Article

A Road Map to Detect the Foremost 3E Potential Areas for Installation of PV Façade Technology Using Multi-Criteria Decision Making

by
Mohammad Hassan Shahverdian
1,
Saba Sedayevatan
1,2,
Sajjad Latif Damavandi
1,
Ali Sohani
1,3,* and
Hoseyn Sayyaadi
1
1
Lab of Optimization of Thermal Systems’ Installations, Faculty of Mechanical Engineering-Energy Division, K.N. Toosi University of Technology, No. 15-19, Pardis St., Mollasadra Ave., Vanak Sq., Tehran P.O. Box 19395-1999, Iran
2
Department of Chemical Engineering, University of Guilan, Rasht P.O. Box 41996 13776, Iran
3
Department of Enterprise Engineering, University of Rome Tor Vergata, Via Del Politecnico 1, 00133 Rome, Italy
*
Author to whom correspondence should be addressed.
Sustainability 2022, 14(23), 15529; https://doi.org/10.3390/su142315529
Submission received: 25 October 2022 / Revised: 14 November 2022 / Accepted: 18 November 2022 / Published: 22 November 2022

Abstract

:
A procedure to prioritize the cities to utilize a building integrated photovoltaic thermal (BIPV/T) system is proposed in which the technique for order of preference by similarity to ideal solution (TOPSIS) is employed as a systematic decision-making method. Electricity generation and heat recovery in a year from the energy side, levelized cost of electricity (LCOE), and payback period (PBP) from the economic viewpoint, as well as the carbon dioxide savings from the environmental perspective, are taken into account as the decision criteria. They are the key economic, environmental, and energy (3E) performance indicators of the system. The novelty of the proposed research approach is two items. The first item is systematic and could be employed for each and every case. Moreover, another item is that selection is made based on energy, economic, and environmental (3E) criteria all together, as the important aspects of an energy system. Having introduced the procedure, it is utilized to rank five cities in Iran for the installation of BIPV/T technologies. The cities are Tehran, Tabriz, Yazd, Rasht, and Bandar Abbas, where each one is a populated city from one of the climatic conditions of the country. According to the results, a high priority is seen for two cities: the first city is Yazd with the highest ambient temperature and relative humidity among the alternatives, and the other city is Tehran, with the highest natural gas and electricity tariffs, as well as the greatest price for operating and maintenance. The values of heat recovery, electricity generation, carbon dioxide savings, PBP, and LCOE for Yazd are 42.3 MWh, 23.4 MWh, 16.8 tons, 5.48 years, and 9.45 cents per kWh. The corresponding values for Tehran are 35.6 MWh, 21.6 MWh, 15.0 tons, 2.79 years, and 8.71 cents per kWh, respectively.

1. Introduction

1.1. Motivation

The growing world population of the world has led to an increasing need for more energy resources [1]. Today, one of the most popular types of energy in the world is electrical energy [2,3,4]. There are different alternatives for being converted into electricity. Among them, fossil fuels are limited, while they impose almost high levels of environmental emissions [5]. As a result, the use of renewable energy is becoming increasingly more popular [6]. One of the renewable energies that is increasing in popularity on a daily basis is solar energy [7]. It is due to the several advantages, including wide access and being environmentally friendly [8].
With the advancement of science and technology, solar energy is becoming more and more economically viable [9]. Photovoltaic (PV) systems are considered as one of the most promising propitious items to exploit the received energy from the sun [10]. PV systems are able to generate electricity, while they have the potential of recovering the heat [11]. Heat recovery can be carried out by absorbing the panel’s heat with a working fluid, usually air or water [12]. As a practical solution, building integrated photovoltaic thermal (BIPV/T) technologies can be used in building application [13].
A BIPV/T system consists of PV panels, installed on the building’s outer surface. There is a space between the wall and PV panels, which results in providing a channel for air to pass through [14]. PV converts a part of irradiation into the electricity, while another part raises the temperature of that [15]. The air enters the channel, and thorough heat transfer, the temperature of air goes up, while the PV temperature goes down [16]. The temperature lower PV has, the higher efficiency it enjoys. The heat transfer could be either natural (free) or forced convection [17].

1.2. Literature Review

The increasing growth in the application of BIPV/T technologies has led to conducting several research studies during the past recent years [18]. Table 1 shows the studies that have been carried out in this field. In this table, a short description of each study is presented, while a point from each research study is also checked.

1.3. Gap and Novelty

Reviewing the literature and checking the answer to the raised question in Table 1 has shown that, to the best of the knowledge of the authors, this gap could be identified:
  • In the past, there has been no study regarding the systematic approach in order to determine the best place to use BIPV/T systems. It means in the studies in which more than one city has been investigated, no decision-making approach was utilized to find the best potential case.
Consequently, this research work comes with this item as the novelty:
  • Providing a method to determine the preference for installation of BIPV/T technologies among a number of candidate locations. It is carried out using TOPSIS, as a systematic approach for this purpose (the word “systematic” means it could be employed for each and every case). The electricity generation and heat recovery in a year from the energy side, PBP and LCOE from the economic viewpoint, as well as the carbon dioxide savings from the environmental side, are taken into account as the decision criteria. They are the key performance indicators of an energy system such as BIPV/T technology.
Iran as one of the countries with a great potential to use solar energy is chosen, and five big cities from diverse climatic conditions of that are selected; one from each climatic group.

1.4. Structure of Paper

This research is organized in four parts. In the second part, the material and method, which includes modeling and description of the system, are given. In the third and fourth sections, there are results and discussion, and conclusions.

2. Materials and Methods

This part introduces the system and candidate cities under study, as well as the way to model the system from energy, economic, and environmental perspectives which are considered in the selection of the best location for the installation of BIPV/T technology. Moreover, introducing TOPSIS decision-making method is carried out in this part.

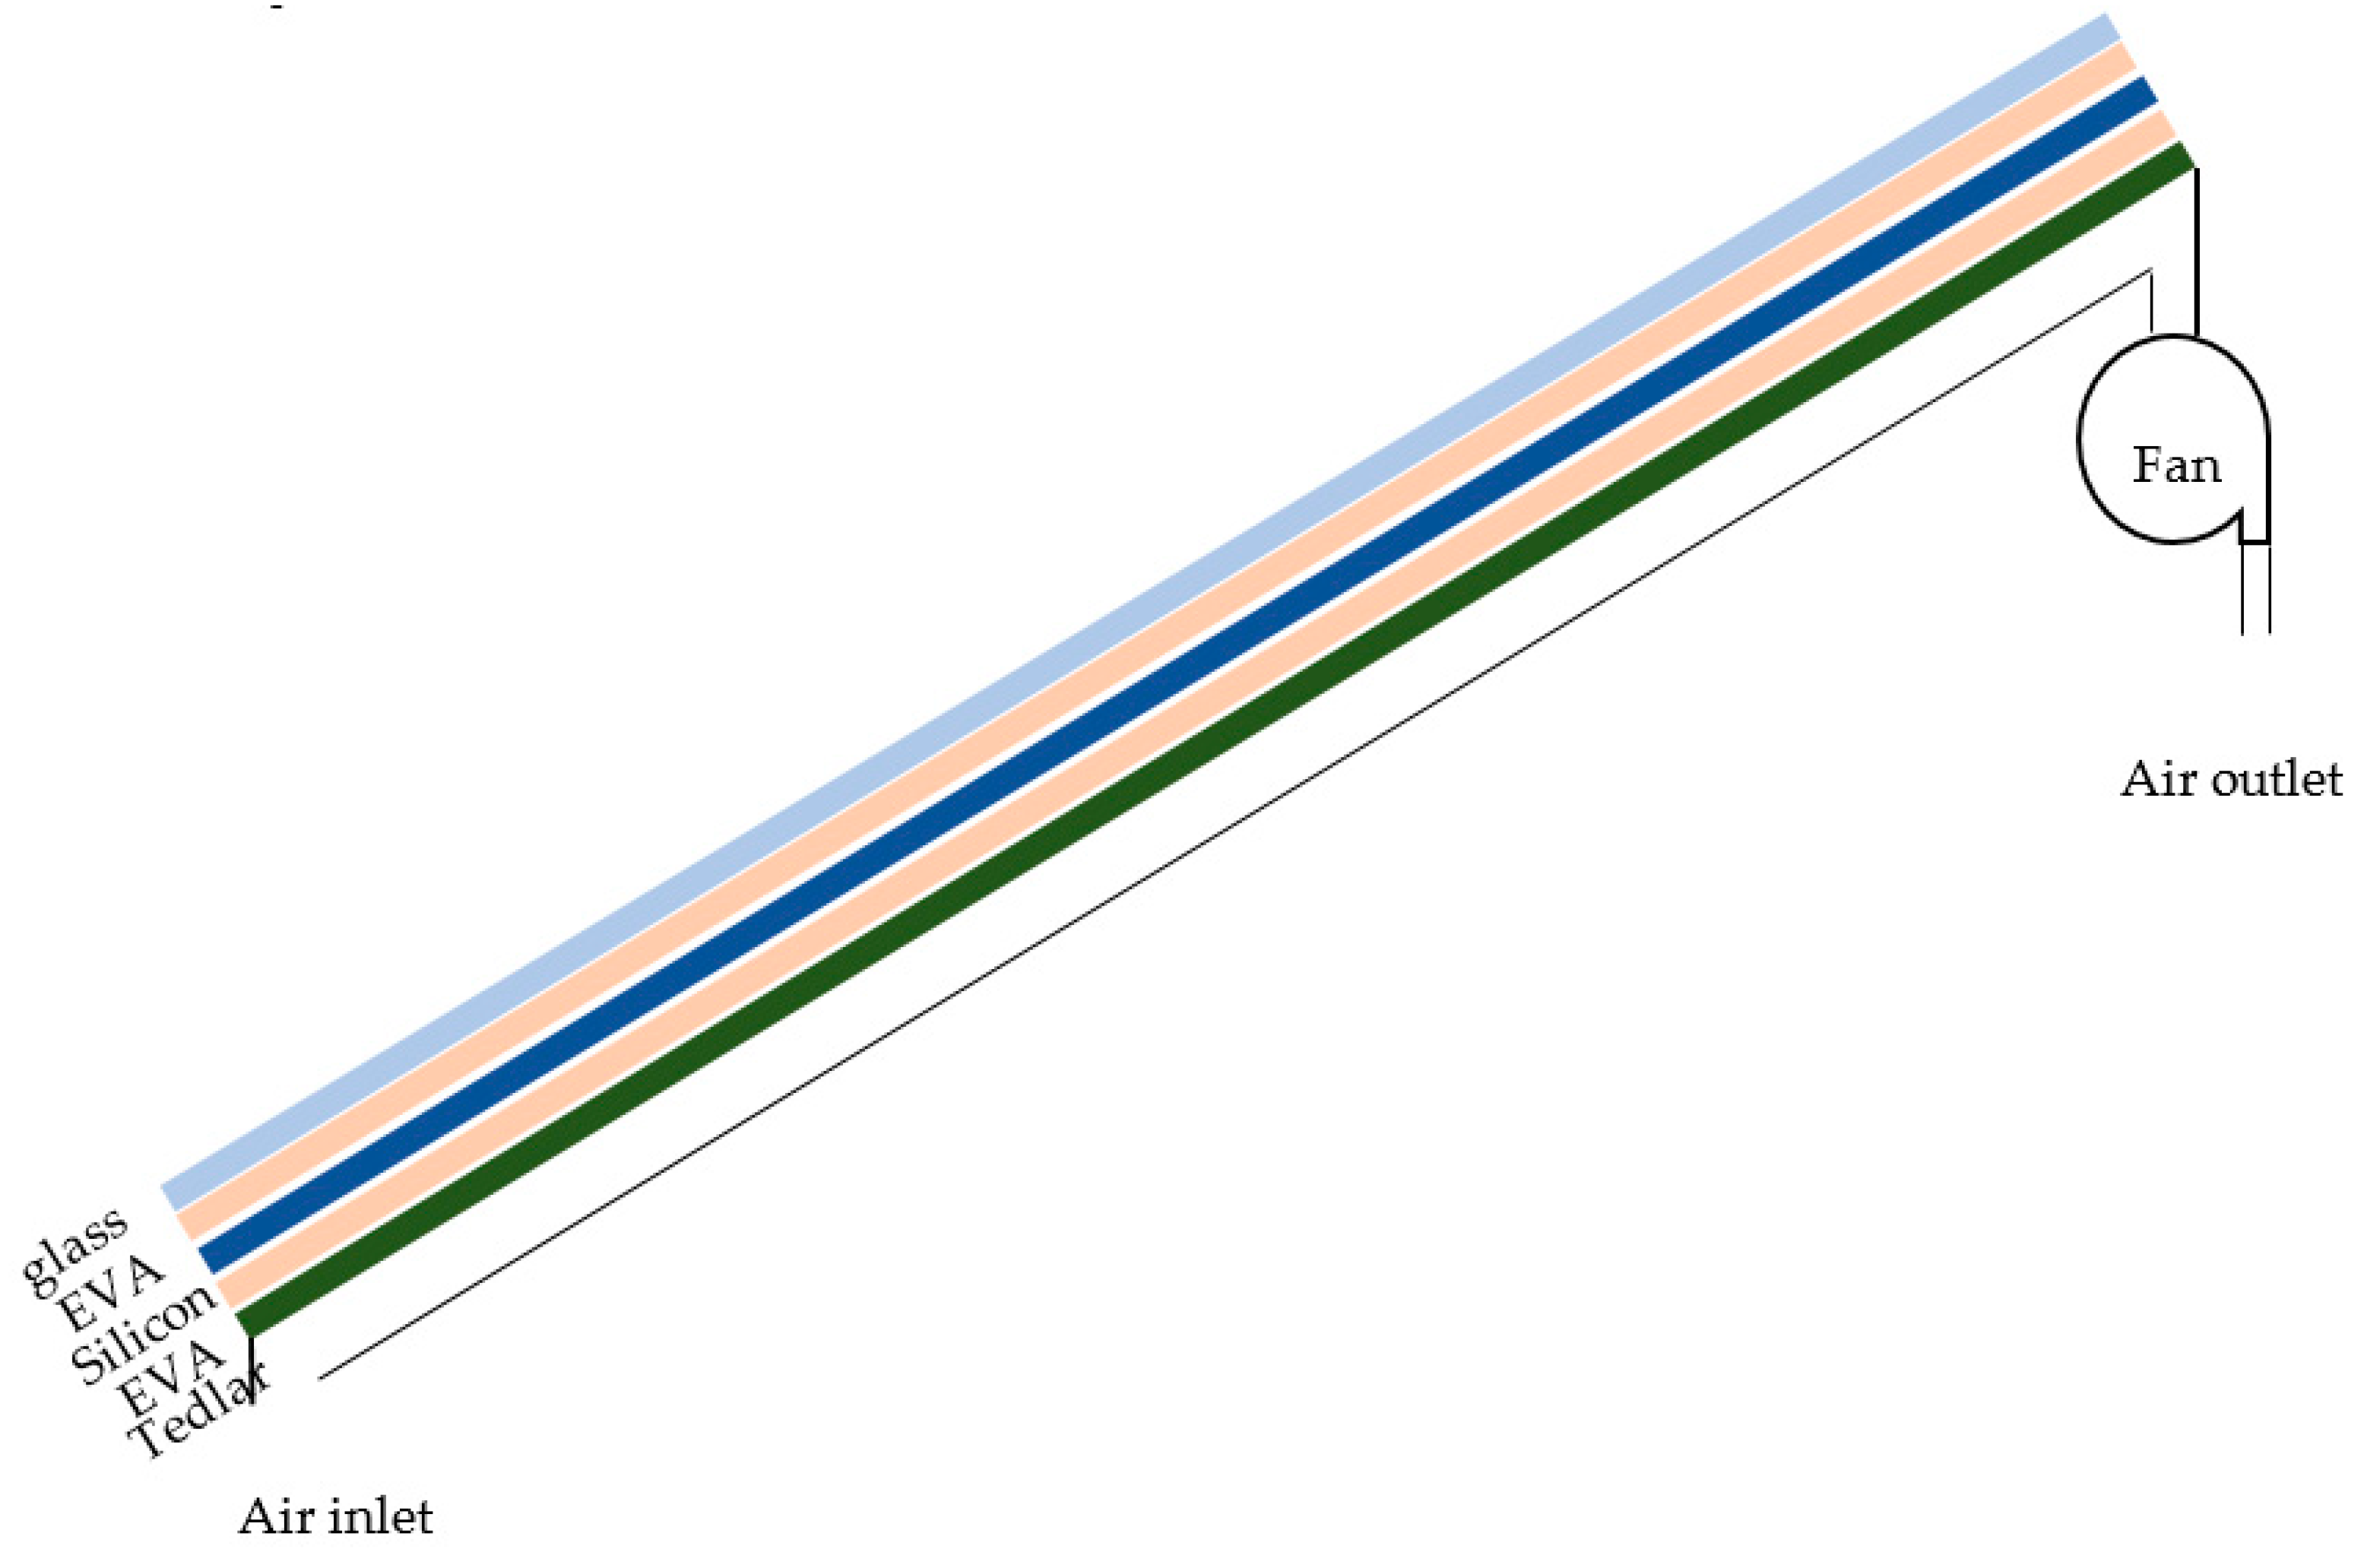
2.1. System Description

Schematic of the considered system is shown in Figure 1. As discussed, a BIPV/T system recovers heat by air flowing in a duct from the back of BIPV. The convection type is forced, which means a fan is used for better air flow. The use of a fan is due to the increase in heat transfer and recovering more heat. The recovered heat can be used for the heating load of the building, which saves natural gas consumption. In addition, PV panels could be installed vertically or on the slanted roof. Figure 1 shows a general scheme. However, in this study, the vertical installation condition is studied.

2.2. Studied Cities

In this study, five cities with different climatic conditions in Iran are studied. They are all among the populated cities of the country. These five cities are Bandar Abbas, Tabriz, Tehran, Rasht, and Yazd. Important city with the information is given in Table 2. Moreover, the considered values of key parameters which are utilized for modeling BIPV/T system are given in Table 3. The indicated temperature values in Table 3 for the summer and winter are for the outdoor design condition (5 a.m. in December and 3 p.m. in July, respectively). The American society of heating, refrigerating, and air-conditioning engineers (ASHRAE) has suggested using the indicated design condition for modeling the weather data during the year. By employing the design temperature values, the weather profile could be simulated during the year. In this investigation, the carrier hourly analysis program (HAP) is utilized for this purpose, with the procedure fully discussed in the past studies of the research group, including [34].
Information about the solar radiation, the duration of the sun in the sky, and ambient temperature is given in full in [35], which can be referred to for more reading.

2.3. Modelling

In this section, first, the PV panel and air that flows are modeled. Then, and in the subsequent sections, the method for economic and environmental analyses is described.

2.3.1. Energy Analysis

As illustrated in Figure 1, a photovoltaic solar system is made of 5 layers: glass, top ethylene vinyl acetate (EVA), silicon, bottom EVA, and Tedlar. For modeling, each of these layers is modeled separately.

Glass Layer

As observed in Equation (1), the energy entering the glass is through [37]:
  • The solar radiation;
  • The heat transfer from conduction type between top EVA and glass layers;
  • The heat transfer from convection type between glass and surroundings;
  • Radiation between glass and the environment.
c p , g δ g A ρ g T g t = α g G A + T E V A 1 T g R c o n d E V A 1 , g T g T a R c o n v g , a T g T s k y R r a d g , s k y
In Equation (1), g, a and sky, cp, δ, A, T, ρ, t, α, G, R symbol of glass, environment, sky, specific heat capacity, thickness, area, temperature, density, time, absorption coefficient, solar radiation, and the thermal resistance, respectively, are calculated according to Equations (2)–(4) [37].
R c o n d E V A 1 , g = δ E V A 1 2 k E V A 1 A E V A 1 + δ g 2 k g A g
R c o n v g , a = 1 h c o n v g , a A
R r a d g , s k y = 1 σ ε g A ( T g 2 + T s k y 2 ) ( T g + T s k y )
In Equations (2)–(4), k is the conduction heat transfer coefficient, h c o n v g , a shows the convection heat transfer coefficient, which is calculated according to Equation (5) [37], and σ represents the Stefan Boltzmann coefficient. Furthermore, ε denotes emissivity coefficient. Additionally, it is worth indicating that the employed equations for modeling PV are the same as the previously conducted research on the topic [37,38]. In these studies, the equivalent circuit (electrical circuit analogy), which has been discussed in studies such as [39], has been used for the modeling of different mechanisms for heat transfer.
h c o n v g , a = 2.8 + 3 U

Top EVA Layer

Equation (6) demonstrates that the energy entering the top EVA is through [37]:
  • The heat transfer from conduction type between top EVA and glass layers;
  • The heat transfer from conduction type between top EVA and PV layers.
c p , E V A 1 δ E V A 1 A ρ E V A 1 d T E V A 1 d t = T P V T E V A 1 R c o n d P V , E V A 1 T E V A 1 T g R c o n d E V A 1 , g
The conductive thermal resistance between the top layers of EVA and silicon can also be calculated from Equation (7) [36].
R c o n d P V , E V A 1 = δ P V 2 k P V A P V + δ E V A 1 2 k E V A 1 A E V A 1

Silicon Layer

Equation (8) shows the silicon layer energy changes that is the result of [40]:
  • Radiation from the sun;
  • Power production;
  • The heat transfer from conduction type between top EVA and PV layers;
  • The heat transfer from conduction type between bottom EVA and PV layers.
c p , P V δ P V A ρ P V d T P V d t = α P V τ g G A P e l e T P V T E V A 1 R c o n d P V , E V A 1 T P V T E V A 2 R c o n d E V A 2 , P V
In Equation (8), τ is the transmissivity coefficient, and Pele is the power production. The conductive thermal resistance between the lower ethylene vinyl acetate and silicon layers is calculated from Equation (9) [37]:
R c o n d P V , E V A 2 = δ E V A 2 2 k E V A 2 A E V A 2 + δ P V 2 k P V A P V
In Equation (8), Pele is the power production that can be calculated from Equation (10) [37].
P e l e c = η e l e c G A
In which η e l e c is the electrical efficiency and is obtained according to Equation (11) [41].
η = η r e f ( 1 β r e f ( T P V T r e f ) )
In Equation (11), η r e f , β r e f , and T r e f indicate efficiency, temperature coefficient, and reference temperature [37].

Lower EVA Layer

Equation (12) indicates that for the lower EVA layer, heat transfer is due to:
  • Conductive heat transfer between bottom EVA and Silicon layers;
  • Conductive heat transfer between bottom EVA and Tedlar layers.
c p , E V A 2 δ E V A 2 A ρ E V A 2 d T E V A 2 d t = T P V T E V A 2 R c o n d E V A 2 , P V T E V A 2 T T d R c o n d E V A 2 , T d
The thermal resistance between the EVA and Tedlar is calculated from Equation (13) [37].
R c o n d P V , E V A 1 = δ P V 2 k P V A P V + δ E V A 1 2 k E V A 1 A E V A 1

Lower EVA Layer

According to Equation (14), there are three terms in the heat transfer of Tedlar [37]:
  • Conductive heat transfer between bottom EVA and Tedlar layers;
  • The convective heat transfer between Tedlar and surroundings;
  • Radiation between Tedlar and the environment.
c p , T d δ T d A ρ T d d T T d d t = T E V A 2 T T d R c o n d E V A 2 , T d T T d T a R c o n v T d , a T T d T g r R r a d T d , a
The radiative heat resistance is calculated according to Equation (15) [37]:
R r a d T d , a = 1 σ ε T d A ( T T d 2 + T a 2 ) ( T T d + T a )
Equation (16) shows the thermal resistance of the forced air convection between the air in the channel and the wall [42].
h c o n v T d , a = k D H { 0.0182 Re 0.8 Pr 0.4 [ 1 + j D H L ] }
In Equations (17) and (18), j is equal to [42]:
j = 14.3 log ( L D H ) 7.9 f o r   0 < L D H 60
j = 17.5 f o r   L D H > 60
In Equations (17) and (18), L , Pr , Re and D H which are channel length Prandtl number, Reynolds number, and hydraulic diameter, respectively. Re and D H are determined based on Equations (19) and (20), as well [42].
Re = V L X ν
D H = 4 A c h p e r i m e t e r
In which V and ν are the fluid velocity and kinematic viscosity, respectively. L X is also the characteristic length for a rectangular duct (duct), which is the hydraulic diameter of that. Obtaining the convective heat transfer is carried out with the assumption of the air as the ideal gas. Furthermore, the airflow reaches the fully developed condition. More discussion could be found in the works of Shahsavar and Rajabi [42], and Tan and Charters [43].
After determination of temperature values of air and PV layers, the absorbed heat by the air in the channel ( Q r e c ) and the produced power ( P e l e c ) are determined using Equations (21) [38] and (10), respectively.
Q r e c = ρ a V a A c h c p , a ( T a , o u t T a , i n )
where ρ a , V a , A c h , T a , o u t , and T a , i n show air density and velocity, channel cross section area, outlet, and inlet air temperatures, respectively.

2.3.2. Economic Analysis

The economic calculation is carried out to obtain PBP and LCOE.

Payback Period

PBP can be calculated according to Equation (22). PBP is the time when the net present worth of the whole system of gained income changes from negative to positive [38].
k = 1 P B T ( A E P × c S E N × ( 1 + i S E N ) P B T 1 ( 1 + d ) P B T ) + k = 1 P B T ( A H R η h e a t i n g   s y s t e m × ( 1 L H V N G ) × ( 1 ρ N G ) × c N G × ( 1 + i N G ) P B T 1 ( 1 + d ) P B T ) k = 1 P B T ( f O M × I P P × ( 1 + i O M ) P B T 1 ( 1 + d ) P B T ) I P P = 0
In most of the studies, the payback period is usually the simple payback period, which does not consider inflation, depreciation, etc. Nonetheless, as seen in Equation (22), the considered PBP here takes the aforementioned economic issues into consideration. In Equation (22), there are four sentences from left to right, which are:
  • Selling electricity to the grid. In that term, A E P , c S E N , i S E N , N and d are electricity produced throughout the year, selling electricity price to the grid per unit, the annual inflation rate in electricity price, life time of system, and the interest rates;
  • Revenues from savings in the natural gas consumption. Here, L H V N G , ρ N G , c N G , and i N G are the lower heating value, density, cost of fuel per unit, and the annual inflation rate in electricity price, respectively. A H R and η h e a t i n g   s y s t e m are also the heat recovery in a year and conventional system efficiency. The conventional system could be a hot water system and recovering heat from PV panels leads to its natural gas consumption;
  • Initial costs;
  • Maintenance cost is equal to 0.02 of the initial system costs in the first year of operation [44]. It has an inflation of i O M .

Levelized Cost of Energy (LCOE)

By dividing the life cycle costs of the system (the summation of initial and operating and maintenance costs, indicated by P W I P P , w h i l e _ l i f e and P W O M , w h o l e _ l i f e , respectively) by the produced electricity for the system within its lifetime ( E P w h o l e _ l i f e ), LCOE is determined [38]:
L C O E = P W I P P , w h i l e _ l i f e + P W O M , w h o l e _ l i f e E P w h o l e _ l i f e

2.3.3. Environmental Modeling

In the absence of a BIPV/T system, the whole electricity for a building is purchased by a thermal power plant [45]. This means that the needed heat is provided by a fossil fuel burning system [46]. Therefore, due to BIPV/T usage, both electricity production in a thermal power plant and fuel consumption in the fossil fuel burning system are saved, and consequently, carbon dioxide is retained, and its release to the environment is prevented [47]. The saved carbon dioxide due to electricity production reduction in a thermal power plant ( C D R e l e c ) can be calculated from Equation (24) [18].
C D R e l e c = c d e e l e c , t p p × E P
where E P is the produced electrical energy and c d e e l e c , t p p is the specific produced carbon dioxide for the power generation process in a thermal power plant. According to [48], the electricity generated in a thermal power plant is 0.598 kg of carbon dioxide per kilowatt hour.
Moreover, the amount of carbon dioxide retained by heat recovery from the back of the panel is obtained from Equation (25) [49].
C D R h e a t = c d e N G × H R η h e a t i n g   s y s t e m
Similar to electricity, c d e N G is also the amount of carbon dioxide produced per unit of the burned natural gas, which is 0.185 kg. kWh−1 of the gas consumed according to the information given in [50].

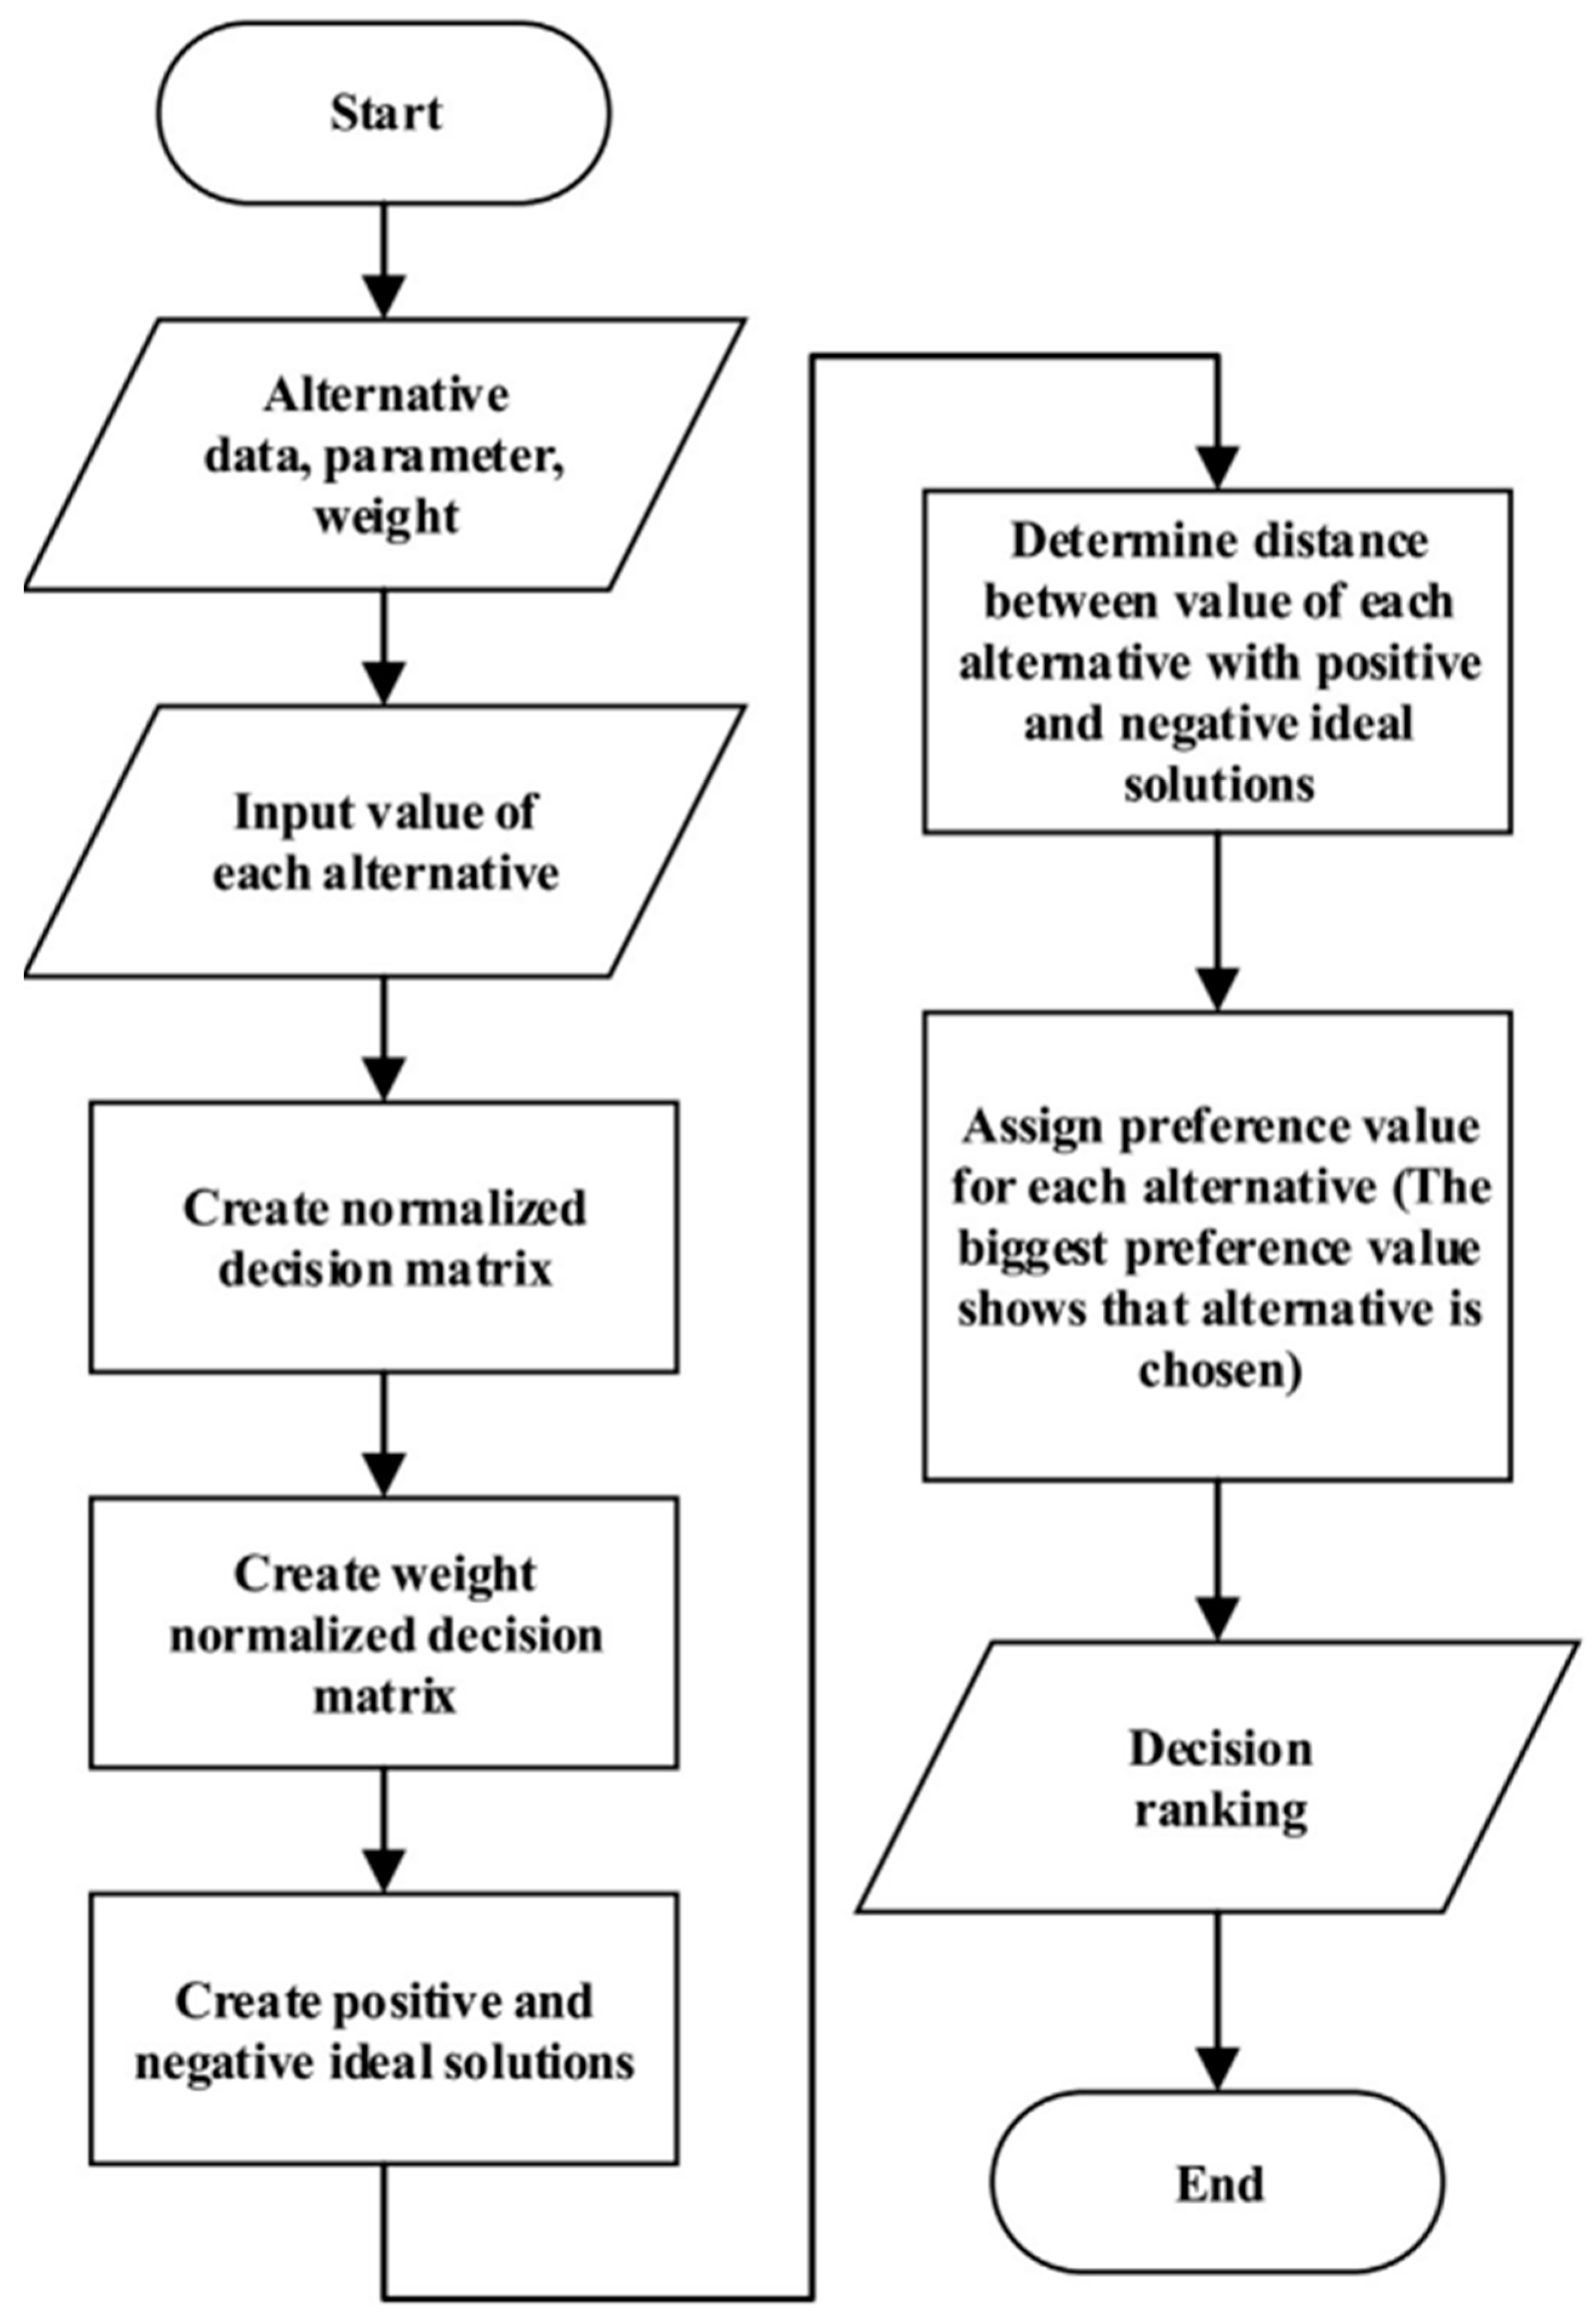
2.4. TOPSIS Decision-Making Method

Selection of the best parameters is carried out by considering a number of system parameters which are called decision criteria. In this study, the decision criteria are:
  • Electricity production during a year;
  • Heat recovery during a year (the annual heat recovery means the amount heat recovered during the heating season (Annual heat recovery = Heating season heat recovery + Other seasons heat recovery = Heating season heat recovery + 0 = Heating season heat recovery));
  • LCOE;
  • PBP;
  • Carbon dioxide saving during a year.
The selection is carried out to find the rank a number of “things” which are known as alternatives. In this work, alternatives are the cities. If an alternative possesses the best values of all chosen parameters at the same time, it would be chosen as the best one. Nevertheless, if as in this case, one alternative does not have the best values of all decision criteria, simultaneously, a decision-making method has to be utilized. The process flow chart of TOPSIS is depicted in Figure 2.
In the TOPSIS decision-making method, as the first step, the alternatives, which are also called solutions, are made dimensionless. It is carried out using the Euclidian approach [2]:
o b j i j * = o b j i j i = 1 n u m i ( O b j i j ) 2
Then, the ideal and non-ideal answers are defined. They are two imaginary alternatives; the former has the best values of all the decision criteria at the same time, whereas the latter has the worst value of all of them simultaneously. After that, the distance from the ideal and non-ideal answers are determined [2]:
d i + = j = 1 n u m o b j ( o b j i j * o b j j * , i d e a l ) 2
d i = j = 1 n u m o b j ( o b j i j * o b j j * , n o n i d e a l ) 2
Next, the closeness index is calculated for each alternative by Equation (29) [2], and the one with the highest closeness index (the lowest distance to the ideal answer) is introduced as the TOPSIS choice.
C L I i = d i d i + d i +

3. Results and Discussion
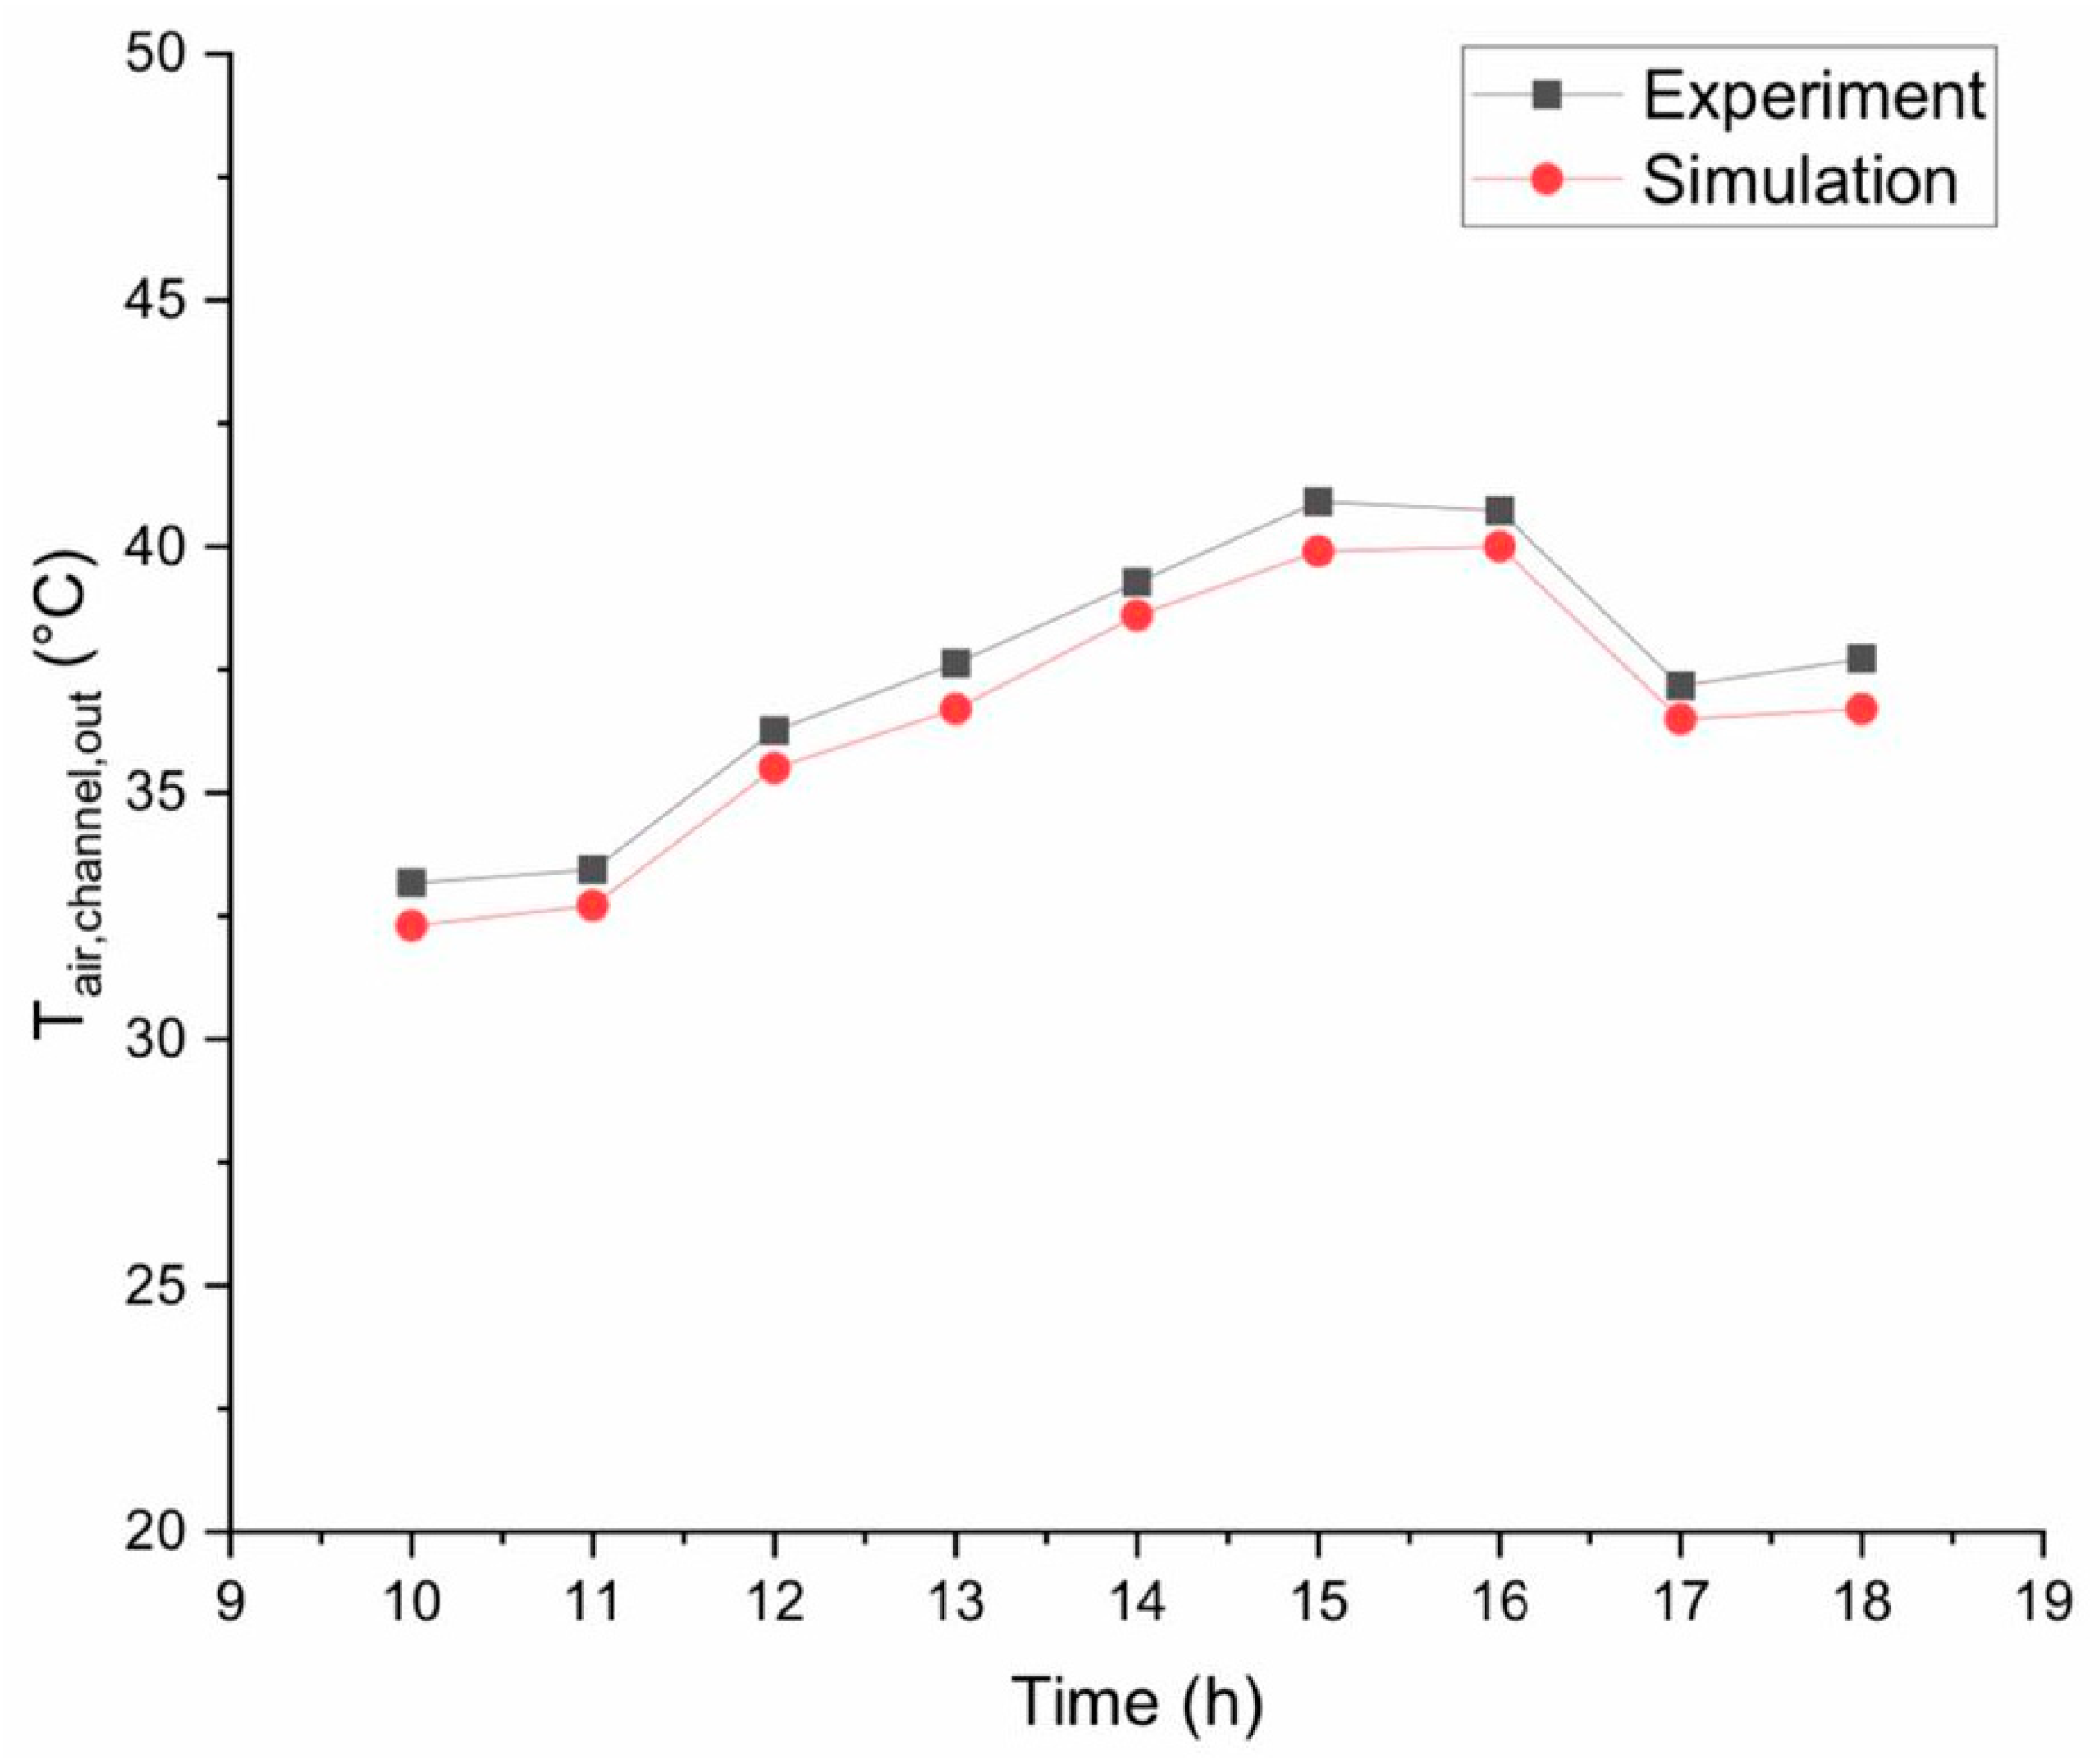
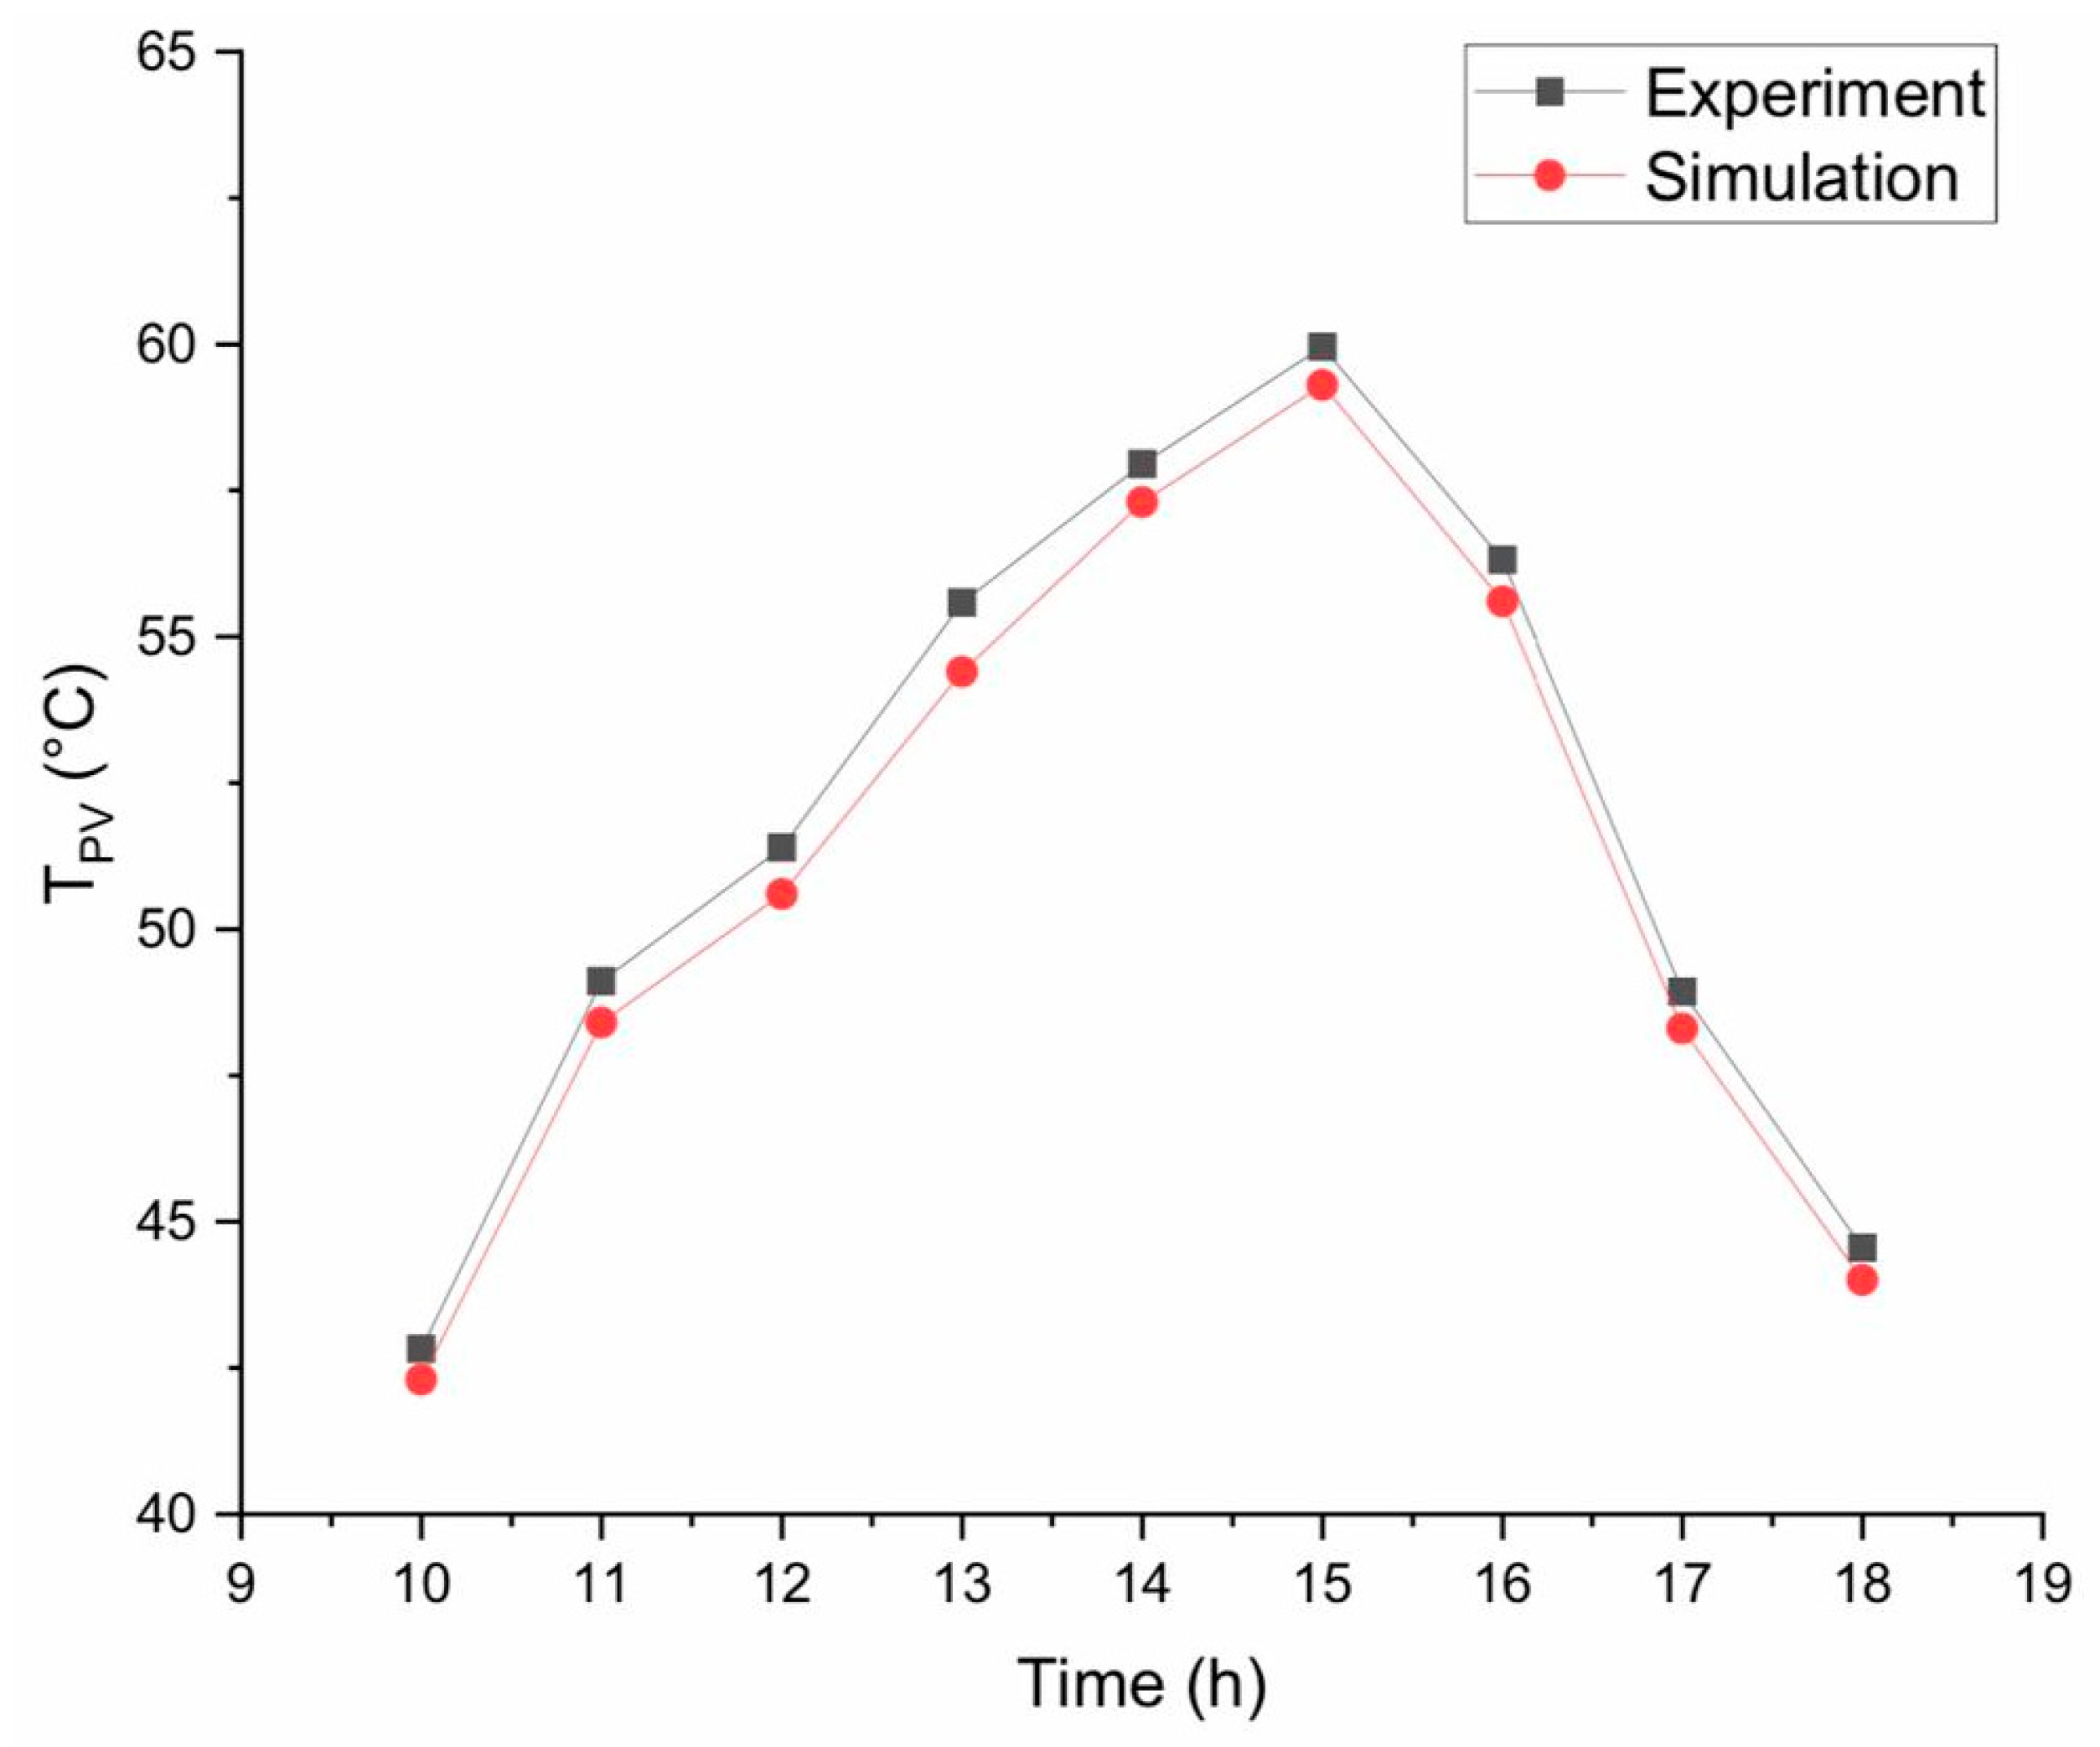
In the following section, the results of the study are presented. First, model validation is given, and then, the decision criteria for different cities are compared. Finally, the outcome of decision making is given and discussed.

3.1. Validation

In order to check the accuracy of the simulation approach, the experimental data found in [52] is used. Figure 3 and Figure 4 report the comparison for air temperature in the channel and PV temperature. Comparison of the experimental and simulation has demonstrated that the prediction average error of air temperature in the channel is only 2.2%. The average error for PV temperature is even more, i.e., 1.4%. As a result, the simulation methodology has been proven, and it could be verified for further calculations.

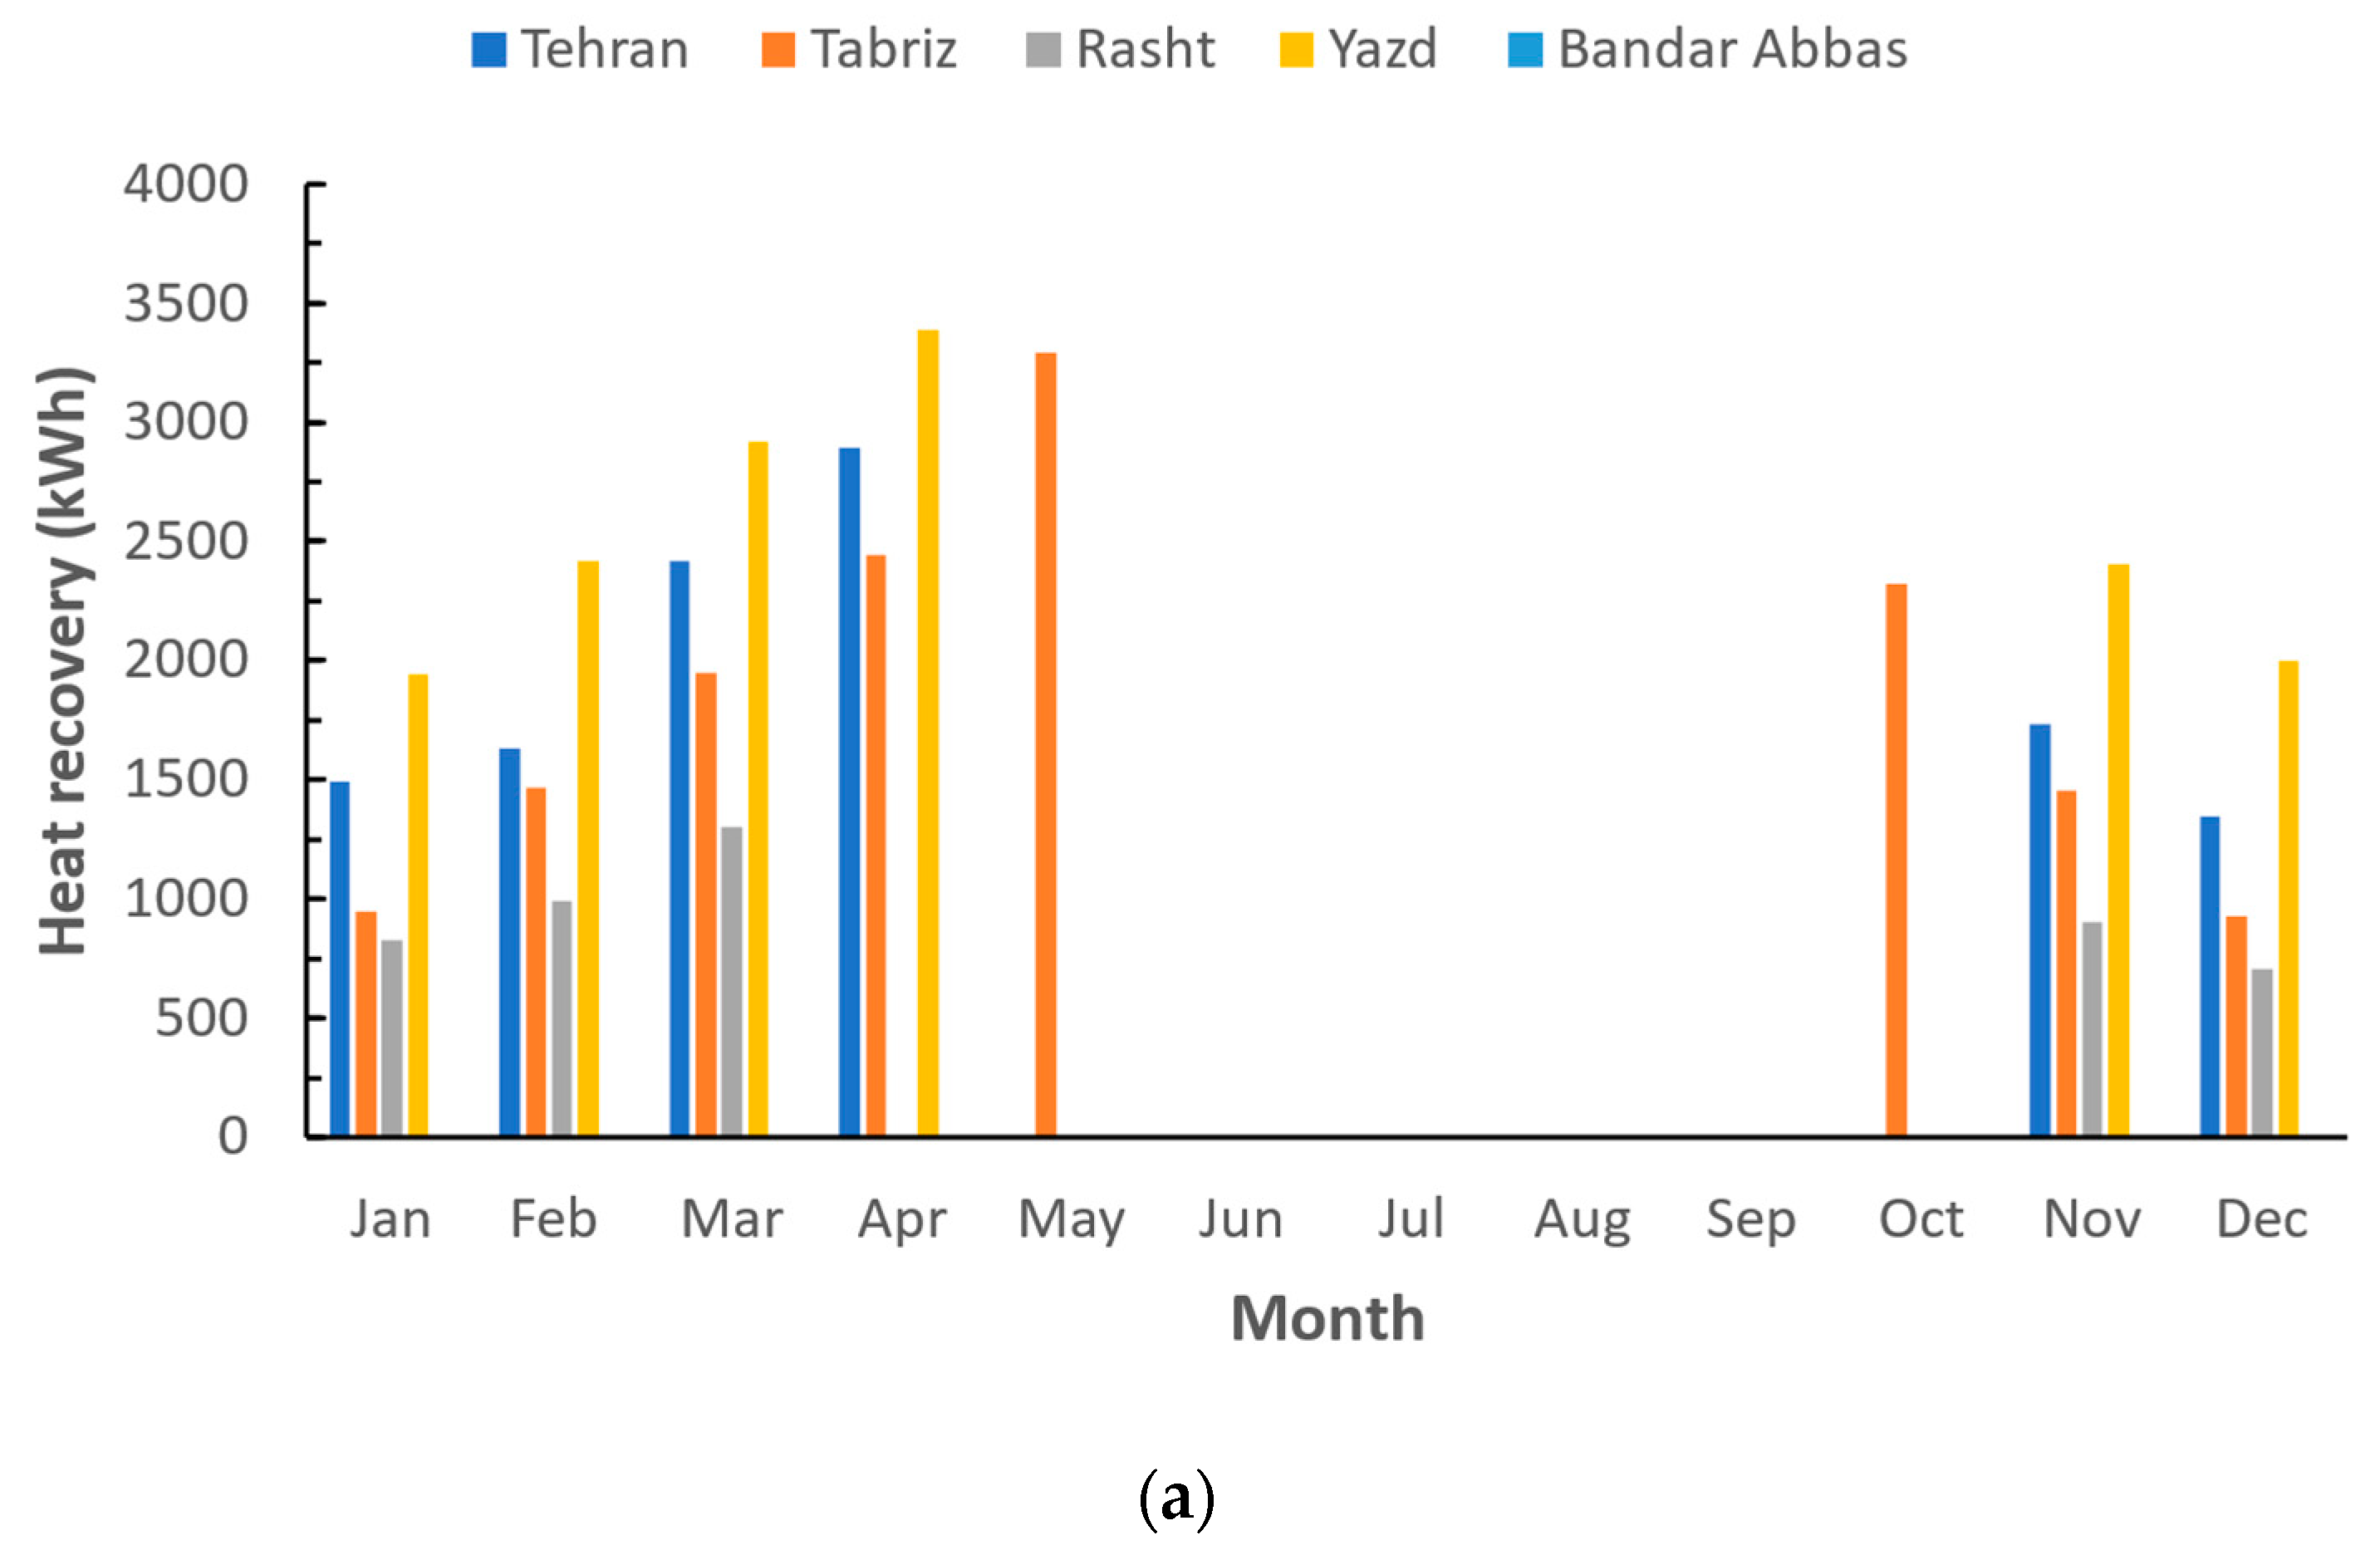
3.2. Monthly Profiles

Figure 5a illustrates the monthly profiles of heat recovery for five different cities. Figure 5a,b show that by getting closer to the warm seasons, more electricity is generated by PV panels. Consequently, more heat is dissipated by PV panels to the air stream, which means more heat recovery.
The most heat recovery is seen for Yazd. Yazd is a city in the dessert. Not only does it have hot summers, but also there is a severe cold season. Based on Equation (21), the heat recovery has a reverse relationship with the temperature of the inlet air. The lower temperature is of the air when it enters, the higher the heat could be that is recovered from the backside of the module. Therefore, the highest heat recovery is observed for Yazd. For this city, 3523.9 kWh heat is recovered in each month of the heating season on average. Bandar Abbas, Tehran, Tabriz, and Rasht are in the next places, respectively. They offer 3158.8, 2968.6, 2406.6, and 1911.6 kWh heat during the heating season on average.
For PV electricity generation, Yazd has the highest amount, as well, where the average electricity generation is 1952.9 kWh. The minimum and maximum electricity generation for this city are also 2735.8 and 1053.2 kWh, respectively. Rasht is the city which has the least mean electricity generation. The average, minimum, and maximum electricity generation for Rasht are 943.6, 1678.2, and 388.4 kWh, respectively.
The carbon dioxide savings come from both electricity generation and heat recovery. Therefore, Yazd, which has the highest amount of both aforementioned indicators, also enjoys the greatest carbon dioxide savings; 1400.1 kg of carbon dioxide is retained due to using BIPB/T system in this city. Tehran and Rasht, which have much longer heating seasons compared to Bandar Abbas, are in the second and third positions, with the monthly average of 1253.3 and 1233.9 kg, respectively. Bandar Abbas is the fourth city in the carbon dioxide saving ranking, where 1143.3 kg carbon dioxide is retained, and the lowest amount of carbon dioxide savings is seen in Rasht. The carbon dioxide savings for Rasht is 637.3 kg. On a yearly average basis, the values for Tehran, Tabriz, Bandar Abbas, and Rasht are 10.49, 11.87, 18.34, and 54.48% lower than Yazd, respectively.

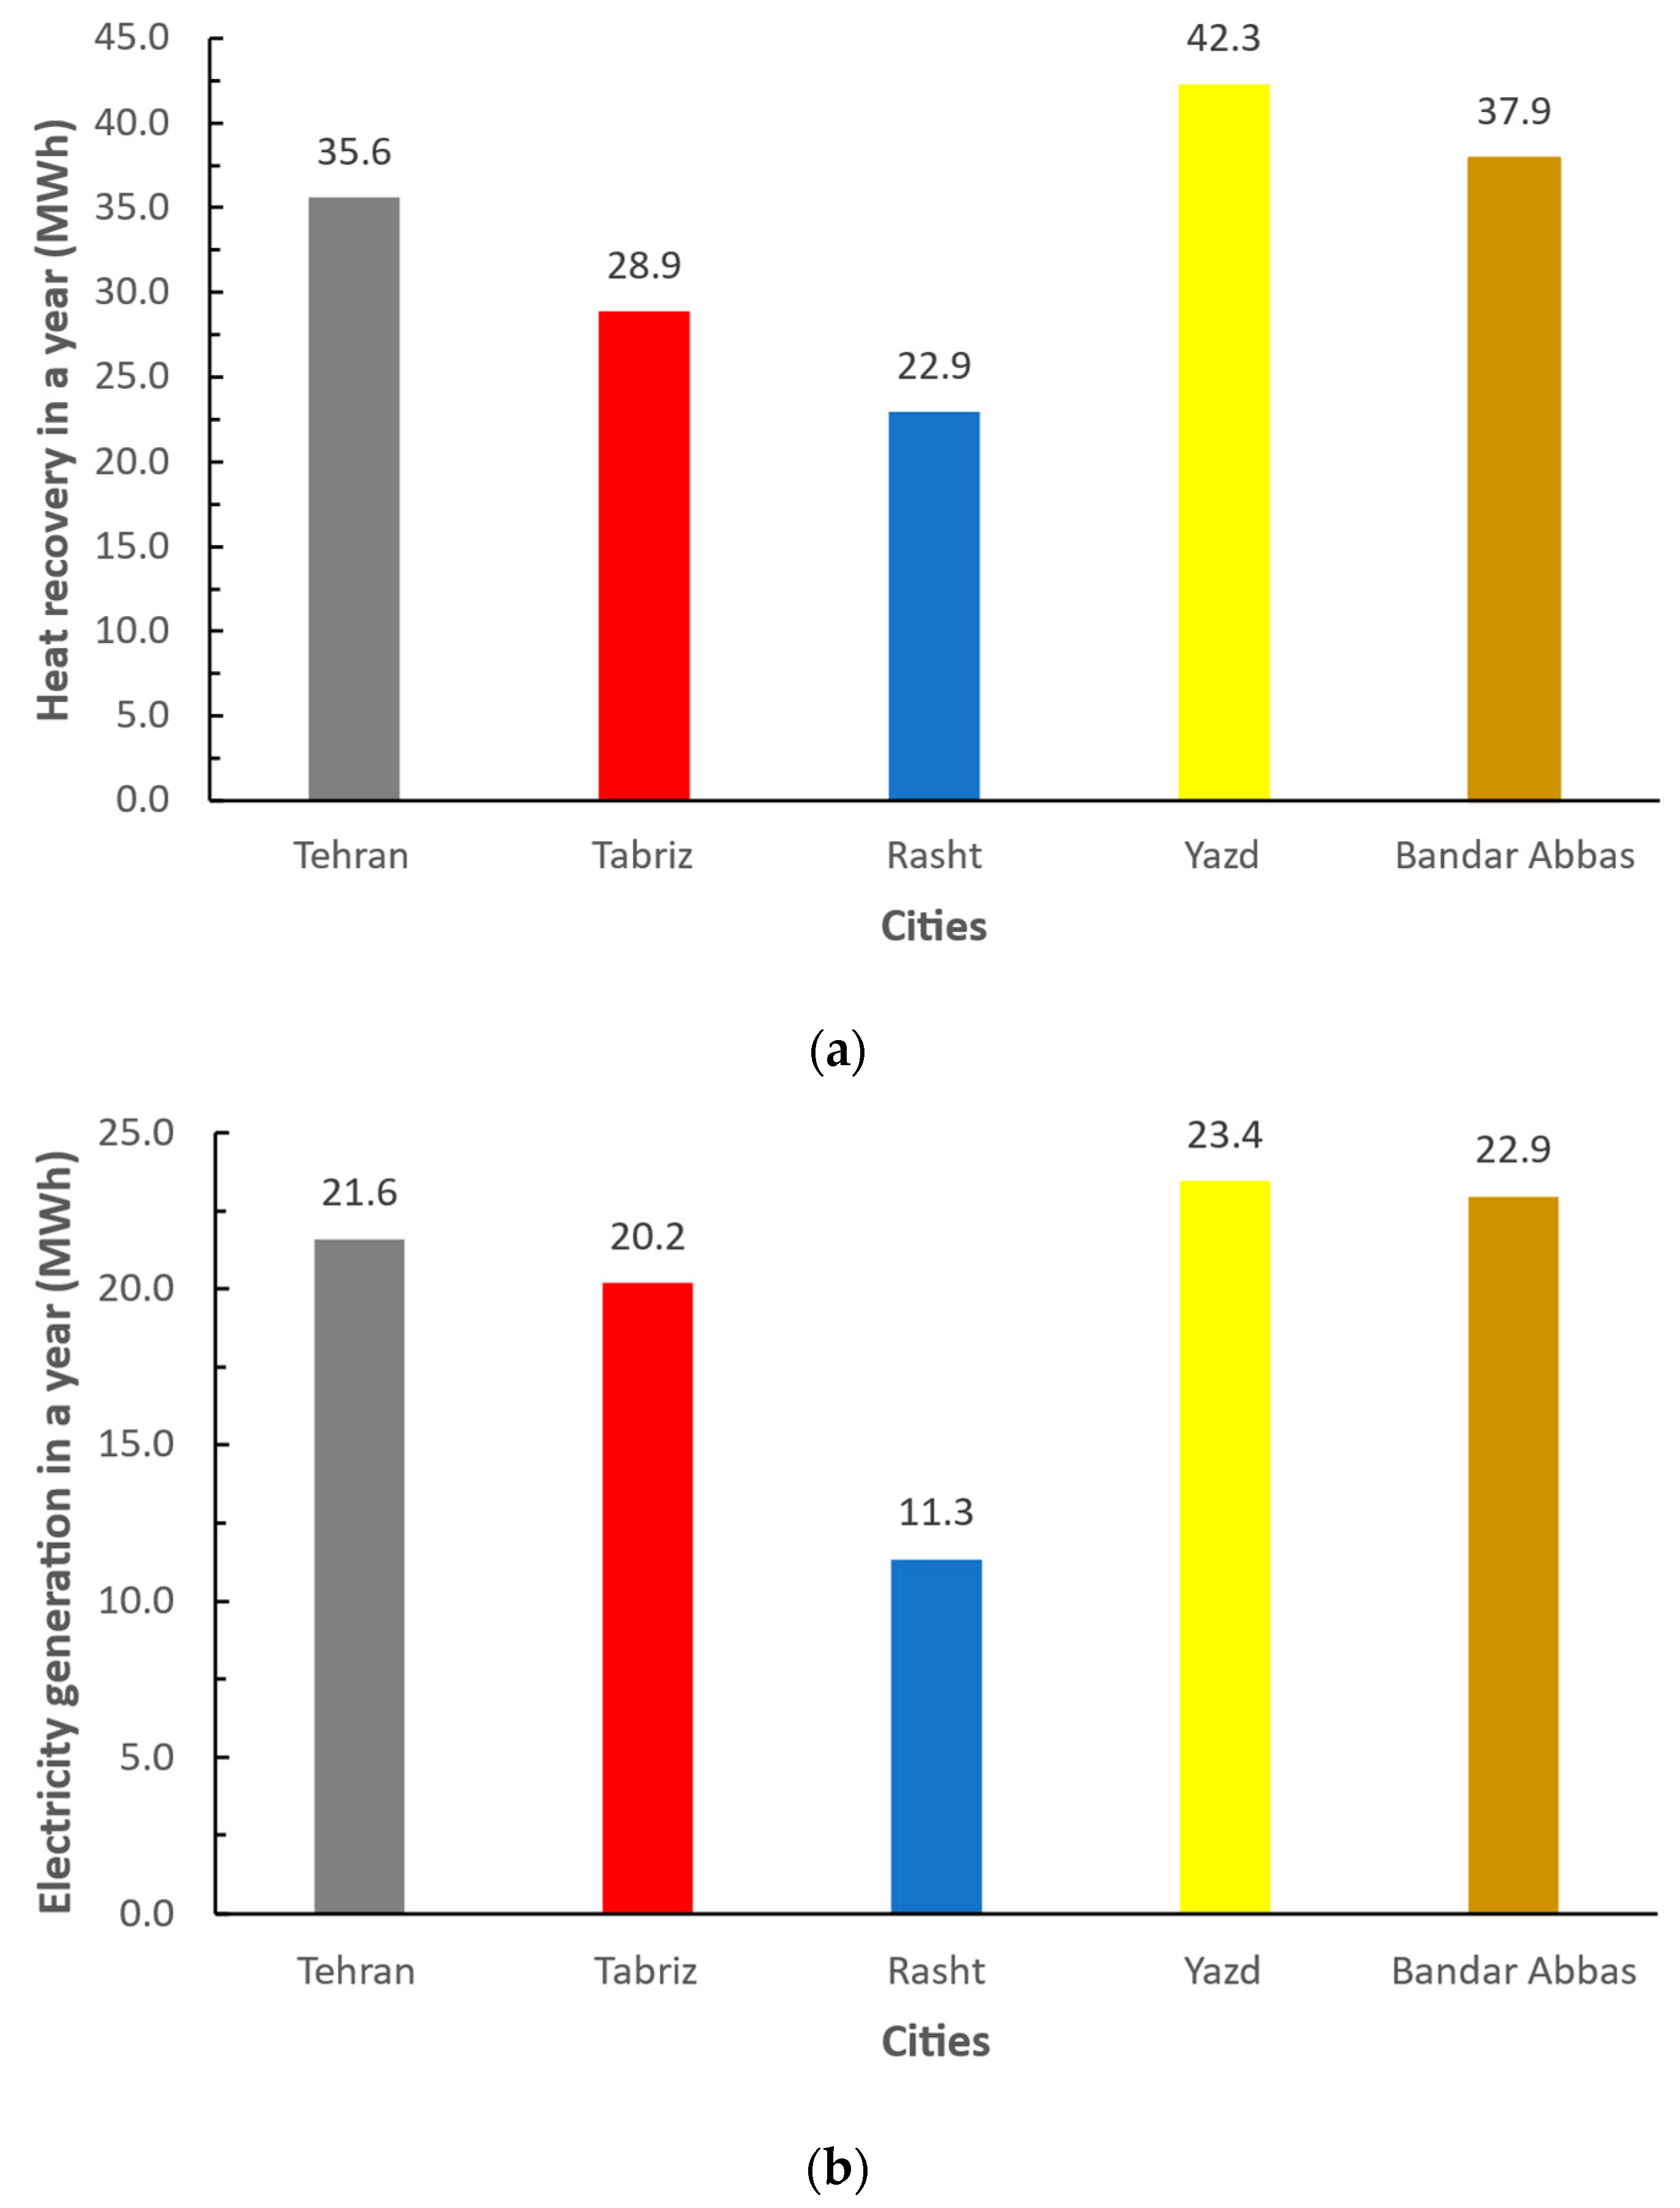
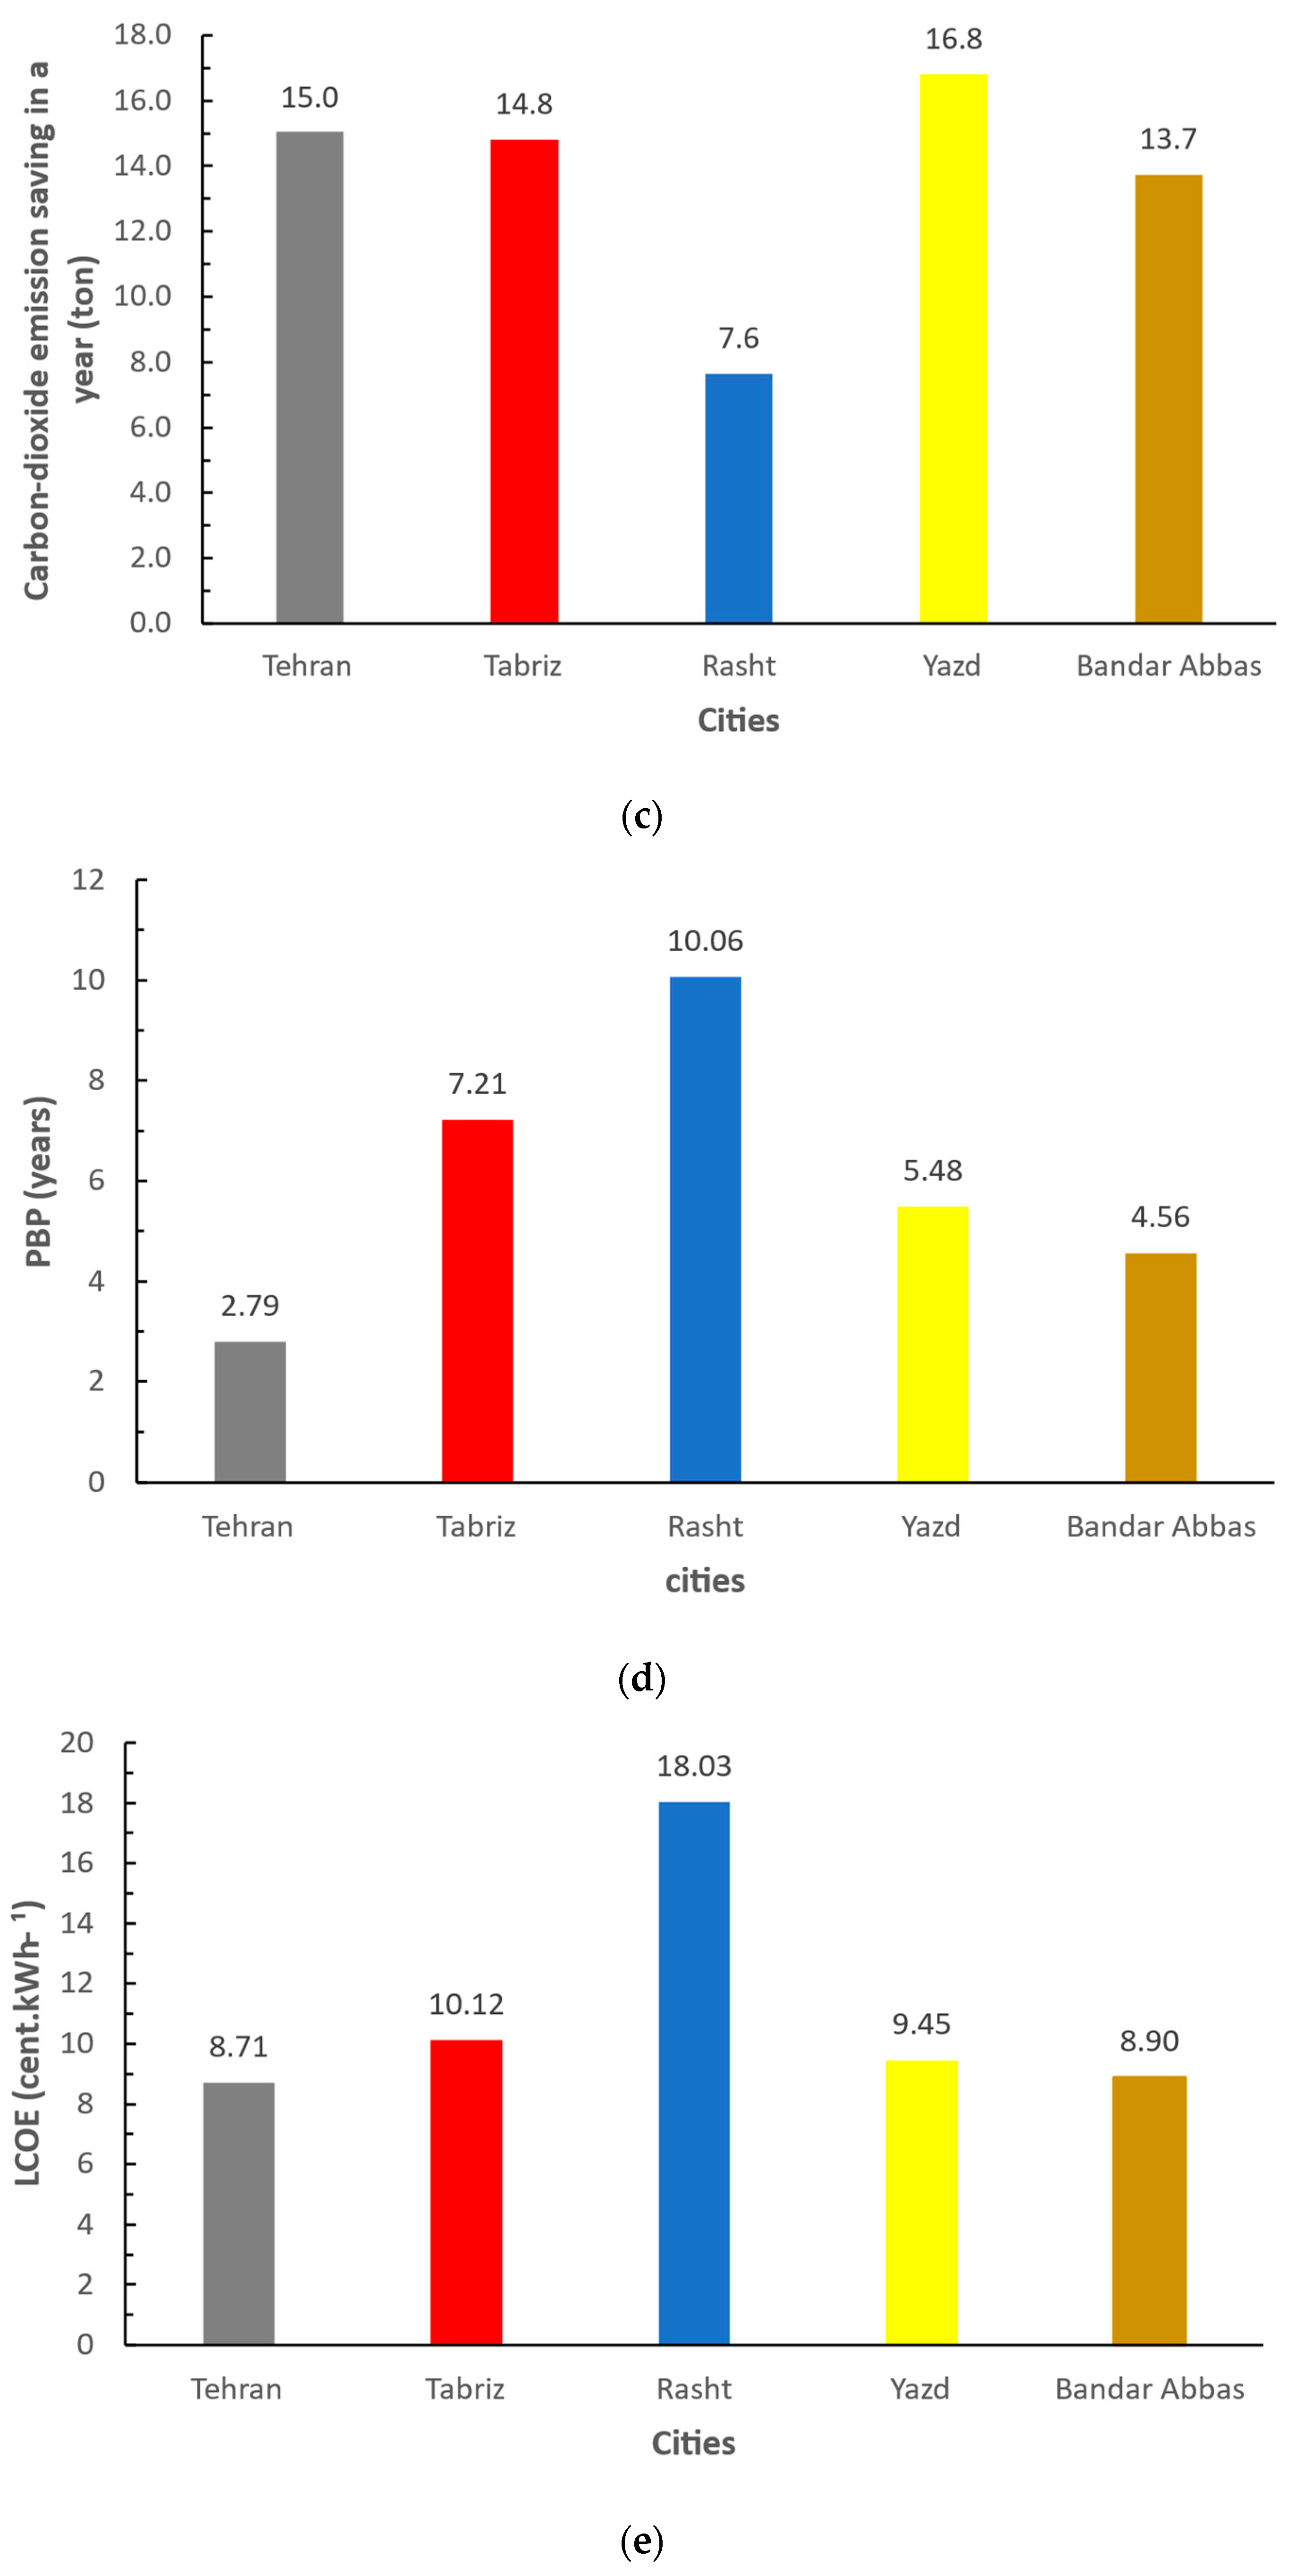
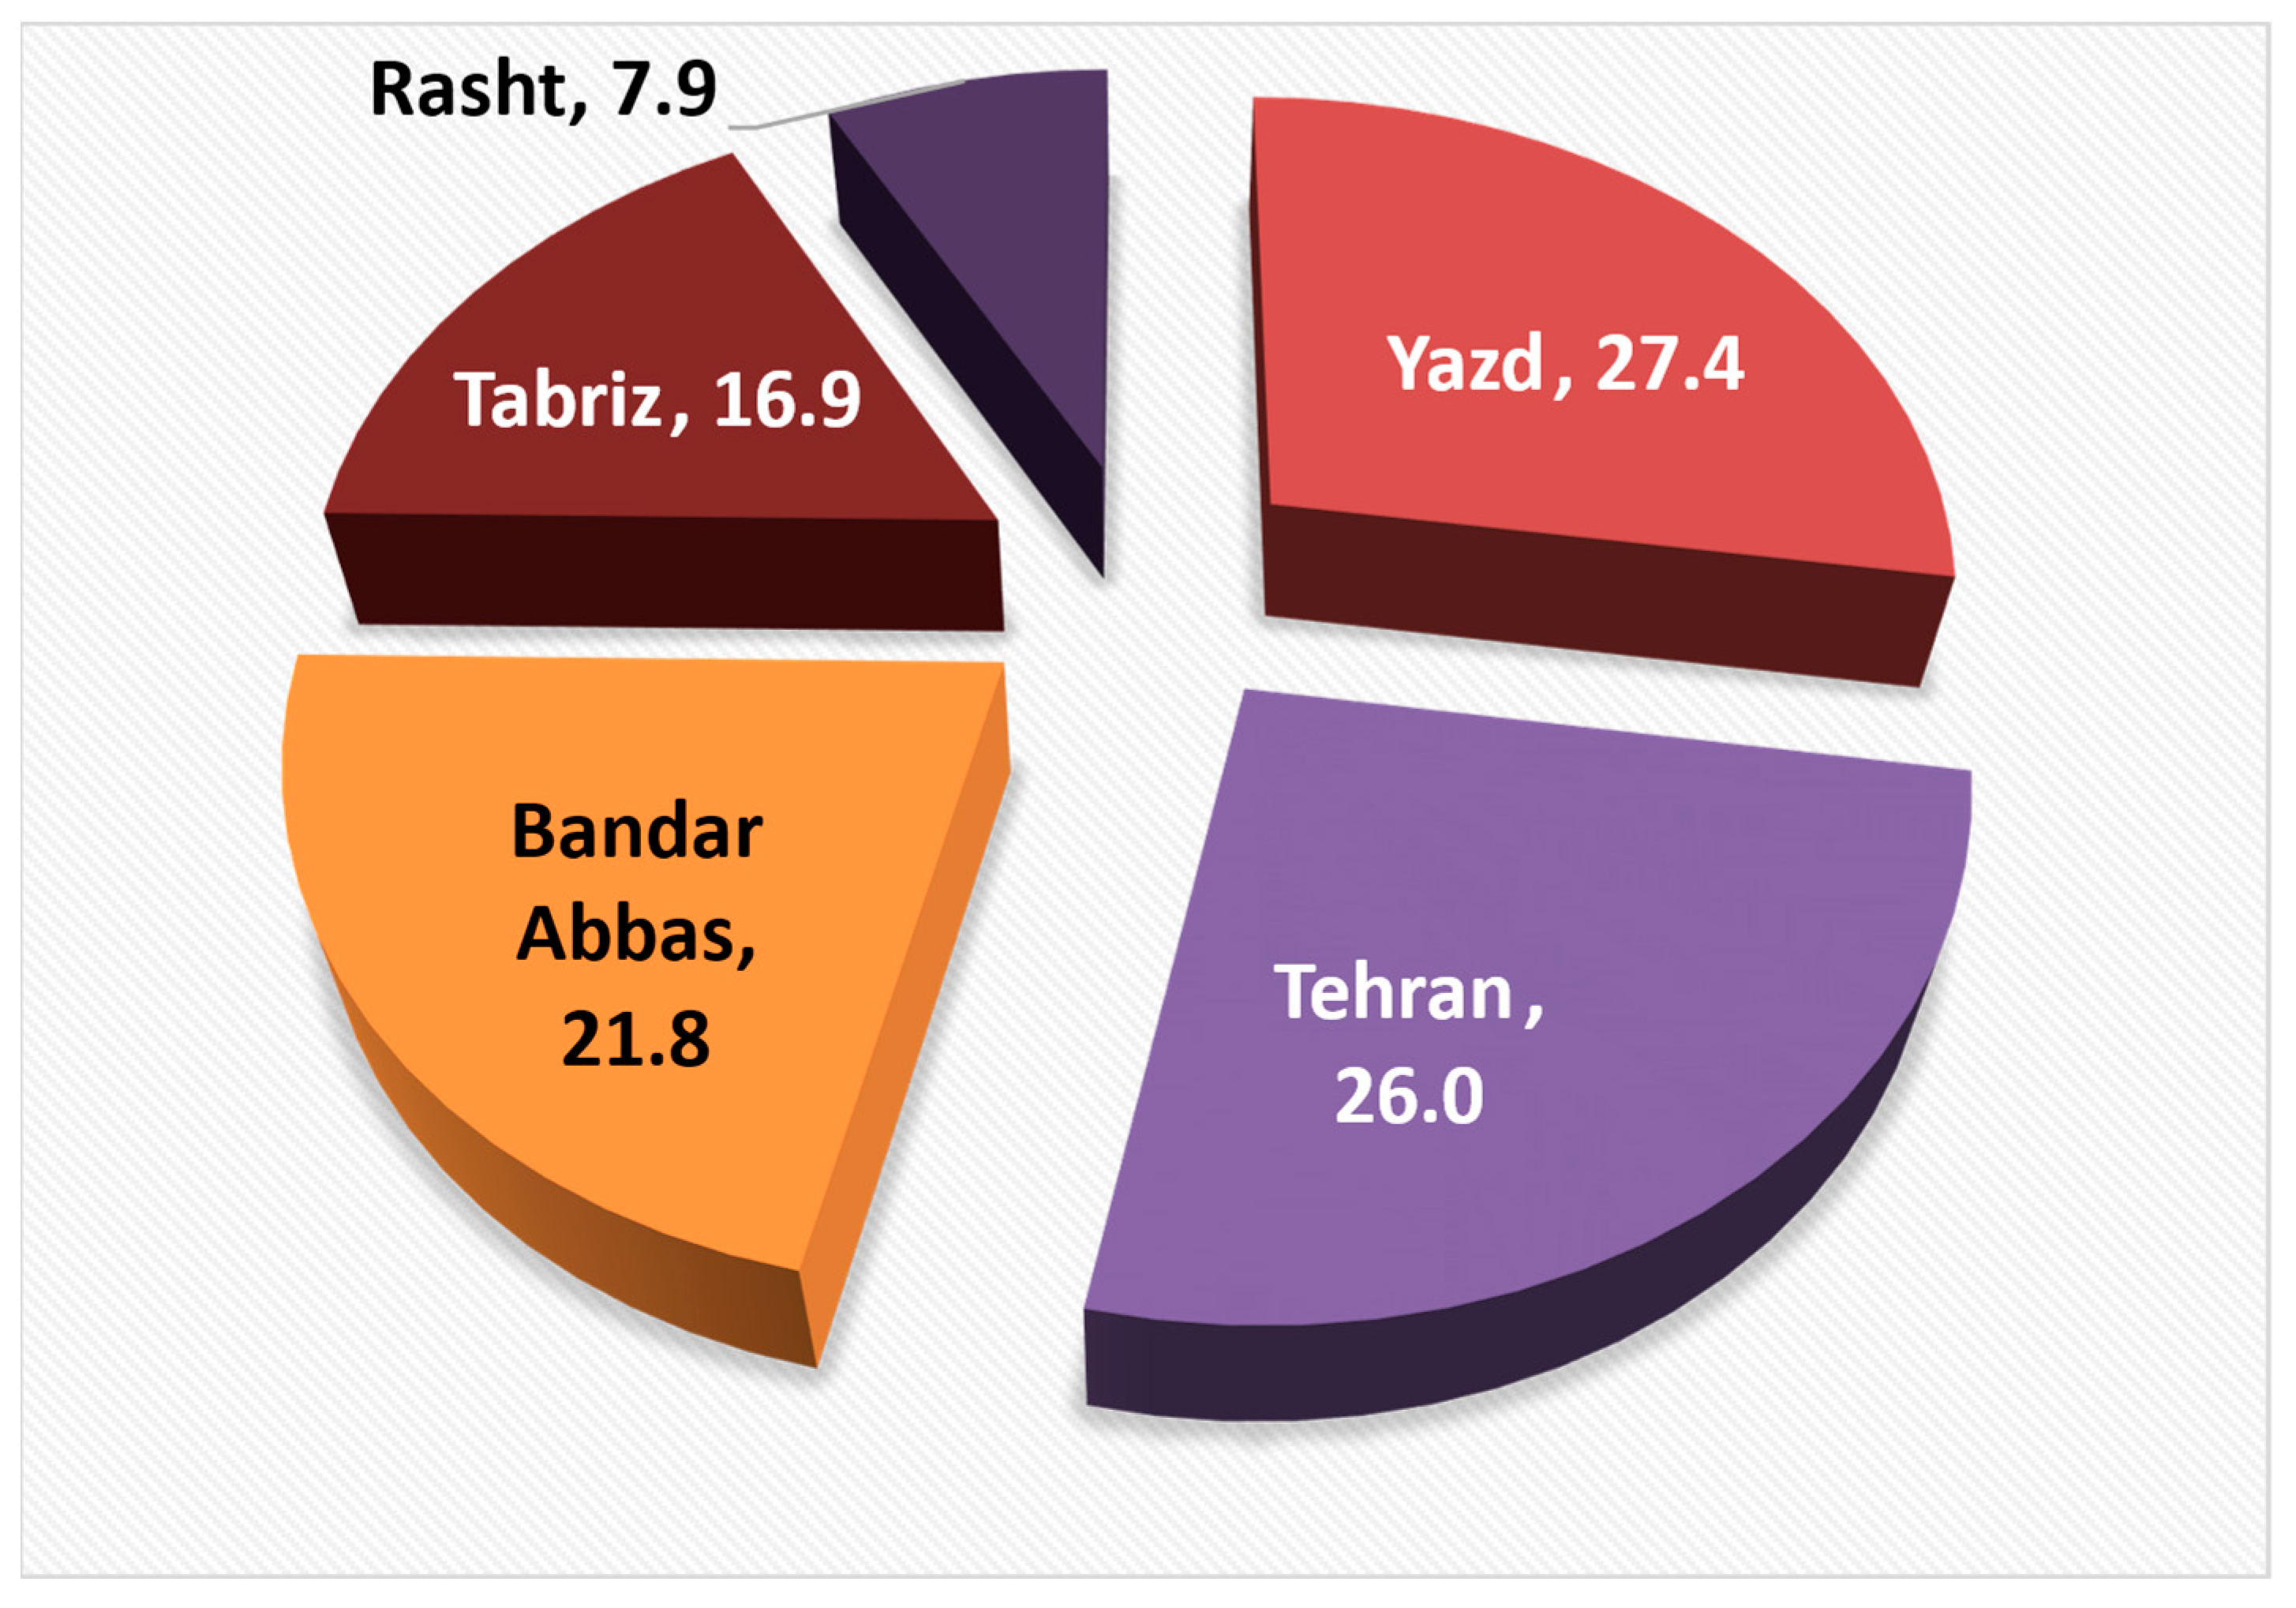
3.3. Annual Performance Indicators

According to the conducted discussion, Yazd, which has the hottest climatic condition and highest received solar radiation, is the city with the greatest heat recovery. As seen in Figure 6, BIPV/T is able to produce 42.3 MWh. Bandar Abbas is the location with the biggest heat recovery after Yazd; 37.9 MWh electricity is produced during a year in Bandar Abbas, which is 10.40% smaller than Yazd. The next places of Tehran, Tabriz and Rasht produce 35.6, 28.9, and 22.9 MWh electricity, respectively.
There is the same ranking as heat recovery for electricity generation. The values of annual electricity in Yazd, Bandar Abbas, Tehran, Tabriz, and Rasht are 23.4, 22.9, 21.6, 20.2, and 11.3 MWh, respectively.
Both electricity generation and heat recovery have contributions to the carbon dioxide savings, and for that reason, Yazd, as the city with the highest value of both indicated indicators, has the greatest carbon dioxide savings. For this city, 16.8 tons carbon dioxide is retained in a year. Tehran and Tabriz, which have much longer heating season periods compared to Bandar Abbas, are the cities after Yazd. In Tehran and Tabriz, using BIPV/T technology is accompanied by 15.0 and 14.8 tons of carbon dioxide savings, respectively. The fourth city in the ranking is Bandar Abbas, which has the value of 13.7 tons per annum. The lowest carbon dioxide savings is also seen for Rasht, with 7.6 tons saving.
Because of the highest electricity and natural gas tariffs in Tehran, this city enjoys the shortest BPB among the investigated cities. The time for return of investment for this city is 2.79 years. Bandar Abbas is in the next place, with a PBP of 4.56 years. This study is in the second rank mainly due to the fact that during almost the whole year, it does not need space heating. Having the lowest natural gas and electricity tariffs, Yazd is in third place. PBP of Yazd is 5.48 years. Tabriz and Rasht also have PBP values of 7.21 and 10.06 years, respectively.
The operating and maintenance cost is also in the lowest level in Tehran, which leads to the lowest in Tehran. LCOE is 8.71 cents per kWh. Bandar Abbas, Yazd, and Tabriz are in the second, third, and fourth places, with LCOE values of 8.90, 9.45, 10.12 cents per kWh. Rasht has the smallest LCOE value, with the amount of 18.03 cents per kWh.
The final ranking of cities is provided in Figure 7. In this figure, the normalized closeness index values are shown. Based on Figure 7, with the normalized closeness index of 27.4 out of 100, Yazd is the foremost city to install BIPV/T system. This city has the highest amount electricity generation and heat recovery, as well as carbon dioxide savings. Tehran, which is the city with the most favorable one from PBP and LCOE viewpoints. The normalized closeness index for Tehran is 26.0 out of 100. Bandar Abbas and Rasht are in the third and fourth places, which have the normalized closeness index values of 21.8 and 16.9 out of 100, respectively. Rasht is also the city with the lowest preference city for the installation of a BIPV/T system. It gains the normalized closeness index of 7.9 out of 100.
All the obtained values have shown that a BIPV/T system could be an appropriate alternative for the diverse considered climatic conditions, except for Rasht, which is a city with the wet condition and low levels of the received solar radiation and natural gas and electricity tariffs in addition to O&M cost.

4. Conclusions

The obtained results have demonstrated that high priority was seen for the cities with one of these two characteristics:
  • The cities with high ambient temperature and high received solar irradiance. For such cities, the amount of heat recovery and electricity generation, and consequently, carbon dioxide savings, are in the best condition among all the cities. Yazd was best representative of all the cities with such specifications. It gained the normalized closeness index of 27.4 out of 100;
  • The cities with great natural gas and electricity tariffs, as well as high O&M cost. Tehran was the best representative of all the cities. TOPSIS gave a closeness index of 26.0 out of 100 to Tehran. For such cities, PBP and LCOE are of the foremost conditions in comparison to other alternatives.
Furthermore, the obtained values of performance indicators for the cities have shown that all other cities have a suitable condition to install BIPV/T, except for Rasht. Not only does Rasht have a low level of received solar radiation, but it also has a low level of natural gas and electricity tariff, and operating and maintenance cost. As a potential idea for future research studies, the impact of using BIPV/T systems on the greenhouse effect could be investigated, by taking CO2 and other possible emissions of the system, and using the life cycle assessment (LCA) approach.

Author Contributions

Data curation, M.H.S., S.S. and S.L.D.; investigation, M.H.S., A.S. and S.S.; methodology, A.S. and M.H.S.; project administration, A.S.; resources, A.S.; software, M.H.S.; supervision, A.S. and H.S.; validation, S.S. and S.L.D.; writing—original draft, M.H.S., A.S. and S.L.D.; writing—review & editing, H.S., S.L.D. and A.S. All authors have read and agreed to the published version of the manuscript.

Funding

This research received no external funding.

Institutional Review Board Statement

Not applicable.

Informed Consent Statement

Not applicable.

Data Availability Statement

Data will be available upon the request from the corresponding author.

Conflicts of Interest

The authors declare no conflict of interest.

Nomenclature

A Area ( m 2 )
c p Isobaric heat transfer ( J . K 1 . k g 1 )
C Cost
CLICloseness index
d Discount rate (%)
D h Hydraulic diameter
G irradiance ( W . m 2 )
i Inflation rate (%)
L Length ( m )
k thermal conductivity ( W . K 1 . m 1 )
ObjOnbjective
N Year
P Power ( W )
Pr Prandtl number
RThermal resistance
ReReynolds number
t Time ( s )
T Temperature ( K )
V Velocity ( m . s 1 )
U Wind speed ( m . s 1 )
Greek symbols
α Absorptivity
β Temperature coefficient
δ Thickness ( m )
ε Emissivity
ρ Density ( kg . m 3 )
ν Kinetic viscosity
η Efficiency (%)
τ Transmissivity
Scripts
a Ambient
c o n d Conduction
c o n v Convection
E V A Ethylene vinyl acetate
eleElectricity
g Glass
idealIdeal
N G Natural gas
numNumber
O & M Operating and maintenance
r a d Radiation
r e f Reference
s k y Sky
TdTedlar
Abbreviation
BIPVBuilding integrated photovoltaic
LCOELevelized cost of energy
LHVLower heating value
PBPPayback period

References

  1. Zhang, Y.; Lu, J.; Jiang, X.; Shen, S.; Wang, X. A study on heat transfer load in large space buildings with stratified air-conditioning systems based on building energy modeling: Model validation and load analysis. Sci. Prog. 2021, 104, 00368504211036133. [Google Scholar] [CrossRef] [PubMed]
  2. Sohani, A.; Dehnavi, A.; Sayyaadi, H.; Hoseinzadeh, S.; Goodarzi, E.; Garcia, D.A.; Groppi, D. The real-time dynamic multi-objective optimization of a building integrated photovoltaic thermal (BIPV/T) system enhanced by phase change materials. J. Energy Storage 2021, 46, 103777. [Google Scholar] [CrossRef]
  3. Hoseinzadeh, S.; Garcia, D.A. Techno-economic assessment of hybrid energy flexibility systems for islands’ decarbonization: A case study in Italy. Sustain. Energy Technol. Assess. 2021, 51, 101929. [Google Scholar] [CrossRef]
  4. Sohani, A.; Cornaro, C.; Shahverdian, M.H.; Samiezadeh, S.; Hoseinzadeh, S.; Dehghani-Sanij, A.; Pierro, M.; Moser, D. Using Building Integrated Photovoltaic Thermal (BIPV/T) systems to achieve net zero goal: Current trends and future perspectives. In Towards Net Zero Carbon Emissions in the Building Industry; Sayigh, A., Ed.; Springer International Publishing: Cham, Switzerland, 2022; pp. 91–107. [Google Scholar]
  5. Lv, L.; Xiang, Y.; Gu, Z.; Huang, C. Dynamic characteristics of convection heat and radiation heat on building surfaces under cyclic heat flow. Sci. Prog. 2022, 105, 00368504221075189. [Google Scholar] [CrossRef] [PubMed]
  6. Razmjoo, A.; Mirjalili, S.; Aliehyaei, M.; Østergaard, P.A.; Ahmadi, A.; Nezhad, M.M. Development of smart energy systems for communities: Technologies, policies and applications. Energy 2022, 248, 123540. [Google Scholar] [CrossRef]
  7. Mahmoudan, A.; Esmaeilion, F.; Hoseinzadeh, S.; Soltani, M.; Ahmadi, P.; Rosen, M. A geothermal and solar-based multigeneration system integrated with a TEG unit: Development, 3E analyses, and multi-objective optimization. Appl. Energy 2021, 308, 118399. [Google Scholar] [CrossRef]
  8. Lv, L.; Luo, Y.; Xiang, Y.; Zhou, X.; Huang, C. Research on the dynamic heat transfer of stratified air conditioning zone building surfaces in large space scale rig based on low supply-middle return. Sci. Prog. 2020, 103, 0036850420950926. [Google Scholar] [CrossRef]
  9. Gong, X.; Chen, Y.; Liang, M. Theoretical study of building-integrated photovoltaics based on perovskite single junction and perovskite/silicon tandem solar cells. Energy Explor. Exploit. 2019, 38, 723–732. [Google Scholar] [CrossRef] [Green Version]
  10. Sohani, A.; Naderi, S.; Pignatta, G. 4E Advancement of Heat Recovery during Hot Seasons for a Building Integrated Photovoltaic Thermal (BIPV/T) System. Environ. Sci. Proc. 2021, 12, 5. [Google Scholar]
  11. Riaz, A.; Liang, R.; Zhou, C.; Zhang, J. A review on the application of photovoltaic thermal systems for building façades. Build. Serv. Eng. Res. Technol. 2019, 41, 86–107. [Google Scholar] [CrossRef]
  12. Kong, F. A better understanding of the role of new energy and green finance to help achieve carbon neutrality goals, with special reference to China. Sci. Prog. 2022, 105, 00368504221086361. [Google Scholar] [CrossRef] [PubMed]
  13. Riaz, A.; Zhou, C.; Liang, R.; Zhang, J. Performance study on photovoltaic thermal building façade component in multi-energy generation during winter. Build. Serv. Eng. Res. Technol. 2021, 42, 405–419. [Google Scholar] [CrossRef]
  14. Karthick, A.; Murugavel, K.K.; Sudalaiyandi, K.; Manokar, M. Building integrated photovoltaic modules and the integration of phase change materials for equatorial applications. Build. Serv. Eng. Res. Technol. 2019, 41, 634–652. [Google Scholar] [CrossRef]
  15. Pugsley, A.; Zacharopoulos, A.; Chemisana, D. Chapter 10—Polygeneration systems in buildings. In Polygeneration Systems; Calise, F., Dentice D’Accadia, M., Vanoli, L., Vicidomini, M., Eds.; Academic Press: Cambridge, MA, USA, 2022; pp. 351–410. [Google Scholar]
  16. Rahiminejad, M.; Pâris, A.L.M.; Ge, H.; Khovalyg, D. Performance of lightweight and heavyweight building walls with naturally ventilated passive and active facades. Energy Build. 2021, 256, 111751. [Google Scholar] [CrossRef]
  17. Theokli, C.; Elia, C.; Markou, M.; Vassiliades, C. Energy renovation of an existing building in Nicosia Cyprus and investigation of the passive contribution of a BIPV/T double façade system: A case-study. Energy Rep. 2021, 7, 8522–8533. [Google Scholar] [CrossRef]
  18. Pillai, D.S.; Shabunko, V.; Krishna, A. A comprehensive review on building integrated photovoltaic systems: Emphasis to technological advancements, outdoor testing, and predictive maintenance. Renew. Sustain. Energy Rev. 2022, 156, 111946. [Google Scholar] [CrossRef]
  19. Dash, A.; Agrawal, S.; Gairola, S.; Singh, S. Optimization and Performance Characteristics of Building Integrated Photovoltaic Thermal (BIPVT) System in Cold Climatic Conditions. Asian J. Water, Environ. Pollut. 2018, 15, 63–72. [Google Scholar] [CrossRef]
  20. Garg, S. Developing a BIPVT: Building Integrated PV-Thermal System. Master’s Thesis, Delft University of Technology, Delft, The Netherlands, 2018. [Google Scholar]
  21. Lamnatou, C.; Smyth, M.; Chemisana, D. Building-Integrated Photovoltaic/Thermal (BIPVT): LCA of a façade-integrated prototype and issues about human health, ecosystems, resources. Sci. Total Environ. 2019, 660, 1576–1592. [Google Scholar] [CrossRef]
  22. Kazemian, A.; Salari, A.; Hakkaki-Fard, A.; Ma, T. Numerical investigation and parametric analysis of a photovoltaic thermal system integrated with phase change material. Appl. Energy 2019, 238, 734–746. [Google Scholar] [CrossRef]
  23. Yu, G.; Yang, H.; Yan, Z.; Ansah, M.K. A review of designs and performance of façade-based building integrated photovoltaic-thermal (BIPVT) systems. Appl. Therm. Eng. 2020, 182, 116081. [Google Scholar] [CrossRef]
  24. Jahangir, M.H.; Razavi, S.M.E.; Kasaeian, A.; Sarrafha, H. Comparative study on thermal performance of an air based photovoltaic/thermal system integrated with different phase change materials. Sol. Energy 2020, 208, 1078–1090. [Google Scholar] [CrossRef]
  25. Shakouri, M.; Ghadamian, H.; Noorpoor, A. Quasi-dynamic energy performance analysis of building integrated photovoltaic thermal double skin façade for middle eastern climate case. Appl. Therm. Eng. 2020, 179, 115724. [Google Scholar] [CrossRef]
  26. Bot, K.; Aelenei, L.; Da Glória Gomes, M.; Silva, C.S. Performance Assessment of a Building Integrated Photovoltaic Thermal System in Mediterranean Climate—A Numerical Simulation Approach. Energies 2020, 13, 2887. [Google Scholar] [CrossRef]
  27. Kumar, N.M.; Samykano, M.; Karthick, A. Energy loss analysis of a large scale BIPV system for university buildings in tropical weather conditions: A partial and cumulative performance ratio approach. Case Stud. Therm. Eng. 2021, 25, 100916. [Google Scholar] [CrossRef]
  28. Rounis, E.D.; Athienitis, A.K.; Stathopoulos, T. BIPV/T curtain wall systems: Design, development and testing. J. Build. Eng. 2021, 42, 103019. [Google Scholar] [CrossRef]
  29. Dumoulin, R.; Rounis, E.D.; Athienitis, A. Operation and grid interaction modeling of a house with a building integrated photovoltaic thermal (BIPV/T) system coupled to an air-source heat pump. Sci. Technol. Built Environ. 2021, 27, 1311–1329. [Google Scholar] [CrossRef]
  30. Ma, L.; Ge, H.; Wang, L.; Wang, L. Optimization of passive solar design and integration of building integrated photovoltaic/thermal (BIPV/T) system in northern housing. In Building Simulation; Tsinghua University Press: Beijing, China, 2021; Volume 14, pp. 1467–1486. [Google Scholar]
  31. Asefi, G.; Habibollahzade, A.; Ma, T.; Houshfar, E.; Wang, R. Thermal management of building-integrated photovoltaic/thermal systems: A comprehensive review. Sol. Energy 2021, 216, 188–210. [Google Scholar] [CrossRef]
  32. Gagliano, A.; Tina, G.M.; Aneli, S.; Chemisana, D. Analysis of the performances of a building-integrated PV/Thermal system. J. Clean. Prod. 2021, 320, 128876. [Google Scholar] [CrossRef]
  33. Maghrabie, H.M.; Elsaid, K.; Sayed, E.T.; Abdelkareem, M.A.; Wilberforce, T.; Olabi, A. Building-integrated photovoltaic/thermal (BIPVT) systems: Applications and challenges. Sustain. Energy Technol. Assess. 2021, 45, 101151. [Google Scholar] [CrossRef]
  34. Sohani, A.; Sayyaadi, H.; Mohammadhosseini, N. Comparative study of the conventional types of heat and mass exchangers to achieve the best design of dew point evaporative coolers at diverse climatic conditions. Energy Convers. Manag. 2018, 158, 327–345. [Google Scholar] [CrossRef]
  35. Moghadam, R.S.; Sayyaadi, H.; Hosseinzade, H. Sizing a solar dish Stirling micro-CHP system for residential application in diverse climatic conditions based on 3E analysis. Energy Convers. Manag. 2013, 75, 348–365. [Google Scholar] [CrossRef]
  36. Shahverdian, M.H.; Sohani, A.; Sayyaadi, H.; Samiezadeh, S.; Doranehgard, M.H.; Karimi, N.; Li, L.K. A dynamic multi-objective optimization procedure for water cooling of a photovoltaic module. Sustain. Energy Technol. Assess. 2021, 45, 101111. [Google Scholar] [CrossRef]
  37. Gu, W.; Ma, T.; Shen, L.; Li, M.; Zhang, Y.; Zhang, W. Coupled electrical-thermal modelling of photovoltaic modules under dynamic conditions. Energy 2019, 188, 116043. [Google Scholar] [CrossRef]
  38. Sohani, A.; Sayyaadi, H.; Miremadi, S.R.; Yang, X.; Doranehgard, M.H.; Nizetic, S. Determination of the best air space value for installation of a PV façade technology based on 4E characteristics. Energy 2023, 262, 125386. [Google Scholar] [CrossRef]
  39. Holman, J.P. Heat Transfer, 10th ed.; McGraw-Hill: New York, NY, USA, 2009. [Google Scholar]
  40. Sohani, A.; Shahverdian, M.H.; Sayyaadi, H.; Hoseinzadeh, S.; Memon, S. Enhancing the renewable energy payback period of a photovoltaic power generation system by water flow cooling. Int. J. Sol. Therm. Vac. Eng. 2021, 3, 73–85. [Google Scholar] [CrossRef]
  41. Shahverdian, M.H.; Sohani, A.; Sayyaadi, H. Water-energy nexus performance investigation of water flow cooling as a clean way to enhance the productivity of solar photovoltaic modules. J. Clean. Prod. 2021, 312, 127641. [Google Scholar] [CrossRef]
  42. Shahsavar, A.; Rajabi, Y. Exergoeconomic and enviroeconomic study of an air based building integrated photovoltaic/thermal (BIPV/T) system. Energy 2018, 144, 877–886. [Google Scholar] [CrossRef]
  43. Tan, H.; Charters, W. Effect of thermal entrance region on turbulent forced-convective heat transfer for an asymmetrically heated rectangular duct with uniform heat flux. Sol. Energy 1969, 12, 513–516. [Google Scholar] [CrossRef]
  44. Zahedi, R.; Seraji, M.A.N.; Borzuei, D.; Moosavian, S.F.; Ahmadi, A. Feasibility study for designing and building a zero-energy house in new cities. Sol. Energy 2022, 240, 168–175. [Google Scholar] [CrossRef]
  45. Ahmadi, A.; Das, B.; Ehyaei, M.; Esmaeilion, F.; Assad, M.E.H.; Jamali, D.; Koohshekan, O.; Kumar, R.; Rosen, M.; Negi, S.; et al. Energy, exergy, and techno-economic performance analyses of solar dryers for agro products: A comprehensive review. Sol. Energy 2021, 228, 349–373. [Google Scholar] [CrossRef]
  46. Chen, L.; Cheng, D.; Tang, P.; Yao, D.; Ahmadi, A.; Ehyaei, M. Energy, exergy, and exergoenvironmental assessment of the coupled electrochemical copper-chlorine with the Goswami cycles. Energy Sources Part A Recover. Util. Environ. Eff. 2021, 1–19. [Google Scholar] [CrossRef]
  47. Zahedi, R.; Ahmadi, A.; Dashti, R. Energy, exergy, exergoeconomic and exergoenvironmental analysis and optimization of quadruple combined solar, biogas, SRC and ORC cycles with methane system. Renew. Sustain. Energy Rev. 2021, 150, 111420. [Google Scholar] [CrossRef]
  48. Shahverdian, M.H.; Sohani, A.; Sayyaadi, H. A 3E water energy nexus based optimum design for a hybrid PV-PEMFC electricity production systems for off-gird applications. Energy Convers. Manag. 2022, 267, 115911. [Google Scholar] [CrossRef]
  49. Abbasi, M.H.; Sayyaadi, H.; Tahmasbzadebaie, M. A methodology to obtain the foremost type and optimal size of the prime mover of a CCHP system for a large-scale residential application. Appl. Therm. Eng. 2018, 135, 389–405. [Google Scholar] [CrossRef]
  50. Sohani, A.; Rezapour, S.; Sayyaadi, H. Comprehensive performance evaluation and demands’ sensitivity analysis of different optimum sizing strategies for a combined cooling, heating, and power system. J. Clean. Prod. 2021, 279, 123225. [Google Scholar] [CrossRef]
  51. Suryanti, A.; Sugiartawan, P.; Welda, W. A computer-based system to support tourism in Bali, Indonesia. J. Phys. Conf. Ser. IOP 2020, 1469, 012039. [Google Scholar] [CrossRef]
  52. Tonui, J.; Tripanagnostopoulos, Y. Improved PV/T solar collectors with heat extraction by forced or natural air circulation. Renew. Energy 2007, 32, 623–637. [Google Scholar] [CrossRef]
Figure 1. A simple schematic of system.
Sustainability 14 15529 g001
Figure 2. A flow chart describing the TOPSIS procedure Reprinted with permission from reference [51]. 2020, Journal of Physics: Conference Series.
Sustainability 14 15529 g002
Figure 3. Model validation using the experimental data for air temperature in the channel available in [52].
Sustainability 14 15529 g003
Figure 4. Model validation using the experimental data for PV temperature available in [52].
Sustainability 14 15529 g004
Figure 5. Monthly profiles of the investigated performance indicators of BIPV/T systems; (a) electricity generation; (b) heat recovery; (c) carbon dioxide emissions.
Sustainability 14 15529 g005aSustainability 14 15529 g005a
Figure 6. Comparing the performance indicators which are considered for decision making by TOPSIS for the five investigated cities; (a) electricity generation in a year; (b) heat recovery in a year; (c) carbon dioxide emissions in a year; (d) PBP; (e) LCOE.
Sustainability 14 15529 g006aSustainability 14 15529 g006b
Figure 7. The normalized closeness index values for the five investigated cities; the more normalized closeness index an alternative has, the higher the preference for installation of a BIPV/T system it enjoys.
Sustainability 14 15529 g007
Table 1. Reviewing the recent relevant studies.
StudyYearA Short DescriptionWas a Systematic Decision-Making Approach Utilized for Selecting the Best Location for the Installation of a BIPV/T System?
Dash et al. [19]2018A model based on simple equations for heat transfer was developed and energy and exergy analyses were carried out. The study considered climatic conditions of India.No
Garg [20]2018A numerical model in which the performance was assumed as a steady-state, was developed. The developed model was validated using the obtained experimental data under the climatic condition of the University of Delft, the Netherlands.No
Lamnatou et al. [21]2019Life cycle assessment was carried out for a BIPV/T system in Belfast, United Kingdom. Different indicators, including ecological footprint were studied.No
Kazemian et al. [22]2019A BIPV/T system performance with PCM was simulated. It was carried out by developing a 3D numerical model. A parametric analysis was carried out afterwards.No
Yu et al. [23]2020A review on the design and performance assessment of BIPV/T systems was conducted. No
Jahangir et al. [24]2020A novel design for application of PCM in a BIPV/T system was proposed. Four types of PCM were examined, while the case study was located in Mashhad, Iran.No
Shakouri et al. [25]2020By developing a quasi-static model, the performance of a BIPV/T was simulated to improve the energy aspect. The study considered Middle Eastern climatic conditions for analysis.No
Bot et al. [26]2020A numerical simulation was carried out to model a BIPV/T system in the Mediterranean climate. A variety of indicators, including thermal comfort, were studied.No
Kumar et al. [27]2021The study focused on energy losses in a BIPV/T system. Two indicators, namely, cumulative and partial performance ratios, were considered. The study selected Malaysia as the case study, which was representative of the tropical climate.No
Rounis et al. [28]2021A BIPV/T was designed, developed, and experimentally tested, and a number of performance improvement techniques, such as multiple inputs, were examined. A solar simulator was utilized for conducting the experiments.No
Dumoulin et al. [29]2021An integrated system, which was a combination of a BIPV/T unit and a heat pump, was experimentally investigated using TRNSYS software. The goal of the study was to find the enhancement potential of the system due to the application of storage units, while Montreal, Canada, was the considered case study.No
Ma et al. [30]2021A region in the northern part of Canada was considered, and the feasibility of BIPV/T system application for that was investigated. The investigation was carried out to optimize the life cycle cost.No
Asefi et al. [31]2021A review was conducted with the aim of comparison of different technologies that have the potential of integration with a BIPV/T system.No
Gagliano et al. [32]2021The operation of a BIPV in the Mediterranean region was investigated by developing a validated simulation approach. The energy production values for diverse exposures were obtained and compared together.No
Maghrabie et al. [33]2021This study investigated different challenges towards using BIPV/T systems, including technical, economic, and environmental perspectives.No
Sohani et al. [2]2022A BIPV/T PCM system in Tehran, Iran, was studied to find the best value of PCM. It was carried out using the dynamic multi-objective optimization approach.No
The current study2022Five cities from diverse climatic conditions of Iran are chosen, and by taking advantage of TOPSIS, the preference for installation of BIPV/T systems is found for a residential building as the case-study. The investigation covers environmental, energy, and economic indicators.Yes
Table 2. General information of the five investigated cities [35].
Bandar AbbasTabrizTehranRashtYazd
Climate typeHot and humidCold and dryHot Semi desertTemperate and humidHot and dry
Latitude (°N)27.237.835.737.331.9
Longitude (°E)56.446.351.450.254.4
SummerTdb (°C)40.633.937.831.940
Twb (°C)31.91819.425.718.3
WinterTdb (°C)7.5−10.8−4.4−2.2−5.3
Table 3. The considered values of key parameters which are utilized for modeling the BIPV/T system [36].
ParameterValueUnit
Module typeSilicon-based polycrystalline (YL320P-35b)-
The rated capacity of each module320
Manufactured byYingly Company-
Air gap150mm
Thickness of each module40mm
Width of each module992mm
Length of each module1960mm
Building height18m
Temperature factor of maximum power−0.45%.K−1
Current in short-circuit state9.25A
Current in maximum power state8.78A
Voltage in open-circuit state45.2V
Temperature factor of voltage−0.37%.K−1
Voltage in maximum power state36.5V
Publisher’s Note: MDPI stays neutral with regard to jurisdictional claims in published maps and institutional affiliations.

