Article

Geological and Mineralogical Mapping Based on Statistical Methods of Remote Sensing Data Processing of Landsat-8: A Case Study in the Southeastern Transbaikalia, Russia

by
Igor Olegovich Nafigin
*,
Venera Talgatovna Ishmukhametova
,
Stepan Andreevich Ustinov
,
Vasily Alexandrovich Minaev
and
Vladislav Alexandrovich Petrov
Institute of Geology of Ore Deposits, Petrography, Mineralogy and Geochemistry (IGEM) RAS, 119017 Moscow, Russia
*
Author to whom correspondence should be addressed.
Sustainability 2022, 14(15), 9242; https://doi.org/10.3390/su14159242
Submission received: 29 June 2022 / Revised: 22 July 2022 / Accepted: 25 July 2022 / Published: 28 July 2022

Abstract

:
The work considers the suitability of using multispectral satellite remote sensing data Landsat-8 for conducting regional geological and mineralogical mapping of the territory of south-eastern Transbaikalia (Russia) based on statistical methods for processing remote sensing data in conditions of medium–low-mountain relief and continental climate. The territory was chosen as the object of study due to its diverse metallogenic specialization (Au, U, Mo, Pb-Zn, Sn, W, Ta, Nb, Li, fluorite). Diversity in composition and age of ore-bearing massifs of intrusive, volcanogenic, and sedimentary rocks are also of interest. The work describes the initial data and considers the procedure for their pre-processing, including radiometric and atmospheric correction. Statistical processing algorithms to increase spectral information content of satellite data Landsat-8 were used. They include: principal component analysis, minimum noise fraction, and independent component analysis. Eigenvector matrices analyzed on the basis of statistical processing results and two-dimensional correlation graphs were built to compare thematic layers with geological material classes: oxide/hydroxide group minerals containing transition iron ions (Fe3+ and Fe3+/Fe2+); a group of clay minerals containing A1-OH and Fe, Mg-OH; and minerals containing Fe2+ and vegetation cover. Pseudo-colored RGB composites representing the distribution and multiplication of geological material classes are generated and interpreted according to the results of statistical methods. Integration of informative thematic layers using a fuzzy logic model was carried out to construct a prediction scheme for detecting hydrothermal mineralization. The received schema was compared with geological information, and positive conclusions about territory suitability for further remote mapping research of hydrothermally altered zones and hypergenesis products in order to localize areas promising for identifying hydrothermal metasomatic mineralization were made.

1. Introduction

The explored area of the south-eastern Transbaikalia has a wide metallogenic potential (Au, U, Mo, Pb-Zn, Sn, W, Ta, Nb, Li, fluorite) and is promising for the discovery of hydrothermal mineral deposits. As the area is large enough and covers more than 50,000 square kilometers, it is cost-effective to carry out detailed field-forecasting and search works in severe climatic conditions. For this reason, it is necessary to consider the various accessible remote approaches for the mapping, classification, and identification classes of geological data, as well as for the identification of geological process indicators in order to localize promising areas for ore mineralization of hydrothermal and hypergene nature.
The application of modern methods and technologies using the Earth’s remote sensing data is a promising direction of increasing the efficiency of forecasting and prospecting for mineral deposits [1,2]. Implementation of a complex of forecasting works using remote methods is performed sequentially in accordance with the traditional approach to the study of territories: from regional to large-scale works [3,4]. The article considers the first stage of the predictive and search complex of works using remote methods corresponding to the regional level of research. At this stage, the application of various statistical methods for the processing of remote sensing data is aimed at evaluating suitability of using the multi-spectral satellite acquisition Landsat-8 materials for geological and mineralogical mapping under geomorphological, climatic, and soil–plant conditions of the territory under investigation.
With increased availability, emergence of new processing algorithms, and improved spatial and spectral resolution, multi-spectral and hyperspectral satellite images have become increasingly widely used for geological mapping, mapping of hydrothermal–metasomatic alteration rocks, and mineral groups to study different types of mineralization: epithermal gold [5,6,7], epithermal polymetallic [8], and porphyry copper [9]. Open areas with arid or semi-arid climates are mainly used as reference areas to validate the performance of this mapping approach (Egypt, Saudi Arabia, Iran, Iraq, Pakistan, etc.), since such territories are practically free from vegetation and wet cover which increases the reliability of remote mapping results. Nevertheless, there are also a number of successful mapping projects of hydrothermally altered rocks in arctic [10,11,12], tropical [13,14,15], subtropical [16,17], and arid [18] climates.
Due to the weak metallogenic study, complex geological conditions, but with high prospects for discovering new hydrothermal deposits, no regional prospecting studies have been conducted in South-Eastern Transbaikalia.
The study of modern remote methods and approaches to regional geological and mineralogical mapping allowed the authors to develop an approach applicable to the geological, climatic, and soil–vegetation conditions of the study area. For this purpose, geological, geomorphological, and metallogenic information about the object of study was collected and digitized in the geoinformation environment on a 1:200,000 scale. As remote sensing data the Landsat-8 dataset was chosen. Because the scope of imagery corresponds to the regional scale, there is the Operational Land Imager (OLI) sensor working in nine spectral ranges with VNIR and SWIR wavelengths on board and due to a sufficient observation period of 16 days [19], there is a possibility to choose the appropriate scene in the concrete month with absence of cloud cover.
For remote sensing data processing, methods such as false color composite (FCC) [20], principal component analysis (PCA) [21], minimum noise fraction (MNF) [22], and independent component analysis (ICA) [23] were chosen as the most effective. The works on measurement of mineral spectra using Vis-NIR methods [24,25,26] were used as the basis for comparison of groups of geological materials with Landsat-8 bands.
On basis of the FCC results, geological mapping of the territory was carried out, during which 16 morphological structures were identified. The geological and morphological characteristics of the identified structures were characterized.
The most informative thematic layers of the results of statistical processing of remote sensing data were fused using the fuzzy logic model [27] for generating a prospectivity map. In order to verify the prospectivity map, it was spatially correlated with previously collected geological data.

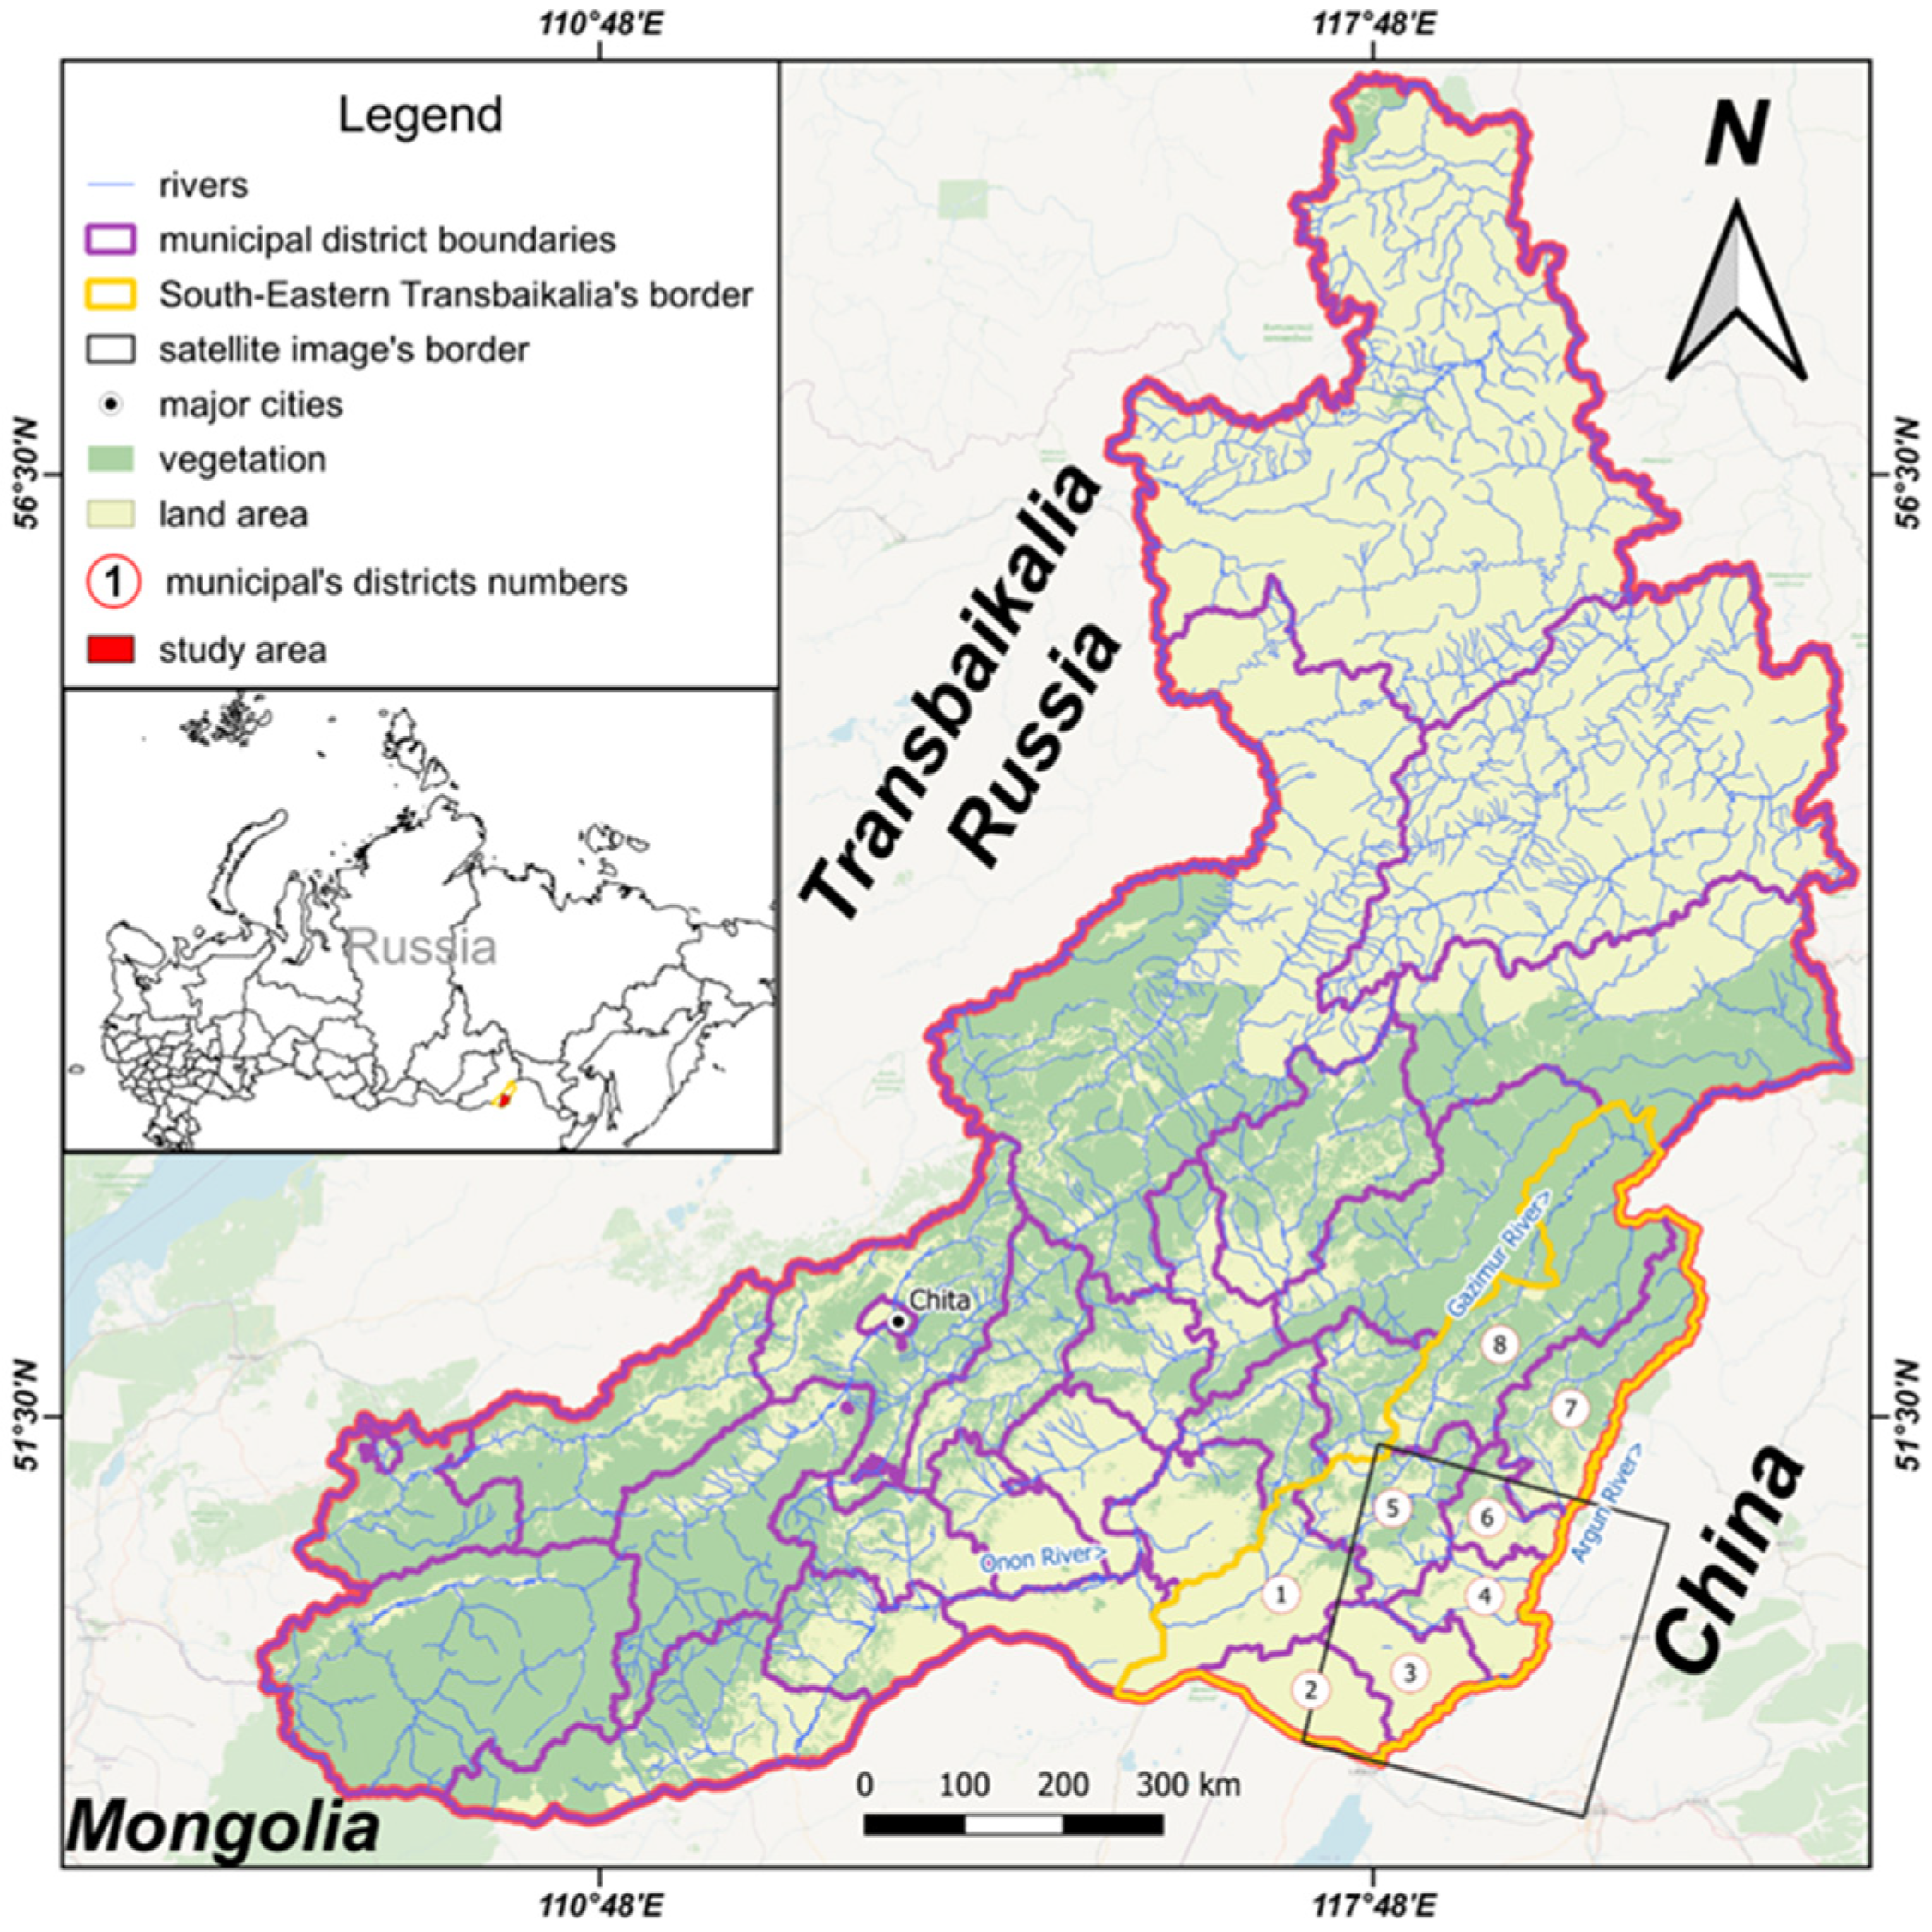
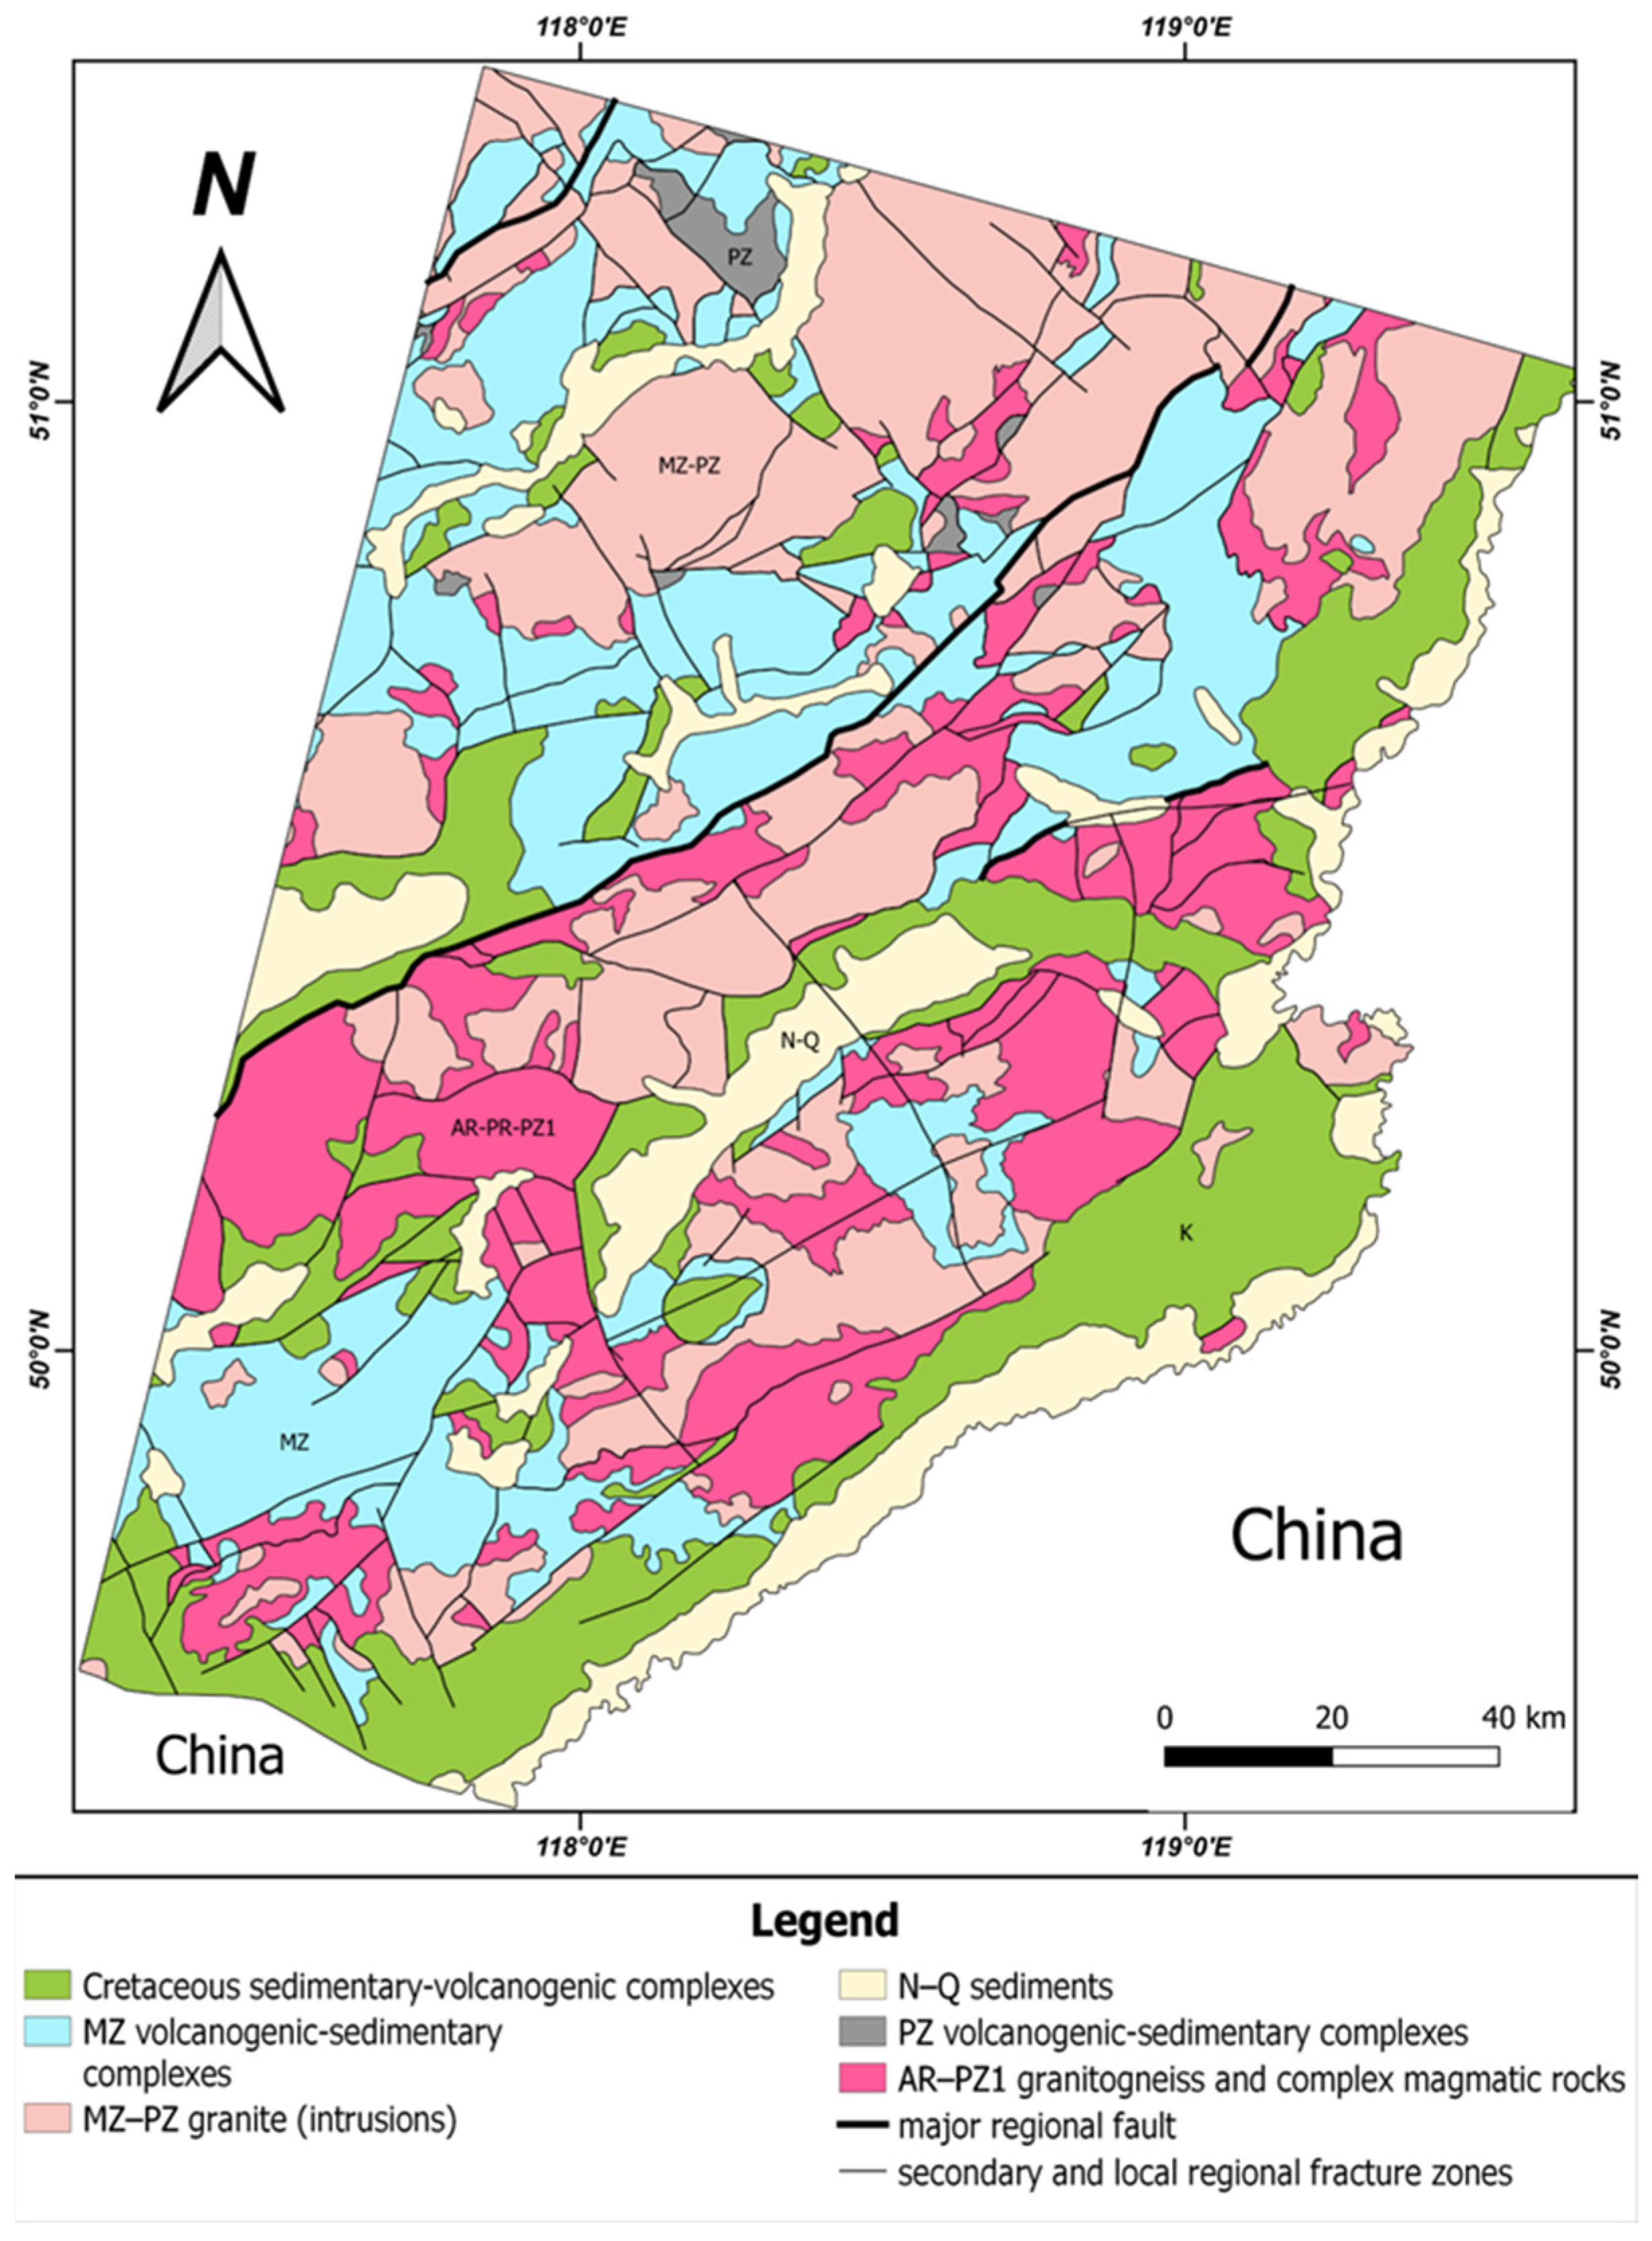
2. Geological Setting

The studied territory is located in the south-eastern part of Transbaikalia (Russia) and extends from the west to east between the valleys of the rivers Onon and Argun, and from north to south between the Gazimur river valley and the state country’s borders with China and Mongolia. Administratively, the southeastern part of Transbaikalia includes Borzin, Transbaikalia, Krasnokamen, Priargun, Alexandrovo-Zavodskoye, and Gazimuro-Zavod municipal areas (Figure 1) [28]. The tectonic position of the territory is determined by its position at the junction of the Siberian craton and the Mongolian-Okhotsk fold-block region [29].
The terrain is predominantly medium–low mountainous, mainly represented by ridges separated by extensive depressions and broad valleys of numerous rivers. Average height above sea level is about 700 m. The climate is sharply continental. The predominance of the anticyclonic state of the atmosphere determines atmosphere results in a greater number of sunny days. The average annual air temperature is −1 °C.
The geology of the studied area is very complex and characterized by the long-term development of age-diverse, diverse in composition, and genesis formations whose occurrence is complicated by folding and faulting.
Geological structure and ore-bearing volcano–plutonic complexes of the southern Argun area evolved during the Proterozoic (which ended about 600 million years ago), Caledonian (520–410 million years ago), and Hercynian tectonomagmatic cycles (360–120 million years ago), in the process of tectonomagmatic activation in the late Mesozoic (160–100 million years ago) and at the neotectonic phase of the region’s development. Late Mesozoic tectonomagmatic activation is most productive in the form of ore-genetic processes that determined the metallogenic appearance of the territory [30,31].
Late Mesozoic volcanism has developed mainly in local structures, arising both within and between large depressions. Thus, sedimentary–volcanogenic rock complexes of late Mesozoic activation, composing graben-like depressions and local volcano–tectonic structures make up the upper structural level, which was formed on the proterozoic-paleozoic granite-metamorphic basement, which forms the lower structural level.
After the completion of volcanism along the same long-lived tectonic structures, multi-stage hydrothermal processes that formed ore deposits appeared, and large ore clusters of gold-porphyry, molebden-copper-porphyry, gold-sulphide, polymetallic, fluorite, and molybdenum-uranium mineralization formed in the intersection nodes of the long-lived deep faults.
The main factor determining the location of mineral deposits within the studied area is the lithological-structural as the deposits are mostly associated with linear zones of faults of various orders and intersections of long-lived deep zones of fractures of the north-eastern strike, with fracture zones of the north-western, meridional, and latitudinal directions [29].
Additionally, a prominent role in the formation and placement of mineral deposits belongs to the hypergenic processes. They condition some of the qualitative and quantitative characteristics of ores at individual sites. This primarily concerns placers of gold and other metal deposits, a significant part of deposits of building materials, as well as some primary deposits of metallic minerals. Areal and linear weathering crusts, oxidation zones of sulphide deposits and iron hats, as well as placers of minerals resistant to weathering processes were formed on the territory of the study (in the study area). Iron hats and liner weathering crusts developing mainly along linear zones of faulting of various orders are considered as metallotects that control the distribution of minerals [32].
Despite the relatively high level of knowledge, data analysis indicates that the territory has good prospects for increasing the mineral resource base for many types of minerals. A simplified version of the millionth scale [32] detailed geological map is presented in Figure 2.

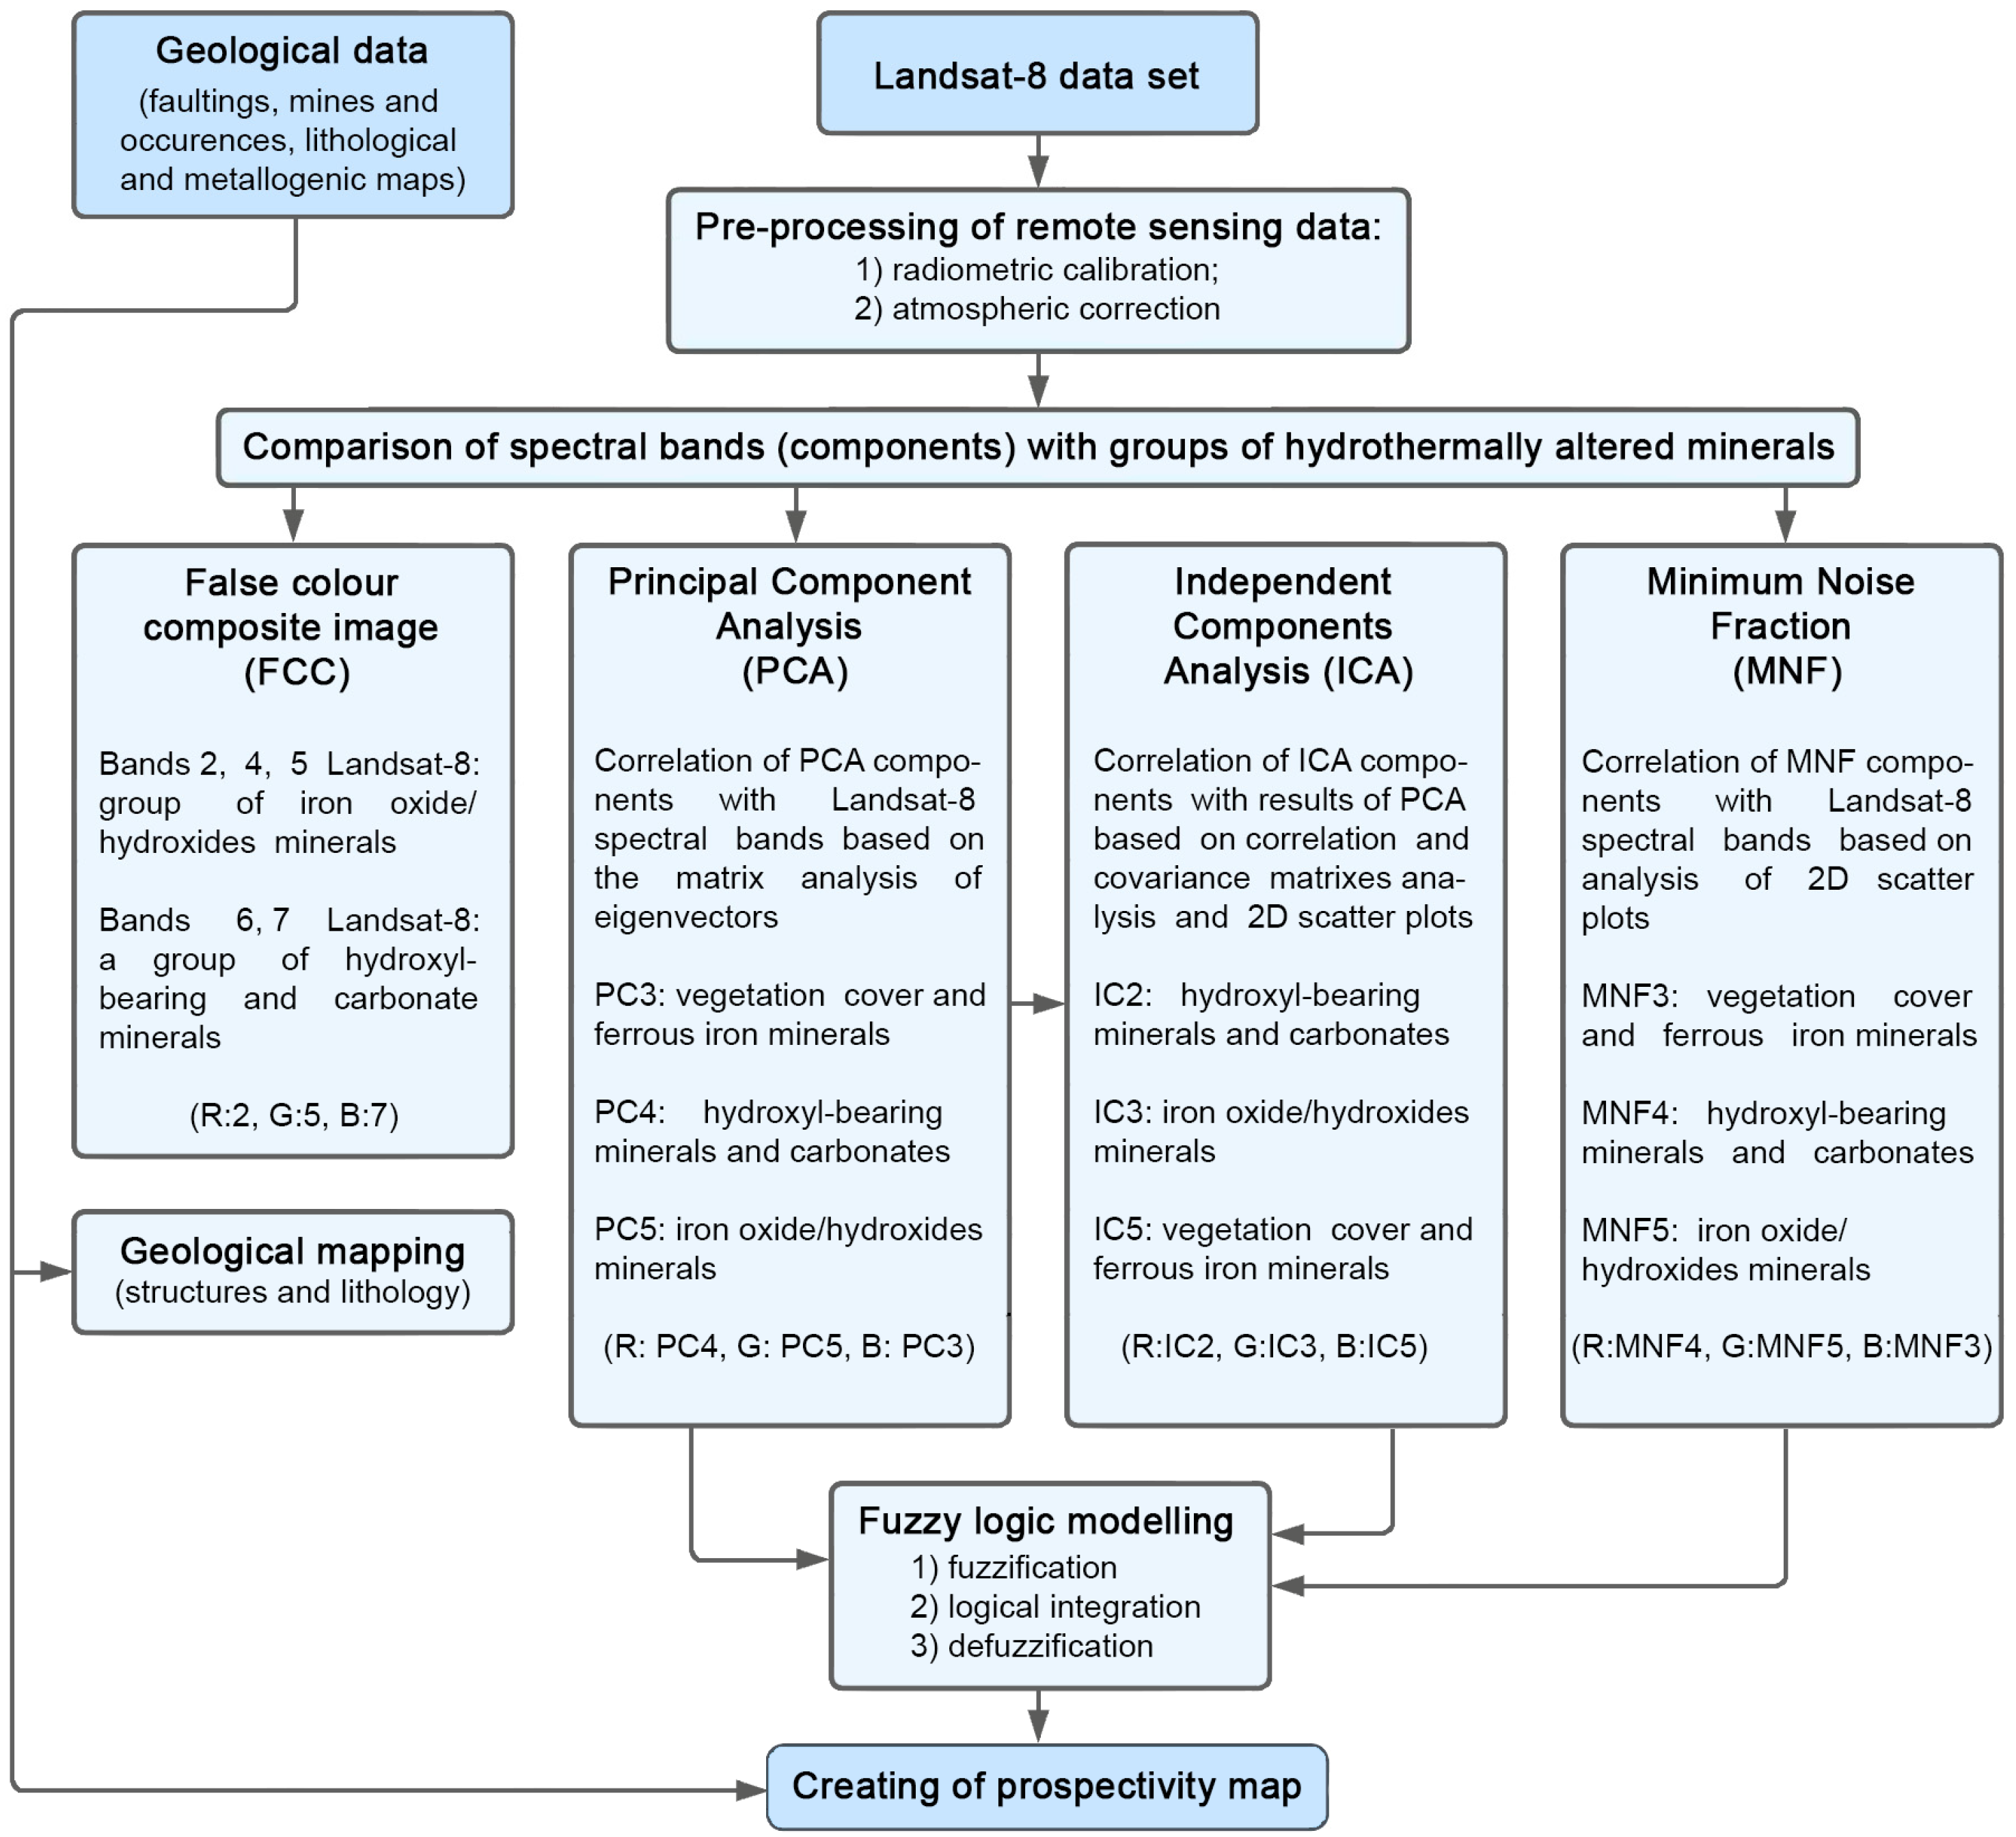
3. Data and Methodology

3.1. Satellite Optical Data Characteristics

Landsat-8 was launched on 11 February 2013 and is the eighth in the series of the satellites (http://science.nasa.gov/missions/ldcm, accessed on 28 June 2022). Landsat-8 has 2 sensors OLI and Thermal Infrared Sensor (TIRS). The OLI sensor collects data for 8 shortwave spectral channels with a spatial resolution of 30 m and a 15 m panchromatic channel: band 1—deep blue (0.43–0.45 μm); band 2—blue (0.45–0.51 μm); band 3—green (0.53–0.59 μm); band 4—red (0.64–0.67 μm); band 5—short-wave infrared (0.85–0.88 μm); band 6—short-wave infrared (1.57–1.65 μm); band 7 short-wave infrared (2.11–2.29 μm); band 8—panchromatic (0.50–0.68 μm); and band 9—cirrus clouds (Cirrus) (1.36–1.38 μm). Band 1—the sensor OLI channel is mainly used to observe ocean coloration in coastal zones, and the band 9 short-wave infrared channel of the OLI sensor allows to detect cirrus clouds (Cirrus), because it captures a strong water vapor absorption function [19,33]. The TIRS sensor collects image data for two thermal channels: band 10 (10.60–11.19 μm) and band 11 (11.50–12.51 μm) with a spatial resolution of 100 m. Except channels for OLI and TIRS sensors, there is a “quality assessment” channel in the data set of Landsat-8 OLI, which is bit-packed data about surface, atmospheric, and sensory survey conditions that can affect the overall usefulness of formed pixels [34].
Landsat-8 OLI data are collected in a gripping band of 185 km and segmented on 185 × 180 km-long stages, have a high signal to noise ratio, and 12-bit data quantization, allowing the fine variability of the ground reflection, what is appropriate for regional geological mapping [33,35].

3.2. Pre-Processing of Satellite Optical Data

Daytime cloudless landscape image Landsat-8 of processing level 1T (terrain corrected) LC08_L1TP_165013_20161001_20170320_01_T1 (path/row 165/13), covering the studied area was received on 21 October 2017 for this research work from the Information System for the collection and Provision of Remote Sensing Satellite Data (EOSDIS) (https://search.earthdata.nasa.gov, accessed on 28 June 2022).
The cartographic projection of satellite imagery was determined in the 50 N zone of the universal transverse Mercator (UTM), using the datum of the World System of Geodetic parameters of the Earth 1984 (WGS 84). To calibrate the original digital values (DN) of the image to the surface reflectivity (range from 0 to 1) an algorithm for Fast Line-of-sight Atmospheric Analysis of Hypercubes (FLAASH) [36] using sub-Arctic summer atmospheric and rural aerosol models MODTRAN [37,38] was applied. As a result, the spectral curve of each pixel of a multi-spectral image can be used to detect, recognize, and classify objects of a surface [39,40].
Then, a normalized relative vegetation index (NDVI) [41] and normalized relative water index (NDWI) [42] were calculated to mask the vegetation and water cover of the daily surface, as the areas of the land surface are dominated by strong (intensive) vegetation and water cover, making it impossible to assess the unique spectral contribution of rocks and soils to the image pixel [24].
Moreover, on the basis of a channel “the quality assessment”, pixels which can introduce errors into further image processing were isolated. The area under investigation was also removed. Channel 9 (cirrus clouds) was not used in this study. Channel 8 (panchromatic) was used for resampling of spectral channel VNIR and SWIR ranges of Lansat-8–15 m spatial resolution using the “Pan-sharpening” method, which is based on the Gram–Schmidt algorithm [43].

3.3. Image Processing Techniques

To extract key information related to hydrothermally altered minerals and hypergenesis products from the pre-processed remote sensing data, a number of image processing methods were used: FCC, PCA, MNF, and ICA. Further, for generating the mineral prospectivity map, the most informative thematic layers were fused by the fuzzy logic model. Finally, to interpret the remote sensing results, spatial analysis was carried out in association with geological information. A flowchart of the remote sensing data processing algorithm used in this study is shown in Figure 3.

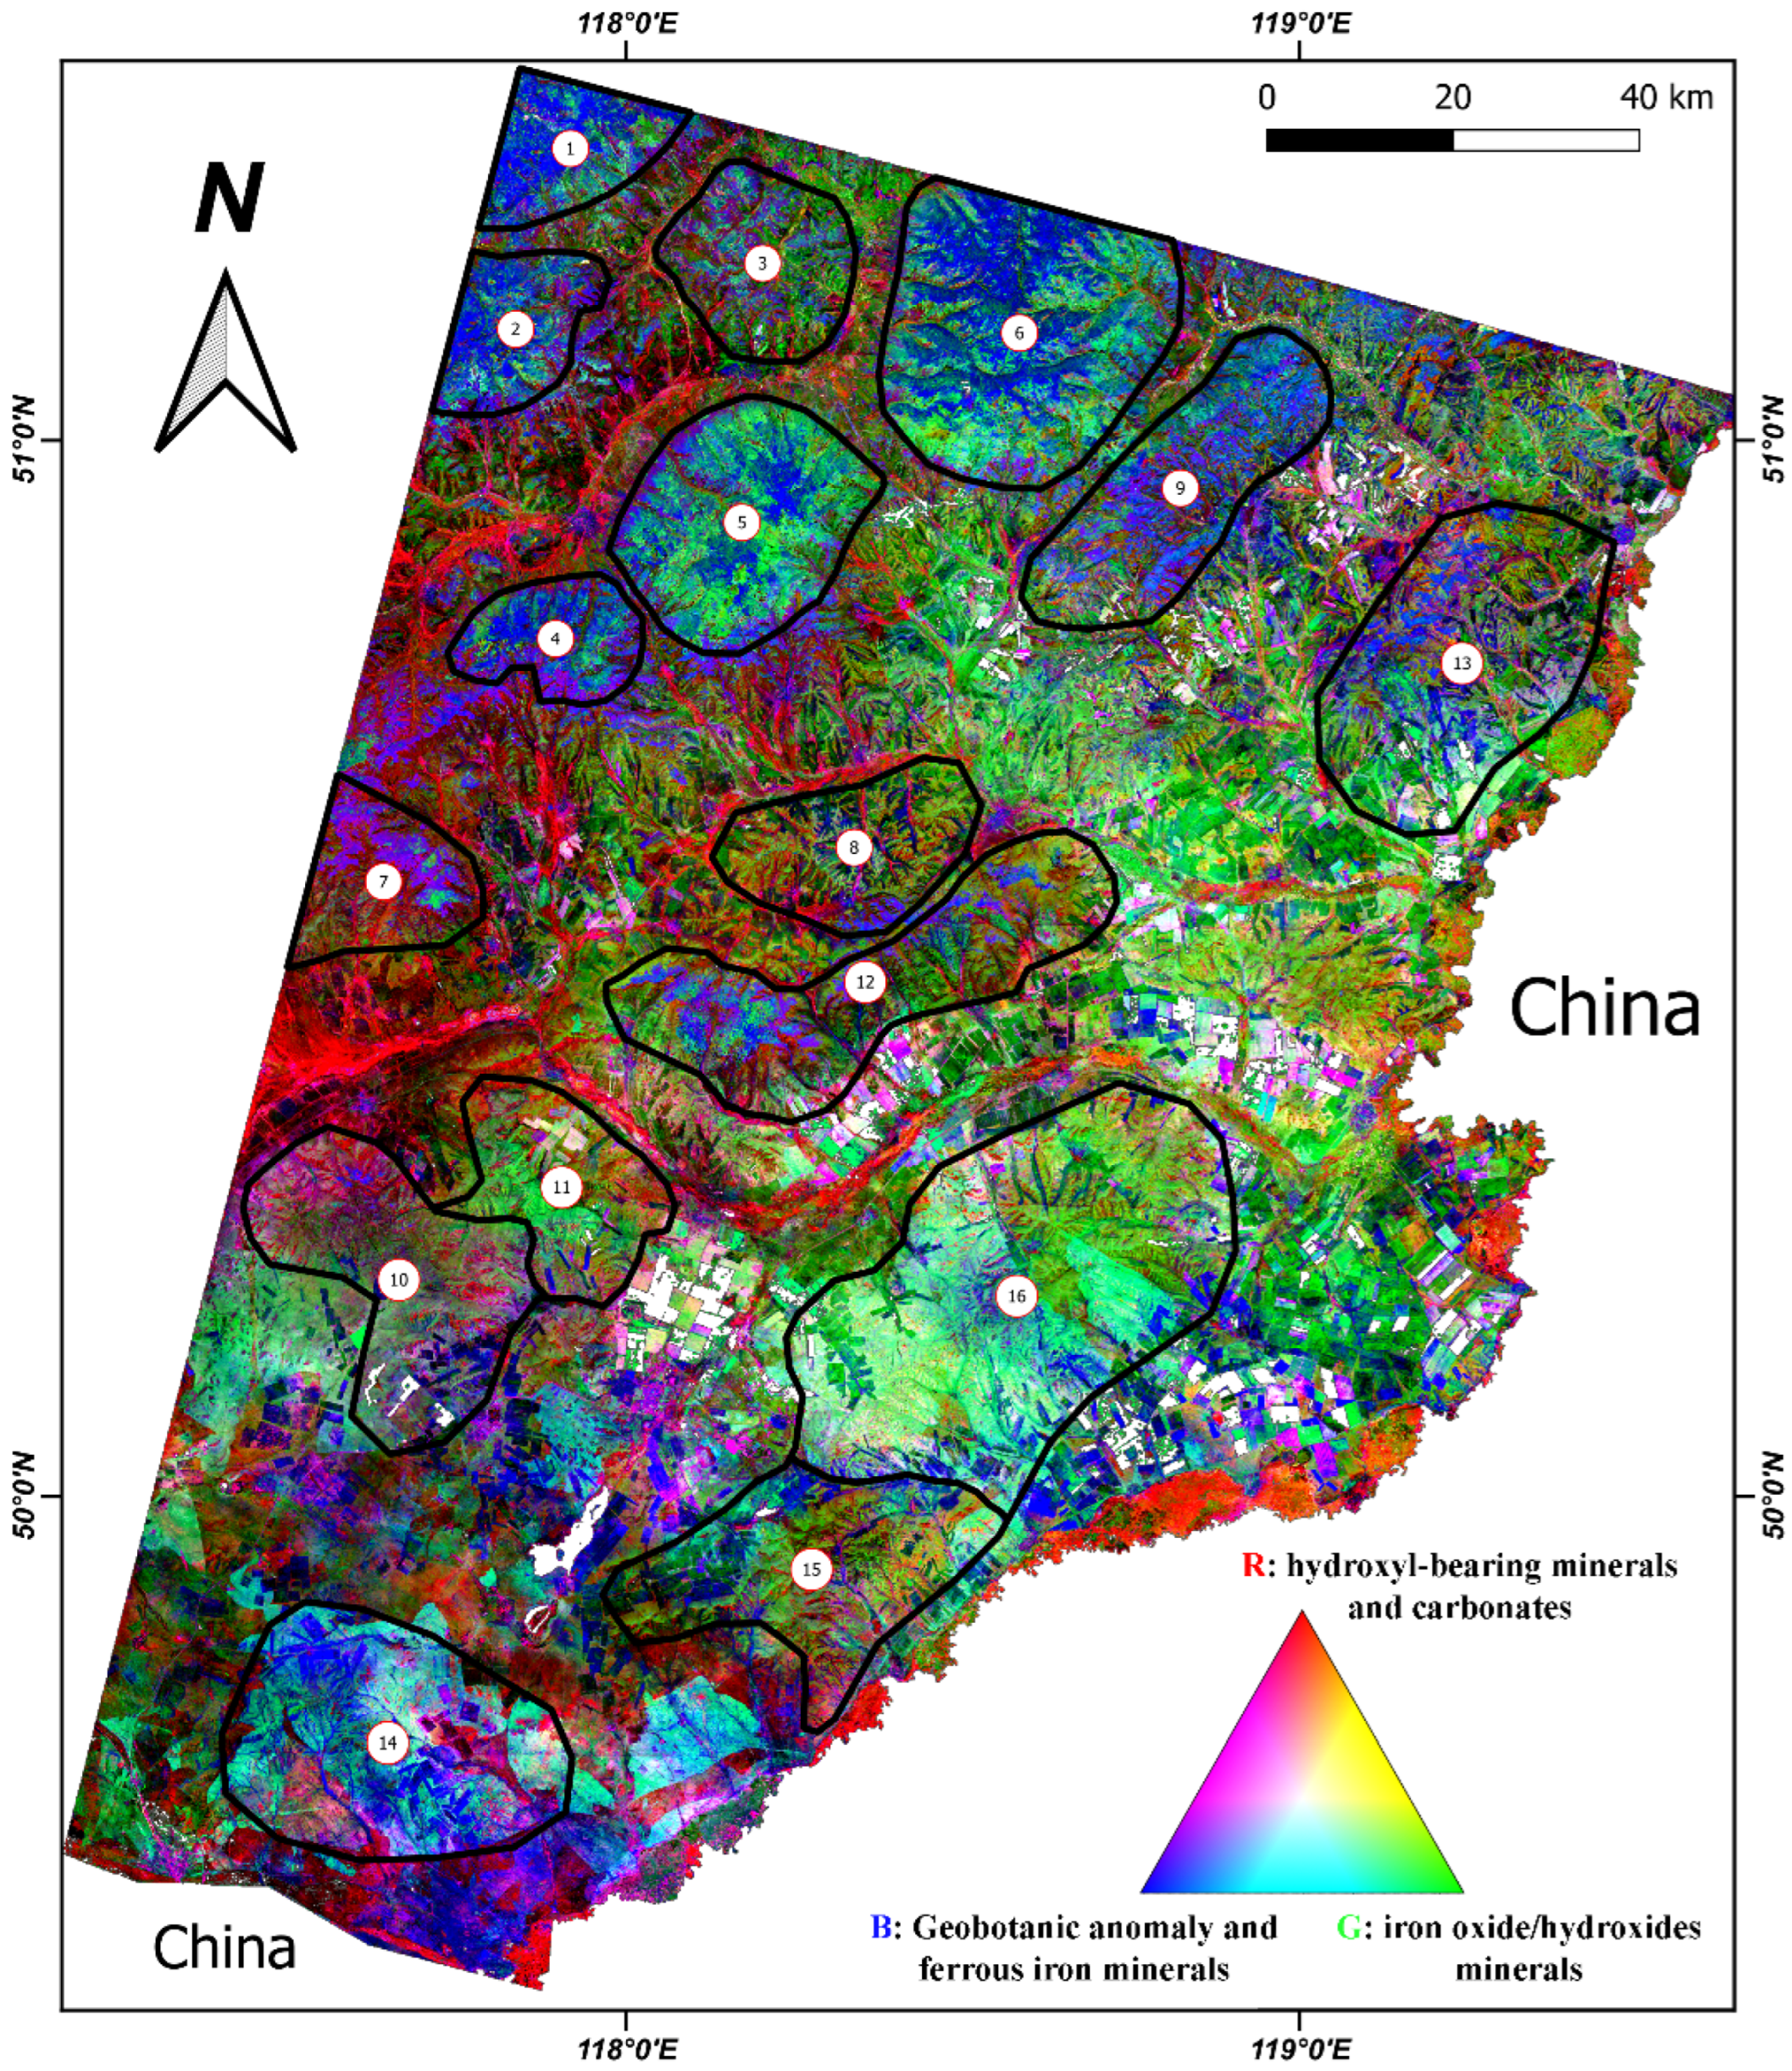
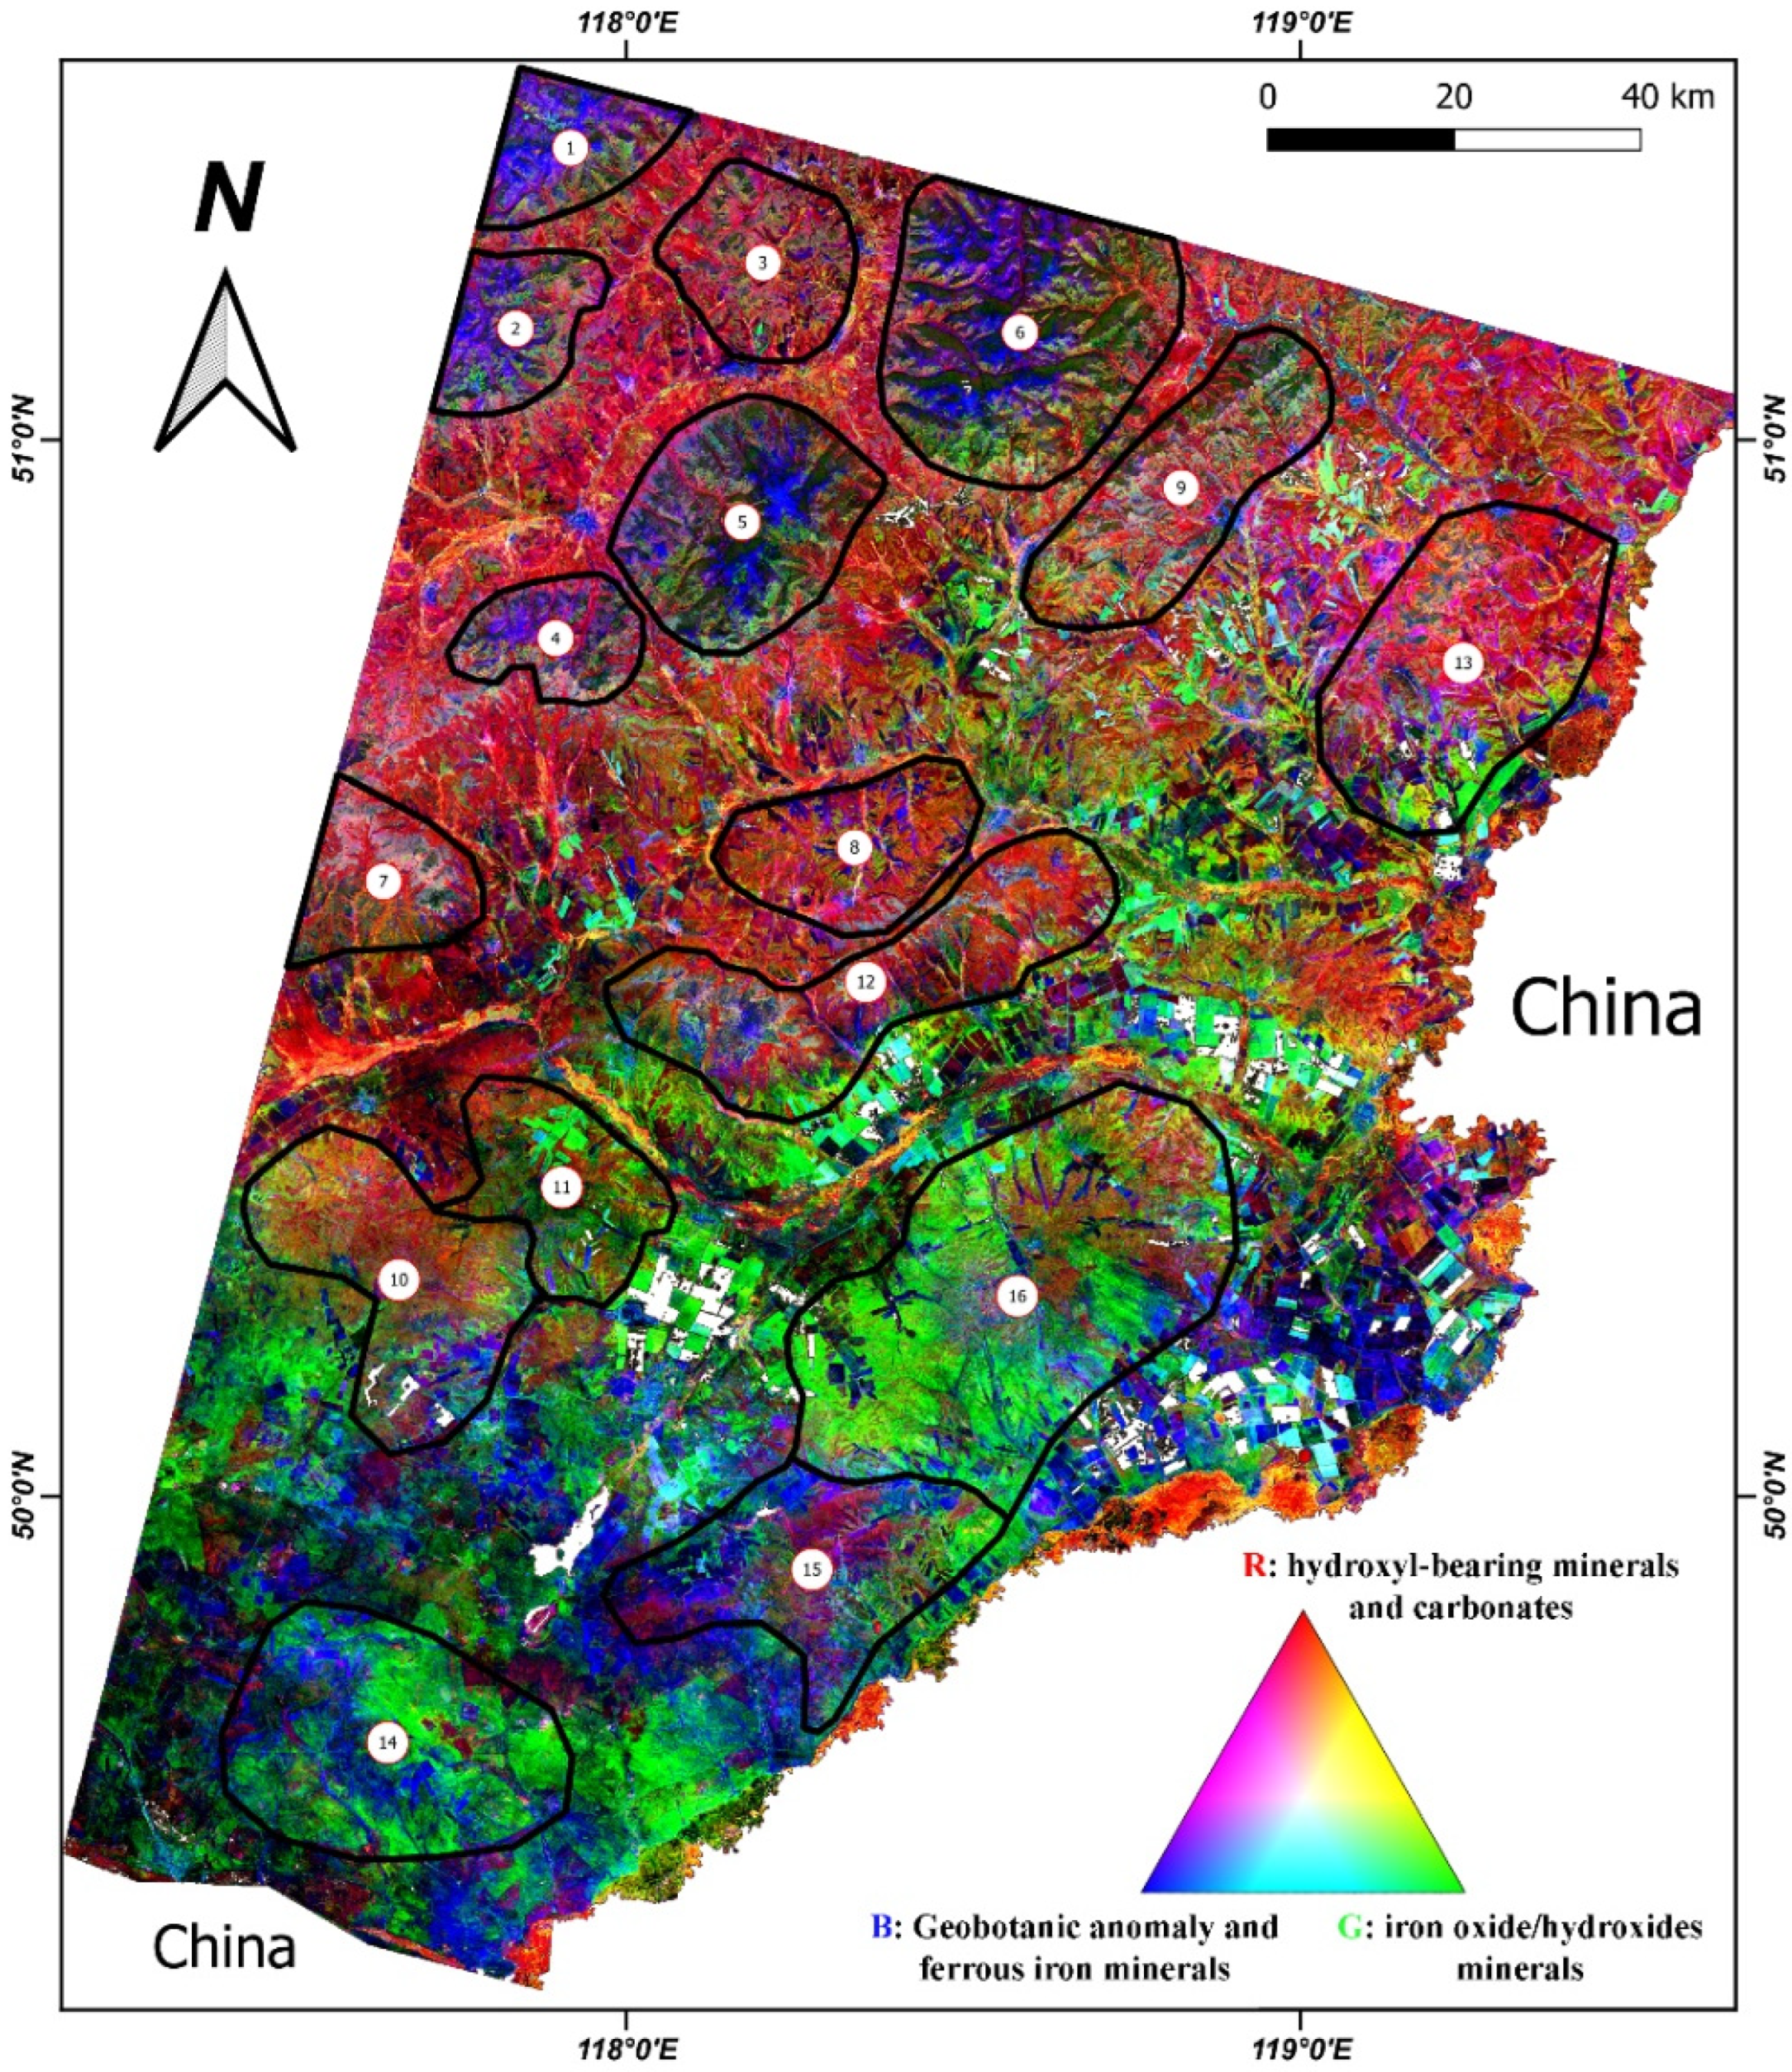
3.4. False Color Composite

Various color combinations of satellite images received in VNIR, SWIR, and TIR spectral ranges are widely used to decrypt the Earth’s surface. However, Landsat data have proved to be successful among the many freely available satellite optical data for geological mapping [44]. FCC is one of the best ways to interpret raster information obtained in different electromagnetic spectrum ranges (both visible and invisible) using an additive RGB model [20]. Color composites of the Landsat data set are mainly used to recognize classes of geological materials such as rocks, vegetation, and water bodies [45,46]. For lithological mapping, the creation of a false color composite (FCC) is based on a combination of collectively less-correlated spectral channels reflecting unique spectral characteristics of absorption and reflection of different rocks and minerals [47]. Received combinations of spectral channels make it possible to distinguish regions with different structures, lithological differences, and minerals, which are characterized by different colors and gradients on the obtained FCC image [45]. The color range of the same combination may differ for each studied area, which in turn is related to the different sedimentation environments and mineral composition of rocks [48]. For the framework of our study, a false RGB composite from 2, 5, and 7 channels of Landsat-8 was selected, which is the most informative for regional mapping of different geological formations within the south-eastern Transbaikalia.

3.5. Principal Component Analysis

PCA is a statistical method that transforms a set of correlated data into a set of uncorrelated linear data called “principal components” (PCs) [21,49]. It can be based on both covariance and correlation matrices [50,51]. PCA is widely used for geological and mineralogical mapping based on the spectral features of materials on the daily surface detected by remote sensing [52]. In general, the data set converted by this method usually saves up to 97% of the information of the original data set [53]. The main purpose of this transformation is to maximize the signal/noise ratio for the increased reliability of day surface objects’ selection.
Uncorrelated linear combinations (eigenvector loads) of the first seven channels of Landsat-8 contain information related to Fe3+, Fe2+ (hematite, jarosite, etc.), Al/Fe-OH (biotite, sericite, and others), Mg-Fe-OH (chlorite, epidote, etc.), CO32− (calcite, dolomite, etc.), and by Si-OH (opal/chalcedon, etc.) groups of minerals. This information can be extracted from near (VNIR), short-wave (SWIR), and thermal (TIR) infrared spectral channels [50,51,52]. As a general rule, PCs with strong loads of eigenvectors in certain spectral channels characterize the reflective and absorbing power of the previously mentioned mineral groups with opposite signs. The positive load in the spectral channel emphasizes the group of minerals as bright pixels while the negative load represents the group of minerals as dark pixels [43,54].
The PCA method was applied to seven channels of Landsat-8 (1–7), using a covariance matrix. Table 1 presents the eigenvector matrix for the selected channels of Landsat-8 (1–7) obtained during PCA transformation.

3.6. Minimum Noise Fraction

Principal component method with pre-normalization of noise or MNF is a well-known multi-spectral and hyperspectral image technology that reduces and separates noise components [22,55]. MNF is a linear transformation and consists of two sequential PCA transformations. The first transformation uses a covariance noise matrix for decorrelation and reseating noise components. Data with unit variance and no cross-channel correlation are considered as noise and separated from the rest of the data. The next step sees the standard PCA transformation applied to the noise-isolated data, the purpose of which is a revision of standard deviations of noise components. Like PC images, MNF images are also ordered in accordance with the maximum variability of data with a difference in that that PCs are ordered in accordance with the variance reduction, but MNFs in accordance with the useful signal level decrease.
Table 2 presents the matrix of eigenvectors of the first seven channels of Landsat-8 (1–7), obtained during MNF transformation.

3.7. Independent Component Analysis

ICA is a statistical method that extracts independent components from a multidimensional signal by decomposing observed random variables into a linear combination of independent random components [23]. This approach is based on two basic assumptions: (1) the distribution of components that emit a signal other than normal, i.e., non-Gaussian, (2) the components are statistically independent from each other. ICA is also a special case of blind source separation (BBS) [23,56]. ICA in its wording is close to PCA, but unlike it, it is aimed at finding a set of independent rather than orthogonal components. It also uses higher-order statistics and can distinguish objects of interest even if they occupy only a small part of the image pixels [57,58].
In order to isolate the most independent pixels associated with hydrothermal minerals and products of hypergenesis, ICA analysis was applied to the results of the PCA transformation, that is, seven images of the main component. The results were analyzed on the basis of statistical coefficients, 2D scatter plots, and visual analysis.

3.8. Fuzzy Logic Modeling

Fuzzy logic modeling is based on fuzzy logic theory proposed in the work of L.A. Zadeh [59]. It is a form of ambiguous logic in which variables can take any real (actual) values in the range from 0 to 1 inclusive [27]. Fuzzy logic modeling has been successfully applied to construct patterns of distribution of prospective areas for ore mineralization within metallogenic provinces [60,61,62]. Fuzzy logic modeling for mapping prospective areas for mineral discovery usually consists of three consecutive steps: (1) fuzzification of the evidential data set; (2) logical integration of the phased actual data with the help of the output network and a suitable fuzzy operator; and (3) defuzzification of the received results to facilitate their interpretation [63]. The result of the first step is a set of values of a fuzzy set, expressed as a continuous series from 0 to 1. It is worth noting that this scale is not a function of probability density [16,64]. The 0 denotes no belonging to a defined fuzzy membership and 1 denotes full ownership. At the interval, the value ratio corresponds to the selected membership function. Such membership assessment is performed for each evidence map that will be further integrated. Fuzzy integration weighs the entire fuzzificated data set based on the distance between the objects and each pixel or spatial position, assigning a certain weight between 0 and 1 [63,65].
Five types of overlay are commonly used to logically integrate the datasets used in mineral prospecting: fuzzy N (AND), fuzzy OR, fuzzy OR, fuzzy product, fuzzy sum and fuzzy Gamma [66,67,68].
Table 3 lists the input layers and fuzzification parameters.

4. Research Results

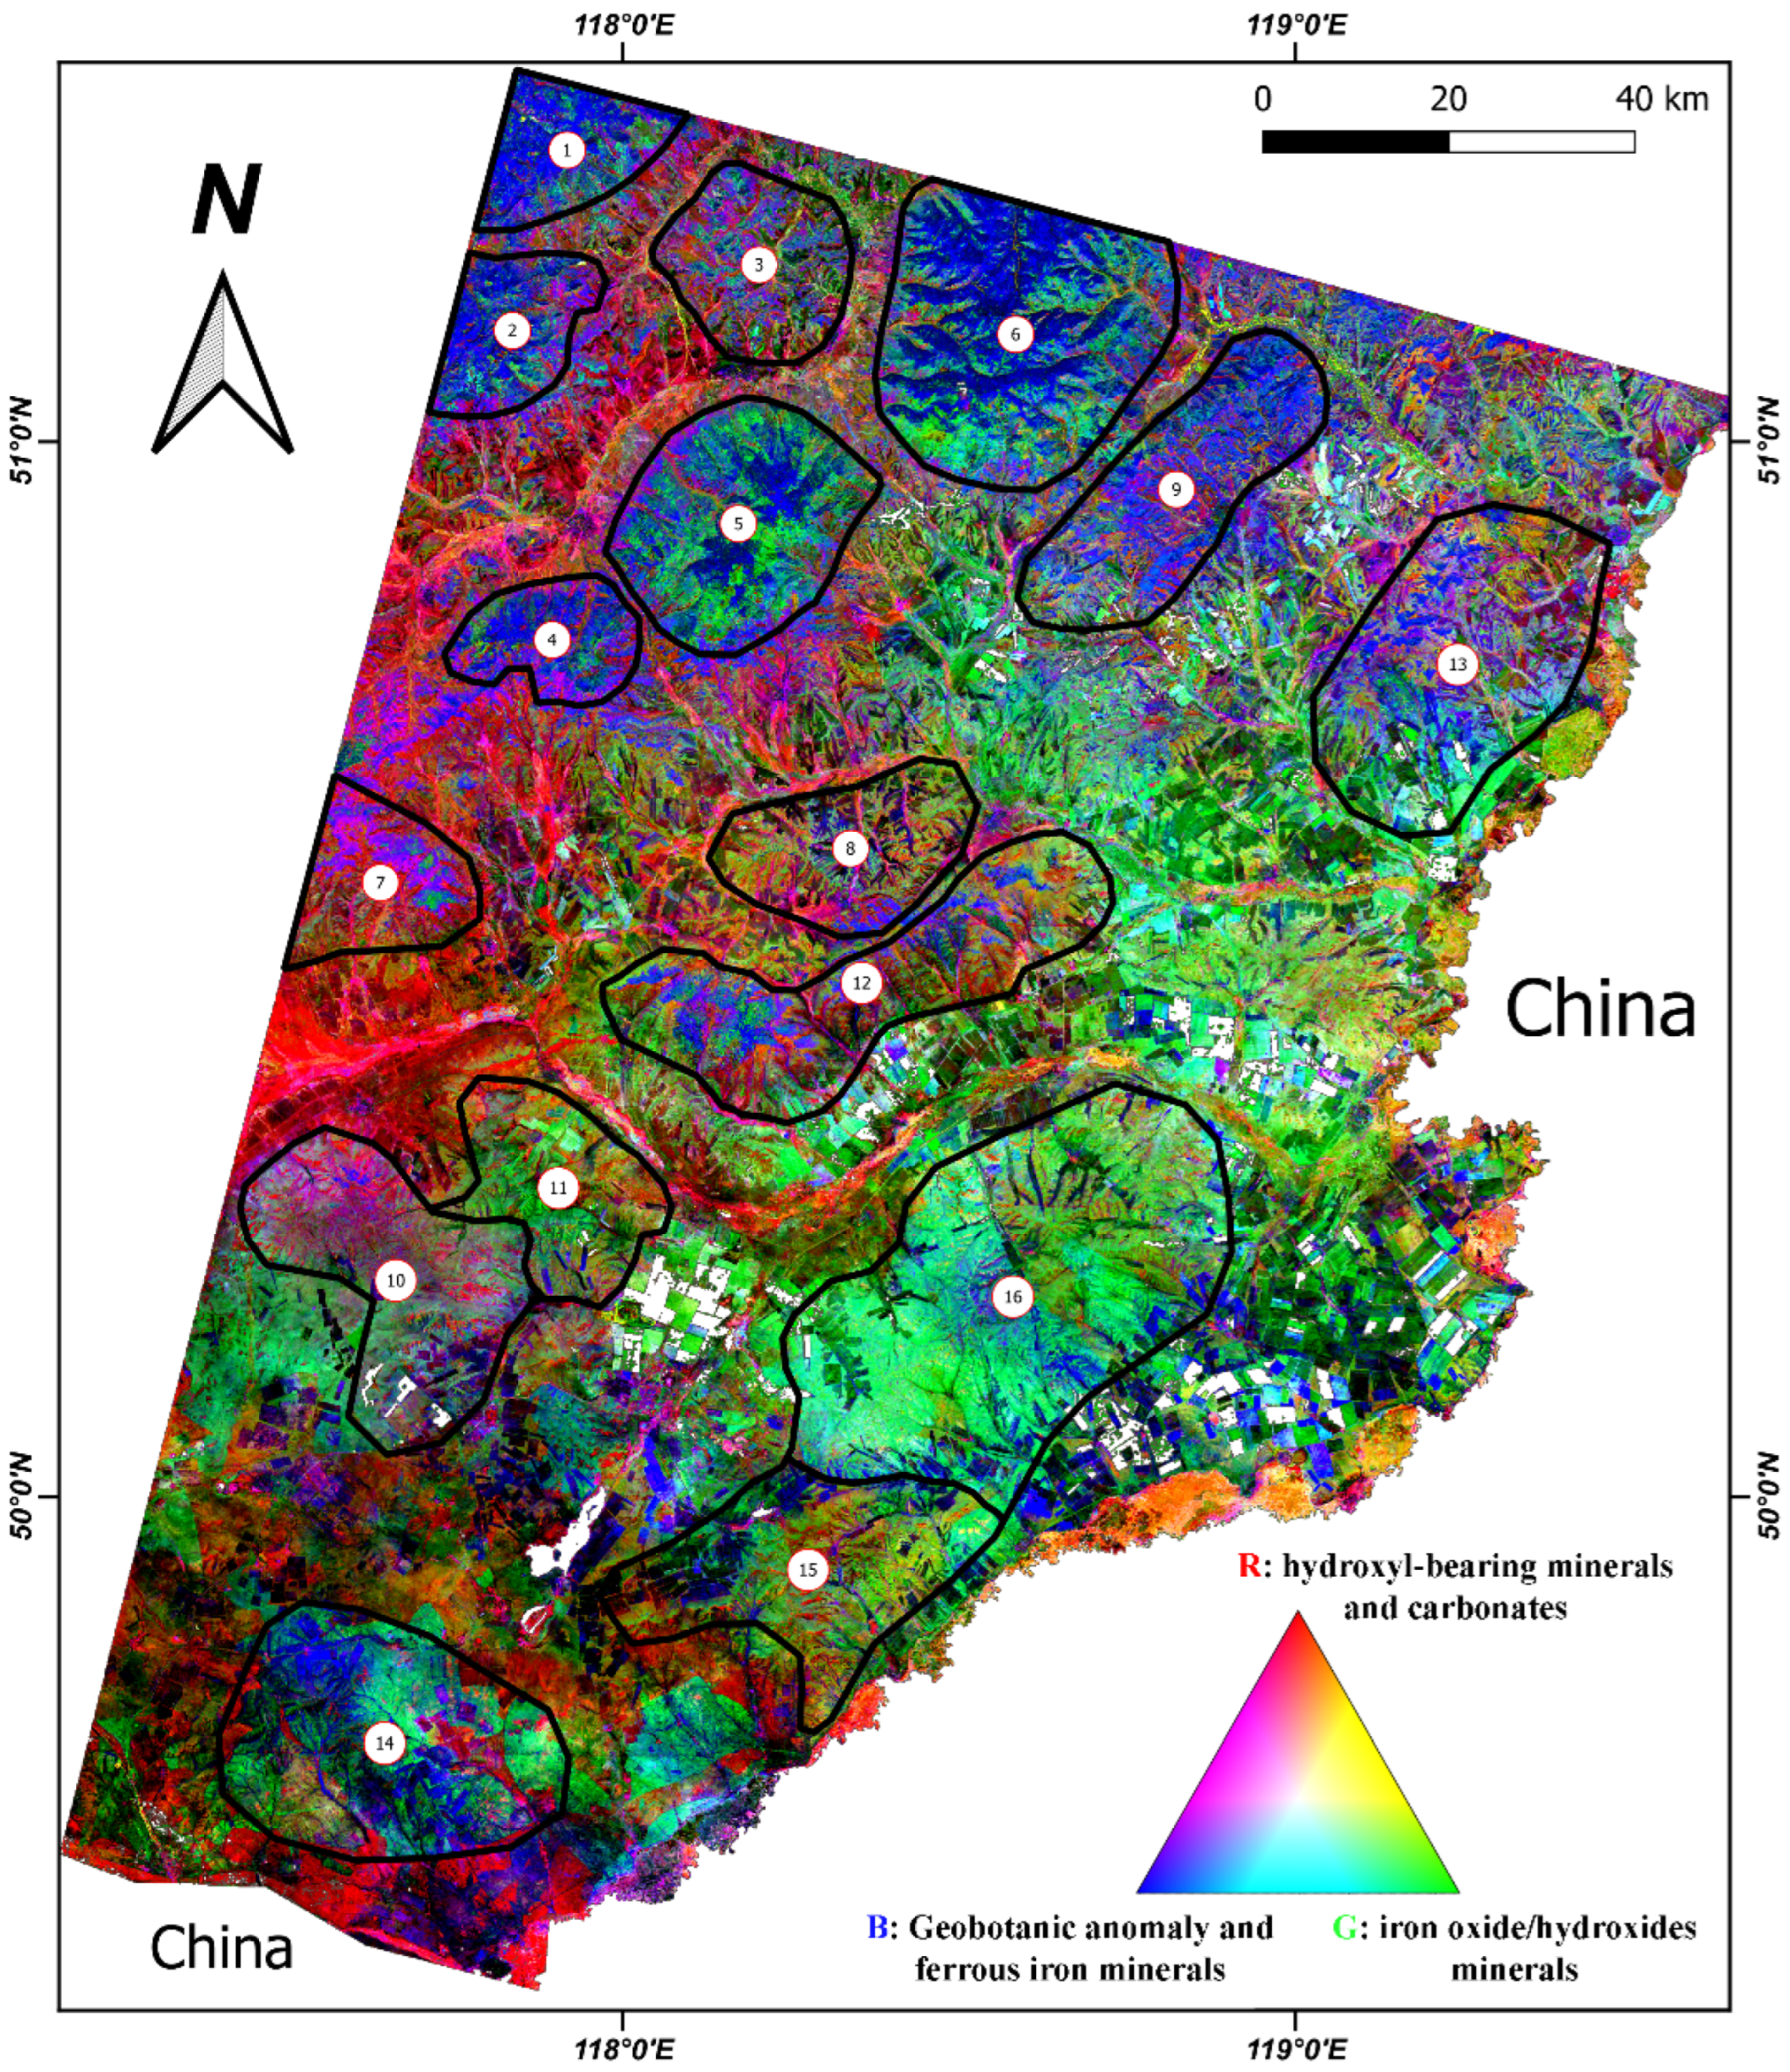
4.1. False Color Composite

The colored RGB composite from 2, 5, and 7 (Figure 4) spectral channels of Landsat-8 displays classes of geological materials with spectral characteristics related to iron oxide/hydroxides (Fe3+ and Fe3+/Fe2+) as well as clay (A1-OH and Fe, Mg-OH) and carbonate minerals (CO32−). This statement is based on the fact that the minerals of the group of iron oxide/hydroxides tend to be heavily absorbed in the range of 0.4–1.1 µm (features of absorption Fe3+ from 0.45 to 0.90 µm, and Fe2+ from 0.90 to 1.2 µm) [25,69], that corresponds to 2, 4, and 5 channels of Landsat-8. Clay (A1-OH and Fe, Mg-OH) and carbonate (CO32−) minerals have spectral absorption features in the range from 2.1 to 2.4 µm, and reflectors in the range of 1.55–1.75 µm [25,26,69], that corresponds to 7 and 6 channels of Landsat-8, respectively. Thus, this color combination clearly highlights the texture characteristics of the magmatic rocks, distinguishing them from the sedimentary rocks [49].
It should also be noted that channel 5 is sensitive to vegetation cover. This makes it possible to distinguish high vegetation areas from hydrothermal altered zones. The absorption features of vegetation cover are in the range of 0.45–0.68 µm, and high reflectivity in the near infrared range from 0.7 to 1.2 µm [21].
Visual analysis of the obtained FCC (Figure 4) image shows that on the basis of certain groups of minerals, the studied territory can be conditionally divided into north-eastern and south-western parts. The south-western part is characterized by a rich spatial distribution of the Fe3+ iron oxide/hydroxides class minerals with a mixture of clay minerals (blue, purple, pale green shades in Figure 4), but the north-eastern part has a uniform spatial distribution of clay minerals class with a mixture of Fe2+ iron oxide/hydroxide minerals. Vegetation cover (dense green) is mainly associated with the most dissected and high mountains relief.
It can be concluded from the geological map that such a division of classes of geological materials on composite RGB images is likely to be associated with different age-diverse sedimentary (alevrolites, sandstones, argillites, conglomerates, tuftes, clays, loams, etc.); magmatic (granites, granodiorites, granosynites, etc.) and metamorphic (gneisses plagiarism, gneisse-granites, amphibolites, crystalline shales, milonites, etc.) rocks, as well as processes of the extension of the territory mainly in its south-western part. Magmatic and metamorphic rocks on the RGB composite (Figure 4) are expressed in identical color characteristics, indicating similarities in their chemical composition and are considered as a unified class of geological material in the current study. Based on the identified classes of geological materials, structural and geomorphological assumptions, geological and landscape conditions, availability of agricultural land, color and gradient ranges that emphasize geological boundaries, on the basis of pseudo-colored RGB composite (FCC image) 16 geological and morphological structures were highlighted (Figure 4) connected according to the geological map [32] mainly with granite–granodiorite and granite–gneiss complexes.
The geomorphological position, composition, and associated quaternary sediments and secondary alteration zones are summarized in Table 4.
No more detailed geological mapping of the Landsat-8 data on the studied area is possible, as there are no unique spectral signatures of the chemical composition of various rocks, possibly due to the overlap of their eluvial, deluvial, solutional, and colluvial formations with thickness of 1–8 m or spectral sampling of Landsat-8 data and their resolution.

4.2. Principal Component Method

The analysis of statistical data obtained during the PCA transformation over VNIR and SWIR spectral channels (Table 1) shows that PCs can be considered as significant indicators: (1) of vegetation cover; (2) ferrous iron minerals group (Fe2+); (3) iron oxide/hydroxides mineral groups (Fe3+ and Fe3+/Fe2+); (4) clay (Al-OH and Fe, Mg-OH) and carbonate (CO32−) minerals. Table 3 presents the eigenvectors loadings for each PC. By analyzing the load value and sign of the eigenvectors in the PCs, one can determine that PC1 contains a negative load in all bands. This indicates that none of the channels contributed uniquely to the formation of PC1; therefore, it cannot be identified.
PC2 shows a moderate and low positive load in almost all bands except 6 with a very low negative load (−0.0443). Based on this information, one can conclude that a group of hydroxyl-bearing (Al-OH and Fe, Mg-OH) and carbonate (CO32−) minerals are presented in the PC2 image by dark pixels because of the negative load in band 6. For visualization convenience, dark pixels were inverted into bright ones by multiplying the matrix values by −1.
PC3 contains a strong positive loading in 5 band (0.80112) and a moderate negative loading in 7 band(−0.5313), while the contribution of the remaining bands in the PC3 forming is weak and moderate. Therefore, PC3 displays useful information related to the vegetation cover and the group of minerals as bright pixels PC4 that has a moderate loading of 6 (−0.5585) and is strong in 7 (0.6814) bands with opposite signs. Given that the load in band 6 is relatively moderate and the negative contribution of the other bands is low, dark pixels PC4 can be considered as more reliable indicators of a group of hydroxyl-bearing (Al-OH and Fe, Mg-OH) and carbonate (CO32−) minerals than pixels PC2. Dark pixels in PC4 were converted into light by multiplying them by −1.
The eigenvectors PC5 have a strong negative loading in band 4 (−0.6658) and a moderate positive loading in band 1 (0.5881). At the same time, the loading of other bands is weakly manifested. Therefore, the group of minerals bearing iron oxide/hydroxides is defined in PC5 mainly by dark pixels. To convert dark pixels to light, their values were multiplied by −1.
Values and loadings signs of eigenvectors for PC6 and PC7 (see Table 1) do not indicate unique contributions of bands in Landsat-8 to their formation, which were expected to reflect hydrothermally altered rocks and hypergenesis products.
Based on the loading matrix analysis of eigenvectors, the PC4, PC5, and PC3 components were selected to generate the RGB composite (Figure 5). PC4 (a group of hydroxyl-bearing (Al-OH and Fe, Mg-OH) and carbonate (CO32−) minerals) were placed in the R-channel, PC5 in the G-channel (a group of minerals bearing iron oxide/hydroxides), and PC3 (vegetation cover and a group of minerals bearing bivalent iron ions) were placed in the B-channel.

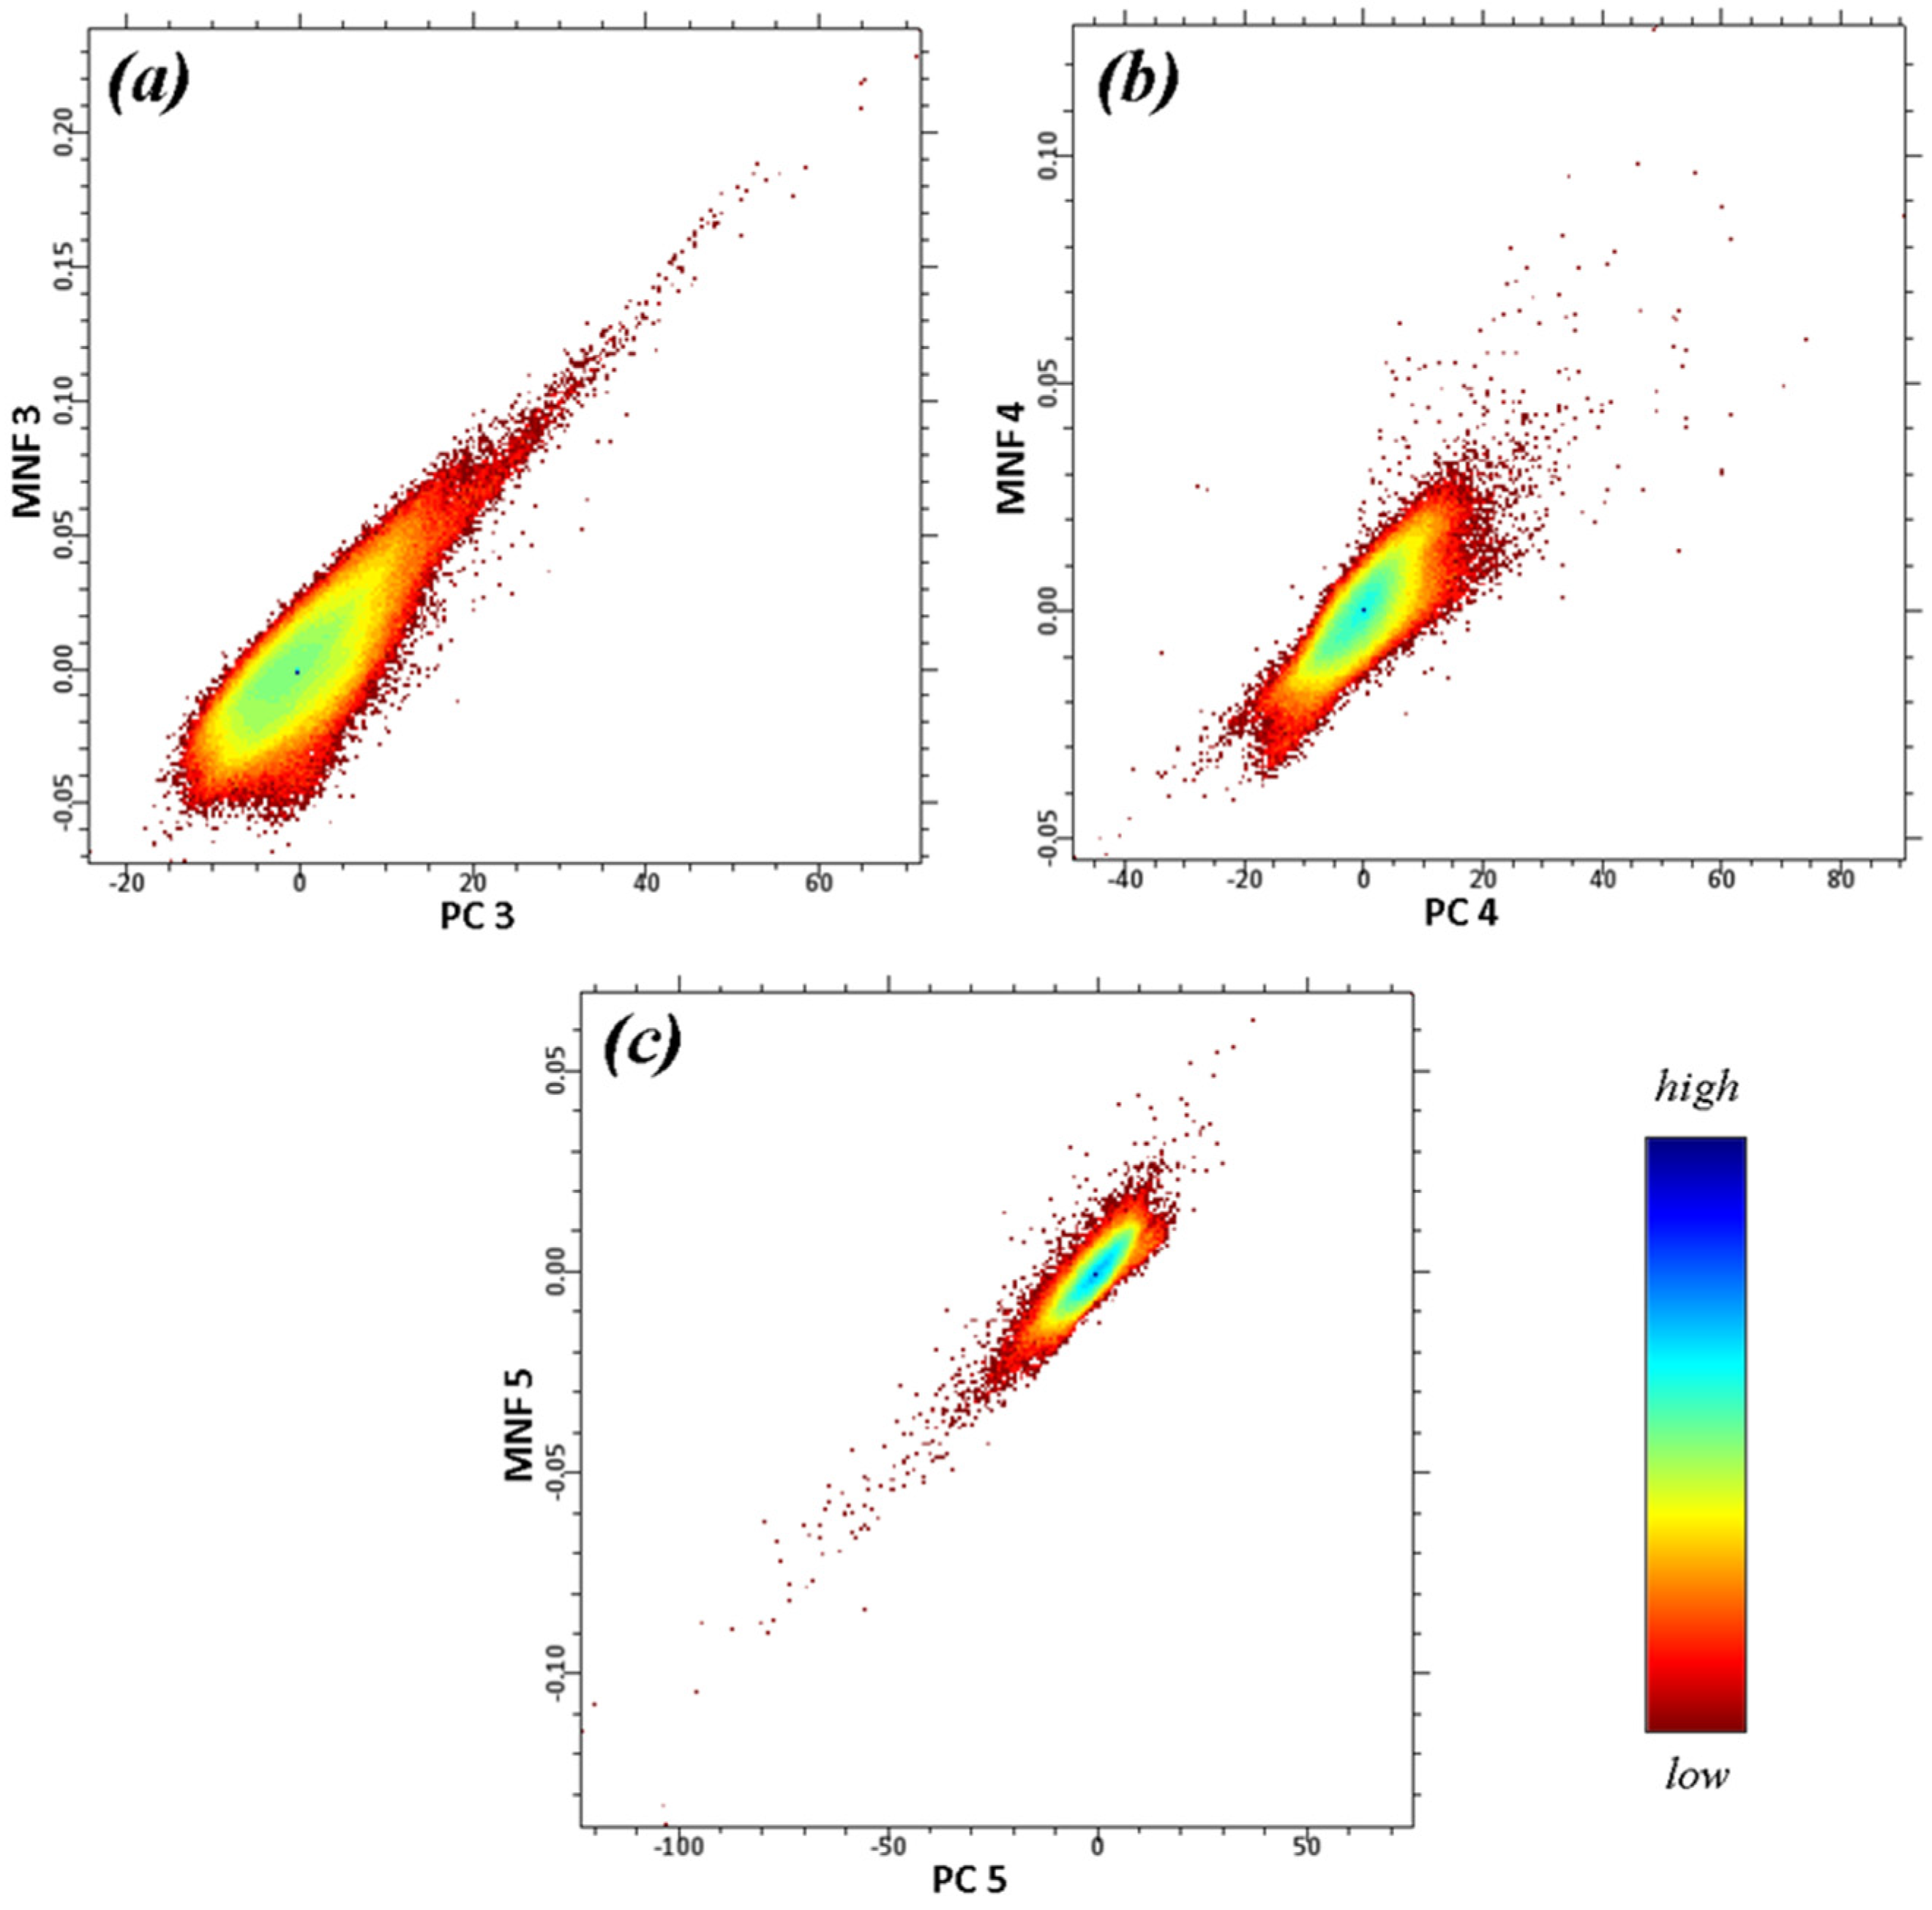
4.3. Minimum Noise Fraction

Similar to PCA transformation, the first seven channels of Landsat-8 served as the basis for MNF. Therefore, the results can also be considered as the vegetation distribution maps and mineral groups with iron ion bivalent (Fe2+), iron oxide/hydroxides minerals group (Fe3+ and Fe3+/Fe2+), and clay (Al-OH and Fe, Mg-OH) and carbonate (CO32−) minerals group, i.e., products of hypergenesis and hydrothermally altered minerals. Values of the eigenvector matrices comparison of MNF (Table 2) and PCA (Table 1) of transformations show that they have a similar pattern of distributions with minor deviations in the hundredths. The 2D scattering plots were constructed to quantify the relationship between the main and the noise components (Figure 6).
In the plot, PC3 and MNF3 (Figure 6a) show a positive linear dependence, converging at high values. That is why both spectral channels of the component describe the same class of natural materials, that is, a vegetation cover together with a group of ferrous minerals. The best way this class emphasizes the PC3 component is that in its formation band 5 Landsat-8 has put the most load (0.8011) compared to in formation MNF3 (0.63). Further, this information will be needed to isolate areas with intensive vegetation from hydrothermally altered rocks and hypergenesis products on the studied territory. The components of PC4 and MNF4 (Figure 6b) also have a positive linear correlation, but with increase in dispersion at high values [10], and both describe a group of hydroxyl-bearing (Al-OH and Fe, Mg-OH) and carbonate (CO32−) minerals. The graph (c) on picture 5 shows a very strong positive correlation between PC5 and MNF5, which justifies the close spatial distribution of the iron oxide/hydroxide (Fe3+ and Fe3+/Fe2+) minerals group.
Therefore, the conclusions made during the eigenvector matrix analysis of PCA transformation are also relevant when analyzing the eigenvector matrix MNF. This similarity is due to the fact that the MNF transformation is based on two successive PCA transformations and should describe spectral types and their spatial distribution more reliably than PCA.
Having determined that 3, 4, and 5 noise components are of key importance in determining the major groups of hydrothermally altered rock and hypergenesis products, the composite RGB was combined from them (Figure 7). On the resulting image the areas with high clay and carbonate minerals are represented by red, pink, and purple colors associated, mainly, to structural disturbances and drainage systems as well as to apical parts of ridges and deluvial slopes [16]. Mineral abundance iron oxide/hydroxide groups are mainly associated with alphahumus (Fe + Al + humus) soils, which are the main natural element of the landscape in the studied area. They are expressed in the image in turquoise, green, dark and bright green shades. Along with it blue, dark-blue, and purple pixels determine the presence of vegetation (of varying degrees of suppression) associated mainly with the northern slopes and apical parts of the ridges as well as with agricultural land.

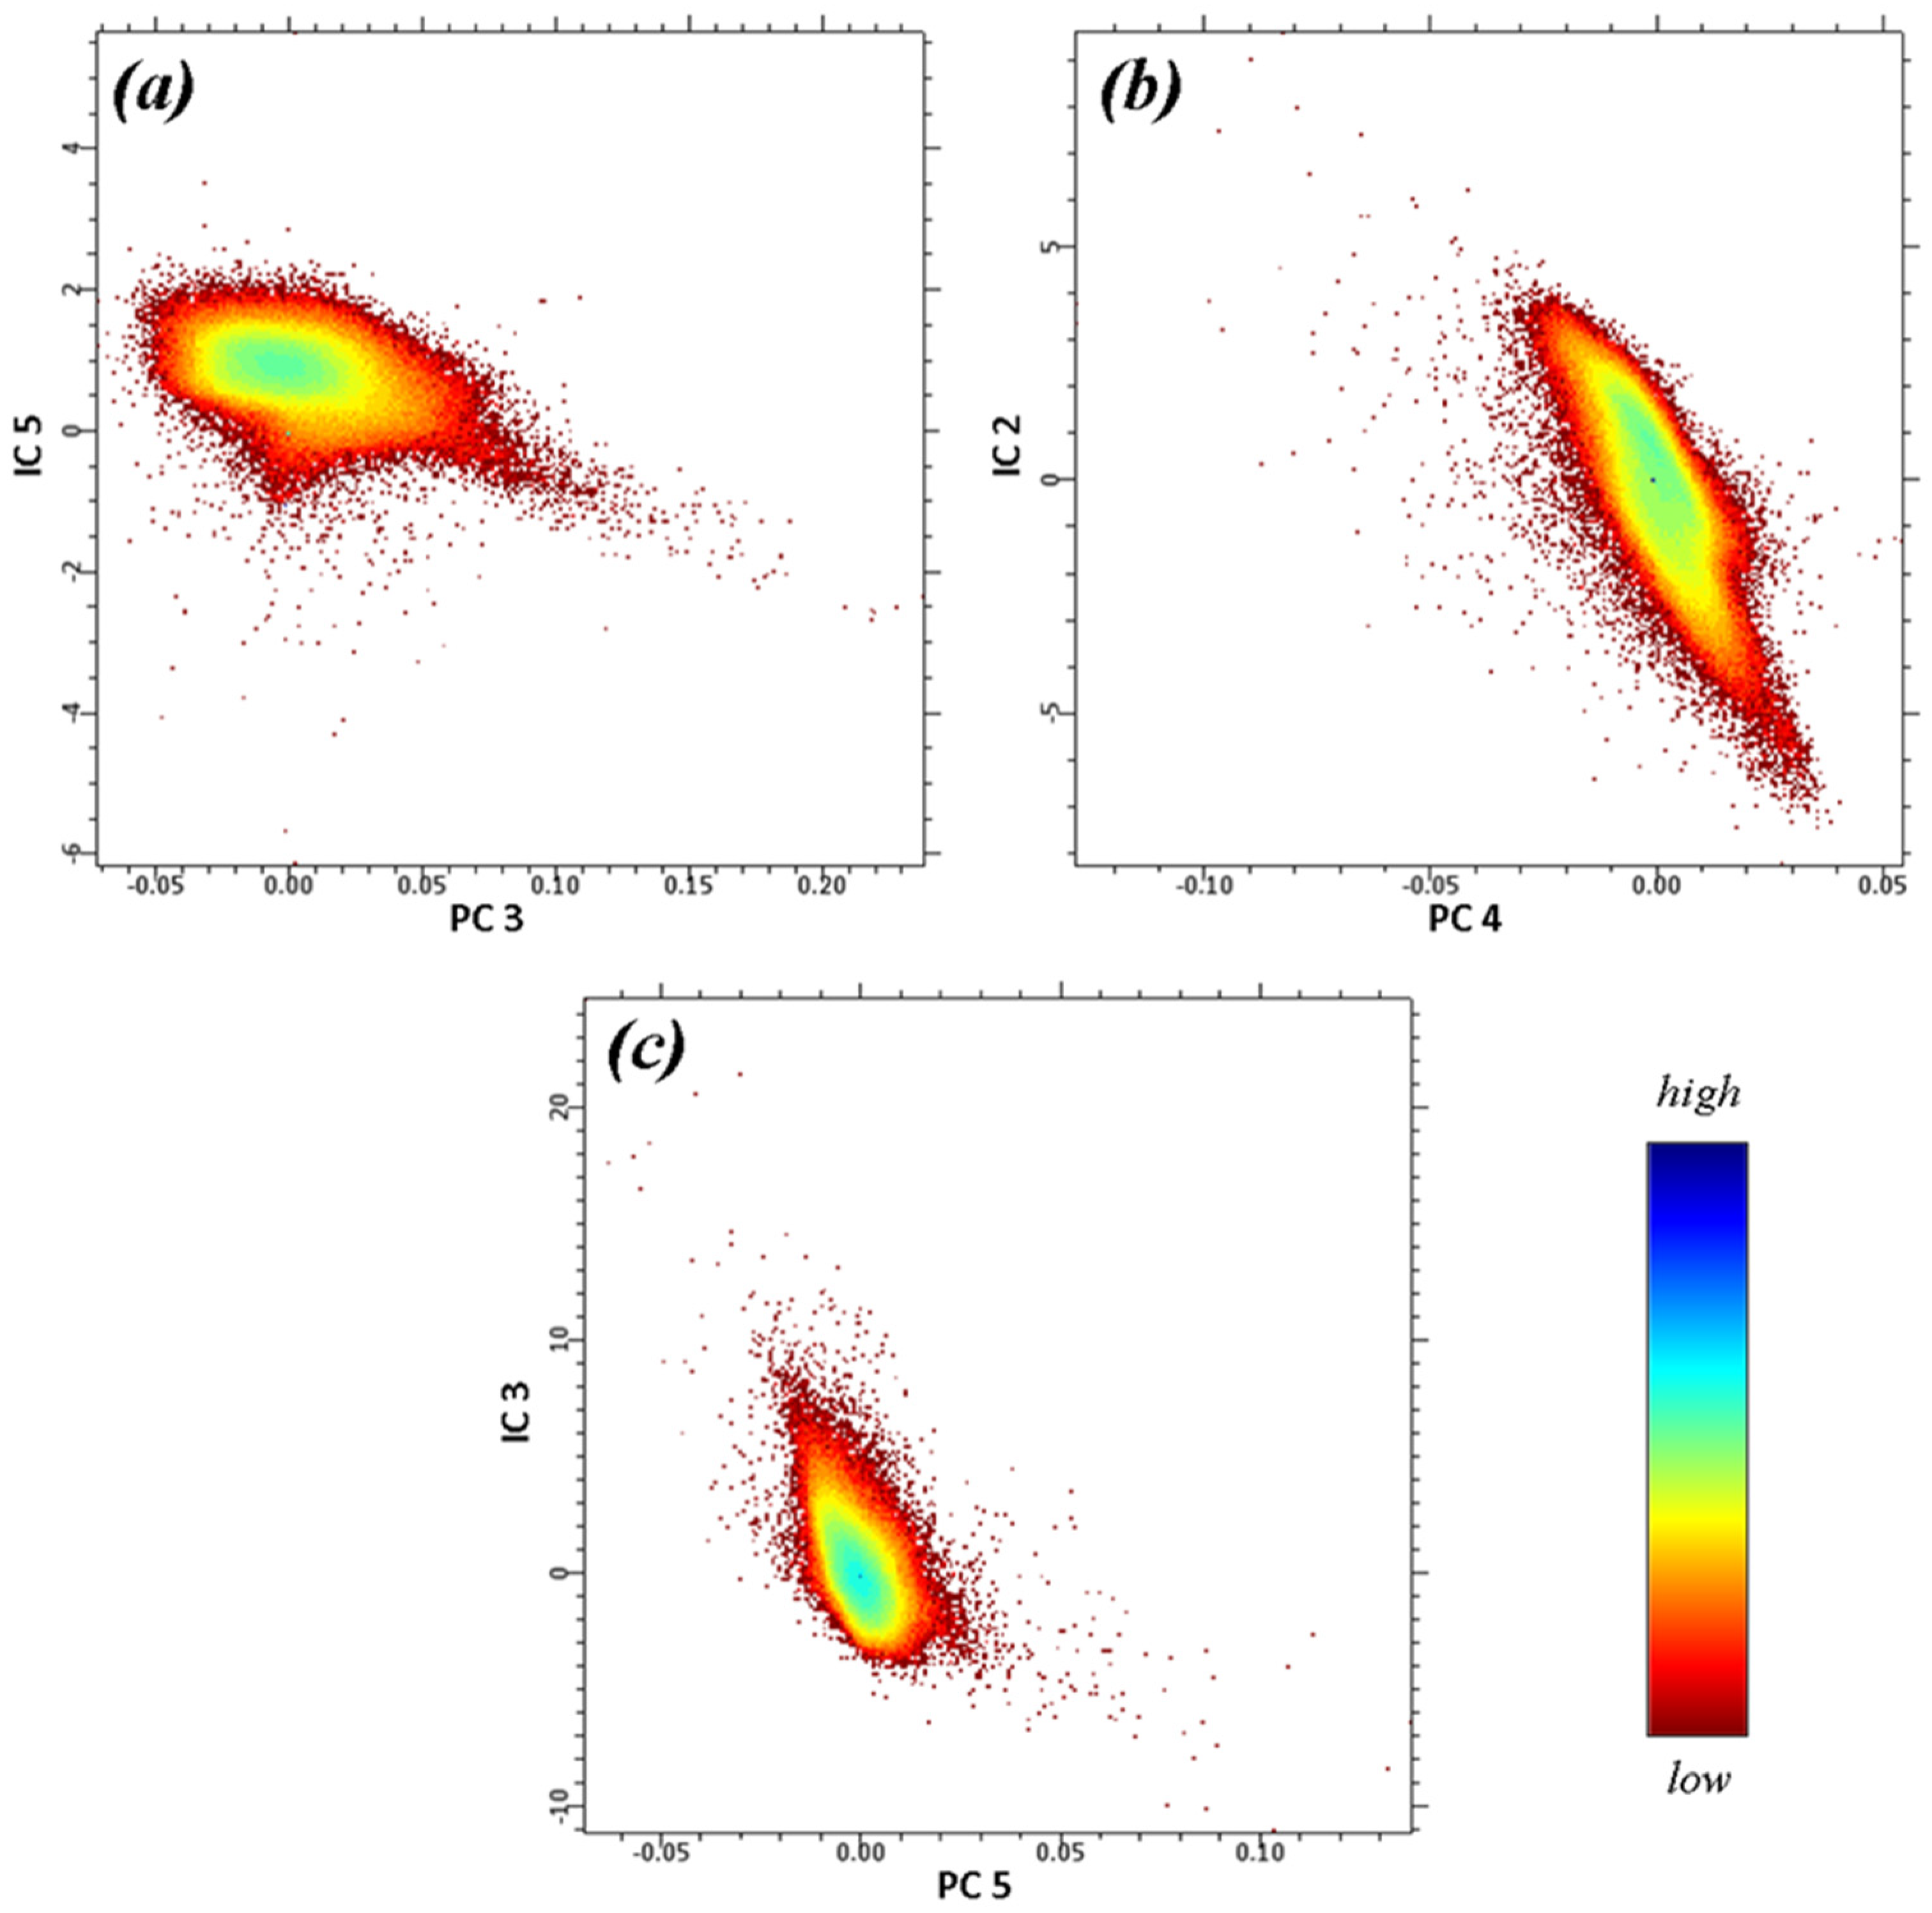
4.4. Independent Component Analysis

The results of the visual analysis IC and PC images show that some IC images a have similar spatial distribution of pixel values to pixels of PC images. Consequently, it is possible to determine the type of relationship between them and attempt to identify images associated with previously defined spectral classes of geological materials by constructing two-dimensional scattering plots.
During the scatter plot analysis (Figure 8) it was determined that the image IC5 isolates data related to vegetation cover and ferrous-iron-bearing minerals (Figure 8a), the image IC2 isolates a group of clay (Al-OH and Fe, Mg-OH) and carbonate (CO32−) minerals (Figure 8b), and the image IC3 isolates the minerals of the iron oxide/hydroxide minerals group (Figure 8c).
This conclusion is based on the fact that all established plots clearly show the reverse linear dependence, which allows to determine the input data ownership to the same spectral class of geological material. Additionally, analysis of the covariance and correlation matrix for selected components confirms their maximum independence with each other, since their diagonal elements are equivalent, and their values are almost zero (Table 5 and Table 6) [10].
For example, IC2 loading for PC3 (−4.89 × 10⁻¹⁴) is equivalent to IC3 loading for PC2 (−4.89 × 10⁻¹⁴), and their values are almost zero. The same equivalent and quantitative dependence is characteristic for IC2 with a loading in PC5 (1.04 × 10⁻¹⁰), IC5 with a loading in PC2 (1.04 × 10⁻¹⁰), IC5 with a loading in PC3 (−5.42 × 10⁻¹¹), and IC3 with a loading in PC5 (−5.42 × 10⁻¹¹).
Consequently, for the display of isolated pixels (improve characteristics) of certain geological materials a rap composite from IC2, IC3, and IC5 (Figure 9) was built. The values of IC5 components were inverted before the construction of the composite, as the relationship of IC5 to PC3 has an inverse linear dependence (Figure 8a), and the loading sign of eigenvectors for PC3 in band 5 of Landsat-8 is positive.
With a stricter separation of mineral groups and their localization among vegetation cover compared to the results of PCA and MNF transformations, one can see a synthesized composite (Figure 9). The vegetation cover depending on its density in addition to a dark-blue shade acquired a pale turquoise and pale grey shade. Geomorphological structures also became more pronounced, mainly river systems combined with alluvial and deluvial deposits composed primarily of hydroxyl-bearing minerals (red and pink shades).
Areas affected mainly by oxidative processes (green and light green shades) were also spatially distributed and became more densely localized. Yellow and orange shades also found in PCA and MNF results are thought to be associated with hydrothermally altered rocks or hypergenesis products.

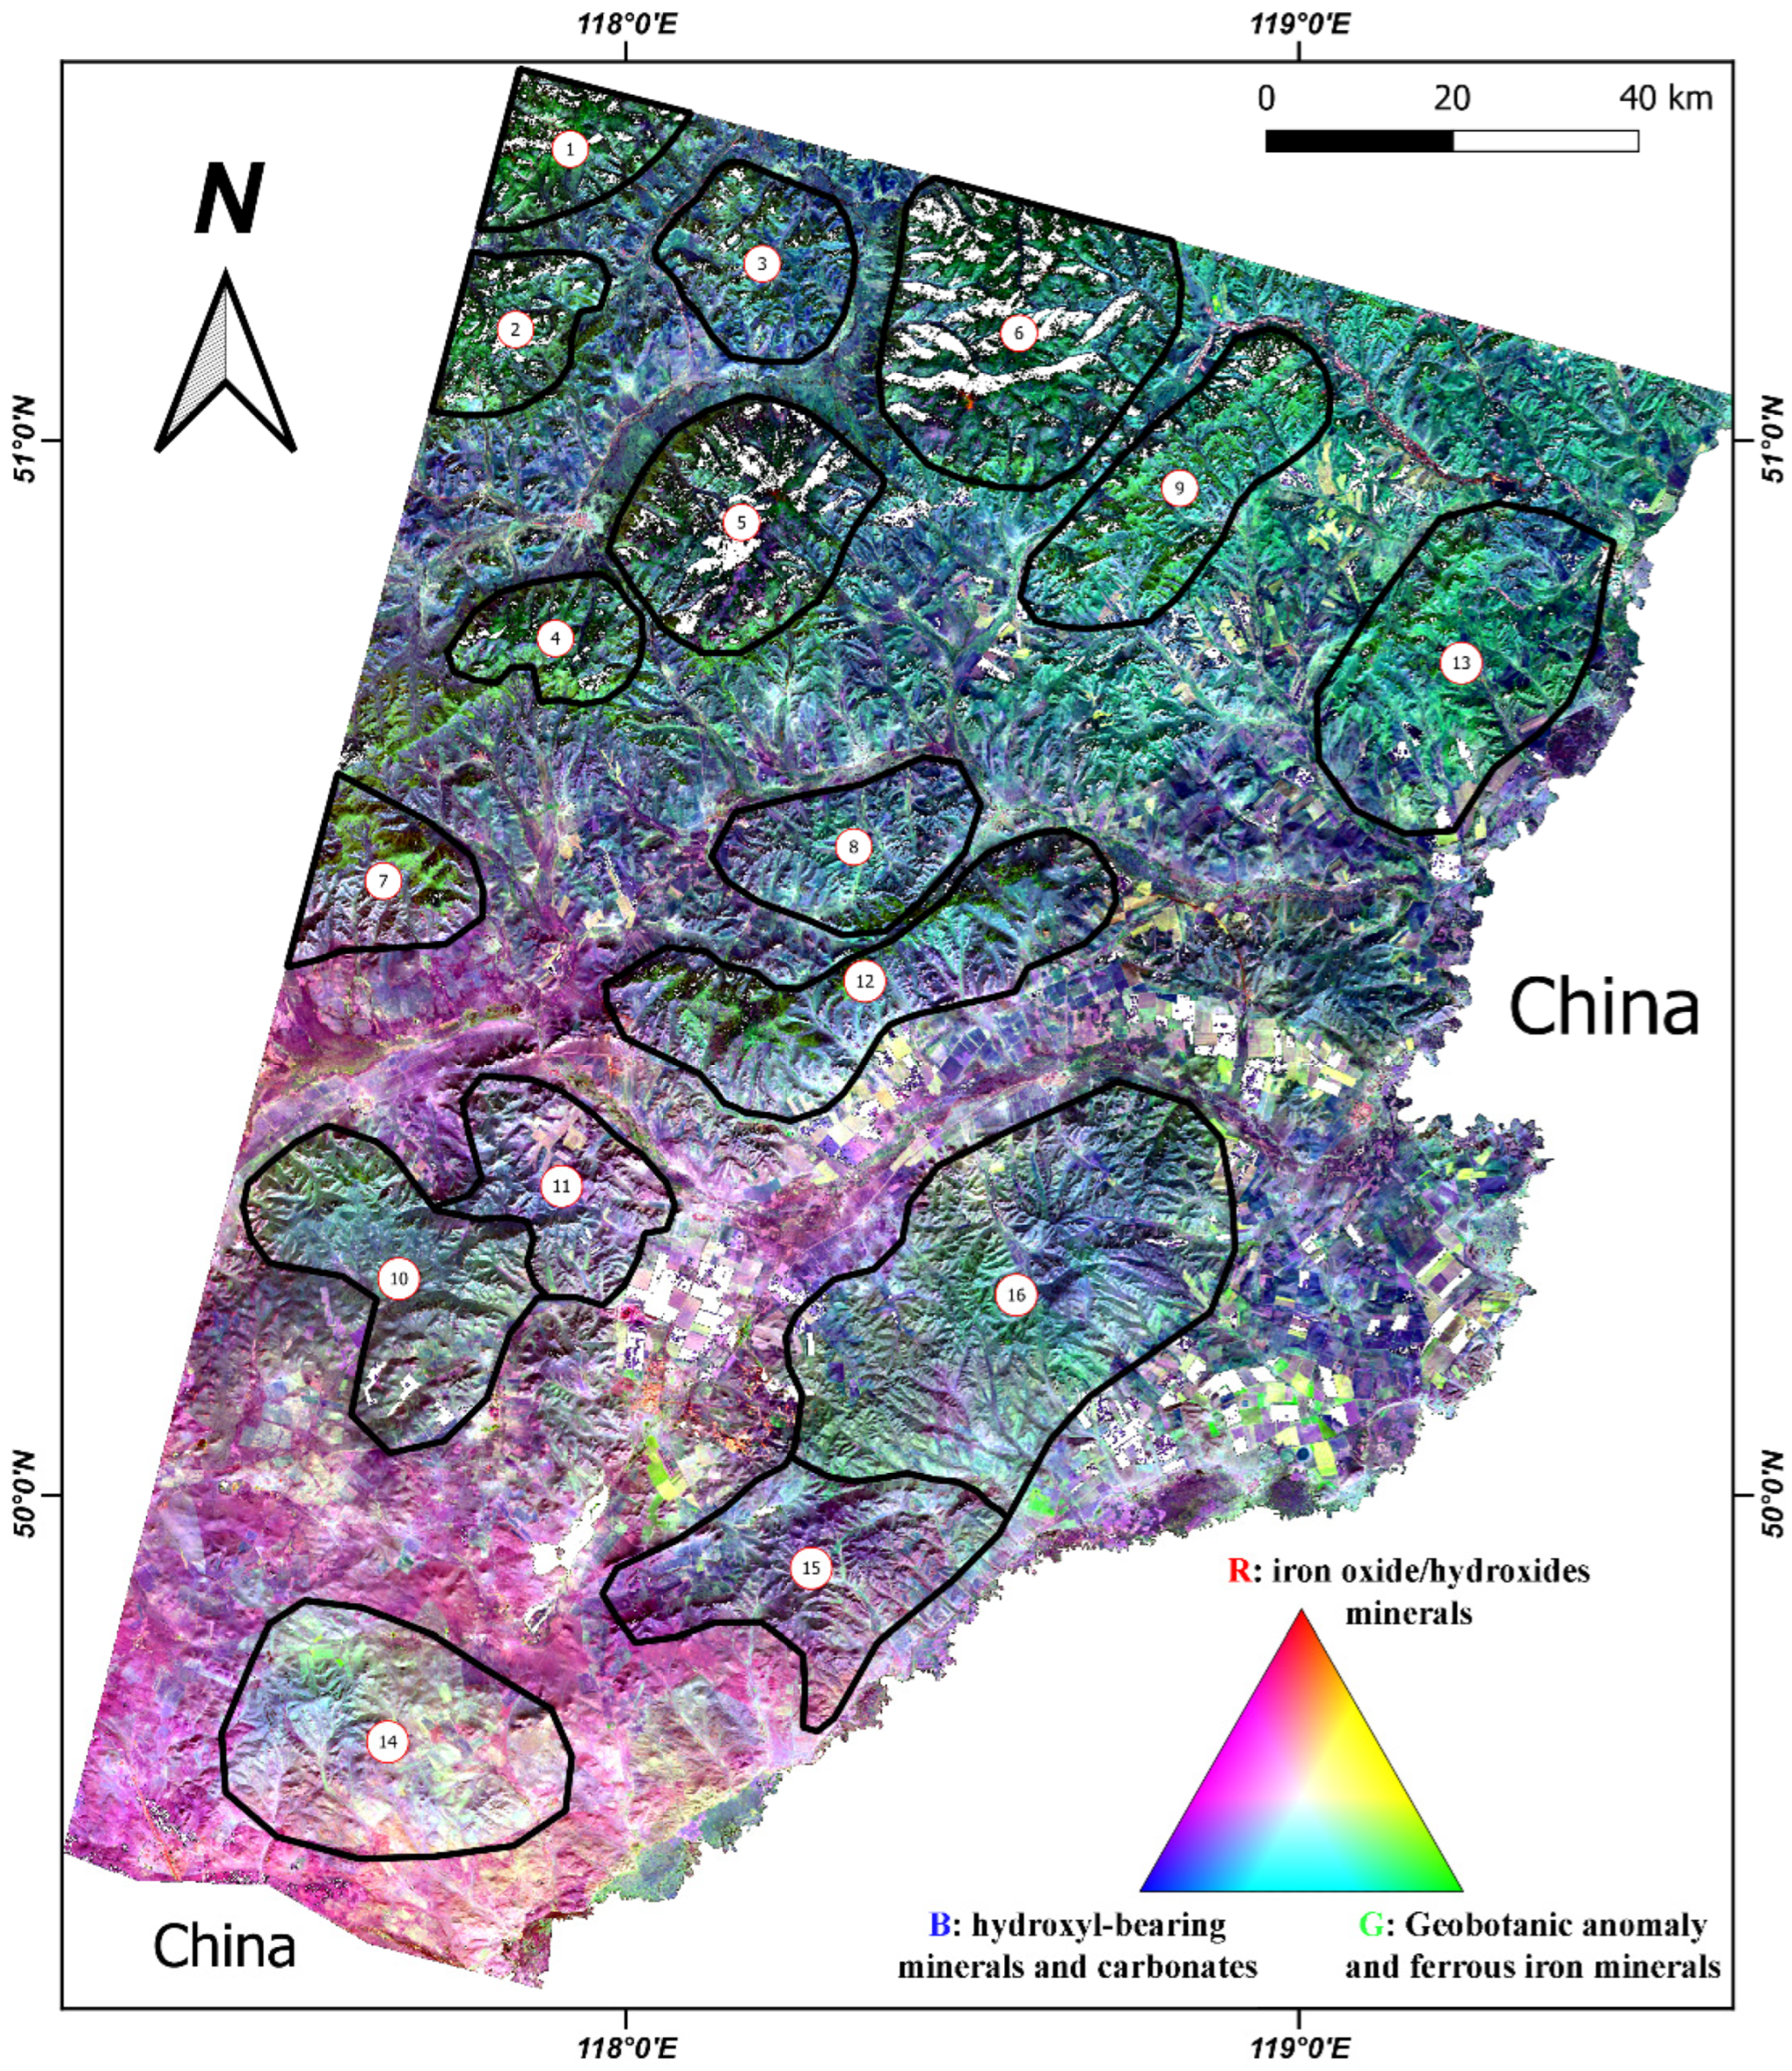
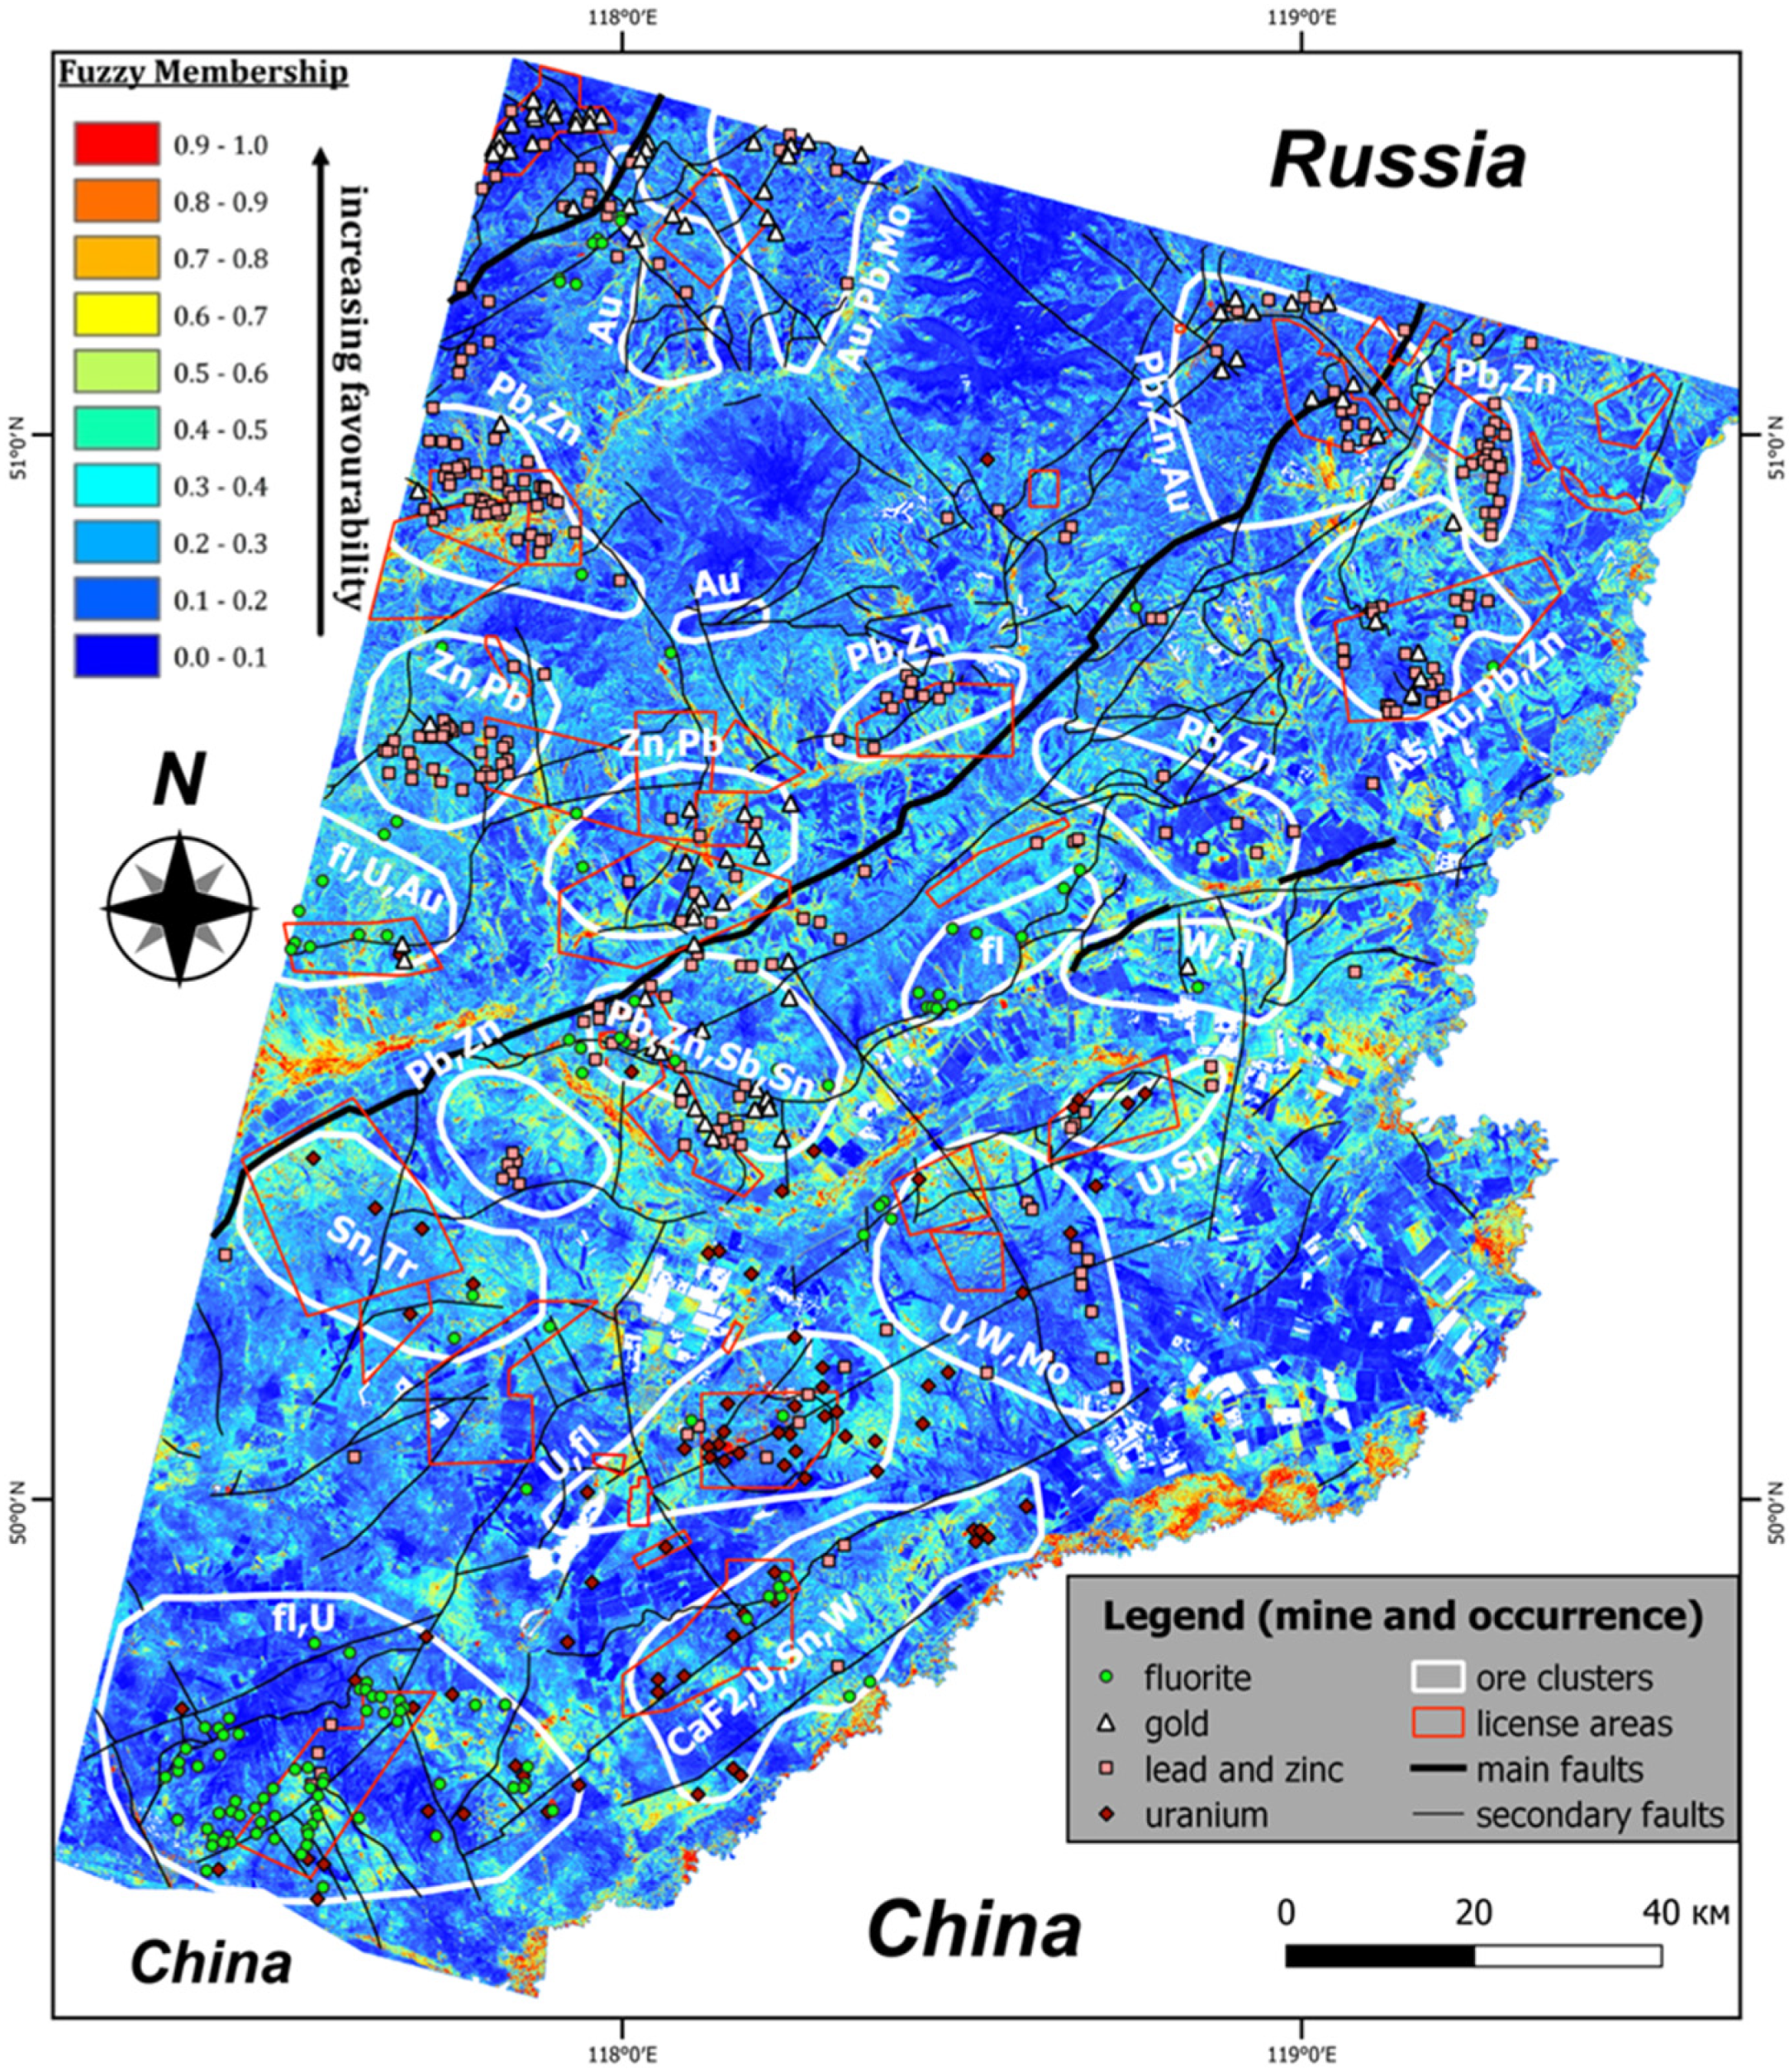
4.5. Modeling of Prospectivity Map for the Discovery of Minerals

In order to construct a map of regional spatial distribution most favorable to finding ore mineralization areas on the basis of the fuzzy logic model, appropriate thematic layers were used resulting from statistical transformation of the data from the Landsat-8 methods PCA, MNF, and ICA (Table 3). PC4, PC5, and PC3 thematic components were selected from PCA transformation; from MNF—MNF3, MNF4, and MNF5 thematic components; and from ICA—IC2, IC3, and IC5 thematic components (the validity of the selected thematic components is described in previous sections). Before integration, using the “AND” operator, the selected thematic layers were first pre-classified and then fuzzificated using a linear set function (linear membership function). A prospectivity map obtained for the discovery of minerals within the studied area is presented in Figure 10. For spatial analysis of the distribution of fuzzy memberships, regarding the location of rock complexes, ore clusters, licensed areas of known minerals and faulting, they were applied to the scheme (Figure 10). The analysis showed that the supposed high potential zones with an intensity of 0.6–1 are mainly associated with the Mesozoic volcano–sedimentary complexes, Neogene-Quaternary sediments, extended fault zones, and contacts of intrusive bodies (Figure 2). There is also an increased concentration of promising zones (from 0.7 to 1) within ore clusters and license areas (Figure 10) and the attachment to them of most known mines and occurrences of gold, uranium, polymetallic, and fluorite mineralization, the localization of which is also controlled by extended faulting (Figure 10). Besides this, a spatial analysis was carried out between known hydrothermal-metasomatic zones and presumably promising zones with an intensity from 0.7 to 1. The analysis revealed a spatial pattern in the localization of these zones within the areas of hydrothermal and metasomatic alterations widely manifested in the studied area: argillization, propilitization, sericitization, silicification, greisenization, and skarnification.

5. Discussion

Our study was aimed at assessing the possibility of conducting regional geological and mineralogical mapping of the territory of south-eastern Transbaikalia based on a dataset in conditions of a sharply continental climate, the presence of moderate vegetation, and alpha-humus soils affecting to some extent the spectral curve of hydrothermal altered minerals or masking hydrothermal zones. In order to minimize the negative environmental factors when conducting geological and mineralogical mapping, a cloudless scene with an acquisition date, characterized by the lowest degree of humidity and vegetation, was used. To eliminate the correlation between spectral channels, to identify and remove hidden obstacles to geological and mineralogical mapping, and as a result to classify mutually independent image pixels, reflecting the unique spectral characteristic of hydrothermal altered minerals of their groups, statistically reasonable image processing techniques such as PCA, MNF, and ICA were used.
The first stage of the study, the composite in false colors (FCC) was generated from 2, 5, and 7 spectral channels of Landsat-8 in order to assess the possibility to conduct geological mapping of the studied area. As a result, it was established that due to the very complex geological structure of the studied area, the presence of vegetation cover, thick quaternary sediments, similar material composition of the main rock mass, and as a result of the absence of their unique spectral features within the sensor Landsat-8 ranges, it is impossible to make unambiguous identification of rocks or their complexes. Despite this, based on the spatial distribution of identified groups of hydrothermally altered minerals, there is a strict separation between sedimentary and igneous/metamorphic rocks (Figure 4, Figure 5, Figure 7 and Figure 9). In addition, on the basis of landscape and structural-geomorphological conditions, colors and gradient transitions of the false RGB image, spatial distribution of groups of hydrothermally altered minerals, 16 areas were identified mapping according to the geological map [32], granite–gneiss and granite–granodiorite rock complexes. Geological and geomorphological conditions of the selected areas are presented in Table 4.
The second phase of the research involved the statistical processing of the Landsat-8 dataset using PCA, MNF, and ICA techniques and establishing a correspondence between their components and groups of hydrothermally altered minerals based on analysis of eigenvectors matrices and construction of two-dimensional correlation plots. Loadings in eigenvector matrices for selected thematic bands are high enough (Table 1 and Table 2), and two-dimensional correlation plots reflect a strong linear trend (Figure 6 and Figure 8). According to the results of each transformation an RGB composite was generated from the thematic layers of hydrothermally altered mineral groups. Each of the RGB composites is unique and in its own way reflecting the geological and morphological conditions of the studied area.
In the third phase of the study an integrated mineral map was built on the basis of the fuzzy logic model, obtained from informative thematic layers, identified after PCA, MNF, and ICA transformation (Table 3, Figure 10). The spatial distribution of favorable ore mineralization regions with intensity from 0.6 to 1 agrees well with the productivity of oregenesis stages, which have passed in the interval from the Proterozoic to the Holocene inclusive. The most productive minerogenic event occurred in the Mesozoic era when during the process of intraplate tectonomagmatic activation the subalcalic magmatics were formed with Au, Cu-Mo-, Pb-Zn-Ag-metallogenic specialization, volcano–plutonic calder complexes with Mo-U, Pb-Zn, and fluorite ores, and then rare-metal granites with a Sn-W-Li-Ta mineralization spectrum [31]. In connection with the manifestation of Mesozoic magmatism, there were also processes of hydrothermal–metasomatic alterations in rocks from magnesian and calcareous skarns, K-feldspars, greisens and beresites to hydromicas and argillizites took place [30]. Large deposits of coal, siderites, and zeolites were formed in the final stages of the activation events and in the process of territory peneplanation [32]. Throughout the history of ore-forming processes, faulting zones of various ranks played a key role in heat and mass transfer which served as permeable channels for magma and ore-bearing fluids, and had an important ore localization value.
High-potential zones with an intensity of 0.8–1 are also observed in the Neogene-Quaternary sediment caps which are predominantly sandstone, kaolinite-hydromicas, and argillite-like clays, and represent the reprecipitation products of Paleogenic weathering crust which could potentially be considered as construction raw materials [32].
The northern, more partitioned part of the territory is characterized by an increased presence of land cover which overlaps the ore-bearing bedrocks. This makes the area practically unsuitable for mineralogical mapping, although it has high prospects for identifying large gold, copper-molybdenum, and polymetallic deposits. On the other hand, geobotanic anomalies in soils can be considered as an indicator of the presence of hydrothermally altered rocks. However, such an assumption may contribute to targeting false anomalies along with anomalies that are actually associated with ore mineralization. In this regard, the use of, for example, multispectral satellite data from Earth remote sensing with increased spatial and spectral resolution, such as Aster or WorldView-3, the application of a variety of techniques for processing remote sensing data, their integration and more careful selection of acquisition date and scene will improve the quality of mineralogical mapping results in areas with higher vegetation cover. Further research plans to use data from Aster, Sentinel-2, and commercial satellites WorldView-3, as they provide better spatial and spectral characteristics VNIR, SWIR, and TIR of ranges to identify the geological features of the territory and conduct more detailed geological and mineralogical mapping. In order to verify and calibrate the remote sensing data processing results, it is planned to conduct field work and measure Vis-NIR (0.35–2.5 μm) spectra of rock minerals within the prospectivity areas.

6. Conclusions

During the geological mapping based on the FCC image, 16 geological and morphological structures were identified. A combined analysis of the highlighted structures with geological information was carried out and their spatial relationship with the geomorphological position, quaternary deposits, composition of rocks, and zones of alteration was established.
During mineralogical mapping, the relationship between the Landsat-8 dataset statistical processing results and spectral characteristics associated with iron oxides/hydroxides (Fe3+ and Fe3+/Fe2+), clays (Al-OH and Fe, Mg-OH), and carbonate (CO32−)-altered groups of minerals was established. Based on the fusion of the obtained thematic layers using the fuzzy logic model a prospectivity map was generated reflecting the expected, most favorable areas (anomalies) of hydrothermal mineralization localization.
Based on the spatial analysis of geological information and the results of the remote sensing data processing, the correlation of the supposed anomalies to the Mesozoic plutonic and volcanic–sedimentary complexes, as well as to the Neogene-Quaternary sediments, was established, extended faulting zones and intrusive contacts. A close spatial relationship between the anomalies of the forecast map intensity from 0.7 to 1 with ore objects bearing (U, Ag, Pb, Zn) and fluorite mineralization was also identified which is controlled by faulting and developed mainly within ore clusters and license areas. On the basis of the obtained results and geological criteria of localization of productive mineralization, it is possible to identify promising areas both within and outside ore clusters.
In general, the results of the study lead to positive conclusions about the suitability of the use of remote methods for more detailed geological and mineralogical mapping of the territory with complex conditions of the continental climate.
The results demonstrated in this study represent a significant contribution to the development of ways to apply satellite multispectral remote sensing data for regional mineral exploration. The presented work may be of great interest to scientists, researchers, and mining and exploration companies applying multi- and hyperspectral remote sensing data at various stages of mineral exploration.

Author Contributions

Conceptualization, I.O.N., V.T.I. and V.A.P.; Data curation, S.A.U., V.A.M. and V.A.P.; Formal analysis, I.O.N. and V.T.I.; Investigation, I.O.N. and V.T.I.; Methodology, I.O.N. and S.A.U.; Project administration, V.A.M. and V.A.P.; Resources, V.A.P.; Validation, V.A.M. and V.A.P.; Visualization, S.A.U. and V.A.P.; Writing—original draft, I.O.N. and V.T.I.; Writing—review & editing, I.O.N., V.T.I., S.A.U., V.A.M. and V.A.P. All authors have read and agreed to the published version of the manuscript.

Funding

The work was carried out within the framework of the state assignment of IGEM RAS in accordance with the Program of the Ministry of Science and Higher Education of Russian Federation.

Institutional Review Board Statement

The study does not require ethical approval.

Informed Consent Statement

Informed consent was obtained from all subjects involved in the study.

Data Availability Statement

No data were presented in the study.

Conflicts of Interest

The authors declare no conflict of interest.

References

  1. Kirsanov, A.A.; Lipiyainen, K.L.; Smirnov, M.Y. Identification of areas perspective for gold mineralization based on results of aeroborne and satellite hyperspectral data processing. Reg. Geol. Metallog. 2019, 78, 82–90. [Google Scholar]
  2. Smirnova, I.O.; Kirsanov, A.A.; Kamyshnikova, N.V. A review of the past 5 years of international advances in multi- and hyperspectral satellite data application and processing techniques in geological research. Mod. Probl. Remote Sens. Earth Space 2020, 17, 9–27. [Google Scholar] [CrossRef]
  3. Sakhnovsky, M.L.; Borozdin, A.P.; Vinogradov, L.A. Guidelines for Organizing and Evaluating Geological and Mineralogical Mapping at Scales of 1:500,000 and 1:200,000; Map Manufactory VSEGEI: St. Petersburg, Russia, 2009; 280p, ISBN 978-5-93761-148-2.
  4. Sakhnovsky, M.L.; Bondarenko, V.M.; Golovin, A.A. Requirements for the Organization and Conduct of Geological and Mineralogical Mapping at Scales of 1:500,000 and 1:200,000; Map manufactory VSEGEI: St. Petersburg, Russia, 2009; 88p, ISBN 978-5-93761-136-9.
  5. Eldosouky, A.M.; Sehsah, H.; Elkhateeb, S.O.; Pour, A.B. Integrating aeromagnetic data and Landsat-8 imagery for detection of post-accretionary shear zones controlling hydrothermal alterations: The Allaqi-Heiani Suture zone, South Eastern Desert, Egypt. Adv. Space Res. 2019, 65, 1008–1024. [Google Scholar] [CrossRef]
  6. Sheikhrahimi, A.; Pour, A.B.; Pradhan, B.; Zoheir, B. Mapping hydrothermal alteration zones and lineaments associated with orogenic gold mineralization using ASTER data: A case study from the Sanandaj-Sirjan Zone, Iran. Adv. Space Res. 2019, 63, 3315–3332. [Google Scholar] [CrossRef]
  7. Zoheir, B.; El-Wahed, M.A.; Pour, A.B.; Abdelnasser, A. Orogenic Gold in Transpression and Transtension Zones: Field and Remote Sensing Studies of the Barramiya-Mueilha Sector, Egypt. Remote Sens. 2019, 11, 2122. [Google Scholar] [CrossRef] [Green Version]
  8. Noori, L.; Pour, B.A.; Askari, G.; Taghipour, N.; Pradhan, B.; Lee, C.-W.; Honarmand, M. Comparison of Different Algorithms to Map Hydrothermal Alteration Zones Using ASTER Remote Sensing Data for Polymetallic Vein-Type Ore Exploration: Toroud-Chahshirin Magmatic Belt (TCMB), North Iran. Remote Sens. 2019, 11, 495. [Google Scholar] [CrossRef] [Green Version]
  9. Pour, B.A.; Hashim, M. The application of ASTER remote sensing data to porphyry copper and epithermal gold deposits. Ore Geol. Rev. 2016, 44, 1–9. [Google Scholar] [CrossRef] [Green Version]
  10. Pour, A.B.; Hashim, M.; Park, Y.; Hong, J.K. Mapping alteration mineral zones and lithological units in Antarctic regions using spectral bands of ASTER remote sensing data. Geocarto Int. 2018, 33, 1281–1306. [Google Scholar] [CrossRef]
  11. Pour, A.B.; Park, Y.; Park, T.S.; Hong, J.K.; Hashim, M.; Woo, J.; Ayoobi, I. Regional geology mapping using satellite-based remote sensing approach in Northern Victoria Land, Antarctica. Polar Sci. 2018, 16, 23–46. [Google Scholar] [CrossRef]
  12. Pour, A.B.; Park, T.S.; Park, Y.; Hong, J.K.; Zoheir, B.; Pradhan, B.; Ayoobi, I.; Hashim, M. Application of multi-sensor satellite data for exploration of Zn-Pb sulfide mineralization in the Franklinian Basin, North Greenland. Remote Sens. 2018, 10, 1186. [Google Scholar] [CrossRef] [Green Version]
  13. Pour, B.A.; Hashim, M.; Marghany, M. Exploration of gold mineralization in a tropical region using Earth Observing-1 (EO1) and JERS-1 SAR data: A case study from Bau gold field, Sarawak, Malaysia. Arab. J. Geosci. 2014, 7, 2393–2406. [Google Scholar] [CrossRef]
  14. Deller, M.E.A. Facies discrimination in laterites using Landsat Thematic Mapper, ASTER and AlI data—Example from Eritrea and Arabia. Int. J. Remote Sens. 2006, 27, 2389–2409. [Google Scholar] [CrossRef]
  15. Pour, B.A.; Hashim, M.; van Genderen, J. Detection of hydrothermal alteration zones in a tropical region using satellite remote sensing data: Bau gold field, Sarawak, Malaysia. Ore Geol. Rev. 2013, 54, 181–196. [Google Scholar] [CrossRef]
  16. Wambo, J.D.T.; Pour, A.B.; Ganno, S.; Asimow, P.D.; Zoheir, B.; dos Reis Salles, R.; Nzenti, J.P.; Pradhan, B.; Muslim, A.M. Identifying high potential zones of gold mineralization in a sub-tropical region using Landsat-8 and ASTER remote sensing data: A case study of the Ngoura-Colomines goldfield, eastern Cameroon. Ore Geol. Rev. 2020, 122, 103530. [Google Scholar] [CrossRef]
  17. Carranza, E.J.M.; Hale, M. Mineral imaging with Landsat Thematic Mapper data for hydrothermal alteration mapping in heavily vegetated terrane. Int. J. Remote Sens. 2010, 23, 4827–4852. [Google Scholar] [CrossRef]
  18. Rajendran, S.; Nasir, S. ASTER capability in mapping of mineral resources of arid region: A review on mapping of mineral resources of the Sultanate of Oman. Ore Geol. Rev. 2019, 108, 33–53. [Google Scholar] [CrossRef]
  19. Ihlen, V.; Zanter, K. Landsat 8 (L8) Data Users Handbook; Report of the Geological Survey of the USGS; USGS: Reston, VA, USA, 2019; 114p.
  20. Richards, J.A.; Xiuping, J. Remote Sensing Digital Image Analysis: An Introduction; Springer Nature: Berlin, Germany, 2006; 440p, ISBN 9783540251286. [Google Scholar]
  21. Ruiz-Armenta, J.R.; Prol-Ledesma, R.M. Techniques for enhancing the spectral response of hydrothermal alteration minerals in Thematic Mapper images of Central Mexico. Int. J. Remote Sens. 1998, 19, 1981–2000. [Google Scholar] [CrossRef]
  22. Green, A.A.; Berman, M.; Craig, M.D. A Transformation for ordering multispectral data in terms of image quality with implications for noise removal. IEEE Trans. Geosci. Remote Sens. 1988, 26, 65–74. [Google Scholar] [CrossRef] [Green Version]
  23. Comon, P. Independent component analysis, A new concept? Signal Process. Image Commun. 1994, 36, 287–314. [Google Scholar] [CrossRef]
  24. Clark, R.N.; Swayze, G.A. Mapping minerals, amorphous materials, environmental materials, vegetation, water, ice, and snow, and other materials. In Summaries of the Fifth Annual JPL Airborne Earth Science Workshop, The United States Geological Survey; Jet Propulsion Laboratory: Pasadena, CA, USA, 1995; pp. 39–40. [Google Scholar]
  25. Hunt, G.R.; Ashley, R.P. Spectra of altered rocks in the visible and near-infrared. Econ. Geol. 1979, 74, 1613–1629. [Google Scholar] [CrossRef]
  26. Zhao, D.; Zhao, X.; Khongnawang, T.; Arshad, M.; Triantafilis, J. A Vis-NIR Spectral Library to Predict Clay in Australian Cotton Growing Soil. Soil Sci. Soc. Am. J. 2018, 82, 1347–1357. [Google Scholar] [CrossRef]
  27. Novák, V.; Perfilieva, I.; Mockor, J. Mathematical Principles of Fuzzy Logic; Springer Science & Business Media: Berlin/Heidelberg, Germany, 1999; 320p, ISBN 978-0-7923-8595-0. [Google Scholar]
  28. Novikova, M.S. Economic and Geographical Features of the Development of the South-Eastern Regions of the Trans-Baikal Territory; Academic Publishing House “GEO”: Novosibirsk, Russia, 2014; 162p, ISBN 978-5-906284-42-6. [Google Scholar]
  29. Ischukova, L.P.; Igoshin, Y.A.; Avdeev, B.V.; Gubkin, G.N.; Filipchenko, Y.A.; Popova, A.I.; Rogova, V.P.; Makushin, M.F.; Khomentovsky, B.N.; Spirin, E.K. Geology of the Urulyunguevsky Ore Region and Molybdenum-Uranium Deposits of the Streltsovsky Ore Field; Geoinformmark: Moskow, Russia, 1998; 329p. [Google Scholar]
  30. Andreeva, O.V.; Petrov, V.A.; Poluektov, V.V. Mesozoic felsic magmatites of southeastern Transbaikalia: Petrogeochemistry, connection with metasomatism and ore formation. Geol. Ore Depos. 2020, 62, 76–104. [Google Scholar] [CrossRef]
  31. Petrov, V.A.; Andreeva, O.V.; Poluektov, V.V. Tectonomagmatic cycles and geodynamic settings for the formation of ore-bearing systems in the Southern Argun region. Geol. Ore Depos. 2017, 59, 445–469. [Google Scholar] [CrossRef]
  32. Shivokhin, E.A.; Ozersky, A.F.; Artamonova, N.A.; Dukhovskiy, A.A.; Karasev, V.V.; Kurylenko, A.V.; Nadezhdina, T.N.; Pavlenko, Y.V.; Raitina, N.I.; Shor, G.M. State Geological Map of the Russian Federation. Scale 1:1,000,000 (Third Generation); Sheet M-50–Greyhound, Explanatory letter; VSEGEI: St. Petersburg, Russia, 2010; 553p. [Google Scholar]
  33. Irons, J.R.; Dwyer, J.L.; Barsi, J.A. The next Landsat satellite; the Landsat Data Continuity Mission. Remote Sens. Environ. 2012, 122, 11–21. [Google Scholar] [CrossRef] [Green Version]
  34. Acharya, T.; Yang, I. Exploring Landsat 8. Int. J. IT Eng. Appl. Sci. Res. 2015, 4, 4–10. [Google Scholar]
  35. Roy, D.P.; Wulder, M.A.; Loveland, T.R.; Woodcock, C.E.; Allen, R.G.; Anderson, M.C.; Helder, D.; Irons, J.R.; Johnson, D.M.; Kennedy, R.; et al. Landsat-8: Science and product vision for terrestrial global change research. Remote Sens. Environ. 2014, 145, 154–172. [Google Scholar] [CrossRef] [Green Version]
  36. Cooley, T.; Anderson, G.P.; Felde, G.W.; Hoke, M.L.; Ratkowski, A.J.; Chetwynd, J.H.; Gardner, J.A.; Adler-Golden, S.M.; Matthew, M.W.; Berk, A.; et al. FLAASH, a MODTRAN4-based atmospheric correction algorithm, its application and validation. Int. Geosci. Remote Sens. Symp. 2002, 3, 1414–1418. [Google Scholar] [CrossRef]
  37. Research Systems, Inc. ENVI Tutorials; A rjdak Company, Research Systems, Inc.: Sydney, Australia, 2008; 620p. [Google Scholar]
  38. Berk, A.; Bernstein, L.S.; Robertson, D.C. MODTRAN: A moderate resolution model for LOWTRAN. 7. U.S.C. Geophys. Lab. Tech. Rep. 1989, 89, 44. [Google Scholar]
  39. Mather, P.M.; Koch, M. Computer Processing of Remotely Sensed Images. An Introduction; John Wiley and Sons: Hoboken, NJ, USA, 1999; 434p, ISBN 9780470666517. [Google Scholar]
  40. Kumar, C.; Shetty, A.; Raval, S.; Champatiray, P.K.; Sharma, R. Sub-Pixel mineral mapping using EO-1 Hyperion hyperspectral data. Int. Arch. Photogramm. Remote Sens. Spat. Inf. Sci. 2014, 8, 455–461. [Google Scholar] [CrossRef] [Green Version]
  41. Kriegler, F.; Malila, W.; Nalepka, R.; Richardson, W. Preprocessing transformations and their effect on multispectral recognition. In Proceedings of the Sixth International Symposium on Remote Sensing of Environment, Ann Arbor, MI, USA, 13–16 October 1969; pp. 97–131. [Google Scholar]
  42. Gao, B.-C. NDWI—A normalized difference water index for remote sensing of vegetation liquid water from space. Remote Sens. Environ. 1996, 58, 257–266. [Google Scholar] [CrossRef]
  43. Laben, C.A.; Brower, B.V. Process for Enhancing the Spatial Resolution of Multispectral Imagery Using Pan-Sharpening. U.S. Patent 6.011.875, 4 January 2000. [Google Scholar]
  44. Mwaniki, M.W.; Matthias, M.S.M.; Schellmann, G. Application of remote sensing technologies to map the structural geology of central Region of Kenya. IEEE J. Sel. Top. Appl. Earth Obs. Remote Sens. 2015, 8, 1855–1867. [Google Scholar] [CrossRef]
  45. Drury, S.A. Image Interpretation in Geology; Chapman & Hall: London, UK, 2001; 290p, ISBN 978-0748764990. [Google Scholar]
  46. Chukwu, G.U.; Ijeh, B.I.; Olunwa, K.C. Application of Landsat imagery for landuse/landcover analyses in the Afikpo sub-basin of Nigeria. J. Geol. Min. Res. 2013, 3, 67–81. [Google Scholar]
  47. Sabins, F.F., Jr.; Ellis, J.M. Remote Sensing: Principles and Applications; Waveland Press: Long Grove, IL, USA, 1997; 524p, ISBN 978-1478637103. [Google Scholar]
  48. Bishta, A. Lithologic Discrimination Using Selective Image Processing Technique of Landsat 7 Data, Um Bogma Environs Westcentral Sinai, Egypt. J. King Abdulaziz Univ. Mar. Sci. 2009, 20, 193–213. [Google Scholar] [CrossRef]
  49. Ourhzif, Z.; Algouti, A. Lithological mapping using Landsat 8 OLI and Aster multispectral data in Imini-Ounilla district South high Atlas of Marrakech. Int. Arch. Photogramm. Remote Sens. Spat. Inf. Sci. 2019, XLII-2/W13, 1255–1262. [Google Scholar] [CrossRef] [Green Version]
  50. Pour, A.B.; Hashim, M. Hydrothermal alteration mapping from Landsat-8 data, Sar Cheshmeh copper mining district, south-eastern Islamic Republic of Iran. J. Taibah Univ. Sci. 2015, 9, 155–166. [Google Scholar] [CrossRef]
  51. Chang, Q.; Jing, L.; Panahi, A. Principal component analysis with optimum order sample correlation coefficient for image enhancement. Int. J. Remote Sens. 2006, 27, 3387–3401. [Google Scholar] [CrossRef]
  52. Crosta, A.P.; Moore, J.M. Enhancement of Landsat Thematic Mapper imagery for residual soil mapping in SW Minais Gerais State, Brazil: A prospecting case history in Greenstone belt terrain. In Proceedings of the 7th Thematic Conference on Remote Sensing for Exploration Geology, Calgary, AB, Canada, 2–6 October 1989; pp. 1173–1187. [Google Scholar]
  53. Kruse, F.A.; Lefkoff, A.B.; Boardman, J.W.; Heidebrecht, K.B.; Shapiro, A.T.; Barloon, P.J.; Goetz, A.F.H. The spectral image processing system (SIPS)—Interactive visualization and analysis of imaging spectrometer data. Remote Sens. Environ. 1993, 44, 145–163. [Google Scholar] [CrossRef]
  54. Loughlin, W.P. Principal component analysis for alteration mapping. Photogramm. Eng. Remote Sens. 1991, 57, 1163–1169. [Google Scholar]
  55. Boardman, J.W.; Kruse, F.A. Automated spectral analysis: A geological example using AVIRIS data, north Grapevine Mountains, Nevada. In Proceedings of the 10th Thematic Conference on Geological Remote Sensing, San Antonio, TX, USA, 9–12 May 1994; pp. 407–418. [Google Scholar]
  56. Amari, S.; Cichocki, A.; Yang, H.H. A new learning algorithm for blind signal separation. Adv. Neural. Inf. Process Syst. 1996, 8, 757–763. [Google Scholar]
  57. Adiri, Z.; El Harti, A.; Jellouli, A.; Maacha, L.A.; Zouhair, M.; Bachaoui, M. Mineralogical mapping using Landsat-8 OLI, Terra ASTER and Sentinel-2A multispectral data in Sidi Flah Bouskour inlier, Moroccan Anti-Atlas. J. Spat. Sci. 2019, 65, 147–171. [Google Scholar] [CrossRef]
  58. Kumar, C.; Shetty, A.; Raval, S.; Sharma, R.; Ray, P.K.C. Lithological Discrimination and Mapping using ASTER SWIR Data in the Udaipur area of Rajasthan, India. Procedia Environ. Sci. 2015, 11, 180–188. [Google Scholar] [CrossRef] [Green Version]
  59. Zadeh, L.A. Fuzzy sets. Inf. Control. 1965, 8, 338–353. [Google Scholar] [CrossRef] [Green Version]
  60. Ghanbari, Y.; Hezarkhani, A.; Ataei, M.; Pazand, K. Mineral potential mapping with fuzzy models in the Kerman-Kashmar Tectonic Zone, Central Iran. Appl. Geomat. 2012, 4, 173–186. [Google Scholar] [CrossRef]
  61. Kim, Y.H.; Choe, K.U.; Ri, R.K. Application of fuzzy logic and geometric average: A Cu sulfide deposits potential mapping case study from Kapsan Basin, DPR Korea. Ore Geol. Rev. 2019, 107, 239–247. [Google Scholar] [CrossRef]
  62. Nykänen, V.; Groves, D.I.; Ojala, V.J.; Eilu, P.; Gardoll, S.J. Reconnaissance-scale conceptual fuzzy-logic prospectivity modelling for iron oxide copper-gold deposits in the northern Fennoscandian Shield, Finland. Aust. J. Earth Sci. 2008, 55, 25–38. [Google Scholar] [CrossRef]
  63. Carranza, E.J.M. Geochemical Anomaly and Mineral Prospectivity Mapping in GIS; Elsevier: Amsterdam, The Netherlands, 2008; 347p, ISBN 978-0-444-51325-0. [Google Scholar]
  64. Sekandari, M.; Masoumi, I.; Pour, A.B. Application of Landsat-8, Sentinel-2, ASTER and WorldView-3 Spectral Imagery for Exploration of Carbonate-Hosted Pb-Zn Deposits in the Central Iranian Terrane (CIT). Remote Sens. 2020, 12, 1239. [Google Scholar] [CrossRef] [Green Version]
  65. Zimmermann, H.-J.; Zysno, P. Latent Connectives in Human Decision Making. Fuzzy Sets Syst. 1980, 4, 37–51. [Google Scholar] [CrossRef]
  66. An, P.; Moon, W.M.; Rencz, A. Application of fuzzy set theory to integrated mineral exploration. Can. J. Explor. Geophys. 1991, 27, 1–11. [Google Scholar]
  67. Bonham-Carter, G.F. Geographic Information Systems for Geoscientists: Modeling with GIS; Elsevier: Amsterdam, The Netherlands, 1994; 402p, ISBN 9781483144948. [Google Scholar]
  68. Carranza, E.J.M.; Hale, M. Geologically constrained fuzzy mapping of gold mineralization potential, Bauio District, Philippines. Nat. Resour. Res. 2001, 10, 125–136. [Google Scholar] [CrossRef]
  69. Crowley, J.K.; Brickey, D.W.; Rowan, L.C. Airborne imaging spectrometer data of the Ruby Mountains, Montana: Mineral discrimination using relative absorption band-depth images. Remote Sens. Environ. 1989, 29, 121–134. [Google Scholar] [CrossRef]
Figure 1. Basemap of the Zabaikalya Territory, Russia. Municipal districts: 1—Borzinskiy; 2—Transbaikalia; 3—Krasnokamenskiy; 4—Priargunskiy; 5—Alexandrovo-Zavodskiy; 6—Kalganskiy; 7—Nerchinsko-Zavodskiy; 8—Gazimuro-Zavodskiy (Nafigin I.O.).
Sustainability 14 09242 g001
Figure 2. Scheme of the geological structure of the studied area within satellite image’s border on Figure 1 (modification from [32]).
Sustainability 14 09242 g002
Figure 3. Flowchart of the remote sensing data processing algorithm.
Sustainability 14 09242 g003
Figure 4. Pseudo-colored RGB composite of 2, 5, and 7 bands of Landsat-8 (R: band 2; G: band 5; B: band 7). Circle numbers 1–16 are deciphered geological and morphological structures whose characteristics are given in Table 4.
Sustainability 14 09242 g004
Figure 5. PCA composite (R: PC4; G: PC5; B: PC3). Numbers in circles 1–16—decrypted geological and morphological structures, the characteristics of which are given in Table 4.
Sustainability 14 09242 g005
Figure 6. (a) The 2D scatter plot for PC3 and MNF3, (b) 2D scatter plot for PC4 and MNF4, and (c) 2D scatter plot for PC5 and MNF5.
Sustainability 14 09242 g006
Figure 7. MNF composite (R: MNF 4; G: MNF 5; B: MNF 3). Numbers in circles 1–16—decrypted geological and morphological structures, the characteristics of which are given in Table 4.
Sustainability 14 09242 g007
Figure 8. (a) The 2D scatter plot for PC3 and IC5, (b) 2D scatter plot for PC4 and IC2, and (c) 2D scatter plot for PC5 and IC3.
Sustainability 14 09242 g008
Figure 9. ICA composite (R: IC2; G: IC3; B: IC5). Numbers in circles 1–6—decrypted geological and morphological structures, the characteristics of which are given in Table 4.
Sustainability 14 09242 g009
Figure 10. Distribution schemes of prospective areas for ore mineralization.
Sustainability 14 09242 g010
Table 1. Eigenvector matrix obtained in PCA transformation for the first seven channels of Landsat-8.
EigenvectorsBand 1Band 2Band 3Band 4Band 5Band 6Band 7
PC1−0.0495−0.0650−0.1497−0.2377−0.4534−0.6808−0.4953
PC20.40640.44150.48050.44650.0958−0.04430.0636
PC3−0.1689−0.1306−0.04200.08870.8011−0.1440−0.5313
PC4−0.1444−0.2034−0.1624−0.20910.3025−0.55850.6814
PC50.58810.3506−0.1666−0.66580.22660.0788−0.0507
PC60.5190−0.2626−0.65960.4748−0.0200−0.02580.0079
PC70.4096−0.74200.5057−0.1544−0.01300.0207−0.0388
Table 2. Eigenvector matrix obtained at the rate of MNF transformation for the first seven channels of Landsat-8.
EigenvectorsBand 1Band 2Band 3Band 4Band 5Band 6Band 7
PC1−0.0824−0.1040−0.1910−0.2730−0.4650−0.6520−0.4800
PC20.23900.27300.34500.40400.5100−0.0455−0.3440
PC30.36800.34300.35000.2260−0.6300−0.14100.3960
PC40.21600.18800.07860.0844−0.26800.5880−0.6970
PC50.58900.3820−0.2830−0.60800.2290−0.01780.0768
PC6−0.45700.31900.6370−0.52900.04140.0363−0.0330
PC70.4450−0.71700.4800−0.23500.03110.0154−0.0291
Table 3. Fuzzification parameters for selected theme layers.
Source DataInput LayersDetection GroupMembership FunctionFuzzy Type
Landsat-8 dataset (VNIR-SWIR)PC4Hydroxyl-bearing minerals and carbonatesLinearAnd
MNF4
IC2
PC5Iron oxide/hydroxide minerals
MNF5
IC3
PC3Geobotanic anomaly and ferrous iron minerals
MNF3
IC5
Table 4. Geological and morphological characteristics of the decrypted structures.
Geomorphological PositionQuaternary DepositsComposition of Prequaternary RocksZone of Secondary Alteration
1.Medium- and low-mountain, weakly and strongly dissected steeply sloping relief. Landscape is more geochemically unstable.Eluvial, desertion, colluvial, deluvial-colluvial.Granites, granosyenites, granodiorites, monzodiorites, plagiogranites, diorites, monzonites, gabbro, gabbrodiorites, conglomerates, gravelites, sandstones, siltstones, mudstone interbeds, tuff, tuff sandstones.K-feldspathization, beresitization.
2.Medium- and low-mountain, weakly and strongly dissected steeply sloping relief. The landscape is more geochemically unstable. Eluvial, deluvial-solifluction, colluvial, deluvial-colluvial, alluvial-deluvial.Granites, granodiorites, granosyenites, monzodiorites, diorites, plagiogranites, gabbro, gabbrodiorites, conglomerates, gravelites, shales, dolomites, limestones, sandstones, metabasalts, metarhyolites, tuffs.K-feldspathization, beresitization, skarns, greisenization.
3.Erosion-denudation medium–low-mountain dissected steep-middle slope relief. The landscape is geochemically unstable.Desertion, deluvial-colluvial, deluvial-proluvial, alluvial-deluvial.Granites, granodiorites, granosyenites, monzodiorites, diorites, plagiogranites, gabbro, gabbrodiorites, rhyolites, rhyodacites, graniteporphyries, conglomerates, gravelites, marls, sandstones, limestones, mudstones, siltstones, tuffs.Not defined (not identified).
4.Medium–low-mountainous, intensively and slightly dissected relief. The landscape is geochemically unstable.Eluvial, desertion, colluvial, deluvial-colluvial.Granites, granodiorites, granosyenites, monzodiorites, monocytes, diorites, gabbro, gabbrodiorites, rhyolites, shales, conglomerates.Skarns, beresitization.
5.Erosion-denudation medium–low-mountain dissected steeply-medium slope relief. The landscape is geochemically stable.Eluvial, desertion, colluvial, deluvial-colluvial.Granites, granodiorites, granosyenites, monzodiorites, monocytes, diorites, gabbro, gabbrodiorites, plagiogranities.Not defined (not identified).
6.Erosion-denudation medium–low-mountain dissected steep-medium slope relief. The landscape is geochemically stable.Eluvial, desertion, colluvial.Granites, granodiorites, granosyenites, monzodiorites, monocytes, diorites, gabbro, gabbrodiorites, plagiogranites.Not defined (not identified).
7. Medium–low-mountain, intensely and slightly dissected relief. Landscape is geochemically unstable.Eluvial, desertion, deluvial-colluvial.Granites, granodiorites, granosyenites, monzodiorites, diorites, gabbro, gabbrodiorites, shales, siltstones, sandstones.Argillization, quartz-fluorite veins.
8.Low-mountain moderately dissected relief. Landscape with high geochemical stability.Deluvial-colluvial, deluvial-solifluction, alluvial-deluvial, alluvial.Granites, granosyenites, granodiorites, monzodiorites, diorites, gabbro-diorities, syenites, conglomerates, gravelites, sandstones, siltstones, tuffs gravelstones, shales, metabasalts, trachybasalts, dolomites, limestones.Argilization.
9.Medium–low-mountain dissected relief. Landscape is geochemically stable.Eluvial, deluvial-colluvial, deluvial-solifluction, alluvial-deluvial.Grannites, granodiorites, granosyenites, monzodiorites, diorites, plagiogranites, gabbro, gabbrodiorites, rhyolites, rhyodacites, shales, sieltstones, sandstones, gravelites, metabasalts, metarhyolites, trachyandesites, trachybasalts, metarhyolites, conglomerates, tuffs, interlayers of dolomites, limestones.Silicification, tourmaline.
10.Low-mountain medium dissected relief. Landscape is with high geochemical stability.Deluvial-colluvial, deluvial-solifluction, alluvial-deluvial, alluvial.Grannites, granosyenites, gneiss-granites, trachybasalts, andesites, trachyandesites, shales, sandstones, gravelstones, dolomites, limestones, tuffs, tuff sandstones.Argillization, silicification, tourmalinization, greisenization are common.
11.Low-mountain medium dissected relief. Landscape with high geochemical stability.Deluvial-colluvial, deluvial-solifluction, alluvial-deluvial.Grannites, granodiorites, granosyenites, gneiss-granites, blastocataclasites, blastomylonites, orthogneisses, gneisses, shales, limestones, dolomites, sandstones, siltstones, shale, gravelites, conglomerates, tuffs, tuff sandstones, tuff breccias.Greisenization is widespread.
12.Structure-denudation and denudation medium–low mountain strongly partitioned relief. Landscape is geochemically sustainable.Eluvial, desertion, deluvial-solifluctional, colluvial, deluvial-colluvial, deluvial-proluvial, alluvial-deluvial, alluvial.Grannites, granodiorites, granosyenites, monzodiorites, diorites, gabbro, gabbrodiorites, leukogranites, conglomarates, shale, aleurolites, sandstones, gravelites, metabasaltes, metariolites, dolomite layer, limestones.Argilization, silicification, tourmalinization.
13. Erosion-denudation low-mountain moderately partitioned and denudation low-mountain–hilly terrain. Landscape is geochemically sustainable.Desertion, deluvial-solifluctional, deluvial, deluvial-colluvial, alluvial-deluvial, alluvial.Grannites, granosyenites, granodiorites, monzodiorites, diorites, gabbro-diorites, trachybasalts andesites, sandstones rhyolites, dacites, shale, aleurolites, sandstones, gravelites, conglomerates, metabasaltes, metariolites, tuffs, dolomite layer, limestones, argillites.Not defined (not identified).
14.Low-mountain dissected and accumulative moderately and slightly dissected hilly–ridged ridge relief. Landscape is geochemically sustainable.Eluvial and deluvial, deluvia colluvial, alluvial-deluvial, alluvial.Grannites, leucocratic grannites, granosyenites, gneissic granites, rhyolites, trachybasalts, basalts, basaltic andesites, andesites, dolomites, limestones, sandstones, siltstones, shales, gravelstones, conglomerates, tuffs, tuff sandstones.Argillization and propilization are widely disseminated.
15.Low-mountain dissected and accumulative moderately and slightly dissected hilly–ridged ridge relief. Landscape is geochemically sustainable.Eluvial and deluvial, deluvial, deluvial-colluvial, alluvial-deluvial, alluvial.Grannites, granodiorites, granosyenites, monzodiorites, diorites, plagiogranites, gabbro, gabbrodiorities, rhyolites, granite-porphyry, gneiss-granites, shales, sandstones, gravelites, dolomite layers, limestones.Occultation, kaolinization, Greysenization, quartz sericite metasomatites.
16. Low-mountain moderately dissected, medium-slope relief. Landscape with high and medium geochemical stability.Deluvial, deluvial-colluvial, alluvial-deluvial, alluvial.Leukogranites, granosienites, gneiss-granites, trachibaslts, basalts, andesiazalts, trachyancides, tuffs, granodiorites, monzodiorites, diorites, plagiogranities, gabbros, gabbrodierites, blactocataclasites, orthogneisses, gneisses, plagiogneisses, shales, quartzites, marbles, limestones, dolomites, amphiboles, dacites, riodacites, trachiriodacites, trachyrolites, granodiorities-porphyries, granosienite-porphyries, andesites; trachiandesites, trachiandasites.Argillization, occultation, tourmalinization, squaring, greisenization, muscovitization.
Table 5. Covariance matrix received by ICA transformation over PCA results.
CovariancePC1PC2PC3PC4PC5PC6PC7
IC13.67 × 10−22.03 × 10⁻¹²−1.73 × 10⁻¹²−5.69 × 10−131.12 × 10⁻¹³−1.70 × 10⁻¹³−2.42 × 10⁻¹⁴
IC22.03 × 10−123.28 × 10⁻⁴−4.89 × 10⁻¹⁴−2.72 × 10−146.67 × 10⁻¹⁵−6.43 × 10⁻¹⁵−3.86 × 10⁻¹⁵
IC3−1.73 × 10⁻¹²−4.89 × 10−141.91 × 10−47.73 × 10−15−2.65 × 10−151.84 × 10−151.36 × 10⁻¹⁵
IC4−5.69 × 10⁻¹³−2.72 × 10−147.73 × 10−152.85 × 10⁻⁵−1.14 × 10−151.09 × 10−156.63 × 10⁻¹⁶
IC51.12 × 10−136.67 × 10⁻¹⁵−2.65 × 10⁻¹⁵−1.14 × 10−151.25 × 10⁻⁵−3.63 × 10⁻¹⁶−9.34 × 10⁻¹⁷
IC6−1.70 × 10⁻¹³−6.43 × 10−151.84 × 10−151.09 × 10⁻¹⁵−3.63 × 10−161.62 × 10−61.69 × 10−16
IC7−2.42 × 10⁻¹⁴−3.86 × 10−151.36 × 10−156.63 × 10⁻¹⁶−9.34 × 10−171.69 × 10−169.44 × 10⁻⁷
Table 6. Correlation matrix received by ICA transformation over PCA results.
CorrelationPC1PC2PC3PC4PC5PC6PC7
IC11.00 × 1005.84 × 10−10−6.53 × 10⁻¹⁰−5.57 × 10−101.66 × 10⁻¹⁰−6.95 × 10⁻¹⁰−1.30 × 10⁻¹⁰
IC25.84 × 10−101.00 × 100−1.95 × 10⁻¹⁰−2.82 × 10−101.04 × 10⁻¹⁰−2.78 × 10⁻¹⁰−2.19 × 10⁻¹⁰
IC3−6.53 × 10⁻¹⁰−1.95 × 10−101.00 × 1001.05 × 10−10−5.42 × 10−111.04 × 10−101.02 × 10⁻¹⁰
IC4−5.57 × 10⁻¹⁰−2.82 × 10−101.05 × 10−101.00 × 100−6.03 × 10−111.60 × 10−101.28 × 10⁻¹⁰
IC51.66 × 10−101.04 × 10⁻¹⁰−5.42 × 10⁻¹¹−6.03 × 10−111.00 × 100−8.06 × 10⁻¹¹−2.72 × 10⁻¹¹
IC6−6.95 × 10⁻¹⁰−2.78 × 10−101.04 × 10−101.60 × 10⁻¹⁰−8.06 × 10−111.00 × 1001.36 × 10−10
IC7−1.30 × 10⁻¹⁰−2.19 × 10−101.02 × 10−101.28 × 10⁻¹⁰−2.72 × 10−111.36 × 10−101.00 × 100
Publisher’s Note: MDPI stays neutral with regard to jurisdictional claims in published maps and institutional affiliations.

