Article

Evaluation of Future Maize Yield Changes and Adaptation Strategies in China

1
Institute of Environment and Sustainable Development in Agriculture, Chinese Academy of Agricultural Sciences, Beijing 100081, China
2
Liaoning Weather Modification Office, Shenyang 110166, China
*
Author to whom correspondence should be addressed.
Sustainability 2022, 14(15), 9246; https://doi.org/10.3390/su14159246
Submission received: 27 June 2022 / Revised: 16 July 2022 / Accepted: 19 July 2022 / Published: 28 July 2022
(This article belongs to the Special Issue Climate Change Research toward Sustainable Agriculture)

Abstract

:
In the past century, climate change has become more significant, which has a great impact on crop growth, especially food security. Based on the regional climate model PRECIS, high-precision grid climate data in China under RCP4.5 and RCP8.5 scenarios were output, and the high-precision amplification and calibration of crop model DSSAT were calibrated and verified in combination with data of maize planting from 2005 to 2015, including observation data of agrometeorological stations, ecological networking experiment data and maize survey data of agricultural demonstration counties. The impact of climate change on maize production in 2030s and 2050s was evaluated; and the effect of main adaptation strategies to climate change is put forward which could support macro strategies of layout adjustment for the maize production system. The results show that if no countermeasures are taken in the future, the risk of maize yield reduction in China will gradually increase, especially under the RCP8.5 scenario. The risk of maize yield reduction in each main production area will be very prominent in the 2050s under the RCP8.5 scenario, which would be between 10–30%. Compared with a delayed sowing date, an early sowing date would be more conducive to maize production, but there would be some differences in different regions. The heat in the growing season of maize would increase significantly. If the growth time of maize from silking to maturity could be prolonged and the accumulated temperature could be raised, the dry matter accumulation of maize would effectively increase, which would have an obvious effect on yield. Improving grain filling rate is also significant, although the effect of yield increase would be smaller. Therefore, sowing in advance, full irrigation and cultivating varieties with a long reproductive growth period could effectively alleviate the yield reduction caused by climate change. Adjusting maturity type and grain harvest strategy would have a more obvious mitigation effect on yield reduction in northeast China and northern China, and plays a positive role in ensuring future maize yield.

1. Introduction

In recent years, with global warming, the impacts of climate change on the global natural system and human system have become more and more obvious [1]. This has increasingly highlighted the practical significance of the community with a shared future for mankind. In 2016, nearly 200 countries and organizations of the United Nations Framework Convention on climate change reached the Paris Agreement at the Paris climate change conference [2]. At the general debate of the 75th United Nations General Assembly Present Xi Jinping made a commitment to the world that China would increase its national independent contribution, adopt more effective policies and measures, do its best to reach peak of carbon dioxide emissions by 2030 and achieve carbon neutrality by 2060. This is a major strategic decision made by China based on the inherent requirements of promoting the responsibility of building a community with a shared future for mankind and realizing sustainable development. It is also a Chinese solution to climate change for the whole world. According to the latest scientific findings, the observed global average surface temperature in the decade 2011–2020 was 1.09 °C higher than the average value in 1850–1900, and almost all regions of the world are experiencing warming [3]. With climate change, temperature increase is most significant and has the most direct impact on agricultural production and food security, such as the compound stress of high temperature and drought, frequent heat waves, the shortening of the crop growth season, the decline of soil fertility, land degradation, the intensification of diseases and insect pests, among other factors. On the other hand, precipitation is becoming more unstable, untimely and sudden due to climate change in all regions of the world, resulting in an increase on the frequency and intensity of disasters such as drought and flooding, which leads to grain failure and deterioration of the ecological environment [4,5,6,7,8]. According to the third national assessment report on climate change, China’s surface temperature has increased in recent 50 years, and warming is very obvious [9,10,11]. In particular, the warming rate in central and eastern China from 1909 to 2010 reached 1.52 °C/100 year, which is significantly higher than global warming in the past century. Extreme climate events brought by climate change are becoming more and more frequent, resulting in increasingly serious ecological and environmental problems, which restricts the sustainable development of human society and the economy [12,13,14].
As the main grain crop in China, maize is not only the staple food, but also an important forage crop for animal husbandry and industrial raw materials. A huge fluctuation of maize yield would directly affect food security in China. Changes in sunshine, temperature and moisture caused by climate change would directly lead to changes in maize yield. At the same time, there are obvious temporal and spatial characteristics of climate change impact on maize growth [15]. Differences of temperature in the maize growing season in different regions and seasons, as well as the differences in temperature increase, will lead to great differences in maize production. In view of the impacts of climate change on maize, research all over the world is mainly carried out on three aspects. First, the impact of future climate change on maize growth process and yield is predicted using crop models, combined with climate scenario data and site measurement data [16]. Crop models are usually established based on the crop growth process, and have good simulation effects on the dynamic change trend of crop growth and broad application prospects in predicting future yield change [17,18,19]. In recent years, a series of crop growth simulation studies have been carried out by applying crop models such as CERES, APSIM and Aquacrop [20,21,22], which predicted the change trends and temporal and spatial distribution patterns of crop yield under climate change. Second, statistical correlation analysis of extreme climate events on maize growth have also been carried out based on historical climate statistics and key growth processes of maize [23,24,25]. It is usual to use statistical methods such as time series models, cross-section models and panel models to analyze the impact of climate factors on long-time series of maize yield; but it is difficult to clarify mechanism of crop growth and the cross impacts of different factors [26,27,28]. Third, a lot of studies have carried out experiments on maize growth to reveal the impacts of climate factors and disaster indicators on maize growth mechanisms [29,30,31]. Specific field experiments have been carried out to quantify the impact of climate change on crops by meteorological factors such as temperature, precipitation, radiation and CO2 concentration control experiments [32], which could obtain first-hand data. Due to the lack of regional representation, this is not suitable for long-term and large-scale spatial research on crop yield prediction.
Based on the regional climate model PRECIS, high-precision grid climate data in China under RCP4.5 and RCP8.5 scenarios were output, and high-precision amplification and calibration of the crop model DSSAT was calibrated and verified in combination with data of the maize planting process from 2005 to 2015, including the observational data of agrometeorological stations, ecological networking experiment data and maize survey data of agricultural demonstration counties. The predicted impact of climate change on maize production in the 2030s and 2050s was evaluated; and the effect of main adaptation strategies to climate change is put forward, which could support macro strategies of layout adjustment for the maize production system.

2. Materials and Methods

2.1. Data

In this study, historical daily weather data (1986–2005) was derived from the AgMERRA dataset. AgMERRA represents post-processing of the NASA Modern-Era Retrospective Analysis for Research and Applications (MERRA) data. The dataset has been proved to be suitable for agricultural modelling and features consistent, daily time-series data [33].
For future climate data, applying the regional climate simulation system PRECIS from the Hadley Climate Prediction and Research Center of the National Weather Service of the UK, based on different representative concentration emission paths (RCP4.5, RCP8.5) proposed in the fifth assessment report of IPCC, the output results of HadGEM2-ES model were dynamically downscaled to simulate the climate conditions of China from 1971 to 2100, and high-precision climate scenarios data of China under RCP 4.5 and RCP 8.5. The RCPs are a set of four trajectories that span a large radiative forcing range, defined as increased energy input at the surface level in W m−2, ranging from 2.6 W m−2 (RCP2.6) to 8.5 W m−2 (RCP8.5) by the end of the 21st century, with RCP4.5 as the intermediate emission scenario, and RCP8.5 as the high emission scenario. The horizontal resolution of HadGEM2-ES model was downscaled from 1.875° × 1.25° to 0.5° × 0.5°.

2.2. Simulation of Maize Yield Using DSSAT

According to the data of global warming selected above, we simulated maize yield changes compared with the average yield during 1986–2005 on a grid level using CERES-Maize, which is part of DSSAT version 4.6 [34]. DSSAT is widely used to simulate the potential impacts of climate change. The ability of DSSAT to simulate crop production under different levels of irrigation, or other management conditions, and for long-term (30-years or more) weather conditions, makes the model highly suitable for studying the impacts of adaptation strategies. Crop simulations applying DSSAT have been a major data source for the Intergovernmental Panel on Climate Change (IPCC) assessments for agriculture.
Maize producing areas were divided into six areas (Figure 1). Four of the main maize producing areas (northern planting area, Huang Huai Hai planting area, southwest planting area and northwest planting area) are selected to simulate per unit yield of maize in the 2030s (2021–2040) and 2050s (2041–2060) under the scenarios of RCP 4.5 and RCP 8.5. By comparing the average yield of maize per unit area at the baseline (1986–2005), the change of per unit maize yield in China under the influence of future climate change was calculated.
Six parameters were selected in the crop model for regional calibration and verification. The agricultural production data used for calibration and verification includes sowing date, growth period, fertilization and yields, which are from the agrometeorological experimental stations provided by the data center of China Meteorological Administration, the ecological networking field test provided by Chinese Academy of Agricultural Sciences and the maize survey in agricultural demonstration counties. The soil data came from China’s soil database, which is grid-processed, on the basis of a soil attribute database and a soil digital map, to form a national grid soil attribute database. According to the planting varieties and scope of maize, the four main maize producing zones were further divided into 14 sub regions. The genetic parameters of maize in each maize planting region are shown in Table 1. Other simulation conditions were set, such as sufficient fertilizer, water automatic irrigation, and considering the fertilizer effect of CO2.

2.3. Bias Correction

Due to differences of geographical and climatic characteristics in different regions, the simulation abilities of the climate models would be greatly different, and the statistical interpretation on results would be different. Before the impact assessment, the most appropriate interpretation method should be selected according to the research purpose and research area to correct the output values of climate variables from climate models [25,26]. The basic data used for bias correction in this study included meteorological observation data, NCEP/NCAR reanalysis data (National Centers for Environmental Prediction/National Center for Atmospheric Research, USA), ECMWF reanalysis data (European Center for Medium Range Weather Forecasts), CRU data (Climate Research Unit, UK) and gridding CN05.1 observation data, which were applied for comparative analysis considering observation errors, analysis errors and other relative factors. Based on the matching levels of the PRECIS output results with the above data in terms of spatial scale, time scale and element types, gridding CN05.1 observation data and total solar radiation of 2459 stations in the period (1986–2005) were selected as the reference data for correction. So far, no bias correction methods could meet all purposes of applications in different regions and sectors. For maize growth process, the average deviation correction method performs better, and can meet the high accuracy demand of the average values of climate variables. Therefore, the average deviation correction method was finally used to correct the climate scenarios data in this research.
On the other hand, the uncertainties in predictions of the impact of future climate change on the yield within China were evaluated using the existing field corn genotype coefficient and soil parameter database contained within the DSSAT and field data collected from the agrometeorological stations near the study sites. The observed data of one representative cultivar from each site were used to calibrate the crop model with a GLUE module, and two or more years’ independent data were used to validate the CERES-Maize model. More than 3000 runs were initiated to refine the results based on the GLUE select program, which is a Bayesian estimation method that uses Monte Carlo sampling from prior distributions of the coefficients, and a Gaussian likelihood function to determine the best coefficients based on the simulated and observed yield values. The Morris and Sobol sensitivity analysis methods were applied to evaluate the sensitivity of model outputs based on variation in the input variables and genotype-specific parameters.

3. Results

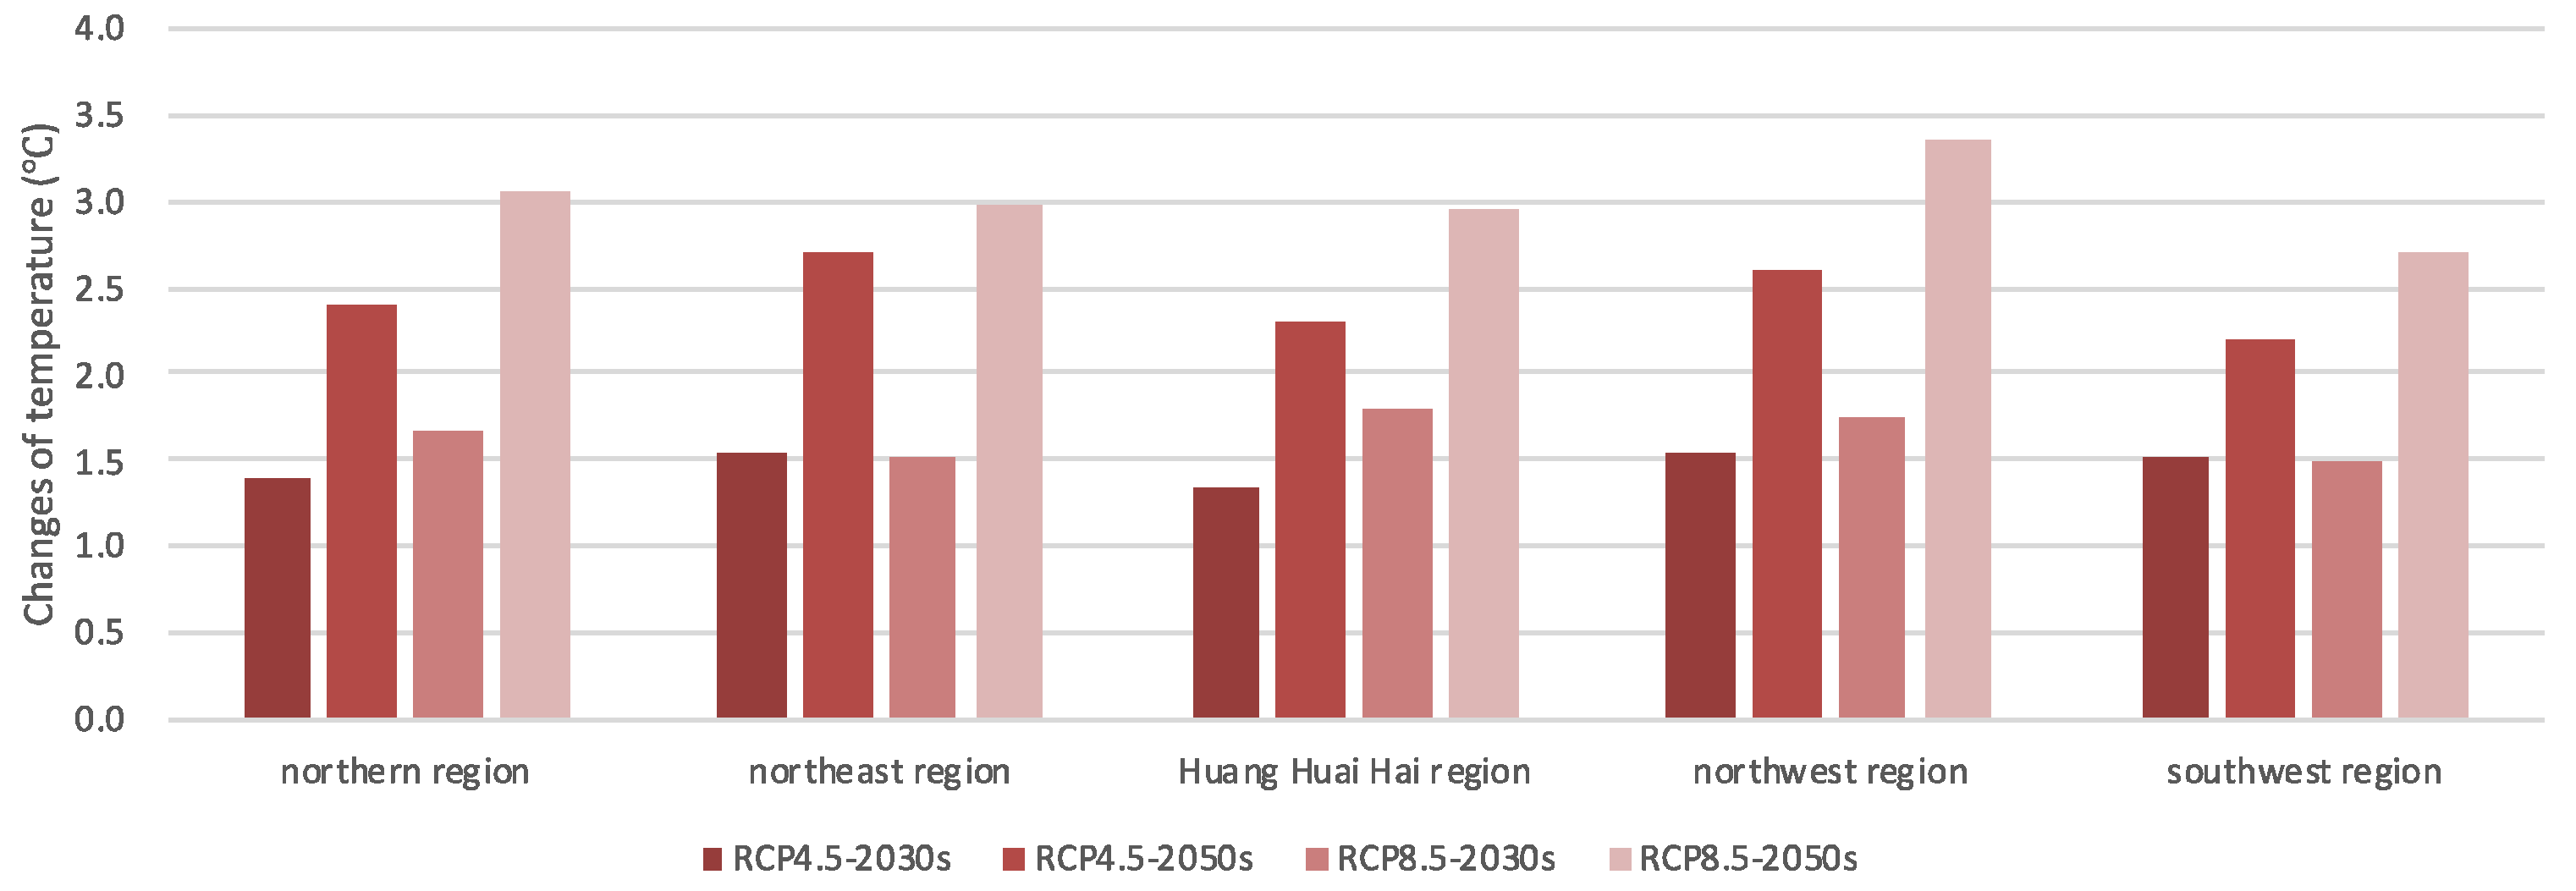
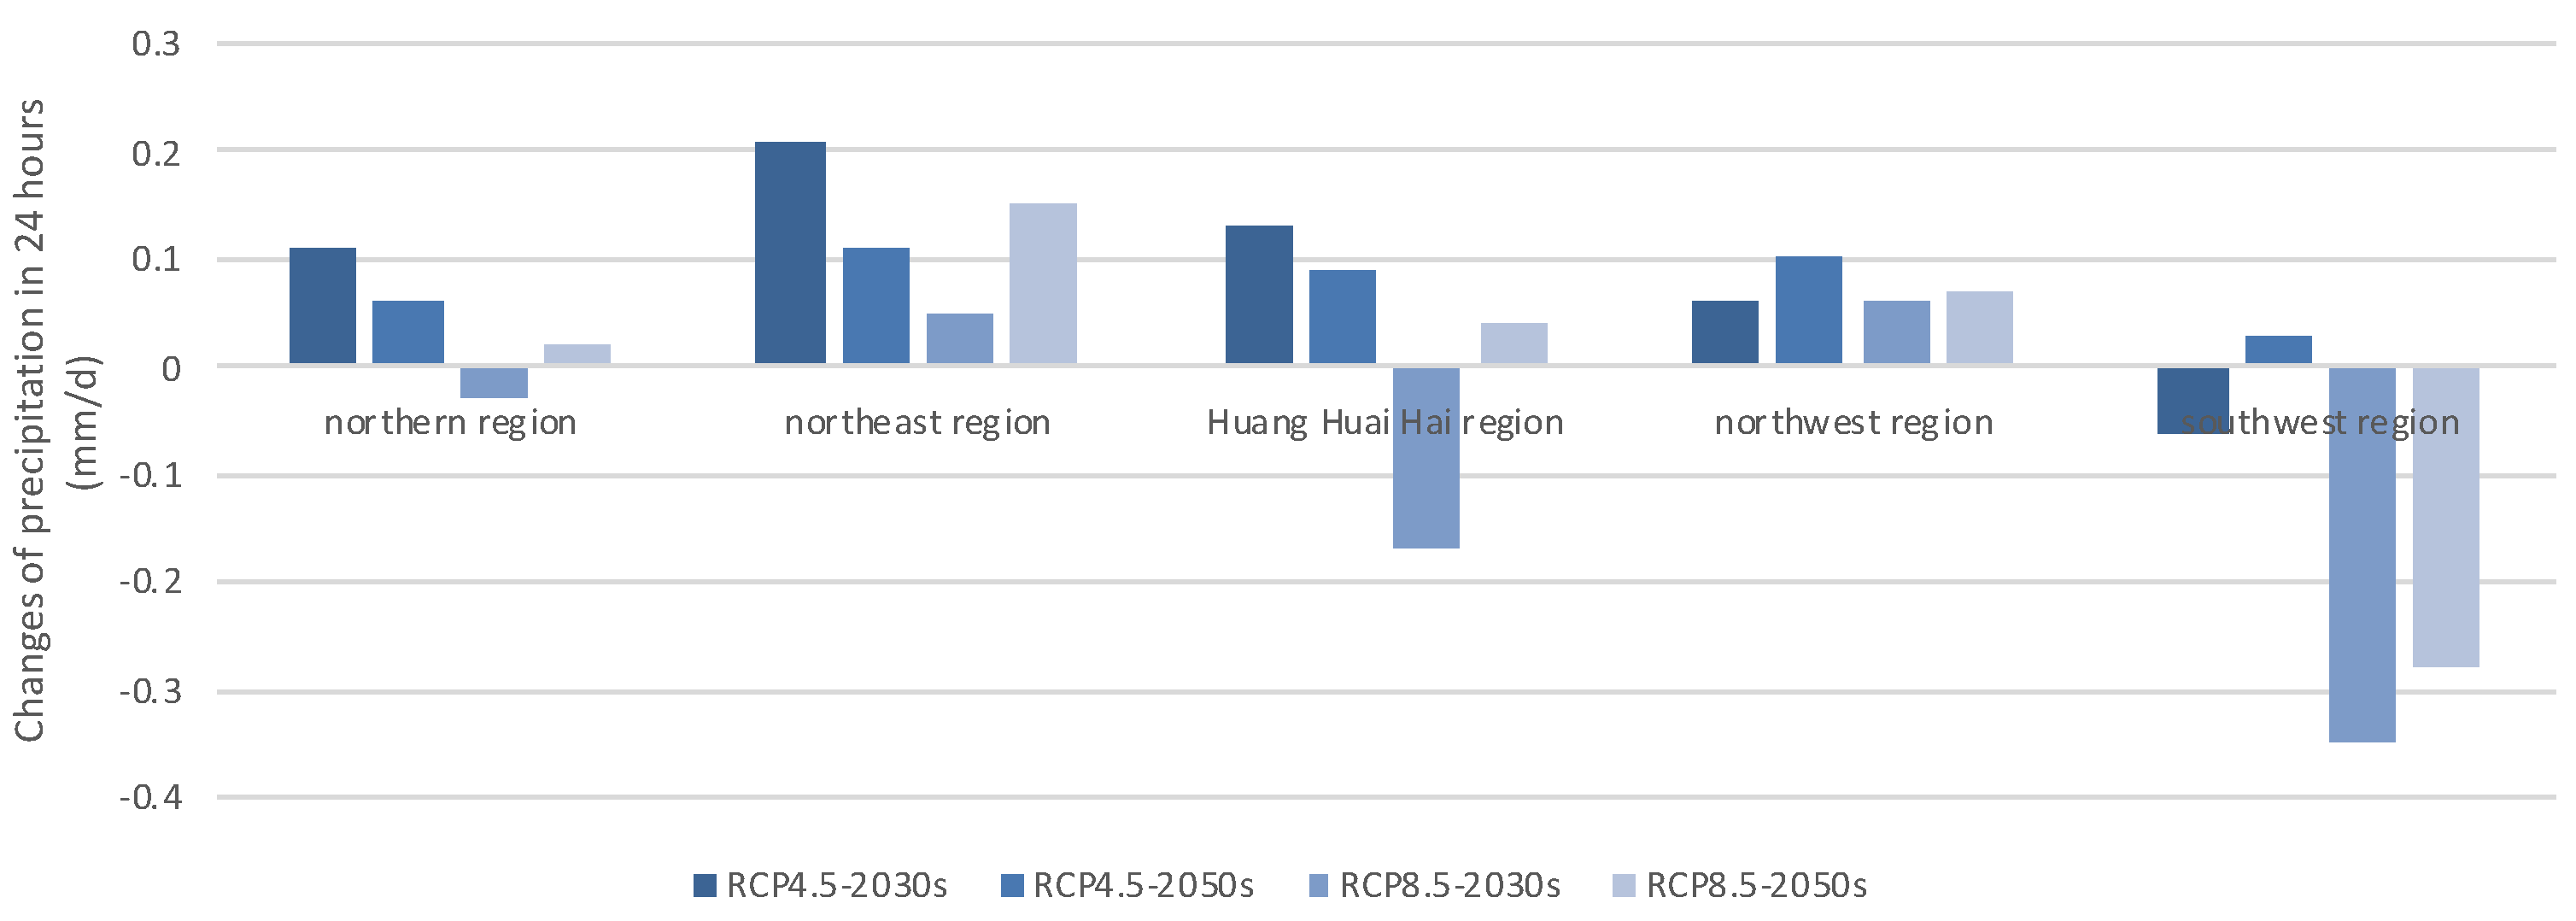
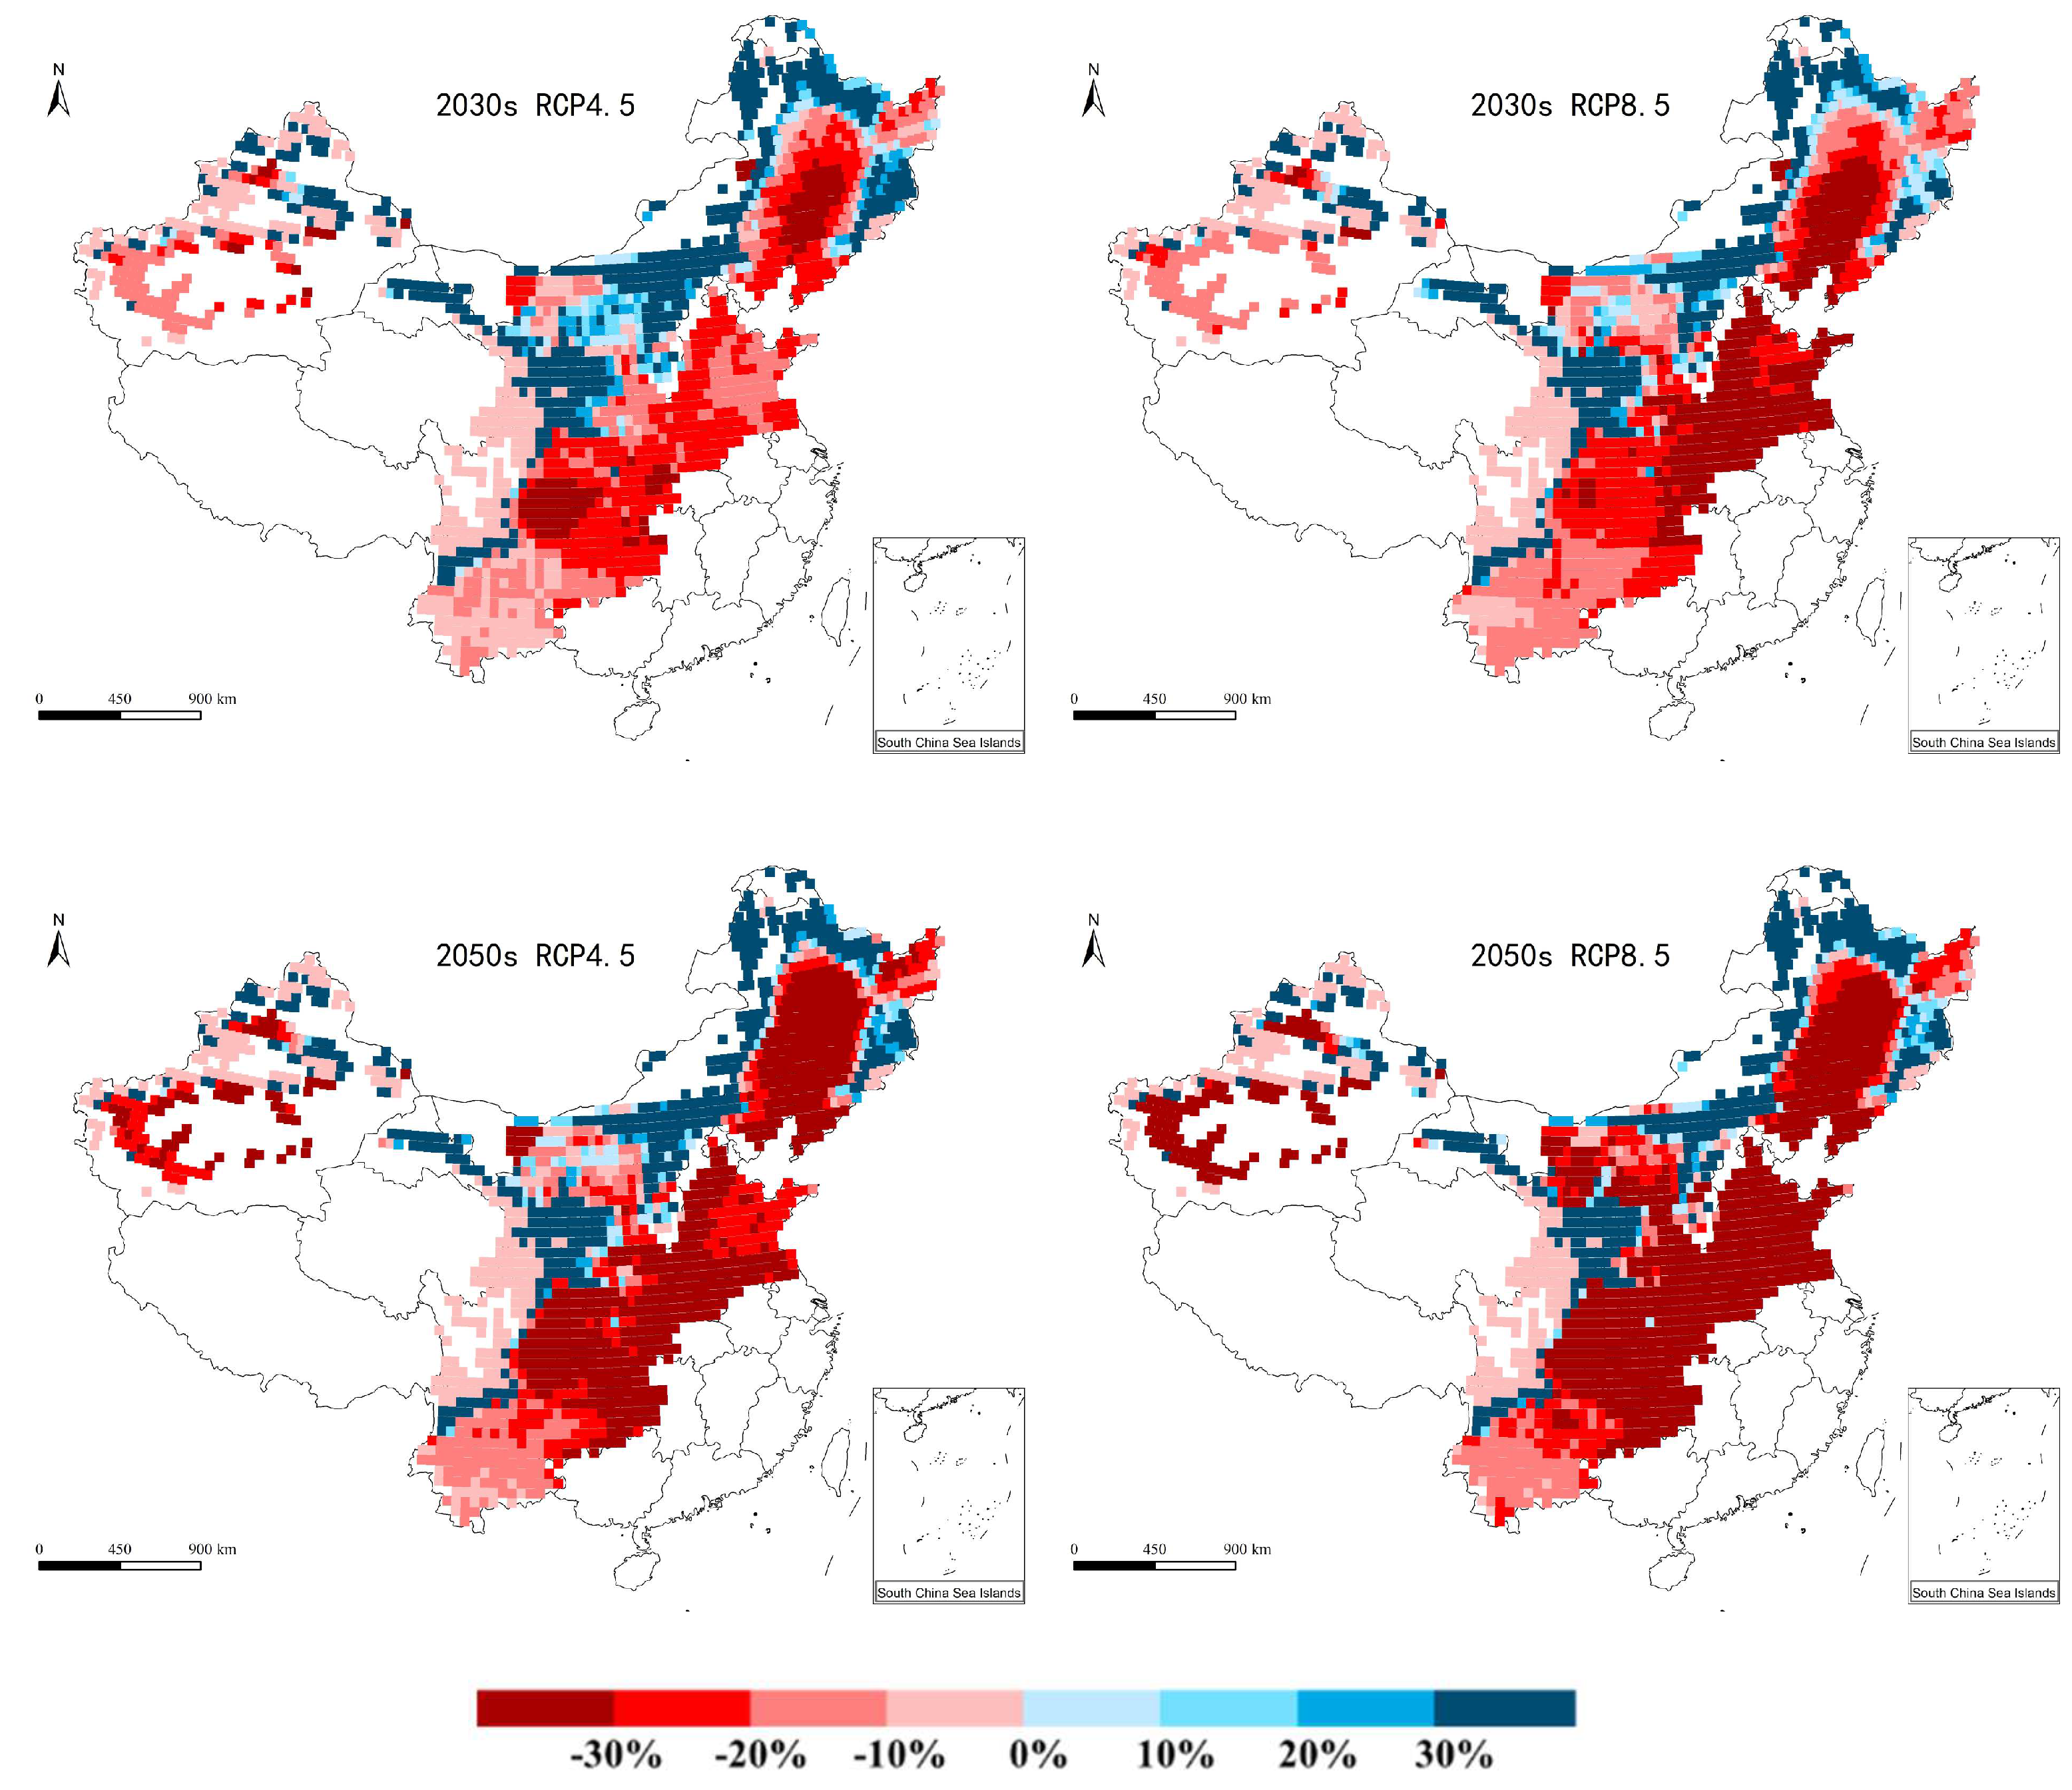
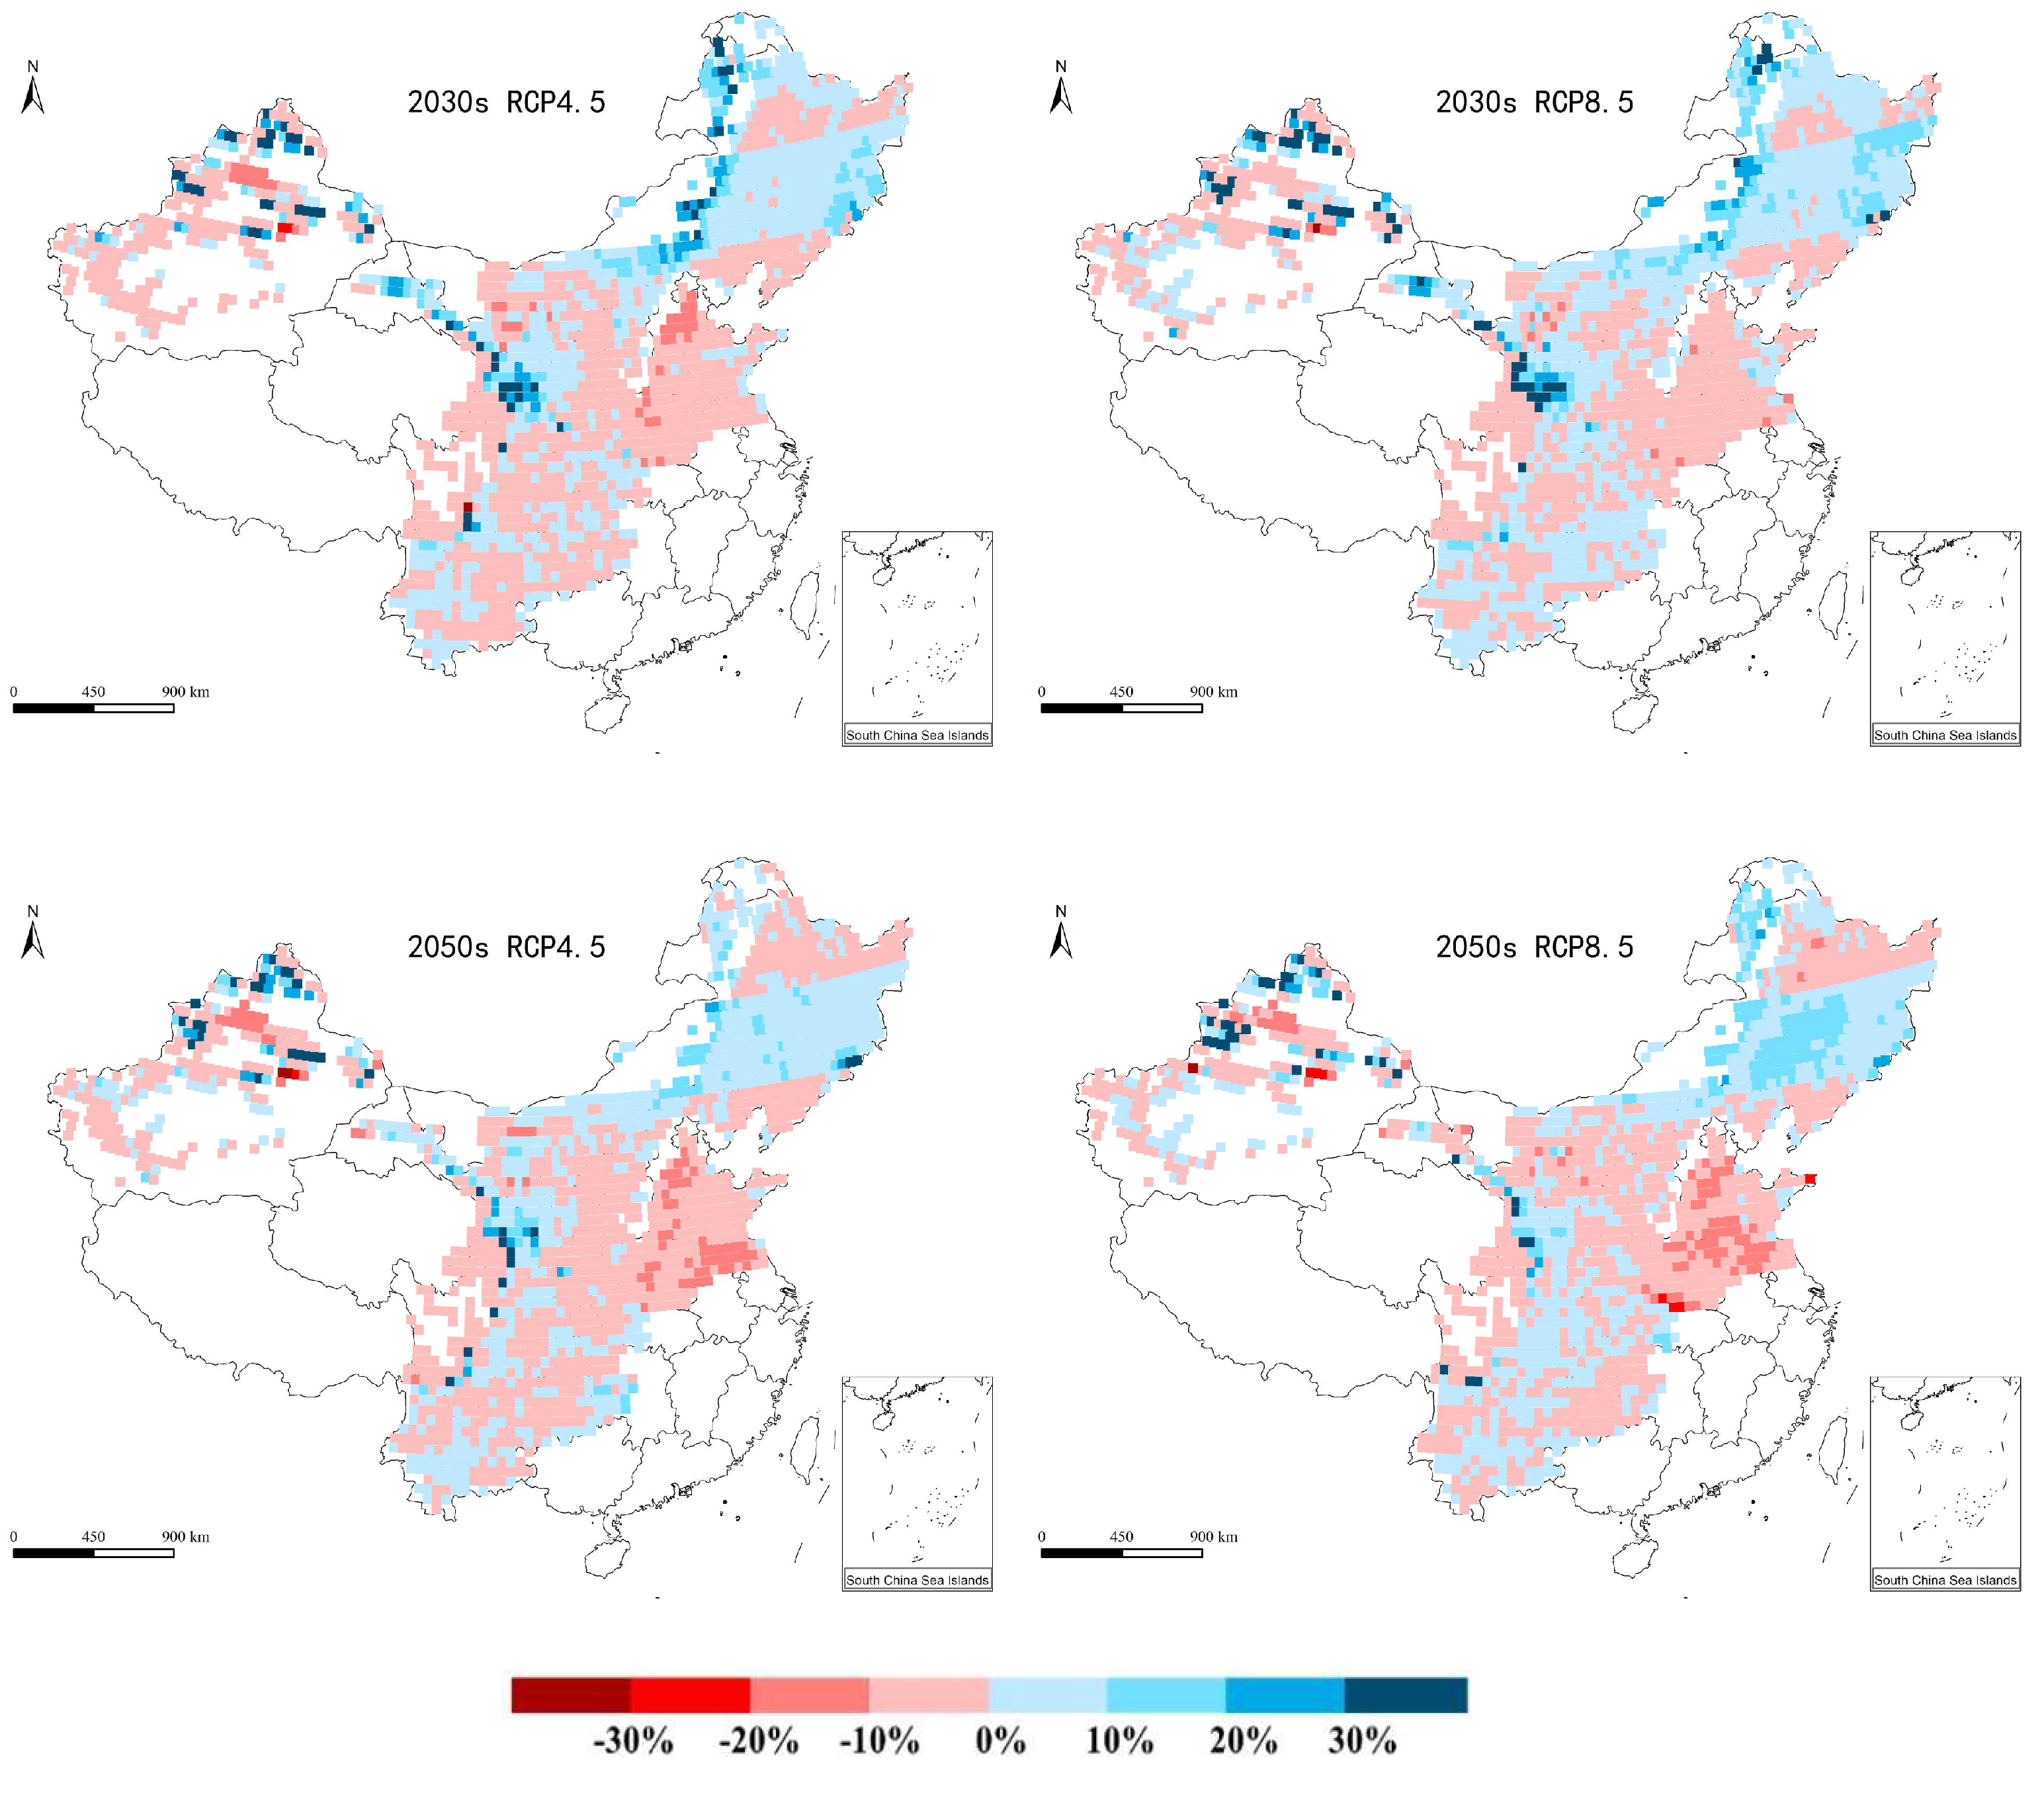
3.1. Climate Change under Global Warming

Under the scenarios of RCP 4.5/8.5 in the 2030s and 2050s, the trends of temperature and precipitation in China relative to the baseline (1986–2005) were obvious and remarkable (Figure 2). On the whole, the average temperature in the future will show an upward trend for the whole country. The temperature increase under the RCP 8.5 scenario would be higher than that under RCP 4.5, while under the same scenario, the temperature increase in the 2050s would be higher than that in 2030s. Under the RCP 4.5 scenario, compared with the precipitation in the baseline (1986–2005), the precipitation in the provinces from the middle and upper reaches of the Yangtze River to the estuary would decline, and the precipitation in most other areas would increase. Under the RCP 8.5 scenario, the reduction trend of precipitation would expand from the middle and upper reaches of the Yangtze River to southeast China and north China, which would be alleviated in 2050s.
For temperature (Figure 2), under the RCP 4.5 scenario, the temperature rise would be the highest in Northwest region in the 2030s, exceeding 1.5 °C; it would be close to 1.5 °C in the southwestern region, and the temperature rise would be the lowest in northern region. In the 2050s, the temperature in southwest region would have the least increase. Under the RCP 8.5 scenario, the temperature increase in the Huang-Huai-Hai region would be the largest in the 2030s, similar to the northwest region, and the southwest region would have the lowest temperature increase among the five regions. In the 2050s, the temperature increase in the northwest region would be close to 3.4 °C, which is the largest, and the temperature rise would be close to 2.7 °C in the southwest, which is the lowest. For precipitation (Figure 3), this would increase in the northeast region and northwest region under RCP 4.5 and RCP 8.5 scenarios. In the Huang-Huai-Hai region the precipitation would also increase, except in the 2030s under the RCP 8.5 scenario. In the southwest region the precipitation would decline, especially in the 2030s under the RCP 8.5 scenario, and would reach 135 mm/year. In addition to the average changes of temperature and precipitation, it was found that the frequency and intensity of extreme climate events under RCP 8.5 scenario would also be more serious than those under the RCP 4.5 scenario; especially in the 2050s the adverse impacts of extreme climate events would be further exacerbated.

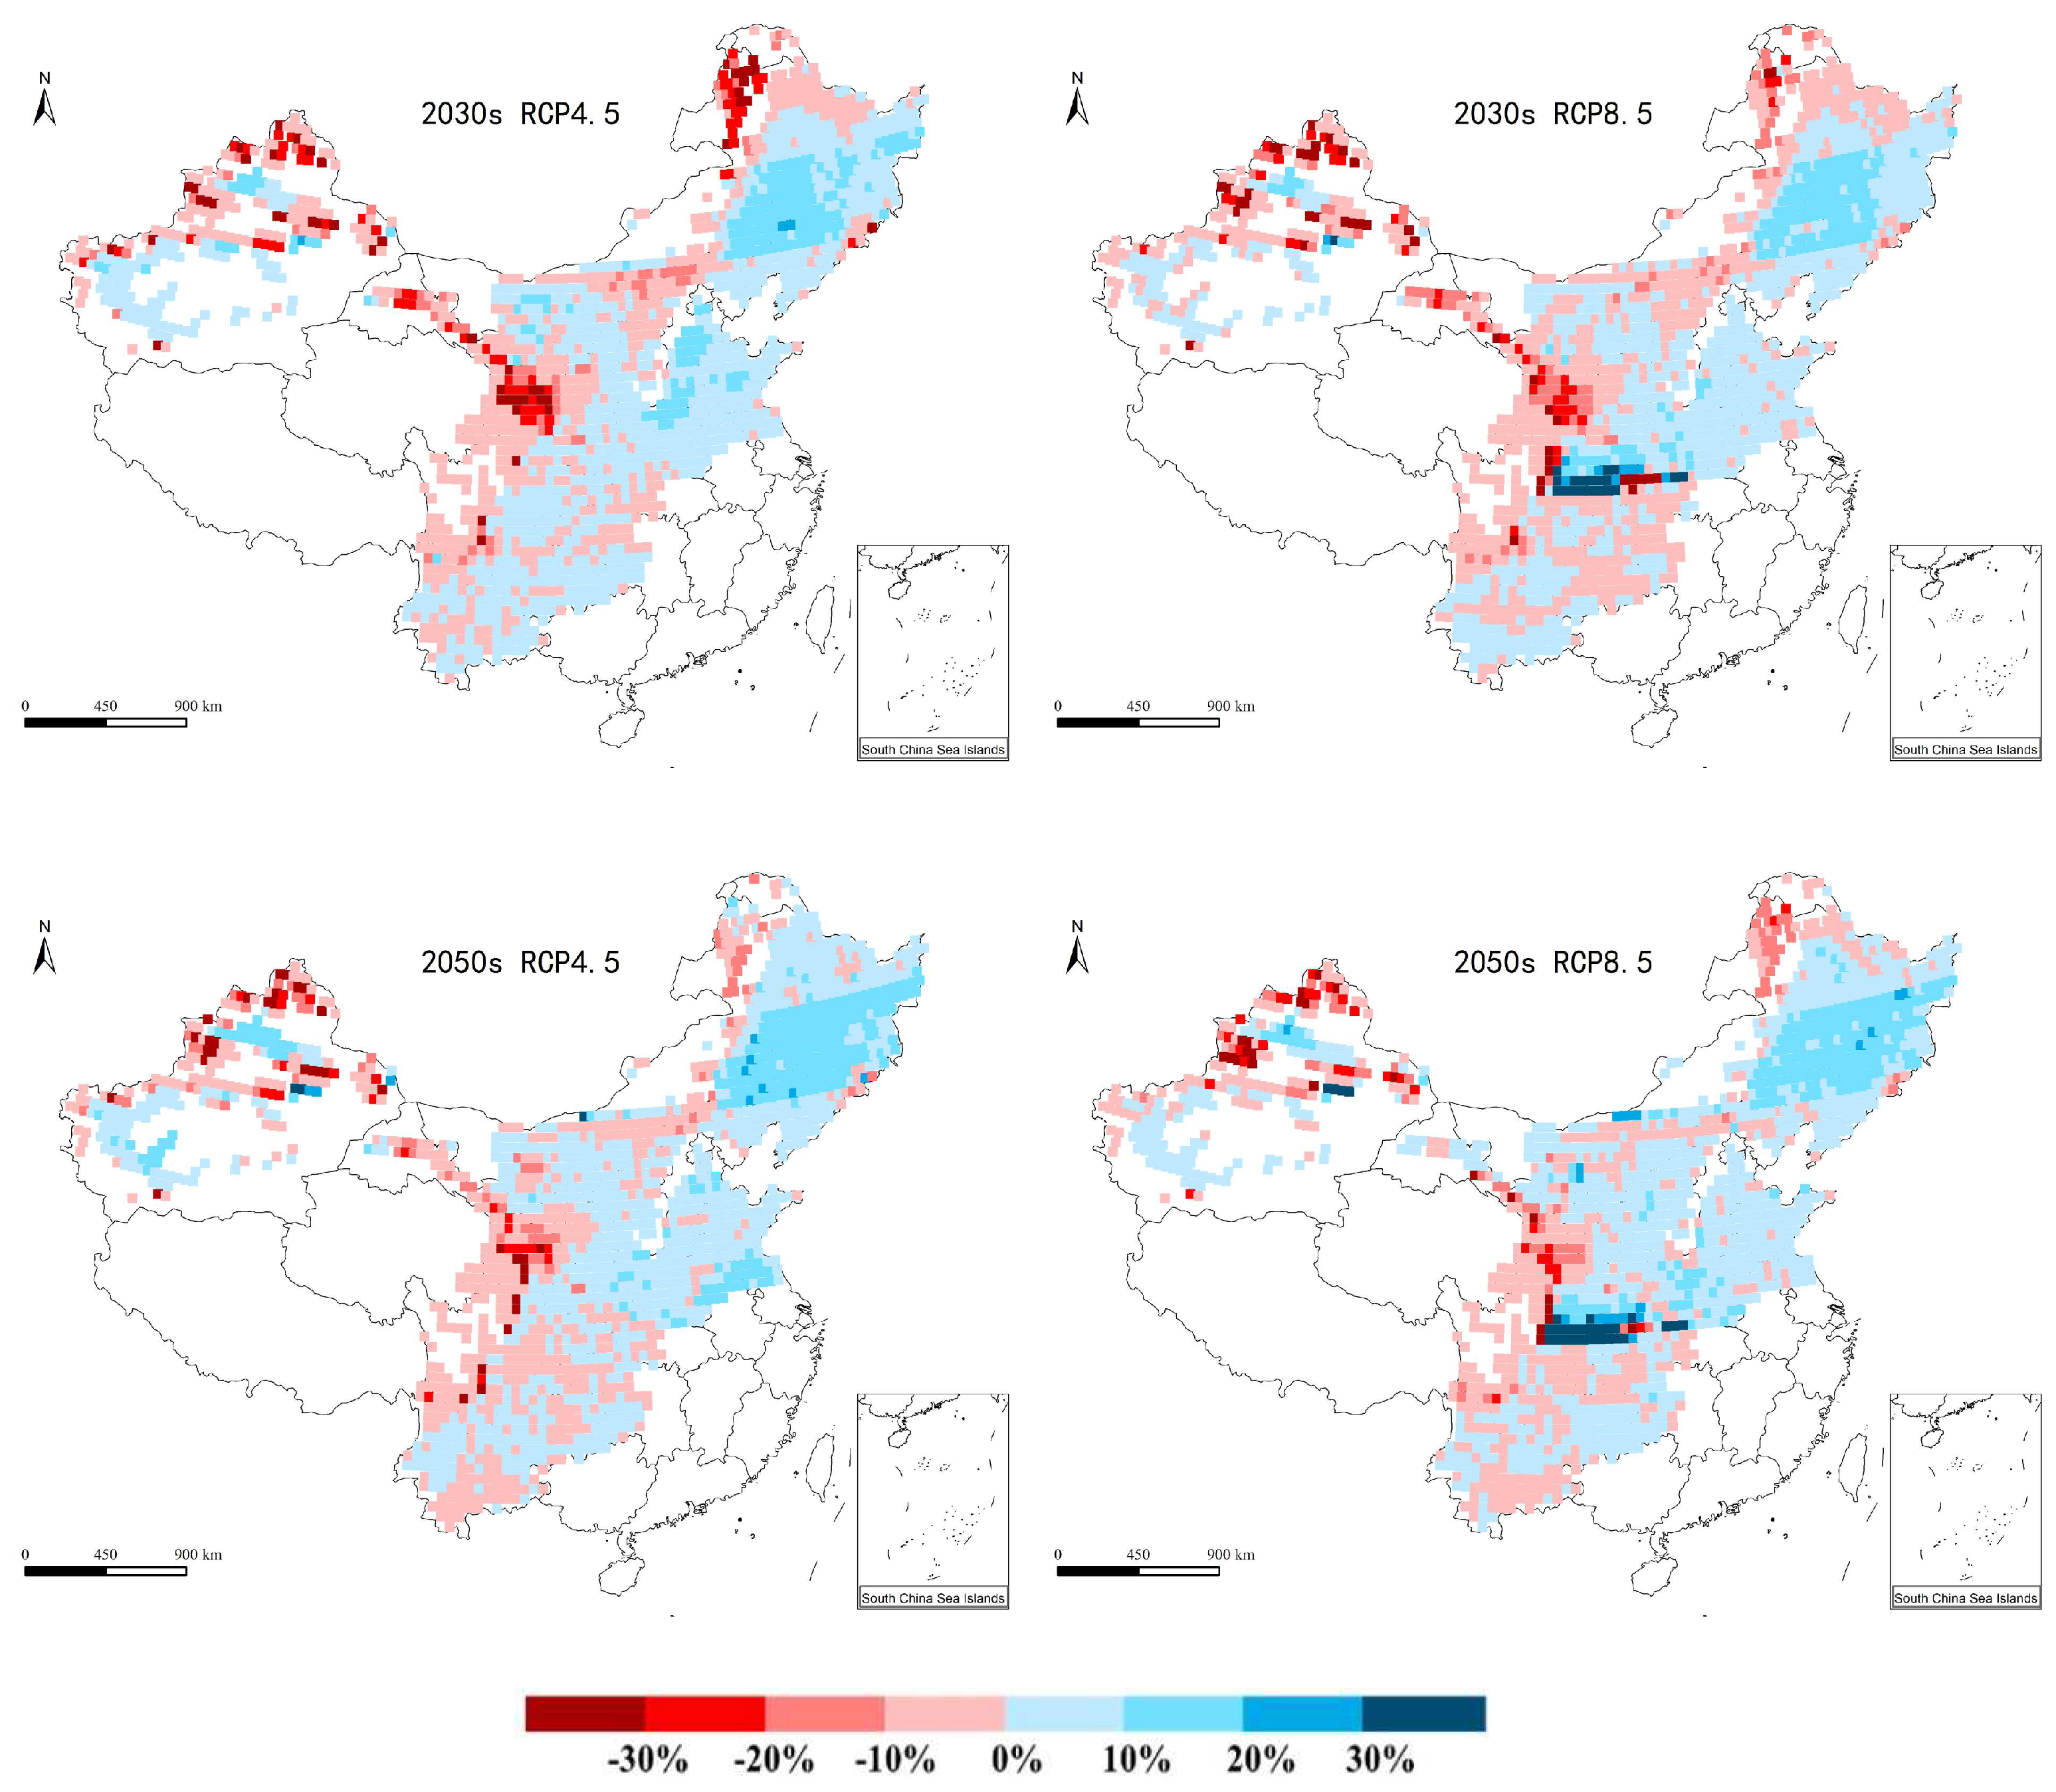
3.2. Yield Changes of Maize under Future Scenarios

Based on climate scenario data (RCP4.5, RCP8.5) of the 2030s and 2050s simulated by the regional climate model PRECIS, under the condition that maize varieties, water and fertilizer management in each region remain unchanged, the CERES-Maize model was applied to simulate the per unit yield of maize in the future. The relative changes of maize yield in different periods and different scenarios relative to the baseline (1986–2005) were analyzed, and the impacts of future climate change on maize growth in China evaluated.
It can be seen from Figure 4 that future climate change will have a significant impact on China’s maize production, for which the area of yield increase accounts for 35–43% and the area of yield reduction accounts for 57–65%. Under different scenarios and different time periods, the future changes of maize yield show a relatively similar spatial distribution. The regions of future yield increase are mainly distributed in the northwest and southeast of Heilongjiang, the east of Jilin, the east and central of Inner Mongolia, most of Ningxia, the west of Shaanxi and the east and north of Gansu. There is a slight increase of yield in the north of Xinjiang, the northwest of Yunnan and the south of Sichuan, while most of other regions show a trend of yield reduction.
In the 2030s, under the RCP 4.5 scenario, the maize yield per unit shows a rising trend, with an average increase of 5.66% nationwide. Under the RCP 8.5 scenario, the maize yield per unit shows a declining trend, with an average reduction of 1.25%. In the 2050s, under both the RCP 4.5 and RCP 8.5 scenarios, the maize yield per unit shows a more serious trend of reduction, with −5.43% and −12.62%, respectively. Especially under the RCP 8.5 scenario, more than 70% of maize production area would decrease severely. The reduction area of maize production would account for 61–66% in the 2030s, which would expand to 69% in 2050s, especially under the RCP 8.5 scenario.
From the perspective of regional distribution (Figure 5), most of the main maize producing areas show an obvious trend of yield reduction, especially in Huang-Huai-Hai region and the southwest region. There would be an obvious trend of yield increase in the northern region, and future yield increase opportunities and yield reduction risks would coexist in the northeast region and northwest region. In the future, under both RCP 4.5 and RCP 8.5 scenarios, the reduction range of maize yield per unit is from −50% to −10% in the Huang-Huai-Hai region and southwest region, whereas the reduction range of maize yield per unit is from −40% to 20% in the northeast region, in which most areas show a declining trend and a few areas show a rising trend. The reduction range of maize yield per unit is from −40% to 40% in the northwest region, and the reduction range of maize yield per unit is from −30% to 60% in the northern region, in which most areas show a rising trend.
On the whole, if no response measures are taken, the reduction risk of maize yield in China will gradually increase in the future, especially under the RCP 8.5 scenario. In the 2050s, China’s maize production will face the greatest risk of yield reduction under the RCP 8.5 scenario; however, in the 2030s, the threat faced by maize production is relatively small under the RCP 4.5 scenario, and there is a potential to increase maize yield in some regions.

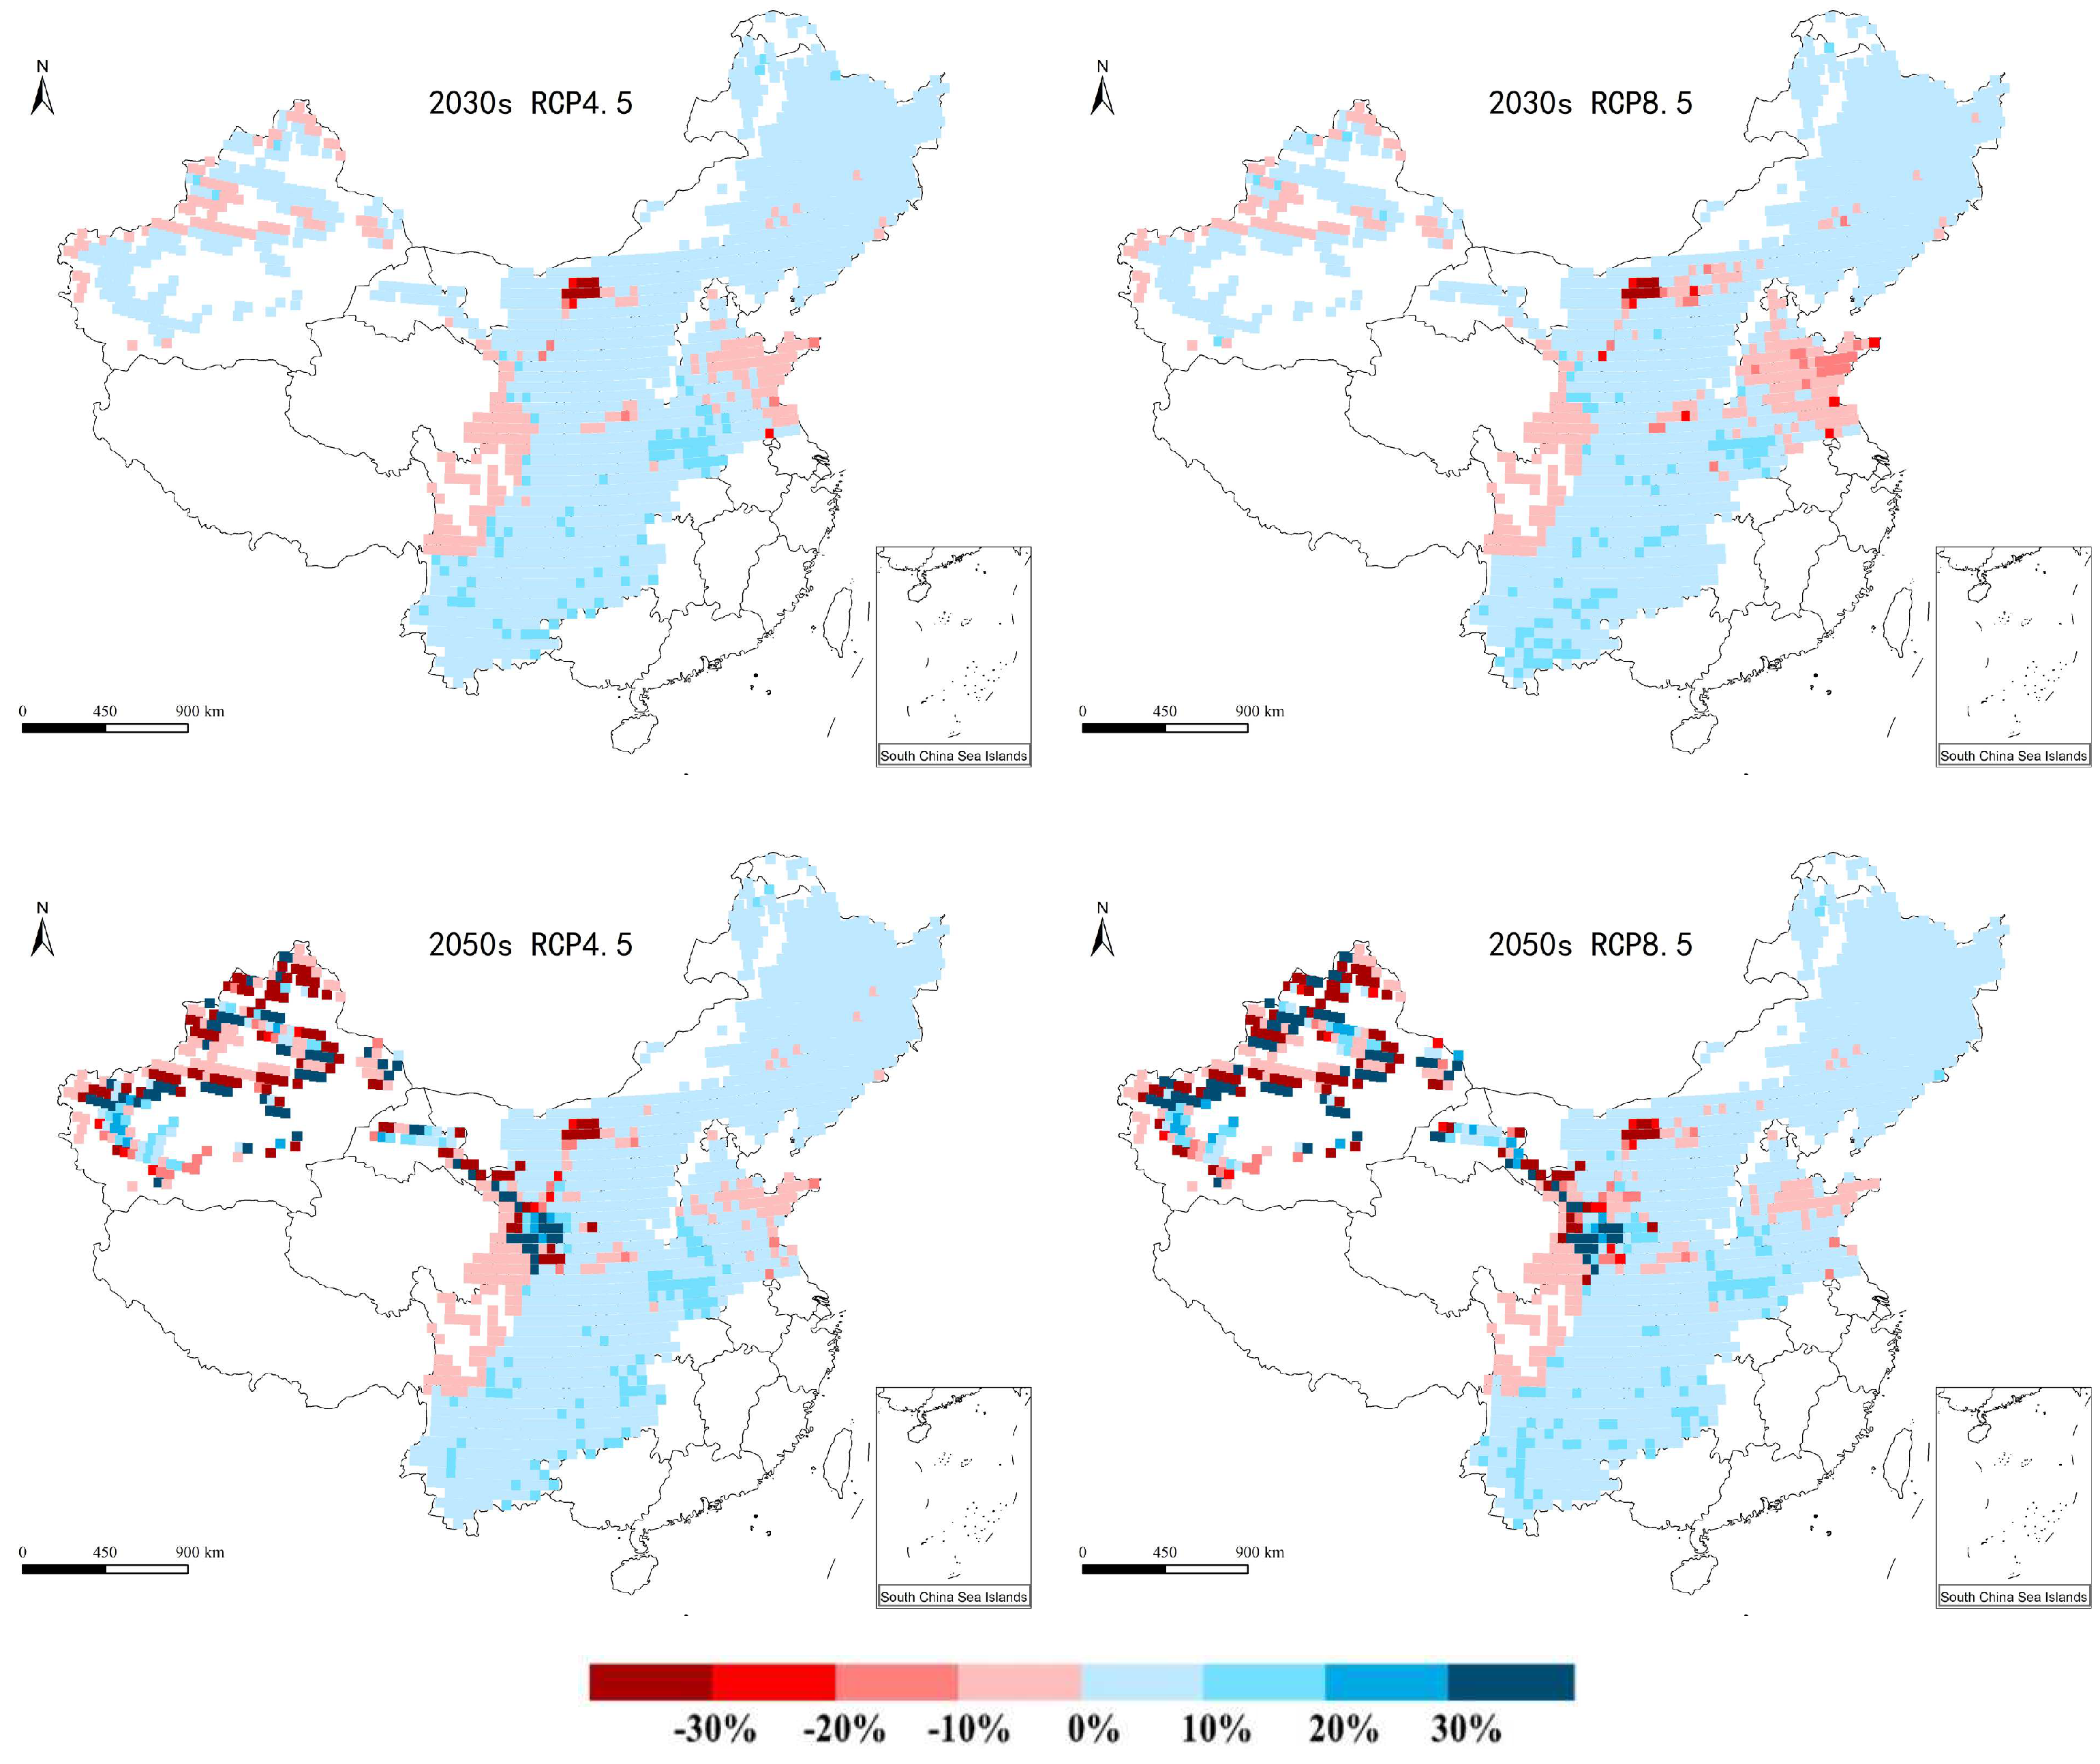
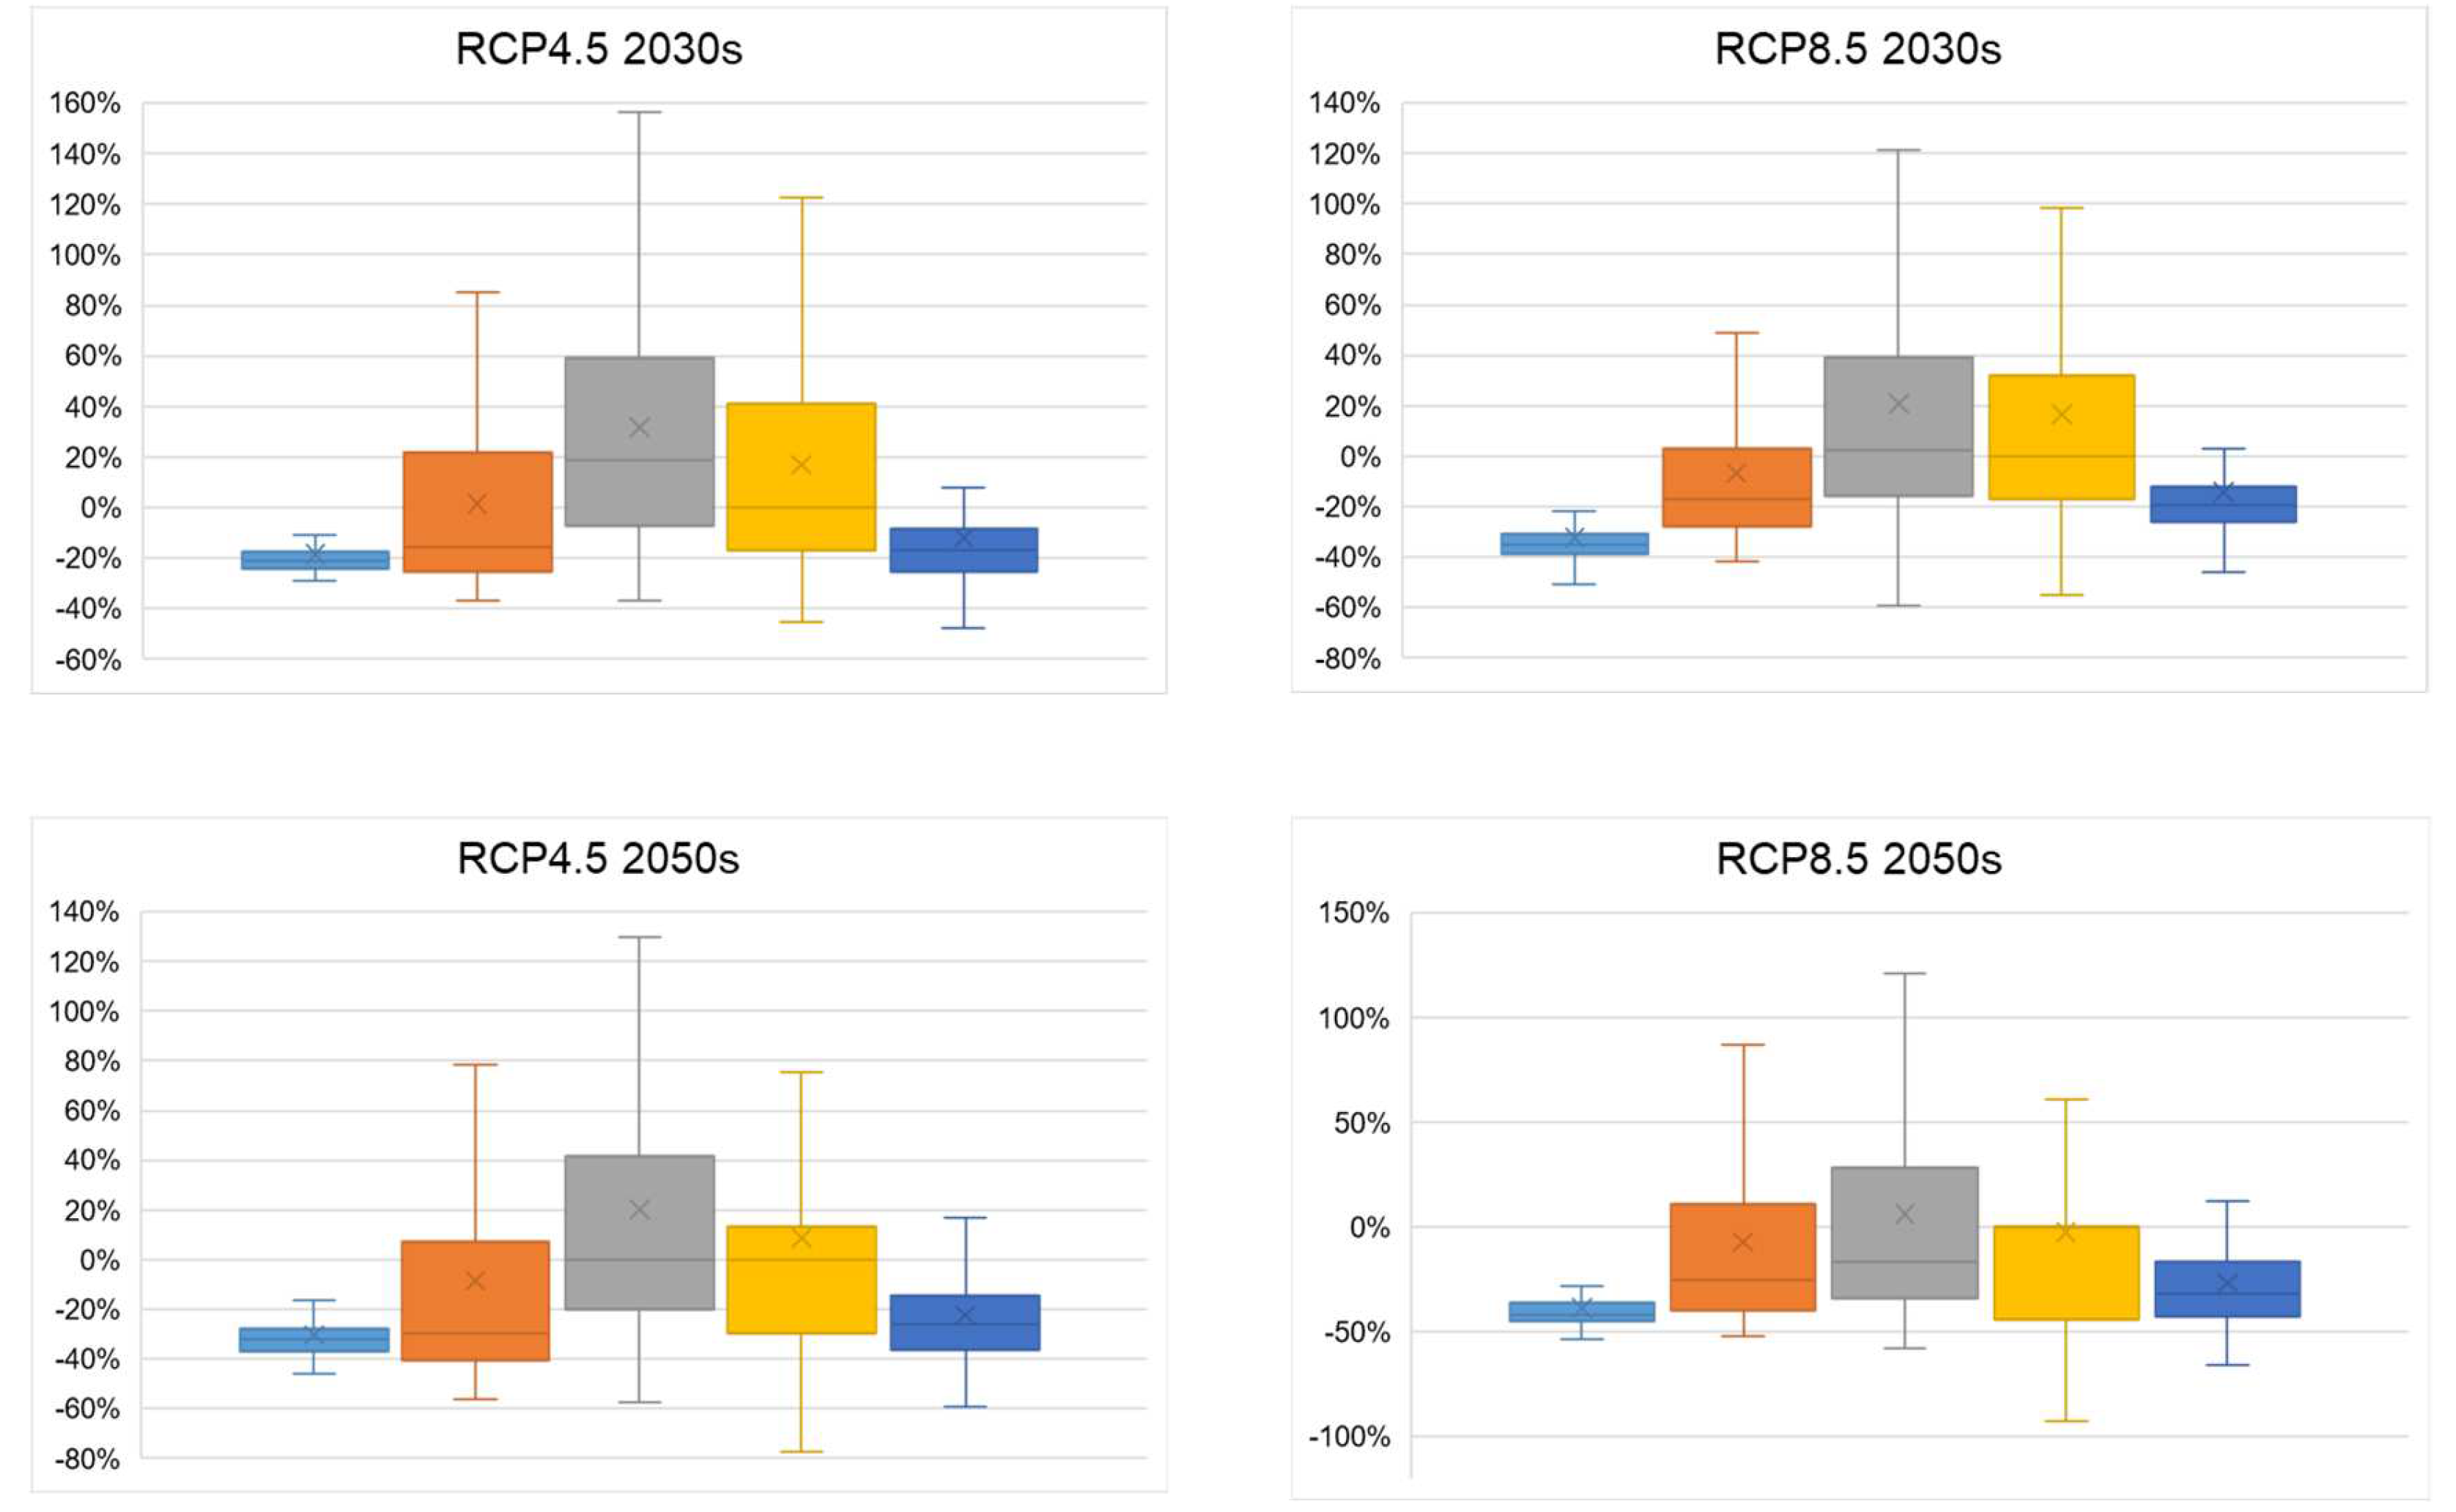
3.3. Impacts of Different Adaptation Strategies on Maize Yield

3.3.1. Adjustment of Sowing Date

Adjusting the sowing date of crops could change the allocation of solar radiation, temperature, water and heat resource during the crop growth period, which would make full use of climatic resources to gain advantages and avoid harm. In the context of climate change, with global warming the temperature in the growing season of maize will also change significantly. On the premise of keeping the maize varieties, soil properties and other farmland management measures unchanged, adjusting the maize sowing date would have a significant impact on maize yield. In order to find out the suitable sowing date of maize under future climate change, two scenarios were set: 5 days before the conventional sowing date and 5 days after the conventional sowing date. The impacts of sowing date adjustment on maize growth and yields in different regions were analyzed.
Compared with the scenario without treatment measures, the impact of sowing date adjustment on maize production is relatively small, showing a coexist trend of both yield reduction and yield increase, in which the area of future yield increase accounts for 50–68%, and the area of yield reduction accounts for 21–50%. Under the RCP 4.5/8.5 scenarios and different periods, the changes of maize yield show a relatively similar spatial distribution when sowing date is brought forward 5 days relative to common practice (Figure 6). The reduction areas of maize yield are mainly distributed in central Heilongjiang, southern Liaoning, most of northern China, central Inner Mongolia, northern and western Xinjiang, southern Gansu, northern Ningxia, western Sichuan, most of Guizhou, northern and southern Yunnan. It is also scattered in Chongqing, Shaanxi and Jilin, whereas the other regions show a trend of increase. If the sowing date is postponed by 5 days, the reduction area of maize yield would decrease significantly, which would be distributed in northern Heilongjiang, central and northern Inner Mongolia, northern Xinjiang, southern Gansu, western and central Sichuan and southern Yunnan. It would be also scattered in Shaanxi, Guizhou, Chongqing, Liaoning and north China. The other regions would have a trend of increase (Figure 7).
Compared to a scenario without treatment measures, in the 2030s, the maize yield per unit would increase by 2.8% on average when the sowing date is advanced by 5 days under the RCP 4.5 scenario, and would increase by 4.0% under the RCP 8.5 scenario. In the 2050s, the maize yield per unit in average would also go up, but less than that in the 2030s. The change rates of maize yield per unit would increase by 1.3% under RCP 4.5 and 1.6% under RCP 8.5. When the sowing date is delayed by 5 days, in the 2030s the maize yield per unit in average would decline by 0.38% under RCP 4.5 and reduce by 0.7% under RCP 8.5. In the 2050s, the change rates of maize yield per unit would increase by 1.1% under RCP 4.5 and 2.5% under RCP 8.5.
Compared with the scenario without treatment measures, most of the main maize producing areas show a significant increase in yield per unit, especially in the northeast region, northern region and northwest region, when the sowing date is advanced by 5 days under future climate change. In the Huang-Huai-Hai region, there is an obvious trend of maize yield reduction, for which the range is from −10% to 0%. In the southwest region, increasing opportunities and reducing risks coexist for maize yield per unit, for which the range is from −5% to 5%. In the northeast region, northern region and northwest region, most areas show a trend of increasing production, and a small part shows a trend of decreasing production, for which the range is from −5% to 15%. When the sowing date is delayed by 5 days under future climate change, there is significant differences on maize yield from the countermeasure of advancing sowing date by 5 days. In the Huang-Huai-Hai region, there is an obvious trend of maize yield increasing, for which the range is from 0% to 10%. In the southwest region, increasing opportunities and reducing risks coexist for maize yield per unit, for which the range is from −5% to 5%. In the northeast region, the maize yield per unit in most area goes up basically from 0% to 15%. In the northern region and northwest region, most areas show a trend of decreasing production, and a small part shows a trend of increasing production, for which the range is from −5% to 15%.
On the whole, for national maize planting under future climate change, a sowing date in advance would be more conducive to maize production than delaying sowing date. But there are some differences of maize yield changes in different regions. In the Huang-Huai-Hai region and northeast region, the delay of sowing date would be more beneficial to maize yield, while in the northern region and northwest region, the advance of sowing date would be more beneficial to maize yield. There is no obvious impact on maize in the southwest region by either advancing sowing date or delaying sowing date.

3.3.2. Varieties Adjustment

Variety is the key factor restricting maize yield. Different maize varieties have different characteristics, and the main varieties in different regions are often different. The dominant varieties in a region are often better matched with the local climate, soil and ecological environment. With climate change, environmental elements such as water, soil, climate, and other environmental factors are changing in each region, so the requirements for maize varieties are also changing. In order to better clarify the breeding direction of future maize varieties, an attempt to adjust the varieties based on CERES-maize was done in this research, in which the impacts of different maize varieties on the yield under future climate change in China were compared and analyzed.
Compared with no countermeasures on maize under future climate change, variety adjustment has a more obvious impact on maize production in China, showing a trend of coexistence of yield reduction and increase. The area of yield increase accounts for 84–94% and the area of yield reduction accounts for 6–16%. Under different scenarios and different time periods, when the maize varieties with improved grain filling rate are bred, the changes of future maize yield show a relatively similar spatial distribution. The yield reduction areas are mainly distributed in the east of the Huang-Huai-Hai region, central Inner Mongolia, north and west of Xinjiang, west of Sichuan, and north of Yunnan. There is also a slight decline of maize yield in Gansu and Ningxia, whereas most of other regions show a trend of increasing yield. Compared with varieties with improved grain filling rate (Figure 8), future maize yield changes would have a different spatial distribution, for which varieties is breeding to prolong silking-mature growth time; the yield reduction area would increase, mainly distributed in central and northern Inner Mongolia, northern Xinjiang, southern and western Gansu, western Sichuan, northern Yunnan and Shaanxi; most of other regions show a trend of increasing yield.
Compared with the scenario without treatment measures, in the 2030s, the maize yield per unit would increase by 6.5% on average when the varieties with improved grain filling rate are applied under the RCP 4.5 scenario, and would increase by 5.9% under the RCP 8.5 scenario. In the 2050s, the maize yield per unit in average would also go up, but less than that in 2030s. The change rates of maize yield per unit would increase by 4.0% under the RCP 4.5 and 4.4% under RCP 8.5. If varieties with prolonged silking-mature growth time are planted in the 2030s, the maize yield per unit in average would increase by 8.0% under RCP 4.5 and go up by 7.1% under RCP 8.5. In the 2050s, the change rates of maize yield per unit would increase by 7.1% under RCP 4.5 and 7.4% under RCP 8.5 (Figure 9).
Compared with the scenario without treatment measures, most of the main maize producing areas show a significant increase in yield per unit, especially in the northeast region, northern region and southwest region, when the varieties with improved grain filling rate are applied under future climate change. In Huang-Huai-Hai region, the opportunities of increasing yield and the risks of reducing yield coexist, for which the range is from −5% to 10% in 2030s; there is an obvious rising trend of maize yield per unit in 2050s, for which the range is from 0 to 10%. In the northwest region, maize yield per unit would go up significantly in 2030s, for which the range is from 5% to 10%; however, in the 2050s, maize yield per unit would have a declining trend, for which the range is from −50% to 10%. In the northeast region, southwest region and northern region, there is an obvious trend of increase on maize yield per unit, for which the range is from 5% to 10%. When varieties with prolonged silking-mature growth time are planted, most of the regions show a trend of increasing production on maize yield per unit under RCP 4.5 and RCP 8.5 scenarios in the Huang-Huai-Hai region, northeast region, southwest region and northern region, for which the range is from 0% to 15%. In the northwest region, the maize yield per unit would go up in the 2030s, but there is a declining trend of maize yield per unit in 2050s, for which the range is from −50% to 10%.
On the whole, for national maize planting under future climate change, heat during the maize growth season will increase significantly. If the growth time of maize silking maturity could be prolonged and the accumulated temperature during silking maturity could be increased, we could effectively increase the dry matter accumulation of corn grains, which would have an obvious yield increase effect. However, the maize yield would also increase when varieties with improved grain filling rate are applied, but with a smaller effect than the former countermeasure. Therefore, in the future, breeding maize varieties that extend the growth duration of silking maturity and improve the grain filling rate could effectively make use of water, heat, radiation and other climate resources under future climate change, and play a positive role in ensuring the future maize yield.

4. Discussion and Conclusions

4.1. Discussion

Due to climate change, it would effectively alleviate the negative impacts of climate change on maize production to take appropriate adaptation measures, such as adjusting sowing date, full irrigation and cultivating varieties with long growth period. Adjusting maturity type of maize has a more obvious effect on yield reduction in the main maize production areas of northeast China and the Huang Huai Hai region. On the other hand, in the future, breeding maize varieties that extend growth duration from silking to maturity, or improving the grain filling rate, would effectively make use of water, heat, radiation and other climate resources under future climate scenarios, and play a positive role in ensuring the future maize yield. Our findings are consistent with other studies [35,36] which indicate that the use of maize varieties with longer growing periods among other adaptation measures can help increase maize yield under future climate change.
In summary, if global warming becomes more serious, the comprehensive adverse impacts on maize would be much greater. On the one hand, with temperature rising, evapotranspiration would become greater. Although precipitation may be also increasing, the evapotranspiration caused by warming is more intense, resulting in frequent droughts during the growth period of maize, which would have an obvious impact on yield. On the other hand, compared with the 2030s, the frequency and intensity of high-temperature disasters in 2050s would be significantly increased, resulting in an increased risk of maize yield reduction. The findings are similar with the research done by Koimbori et al. [37] and Li et al. [19]. Therefore, it is necessary to strengthen variety breeding, agricultural infrastructure improvement and farming technology innovation.
In the 2030s, under the RCP 4.5 scenario, climate change is advantageous for maize production in the northern region. On the one hand, the range of temperature increase in the northern region would be lower than that in most other regions, which is basically between 0 °C and 1 °C, which could provide excellent conditions for maize growth. On the other hand, precipitation in the northern region would mainly rise between 0 and 200 mm, which also lays a foundation for maize yield increase. In the 2030s, under the RCP8.5 scenario, the maize yield in the northern region would be reduced, but not obviously, with a temperature increase range between 1–2 °C, and precipitation increase by 0–200 mm. Our findings show no difference with previous results [38,39,40] which reveal similar trends of temperature and precipitation in the future. The excessive temperature increase offsets the beneficial impact of the increase of precipitation and increases the risk of extreme climate events in the future. In other words, from 2020 to 2030, if the global warming can be effectively reduced, corn in the northern region still has the potential to increase production.

4.2. Conclusions

Climate change could significantly shorten the growing period of maize and further lead to large and widespread reductions in current maize producing areas. If no countermeasures are taken, the reduction risk of maize yield in China would gradually increase. Especially under the RCP 8.5 scenario in the 2050s, maize production would face the greatest risk of yield reduction.
On the other hand, with global warming, the maize planting boundary would move northward, and the suitable maize planting areas in northern China and northeast China would increase, in which the increase of maize yield would offset the expected maize yield reduction in other regions to a certain extent. Especially in the 2030s under the RCP4.5 scenario, the threat to maize yield in China would be relatively small, and there is some potential to increase yield for the whole country.
Under future climate change scenarios, the countermeasure of earlier sowing date would be more beneficial to maize production as a whole compared to a delayed sowing date, for which there are certain differences in different regions. If the growth time of maize from silking to maturity can be prolonged, the accumulated temperature in the silking-maturity period could be increased, which could effectively increase the dry matter accumulation of maize grains, and would significantly increase the yield of maize. The effect of increasing grain filling rate on yield increase is obvious, but smaller than the countermeasure of increasing the growth time of maize from silking to maturity.

Author Contributions

Conceptualization: K.L. and L.G.; methodology, K.L. and L.G.; software, J.P. and K.L.; validation, K.L. and L.G.; formal analysis, M.L.; investigation, K.L.; resources, J.P., K.L. and L.G.; data processing, J.P., K.L. and M.L.; writing—original draft preparation, K.L.; writing—review and editing K.L. and L.G.; visualization, K.L.; supervision, K.L. and L.G.; project administration, K.L. and L.G. funding acquisition, L.G. All authors have read and agreed to the published version of the manuscript.

Funding

This research was funded by the National Key R&D program of China Approval No. 2017YFD0300301. The Agricultural Science and Technology Innovation Program of the Chinese Academy of Agricultural Sciences also supported this study.

Institutional Review Board Statement

Not applicable.

Informed Consent Statement

Not applicable.

Data Availability Statement

China Meteorological Agricultural Meteorological Experimental Stations (AMESs; http://data.cma.cn/) (accessed on 20 May 2022); Chinese soil scientific database (http://vdb3.soil.csdb.cn) (accessed on 10 May 2022).

Conflicts of Interest

The authors declare no conflict of interest.

References

  1. IPCC. Summary for Policymakers. In Climate Change 2022: Impacts, Adaptation and Vulnerability. Contribution of Working Group II to the Sixth Assessment Report of the Intergovernmental Panel on Climate Change; Cambridge University Press: Cambridge, UK, 2022. [Google Scholar]
  2. Chao, Q.C.; Zhang, Y.X.; Gao, X.; Wang, M. Paris Agreement: A new start for global governance on climate. Clim. Change Res. 2016, 12, 61–67. [Google Scholar]
  3. IPCC. Summary for Policymakers. In Climate Change 2021: The Physical Science Basis. Contribution of Working Group I to the Sixth Assessment Report of the Intergovernmental Panel on Climate Change; Cambridge University Press: Cambridge, UK, 2021. [Google Scholar]
  4. Xu, Y.L.; Zhao, Y.C.; Zhai, P.M. Advances in scientific understanding on climate change and food security from IPCC special report SRCCL. Clim. Change Res. 2020, 16, 37–49. [Google Scholar]
  5. Ding, R.; Shi, W.J. Quantitative evaluation of the effects of climate change on cereal yields of Tibet during 1993–2017. Acta Geogr. Sin. 2022, 32, 101–116. [Google Scholar]
  6. Lobell, D.B.; Schlenker, W.; Costa-Roberts, J. Climate trends and global crop production since 1980. Science 2011, 333, 616–620. [Google Scholar] [CrossRef] [PubMed] [Green Version]
  7. Li, Y.J.; Wang, C.Y.; Zhao, B.; Liu, W.J. Effects of climate change on agricultural meteorological disaster and crop insects diseases. Trans. CSAE 2010, 26, 263–271. [Google Scholar]
  8. Li, G.; Li, Y.; Huang, G.B.; Luo, Z.Z.; Wang, Q.; Liu, Q.; Yan, Z.G.; Zhao, Y.Y. The effects of climate change on Dryland wheat production under different tillage systems. Acta Prataculturae Sin. 2012, 21, 160–168. [Google Scholar]
  9. Cao, L.; Zhao, P.; Yan, Z.; Jones, P.; Zhu, Y.; Yu, Y.; Tang, G. Instrumental temperature series in eastern and central China back to the nineteenth century. J. Geophys. Res. Atmos. 2013, 118, 8197–8207. [Google Scholar] [CrossRef]
  10. Ren, G.; Ding, Y.; Zhao, Z.; Zheng, J.; Wu, T.; Tang, G.; Xu, Y. Recent progress in studies of climate change in China. Adv. Atmos. Sci. 2012, 29, 958–977. [Google Scholar] [CrossRef]
  11. IPCC. Climate Change 2014: Impacts, Adaptation, and Vulnerability; Cambridge University Press: Cambridge, UK, 2014.
  12. Zhao, Y.X.; Xiao, D.P.; Tang, J.Z.; Bai, H.Z. Effects of climate change on the yield of major grain crops and its adaptation measures in China. Res. Soil Water Conserv. 2019, 26, 317–326. [Google Scholar]
  13. Xiao, L.J.; Liu, L.L.; Asseng, S.; Xia, Y.M.; Tang, L.; Liu, B.; Cao, W.X.; Zhu, Y. Estimating spring frost and its impact on yield across winter wheat in China. Agric. For. Meteorol. 2018, 260, 154–164. [Google Scholar]
  14. Yang, J.M.; Yang, J.Y.; Jiang, X. Progress of crop model research. J. Jilin Agric. Univ. 2012, 34, 553–561. [Google Scholar]
  15. Kocsis, M.; Dunai, A.; Mako, A.; Farsang, A.; Meszaros, J. Estimation of the drought sensitivity of Hungarian soils based on corn yield responses. J. Maps 2019, 16, 148–154. [Google Scholar] [CrossRef]
  16. Lobell, D.B.; Roberts, M.J.; Schlenker, W.; Braun, N.; Little, B.B.; Rejesus, R.M.; Hammer, G.L. Greater sensitivity to drought accompanies maize yield increase in the US Midwest. Science 2014, 344, 516–519. [Google Scholar] [CrossRef]
  17. Huang, S.; Lv, L.; Zhu, J.; Li, Y.; Tao, H.; Wang, P. Extending growing period is limited to offsetting negative effects of climate changes on maize yield in the North China Plain. Field Crops Res. 2018, 215, 66–73. [Google Scholar] [CrossRef]
  18. Lv, S.; Yang, X.G.; Zhao, J.; Liu, Z.J.; Li, K.N.; Mu, C.Y.; Chen, X.C.; Chen, F.J.; Mi, G.H. Effects of climate change and variety alternative on potential yield of spring maize in Northeast China. Trans. Chin. Soc. Agric. Eng. 2013, 29, 179–190. [Google Scholar]
  19. Li, K.; Xiong, W.; Pan, J.; Lin, E.; Li, Y.; Han, X. Trend evaluation on changes of maize yield in China under global warming by 1.5 °C and 2 °C. Chin. J. Agrometeorol. 2018, 39, 765–777. [Google Scholar]
  20. Li, M.-Y.; Gao, X.-N.; Pan, J.; Xiong, W.; Guo, L.-P.; Lin, E.-D.; Li, K. Possible trends of rice yield in China under global warming by 1.5 °C and 2.0 °C. J. Nat. Resour. 2021, 36, 567–581. [Google Scholar] [CrossRef]
  21. Lobell, D.B.; Burke, M.B. On the use of statistical models to predict crop yield responses to climate change. Agric. For. Meteorol. 2010, 150, 1443–1452. [Google Scholar] [CrossRef]
  22. Ma, Y.L.; Wang, Z.W.; Luan, Q.; Hu, L.W.; Zhang, A.Z. Relation between maize yield and eco-climate factors. Chin. J. Agrometeorol. 2009, 30, 565–568. [Google Scholar]
  23. Zipper, S.C.; Qiu, J.; Kucharik, C.J. Drought effect on US maize and soybean production: Spatiotemporal patterns and historical changes. Environ. Res. Lett. 2016, 11, 094021. [Google Scholar] [CrossRef]
  24. Ray, R.L.; Fares, A.; Risch, E. Effects of drought on crop production and cropping areas in Texas. Agric. Environ. Lett. 2018, 3, 170037. [Google Scholar] [CrossRef] [Green Version]
  25. Schlenker, W.; Lobell, D.B. Robust negative impacts of climate change on African agriculture. Environ. Res. Lett. 2010, 5, 01410. [Google Scholar] [CrossRef]
  26. Zhao, C.; Liu, B.; Piao, S.L.; Wang, X.H.; Lobell, D.B.; Huang, Y.; Huang, M.T.; Yao, Y.T.; Bassu, S.; Ciais, P.; et al. Temperature increase reduces global yields of major crops in four independent estimates. Proc. Natl. Acad. Sci. USA 2017, 114, 9326–9331. [Google Scholar]
  27. Xie, L.Y.; Ma, Z.Y.; Gao, X.N.; Tong, C.F.; Lin, E.D. FACE and its limitations on researches of impacts of elevated CO2 on crops. J. China Agric. Univ. 2008, 13, 23–28. [Google Scholar]
  28. Zhang, Z.T.; Yang, X.G.; Gao, J.Q.; Wang, X.L.; Bai, F.; Sun, S.; Liu, Z.J.; Ming, B.; Xie, R.Z.; Wang, K.R.; et al. Analysis of suitable sowing date for summer maize in North China Plain under climate change. Sci. Agric. Sin. 2018, 51, 3258–3274. [Google Scholar]
  29. Cui, Y.; Jiang, S.M.; Jin, J.L.; Ning, S.W.; Feng, P. Quantitative assessment of soybean drought loss sensitivity at different growth stages based on shaped damage curve. Agric. Water Manag. 2019, 213, 821–832. [Google Scholar] [CrossRef]
  30. Liu, Y.J.; Ya, Q.; Ge, Q.S. Spatiotemporal Differentiation of Changes in Maize Phenology in China from 1981 to 2010. J. Geogr. Sci. 2019, 29, 351–362. [Google Scholar] [CrossRef] [Green Version]
  31. Zhou, L.; Pan, J.; Zhang, L.; Xu, Y.L. Analysis on statistical bias correction of daily precipitation simulated by regional climate model. J. Trop. Mereorol. 2014, 30, 137–144. [Google Scholar]
  32. Xu, Y.L.; Pan, J.; Feng, Q.; Lin, Y.H.; Li, K. Prediction of Future Climate Change in China-Constructing SRES High-Resolution Climate Scenarios Using PRECIS; Science Press: Beijing, China, 2016; pp. 198–200. [Google Scholar]
  33. Ruane, A.C.; Goldberg, R.; Chryssanthacopoulos, J. Climate forcing datasets for agricultural modeling: Merged products for gap-filling and historical climate series estimation. Agric. For. Meteorol. 2015, 200, 233–248. [Google Scholar] [CrossRef] [Green Version]
  34. Hoogenboom, G.; Jones, J.; Wilkens, P.; Porter, C.; Boote, K.; Hunt, L.D.; Singh, U.; Lizaso, J.I.; White, J.M.; Uryasev, O.; et al. Decision Support System for Agrotechnology Transfer (DSSAT) Version 4.6; DSSAT Foundation, Prosser: Washington, DC, USA, 2015; Available online: http://dssat.net (accessed on 30 May 2022).
  35. Mi, N.; Cai, F.; Zhang, S.; Zhang, Y.; Ji, R.; Chen, N.; Ji, Y.; Wang, D. Thermal Time Requirements for Maize Growth in Northeast China and Their Effects on Yield and Water Supply under Climate Change Conditions. Water 2021, 13, 2612. [Google Scholar] [CrossRef]
  36. Xu, F.; Wang, B.; He, C.; Liu, D.; Feng, P.; Yao, N.; Zhang, R.; Xu, S.; Xue, J.; Feng, H.; et al. Optimizing Sowing Date and Planting Density Can Mitigate the Impacts of Future Climate on Maize Yield: A Case Study in the Guanzhong Plain of China. Agronomy 2021, 11, 1452. [Google Scholar] [CrossRef]
  37. Koimbori, J.K.; Wang, S.; Pan, J.; Guo, L.; Li, K. Yield Response of Spring Maize under Future Climate and the Effects of Adaptation Measures in Northeast China. Plants 2022, 11, 1634. [Google Scholar] [CrossRef]
  38. Lin, Y.; Wu, W.; Ge, Q. CERES-Maize model-based simulation of climate change impacts on maize yields and potential adaptive measures in Heilongjiang Province, China. J. Sci. Food Agric. 2015, 95, 2838–2849. [Google Scholar] [CrossRef] [PubMed]
  39. Zhao, J.; Yang, X. Spatial patterns of yield-based cropping suitability and its driving factors in the three main maize-growing regions in China. Int. J. Biometeorol. 2019, 63, 1659–1668. [Google Scholar] [CrossRef]
  40. Yin, Y.; Tang, Q.; Liu, X. A multi-model analysis of change in potential yield of major crops in China under climate change. Earth Syst. Dyn. 2015, 6, 45–59. [Google Scholar] [CrossRef] [Green Version]
Figure 1. Seven zones of maize planting in China. (I: northeast region; II: northern region; III: Huang Huai Hai region; IV: northwest region; V: southwest region; VI: southern region; VII: Qinghai Tibet plateau region).
Sustainability 14 09246 g001
Figure 2. Comparison of temperature changes in China under RCP 4.5 and RCP 8.5 scenarios in the 2030s and 2050s (relative to the baseline of 1986–2005).
Sustainability 14 09246 g002
Figure 3. Comparison of precipitation changes in China under the RCP 4.5 and RCP 8.5 scenarios in the 2030s and 2050s (relative to the baseline of 1986–2005).
Sustainability 14 09246 g003
Figure 4. Impacts of climate change on maize yield.
Sustainability 14 09246 g004
Figure 5. Impacts of climate change on maize yield in Huang-Huai-Hai region, Northeast region, Northern region, Northwest region and Southwest region. (Upper left: RCP 4.5, 2030s; Upper right: RCP 8.5, 2030s; Lower left: RCP 4.5, 2050s; Lower right: RCP 8.5, 2050s).
Sustainability 14 09246 g005
Figure 6. Impacts of 5 days in advance than conventional sowing date on maize yield.
Sustainability 14 09246 g006
Figure 7. Impacts of 5 days later than conventional sowing date on maize yield.
Sustainability 14 09246 g007
Figure 8. Impacts of the varieties adjustment with improved grain filling rate on maize yield under climate change.
Sustainability 14 09246 g008
Figure 9. Impacts of the varieties adjustment with prolonged silking-mature growth time on maize yield under climate change.
Sustainability 14 09246 g009
Table 1. Genetic parameters of maize in different maize planting regions.
ZonesRegionsP1P2P5G2G3PHINTNRMSE
ADAPMDAPHWAM
North zone1st district196.40.211637.6452.411.01492.00%3.69%6.17%
2nd district219.71.309655.1390.515.44493.03%3.54%4.84%
3rd district300.61.048694.6518.711.31491.63%2.95%5.60%
4th district346.80.263954.45707.558492.45%4.79%4.81%
Huang Huai Hai zone1st district216.20.650675.9815.110.58493.22%3.26%9.32%
2nd district205.80.645646.2878.512.91499.05%6.45%13.97%
3rd district201.50.743792.7647.69.84496.78%4.89%5.99%
4th district223.81.097687.9791.99.72498.20%4.52%8.48%
5th district238.10.584856.5806.69.13492.87%3.89%10.14%
Northwest zone1st district417.71.317687.8440.411.61453.68%3.03%4.22%
2nd district443.10.444780.8679.212.18454.61%4.64%5.71%
3rd district362.80.536819.1281.219.51503.27%2.80%9.26%
Southwest zone1st district388.40.674746.2400.011.0038.93.96%4.53%7.97%
2nd district315.00.472737.0340.817.0038.95.45%5.25%5.20%
Remarks: P1-Thermal time from seedling emergence to the end of the juvenile phase (expressed in degree days above a base temperature of 8 °C) during which the plant is not responsive to changes in photoperiod. P2-Extent to which development (expressed as days) is delayed for each hour increase in photoperiod above the longest photoperiod at which development proceeds at a maximum rate (considered 12.5 h). P5-Thermal time from silking to physiological maturity (expressed in degree days above a base temperature of 8 °C). G2-Maximum possible number of kernels per plant. G3-Kernel filling rate during the linear grain filling stage and under optimum conditions (mg d−1). PHINT-Phylochron interval, in thermal time (degree days) between successive leaf tip appearances.
Publisher’s Note: MDPI stays neutral with regard to jurisdictional claims in published maps and institutional affiliations.

