Abstract
Vehicle identification and classification are some of the major tasks in the areas of toll management and traffic management, where these smart transportation systems are implemented by integrating various information communication technologies and multiple types of hardware. The currently shifting era toward artificial intelligence has also motivated the implementation of vehicle identification and classification using AI-based techniques, such as machine learning, artificial neural network and deep learning. In this research, we used the deep learning YOLOv3 algorithm and trained it on a custom dataset of vehicles that included different vehicle classes as per the Indian Government’s recommendation to implement the automatic vehicle identification and classification for use in the toll management system deployed at toll plazas. For faster processing of the test videos, the frames were saved at a certain interval and then the saved frames were passed through the algorithm. Apart from toll plazas, we also tested the algorithm for vehicle identification and classification on highways and urban areas. Implementing automatic vehicle identification and classification using traditional techniques is a highly proprietary endeavor. Since YOLOv3 is an open-standard-based algorithm, it paves the way to developing sustainable solutions in the area of smart transportation.
1. Introduction
India is witnessing a massive growth in the automobile sector, as well as in the roads and highway sector, which is in turn increasing the use of smart transportation systems, such as toll management systems (TMSs) and advanced traffic management systems (ATMSs) used on highways and expressways and integrated transit management systems (ITMSs) used in the urban areas. These smart transportation systems intend to achieve a particular goal(s) and are named as per their goal. The main function of a TMS is to collect the toll charges from road users and provide an audit of the number of vehicles and the revenue collected [1], while the main function of an ATMS is to monitor the traffic; manage incidents; and engage in traffic counting and classification, congestion management and speeding detection on highways or expressways. An ITMS is a form of smart transportation for urban transport, which is used to calculate the expected time of arrival (ETA) of city buses and disseminate this information to the commuters waiting at the bus stops and bus terminals [2]. The different systems in the area of smart transportation are built using different hardware devices, information communication technologies (ICTs) and software, which are proprietary in most cases. Therefore, there is a need to have sustainable solutions in the area of smart transportation.
Automatic vehicle identification (AVI) refers to noticing the presence of a vehicle, and in computer vision, it is about automatically finding a vehicle(s) in the image or frames of a recorded or real-time video. Automatic vehicle classification (AVC) refers to the labeling of vehicles according to the classes they belong to. The TMS and ATMS are the two application areas of smart transportation where AVI and AVC form the basis for the function of these systems. Since the toll fee varies as per the vehicle class, the vehicle classification is very important for a TMS. The vehicle classification is important for ATMS too because the vehicles are counted and segregated as per their class for the analysis related to the detours and revenue losses, as well as penalizing the speeding vehicles since the maximum speed limit is different for light, medium and heavy vehicles. Broadly, there are two categories of vehicles: non-exempted and exempted. Table 1 presents the classes of vehicles that pay the toll fee, and thus, represents the non-exempted category.

Table 1.
Vehicle classes and vehicle types.
In India, tolls are collected using manual toll collection (MTC) and electronic toll collection (ETC). In the MTC method of collecting the toll fee, the toll collector collects the toll fee in cash from the road users, through coin receptors or through smart cards, and the receipt is issued to the road user, while in the ETC method of collecting the toll fee, it is collected by deducting the toll fee from a prepaid RFID passive tag installed on the windshield of the vehicle or from the bank account linked with the RFID tag. The advantage of ETC over MTC is that the road user does not need to stop the vehicle at a toll plaza. Both of these toll collection systems require the vehicles to be identified and classified at a toll plaza for the audit of the revenue collected. The traditional method of implementing AVI and AVC at toll plazas is using intrusive sensors, such as an inductive loop detector (ILD), treadles, axle detectors and dual-tire detectors, while non-intrusive sensors, such as a height detector, radar, vehicle separator, camera, infrared transmitters and receivers, that create vehicle profiles are mounted on a road-side pole, canopy structure or gantry. Sometimes, a combination of both is used to implement AVC. Figure 1 represents a typical schematic of a toll lane with ILD, treadle and height sensor devices installed for vehicle identification and classification.
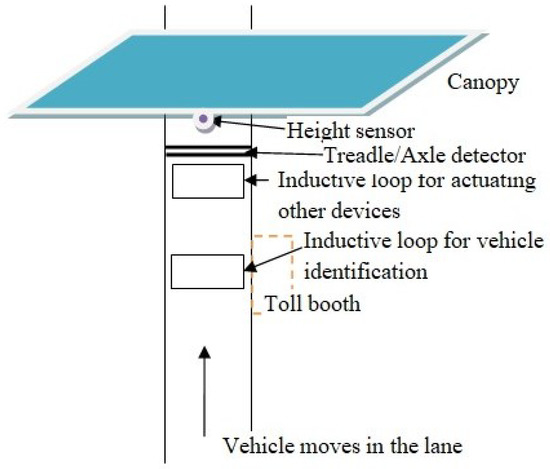
Figure 1.
Vehicle identification and classification at a toll plaza.
To count the entry and exit of different classes of vehicles at the different junctions on the highways, AVI and AVC are used again, but this identification and classification differ from toll plazas, as the vehicles are moving at speed on a highway. Here, a system that implements AVI and AVC using inductive loops and piezo sensors is shown in Figure 2. These sensors provide the data related to vehicles that hit the loop/exit the loop or the speed detected by a sensor. Depending upon the configuration and data provided by the loops/sensors, the vehicle length is calculated and compared with the threshold value to declare the vehicle class. Some systems use cameras to collect vehicle images. The virtual loops that are analogous to the ILD are configured to create the data collection point. Based on the pixel data, the vehicle length is calculated and compared with a threshold value to declare the vehicle class. Shadow removal is also done to increase the classification accuracy [3].
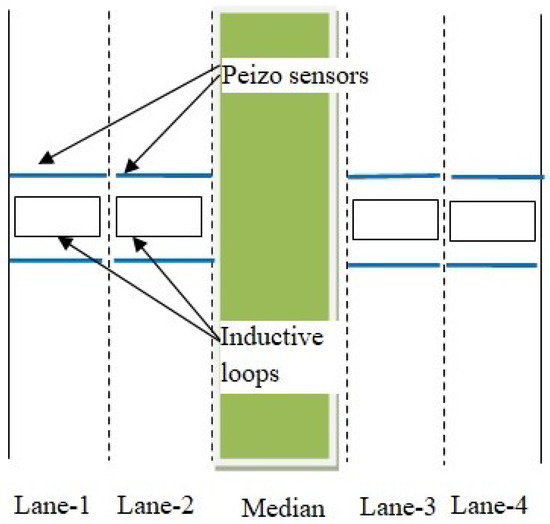
Figure 2.
Vehicle identification and classification on highways.
For the automatic vehicle classification system composed of treadles and an overhead vehicle separator, Michael C. Pietrzyk [4] recommended replacing the overhead vehicle separator with an infrared optical curtain. The combination of treadles and optical curtain had a classification accuracy of 98–99%. Saowaluck Kaewkamnerd et al. [5] used a wireless magnetic sensor embedded in the pavement, sensor board and computer to identify and classify the vehicles into four classes (motorcycle, car, pickup and van), and testing with 130 vehicles resulted in an overall accuracy of 77.69%. Ildar Urazghildiiev et al. [6] proposed vehicle classification using the parameters of vehicle length and height, which were measured with the help of a spread spectrum microwave radar sensor, as most of the vehicles can be distinguished by their geometric shapes. The classification of 2945 vehicles into six classes (car, car with trailer, mini-van, SUV, single-unit truck, multi-trailer truck) was achieved with a classification accuracy of 87%. Hemanshu et al. [7] presented an infrared-sensor-based system with a transmitter and receiver installed vertically and horizontally on paired sides of the toll lane. The vertically mounted pair generates a side profile of the vehicle, while the horizontally installed pair generates a pattern from which the axles are counted and the direction of movement is determined. To classify the vehicles, the extracted side profile of each vehicle is compared with the stacked profiles in the database. Antônio Carlos Buriti da Costa Filho et al. [8] presented an infrared-sensor-based vehicle classification system installed above the road that generates vehicle profiles from above. The classification is achieved by comparing the top profile with the profiles stacked in the database.
The advanced method of implementing AVI and AVC uses machine learning, neural networks and deep learning. These algorithms need pictures or videos of the vehicles, which are captured using the camera in the lanes at toll plazas and on highways. These pictures or videos are processed using deep learning algorithms and the vehicles are identified and classified. The deep learning algorithms [9,10,11,12,13,14,15,16,17,18,19,20,21,22,23] changed the method of object identification and classification from the images, recorded videos and real-time videos. The single-stage object detectors were found to be very useful in terms of speed and accuracy. This paper presents the implementation of AVI and AVC using version 3 of the You Only Look Once algorithm, i.e., YOLOv3, and the vehicle dataset was trained for the identification and classification of vehicles as per the classes defined by the Indian Government. Further, we merged the two-axle bus-truck and three-axle bus-truck into a single class of bus-truck, and thus, a total of five vehicle classes were considered from the non-exempted vehicles. This study also focused on the identification and classification of exempted vehicles. Vehicles such as motorcycles, ambulances, funeral vehicles, fire trucks, army vehicles, three-wheelers and tractors are exempted from the toll fee and are called exempted vehicles. From the exempted vehicle category, we considered three vehicle classes, which were motorcycles, three-wheelers and tractors.
We chose the YOLO family of algorithms over the Faster R-CNN algorithm since the YOLO algorithms belong to a category of single-stage object detectors and are much faster than Faster R-CNN. For the application areas of TMS and ATMS wherein the vehicles are to be identified and classified instantaneously for tasks such as the collection of toll charges or the collection of penalties in the case of speeding, YOLO was found to be the best, as the objects are vehicles and quite large in size, and hence, accuracy should not be an issue. Upesh et al. [24] compared version 3, version 4 and version 5 of the YOLO algorithms for emergency landing spot detection for unmanned aerial vehicles using the DOTA dataset. The performance was monitored for the same input parameters and output parameters of accuracy and speed. Their comparison found that YOLOv3 was faster than YOLOv4 and YOLOv5; however, YOLOv4 and YOLOv5 performed better than YOLOv3 in terms of accuracy. Therefore, we started our research on vehicle identification and classification using the YOLOv3 algorithm.
The architecture of YOLOv3 [20] consists of a base network or backbone, which is Darknet-53, as well as a neck and head. The backbone extracts the features, the neck collects the features extracted, and the head does the job of drawing bounding boxes and classification. In brief, YOLOv3 divides the input image into an N × N-sized collection of cells, giving a total of N2 cells. This cell size varies as per the size of the input image and each cell is responsible for predicting the ‘’B’’ number of bounding boxes in the image. For the input image of size 416 × 416, the cell size is 32 × 32 and the number of cells is 169. Every predicted box has a confidence score and the probability of correctness of identifying the class. The bounding boxes with a confidence score lower than the threshold are eliminated and the process is called non-maximum suppression [20]. YOLO-LITE [21] is the lighter version that was made for running on CPUs. YOLOv4 [22] and scaled-YOLOv4 [23] are other versions of the YOLO family, which were made by the researchers Alexey Bochkovskiy et al. As mentioned above, we used version 3 for our research and we will try version 4 in future works. The YOLO algorithm also gives the flexibility to modify the loss function, as well as the addition or deletion of layer(s), which have been explored by many researchers.
Yolo loss function = Coordinate Loss + Classification Loss + Confidence Loss
The coordinate loss is calculated as the difference between the coordinates of the ground truth anchor box and the predicted bounding box. This loss is calculated only if there is an object inside the bounding box.
The classification loss is calculated as the difference between the actual class of object and the predicted class of object.
The confidence loss is calculated as the probability of the object being present inside the bounding box.
The formulas [21] for these losses are expressed as follows:
λ is a constant, S represents the number of grids and B represents the number of bounding boxes.
x̂ᵢ and ŷᵢ represent the coordinates, ŵᵢ and ĥᵢ represent the width and height of the ground truth bounding box, and cᵢ represents the class of the object.
x̂ᵢ and ŷᵢ represent the predicted coordinates, ŵᵢ and ĥᵢ represent the predicted width and height of the bounding box, and ĉᵢ represents the predicted class of the object.
denotes the bounding box in the grid cell i.
ĉᵢ = Pr(obj)*.
In our study, we trained the YOLOv3 algorithm for a toll management system as per the vehicle classes framed by the Indian Government agency and tested the algorithm for the vehicle identification and classification of vehicles driving on the highway and urban roads. The next section of this paper presents the related work done in the area of vehicle identification and classification and subsequent sections are about the methodology adopted for conducting our research, results and discussion, and conclusions and future work.
2. Related Work
To understand the work done by different researchers on the topic of vehicle identification and classification using deep learning algorithms, in particular YOLO algorithms, we reviewed different papers for the current contribution. The idea of the past research papers with their contributing aspects is summarized below.
Bharavai Joshi et al. [25] presented a comparison study between manual toll collection, RFID-based electronic toll collection and an automated toll collection system based on image processing, where the toll fee is paid online by the user using a mobile phone before reaching the toll plaza. However, the accuracy details of the image processing technique used for verifying the vehicle at the toll plaza were not mentioned in the paper.
Initially, algorithms from deep learning were from the R-CNN family in which two-stage detection was performed, and then single-stage detection algorithms, such as YOLO and SSD, evolved from them. A survey paper on deep-learning-based object detection algorithms from Zhong-Qiu Zhao et al. [26] stated that algorithms such as Fast R-CNN, Faster R-CNN and YOLO provide better detection performance relative to R-CNN. Jorge E. Espinosa et al. [27] presented a comparison between the Faster R-CNN algorithm and the AlexNet classifier with GMM background subtraction for vehicle identification, where the classification revealed that the Faster R-CNN algorithm worked best with an NMS threshold value of 0.6 and a combination of AlexNet and GMM works best with a history of 500 frames. To assist the driver of a vehicle by detecting, identifying and tracking objects while driving, Chaya N Aishwarya et al. [28] proposed a functional and architectural model of a system named the Intelligent Driver Assistant System, which is based on YOLO and tiny YOLO for the detection of vehicles and pedestrians. The sharp change in vehicle scale is a challenge in vehicle detection, as stated by Huansheng Song et al. [29], and to overcome this, they proposed vision-based vehicle detection in which the road surface was first extracted using a Gaussian mixture model of image segmentation process and then the YOLOv3 algorithm was applied to detect the vehicles.
Due to various issues in YOLOv1, Tanvir Ahmad et al. [30] modified the loss function of YOLOv1 by replacing the margin style with a proportion style and added a spatial pyramid pooling layer and inception model with a convolution kernel of 1 × 1 to reduce the number of weight parameters of the layers to perform the object detection. The modified loss function is more flexible at optimizing the network error and the modification increased the average detection rate by approximately 2% on a Pascal VOC dataset. YOLOv2 is the improved version of YOLOv1 and the pre-trained YOLOv2 model with a GPU was used by Sakshi Gupta [31] for the live detection of objects using a webcam; they observed that the model using a GPU improved the computational time, speed and efficiency of identifying the objects in images and videos. Zhongyuan Wu et al. [32] mentioned that YOLOv2 does not work efficiently to detect some uncommon types of vehicles, which is why they proposed two changes to detect multi-scale vehicles. The first change was developing a new anchor box generation method using Rk-means++ to enhance the adaptation of varying sizes of vehicles, thus achieving multi-scale detection. The second change was introducing a focal loss to minimize the negative impact on training caused by the imbalance between vehicles and the background. However, the proposed modified method was not tested for a variety of vehicles due to the unavailability of data.
For object detection in real time, YOLOv3 is the incremental version over the previous version. YOLOv3 is able to achieve the highest precision, as mentioned by Dr. S.V. Viraktamath et al. [33] in their paper explaining the architecture and functioning of the YOLOv3 algorithm. In [34], Xuanyu Yin et al. used YOLOv3 and k-means to detect objects in 3D images captured using a LIDAR camera in an autonomous driving system. The research work of Ignacio et al. [35] came up with an improved version of YOLOv3 that increases the speed but maintains the accuracy. The improvement in speed was achieved with the help of a discarding technique using YOLOv3 and tiny YOLOv3 with an extra output layer. This also eliminated the need to train the model at different scales or output layers and the requirement of loading different configurations of algorithms and different weights. With this change in YOLOv3, an improvement of 22% in speed without losing accuracy and an improvement of 48% in speed with a loss of accuracy were noticed. In our research, we used YOLOv3 for the identification and classification of vehicles at toll plazas, on highways and in urban areas. To achieve the results, the dataset was prepared to cover the non-exempted and exempted vehicles as per the objective and then the algorithm was trained and the results were compared with the paper of Deepaloke et al. [36], who presented vehicle identification and classification using YOLOv3 and tiny-YOLOv3 by taking images from a perpendicular camera installed at gantries. Their study considered passenger vehicles and trucks/buses for identification and classification and observed a recall of 100% but did not consider all non-exempted classes of vehicles required for the function of a toll management system. In our study, we considered all the vehicle classes required at the toll plazas and we compared the classification accuracy of our research with the vehicle classification accuracy obtained using traditional techniques.
3. Materials and Methods
A total of five classes (car-Jeep-van, LCV, bus-truck, MAV and OSV) from the non-exempted category and three classes (motorcycle, three-wheeler and tractor) from the exempted category were selected for our research. In this study, motorcycle, three-wheeler and tractor vehicle classes were selected from the exempted category as the other vehicle classes’ features match with the non-exempted class of vehicles. For example, the ambulance class matches with the LCV class from non-exempted category, while the army vehicle could be from any class out of 1, 2, 3 or 4, and at the same time, the vehicle also has a specific color. This section describes in detail the methodology adopted for implementing automatic vehicle identification and classification using the YOLOv3 algorithm. The methodology involved the steps of dataset preparation and data pre-processing, preparing the Darknet framework and YOLOv3 configuration, and training and testing, which are explained below.
3.1. Dataset and Data Pre-Processing
The images for motorcycles were downloaded from www.kaggle.com (accessed on 22 March 2022) [37] and the images for other classes of vehicles were downloaded from www.google.com (accessed on 22 March 2022) [38]. A total of 160 images from each class were collected. The class-5 vehicles are rare and hence their images are also rarely available. To keep an equal number of images for each vehicle class, 160 images from each vehicle class were considered. The sample images of the dataset are represented in the following Figure 3.
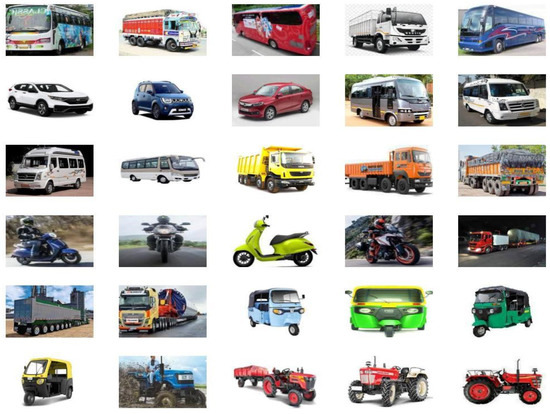
Figure 3.
Sample images from the dataset.
The dataset pre-processing steps are mentioned in the following Figure 4 and consisted of augmentation, annotation and division of the dataset for training and validation.
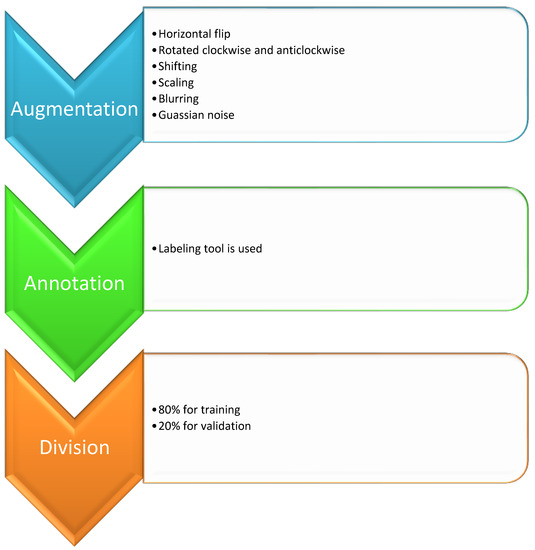
Figure 4.
Data preprocessing steps.
To have a large size dataset, the collected images were augmented using techniques and the expected output, as mentioned in Figure 5.
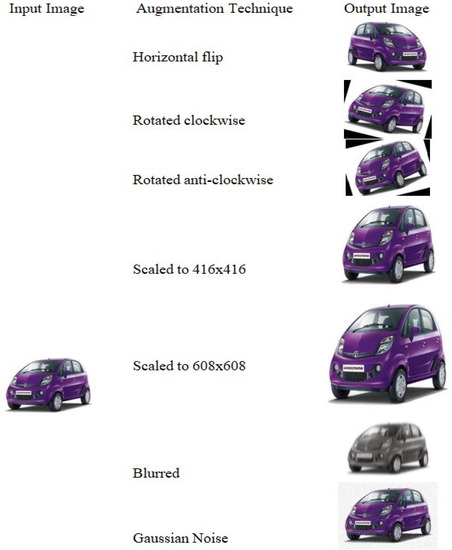
Figure 5.
Augmented techniques and the expected output images.
With augmentation techniques applied to these images, the number of images for each class became 1440. With a total of eight vehicle classes, the dataset with the original and augmented images contained 11,520 images in total. Afterward, the images were annotated using a labeling tool [39] that created a text file for each image. The text file contained the class identifier, coordinates, and width and height for the bounding box created over the vehicle as shown in the Table 2.

Table 2.
Sample contents of a text file.
Finally, the annotated images were divided into 80% for training and 20% for validation.
3.2. Preparing the Darknet Framework and YOLO Configuration File
The pre-defined Darknet-53 framework was downloaded from the GitHub repository https://github.com/pjreddie/darknet/blob/master/cfg/yolov3.cfg. The pre-trained weight file for YOLOv3 was downloaded from https://pjreddie.com/darknet/yolo. In the yolov3.cfg file, the required changes (classes = 8, max_batches = 16,000, steps = 12,800 and 14,400, and filters = 39) were carried out before training the dataset using the YOLOv3 algorithm.
3.3. Training and Testing
The required coding was done using the OpenCV library of Python. The training of the algorithm was done on Google Colab using a GPU. The videos for testing were captured at toll plazas, on highways and in urban areas. These videos were of varying duration and saved in different formats. At certain intervals, the frames were saved from the test videos, as shown in Figure 6.
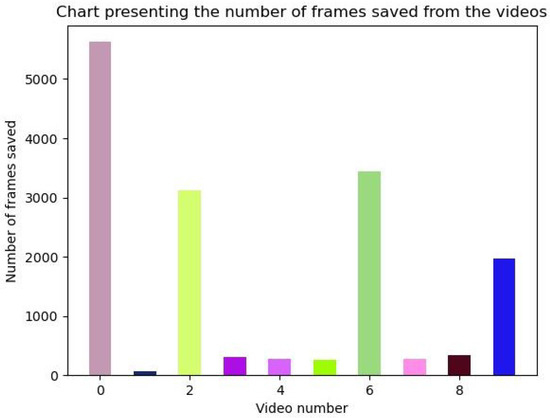
Figure 6.
Video numbers and number of frames saved from the videos.
4. Results
We tested the trained algorithm using test videos that were recorded at the toll plazas, on the highways and in urban areas. The results of the identification and classification are shown in Figure 7, Figure 8 and Figure 9.
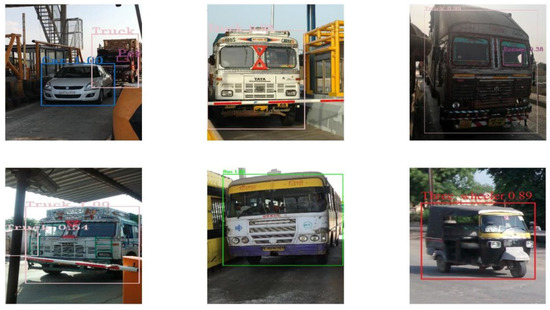
Figure 7.
Identification and classification of vehicles at toll plazas.
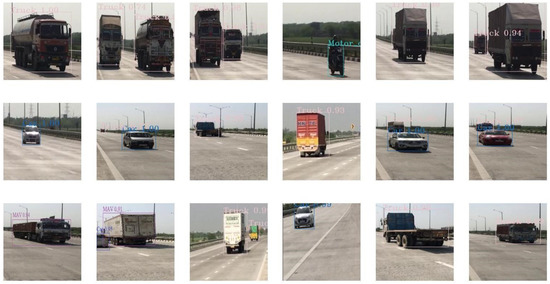
Figure 8.
Identification and classification of vehicles on a highway.
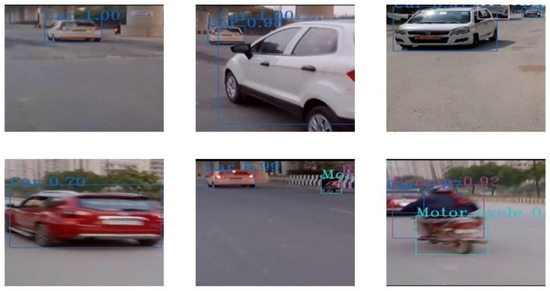
Figure 9.
Identification and classification of vehicles in an urban area.
5. Discussion
Since the images at the toll plazas were captured from near distances, the front vehicles in the images were detected easily. For the images on highways and urban areas, some vehicles were not detected, as the camera captured the images available at both near and far distances as compared with the toll plazas. Since the image captured from near distances had a larger-sized vehicle in it, the class probability was higher when the image was passed through the detector. It was also observed that the images with multiple vehicles had a higher detection time than the images with one vehicle. Figure 10 represents the detection time for different images passed through the detector.
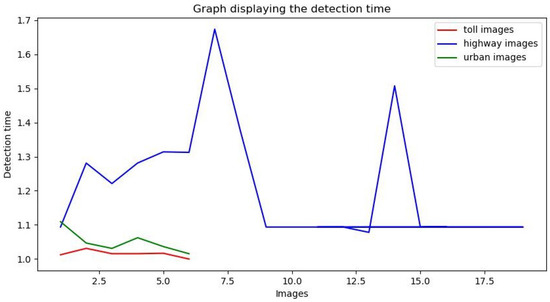
Figure 10.
Detection time for the images.
The parameters for the evaluation of this research were speed, precision and recall. The parameter of speed is defined as the frames per second at which the video was processed by the YOLOv3 algorithm, precision is defined as the ratio of the correctly identified positive cases to all the cases correctly and the incorrectly predicted as positive, and recall is defined as the ratio of the correctly identified positive cases to all the cases.
Precision = TP/(TP + FP)
Recall = TP/(TP + FN)
True positive (TP)—total number of correctly identified and classified specific class of vehicles.
False positive (FP)—total number of incorrectly identified and classified specific class of vehicles.
False negative (FP)—total number of a specific class of vehicles independent of whether they were identified and classified or not.
In our research, we evaluated vehicle images at toll plazas and on highways separately because the videos captured on highways contained a lot of background images and the far vehicles were of smaller sizes. Further, the class-5 vehicles were not found at the toll plazas and on highways as they are rare. For testing at the toll plazas, the downloaded images of class-5 vehicles were passed. For the evaluation of vehicle images on highways, the vehicles of class-5, class-7 and class-8 were not considered due to their unavailability. The evaluation for images for urban areas was not done. The observed precision and recall values are given in Table 3 and Table 4.

Table 3.
Average precision and average recall.

Table 4.
Average precision and average recall.
The values of the average precision and average recall for the toll plazas and highways were looked at separately and not compared because the latter was calculated for five classes only. The values of precision and recall using the YOLOv3 algorithm were impressive and this gave us the confidence to step forward toward implementing automatic vehicle identification and classification at toll plazas with less hardware.
In comparison with the research from [36], we considered all the non-exempted vehicle classes and used test videos of different lengths and in different formats. Before passing to the YOLOv3 algorithm, the frames from the test videos were saved at certain intervals, which increased the speed of vehicle identification and classification, resulting in a reduction in the detection time. Due to a lack of accuracy results in [36], we compared the accuracy of our model with the traditional techniques. The automatic vehicle identification and classification measured by the traditional techniques provided accuracies in the ranges shown in Table 5. The results of the work in this study provided the precision of 94.1% at the toll plazas, which is a good result, and 91.2% on the highways, which is an average result as compared with the traditional techniques.

Table 5.
Comparison of vehicle accuracy of different traditional and YOLOv3-based techniques.
6. Comparison with SOTA
The table shows the SOTA comparison in terms of the parameters of latency, number of classes, number of vehicles and vehicle classification accuracy. The parameter of latency depends upon factors such as the type of hardware and interfacing of the hardware with software. Therefore, we did not consider the latency in our comparison for SOTA. The studies that considered the same vehicle classes as us were not available. However, all the papers for SOTA comparison tested their classification accuracy with small data sets, which made the comparison fair. The table shows that there were some high-performance traditional techniques for vehicle identification and classification, while the YOLOv3-based vehicle identification and classification model trained by us produced an accuracy of 94.1%. Bringing this accuracy level up to par with the traditional technique and also the classification of vehicles from the exempted category, such as army vehicles and ambulances, is within our scope of future work.
7. Conclusions
We tested a custom-trained YOLOv3 algorithm at toll plazas, on highways and in urban areas. The results showed an average precision of 94.1% and an average recall of 86.3% at the toll plazas. With good precision and recall at the toll plazas, the algorithm can be used for AVI and AVC in a toll management system at the toll plazas, while for use in applications related to an ATMS and an urban area, the algorithm requires more research. The other benefit was that we could also eliminate the installation of multiple types of hardware/devices to implement automatic vehicle identification and classification at the toll plazas in contrast with the traditional methods of vehicle identification and classification, which require multiple hardware/devices, such as inductive loops, axle detector/treadles and height sensors, while the AI-based method requires a camera with a mounting structure.
Regarding future work, the identification and classification of a merged category of two- and three-axle buses and trucks into two-axle and three-axle vehicle classes from the non-exempted category and the identification and classification of vehicles such as ambulances, fire trucks and army vehicles from the exempted category will be taken up. The research of AVI and AVC on highways and in urban areas will also be continued. The other sub-task will be the counting of vehicles at toll plazas and on highways.
Author Contributions
Conceptualization, S.K.R.; methodology, J.C.P.; validation, S.S.A. and M.R.; formal analysis, V.C. and A.D.; writing—original draft preparation, S.K.R.; writing—review and editing, M.R., A.G. and A.S.A.; supervision, J.C.P. and R.S.; funding acquisition, S.S.A. All authors have read and agreed to the published version of the manuscript.
Funding
This study was funded by the Deanship of Scientific Research, Taif University Researchers Supporting Project number (TURSP-2020/215), Taif University, Taif, Saudi Arabia.
Institutional Review Board Statement
Not applicable.
Informed Consent Statement
Not applicable.
Data Availability Statement
Data in this research paper will be shared upon request to the corresponding author.
Conflicts of Interest
The authors declare no conflict of interest.
References
- Win, A.M.; MyatNwe, C.; Latt, K.Z. RFID Based Automated Toll Plaza System. Int. J. Sci. Res. Publ. 2014, 4, 1–7. [Google Scholar]
- John, F.; Khalid, G.; Elibiary, J. AI in Advanced Traffic Management Systems; AAAI Technical Report WS-93-04; AAAI: Palo Alto, CA, USA, 1993. [Google Scholar]
- Zhang, G.; Wang, Y.H. Video-Based Vehicle Detection and Classification System for Real-Time Traffic Data Collection Using Uncelebrated Video Cameras. Transp. Res. Rec. J. Transp. Res. Board 2007, 1993, 138–147. [Google Scholar] [CrossRef] [Green Version]
- Pietrzyk, C.M. Interim Evaluation Report-Task Order #1: Automatic Vehicle Classification (AVC) Systems; CUTR Research Reports; CUTR Publications: Tampa, FL, USA, 1997. [Google Scholar]
- Kaewkamnerd, S.; Pongthornseri, R.; Chinrungrueng, J.; Silawan, T. Automatic Vehicle Classification Using Wireless Magnetic Sensor. In Proceedings of the IEEE International Workshop on Intelligent Data Acquisition and Advanced Computing Systems: Technology and Applications, Rende, Italy, 21–23 September 2009. [Google Scholar]
- Urazghildiiev, I.; Ragnarsson, R.; Ridderström, P.; Rydberg, A.; Öjefors, E.; Wallin, K.; Enochsson, P.; Ericson, M.; Löfqvist, G. Vehicle Classification Based on the Radar Measurement of Height Profiles. In IEEE Transactions on Intelligent Transportation Systems; IEEE: New York, NY, USA, 2007; Volume 8, pp. 245–253. [Google Scholar]
- Hemanshu, S.; Sunil, K.; Samani, B. Infrared based system for vehicle Axle Counting and Classification. In Proceedings of the 8th IRF International Conference, Pune, India, 4 May 2014. [Google Scholar]
- Filho, A.C.B.d.; Filho, J.P.d.; de Araujo, R.E.; Benevides, C.A. Infrared-based system for vehicle classification. In Proceedings of the 2009 SBMO/IEEE MTT-S International Microwave and Optoelectronics Conference (IMOC), Belem, Brazil, 3–6 November 2009. [Google Scholar]
- Krizhevsky, A.; Sutskever, I.; Hinton, G.E. ImageNet Classification with Deep Convolutional Neural Networks; Communications of the ACM; University of Toronto: Toronto, ON, Canada, 2012. [Google Scholar]
- Simonyan, K.; Zisserman, A. Very Deep Convolutional Networks for Large-Scale Image Recognition; Computer vision and Pattern recognition. arXiv 2014, arXiv:1409.1556. [Google Scholar]
- Szegedy, C.; Liu, W.; Hill, C.; Jia, Y.; Sermanet, P.; Reed, S.; Anguelov, D.; Erhan, D.; Vanhoucke, V.; Rabinovich, A. Going deeper with convolutions. In Proceedings of the IEEE Conference on Computer Vision and Pattern Recognition (CVPR), Boston, MA, USA, 7–12 June 2015; pp. 1–9. [Google Scholar]
- Girshick, R.; Donahue, J.; Darrell, T.; Malik, J.; Berkeley, U.C. Rich feature hierarchies for accurate object detection and semantic segmentation. In Proceedings of the IEEE Conference on Computer Vision and Pattern Recognition (CVPR), Columbus, OH, USA, 23–28 June 2014; pp. 580–587. [Google Scholar]
- Kaiming, H.; Zhang, X.; Shaoqing, R.; Jian, S. Deep Residual Learning for Image Recognition. In Proceedings of the IEEE Conference on Computer Vision and Pattern Recognition (CVPR), Las Vegas, NV, USA, 27–30 June 2016; pp. 770–778. [Google Scholar]
- He, K.; Zhang, X.; Ren, S.; Sun, J. Spatial Pyramid Pooling in Deep Convolutional Networks for Visual Recognition. In IEEE Transactions on Pattern Analysis and Machine Intelligence; IEEE: New York, NY, USA, 2015; pp. 1904–1916. [Google Scholar]
- Girshick, R. Fast R-CNN. In Proceedings of the IEEE International Conference on Computer Vision (ICCV), Santiago, Chile, 7–13 December 2015; pp. 1440–1448. [Google Scholar]
- Ren, S.; He, K.; Girshick, R.; Sun, J. Faster R-CNN: Towards Real-Time Object Detection with Region Proposal Networks. In Proceddings of the Advances in Neural Information Processing Systems 28 (NIPS 2015), Montreal, QC, Canada, 7–12 December 2015; pp. 91–99. [Google Scholar]
- Redmon, J.; Divvala, S.; Girshick, R.; Farhadi, A. You Only Look Once: Unified, Real-Time Object Detection. In Proceedings of the IEEE Conference on Computer Vision and Pattern Recognition (CVPR), Las Vegas, NV, USA, 27–30 June 2016; pp. 779–788. [Google Scholar]
- Liu, W.; Anguelov, D.; Erhan, D.; Szegedy, C.; Reed, S.; Fu, C.-Y.; Berg, A.C. SSD: Single Shot MultiBox Detector. In Computer Vision–ECCV 2016; ECCV 2016. Lecture Notes in Computer Science; Leibe, B., Matas, J., Sebe, N., Welling, M., Eds.; Springer: Cham, Switzerland, 2016; Volume 9905, pp. 21–37. [Google Scholar]
- Redmon, J.; Farhadi, A. YOLO9000: Better, Faster, Stronger. In Proceedings of the IEEE Conference on Computer Vision and Pattern Recognition (CVPR), Honolulu, HI, USA, 21–26 July 2017; pp. 7263–7271. [Google Scholar]
- Redmon, J.; Farhadi, A. YOLOv3: An Incremental Improvement. arXiv 2018, arXiv:1804.02767. [Google Scholar]
- Huang, R.; Pedoeem, J.; Chen, C. YOLO-LITE: A Real-Time Object Detection Algorithm Optimized for Non-GPU Computers. In Proceedings of the 2018 IEEE International Conference on Big Data (Big Data), Seattle, WA, USA, 10–13 December 2018. [Google Scholar]
- Bochkovskiy, A.; Wang, C.; Liao, H.M. YOLOv4: Optimal Speed and Accuracy of Object Detection. arXiv 2020, arXiv:2004.10934. [Google Scholar]
- Wang, C.; Bochkovskiy, A.; Liao, H.M. Scaled-YOLOv4: Scaling Cross Stage Partial Network. In Proceedings of the IEEE/CVF Conference on Computer Vision and Pattern Recognition (CVPR), Nashville, TN, USA, 20–25 June 2021; pp. 13029–13038. [Google Scholar]
- Nepal, U.; Eslamiat, H. Comparing YOLOv3, YOLOv4 and YOLOv5 for Autonomous Landing Spot Detection in Faulty UAVs. Sensors 2022, 22, 464. [Google Scholar] [CrossRef] [PubMed]
- Joshi, B.; Bhagat, K.; Desai, H.; Patel, M.; Parmar, K.J. A Comparative Study of Toll Collection Systems in India. Int. J. Eng. Res. Dev. 2017, 13, 68–71. [Google Scholar]
- Zhao, Z.-Q.; Zheng, P.; Xu, S.-T.; Wu, X. Object Detection with Deep Learning: A Review. IEEE Trans. Neural Netw. Learn. Syst. 2019, 30, 3212–3232. [Google Scholar] [CrossRef] [PubMed] [Green Version]
- Jorge, E.; Espinosa, S.; Velastin, A.; Branch, J.W. Vehicle Detection Using AlexNet and Faster R-CNN Deep Learning Models: A Comparative study. In Advances in Visual Informatics; IVIC 2017. Lecture Notes in Computer Science; Springer: Cham, Switzerland, 2017; Volume 10645. [Google Scholar]
- Aishwarya, C.N.; Mukherjee, R.; Mahato, D.K.; Pundir, A.; Saxena, G.J. Multilayer vehicle classification integrated with single frame optimized object detection framework using CNN based deep learning architecture. In Proceedings of the 2018 IEEE International Conference on Electronics, Computing and Communication Technologies (CONECCT), Bangalore, India, 16–17 March 2018. [Google Scholar]
- Song, H.; Liang, H.; Li, H.; Dai, Z.; Yun, X. Vision-based vehicle detection and counting system using deep learning in highway scenes. Eur. Transp. Res. Rev. 2019, 11, 51. [Google Scholar] [CrossRef] [Green Version]
- Ahmad, T.; Ma, Y.; Yahya, M.; Ahmad, B.; Nazir, S.; ulHaq, A. Object Detection through Modified YOLO Neural Network. Sci. Program. 2020, 2020, 8403262. [Google Scholar] [CrossRef]
- Gupta, S.; Devi, D.T.U. YOLOv2 based Real Time Object Detection. Int. J. Comput. Sci. Trends Technol. IJCST 2020, 8, 26–30, ISSN 2347-8578. [Google Scholar]
- Wu, Z.; Sang, J.; Zhang, Q.; Xiang, H.; Cai, B.; Xia, X. Multi-Scale Vehicle Detection for Foreground-Background Class Imbalance with Improved YOLOv2. Sensors 2019, 19, 3336. [Google Scholar] [CrossRef] [PubMed] [Green Version]
- Viraktamath, D.S.V.; Yavagal, M.; Byahatti, R. Object Detection and Classification using YOLOv3. Int. J. Eng. Res. Technol. IJERT 2021, 10. Available online: https://www.academia.edu/download/66162765/object_detection_and_classification_using_IJERTV10IS020078.pdf (accessed on 22 April 2022).
- Yin, X.; Sasaki, Y.; Wang, W.; Shimizu, K. YOLO and K-Means Based 3D Object Detection Method on Image and Point Cloud. In Proceedings of the JSME Annual Conference on Robotics and Mechatronics (Robomec), online, June 2019; p. 2P1-I01. [Google Scholar]
- Martinez-Alpiste, I.; Golcarenarenji, G.; Wang, Q.; Alcaraz-Calero, J.M. A dynamic discarding technique to increase speed and preserve accuracy for YOLOv3. Neural Comput. Appl. 2021, 33, 9961–9973. [Google Scholar] [CrossRef]
- Chattopadhyay, D.; Rasheed, S.; Yan, L.; Lopez, A.; Farmer, J.; Brown, D.E. Machine Learning for Real-Time Vehicle Detection in All-Electronic Tolling System. In Proceedings of the 2020 Systems and Information Engineering Design Symposium (SIEDS), Charlottesville, VA, USA, 24 April 2020. [Google Scholar]
- Vehicle Images. (n.d.-b). [Photograph]. Available online: https://www.kaggle.com (accessed on 18 April 2022).
- Vehicle Images. (n.d.-b). [Photograph]. Available online: https://www.google.com (accessed on 27 April 2022).
- Lebellmg. Available online: https://github.com/tzutalin/labelImg (accessed on 22 April 2022).
Publisher’s Note: MDPI stays neutral with regard to jurisdictional claims in published maps and institutional affiliations. |
© 2022 by the authors. Licensee MDPI, Basel, Switzerland. This article is an open access article distributed under the terms and conditions of the Creative Commons Attribution (CC BY) license (https://creativecommons.org/licenses/by/4.0/).