
How Determinants Affect Transfer Ridership between Metro and Bus Systems: A Multivariate Generalized Poisson Regression Analysis Method

 , ,
, ,
Abstract
:1. Introduction
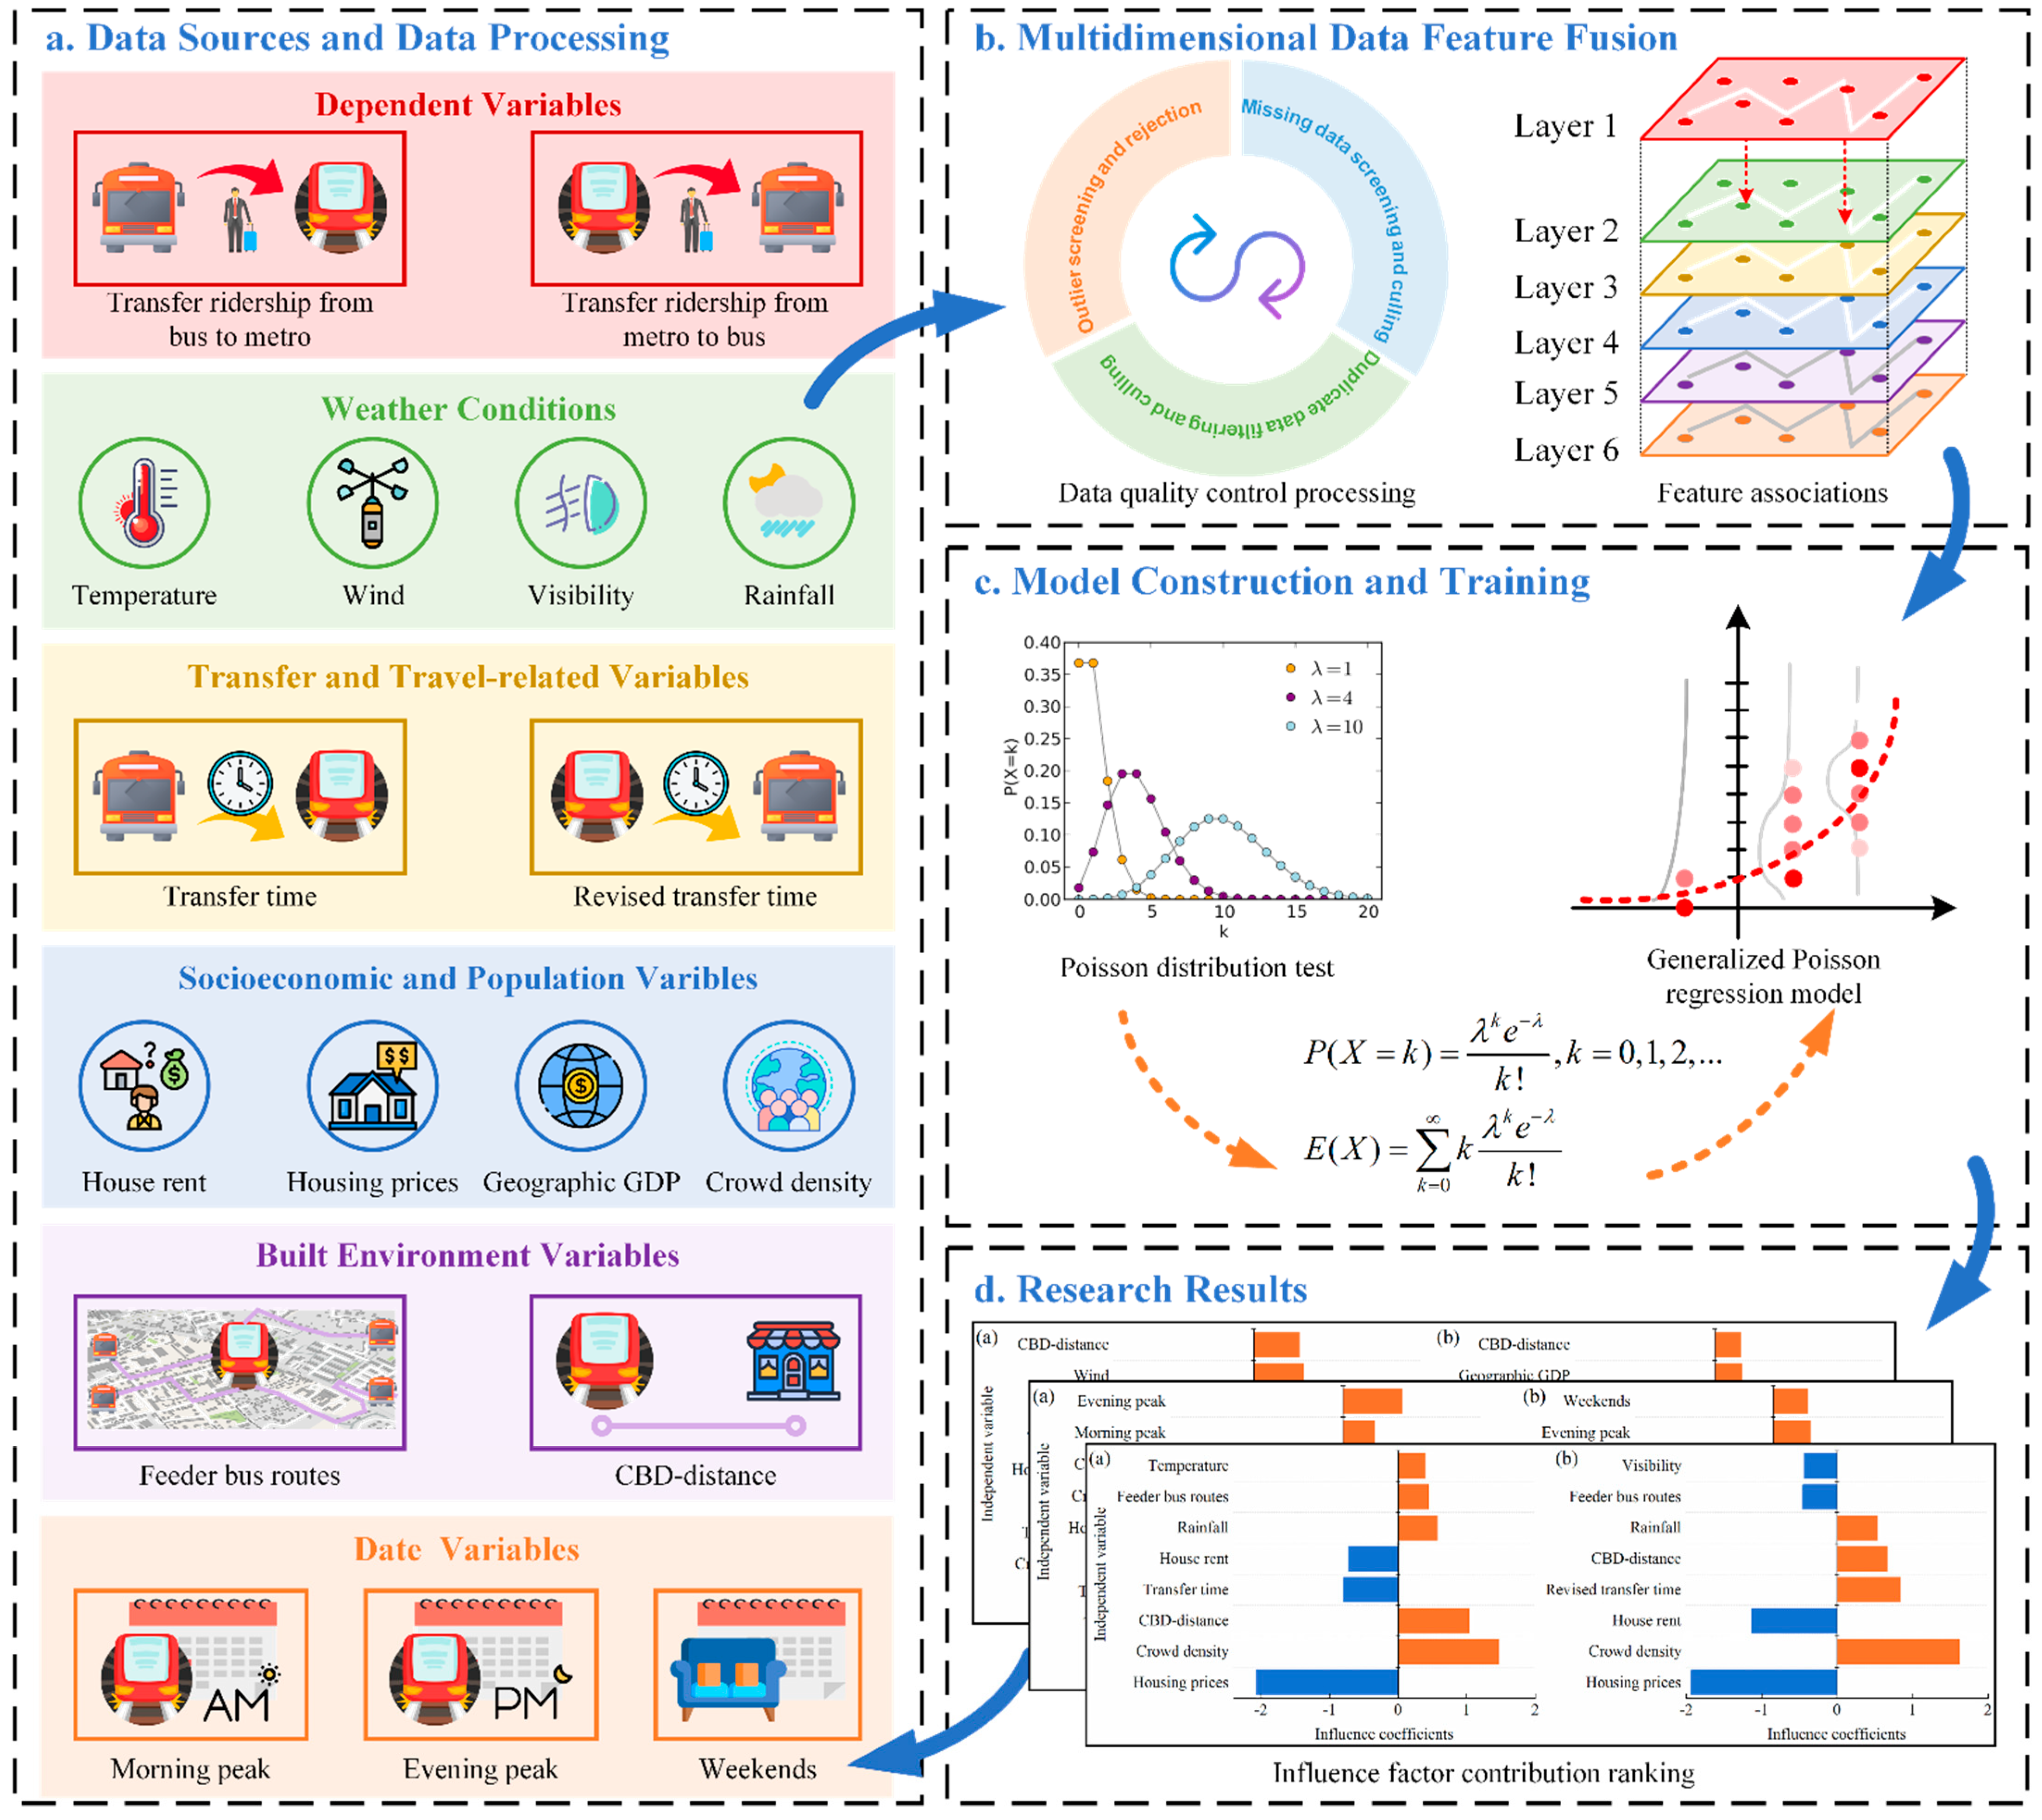
- This study analyzes various factors influencing the transfer ridership using a massive smart card dataset and global positioning system (GPS) coordinate data at a fine-grained temporal scale. A comprehensive understanding of different factors that affect the transfer ridership at the station level is obtained.
- We explore the impact of real-time weather on transfer ridership by the GPR model, which is highly important for understanding the relationship between weather and transfer ridership. We identify the incentive/disincentive factors for transfer passengers, which can help decision-makers reduce the adverse effects of factors for the subsequent planning and construction of new metro stations.
- This paper analyzes the difference in the influence of the same factors on the transfer ridership under different weather conditions and different types of dates. We investigated the differences in the impact of each factor on transfer ridership during typhoon weather, holidays, and weekdays.
2. Literature Review
2.1. The Transfer-Related Studies
2.2. Effects of Weather on the Transport Ridership
3. Study Area and Data
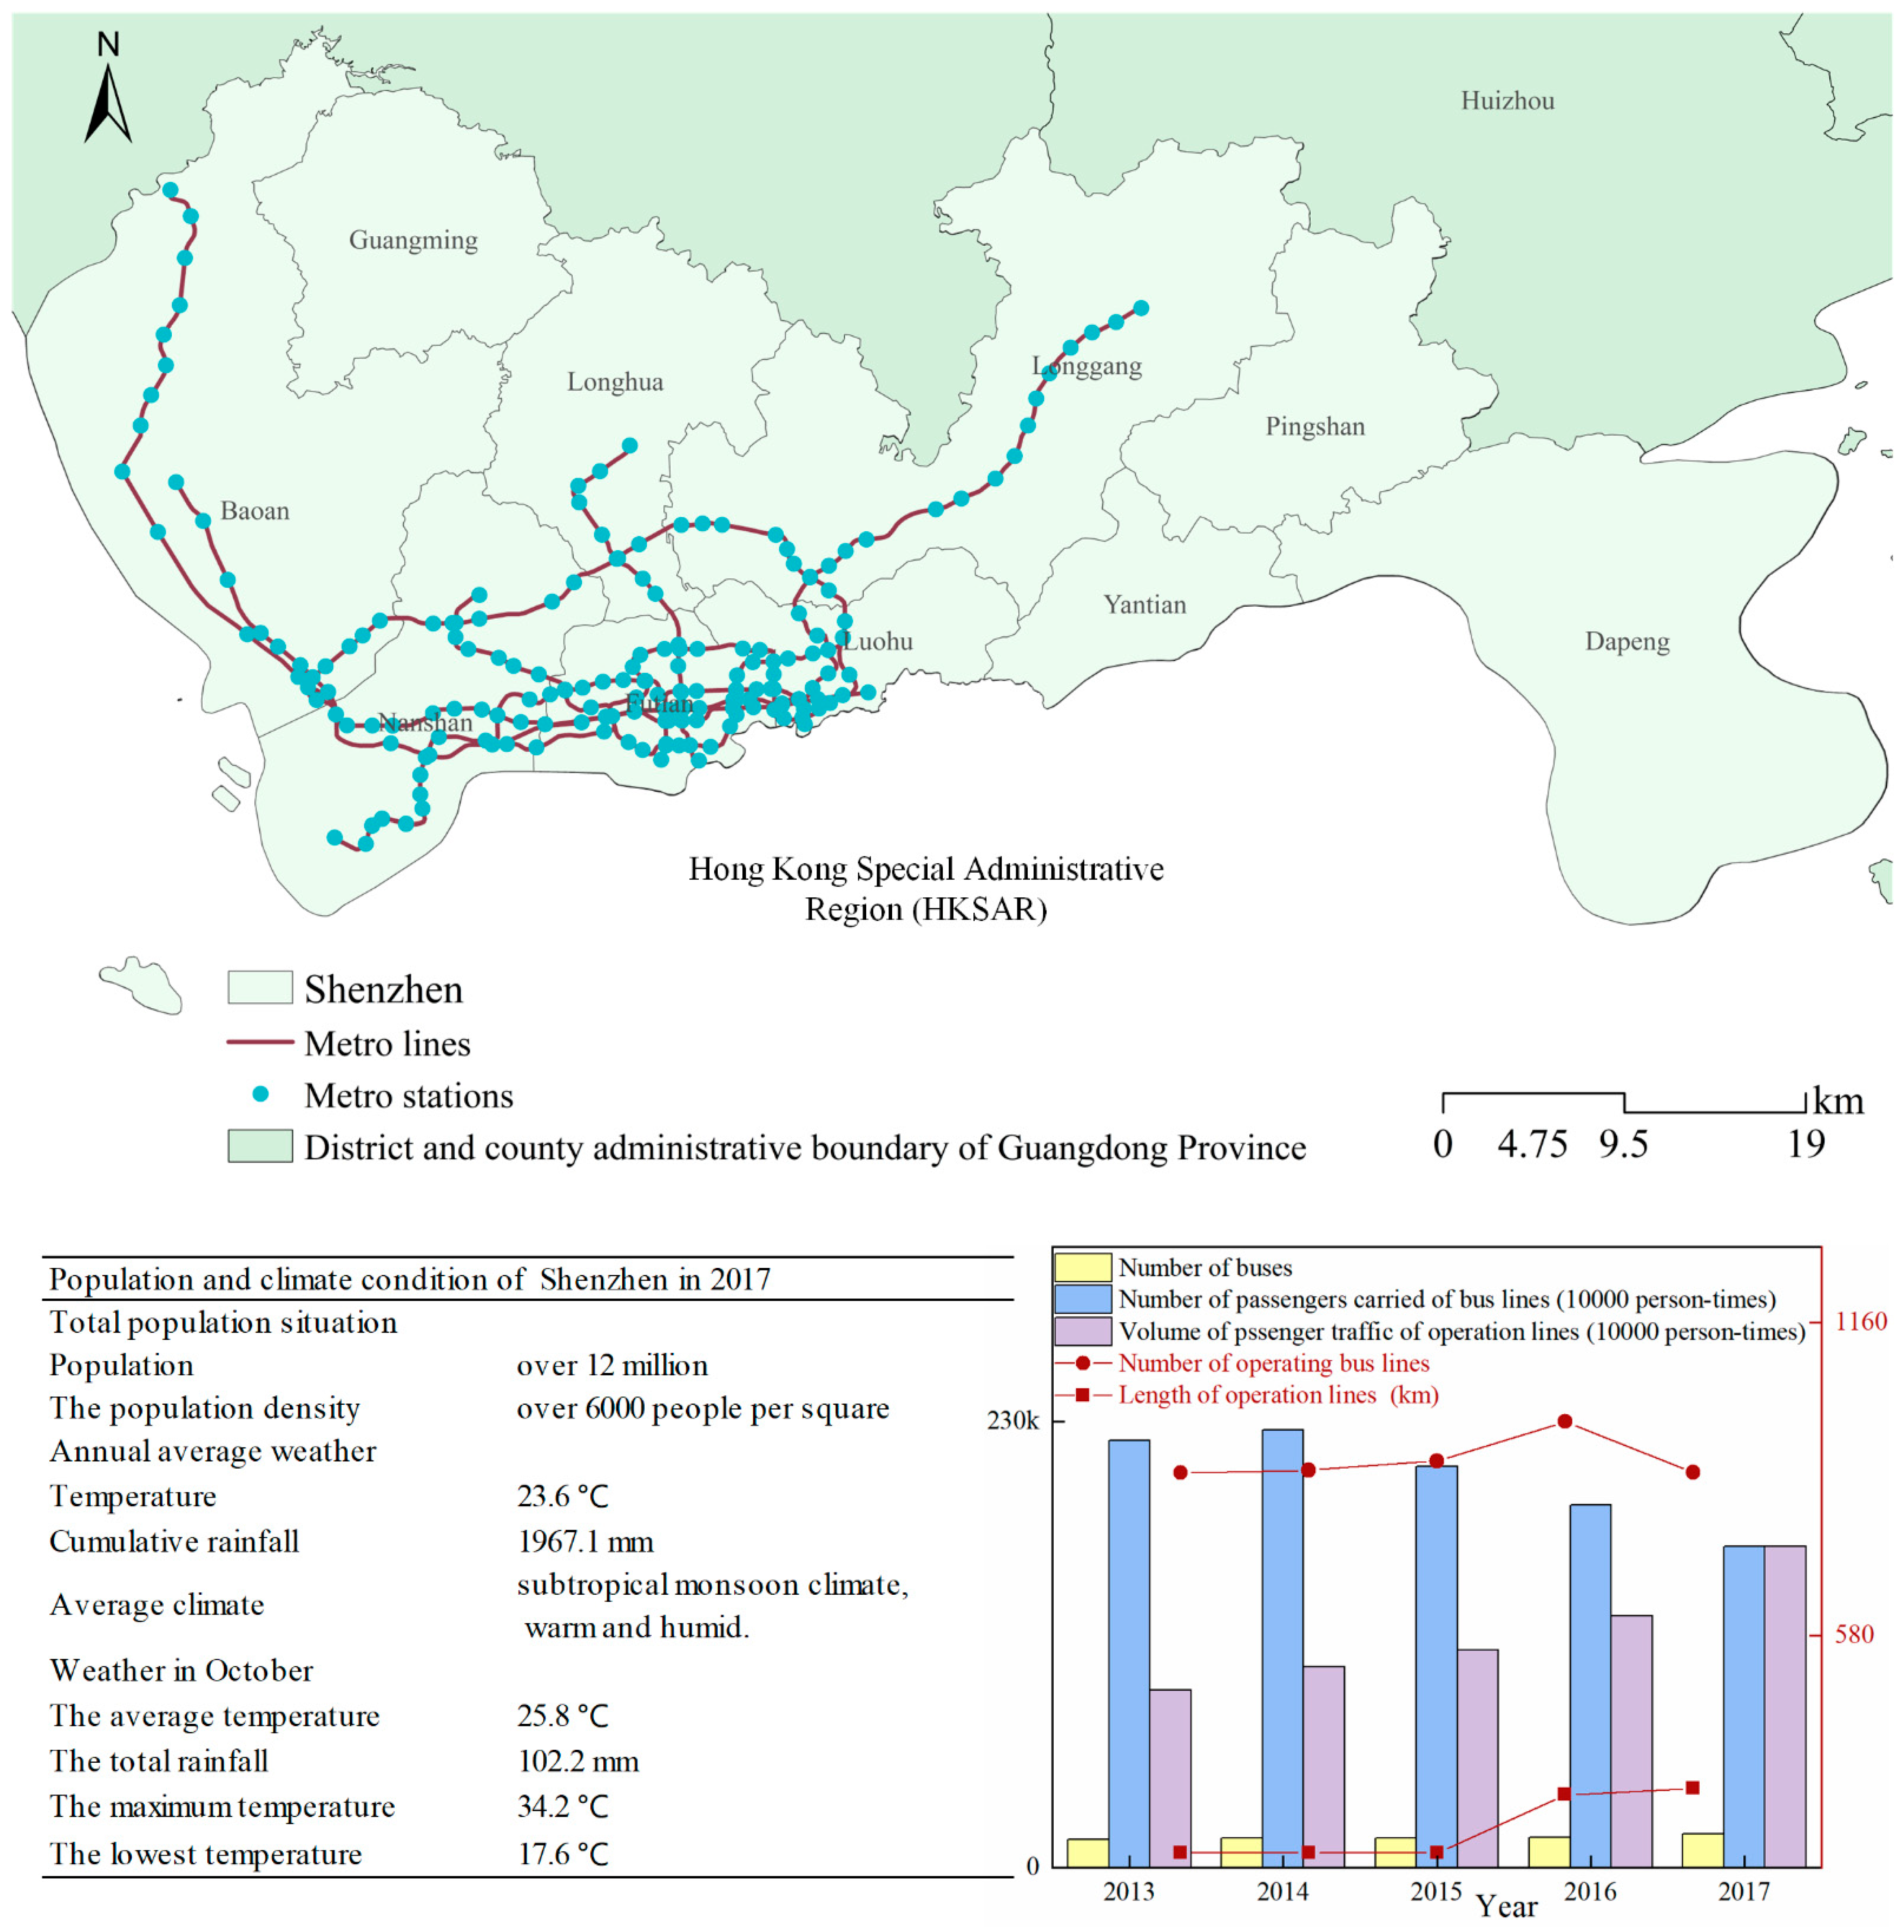
3.1. Study Area
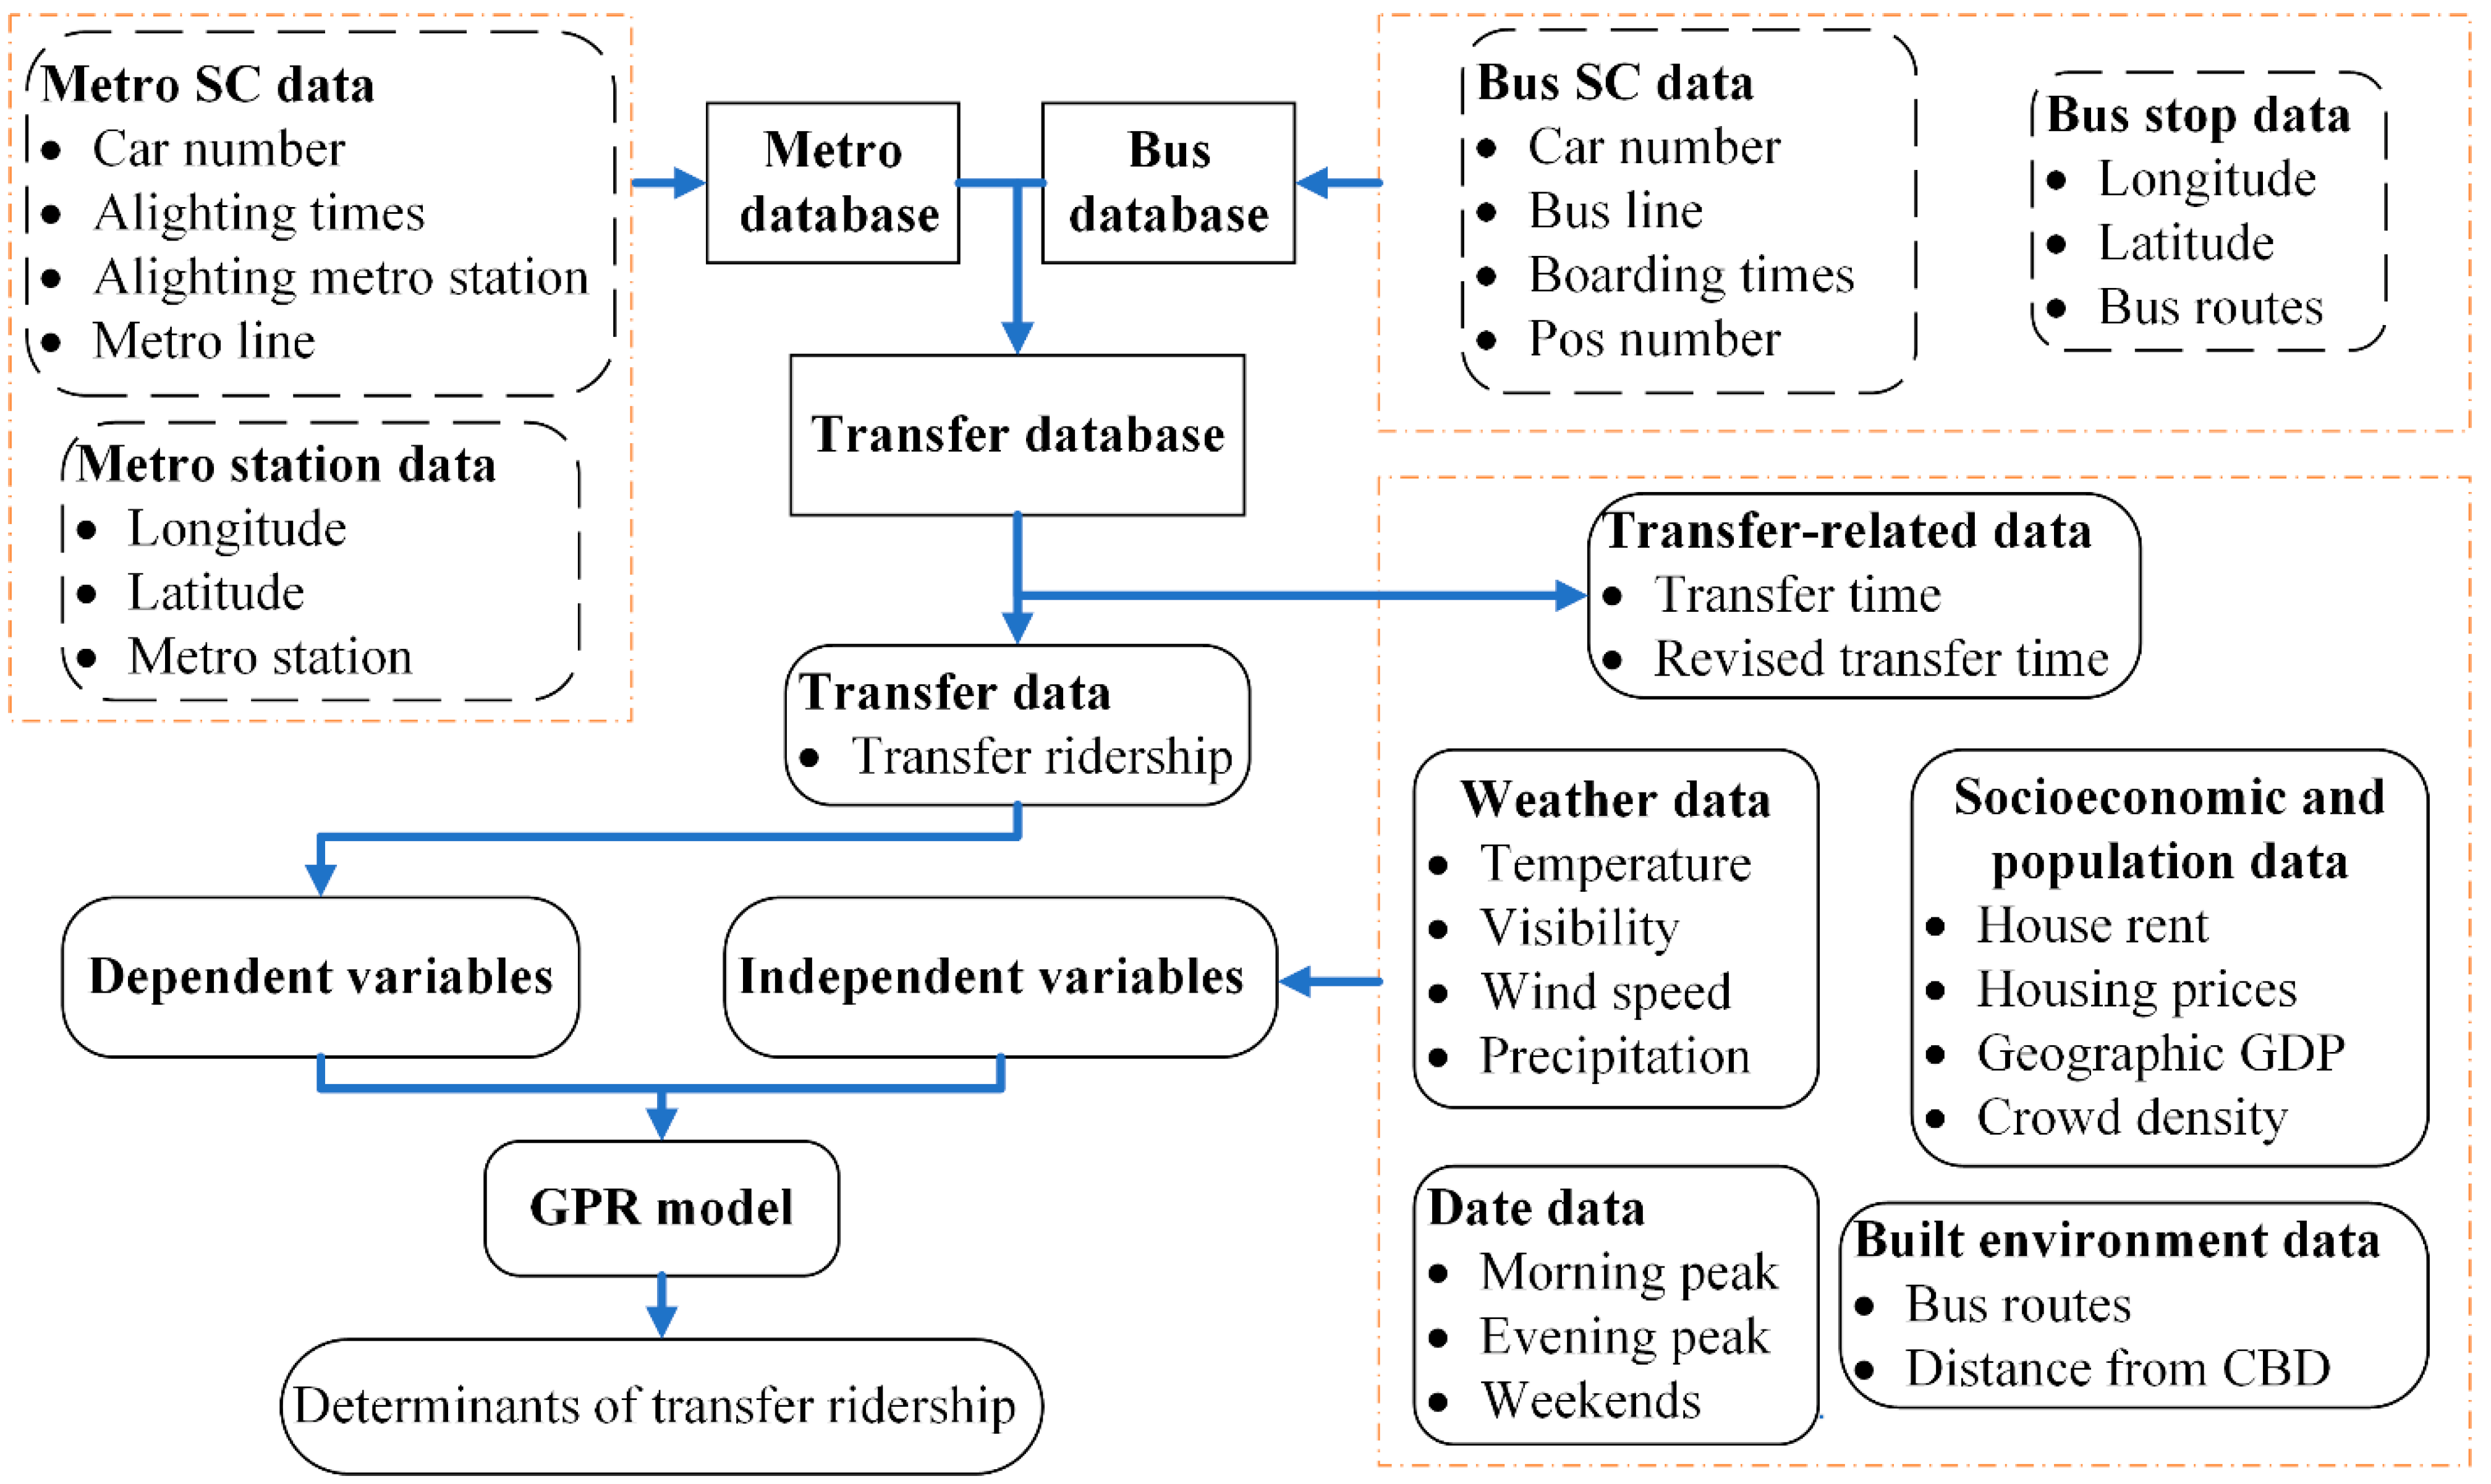
3.2. Data sources and Data Description
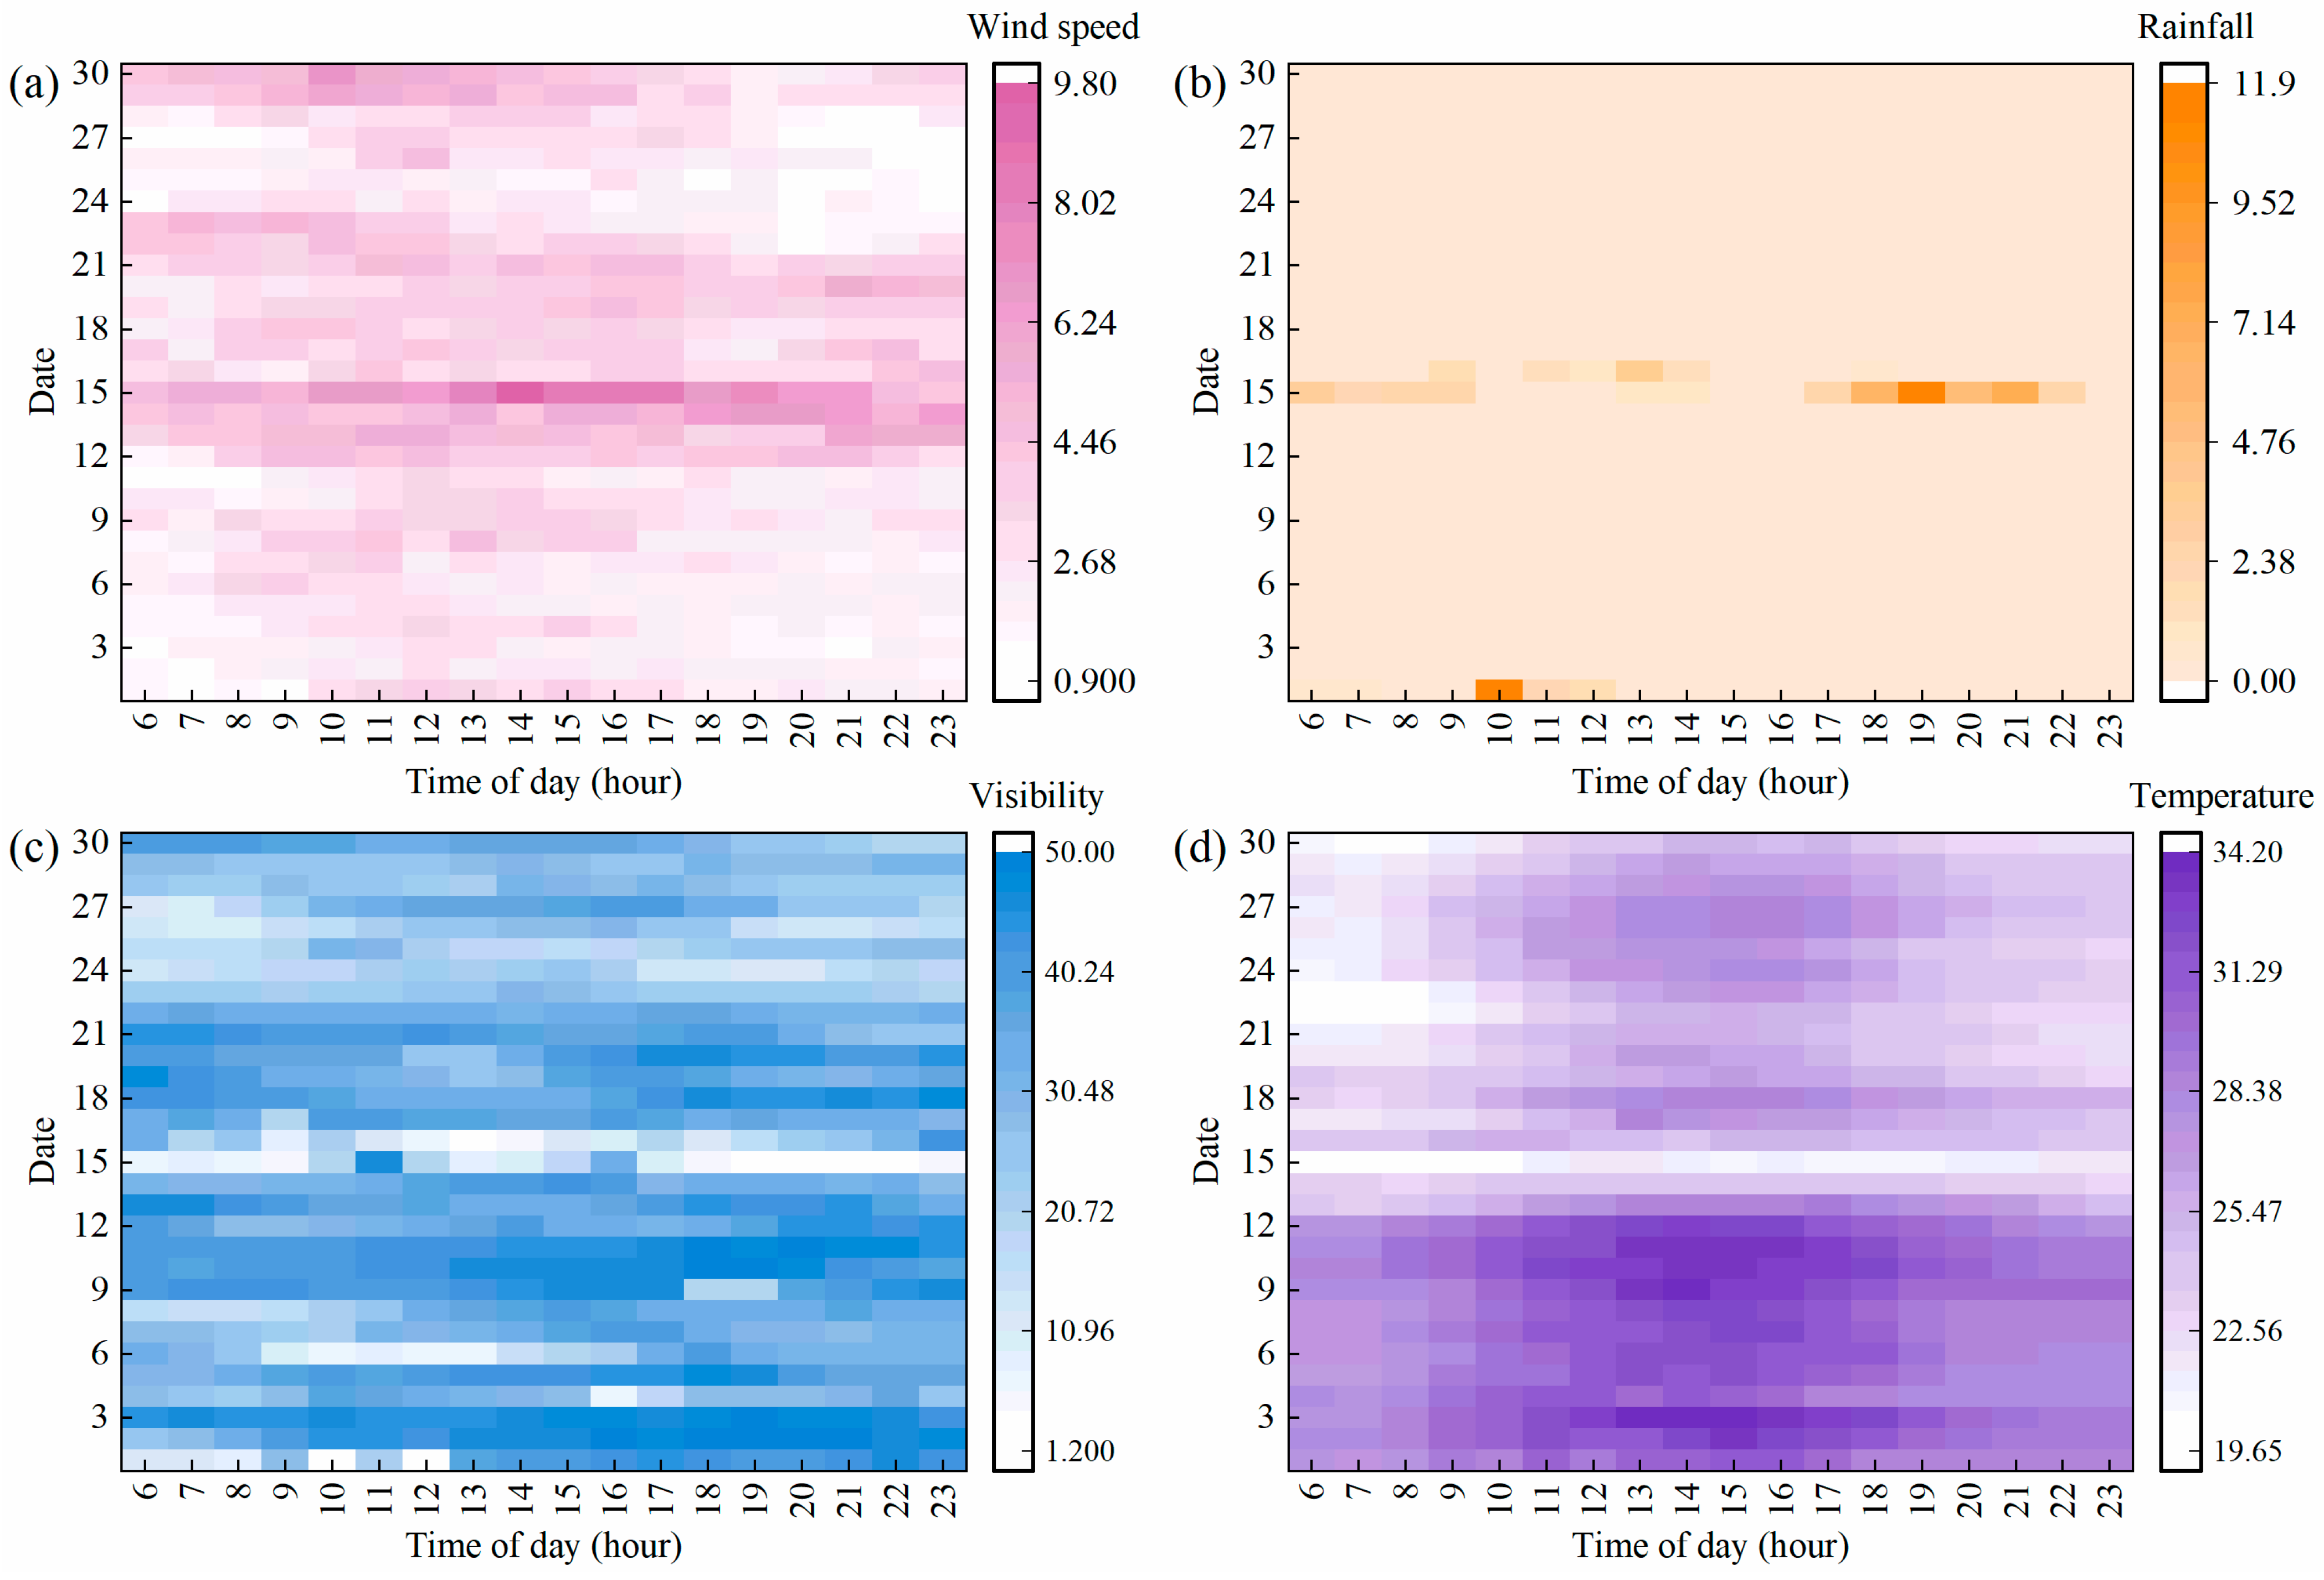
3.2.1. Weather Variable
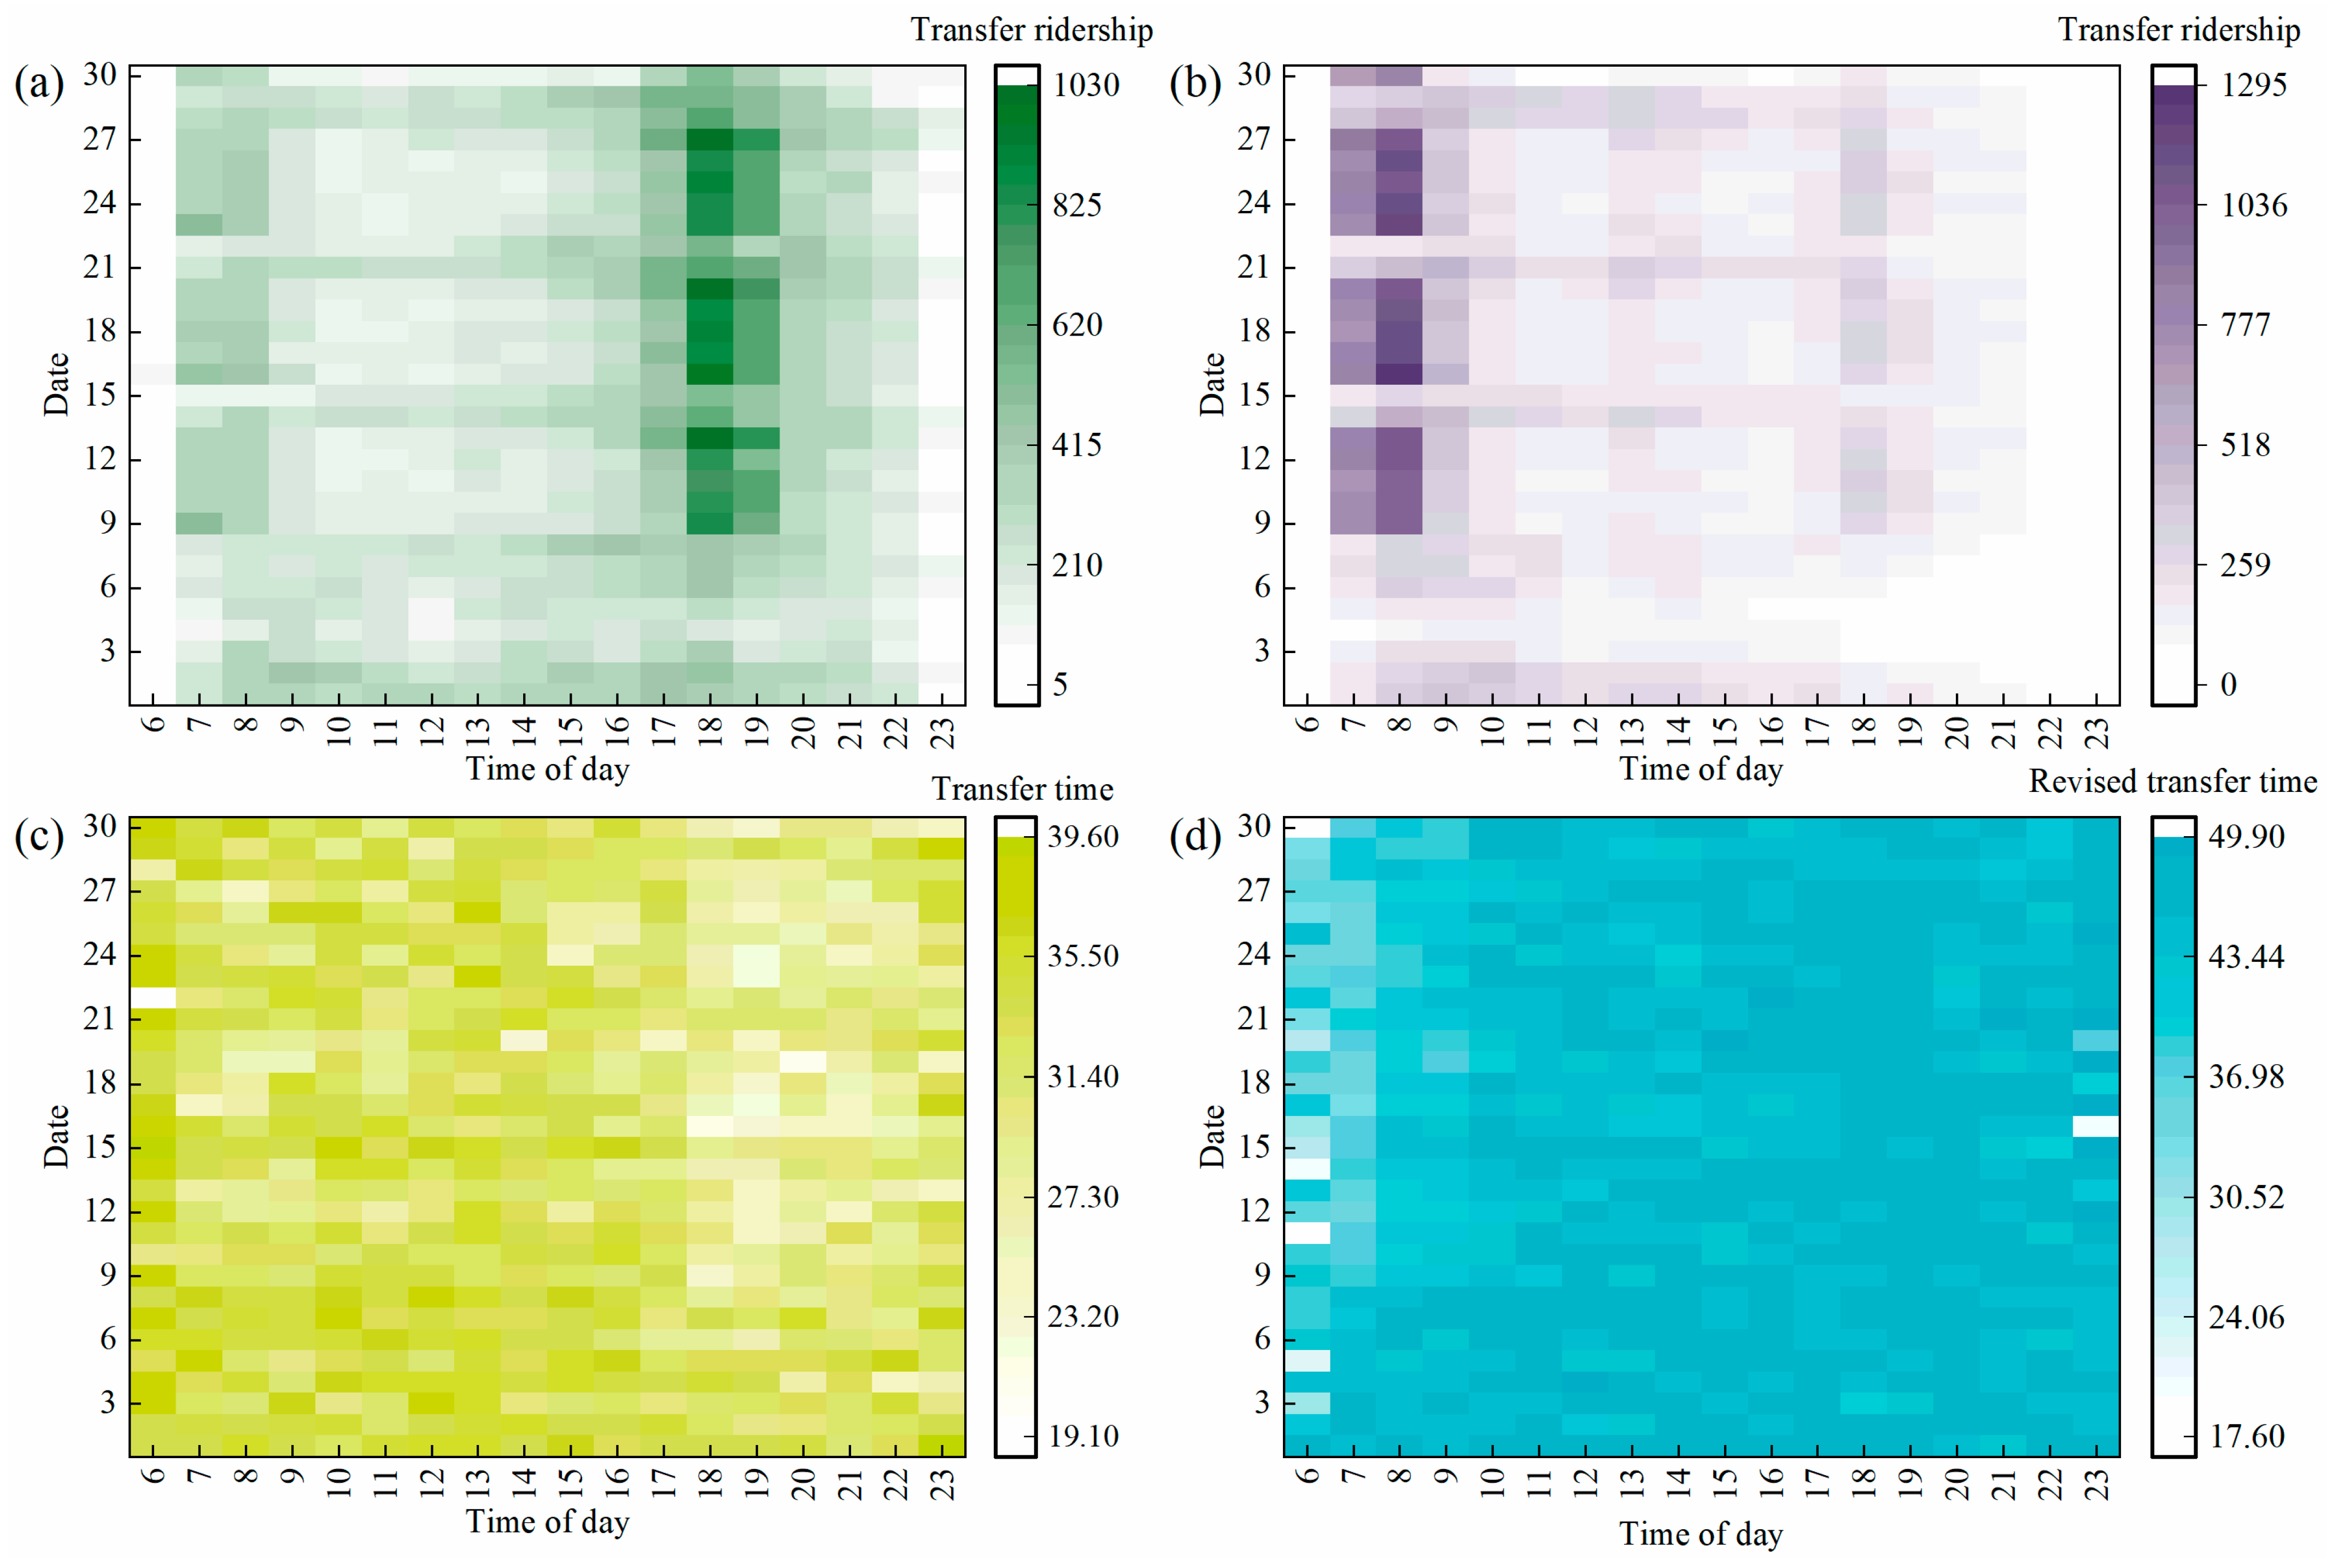
3.2.2. Transfer-Related Variables
3.2.3. Built Environment Variables
3.2.4. Socioeconomic and Population Variable
3.2.5. Date Variables
3.3. Description and Statistical Distribution of the Variables
4. Methodology
5. Results and Discussions
5.1. Results
5.1.1. The Determinants of Transfer Ridership on Weekdays and Weekends
5.1.2. The Determinants of Transfer Ridership on Holidays
5.1.3. The Determinants of Transfer Ridership during the Typhoon
5.2. Discussions
6. Conclusions
- It is feasible to adopt the GPR model to investigate the influence of each factor on the transfer ridership of different transfer modes on weekdays, holidays, and typhoon days, respectively.
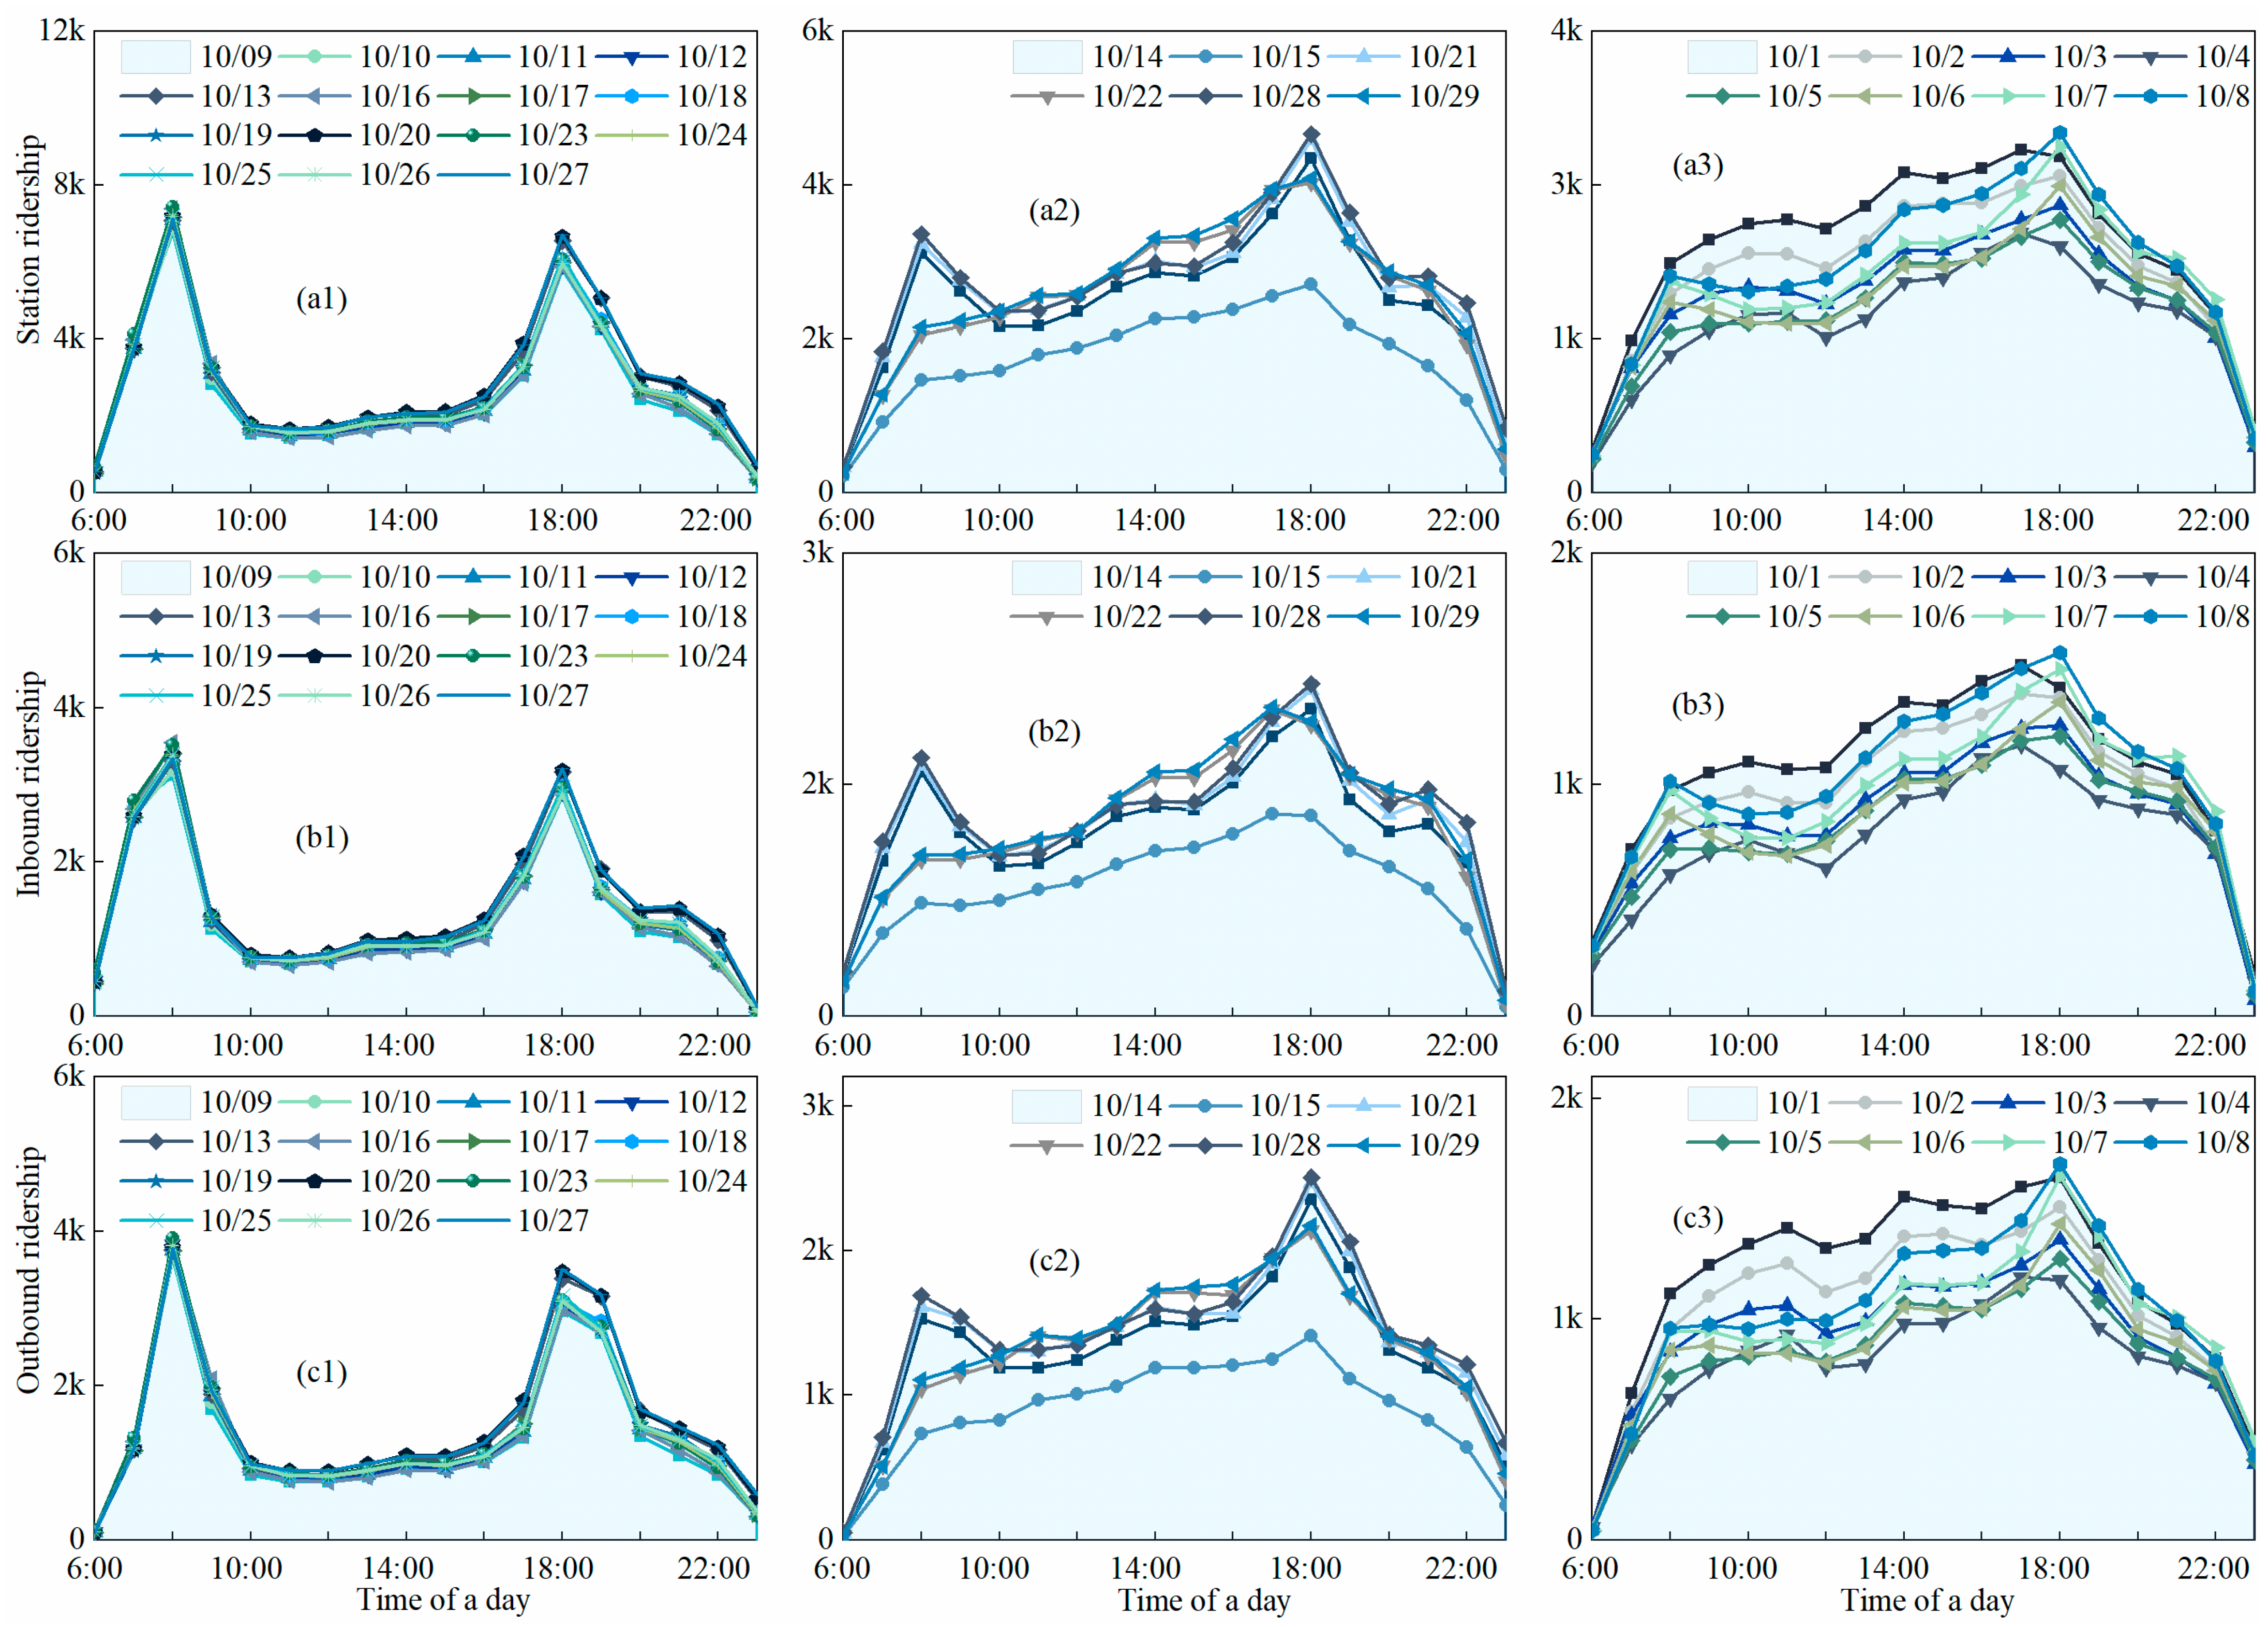
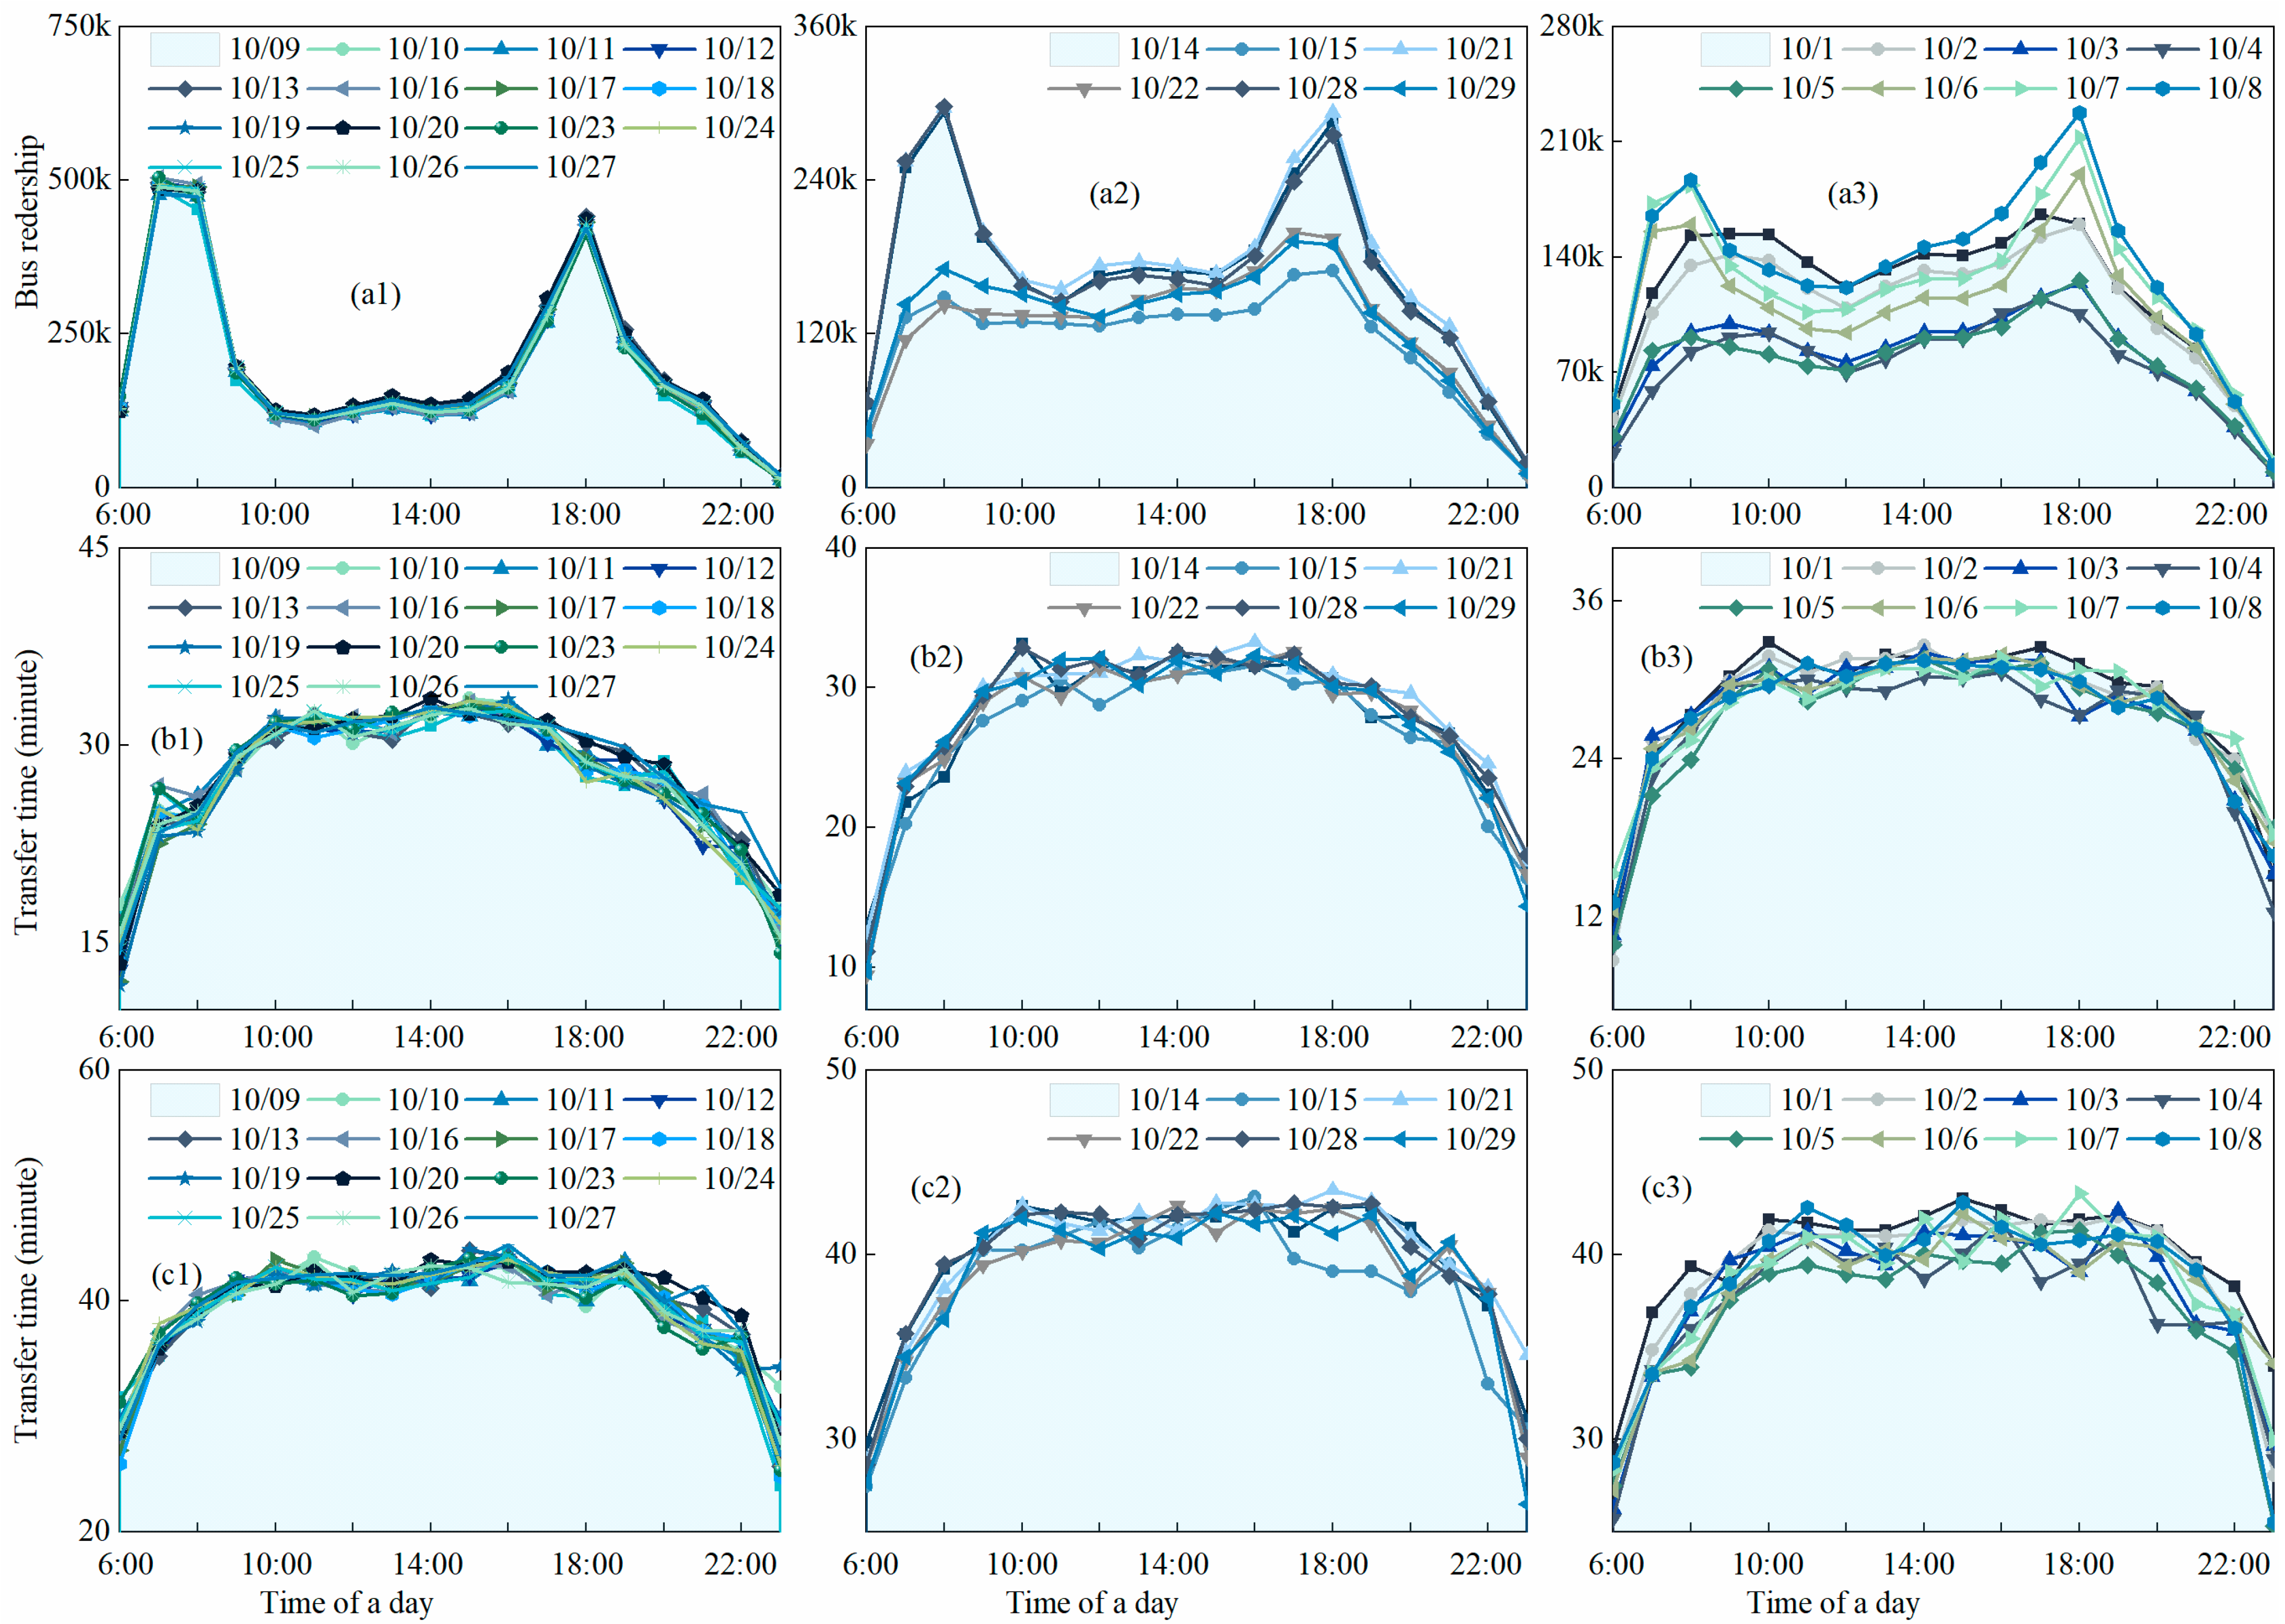
- The distribution of transfer ridership on weekdays consistently has a significant morning and evening peak. The distribution of transfer passenger flows on Saturdays is similar to that of weekdays and also has significant morning and evening peaks. Similarly, the distribution of transfer ridership on Sundays is consistent with that of transfer ridership on holidays, with large differences in the distribution of transfer ridership on different days. Moreover, the distribution of transfer time shows a strong consistency on weekdays, weekends, and holidays without significant morning or evening peaks.
- The impact of each factor on transfer ridership varies with dates and transfer modes. The impact of socioeconomic and demographic factors on transfer ridership is the most significant on different types of dates.
- Weather variables have little effect on transfer ridership on weekdays, but they have a greater effect on transfer ridership on holidays and typhoon days. Moreover, compared to the ridership on weekdays and holidays, the weather has the most significant impact on transfer ridership during typhoon weather.
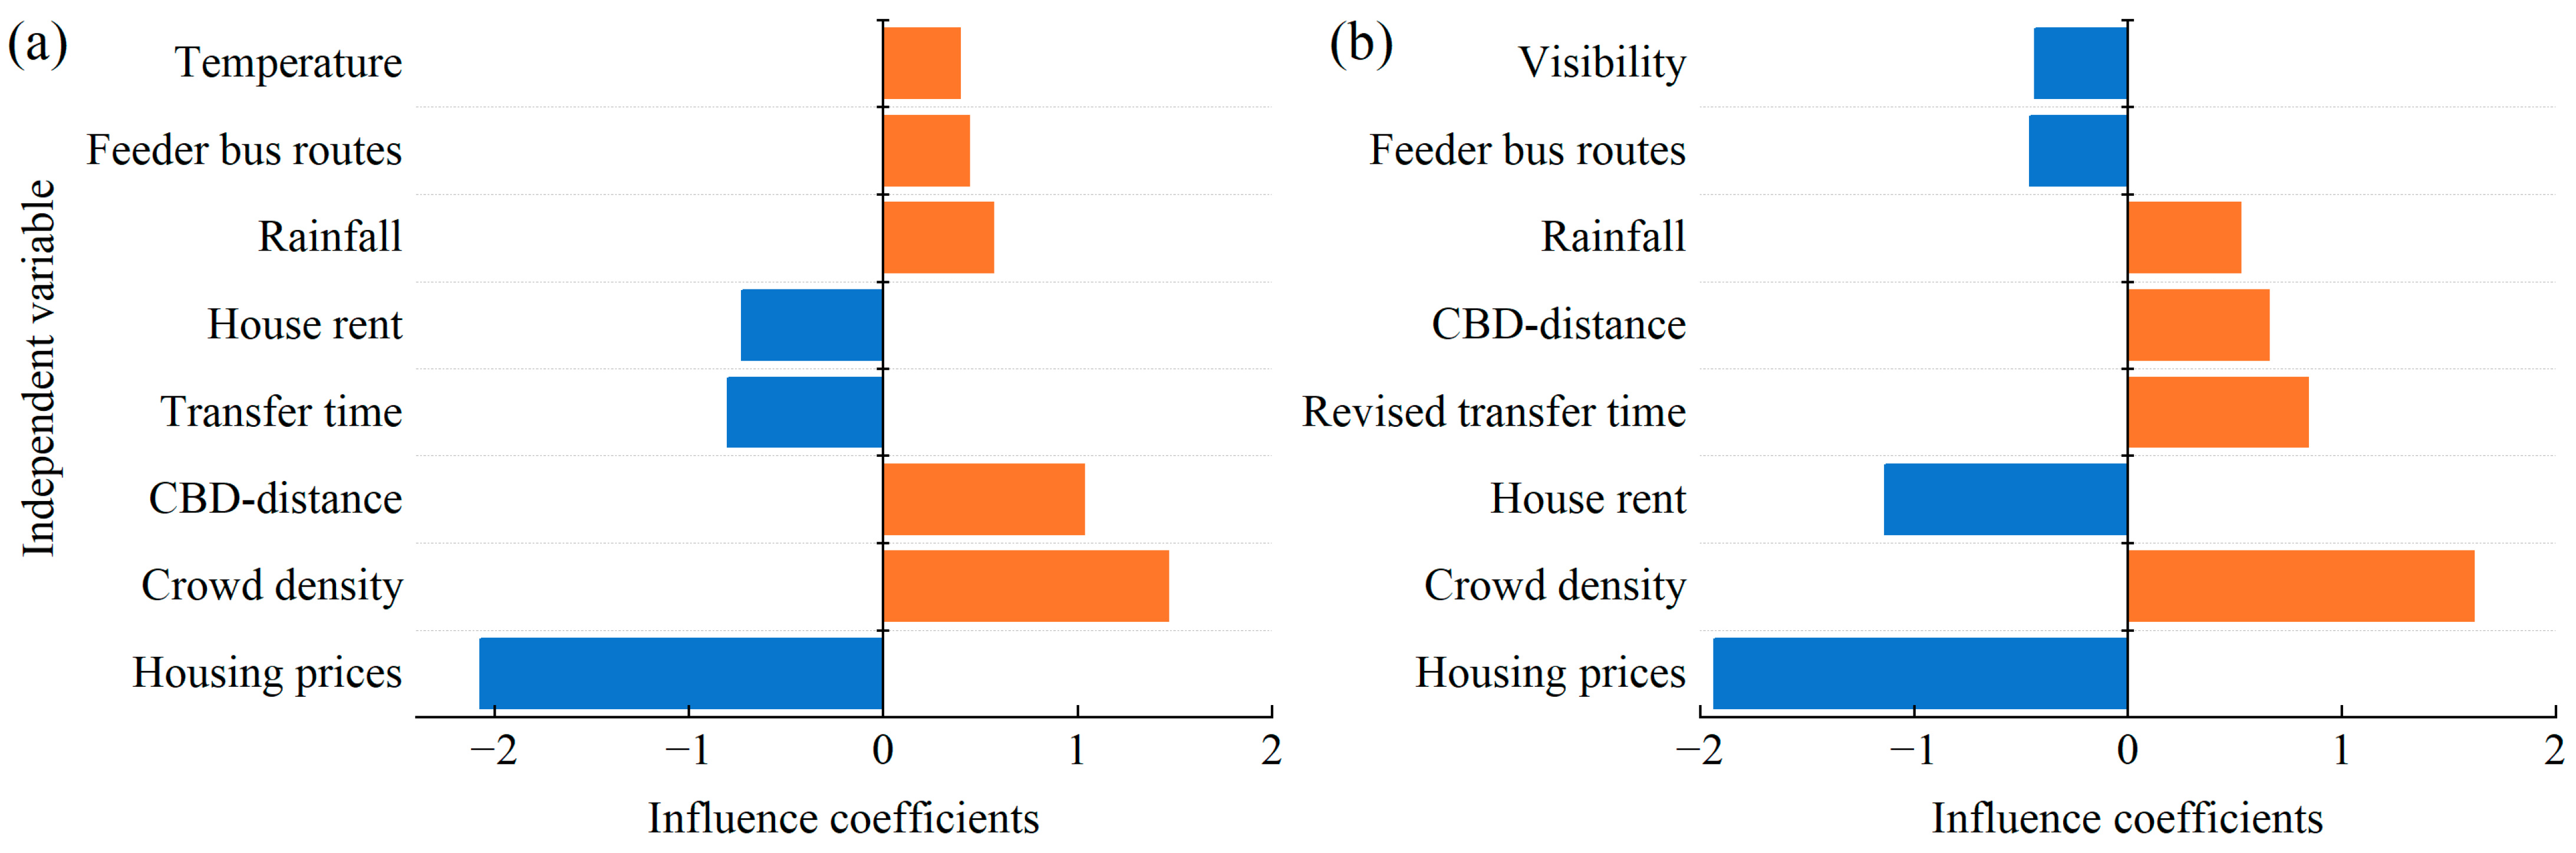
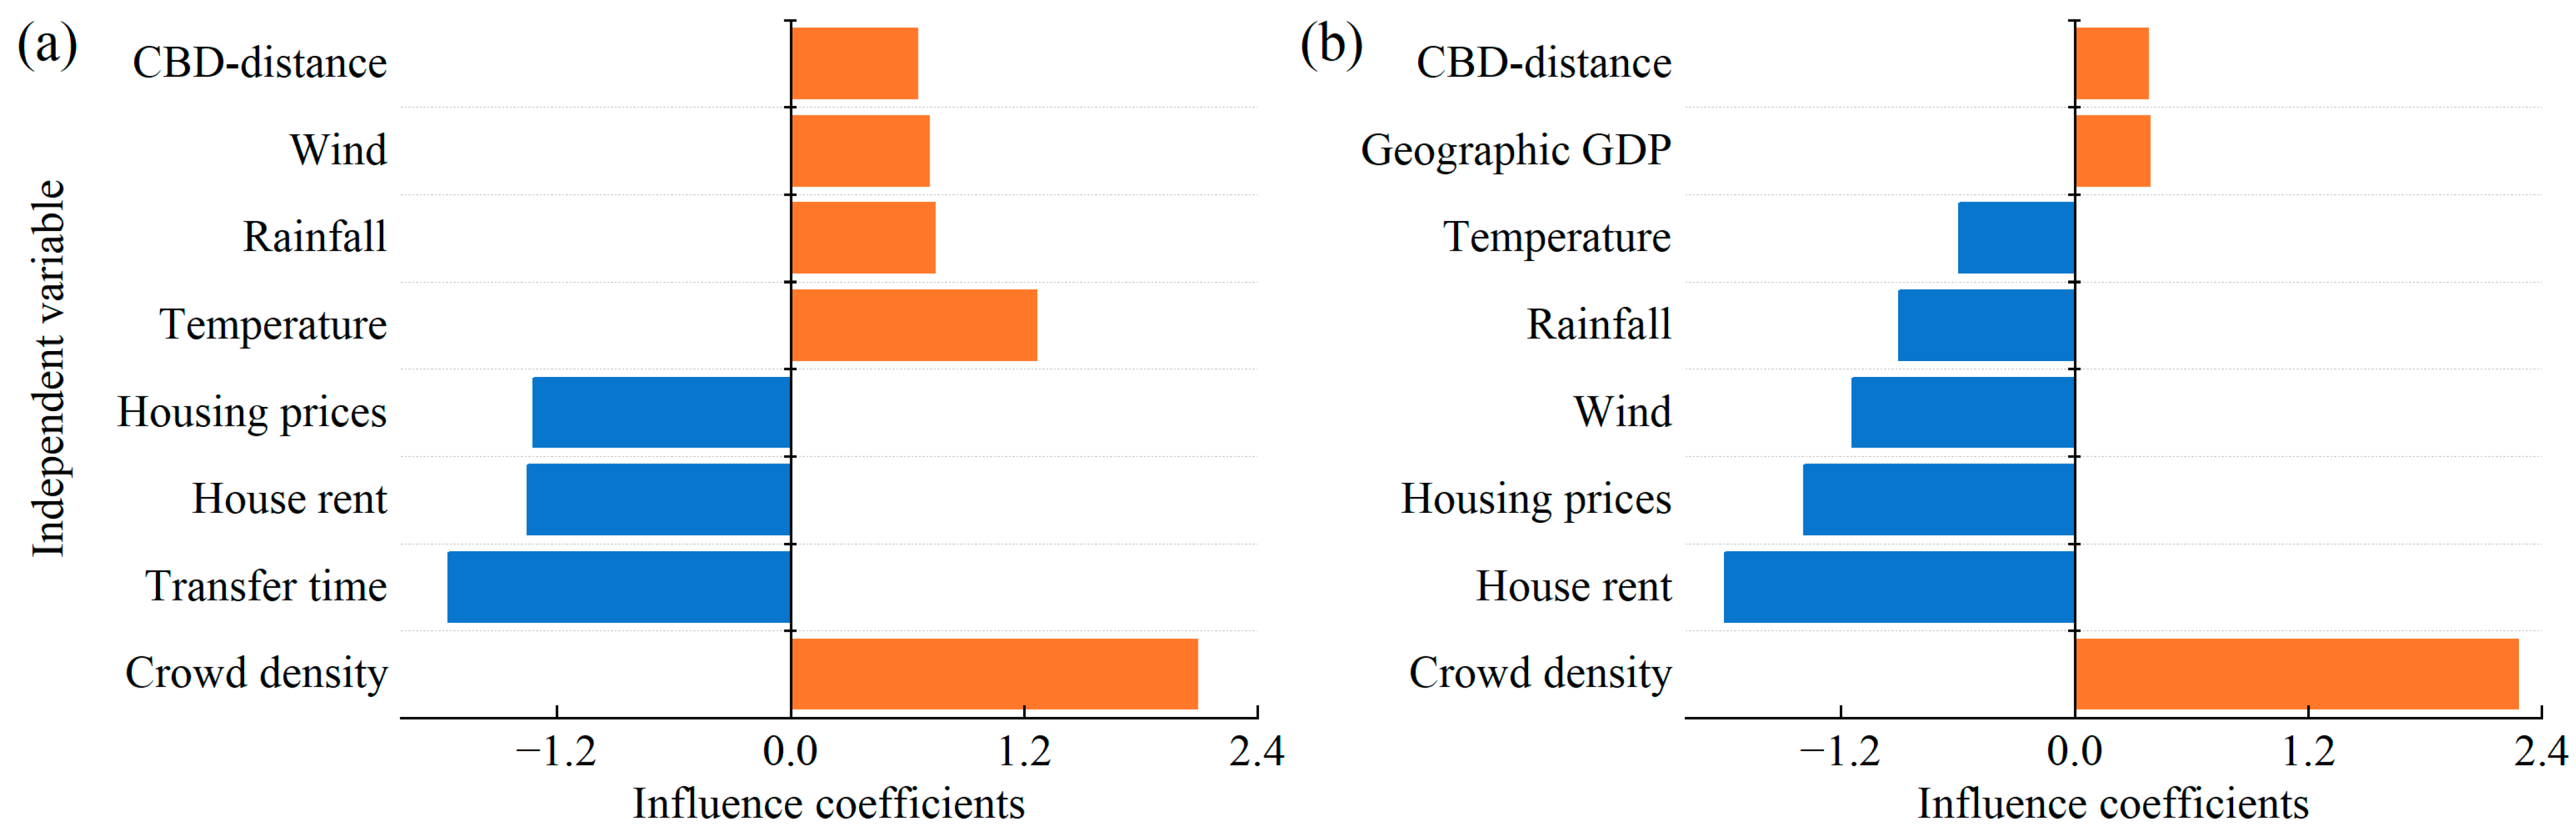
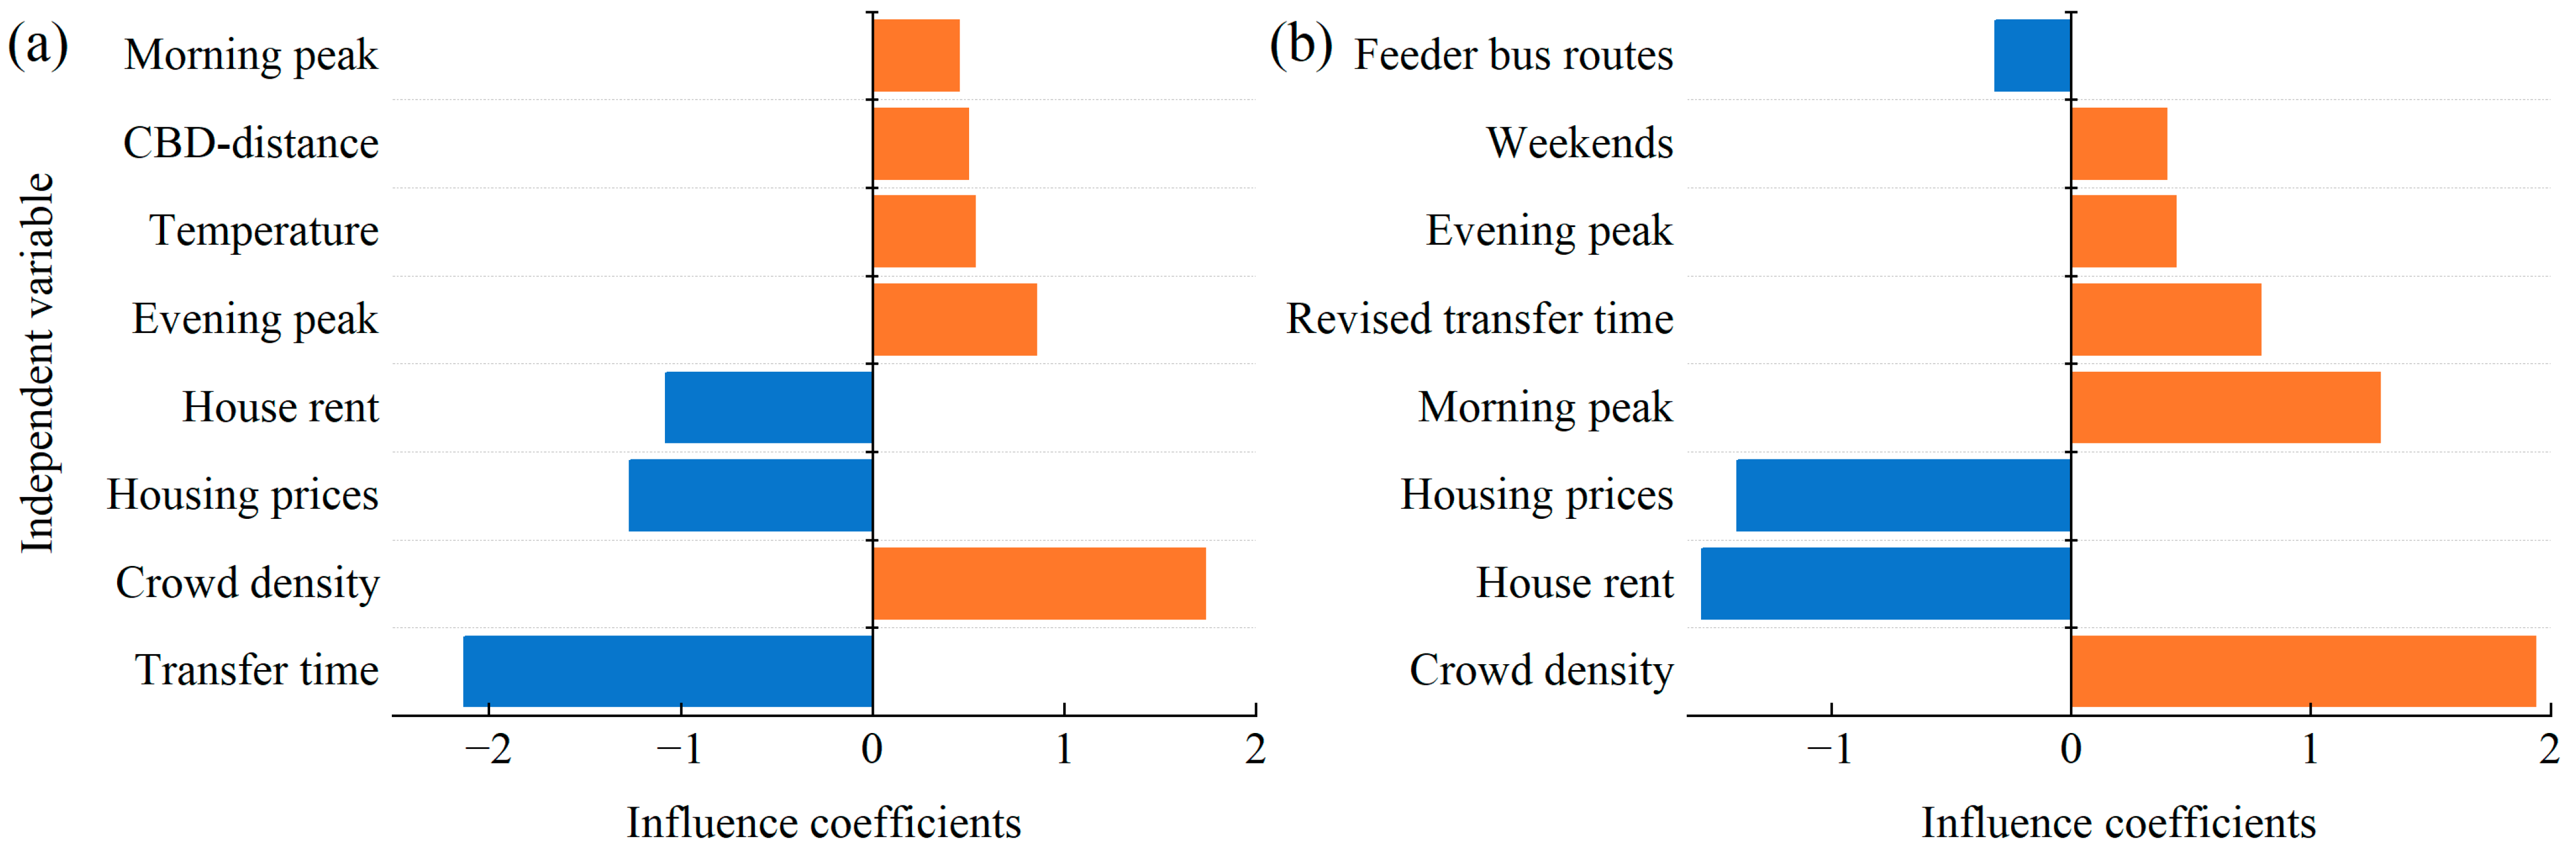
- Strong winds, heavy rain, and high temperatures increase the transfer ridership of the metro-to-bus mode but reduce the transfer ridership of the bus-to-metro mode. Moreover, among the weather variables, the temperature has the greatest impact on the transfer ridership of the metro-to-bus mode, while wind speed has the greatest impact on the transfer ridership of the bus-to-metro mode.
Author Contributions
Funding
Institutional Review Board Statement
Informed Consent Statement
Data Availability Statement
Acknowledgments
Conflicts of Interest
References
- Hamedmoghadam, H.; Vu, H.L.; Jalili, M.; Saberi, M.; Stone, L.; Hoogendoorn, S. Automated Extraction of Origin-Destination Demand for Public Transportation from Smartcard Data with Pattern Recognition. Transp. Res. Part C Emerg. Technol. 2021, 129, 103210. [Google Scholar] [CrossRef]
- Zhao, J.; Qu, Q.; Zhang, F.; Xu, C.; Liu, S. Spatio-Temporal Analysis of Passenger Travel Patterns in Massive Smart Card Data. IEEE Trans. Intell. Transp. Syst. 2017, 18, 3135–3146. [Google Scholar] [CrossRef]
- Wang, Z.; Chen, F.; Xu, T. Interchange between Metro and Other Modes: Access Distance and Catchment Area. J. Urban Plan. Dev. 2016, 142, 04016012. [Google Scholar] [CrossRef]
- Zhaowei, Q.; Haitao, L.; Zhihui, L.; Tao, Z. Short-Term Traffic Flow Forecasting Method with M-B-LSTM Hybrid Network. IEEE Trans. Intell. Transp. Syst. 2022, 23, 225–235. [Google Scholar] [CrossRef]
- Chen, E.; Zhang, W.; Ye, Z.; Yang, M. Unraveling Latent Transfer Patterns Between Metro and Bus From Large-Scale Smart Card Data. IEEE Trans. Intell. Transp. Syst. 2020, 23, 3351–3365. [Google Scholar] [CrossRef]
- Wang, F.; Ye, M. Optimization Method for Conventional Bus Stop Placement and the Bus Line Network Based on the Voronoi Diagram. Sustainability 2022, 14, 7918. [Google Scholar] [CrossRef]
- Fadhlullah, M.; Bakar, A.; Norhisham, S.; Katman, H.Y.; Fai, C.M.; Najwa, N.; Mohd, I.; Sarah, N.; Samsudin, S. Service Quality of Bus Performance in Asia: A Systematic Literature Review and Conceptual Framework. Sustainability 2022, 14, 7998. [Google Scholar]
- Hu, X.; Xu, Y.; Guo, J.; Zhang, T.; Bi, Y.; Liu, W.; Zhou, X. A Complete Information Interaction-Based Bus Passenger Flow Control Model for Epidemic Spread Prevention. Sustainability 2022, 14, 8032. [Google Scholar] [CrossRef]
- Seaborn, C.; Attanucci, J.; Wilson, N.H.M. Analyzing Multimodal Public Transport Journeys in London with Smart Card Fare Payment Data. Transp. Res. Rec. 2009, 2121, 55–62. [Google Scholar] [CrossRef]
- Huang, Z.; Xu, L.; Lin, Y.; Wu, P.; Feng, B. Citywide Metro-to-Bus Transfer Behavior Identification Based on Combined Data from Smart Cards and GPS. Appl. Sci. 2019, 9, 3597. [Google Scholar] [CrossRef] [Green Version]
- Wu, P.; Huang, Z.; Pian, Y.; Xu, L.; Li, J.; Chen, K. A Combined Deep Learning Method with Attention-Based LSTM Model for Short-Term Traffic Speed Forecasting. J. Adv. Transp. 2020, 2020, 8863724. [Google Scholar] [CrossRef]
- Espino, R.; Román, C. Valuation of Transfer for Bus Users: The Case of Gran Canaria. Transp. Res. Part A Policy Pract. 2020, 137, 131–144. [Google Scholar] [CrossRef]
- Schakenbos, R.; La Paix, L.; Nijenstein, S.; Geurs, K.T. Valuation of a Transfer in a Multimodal Public Transport Trip. Transp. Policy 2016, 46, 72–81. [Google Scholar] [CrossRef]
- Pineda, C.; Schwarz, D.; Godoy, E. Comparison of Passengers’ Behavior and Aggregate Demand Levels on a Subway System Using Origin-Destination Surveys and Smartcard Data. Res. Transp. Econ. 2016, 59, 258–267. [Google Scholar] [CrossRef]
- Hao, T.; Zhang, Q.; Gao, P.; Huang, B.; Liang, B.; Li, X. An Overflowing Passengers Transfer Model for Metro Congestion Relieving Using Customized Bus. In Proceedings of the 2019 IEEE Intelligent Transportation Systems Conference (ITSC), Auckland, New Zealand, 27–30 October 2019; IEEE: Piscataway, NJ, USA, 2019; pp. 92–97. [Google Scholar] [CrossRef]
- Böcker, L.; Dijst, M.; Faber, J. Weather, Transport Mode Choices and Emotional Travel Experiences. Transp. Res. Part A Policy Pract. 2016, 94, 360–373. [Google Scholar] [CrossRef]
- Navarrete, F.J.; de Dios Ortúzar, J. Subjective Valuation of the Transit Transfer Experience: The Case of Santiago de Chile. Transp. Policy 2013, 25, 138–147. [Google Scholar] [CrossRef]
- Cools, M.; Moons, E.; Creemers, L.; Wets, G. Changes in Travel Behavior in Response to Weather Conditions: Do Type of Weather and Trip Purpose Matter? Transp. Res. Rec. 2010, 2157, 22–28. [Google Scholar] [CrossRef] [Green Version]
- Koetse, M.J.; Rietveld, P. The Impact of Climate Change and Weather on Transport: An Overview of Empirical Findings. Transp. Res. Part D Transp. Environ. 2009, 14, 205–221. [Google Scholar] [CrossRef]
- Tang, L.; Thakuriah, P.V. Ridership Effects of Real-Time Bus Information System: A Case Study in the City of Chicago. Transp. Res. Part C Emerg. Technol. 2012, 22, 146–161. [Google Scholar] [CrossRef]
- Müller, S.; Tscharaktschiew, S.; Haase, K. Travel-to-School Mode Choice Modelling and Patterns of School Choice in Urban Areas. J. Transp. Geogr. 2008, 16, 342–357. [Google Scholar] [CrossRef]
- Brandenburg, C.; Matzarakis, A.; Arnberger, A. The Effects of Weather on Frequencies of Use by Commuting and Recreation Bicyclists. Adv. Tour. Climatol. 2004, 12, 189–197. [Google Scholar]
- Yan, X.; Levine, J.; Zhao, X. Integrating Ridesourcing Services with Public Transit: An Evaluation of Traveler Responses Combining Revealed and Stated Preference Data. Transp. Res. Part C Emerg. Technol. 2019, 105, 683–696. [Google Scholar] [CrossRef]
- Yang, M.; Zhao, J.; Wang, W.; Liu, Z.; Li, Z. Metro Commuters’ Satisfaction in Multi-Type Access and Egress Transferring Groups. Transp. Res. Part D Transp. Environ. 2015, 34, 179–194. [Google Scholar] [CrossRef]
- Allard, R.F.; Moura, F. Effect of Transport Transfer Quality on Intercity Passenger Mode Choice. Transp. Res. Part A Policy Pract. 2018, 109, 89–107. [Google Scholar] [CrossRef]
- Zong, S.; Chen, S.; Alinizzi, M.; Labi, S. Leveraging UAV Capabilities for Vehicle Tracking and Collision Risk Assessment at Road Intersections. Sustainability 2022, 14, 4034. [Google Scholar] [CrossRef]
- Wu, F.; Ma, W. Clustering Analysis of the Spatio-Temporal On-Street Parking Occupancy Data: A Case Study in Hong Kong. Sustainability 2022, 14, 7957. [Google Scholar] [CrossRef]
- Tao, S.; Rohde, D.; Corcoran, J. Examining the Spatial-Temporal Dynamics of Bus Passenger Travel Behaviour Using Smart Card Data and the Flow-Comap. J. Transp. Geogr. 2014, 41, 21–36. [Google Scholar] [CrossRef]
- Krygsman, S.; Dijst, M.; Arentze, T. Multimodal Public Transport: An Analysis of Travel Time Elements and the Interconnectivity Ratio. Transp. Policy 2004, 11, 265–275. [Google Scholar] [CrossRef]
- Yang, X.; Wu, N.; Andrian, J.H. A Novel Bus Transfer Mode (AS Transfer) and a Performance Evaluation Methodology. Integration 2016, 52, 23–33. [Google Scholar] [CrossRef]
- Cheng, Y.H.; Tseng, W.C. Exploring the Effects of Perceived Values, Free Bus Transfer, and Penalties on Intermodal Metro-Bus Transfer Users’ Intention. Transp. Policy 2016, 47, 127–138. [Google Scholar] [CrossRef]
- Zhou, M.; Wang, D.; Li, Q.; Yue, Y.; Tu, W.; Cao, R. Impacts of Weather on Public Transport Ridership: Results from Mining Data from Different Sources. Transp. Res. Part C Emerg. Technol. 2017, 75, 17–29. [Google Scholar] [CrossRef] [Green Version]
- Liu, C.; Susilo, Y.O.; Karlström, A. The Influence of Weather Characteristics Variability on Individual’s Travel Mode Choice in Different Seasons and Regions in Sweden. Transp. Policy 2015, 41, 147–158. [Google Scholar] [CrossRef]
- Miao, Q.; Welch, E.W.; Sriraj, P.S. Extreme Weather, Public Transport Ridership and Moderating Effect of Bus Stop Shelters. J. Transp. Geogr. 2019, 74, 125–133. [Google Scholar] [CrossRef]
- Liu, C.; Susilo, Y.O.; Karlström, A. Investigating the Impacts of Weather Variability on Individual’s Daily Activity-Travel Patterns: A Comparison between Commuters and Non-Commuters in Sweden. Transp. Res. Part A Policy Pract. 2015, 82, 47–64. [Google Scholar] [CrossRef]
- Jinlim, W.; Xiangfeng, L.; Yuhua, W.; Yan, Y. Study on Optimization of Urban Public Transit Networks Based on Transfer Coefficient. In Proceedings of the 2011 International Conference on Transportation, Mechanical, and Electrical Engineering (TMEE), Changchun, China, 16–18 December 2011; IEEE: Piscataway, NJ, USA, 2019; pp. 67–70. [Google Scholar] [CrossRef]
- Garcia-Martinez, A.; Cascajo, R.; Jara-Diaz, S.R.; Chowdhury, S.; Monzon, A. Transfer Penalties in Multimodal Public Transport Networks. Transp. Res. Part A Policy Pract. 2018, 114, 52–66. [Google Scholar] [CrossRef]
- Iseki, H.; Taylor, B.D. Not All Transfers Are Created Equal: Towards a Framework Relating Transfer Connectivity to Travel Behaviour. Transp. Rev. 2009, 29, 777–800. [Google Scholar] [CrossRef]
- Cascajo, R.; Lopez, E.; Herrero, F.; Monzon, A. User Perception of Transfers in Multimodal Urban Trips: A Qualitative Study. Int. J. Sustain. Transp. 2019, 13, 393–406. [Google Scholar] [CrossRef]
- Gao, K.; Yang, Y.; Li, A.; Li, J.; Yu, B. Quantifying Economic Benefits from Free-Floating Bike-Sharing Systems: A Trip-Level Inference Approach and City-Scale Analysis. Transp. Res. Part A Policy Pract. 2021, 144, 89–103. [Google Scholar] [CrossRef]
- Singhal, A.; Kamga, C.; Yazici, A. Impact of Weather on Urban Transit Ridership. Transp. Res. Part A Policy Pract. 2014, 69, 379–391. [Google Scholar] [CrossRef]
- Arana, P.; Cabezudo, S.; Peñalba, M. Influence of Weather Conditions on Transit Ridership: A Statistical Study Using Data from Smartcards. Transp. Res. Part A Policy Pract. 2014, 59, 1–12. [Google Scholar] [CrossRef]
- Yang, X.; Yue, X.; Sun, H.; Gao, Z.; Wang, W. Impact of Weather on Freeway Origin-Destination Volume in China. Transp. Res. Part A Policy Pract. 2021, 143, 30–47. [Google Scholar] [CrossRef]
- Li, L.; Wang, J.; Song, Z.; Dong, Z.; Wu, B. Analysing the Impact of Weather on Bus Ridership Using Smart Card Data. IET Intell. Transp. Syst. 2015, 9, 221–229. [Google Scholar] [CrossRef]
- Wei, M.; Liu, Y.; Sigler, T.; Liu, X.; Corcoran, J. The Influence of Weather Conditions on Adult Transit Ridership in the Sub-Tropics. Transp. Res. Part A Policy Pract. 2019, 125, 106–118. [Google Scholar] [CrossRef]
- Böcker, L.; Dijst, M.; Prillwitz, J. Impact of Everyday Weather on Individual Daily Travel Behaviours in Perspective: A Literature Review. Transp. Rev. 2013, 33, 71–91. [Google Scholar] [CrossRef]
- Chen, E.; Ye, Z.; Wang, C.; Xu, M. Subway Passenger Flow Prediction for Special Events Using Smart Card Data. IEEE Trans. Intell. Transp. Syst. 2020, 21, 1109–1120. [Google Scholar] [CrossRef]
- Chen, E.; Ye, Z.; Wang, C.; Zhang, W. Discovering the Spatio-Temporal Impacts of Built Environment on Metro Ridership Using Smart Card Data. Cities 2019, 95, 102359. [Google Scholar] [CrossRef]
- Li, J.; Xu, L.; Li, R.; Wu, P.; Huang, Z. Deep Spatial-Temporal Bi-Directional Residual Optimisation Based on Tensor Decomposition for Traffic Data Imputation on Urban Road Network. Appl. Intell. 2022, 52, 11363–11381. [Google Scholar] [CrossRef]
- Wu, P.; Xu, L.; Huang, Z. Imputation Methods Used in Missing Traffic Data: A Literature Review. In Artificial Intelligence Algorithms and Applications; Li, K., Li, W., Wang, H., Liu, Y., Eds.; Springer: Singapore, 2020; Volume 1205, ISBN 9789811555763. [Google Scholar]
- Huang, Z.; Xu, L.; Lin, Y. Multi-Stage Pedestrian Positioning Using Filtered Wifi Scanner Data in an Urban Road Environment. Sensors 2020, 20, 3259. [Google Scholar] [CrossRef]
- Huang, Z.; Zhu, X.; Lin, Y.; Xu, L.; Mao, Y. A Novel WIFI-Oriented RSSI Signal Processing Method for Tracking Low-Speed Pedestrians. In Proceedings of the 2019 5th International Conference on Transportation Information and Safety (ICTIS), Liverpool, UK, 14–17 July 2019; IEEE: Piscataway, NJ, USA, 2019; pp. 1018–1023. [Google Scholar] [CrossRef]
- Ma, X.; Zhang, J.; Ding, C.; Wang, Y. A Geographically and Temporally Weighted Regression Model to Explore the Spatiotemporal Influence of Built Environment on Transit Ridership. Comput. Environ. Urban Syst. 2018, 70, 113–124. [Google Scholar] [CrossRef]
- Li, W.; Chen, S.; Dong, J.; Wu, J. Exploring the Spatial Variations of Transfer Distances between Dockless Bike-Sharing Systems and Metros. J. Transp. Geogr. 2021, 92, 103032. [Google Scholar] [CrossRef]
- Zhao, D.; Wang, W.; Woodburn, A.; Ryerson, M.S. Isolating High-Priority Metro and Feeder Bus Transfers Using Smart Card Data. Transportation 2017, 44, 1535–1554. [Google Scholar] [CrossRef]
- Zhao, D.; Wang, W.; Li, C.; Ji, Y.; Hu, X.; Wang, W. Recognizing Metro-Bus Transfers from Smart Card Data. Transp. Plan. Technol. 2019, 42, 70–83. [Google Scholar] [CrossRef]
- Wu, P.; Xu, L.; Li, J.; Guo, H.; Huang, Z. Recognizing Real-Time Transfer Patterns between Metro and Bus Systems Based on Spatial—Temporal Constraints. J. Transp. Eng. Part A Syst. 2022, 148, 04022065. [Google Scholar] [CrossRef]
- Gordon, J.B.; Koutsopoulos, H.N.; Wilson, N.H.M.; Attanucci, J.P. Automated Inference of Linked Transit Journeys in London Using Fare-Transaction and Vehicle Location Data. Transp. Res. Rec. 2013, 2343, 17–24. [Google Scholar] [CrossRef]
- Huang, H.; Wang, T.; Liu, J.; Xie, S. Predicting Urban Rail Traffic Passenger Flow Based on LSTM. In Proceedings of the 2019 IEEE 3rd Information Technology, Networking, Electronic and Automation Control Conference (ITNEC), Chengdu, China, 15–17 March 2019; IEEE: Piscataway, NJ, USA, 2019; pp. 616–620. [Google Scholar] [CrossRef]
- Mutz, R.; Daniel, H.D. How to Consider Fractional Counting and Field Normalization in the Statistical Modeling of Bibliometric Data: A Multilevel Poisson Regression Approach. J. Informetr. 2019, 13, 643–657. [Google Scholar] [CrossRef]
- Yadav, B.; Jeyaseelan, L.; Jeyaseelan, V.; Durairaj, J.; George, S.; Selvaraj, K.G.; Bangdiwala, S.I. Can Generalized Poisson Model Replace Any Other Count Data Models? An Evaluation. Clin. Epidemiol. Glob. Health 2021, 11, 100774. [Google Scholar] [CrossRef]
- Bae, S.; Famoye, F.; Wulu, J.T.; Bartolucci, A.A.; Singh, K.P. A Rich Family of Generalized Poisson Regression Models with Applications. Math. Comput. Simul. 2005, 69, 4–11. [Google Scholar] [CrossRef]
- Khattak, M.W.; Pirdavani, A.; De Winne, P.; Brijs, T.; De Backer, H. Estimation of Safety Performance Functions for Urban Intersections Using Various Functional Forms of the Negative Binomial Regression Model and a Generalized Poisson Regression Model. Accid. Anal. Prev. 2021, 151, 105964. [Google Scholar] [CrossRef]
- Yang, Z.; Hardin, J.W.; Addy, C.L. A Score Test for Overdispersion in Poisson Regression Based on the Generalized Poisson-2 Model. J. Stat. Plan. Inference 2009, 139, 1514–1521. [Google Scholar] [CrossRef]
- Ibeji, J.U.; Zewotir, T.; North, D.; Amusa, L. Modelling Fertility Levels in Nigeria Using Generalized Poisson Regression-Based Approach. Sci. Afr. 2020, 9, e00494. [Google Scholar] [CrossRef]
- Almasi, A.; Eshraghian, M.R.; Moghimbeigi, A.; Rahimi, A.; Mohammad, K.; Fallahigilan, S. Multilevel Zero-Inflated Generalized Poisson Regression Modeling for Dispersed Correlated Count Data. Stat. Methodol. 2016, 30, 1–14. [Google Scholar] [CrossRef]
- Chen, X.; Yu, R.; Ullah, S.; Wu, D.; Li, Z.; Li, Q.; Qi, H.; Liu, J.; Liu, M.; Zhang, Y. A Novel Loss Function of Deep Learning in Wind Speed Forecasting. Energy 2022, 238, 121808. [Google Scholar] [CrossRef]


| Authors | Research Subjects | Data and Resource | The Key Findings | The Critical Factors | Methods |
|---|---|---|---|---|---|
| |||||
| Cheng et al. [31] | The effects of perceived values, free bus transfer, and penalties on the metro–bus transfer users’ intention | Questionnaire study survey data, samples include potential and retained users of the metro system | Perceived transfer penalties, perceived values, and free bus transfer all influence metro–bus transfer intentions. Perceived value is the most essential determinant of behavioral intention and can mediate the relationship between free bus transfer and transfer intentions. | perceived value, transfer penalties, FBT, and behavior intention. | Systematic sampling method, the perceived value theory |
| Navarrete & Ortúzar [17] | Subjective valuation of the transit transfer experience | Stated choice surveys | The most penalized time was the transfer wait time, the next largest time component disutilities were those associated with the initial and final walk times. | Walk time, wait time, travel time, transfer walk time, transfer wait time | The mixed logit (ML) model |
| Schakenbos et al. [13] | Valuation of a transfer in a multimodal public transport trip | Stated preference experiment | Total disutility during the transfer depends on the total time, the distribution of the time spent, and headway. The most optimal transfer time is found to be 8 min. | Travel time, transfer time, headway, costs, and station facilities | Mixed logit models |
| Espino & Román [12] | Valuation of transfer for bus users | Stated Preference experiment | The improvement opportunities for transport systems should focus on the reduction in the transfer cost except for individuals of class 2 and improving the level of service. | Travel time, travel cost, headway, transfer waiting time, trip purpose | Mixed logit and latent class (LC) models |
| Yang et al. [24] | Metro commuters’ satisfaction with multi-type access and egress transferring groups | Survey data | With two transfers between bus and metro, transit-metro-transit users indicate that the weak point in the access stage is the crowded spaces on buses. Transit-metro-transit users value bus on-time performance. | Personal attributes, journey details (transfer/commute time ratio), access service, and egress service | Logistic model |
| |||||
| Zhou et al. [32] | Impacts of weather on public transport ridership | Smart card data, meteorological records | The weather has more influence than others on public transportation, metro station in urban are more vulnerable to outdoor weather. | Bus/metro ridership, wind speed, rainfall, humidity | Multivariate regression models |
| Liu et al. [33] | The influence of weather on an individual’s travel mode choice | The travel data is Swedish National Transport Survey Data. The Swedish Meteorological data. | The impacts of weather differ in different seasons and regions. Winter increases the possibility of individuals choosing to walk and public transport and decreases the possibility of individuals choosing cycling, the opposite seems to be true for summer. | Seasons, trip distance/ purpose, precipitation, transformed temperature, car ownership | Multinomial logit models |
| Miao et al. [34] | Extreme weather influences transport ridership | The Global Historical Climatology Network data, the UTA bus ridership | Bus stop shelters have a modest effect on mitigating ridership losses resulting from these adverse weather conditions. Public transport can attract more ridership on extreme weather days. | Bad weather days, number of transfers, stop density, income, race, age | Panel regression model |
| Liu et al. [35] | The impacts of weather variability on an individual’s daily activity-travel patterns | Datasets from the Swedish National Travel Survey and the Swedish Meteorological | Commuters are much less sensitive to weather changes than non-commuters. Variation of monthly average temperature greatly influences individual travel behavior than the variation of daily temperature relative to its monthly mean. | Endogenous variables, trip purpose, commute distance, weather variables | Structural equation models |
| Variables | Definitions | Unit | Mean | Sd. |
|---|---|---|---|---|
| Dependent variables | ||||
| Transfer ridership | The number of transfer passengers from metro to bus per hour. | 111 | 165 | |
| The number of transfer passengers from bus to metro per hour. | 120 | 198 | ||
| Independent variables | ||||
| Weather variables | ||||
| Temperature | Highest temperature per hour. | °C | 26.8 | 3.47 |
| Wind | Average wind speed per hour. | m/s | 3.16 | 1.34 |
| Visibility | Minimum visibility per hour. | m | 31.94 | 10.92 |
| Rainfall | Hourly accumulated precipitation. | mm | 0.15 | 0.94 |
| Transfer-related variables | ||||
| Transfer time | Hourly difference time threshold from metro alighting to bus boarding. | 28.6 | 7.56 | |
| Revised transfer time | Hourly difference time threshold from bus boarding to metro boarding. | 39.92 | 8.66 | |
| Socioeconomic and population variables | ||||
| House rent | Average house rent near metro stations. | 12.57 | 3.26 | |
| Housing prices | Average housing prices near metro stations. | 8953.10 | 2547.12 | |
| Geographic GDP | Geographically weighted GDP near metro stations. | $ | 3468.77 | 875 |
| Crowd density | The hourly density of pedestrian traffic near a metro station. | 5.62 | 1.19 | |
| Built environment variables | ||||
| Feeder bus routes | Number of bus lines connected within 1000 m of the metro station | 30 | 12 | |
| CBD-distance | Distance of a metro station from the CBD. | m | 9600.29 | 6604.44 |
| Date variables (dummy variable) | ||||
| Morning peak | 7–9 a.m. on weekdays in October 2017. | 0.14 | 0.34 | |
| Evening peak | 5–8 p.m. on weekdays in October 2017. | 0.18 | 0.39 | |
| Weekends | Ordinary weekends, 14, 15, 21, 22, 28, and 29 in October 2017. | 0.20 | 0.40 | |
| Variables | The Metro-to-Bus Mode | The Bus-to-Metro Mode | ||||||
|---|---|---|---|---|---|---|---|---|
| Coefficient | VIF | Coefficient | VIF | |||||
| Intercept | 4.618 | 80.334 | 0 *** | 2.952 | 40.057 | 0 *** | ||
| Weather variables | ||||||||
| Temperature | 0.536 | 11.183 | 0 *** | 1.77 | −0.063 | −1.245 | 0.213 | 1.73 |
| Wind | 0.060 | 1.155 | 0.248 * | 1.28 | −0.033 | −0.602 | 0.547 | 1.29 |
| Visibility | −0.083 | −2.151 | 0.032 * | 1.43 | 0.074 | 1.808 | 0.0706 | 1.36 |
| Rainfall | 0.012 | 0.152 | 0.879 | 1.03 | 0.241 | 3.186 | 0.001 ** | 1.03 |
| Transfer-related variables | ||||||||
| Transfer time | −2.127 | −44.037 | 0 *** | 1.24 | N/A | N/A | N/A | N/A |
| Revised transfer time | N/A | N/A | N/A | N/A | 0.793 | 14.318 | 0 *** | 1.18 |
| Socioeconomic and population variables | ||||||||
| House rent | −1.078 | −19.083 | 0 *** | 2.40 | −1.54 | −23.792 | 0 *** | 2.61 |
| Housing prices | −1.266 | −17.693 | 0 *** | 1.75 | −1.394 | −16.002 | 0 *** | 1.98 |
| Geographic GDP | 0.176 | 5.035 | 0 *** | 1.69 | 0.182 | 4.885 | 0 *** | 1.69 |
| Crowd density | 1.738 | 34.56 | 0 *** | 1.26 | 1.937 | 31.447 | 0 *** | 1.24 |
| Built environment variables | ||||||||
| Feeder bus routes | 0.420 | 9.992 | 0.003 ** | 1.36 | −0.316 | −6.691 | 0 *** | 1.35 |
| CBD-distance | 0.501 | 10.92 | 0 *** | 1.73 | 0.291 | 6.088 | 0 *** | 1.80 |
| Date variables | ||||||||
| Morning peak | 0.451 | 15.885 | 0 *** | 1.81 | 1.289 | 47.648 | 0 *** | 2.16 |
| Evening peak | 0.855 | 38.686 | 0 *** | 1.59 | 0.437 | 16.036 | 0 *** | 1.49 |
| Weekends | 0.395 | 14.877 | 0 *** | 1.60 | 0.400 | 14.067 | 0 *** | 1.63 |
| Diagnostic statistics | ||||||||
| Observations | 16,684 | 17784 | ||||||
| Null deviance | 2,935,091 | 3,927,336 | ||||||
| Residual deviance | 1,706,702 | 2,187,363 | ||||||
| AIC | 1,803,456 | 2,280,442 | ||||||
| R2 | 0.5887 | 0.6304 | ||||||
| Variables | The Metro-to-Bus Mode | The Bus-to-Metro Mode | ||||||
|---|---|---|---|---|---|---|---|---|
| Coefficient | VIF | Coefficient | VIF | |||||
| Intercept | 3.624 | 33.478 | 0 *** | 3.140 | 26.497 | 0 *** | ||
| Weather variables | ||||||||
| Temperature | 0.397 | 5.586 | 0 *** | 1.41 | 0.337 | 4.783 | 0 *** | 1.31 |
| Wind | 0.087 | 1.046 | 0.296 | 1.07 | 0.336 | 4.138 | 0 *** | 1.06 |
| Visibility | 0.223 | 3.133 | 0.002 ** | 1.40 | −0.434 | −6.49 | 0 *** | 1.41 |
| Rainfall | 0.568 | 3.729 | 0 *** | 1.15 | 0.530 | 4.281 | 0 *** | 1.19 |
| Transfer-related variables | ||||||||
| Transfer time | −0.798 | −9.044 | 0 *** | 1.26 | N/A | N/A | N/A | N/A |
| Revised transfer time | N/A | N/A | N/A | N/A | 0.844 | 8.686 | 0 *** | 1.19 |
| Socioeconomic and population variables | ||||||||
| House rent | −0.726 | −7.024 | 0 *** | 2.73 | −1.133 | −10.549 | 0 *** | 2.86 |
| Housing prices | −2.070 | −14.3 | 0 *** | 1.98 | −1.933 | −12.669 | 0 *** | 2.11 |
| Geographic GDP | 0.299 | 4.875 | 0 *** | 1.65 | 0.362 | 5.868 | 0 *** | 1.66 |
| Crowd density | 1.469 | 18.021 | 0 *** | 1.12 | 1.619 | 17.674 | 0 *** | 1.10 |
| Built environment variables | ||||||||
| Feeder bus routes | 0.445 | 6.225 | 0 *** | 1.39 | −0.456 | −5.708 | 0 *** | 1.41 |
| CBD-distance | 1.037 | 13.498 | 0 *** | 1.9 | 0.663 | 8.582 | 0 *** | 1.95 |
| Diagnostic statistics | ||||||||
| Observations | 6813 | 6654 | ||||||
| Null deviance | 803,506 | 903,526 | ||||||
| Residual deviance | 585,865 | 606,788 | ||||||
| AIC | 623,445 | 641,036 | ||||||
| R2 | 0.5000 | 0.5301 | ||||||
| Variables | The Metro-to-Bus Mode | The Bus-to-Metro Mode | ||||||
|---|---|---|---|---|---|---|---|---|
| Coefficient | VIF | Coefficient | VIF | |||||
| Intercept | 3.438 | 16.943 | 0 *** | 4.291 | 18.698 | 0 *** | ||
| Weather variables | ||||||||
| Temperature | 1.265 | 8.476 | 0 *** | 3.07 | −0.593 | −4.02 | 0 *** | 2.75 |
| Wind | 0.714 | 4.767 | 0 *** | 2.42 | −1.143 | −7.005 | 0 *** | 2.36 |
| Visibility | 0.123 | 1.193 | 0.233 | 1.73 | 0.294 | 2.654 | 0.008 ** | 1.74 |
| Rainfall | 0.745 | 4.487 | 0 *** | 2.11 | −0.904 | −4.178 | 0 *** | 1.92 |
| Transfer-related variables | ||||||||
| Transfer time | −1.756 | −13.626 | 0 *** | 1.21 | N/A | N/A | N/A | N/A |
| Revised transfer time | N/A | N/A | N/A | N/A | 0.233 | 1.407 | 0.16 | 1.20 |
| Socioeconomic and population variables | ||||||||
| House rent | −1.348 | −8.286 | 0 *** | 2.46 | −1.796 | −9.92 | 0 *** | 2.60 |
| Housing prices | −1.319 | −6.483 | 0 *** | 1.79 | −1.391 | −5.9 | 0 *** | 1.95 |
| Geographic GDP | 0.262 | 2.704 | 0.007 ** | 1.64 | 0.386 | 3.785 | 0 *** | 1.64 |
| Crowd density | 2.092 | 15.794 | 0 *** | 1.12 | 2.277 | 14.278 | 0 *** | 1.11 |
| Built environment variables | ||||||||
| Feeder bus routes | 0.434 | 3.69 | 0 *** | 1.38 | −0.286 | −2.179 | 0.029 * | 1.39 |
| CBD-distance | 0.654 | 5.244 | 0 *** | 1.75 | 0.38 | 2.948 | 0.003 ** | 1.78 |
| Diagnostic statistics | ||||||||
| Observations | 2601 | 2523 | ||||||
| Null deviance | 422,791 | 496,331 | ||||||
| Residual deviance | 274,574 | 320,820 | ||||||
| AIC | 289,524 | 335,059 | ||||||
| R2 | 0.5307 | 0.5422 | ||||||
Publisher’s Note: MDPI stays neutral with regard to jurisdictional claims in published maps and institutional affiliations. |
© 2022 by the authors. Licensee MDPI, Basel, Switzerland. This article is an open access article distributed under the terms and conditions of the Creative Commons Attribution (CC BY) license (https://creativecommons.org/licenses/by/4.0/).
Share and Cite
Wu, P.; Li, J.; Pian, Y.; Li, X.; Huang, Z.; Xu, L.; Li, G.; Li, R. How Determinants Affect Transfer Ridership between Metro and Bus Systems: A Multivariate Generalized Poisson Regression Analysis Method. Sustainability 2022, 14, 9666. https://doi.org/10.3390/su14159666
Wu P, Li J, Pian Y, Li X, Huang Z, Xu L, Li G, Li R. How Determinants Affect Transfer Ridership between Metro and Bus Systems: A Multivariate Generalized Poisson Regression Analysis Method. Sustainability. 2022; 14(15):9666. https://doi.org/10.3390/su14159666
Chicago/Turabian StyleWu, Pan, Jinlong Li, Yuzhuang Pian, Xiaochen Li, Zilin Huang, Lunhui Xu, Guilin Li, and Ruonan Li. 2022. "How Determinants Affect Transfer Ridership between Metro and Bus Systems: A Multivariate Generalized Poisson Regression Analysis Method" Sustainability 14, no. 15: 9666. https://doi.org/10.3390/su14159666
APA StyleWu, P., Li, J., Pian, Y., Li, X., Huang, Z., Xu, L., Li, G., & Li, R. (2022). How Determinants Affect Transfer Ridership between Metro and Bus Systems: A Multivariate Generalized Poisson Regression Analysis Method. Sustainability, 14(15), 9666. https://doi.org/10.3390/su14159666