Abstract
This paper aims to evaluate the degree of affinity that Nordic companies’ reports published under the Global Reporting Initiatives (GRI) framework have. Several natural language processing and text-mining techniques were implemented and tested to achieve this goal. We extracted strings, corpus, and hybrid semantic similarities from the reports and evaluated the models through the intrinsic assessment methodology. A quantitative ranking score based on index matching was developed to complement the semantic valuation. The final results show that Latent Semantic Analysis (LSA) and Global Vectors for word representation (GloVE) are the best methods for our study. Our findings will open the door to the automatic evaluation of sustainability reports which could have a substantial impact on the environment.
1. Introduction
Corporate Social Reports (CSRs), whose most crucial referent is the Global Reporting Initiative (GRI) standards [1,2,3,4], are considered a decision investment factor comparable to the company’s financial statements [5] (see Appendix A.1). The CSR not only represents companies’ commitment to Environmental, Social, and Governance (ESG) practices or engagement with the UN 2030 agenda, the CSR is a benchmark of the actual economic health of a company in the long term [6]. Even in many stock markets in emerging countries (in October 2019 a coalition of asset managers, public pension funds, and responsible investment organisations filed a petition with the Securities Exchange Commission (USA) to request that it develop a comprehensive ESG disclosure framework. See https://www.sec.gov/comments/4-711/4-711.htm, accessed on 6 September 2021), the submission of these reports is periodic and mandatory. These frameworks lack regulation and consensus, creating an estimated gap of USD 12 billion in direct investment in sustainability [7]. Complying with these frameworks is voluntary and does not require much detail; most reports are unstructured, so companies can choose to include partial information, embedded figures or tables or any other element in the report; even the order can be arbitrary. Therefore, there is no other alternative than to use advanced text-mining techniques to extract some knowledge of them.
Since the GRI framework removed the rating weighted on these documents from the G4 versions onwards [8], assessing reports following the new guidelines will be difficult as there is not a comparison framework; therefore, any attempt to create an automatic analytical assessment tool will require solving an unsupervised-learning problem (if there is not a labelled dataset). In this way, we implement text-mining methods to extract the degree of semantic similarity that the texts published by the companies have under the guidelines published by the GRI institution. GRI is responsible for promoting, maintaining, and modifying these standards.
This research aims to quantify the degree of affinity of CSR reports provided by a selected group of Nordic companies under the guidelines of the GRI Standards. The degree of affinity is obtained via a similarity measure between the numerical representations obtained by the combination of text-mining methods [9,10,11]. Therefore, this work implements natural-language-processing (NLP) and information-retrieval (IR) methods to obtain semantic similarity and matching disclosures, respectively. Combining these methods can give us clues to know which documents follow GRI Guidelines and to what degree. This work is limited only to the context of Nordic companies published in the GRI reports database using the English language. We have restrained our study only to the English language, as most of the pre-trained models tested have been developed using large corpora in that language, and to Nordic companies because these are of geographical interest for the authors and also because of the well-known Nordic ethos for sustainability embedded in their culture, as the region was the first to discuss such topics internationally in the 1974 Nordic Environmental Protection Convention [12]. These factors, however, do not limit the impact of our work on other countries or languages.
Over recent years, corporations have begun to focus on the corporate social responsibility concept, particularly on one of its central platforms—the notion of sustainability and sustainable development. Although several researchers have found conflicting results between corporate social investments and corporate financial performance (CFP) [13], recent research has shown that Environmental, Social and, Governance (ESG) factors may deliver significant long-term performance advantages when incorporated into the analysis of portfolio investment [14].
It is, therefore, important for CSR companies to effectively communicate their economic and ESG performance to their stakeholders. Different organisations for CSR reporting issue several guidelines; the most important are Global Reporting Initiative, Global Compact Issued by UN, and ISO 2600 (https://www.iso.org/iso-26000-social-responsibility.html, accessed on 22 November 2021). We selected the GRI versions G3, G4, and GRI Standards for this study. Moreover, in several countries, GRI is linked to local regulatory reporting requirements, for instance, the KPMG Survey of Corporate Responsibility Reporting provides an instrumental insight into the recent trends in CSR reporting. KPMG started publishing such reports in 1993 [15]. Since the number of companies and organisations reporting their CSR activities is increasing, the current manual process of analysing the reports demands a lot of effort [16] and is rapidly becoming obsolete.
According to Shahi et al. [17], the automated CSR report analysis system has been overlooked by the research community, even though its text categorisation and machine -learning (ML) approach have been the subject of research since their early introduction to solve various document analysis problems. Shahi et al. [17] have produced the only work in this area using the GRI G3 version. This version used a score ranging from A+ to C to measure the effectiveness of the level check, which was removed from the framework for the GRI G4 version. Presently, a company has two options, or levels, for reporting in accordance with the GRI guideline core and comprehensive reports. The most substantial difference between a core and a comprehensive report is the number of governance and strategy disclosures. Due to this development, comparing classification accuracy is now more difficult. Nevertheless, we can choose to conduct our study in a qualitative method [18]. This includes compiling and classifying quantitative and qualitative data into the GRI Guidelines to discover similarities within the selected scope [19].
To the best of our knowledge, previous work has never included characteristics of GRI reports using the GRI G4 or GRI Standard version in report analysis or scoring. This implementation or adaption could increase the value of the evidence used to demonstrate the importance of the marketplaces on EGS activities that are captured in a non-systematic way. Therefore, due to the current state of the literature review regarding the implementation of machine learning to evaluate ESG activities, we believe it is essential to produce a work that can discover and analyse the relationship of the GRI reports published by the companies with the GRI official guidelines through text mining.
This paper is organised as follows. We describe the fundamentals of the related tools and their state of the art in Section 2. In Section 3, the nature of the problem is examined in more detail, and we describe the steps used to obtain a more adjusted vision for the development of the models to implement. The technical and design details of the models, parametrisation, architecture, and execution capacity of the system, are revealed in Section 4. The results of the executions are examined in Section 5. Finally, the conclusions and particular suggestions for improving this work are made in Section 6.
2. Fundamentals and State of the Art
Machine-learning methods have become a fundamental part of all industries [20], and they are expected to continue improving processes and decision making [21]. One fundamental part is sustainability, which is becoming more relevant in our society to ensure a stable quality of life and preserve natural resources for future generations. Here, artificial intelligence is expected to become more relevant in corporate social responsibility [22,23].
Corporate Social Responsibility (CSR) reporting is the precursor to Environmental Social and Governance (ESG) reporting. Reports prepared under an ESG framework are committed to satisfying audiences such as investors, stakeholders, customers, and regulators, among others. While CSR tries to hold companies accountable, ESG standards make their efforts quantifiable. They have to contain qualitative and quantitative information to reveal how the company has improved its economic, environmental, and social effectiveness and efficiency in the reporting period and how it has integrated these aspects into its sustainability management system. In a recent survey, KPMG [15] highlights “The necessity of a balance between qualitative and quantitative information in sustainability reports when providing an overview of the company’s financial/economic, social/ethical, and environmental performance”. One of the most popular reporting frameworks and the framework considered the most excellent and with the most worldwide acknowledgement is the Global Reporting Initiative (GRI) [24,25]. Currently, 93% of the 250 biggest companies report on their sustainability based on the GRI Guidelines [15].
The development of GRI guideline generations is constantly in progress. In July 2018, a new generation called GRI Standards replaced the GRI G4. One of the main differences is that now the GRI Standards simplify the framework and avoid labelling the ESG commitment of the companies. In GRI G3, the sections on company profile and management approach were followed by the section on non-financial performance indicators, including 84 indicators. The 56 core and 28 additional indicators were further classified into economic indicators (7 core, 2 additional), environmental indicators (18 core, 2 additional), and social indicators (31 core, 14 additional). In social indicators, four subcategories were identified: human rights, labour, product responsibility, and society. In the G3 system, companies could decide on different levels (A, B, or C), containing different amounts of core and additional indicators. The + sign indicated the independent third-party assurance of the report [25]. This standard was criticised for the use of an excessive number of indicators and the fact that the guidelines did not consider the synergies among different dimensions [26].
In GRI G4, core and additional indicators are separated, while indicators have been further extended in number. This may cause problems in internal comparison with previous reports of the same company when switching from G3 to G4 [27]. In addition, G4 includes other differences compared to G3. One of the central elements of G4 is materiality assessment—the function of which is to serve as an input for preparing the report—since it aims to explore the main environmental, social, and economic aspects relating to the activities of the company from the points of view of stakeholders and the company itself. The boundaries of reporting were redefined as well, resulting in a replacement of A, B, and C classification by accordance levels.
For the GRI Standards, an update of GRI G4, new requirements have been introduced in terms of corporate governance and impacts along the supply chain [28]. It is a format change from GRI G4, which is made up of two documents, to a compendium of 36 independent but interrelated documents. This new, more flexible structure makes it easier to use and update (it will be possible to update only one of the documents without modifying the rest). The GRI Standards do not include new aspects; however, they do include specific changes in reporting, e.g., the difference between what is mandatory and what is a recommendation or orientation is now more straightforward in the location of the aspects in the indicators. The GRI Standards have been mandatory since July 2018.
More importantly, CSR reports are becoming increasingly important for the scientific community, especially in the study of methodology, definition, and frequency [29,30,31], as well as in the comparison of the different techniques used by companies from a qualitative perspective [32]. In this paper, we examine the content of CSR reports, focusing on the GRI reports more quantitatively through text-mining techniques. Similar strategies have been developed in the past; for instance, Liew et al. [33] identified sustainability trends and practices in the chemical process industry by analysing published sustainability reports. Székely et al. [34] confirmed previous research on more widely with 9514 sustainability reports; Yamamoto et al. [35] developed a method that can automatically estimate the security metrics of documents written in natural language. This paper also extends the algorithm to increase the accuracy of the estimate. Chae et al.’s [36] study adopted computational content analysis for understanding themes or topics from CSR-related conversations in the Twitter-sphere and Benites-Lazaro et al. [37] identified companies’ commitment to sustainability and business-led governance.
The default technique mainly used in previous investigations is Latent Dirichlet Allocation (LDA) [38]; other methods implemented were, for instance, unsupervised learning using the expectation-maximisation algorithm for identifying clusters and patterns, as in Tremblay et al. [39]. They used an attractor network to learn a sequence series to predict the GRI scoring. Extensive attention has been paid to this topic in the works by Modapothala et al. [40,41], starting from statistical techniques [40], Bayesian [41], or multidiscriminatory analysis [41], for analysis of corporate environment reports. These authors have produced specific work in this area using the GRI G3 version. This version used a score ranging from A+ to C to measure the effectiveness of the level check, which was removed from the framework for the GRI G4 version. As such, Liu et al. [42] utilised the term frequency-inverse document frequency (TF-IDF) [43] method to obtain important and specific terms for different analytical algorithms and shallow machine-learning models. The previously described methods and other more recent ones have been applied successfully in other problems, such as textual similarity in legal-court-case reports [44], biomedical texts from scholarly articles and medical databases [45,46] or network-analytic approaches for assessing the performance of family businesses in tourism [47]. The methods employed in these works have encouraged the exploration of similar algorithms and techniques within the unsupervised-learning realm for scoring corporate-sustainability reports.
3. Materials and Methods
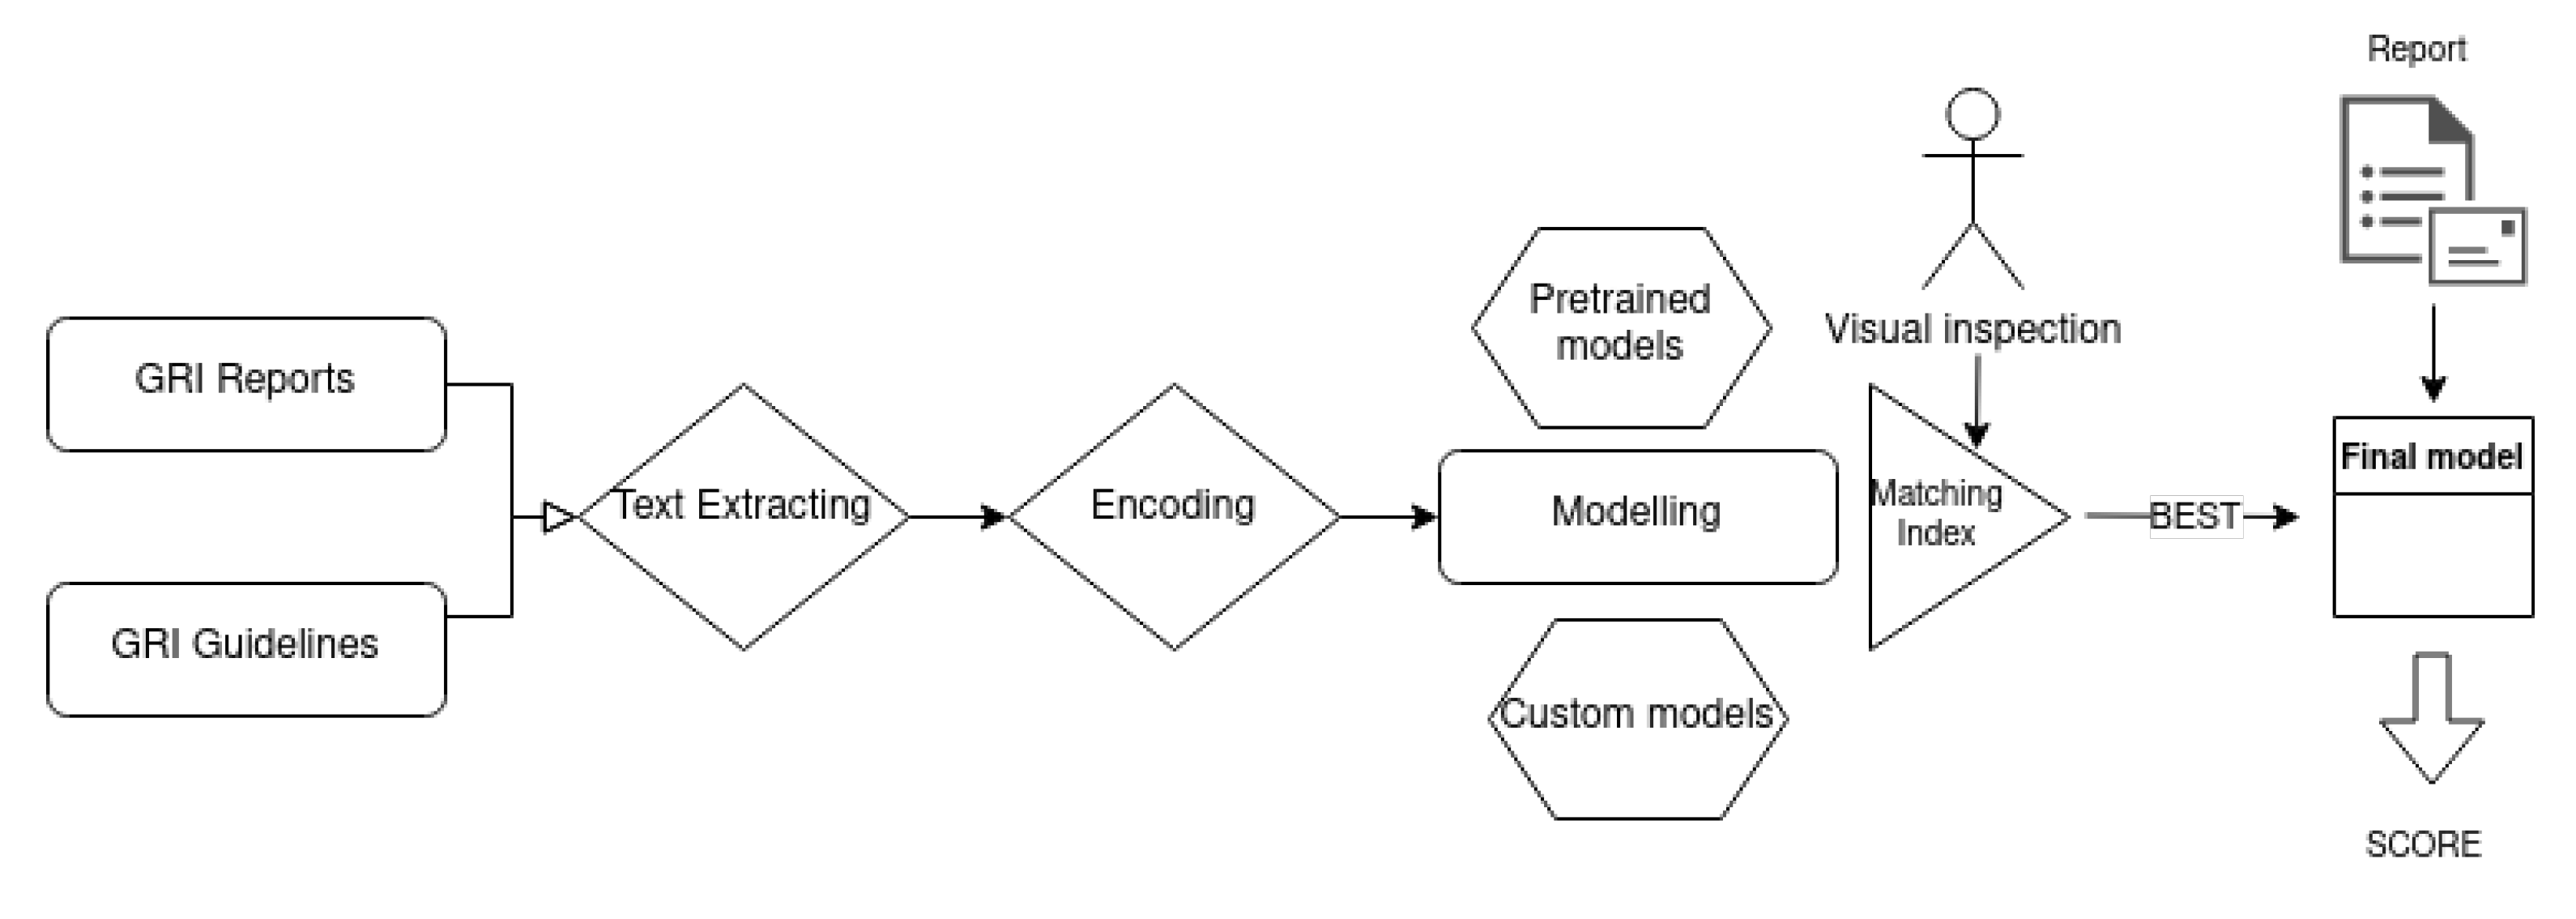
Since the last GRI framework was implemented, there has been no record of the level of compliance that published reports have with current standards. Therefore, there is no test information that we can use to validate text-mining techniques. Henceforth, we are faced with an unsupervised-learning (UL) problem. In the unsupervised-learning regime, it is not possible to know which model or algorithm gives the best result on a dataset without having previously experimented, so when choosing a model for a specific problem, the only thing that can be done is trial and error, that is, testing with different representations of the dataset, different algorithms, and different parameters of each algorithm, which is why a procedure must be followed. In Figure 1 a general scheme of the proposed design is presented. Here, GRI reports and guidelines are parsed through different software libraries to extract the embedded text. In the next step, the text is encoded for training and testing different custom and pre-trained machine-learning models. The final matching index is selected via visual inspection. This last best model is used to score a selected group of reports by a selected group of Nordic companies.
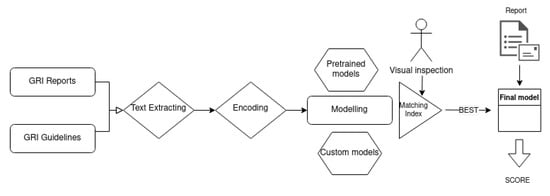
Figure 1.
General scheme of the proposed research design.
Despite the clarity in our research design, there are two main challenges: we need to understand our dataset and find the best algorithm for scoring. For that aim, we will apply Exploratory Data Analysis (EDA) [48] to design which algorithms would best suit our needs and environment. Carrying out a methodology allows planning and estimating the work, preparing a development plan, and independently focusing on each phase.
3.1. Exploratory Data Analysis (EDA)
As stated previously, the problem that we face using text-mining methods is to represent the text so that an algorithm can interpret it, e.g., in all machine-learning models, one of the main tasks before experimentation is preparing the data. As it is an unsupervised-learning problem, we need to build our methodology by experimenting to identify the limits and best options that could be adjusted to our problem. For instance, the EDA strategy studies data collections, primarily utilising visual methods to summarise their key characteristics [49]. EDA can help us see what the data can tell us beyond the formal modelling or hypothesis-testing task instead of just applying descriptive statistical functions. Furthermore, it can show us hidden relationships and attributes present in our data before using it for text-mining modelling [50,51].
3.1.1. Information Retrieval (IR)
In this work, accessing and manipulating the data requires advanced methods for information retrieval (IR) [52,53]. Our case deals with GRI reports obtained from a public database and the GRI Guidelines. As most of the information is available in Portable Document Format (PDF) documents, advanced techniques for information retrieval are necessary to access the correct data used in this study. It is possible to extract raw data from embedded text and images using state-of-the-art software libraries. In most cases, the quality of that data is low, and comprehensive cleaning is needed before it is in good enough shape to be used within any numerical model. Moreover, a suitable representation of the extracted data is paramount for any posterior desired analysis [54].
3.1.2. Natural-Language Processing (NLP)
Because of the subjective nature of reporting and the lack of standardised formats, the obtained data after formatting and post-processing the GRI reports might not be enough to judge via direct comparison with the GRI Guidelines. Here, natural-language-processing (NLP) models become the fundamental step to finding suitable models that will allow us to compare two different datasets [55]. A selected set of both custom and pre-trained models was widely tested in this research to ensure the final proposed matching index algorithm will provide the best result [56].
3.2. Dataset
The data used in this work results from extracting the embedded text in PDF documents of the guidelines and the reports. For normalising the extracted dataset, the documents were subjected to default debugging and transformations to clean the text, which means eliminating all irrelevant aspects or those that will impact the model’s performance negatively. This process covers several steps, from the most straightforward elimination of repeated characters, a transformation of all words to lowercase, fixing of spelling errors or typos, elimination of punctuation marks, elimination of spaces, etc., to more complex, e.g., reducing a word to an English common root form by applying a stemming technique [57].
This cleaning is a time-consuming process, and it is impossible to assess if a given modification in the text upon cleaning may affect the performance of the final model. Moreover, because the reports used in this work are generally unstructured, in some cases, it has been necessary to apply specific tasks to solve problems such as the absence of fields or incomplete data. Unfortunately, the text preprocessing is not perfect. It can be improved continuously, but we applied the cleaning process to a certain degree with verification via visual inspection. Further studies could tackle issues such as automating the cleaning process or the performance of the models under different preprocessing stages.
The composition of the dataset is as follows:
- GRI reports dataset: The GRI Standards database is publicly accessible (for more details, see https://database.globalreporting.org/, accessed on 11 December 2020), and this database has more than sixty thousand reports stored. For our study, we decided to search Nordic countries; we downloaded all reports using country as the filter parameter, leaving the last one published by the company in 2020. In total, we have 550 reports where some were discarded because they were written in a language other than English, leaving a total of 524 reports. Of which 193 correspond to Swedish companies, 161 to Finnish companies, 96 to Danish companies, 72 to Norwegian companies, and 2 to Icelandic companies.
- GRI Guidelines dataset: The GRI Guidelines consist of 169 disclosures grouping in 37 Standards (for more details, see https://www.globalreporting.org/standards/, accessed on 7 July 2020). These guidelines contain information about minimal technical information that needs to be provided by the companies. The companies themselves determine whether they accomplish or do not accomplish these requirements.
Bottom-Up Analysis: An Example
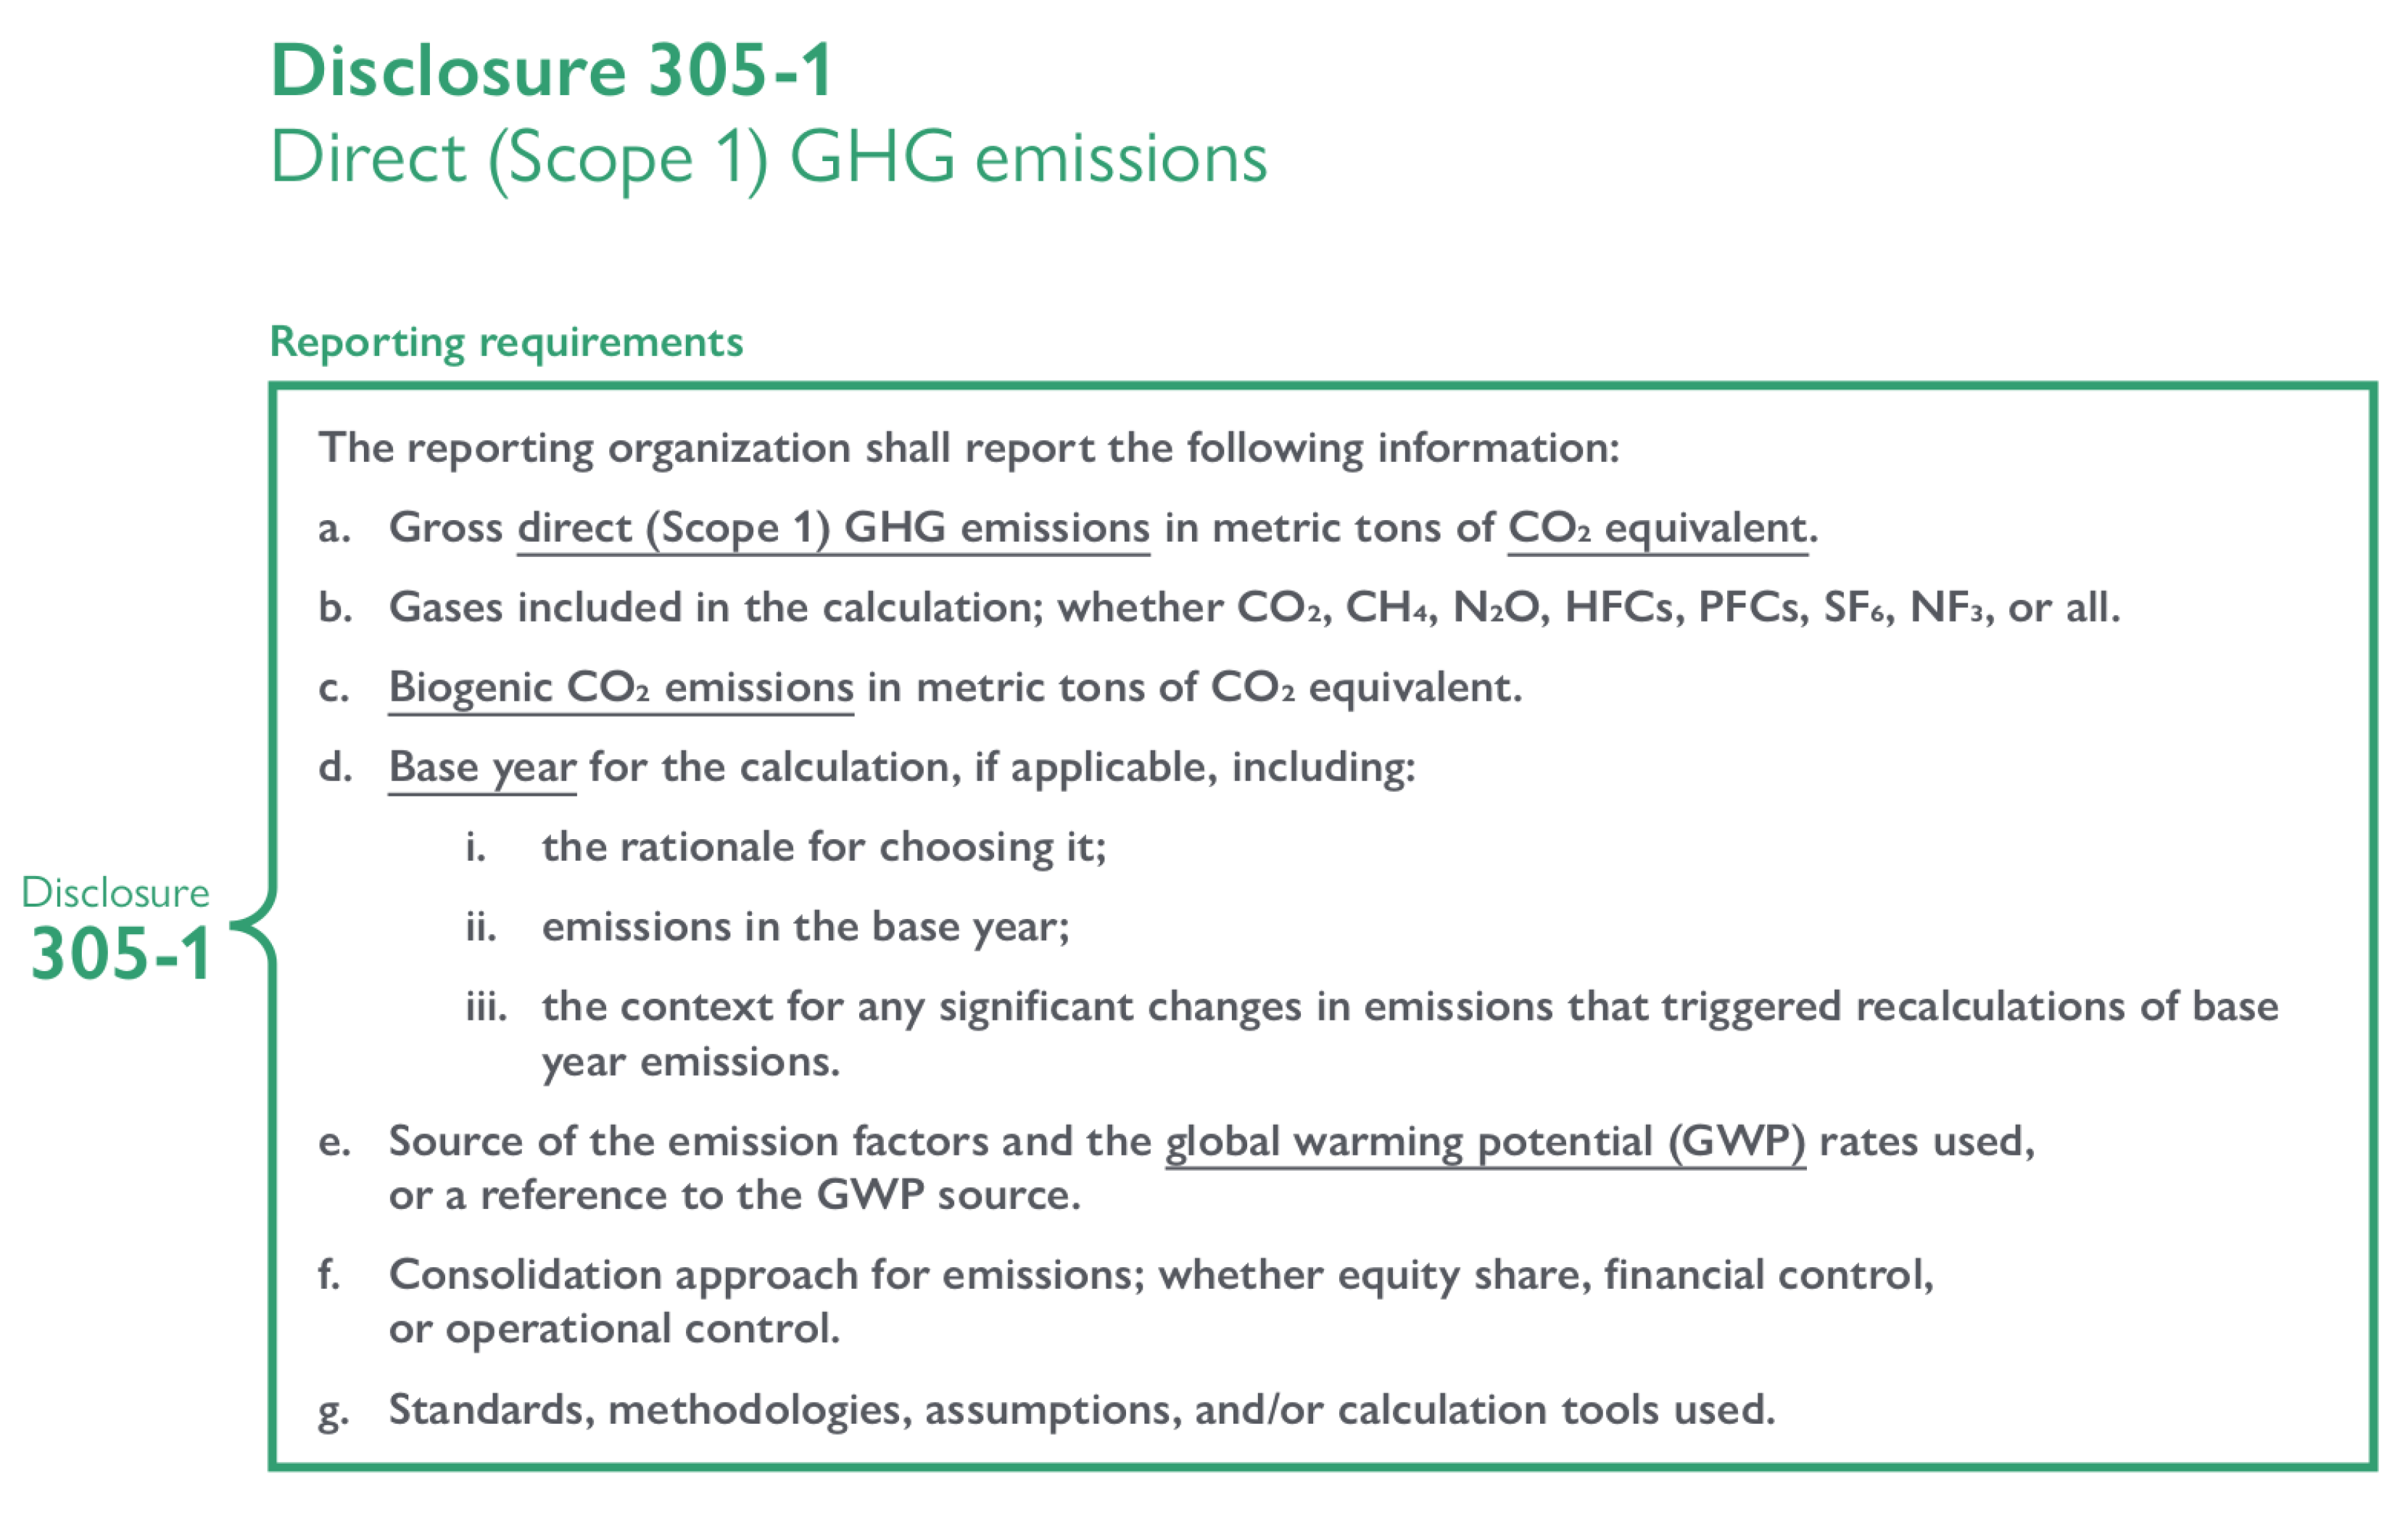
Our objective is to evaluate the degree of affinity of the CSR reports of the companies with the GRI Guidelines. Therefore, we will perform a bottom-up evaluation to obtain enough information to facilitate the modelling process. To obtain an idea of how text mining can be implemented later, we will explore how a descriptive comparison would be made between an official standard and a factual report of a company. In this case, we randomly selected the emissions standard GRI-305 as a guideline example, and Skatkraft (Statkraft AS is a hydropower company wholly owned by the Norwegian state. The Statkraft Group is a generator of renewable energy, as well as Norway’s largest and the Nordic region’s third-largest energy producer (https://www.statkraft.com, accessed on 1 July 2021)) as a company example. The selection of the company was not random. We selected the company with the most significant semantic variation in the results of the test sets when we filtered by standard 33, which includes the disclosure GRI-305 (See Figure 2).
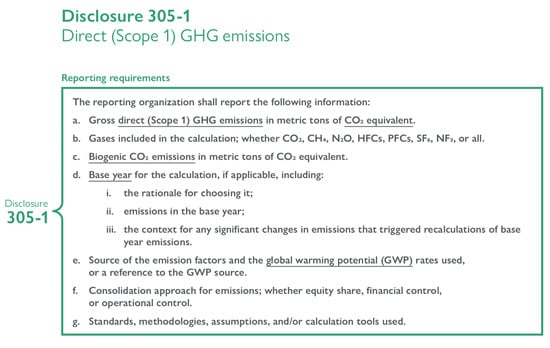
Figure 2.
Text sample of Standard 305-1 [58].
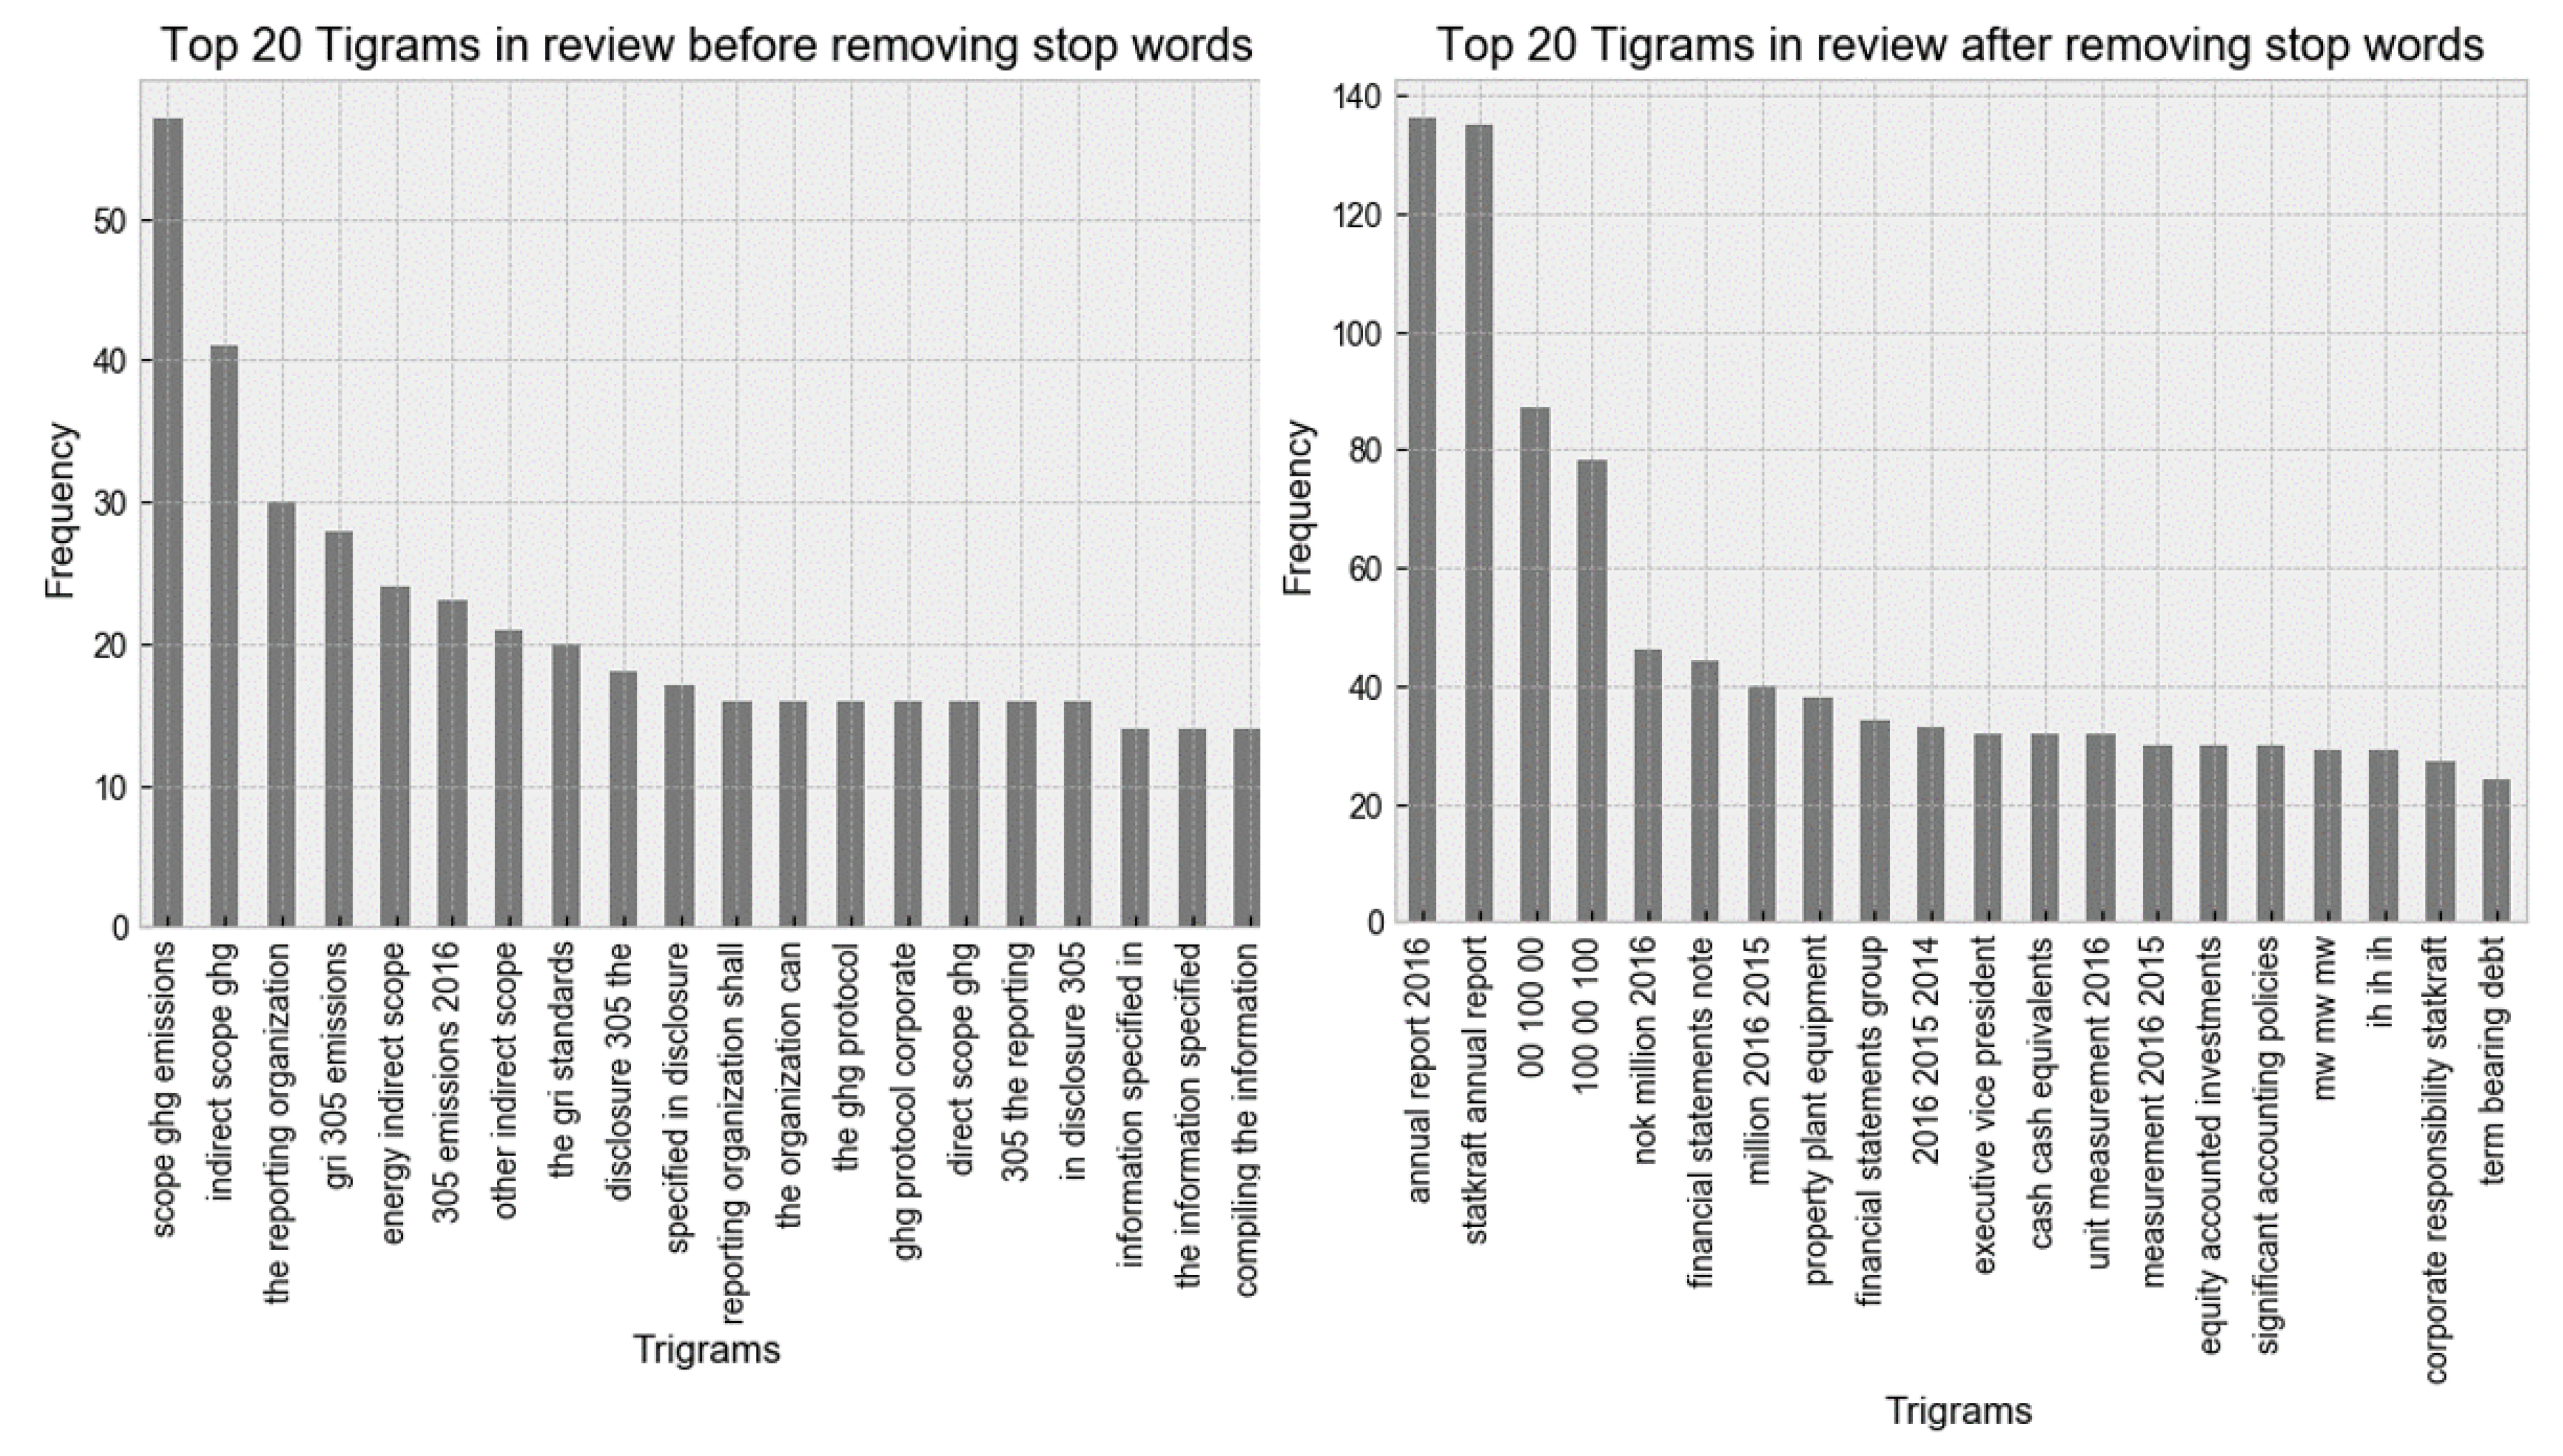
Next, we put the descriptive results in parallel to better understand what we are facing. The objective was to have a snapshot of raw values. We implemented other variants using stemming and lemmatization [59], but the differences were not significant. The numbers have not been eliminated because they are significant for these documents if they are correctly associated. Both tables tell us immediately that they have a relationship with the business environment, reports, and energy. The most frequent terms are scope gri reporting and indirect scope ghg for the emissions side and annual report 2016 and statkraft annual report for Skatkraft. Very little knowledge can be extracted directly from word strings (see Figure 3).
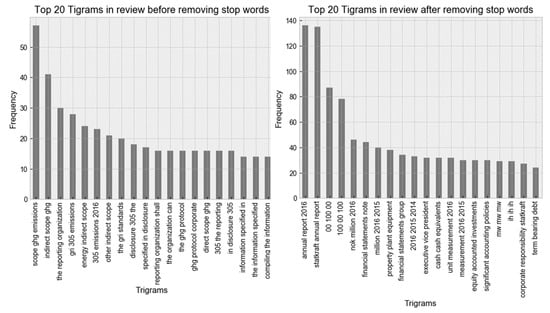
Figure 3.
Distribution of top trigrams from the GRI-305 standard and Skatkraft.
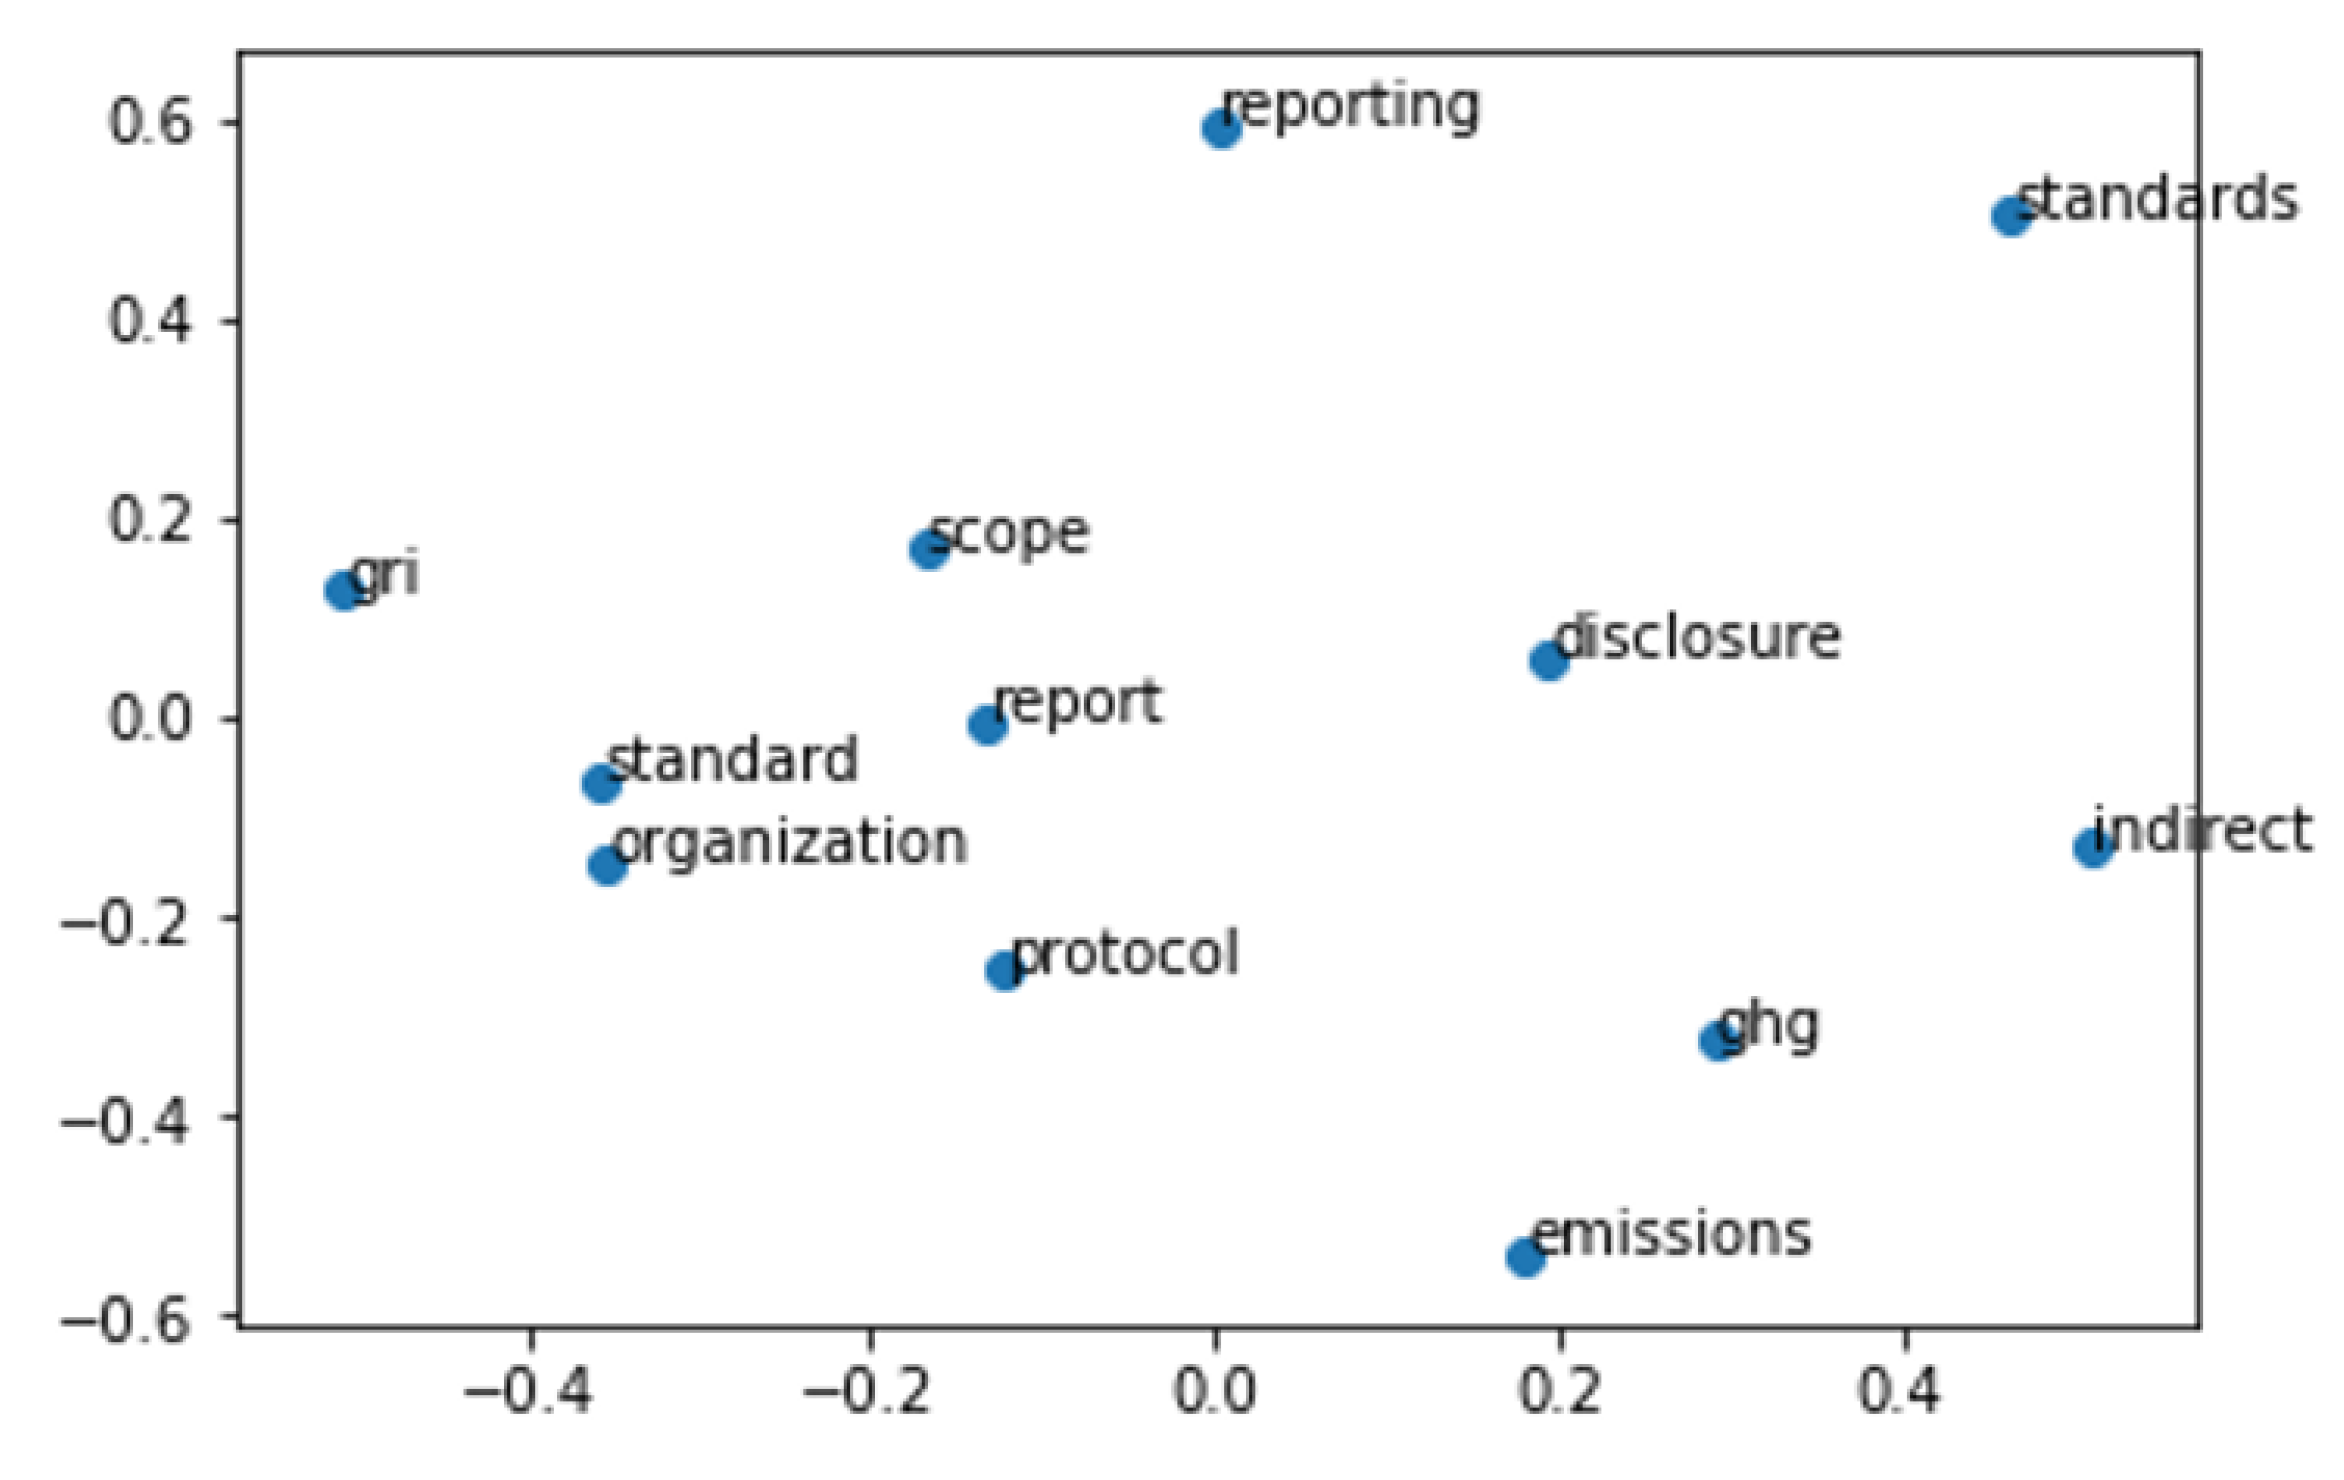
It is important, despite having a limited amount of text, to check if creating a word embedding is feasible. We use classical projection methods to reduce the high-dimensional word vectors to two-dimensional plots and plot them on a graph. The visualisations can provide a qualitative diagnostic for our learned model. For example, this represents only emissions (building our corpus using the standard 33) and implementing a model of word representations in vector space (Word2Vec) [60,61] (see Figure 4).
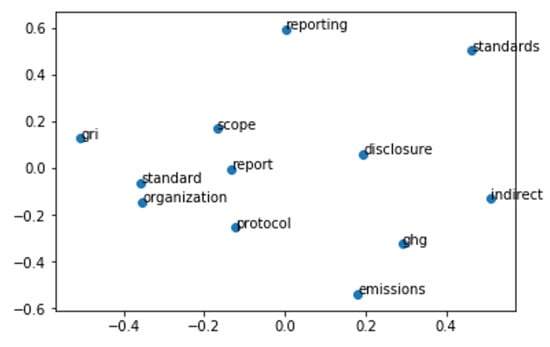
Figure 4.
Representation of words applying Word2Vec to a Standard 33 Corpus. Here you can see that all the words related to reporting are slightly on the top and the words related to emissions are slightly at the bottom, but these converge as we move to the left.
Creating a corpus for each standard will not be feasible for assessing semantic similarity between the documents. That is why we will use Latent Dirichlet Allocation (LDA) [38] to extract the most relevant terms or topics in all our dataset text. LDA is a method to group semantically similar documents under a topic. It is based on a simple exchangeability assumption for the topics and terms in a document where the topics are distributions over words. This discrete distribution generates observations (words in documents) [62].
Tagging a document with a ranked list of semantic topics can be interpreted as the extraction of semantic information. This means that the grouped documents per topic are semantically similar as they share common semantically related terms over the text corpus of what can be generally called discrete data collection, where the probabilistic topic model was built on. For this model, both word order and document order do not matter. Knowing the terms used in each document and their frequencies provides a good enough result to decide which topic each belongs to. Instead of working with the document–term matrix, it changes to a subject–document matrix and reduces the dimension. In this way, we would like to find some similarities between our documents. The topics that have the most predominance in both texts are emissions and skatkraft as can be seen in Figure 5.

Figure 5.
Predominance of texts from Topic #0 in GRI-305 and Skatkraft.
Both represent more than 70% of their marginal topic distribution in both texts. Only one term, energy, appears in the Skaftkraft Topic #6. A comparison by topic cannot be made. Due to the total imposition of one topic over the others, as in the standard emissions and the example company. The topics are very similar and difficult to catalogue at first inspection.
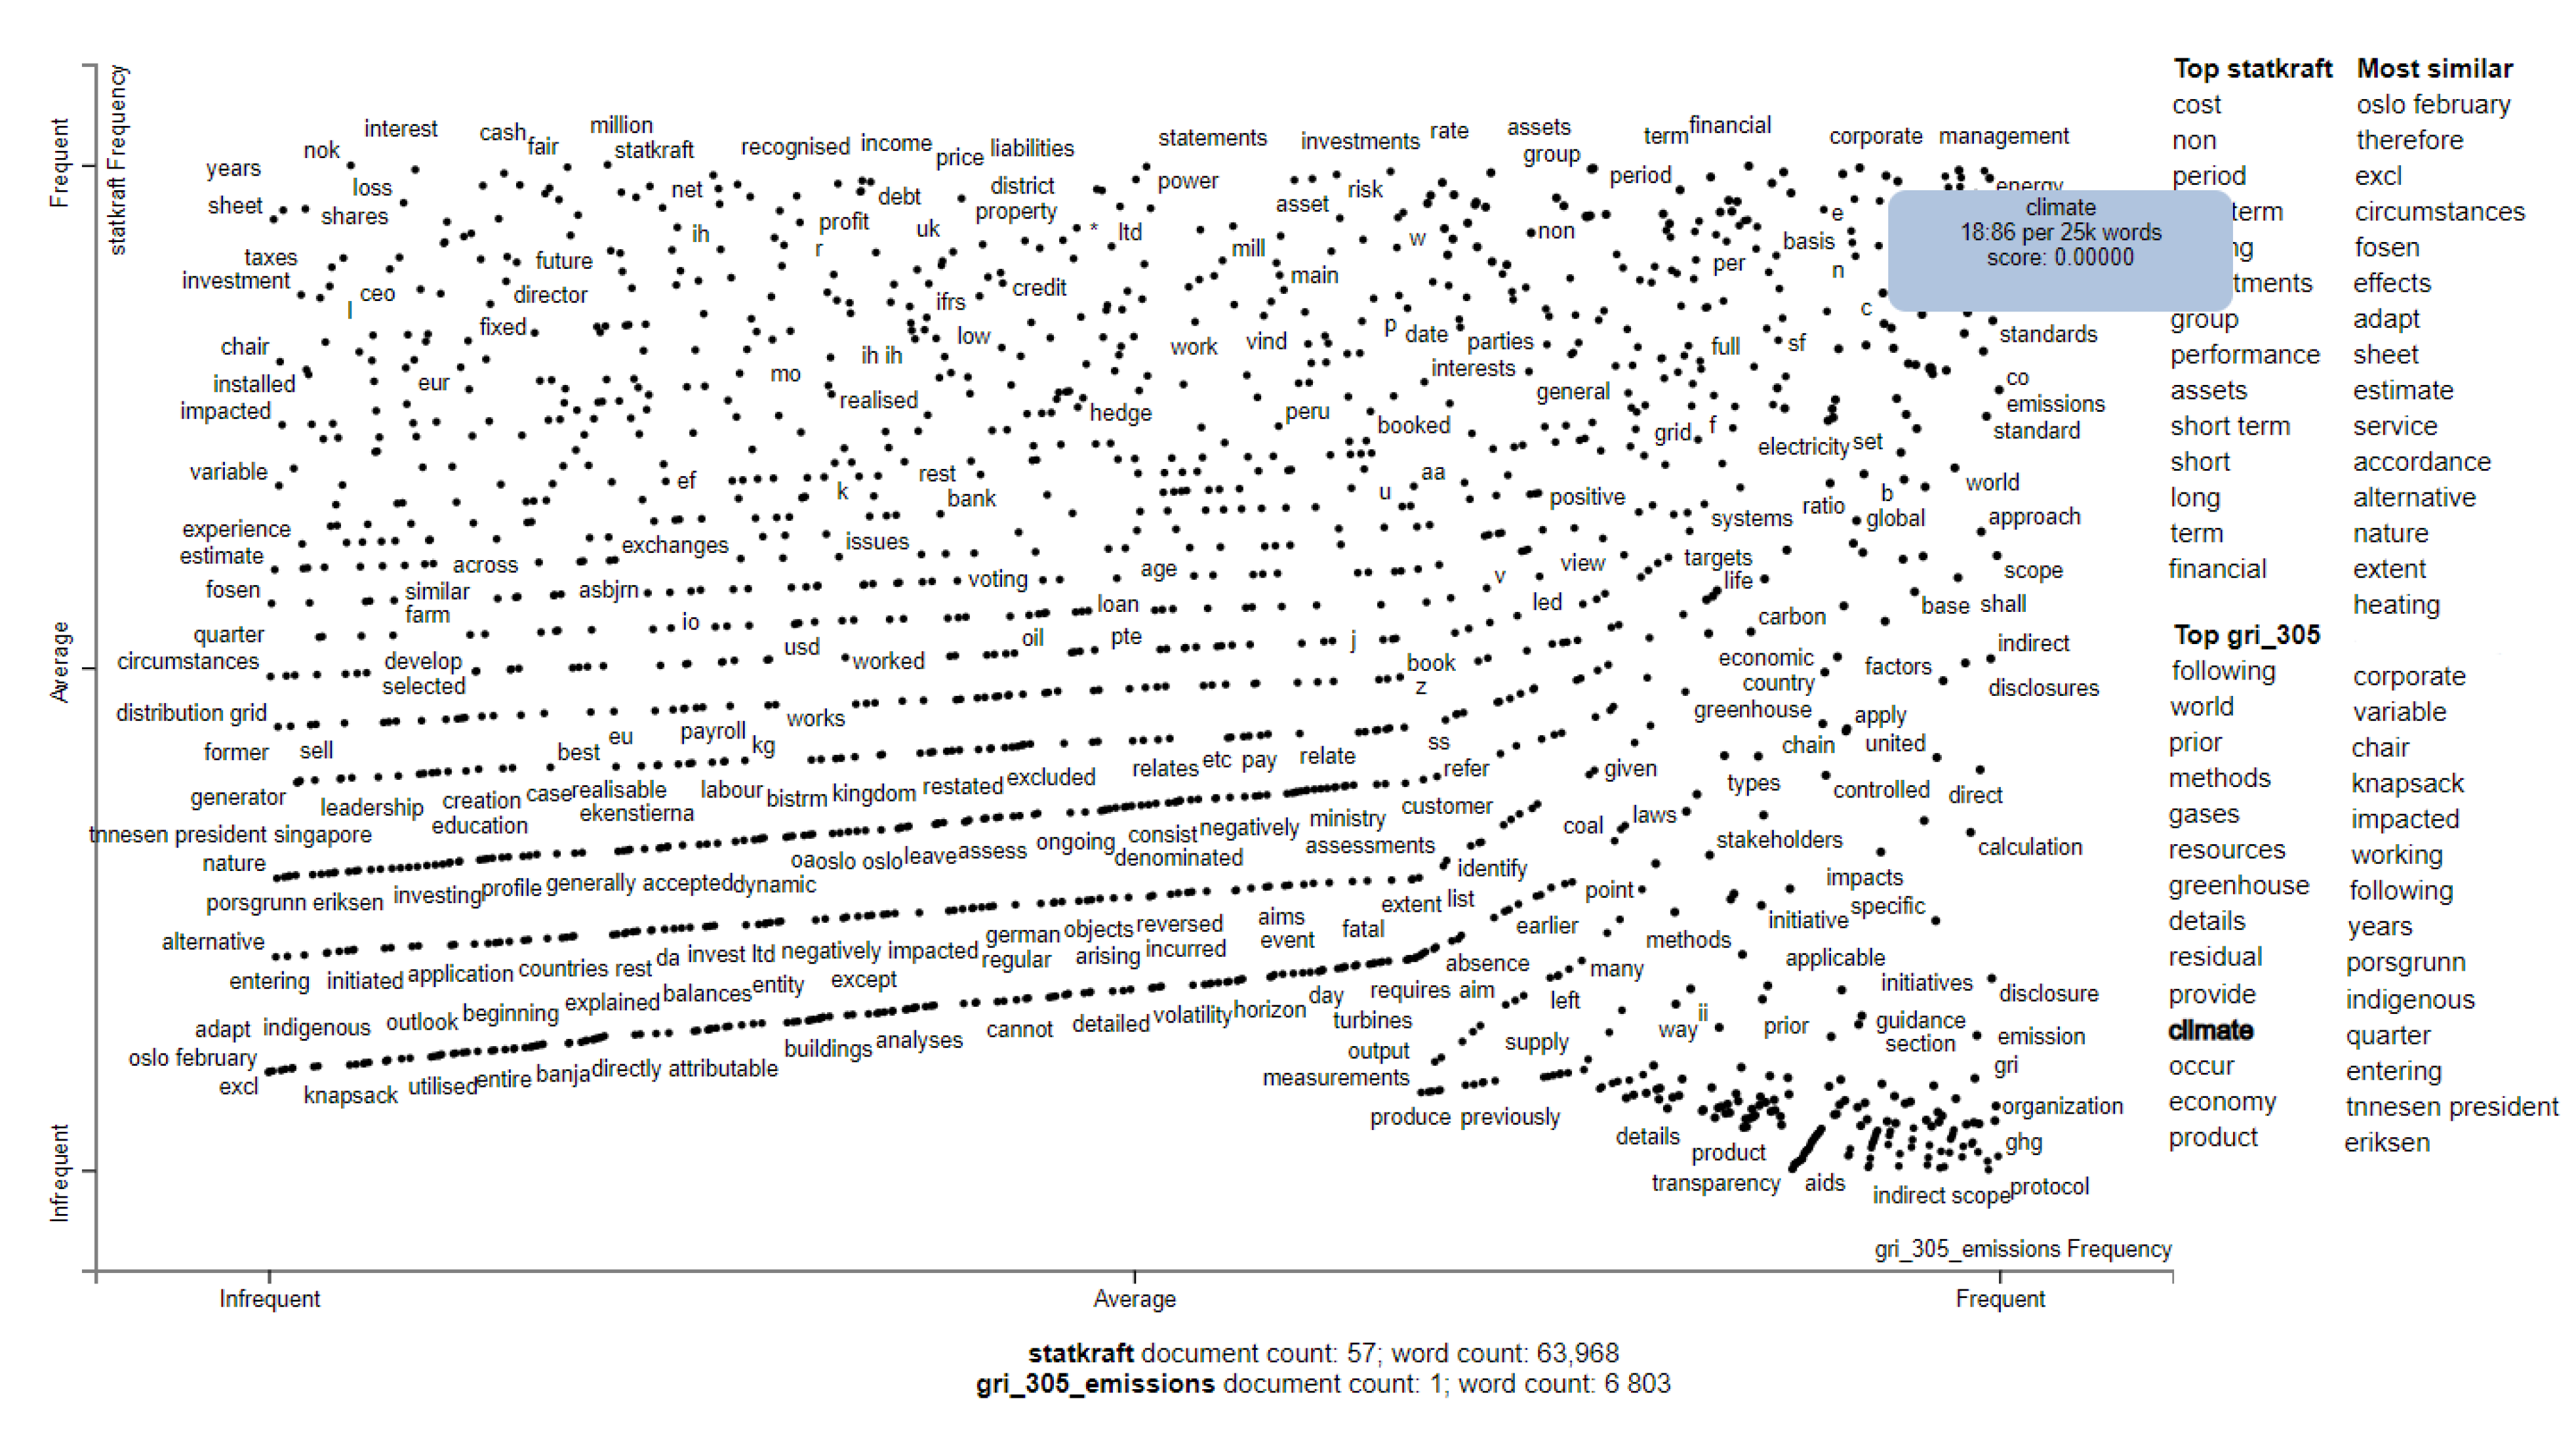
Visualising how Corpora Differ: Now, we would like to understand the terms’ associations between their corpora. To carry out this task, we will use the Scattertext tool (Scattertext is a tool that is intended for visualising what words and phrases are more characteristic of a category than others) [63]. In Figure 6, the results are plotted. From here, we use the Scattertext plot for search terms that may be useful for GRI searching similarities through scaled f-score (while a term may frequently appear in both categories (high and low rating). The scaled f-score determines whether the term is more characteristic of a category than others (high or low rating).). This figure presents the associations between Skatkfraft’s report of 57 pages and the GRI 305, from infrequent to frequent. The terms that appear in the top right are the ones that appear more frequently in both documents. This analysis is important to visually assess the performance of LDA for text matching between reports and standards.
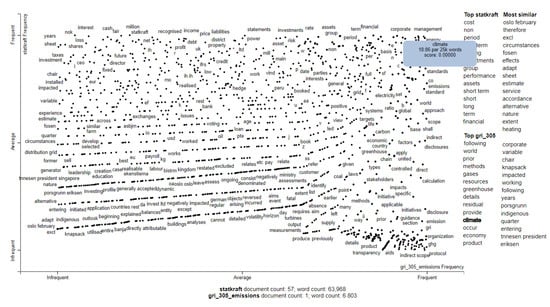
Figure 6.
Terms associations between GRI-305 and Skatkraft obtained using f-score.
The most associated terms in each category make some sense, as we saw with LDA, with skatkfraft and emissions as the most frequent terms. Developing and using bespoke word representations, Scattertext can interface with a Word2Vec model. Note that the similarities produced reflect quirks of the corpus, e.g., climate tends to be one of the most frequent terms in both documents. We see that it would not be enough to implement models to calculate the semantic similarity of documents because the information is not very descriptive and does not necessarily share the same technical terms. Therefore, we will have to reinforce this analysis with the help of information-retrieval techniques.
3.3. Matching the Reports by Guidelines
Regardless of the degree of similarity or the topics associated with the documents to be studied, we have to perform a search matching and check what terms or standards are mentioned in the reports of the companies that coincide with the guidelines. Therefore, we must design a strategy linked to controlled vocabularies, and the definition of descriptors will be listed in a vocabulary of a closed and normalised domain, called controlled. In this vocabulary, there may even be interrelationships between these terms. How could it be the association of the standard number with the title or the description of it? The objective of this controlled vocabulary would be to solve the main problems of information retrieval: polysemy, homonymy, and synonymy. The relationship of these vocabularies will have to be of a hierarchical type, of relationship and equivalence.
3.3.1. Evaluation Measures
The performance of an information-retrieval system can be measured by analysing the data (or documents) recovered from a query. There are two principal metrics to consider: precision, which is the volume of relevant data among the total data recovered; and completeness, which is the volume of relevant data among the total relevant data in the repository or the database.
Both metrics tend to evolve in reverse (Cleverdon’s Law) [64]. The more the precision increases, the more the exhaustive completeness decreases, and vice versa. This is because they measure different factors, noise and silence. Noise is defined as the non-relevant information retrieved and silence as the unrecovered relevant information. To calculate these measures, it is necessary to know how many relevant elements exist. It is necessary to list the relevance of the documents before a set of queries. These listings are called test collections.
3.3.2. Recovery Models
Recovery models try to calculate the degree to which a certain information element responds to a certain query. In general, this is achieved by calculating the coefficients of similarity (Cosine, Phi, etc.). The three most used models are:
- Boolean: One set is created with the query elements and another with the documents, and the correspondence is measured.
- Vectorial: In which two vectors represent the query and the terms of the document, and the degree to which both vectors diverge is measured.
- Probabilistic: The probability that the document responds to the query is calculated. Frequently, feedback is used. The feedback is based on the user indicating which documents are more similar to their ideal response to reformulate the query.
As we saw, the implementation of similarities by topic modelling is discarded and creates its own corpus. After this short evaluation process of our problem, we need to test the models with more popularity based on word, sentence, and hybrid measures. These we will see in the next section. The evaluation of this process of experimentation is left for the final section.
It will also be necessary to implement solutions with pre-trained algorithms. Here, we discarded the approach by Modapothala and co-authors [40] because, in their work, they used text classification with supervised learning, which is not possible here because of the change in the GRI methodology. Therefore, calculating the degree of semantic similarity that the documents have with the guidelines, and more precisely, abstracting the terms that coincide with keywords of the guidelines themselves, will be the basis to be able to extract some information on the affinity of the reports to the general and specific requirements described in the GRI Standards.
4. Experiments
All data for the GRI reports are obtained from the official GRI database. We focus on the latest reports for each company, which are quoted from all Nordic companies. In total, 550 reports correspond to G3, G4, and Standard versions, of which 524 are in English. GRI reports have no predefined format and structure; therefore, reporting entities have total flexibility on how, where, and to what extent to disclose information. It is, therefore, safe to believe that this input is entirely unstructured when it comes to searching for particular data.
Nowadays, the reports use more visualisations to facilitate the explanation of the company’s state of health. This means that the methodology that consists of converting a PDF format to a text format in an attempt to define a hierarchical structure of data, used in previous works such as [17], would be obsolete.
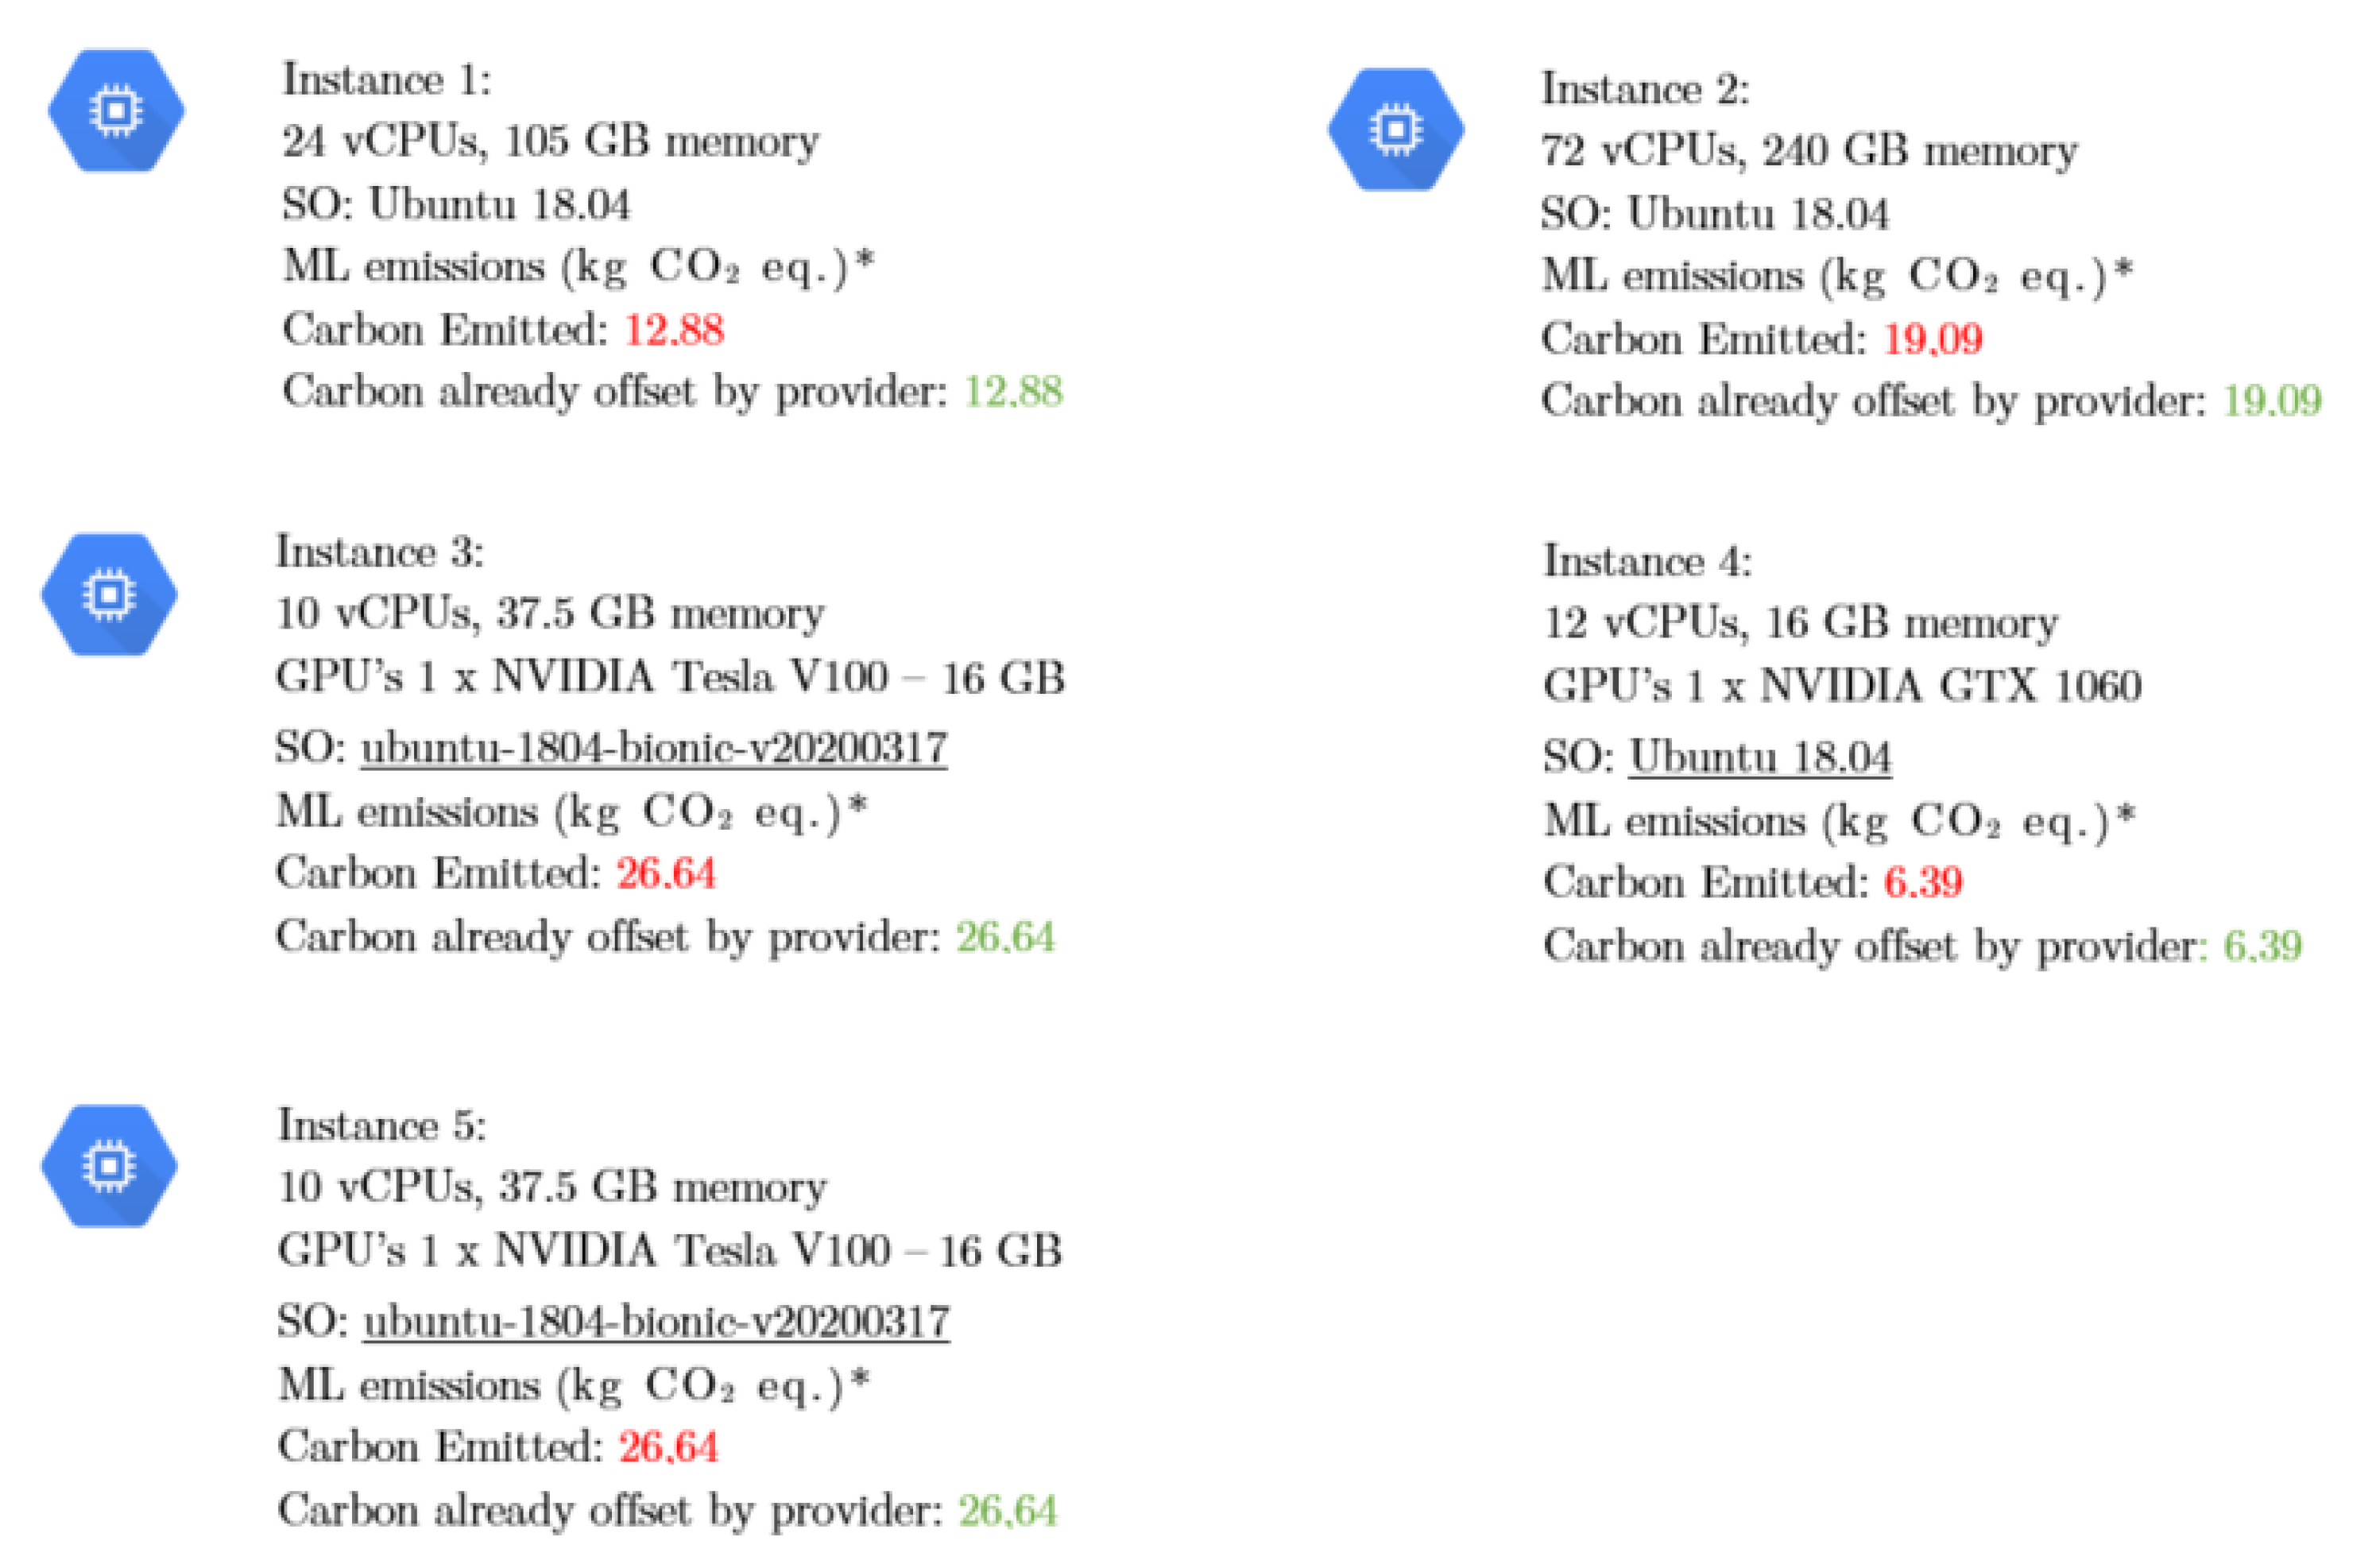
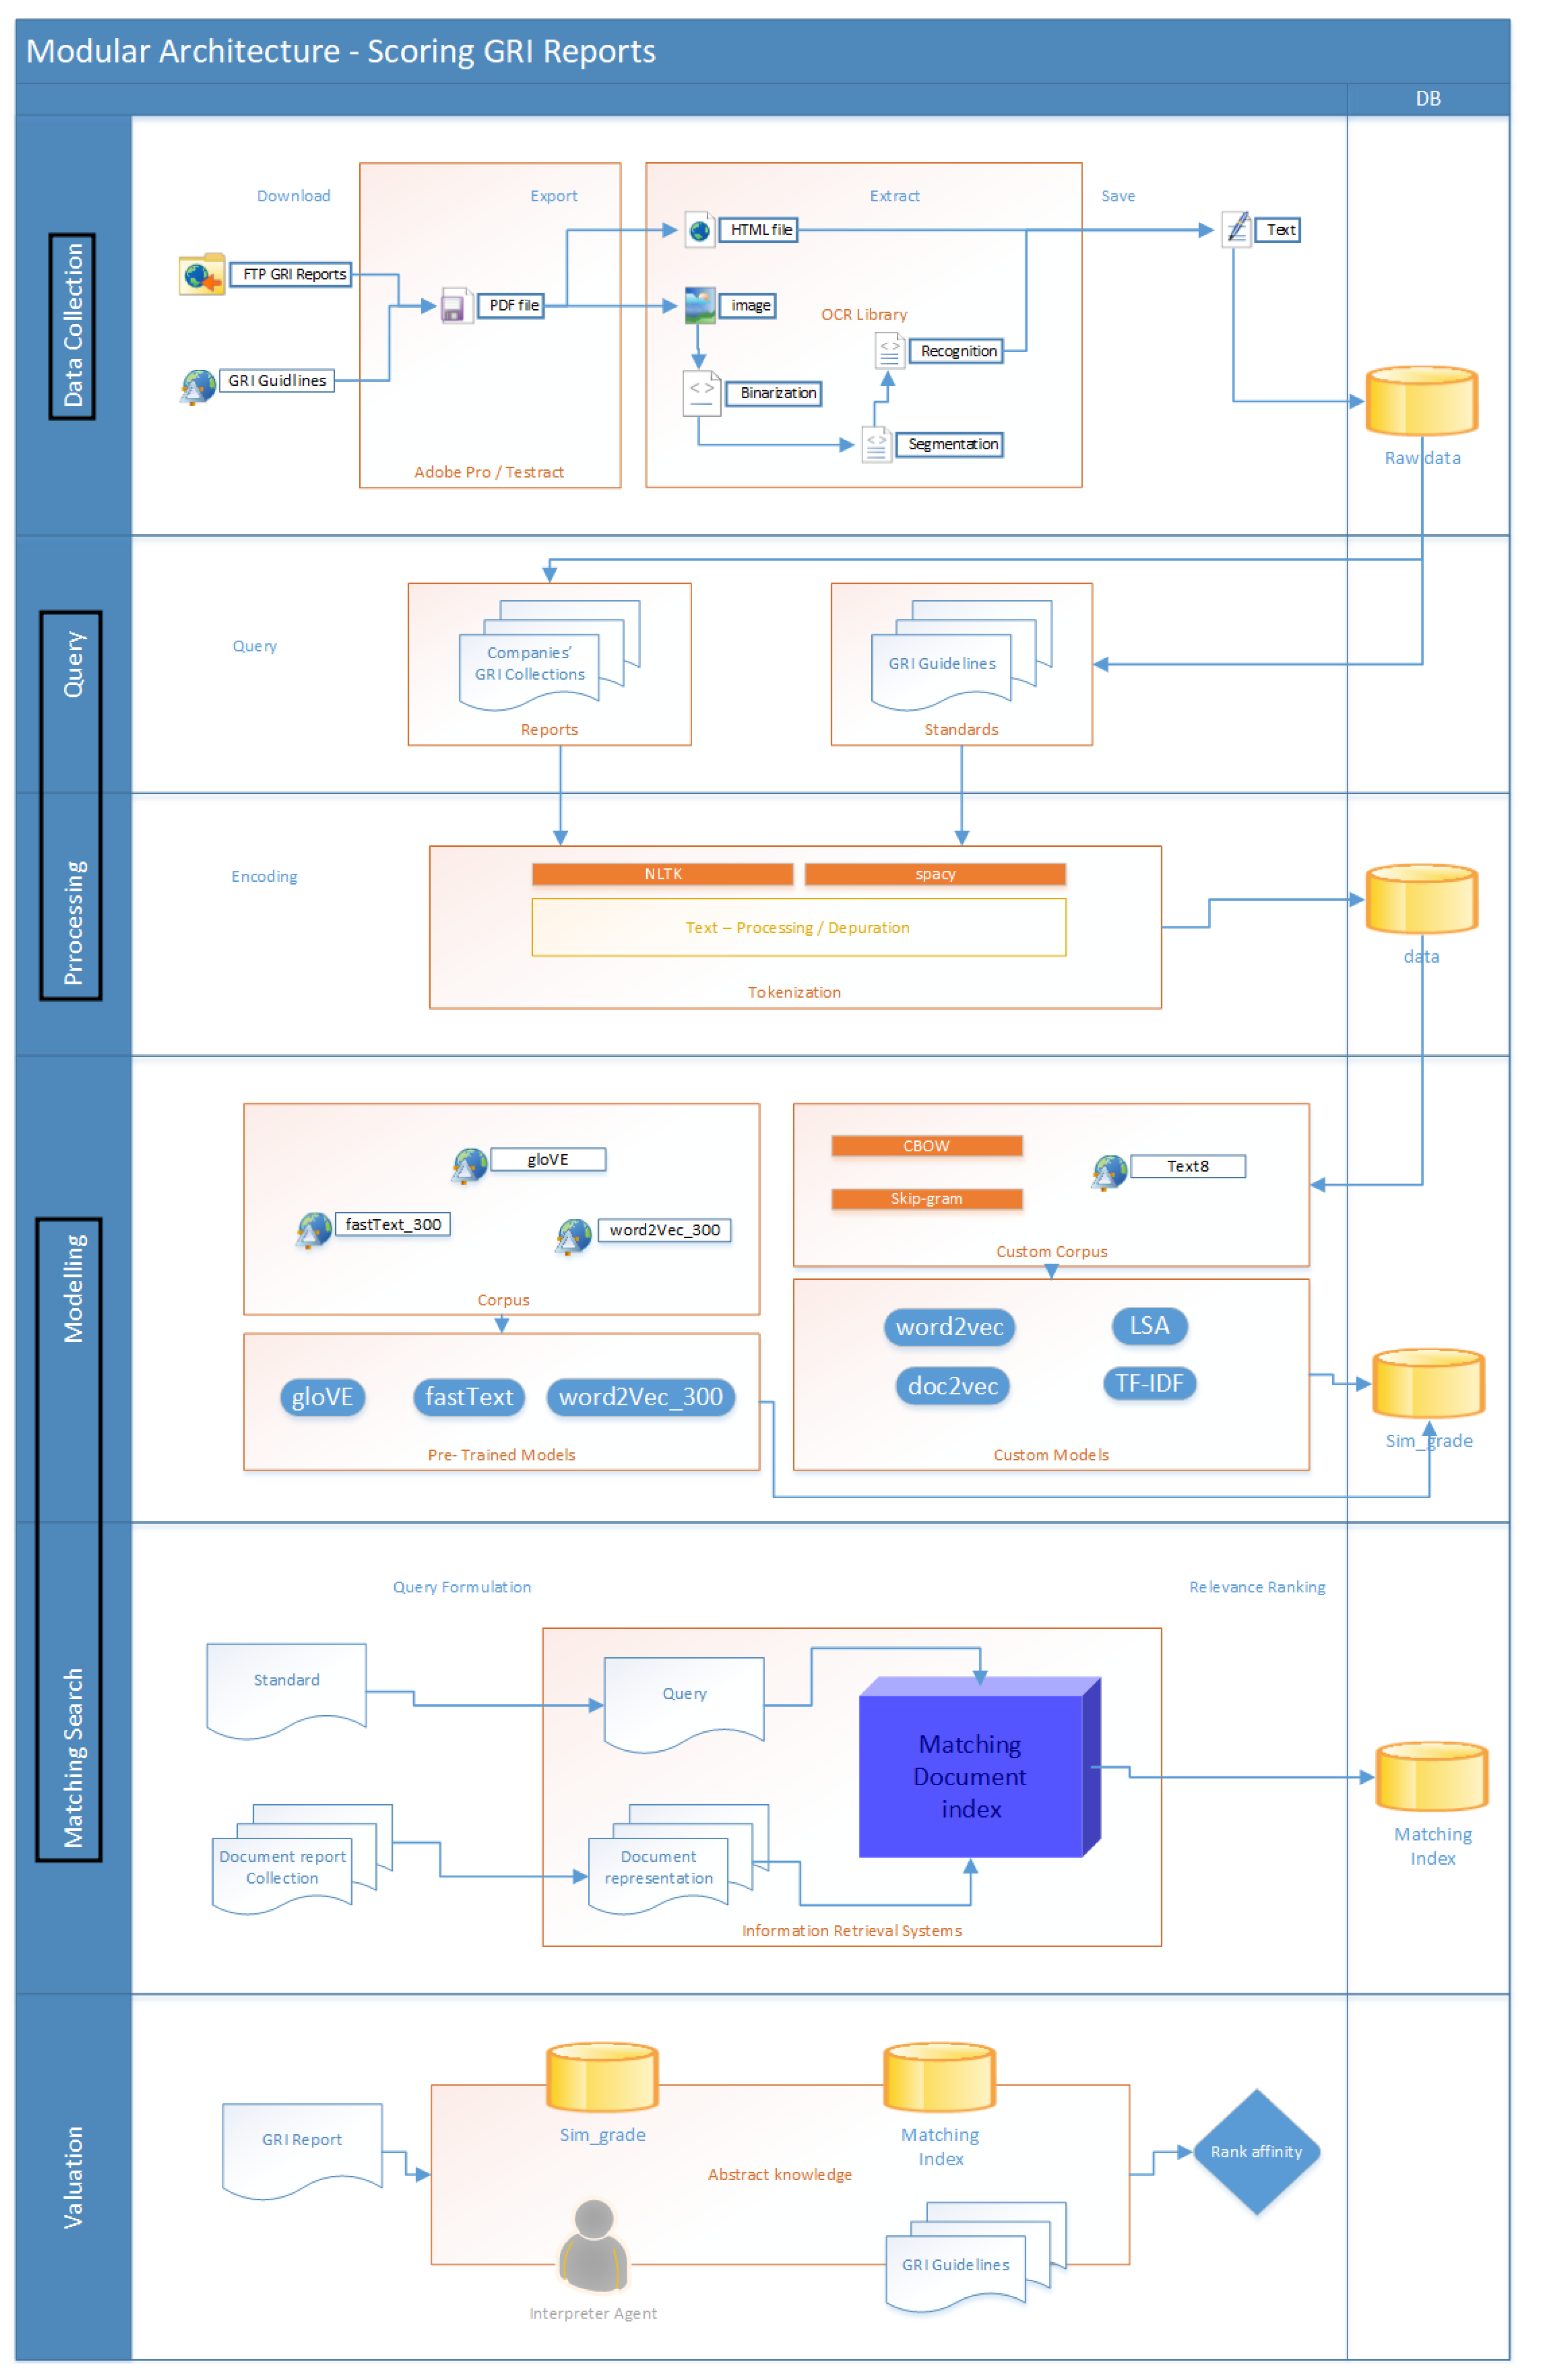
For running our experiments, we present a complete pipeline that aims to resist changes in future GRI Guidelines and formats. Therefore, we designed the whole structure in a modular way, which is easily deployed in cloud services. The results obtained in this paper were obtained using different cloud instances, as plotted in Figure 7. This solution architecture, as described in Figure 8, is the first step toward a reliable and automatised pipeline for scoring CSR reports.
4.1. Software Tools
Several libraries based on python were used for building the modular architecture; among the main ones are:
- Data collection: OCRopus OCR Library (https://github.com/tmbarchive/ocropy, accessed on 1 July 2021) for extracting text from images embedded in PDF documents and Textract(https://github.com/deanmalmgren/textract/, accessed on 1 July 2021) for extracting content from any type of file, without any irrelevant markup.
- Data encoding: spaCy [65] for tokenisation and NLTK [66] for splitting strings into substrings using regular expressions.
- Text vectorisation and calculation of similarities: scikit-Learn [67] is used as the standards vectoriser for based engines in TF-IDF of the system, Gensim [68], for vectorisation engines of the system, which implements the algorithm Doc2Vec and pre-trained models as Glove, fastText, and Word2Vec. Tensorflow [69] uses the Universal Sentence Encoder pre-trained text-embedding module to convert each title to an embedding vector, and sparse_dot_topn (https://pypi.org/project/sparse-dot-topn/, accessed on 1 July 2021) to calculate the similarity between two vectors of TF-IDF values, Cosine similarities are usually used, which can be seen as the normalised dot product between vectors.
- Text preprocessing: re [70] python library was used in the preprocessing of the text of the standards in the definition of filter individuals, BS4 (https://pypi.org/project/beautifulsoup4/, accessed on 1 July 2021) for parsing HTML and XML documents. It creates a parse tree for parsed pages that can be used to extract data from HTML, Textblob (https://textblob.readthedocs.io/en/dev/, accessed on 1 July 2021) for processing textual data. It was used for part-of-speech tagging and noun-phrase extraction.
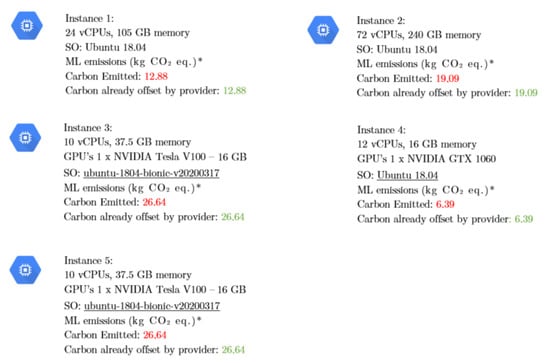
Figure 7.
Specification for deployed instances and quantified CO2 offset. Estimations were conducted using the Machine Learning Impact calculator available at https://mlco2.github.io/impact, accessed on 1 July 2021 [71].
Figure 7.
Specification for deployed instances and quantified CO2 offset. Estimations were conducted using the Machine Learning Impact calculator available at https://mlco2.github.io/impact, accessed on 1 July 2021 [71].
Moreover, for reducing the processing time by multithreading, the joblib python library was used (https://joblib.readthedocs.io, accessed on 1 July 2021). FuzzyWuzzy (https://github.com/seatgeek/FuzzyWuzzy, accessed on 1 July 2021), a library based on fuzzy logic, was used for the string matching process. Moreover, for storing data from both the corpus, validations, and recommendations, we used MySQL and Pickle (https://github.com/python/cpython/blob/3.8/Lib/pickle.py, accessed on 1 July 2021) for storing the trained models.
Figure 8.
High-level solution architecture for the text-semantic search system.
Figure 8.
High-level solution architecture for the text-semantic search system.
4.2. Hardware
The machine-learning models used in this work were implemented on the hardware provided by the Google Cloud Platform for both tests and deployment. The scheme of the used instances is presented in Figure 7.
4.3. Architecture
Figure 8 shows an overview of the final solution architecture. The system extracts and processes the text, validates and builds an approximate similarity matching index, and finally serves to build an index for semantic search and retrieval. In the next part, we will describe the modular elements of the architecture and their tasks.
4.3.1. Module 1: Data Collection—Corpus Creation
To obtain the corpus, we combined Textract and Ocropus to extract the text from PDF files. Despite being a routine process, we had to adjust many parameters for the task of extraction of text embedded in the images of the PDF themselves (See Figure 8). Then, scratch clean-up routines were applied, i.e., loaded to obtain standards in XML format where the data extracts are neatly stored in labels. Each PDF metadata extracted, such as type of title and standard number, is saved on a table for further manipulation.
4.3.2. Module 2: Query and Processing—Text Preprocessing
For each tokenisation process, the sentence is filtered by a depuration process, where we define the politics of treatment of the manipulation of the text. e.g., the boundaries of the minimum number of words that can build a sentence.
4.3.3. Module 3: Modelling and Matching Search—Training and Saving
In this stage, we configure the parameters to develop an environment where the models that are going to be executed can be compared later. Regarding architecture, for the embeddings, we found that bag of words was very slightly faster and produced better results than skip-gram. Training algorithm: TF-IDF, LSA, Word2Vec custom, Word2Vec(300), fastText(300), and GloVE(3).
4.3.4. Database
For storing the results of the models, a database is created at the beginning of the training stage, with the following tables that will be filled at runtime. We split the parameters and results of each model on different tables to mitigate the risk of running exceptions.
4.4. Overall Workflow
We need to design a similarity matching system to extract the similarities from documents against the GRI Standards reports. This means that in the first instance, we need to represent items as numeric vectors. These vectors, in turn, represent semantic embeddings of the item discovered through the models mentioned.
Later we need to organise and store these embeddings to apply cosine distance to find those similar to the embedding vector of the standard query. The solution described in this research illustrates an application of embedding similarity matching in text-semantic search. The goal of the solution is to retrieve semantically relevant documents to compare with the standards query.
The workflow of the semantic search system proposed illustrated in Figure 8 can be divided into the following steps:
- 1.
- Extract embeddings using modules 1 and 2
- Read the PDF files from GRI database.
- Extract the text embeddings using our set of algorithms in module 2.
- Store the extracted embeddings in the database.
- Store the original text and their identifiers in Datastore.
- 2.
- Build the index using AI Platform using module 3
- Load the embeddings from the files in the database into the GRI index.
- Build the index in memory.
- Save the index to disk.
- Upload the saved index again to the database.
- 3.
- Serve the scoring
- Download the guideline index from the database.
- Extract the query embedding using module 2.
- Using the GRI index, find embeddings that are similar to the query embedding.
- Obtain the item IDs of the similar embeddings.
- Retrieve the GRI report titles using the identifiers from Datastore.
- Return the results.
4.4.1. Vectorisation Models
To carry out the vectorisation of each standard’s tokens, the two engines are implemented in the system. Both have undergone experiments to analyse their performance and the quality of recommendations. Internally, textual queries are obtained through inferences to a vector in the model based on the text tokens. The similarities in Doc2Vec are found with the most similar function that internally computes the cosine similarity calculation. Default values from the library were used for the rest of the model parameters that do not appear in the list.
4.4.2. Pre-Trained Models
The gensim package has nice wrappers providing us interfaces to leverage pre-trained models available under the gensim.models module.
4.4.3. Information Retrieval
For the extraction, we implement FuzzyWuzzy determining at least the ratio 95, but we also apply coverage to the similarity between neighbouring sentences. This is because it was found that the terms for matching are often tokenised in different sentences.
4.5. Search and Semantic Systems in Practice
In Table 1, we present the table of executions, the results of which are analysed in the next section. In practice, search and retrieval systems often combine semantic-based search techniques with token-based (inverted index) techniques.

Table 1.
Design of executions.
5. Results
As we have previously commented, the evaluation of the results provided by the implemented models is only a complementary part to a more in-depth analysis required to know the actual degree of affinity that the reports presented can have under the latest framework applied by GRI. This is not due to the bias that the models themselves present or due to a lack of adjustments, but rather to the natural subjectivity associated with the difference of opinions about the semantic relationship between texts.
While dealing with a problem as subjective as the assessment of texts, for which it has been necessary to implement UL tools, we will introduce the results in an intrinsic-assessment way. Intrinsic assessments [72] are experiments in which the results are compared by human judgements on word relations (see Section 2 for more details).
To proceed with this assessment, we will then use the standard mime and report selected in Section 3. That is the GRI 305 standard that corresponds to the emissions section and the CSR of the Norwegian company Statkraft. For this effect, we will prepare the following control dataset for the evaluation of the models (see Section 4 for more details). For the analysis of words, the following terms will be used: {emissions, sustainability, gri}. Emissions is a specific term used in the GRI 305 standard, which is related to control measures regarding the level of emissions produced by the company, sustainability is used as a generic term related to ESG practices, and GRI is a not relevant term for general use or use in a pre-trained corpus but has a particular definition for our context.
For the analysis of the sentences, we extract some sentences from the Statkraft GRI report. The following sentences will be used:
- (a)
- “Statkraft’s power plants have low variable costs, long lifespans and low carbon emissions”.
- (b)
- “Statkraft’s high-level Climate Roundtable gathered scientists, business leaders and politicians to explore new business solutions to the climate challenge”.
- (c)
- “However, 233 minor environmental incidents were registered (228 for 2015)”.
In the same way, as for the analysis of words, the phrases are selected based on their specificity to our studied topic, in this case, GRI 305. The sentence (a) is an example of a specific phrase that determines an objective pursued by our standard: reducing emissions. It is a specific sentence in which it is clearly indicated that one of the disclosures of the GRI 305 standard has been achieved. The sentence (b) does not become so specific in its semantic meaning; however, it does contain many words related to emissions. Finally, the phrase (c) is a very common sentence in this type of corporate report, leaving its interpretability open and with minimal relation to our topic.
5.1. Similarity of Words
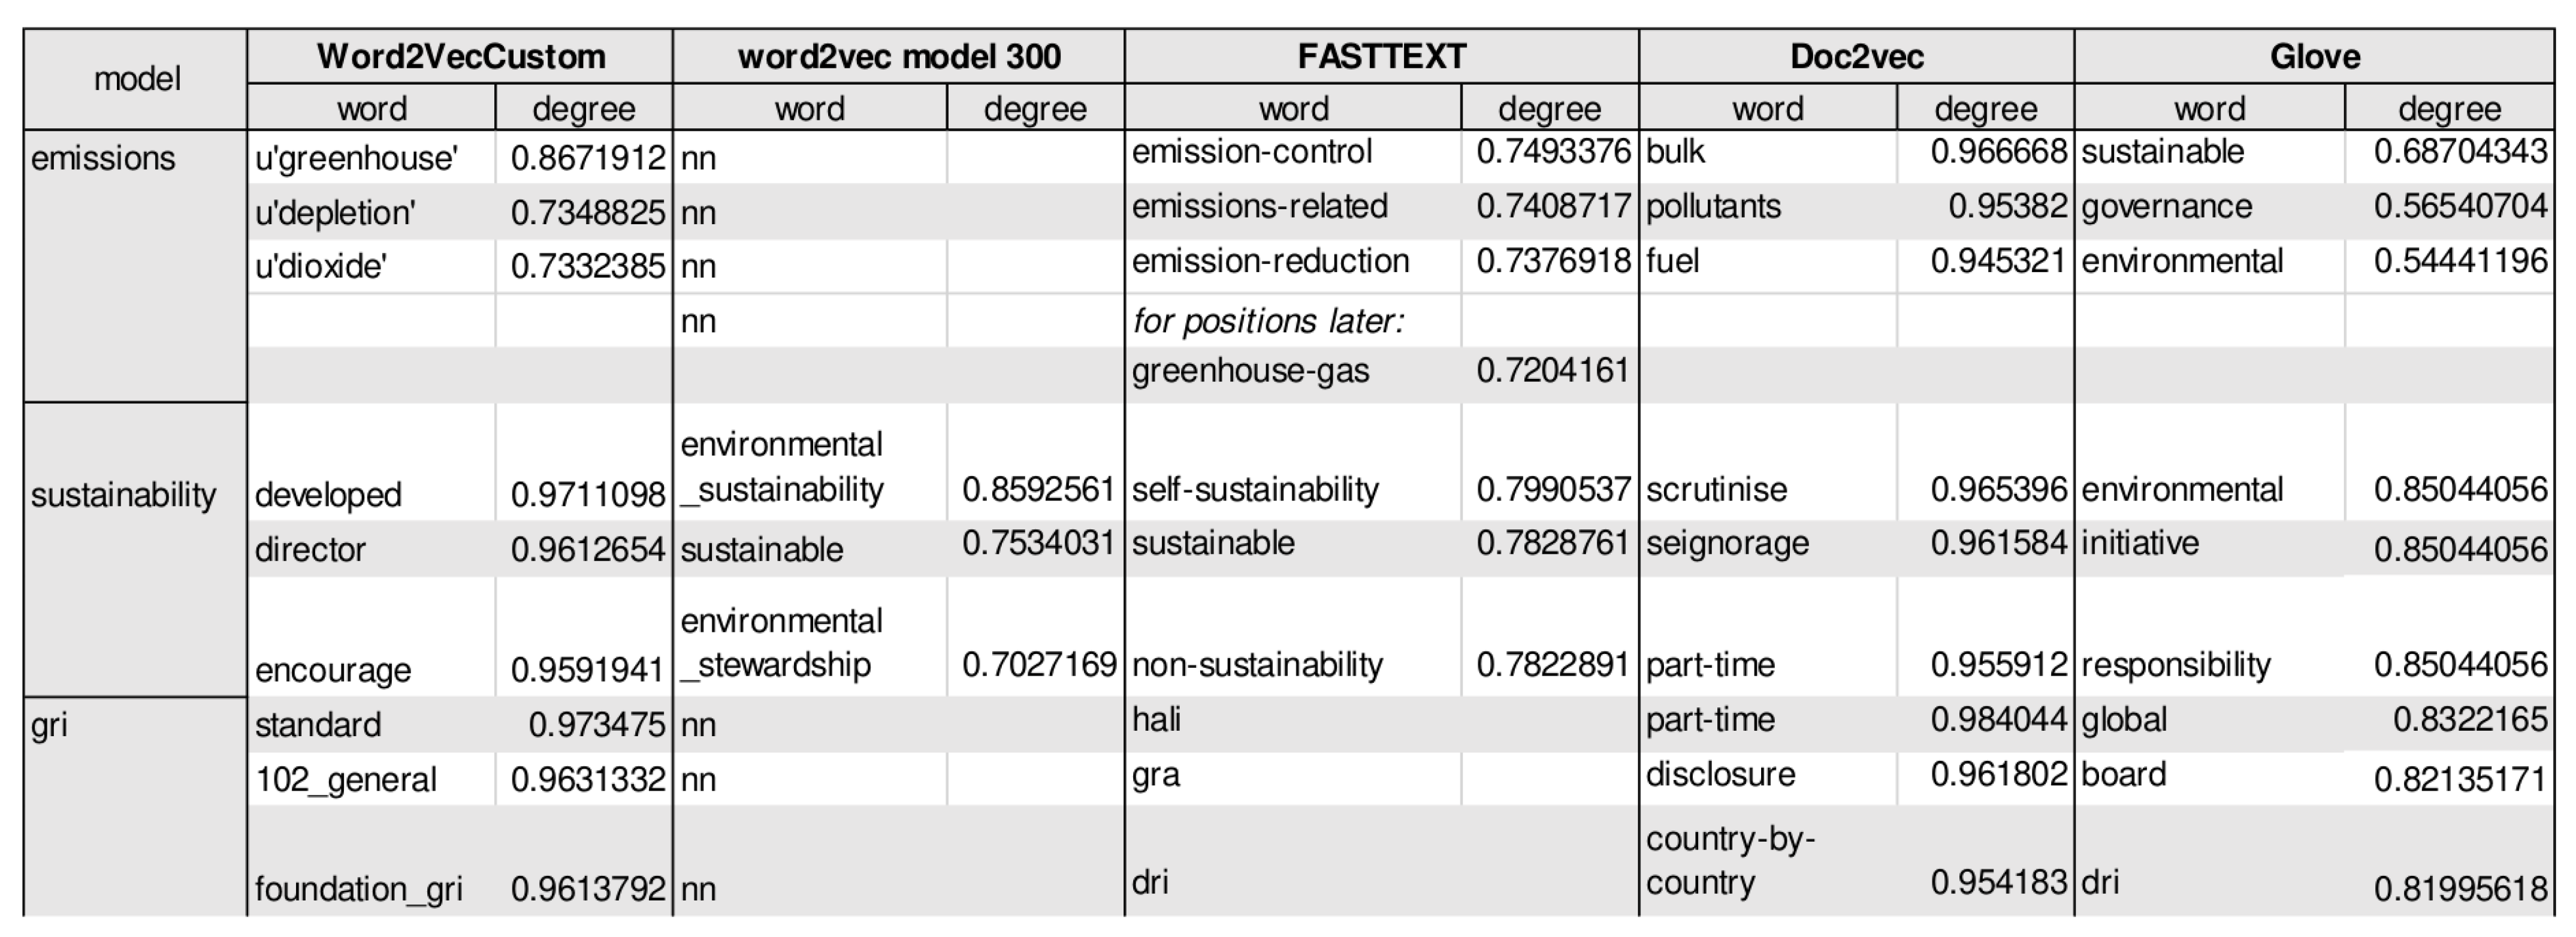
In Figure 9, we can see a summary of which terms are extracted as similar from our models:
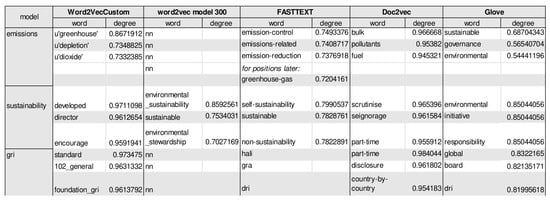
Figure 9.
Similarity by words obtained from the different trained models.
Now, despite making an interesting connection with the term emissions, we can see that, concerning the Doc2Vec models, that does not seem to be the case for the term sustainability. The domain management also stands out when the specified corpus models are executed, as in the case of Word2Vec Custom, which was the only one, logically, that was able to extract the similarity that we expected about the term gri, relating it to standard or 102 general (where 102 corresponds to the standard that describes general aspects of the companies). Not so for fastText, in which we can see how lexical similarity helps define its results. Instead, it is interesting to see the strong relationship presented by the word emission together with governance and sustainable for gloVE, which is closer to the guidelines determined by the GRI Framework.
5.2. Similarity of Sentences
Following the previous structure, we present the results in Table 2 in relation to the control sentence (a), including the sentences with the highest degree of similarity.

Table 2.
Similarity by sentences obtained from the different trained models regarding the sentence control (a).
The first three sentences with the highest degree of similarity were selected and are presented in Table 2 (the results obtained with respect to control sentences (b) and (c) are included in Appendix A.2). From here, it is necessary to determine which sentences have greater accuracy when comparing them with our control sentences. LSA, for our appreciation, stands out above the others in the control statement (a) and declines quite a lot with the control statement (c). gloVE instead seems to handle better in generalist statements such as (b) and (c), but not so much in more specific cases as in (a), fasText continues to demonstrate that the lexicon is one of the most important points to value as well as TF-IDF. With the other models, we find it difficult to abstract a more homogeneous conclusion due to the diversity of its results.
Therefore, we decided to combine the results provided by LSA and gloVE because we believe that both are complementary to our problem environment. In this way, we would try to balance the lack of text with gloVE and the specificity of the documents with LSA. In Table 3 we present the first ten reports with the average of cosine valuations by LSA and gloVE as total in descendant order.

Table 3.
Top 10 semantic similarity.
According to Table 3, the report prepared by the Norwegian company NSB group in 2018 is the one with the highest semantic similarity assessment to the guidelines proposed by GRI Standards. It should be noted that Finnish reports have the best rankings in the overall picture, as its top 10 reports are in the top 21 of the total. It is followed by Denmark, putting its top 10 reports in the top 33, Sweden is below the top 79, and Iceland is in the top 77 (See Appendix A.3).
Capturing the semantic similarity that a document can have, it is not guaranteed that it will be known whether a report mentions compliance with a specific standard. Since June 2018, the GRI Standards are currently the last in force concerning its predecessors, G4 and G3. They suggest that a summary of what standards are being complied with in core or comprehensive elements be attached to reports where possible. Therefore, we will look for reports that match the guidelines described in Section 4. The total field provides the number of disclosures that a report match with the guidelines. The total E, total S, and total G fields provide the total amount that the reports match with the ESG Metrics of the World Federation of Exchanges guidelines (the World Federation of Exchanges, formerly the Federation Internationale des Bourses de Valeurs, or International Federation of Stock Exchanges, is the trade association of publicly regulated stock, futures and options exchanges, as well as central counterparties) mapped with the GRI Standards. In Table 4, as we did previously, we will present the ten first reports with the highest matches according to the index guidelines.

Table 4.
Top 10 index matching.
Stora Enso of Finland has 127 disclosure matches out of 166, which is relatively very high, with a distance of more than 35% to the report in the tenth position. It can be noted that the Finnish reports have virtually monopolised the top 10 positions. The Danish and Swedish reports are in the top 60, and Iceland’s ratings are lower for not applying the latest GRI Standards (see Appendix A.4).
Finally, we would like to combine the semantic similarity obtained by LSA with gloVE and the matching index. As these values belong to different ranges, we must apply the standardisation method to normalise them. The results are compiled in Table 5.

Table 5.
Top 10 companies with more cosine similarity and index matching.
Although the Finnish company Stora Enso is not even in the top 10 best reports according to their semantic affinity, their excellent rating according to disclosures was addressed in their management, which may indicate why they are in the first position in the overall position table.
6. Conclusions
The objective of this research was to discover how it can help us implement text-mining techniques if we would like to know how the reports published by Nordic companies are in line with the GRI Standards. The intrinsic valuation was implemented in Section 4 to determine the degree to which these reports are in line with the latest version of Global Reporting Initiative guidelines. Different techniques were implemented to cover the different forms that exist for semantic evaluation. LSA and gloVE were the best models in terms of congruence.
Regarding the data quality, it has been evident that creating corpus or training new models is not feasible for the volume of data we have. Furthermore, although they can offer good results on the part of similarity by strings, by sentences, which is what interested us the most, text enrichment was discarded to avoid breaking the framework of the official guidelines provided by GRI.
Regarding the trained models, despite the drawback of the amount of text to train an LSA model, it has confirmed its popularity for handling small volumes of text well. Moreover, its docility when updating the training is more than feasible for this type of study. fastText, was not very forceful when presenting the results in terms of clarity. Word3Vec pre-trained was too slow. Doc2Vec is an interesting model but not robust enough for our problem. gloVE proved to be very robust and consistent with its results.
The reports that have obtained a higher semantic similarity rating may not necessarily obtain a good index-matching rating. The reasons may differ, starting from the text extraction, which is often not 100% reliable when the text is embedded in images. Another cause may be that the reports were not updated with the new standards or omitted the GRI index in their reports. Moreover, another reason is the size of the text in the reports; sometimes, it can help obtain a better semantic assessment, but eventually, if the document contains many generalist phrases, it tends to penalise its assessment.
The results of this work are not a guide concerning the actions of companies in matters of Environment, Social, and Governance objectives, for the points outlined above. However, it does give some guidelines on how information on their achievements should be presented. A clear, concise text without any textual or media decorations will enjoy a greater probability of positive evaluation, independent of which or how many CSR Frameworks they are using. Moreover, the obtained results could be limited because we used only reports from Nordic companies. Although more general results can be achieved by including a larger set of reports by different companies around the world. In the future, we plan to explore reports from companies in similar fields or within the same geographical distributions.
Fortunately, text mining is a broad field where several actions can be taken to improve the accuracy of these results. For example, it would be necessary to extend the valuation process to experts and non-experts to reduce the bias criteria. Furthermore, we would like to incorporate more information about the different available guidelines, enrich a corpus, and make it more specific regarding Environmental, Social and Governance objectives and Sustainable Development Goals (SDGs).
Author Contributions
Conceptualisation, methodology, software, validation, M.G.-B.; formal analysis, investigation, resources and data curation, M.G.-B. and L.E.-L.; writing—original draft preparation, M.G.-B.; writing—review and editing, M.G.-B. and L.E.-L. All authors have read and agreed to the published version of the manuscript.
Funding
This research received no external funding.
Institutional Review Board Statement
Not applicable.
Informed Consent Statement
Not applicable.
Data Availability Statement
Data used in this work can be found at https://www.globalreporting.org/standards/, accessed on 1 July 2021 for the GRI Standards and https://www.globalreporting.org/, accessed on 1 July 2021 for the reports.
Acknowledgments
The authors wish to acknowledge CSC—IT Center for Science, Finland, for computational resources.
Conflicts of Interest
The authors declare no conflict of interest.
Appendix A
Appendix A.1
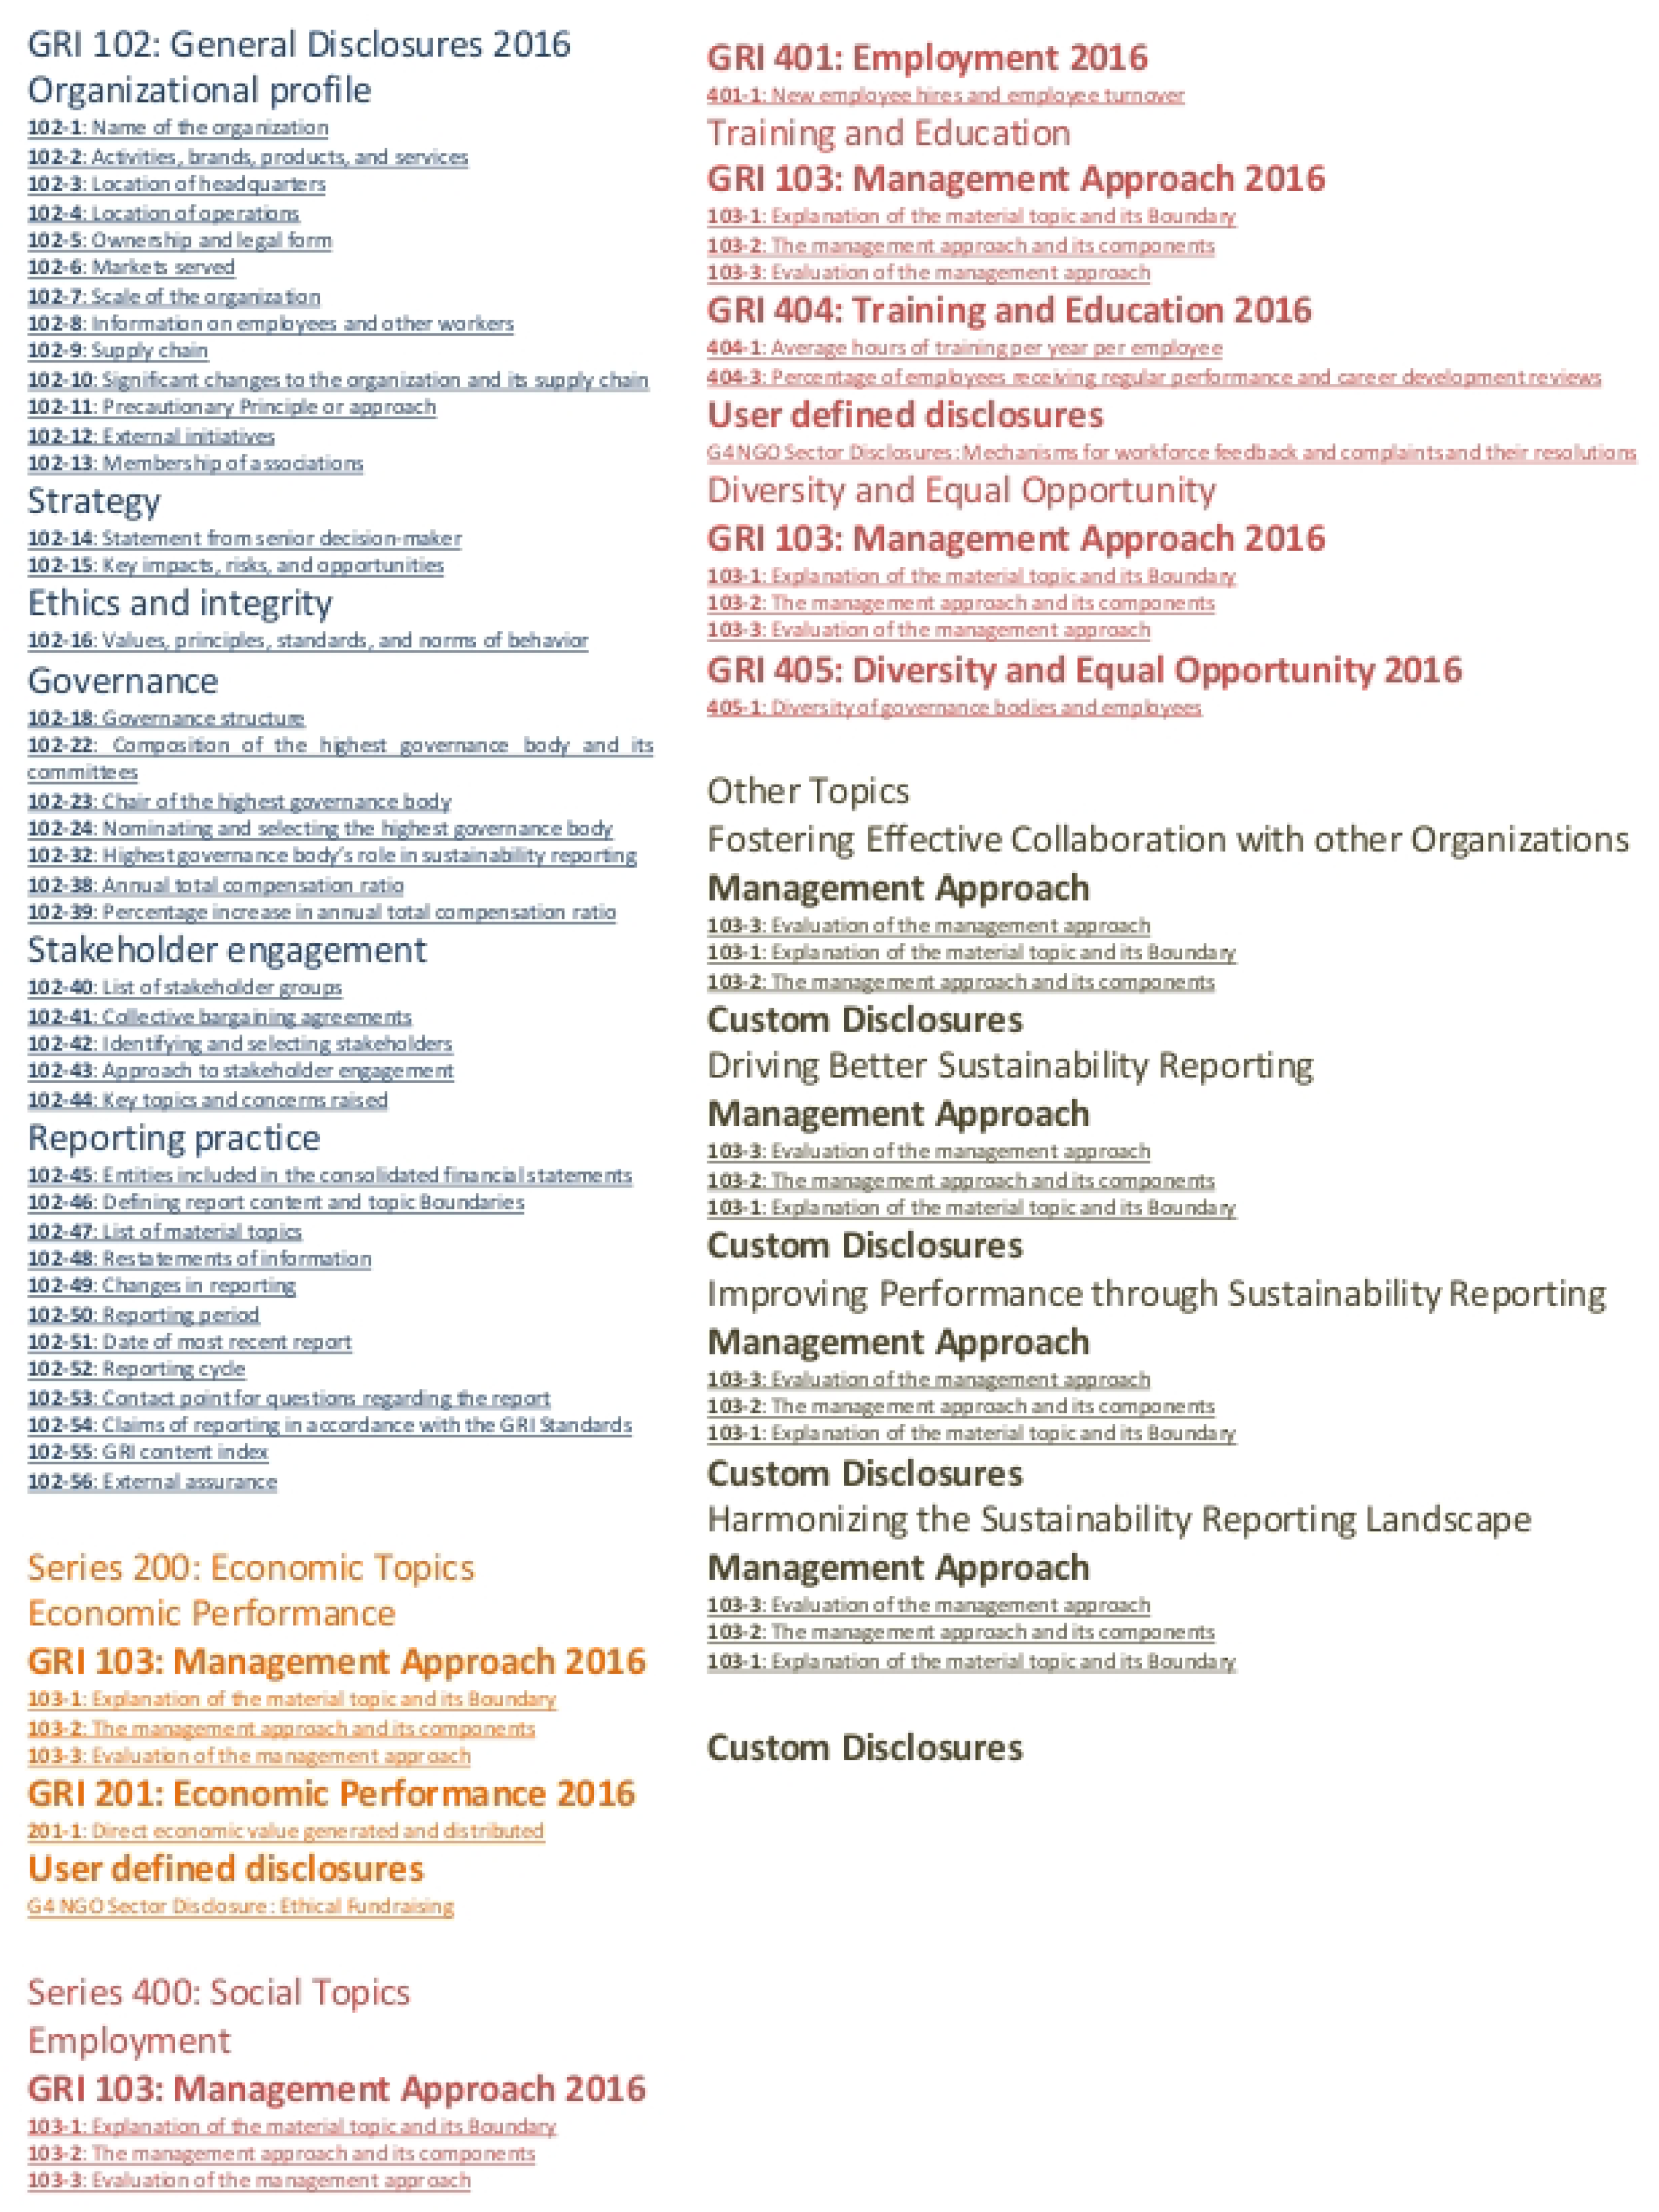
Distribution of GRI Guidelines (For more details: https://www.globalreporting.org/standards/, accessed on 1 July 2021).
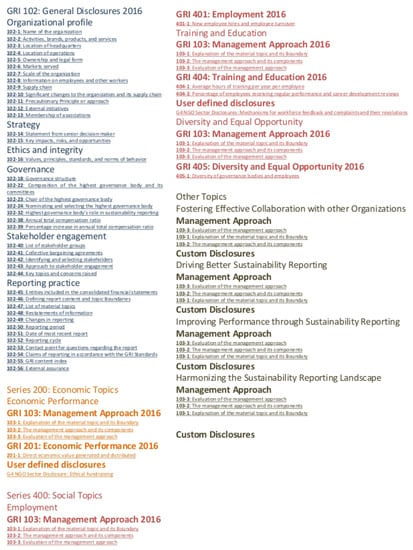
Figure A1.
GRI Guidelines distribution.
Figure A1.
GRI Guidelines distribution.
Appendix A.2
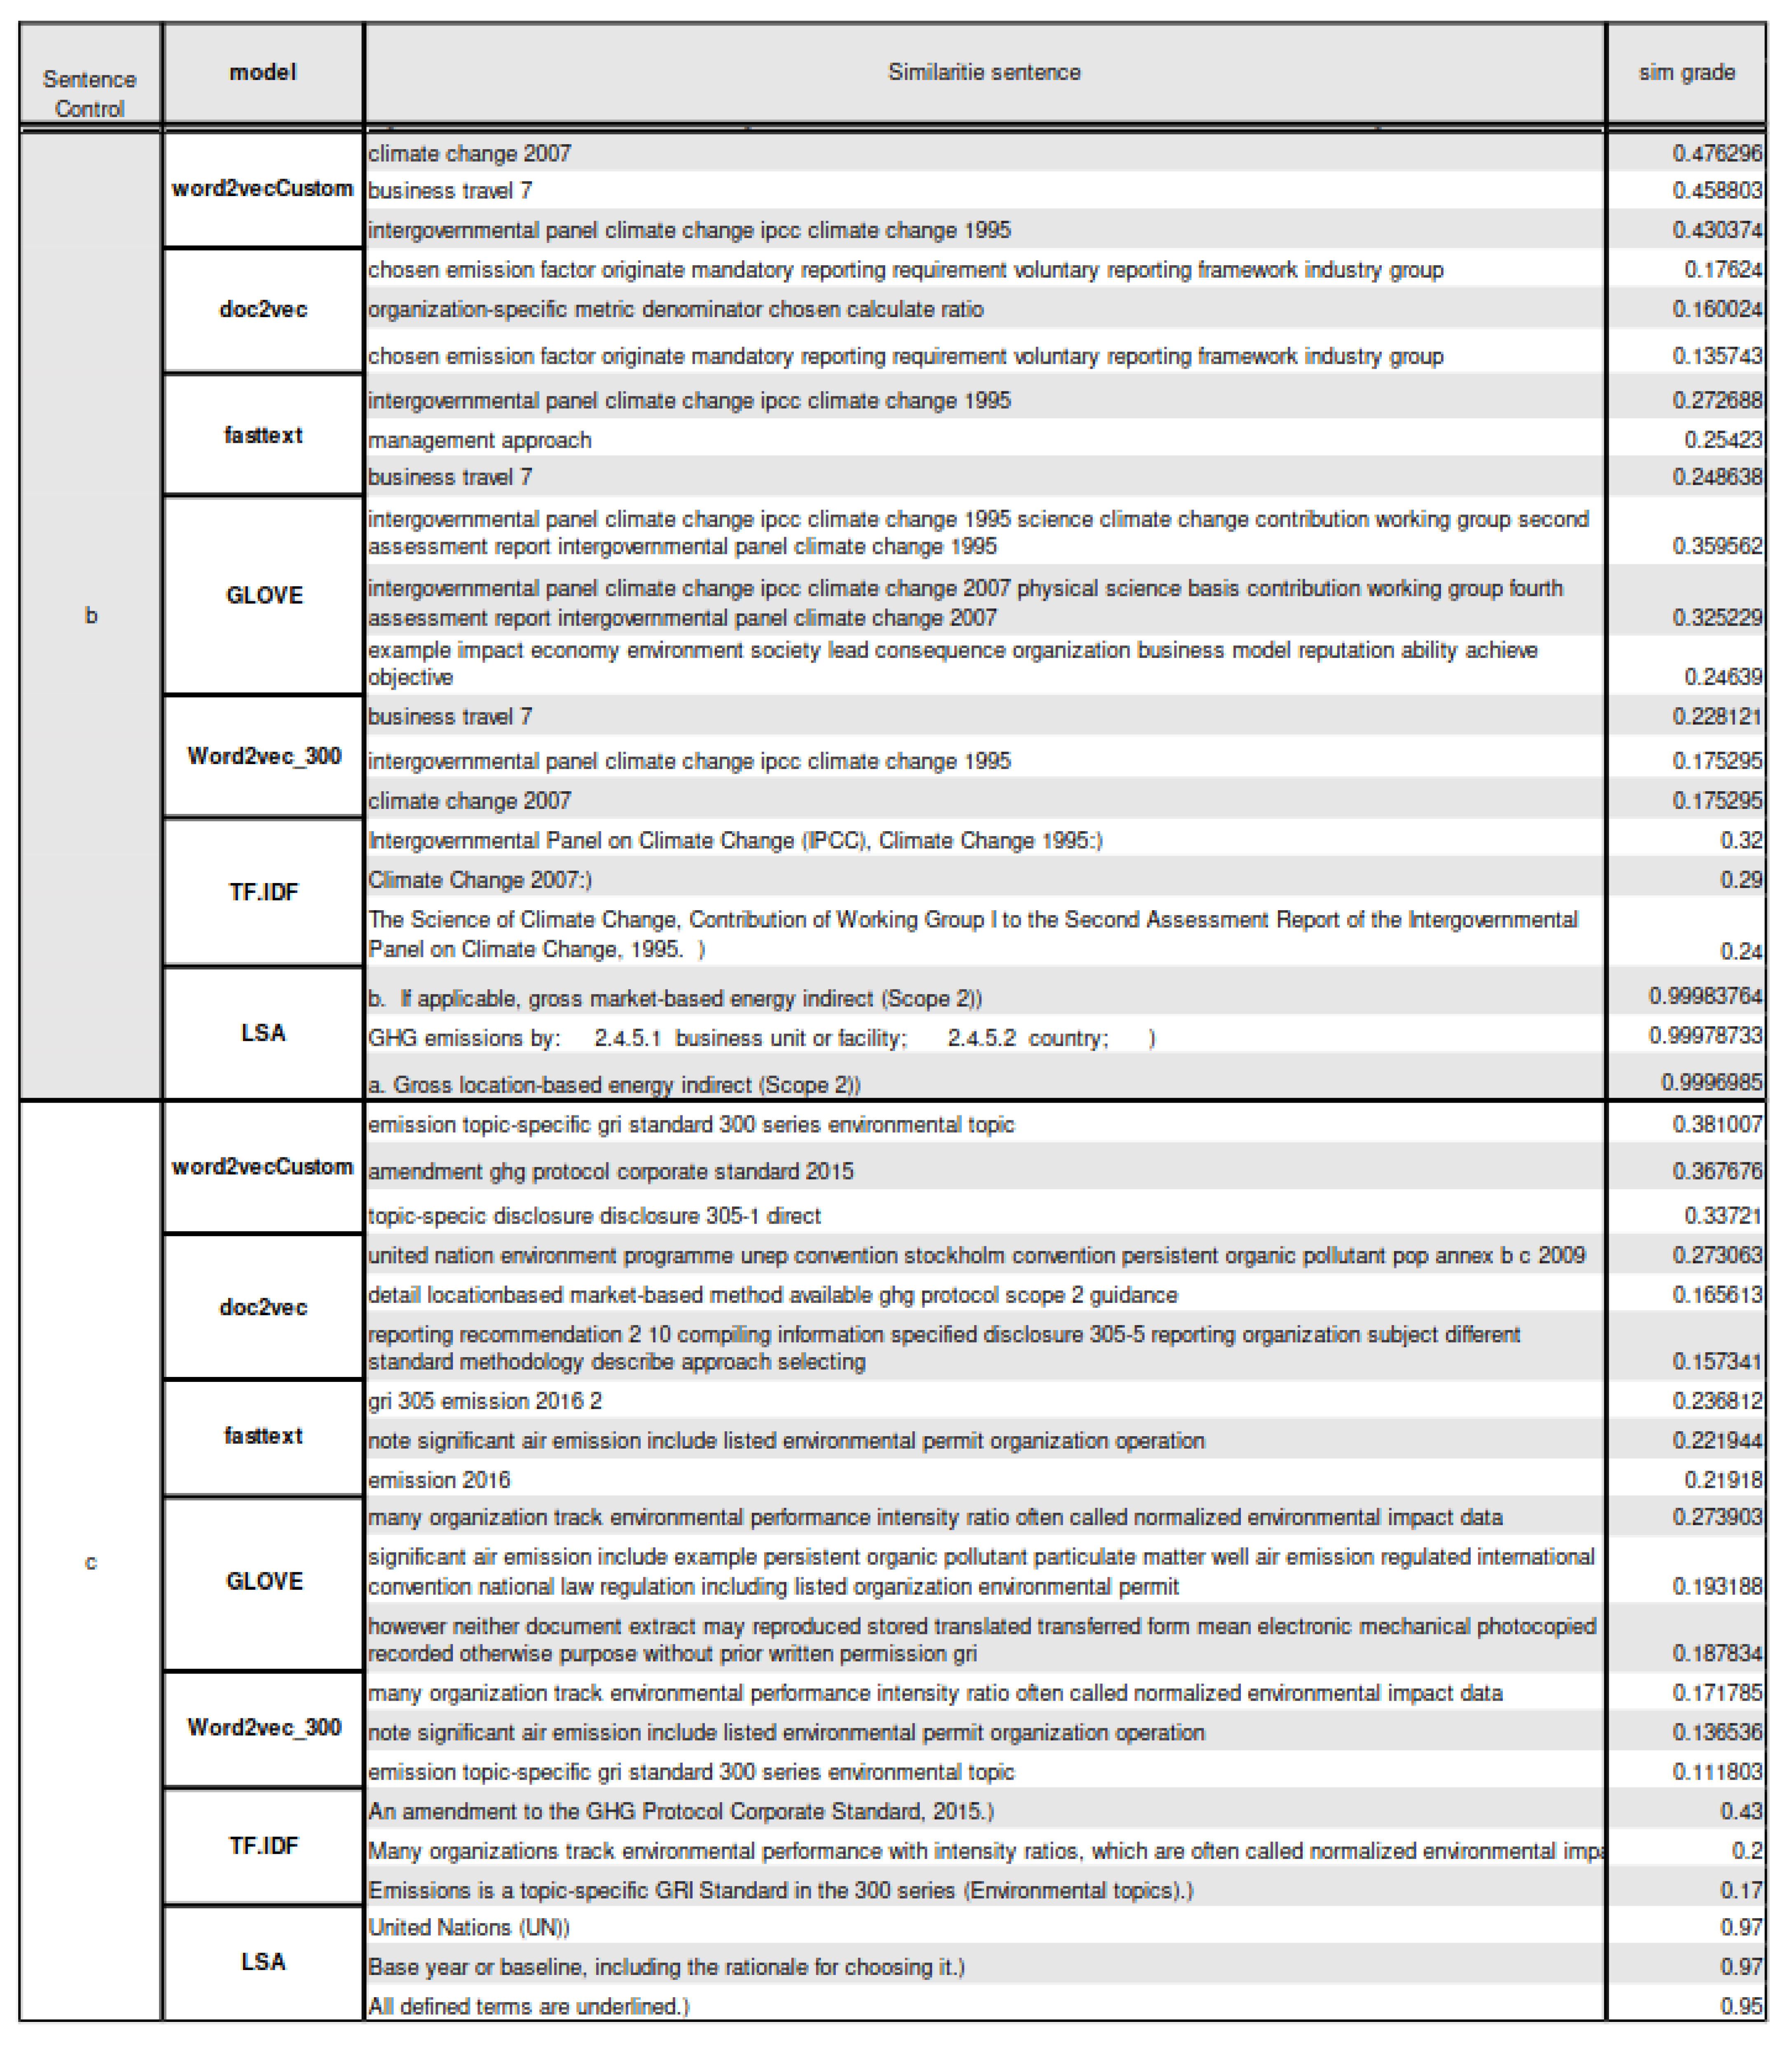
Similarity by sentences obtained from the different trained models regarding the sentence control (b) and (c).
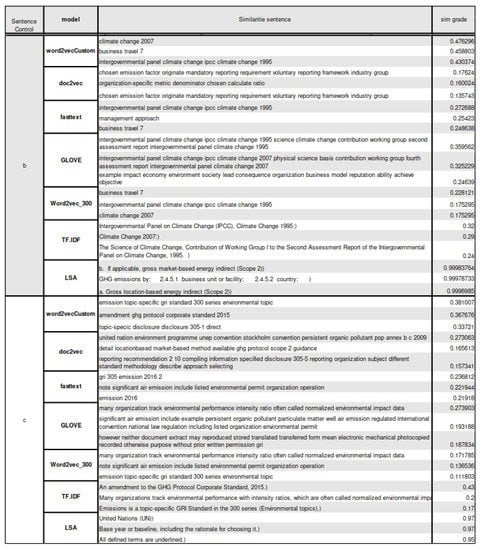
Figure A2.
Similarity by sentences obtained from the different trained models regarding the sentence control (b) and (c).
Figure A2.
Similarity by sentences obtained from the different trained models regarding the sentence control (b) and (c).
Appendix A.3
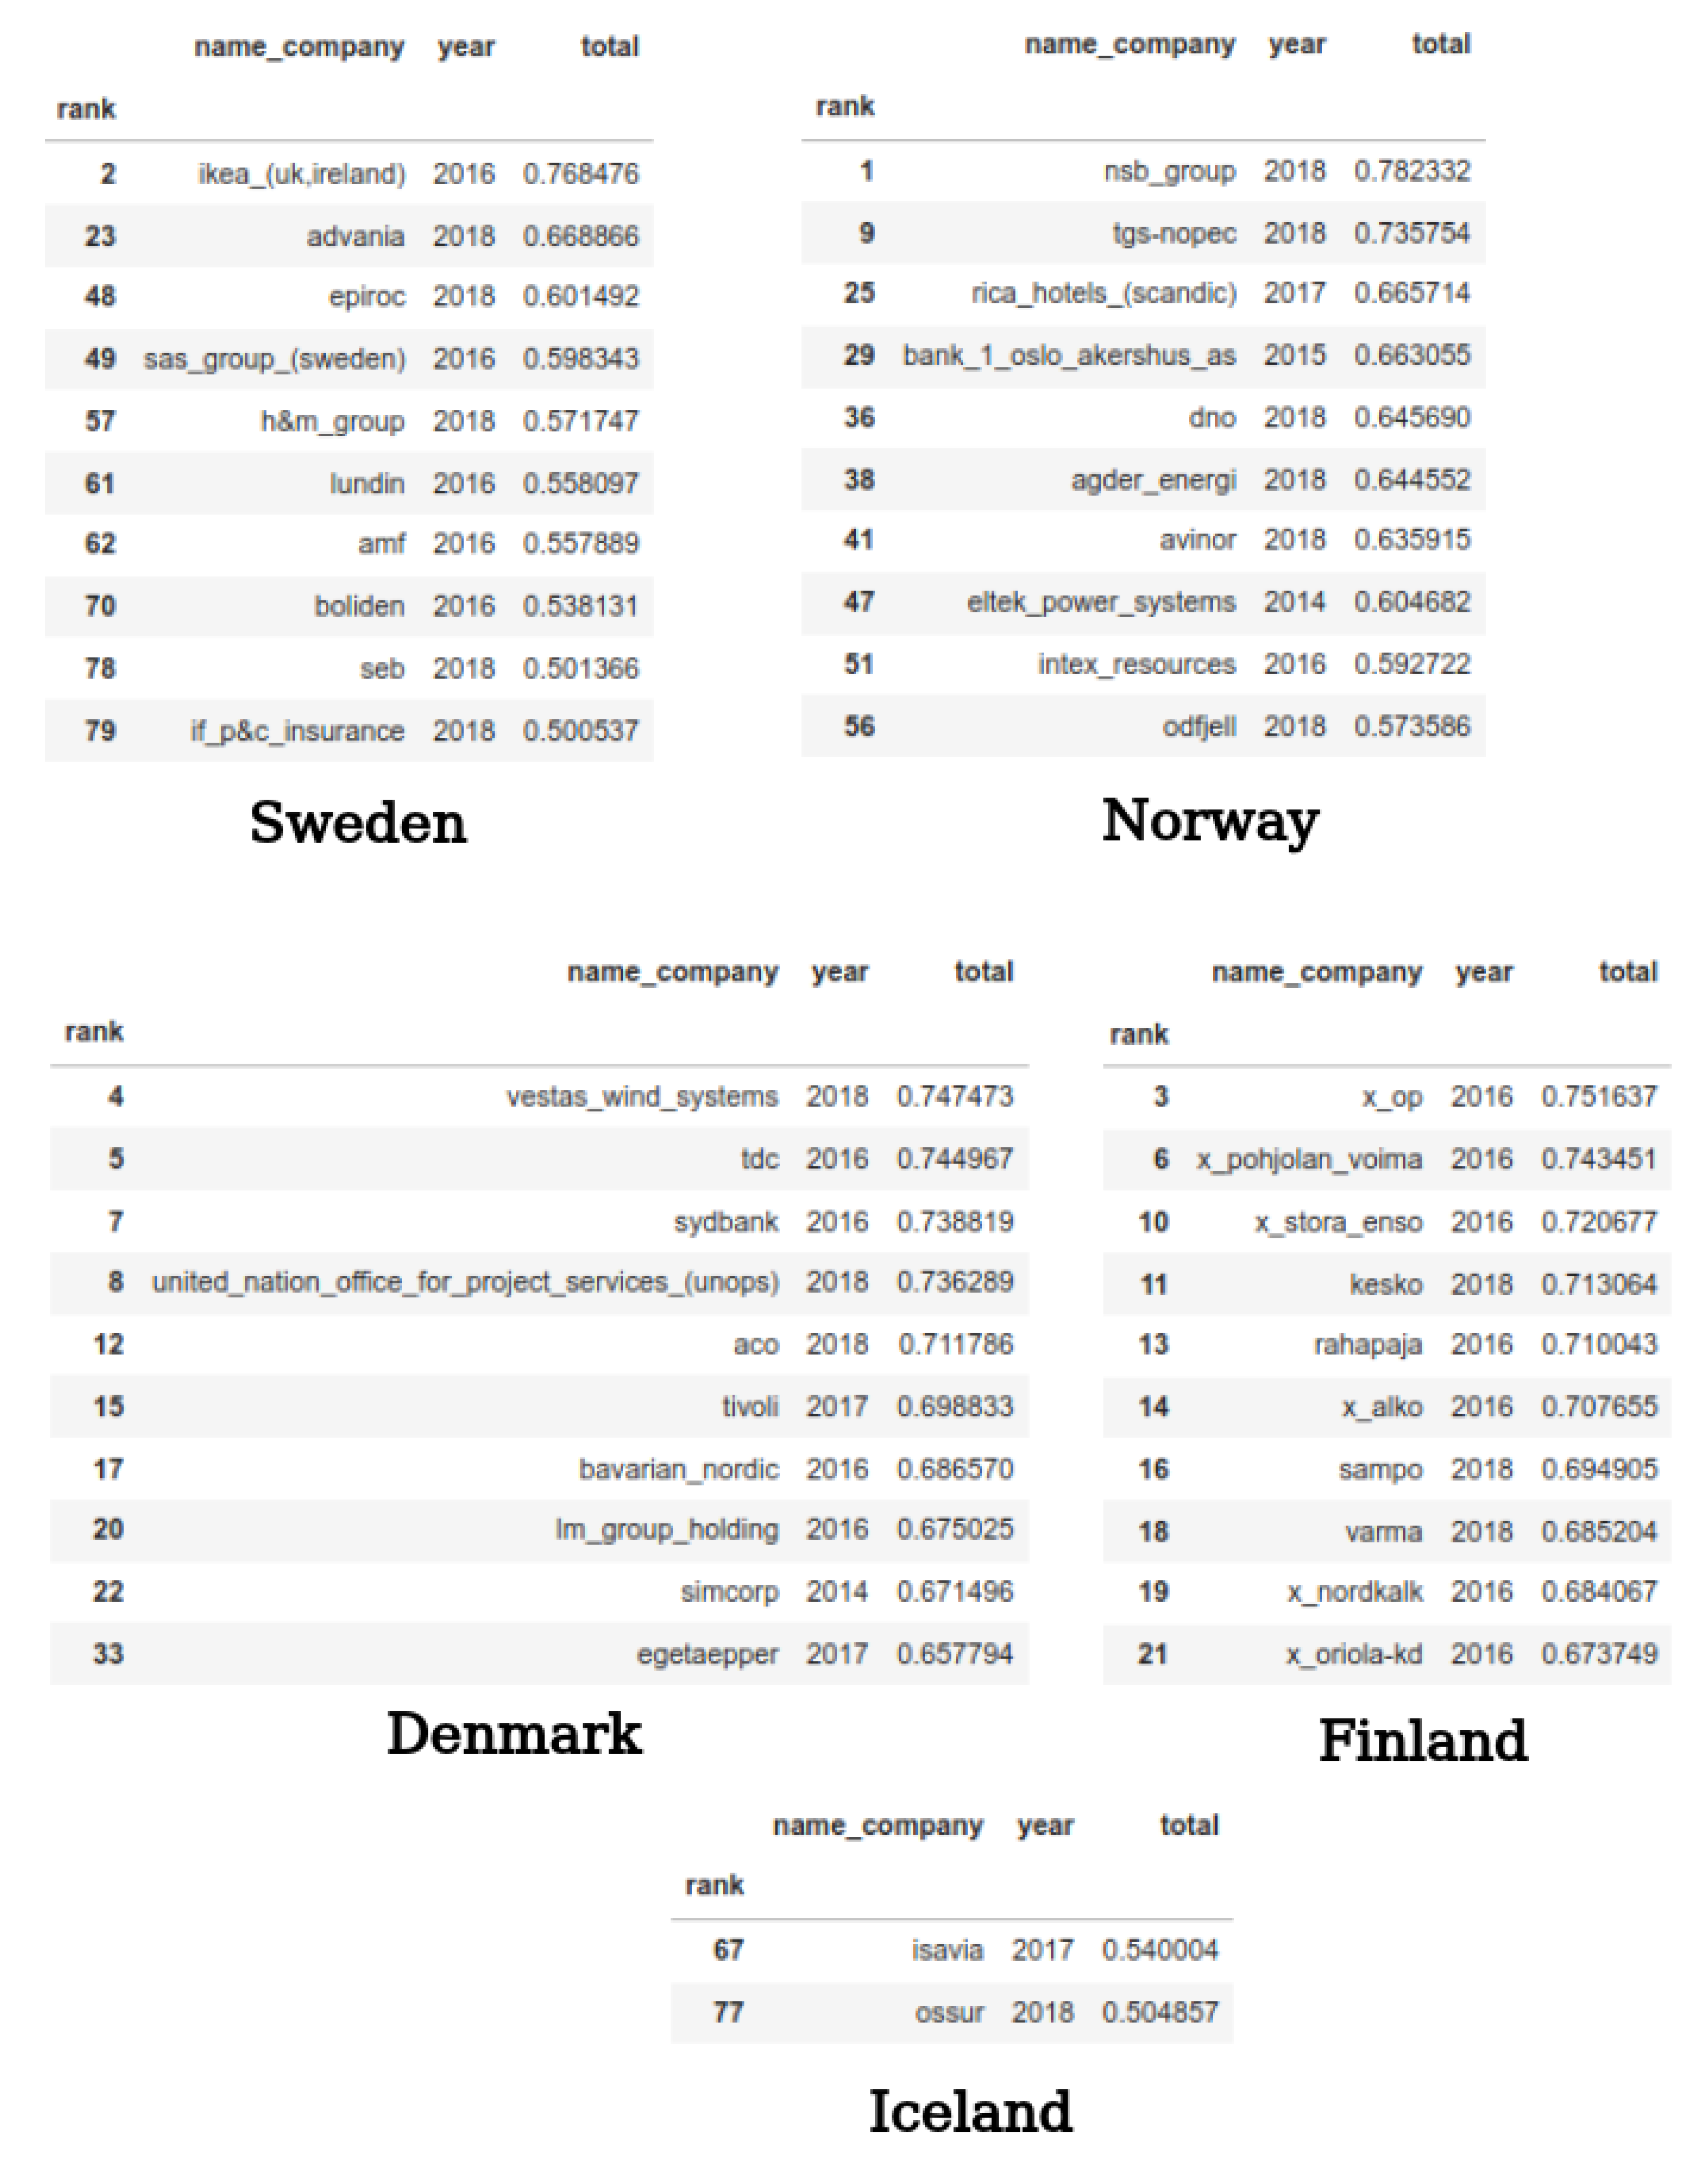
Top 10 semantic similarities by countries:
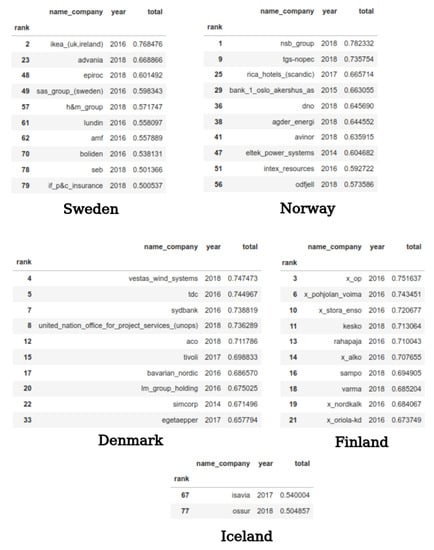
Figure A3.
Top 10 semantic similarities by countries.
Figure A3.
Top 10 semantic similarities by countries.
Appendix A.4
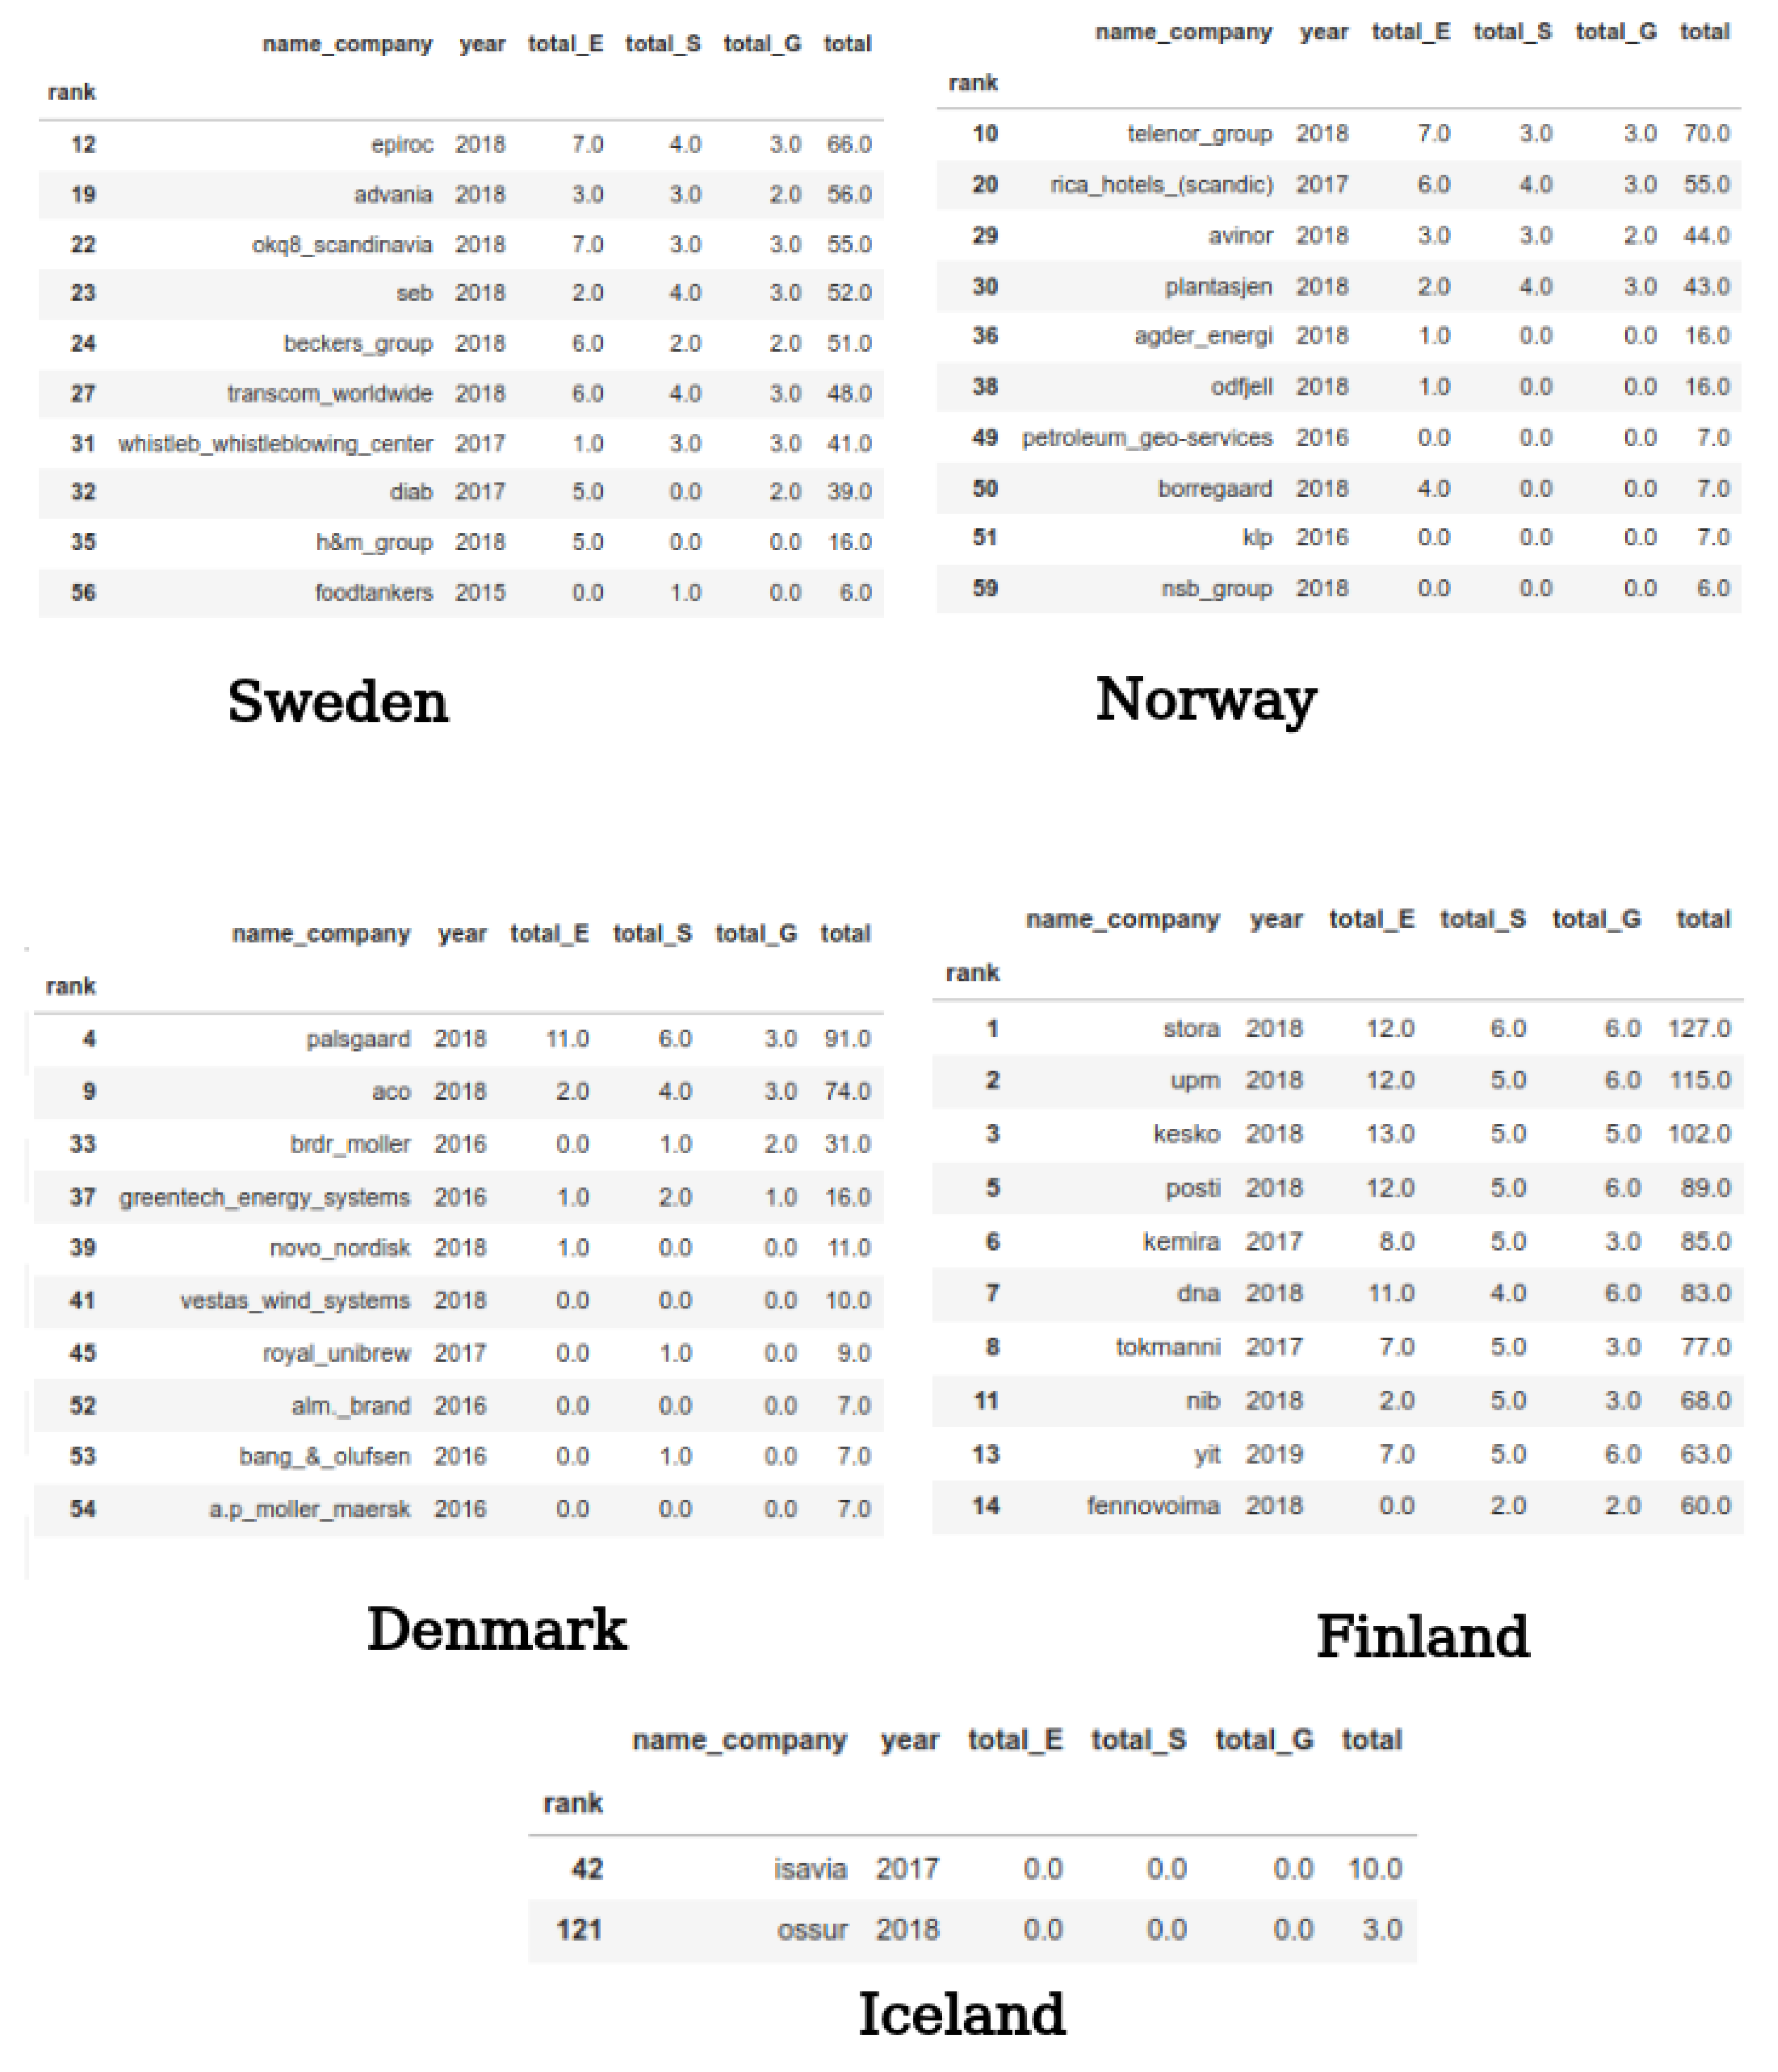
Top 10 index matching by countries:
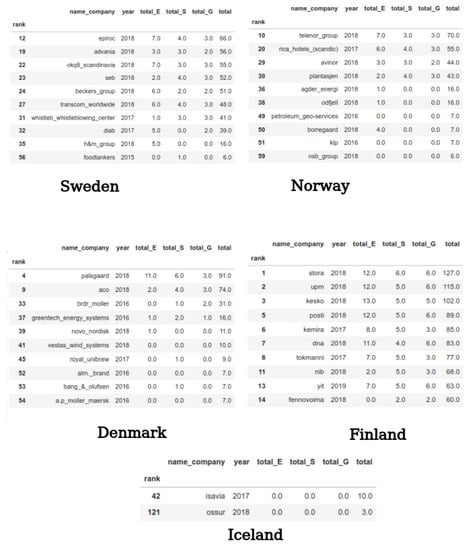
Figure A4.
Top 10 index matching by countries.
Figure A4.
Top 10 index matching by countries.
References
- Dumay, J.; Guthrie, J.; Farneti, F. GRI sustainability reporting guidelines for public and third sector organizations: A critical review. Public Manag. Rev. 2010, 12, 531–548. [Google Scholar] [CrossRef]
- Larrinaga-González, C. The GRI Sustainability Reporting Guidelines: A review of current practice. Soc. Environ. Account. J. 2001, 21, 1–4. [Google Scholar] [CrossRef]
- Novokmet, A.K.; Rogošić, A. Bank sustainability reporting within the GRI-G4 framework. Zesz. Teoretyczne Rachun. 2016, 88, 109–123. [Google Scholar]
- Fernandez-Feijoo, B.; Romero, S.; Ruiz, S. Effect of stakeholders’ pressure on transparency of sustainability reports within the GRI framework. J. Bus. Ethics 2014, 122, 53–63. [Google Scholar] [CrossRef]
- Halkos, G.; Nomikos, S. Corporate social responsibility: Trends in global reporting initiative standards. Econ. Anal. Policy 2021, 69, 106–117. [Google Scholar] [CrossRef]
- Servaes, H.; Tamayo, A. The role of social capital in corporations: A review’. Oxf. Rev. Econ. Policy 2017, 33, 201–220. [Google Scholar] [CrossRef]
- WEF. The Global Risks Report. Geneva: World Economic Forum. 2019. Available online: http://reports.weforum.org/global-risks-2019/ (accessed on 29 January 2020).
- Boerner, H. New GRI’s G4 sustainability reporting guidelines. Corp. Financ. Rev. 2013, 18, 25. [Google Scholar]
- Tan, A.H. Text Mining: The State of the Art and the Challenges. In Proceedings of the PAKDD 1999 Workshop on Knowledge Discovery from Advanced Databases, Beijing, China, 26–28 April 1999; Volume 8, pp. 65–70. [Google Scholar]
- Hauer, B.; Kondrak, G. Clustering semantically equivalent words into cognate sets in multilingual lists. In Proceedings of the 5th International Joint Conference on Natural Language Processing, Chiang Mai, Thailand, 8–13 November 2011; pp. 865–873. [Google Scholar]
- Mikhailov, D.; Emel’yanov, G. Semantic clustering and affinity measure of subject-oriented language texts. Pattern Recognit. Image Anal. 2010, 20, 376–385. [Google Scholar] [CrossRef]
- Buns, M.A. Making a model: The 1974 Nordic Environmental Protection Convention and Nordic attempts to form international environmental law. Scand. J. Hist. 2022, 1–23. [Google Scholar] [CrossRef]
- Griffin, J.; Mahon, J. The corporate social performance and corporate financial performance debate: Twenty-five years of incomparable research. Bus. Soc. 1997, 36, 5–31. [Google Scholar] [CrossRef]
- Wang, Q.; Dou, J.; Jia, S. A Meta-Analytic Review of Corporate Social Responsibility and Corporate Financial Performance: The Moderating Effect of Contextual Factors. Bus. Soc. 2016, 55, 1083–1121. [Google Scholar] [CrossRef]
- KPMG. The KPMG Survey of Corporate Responsibility Reporting 2017; KPMG International: Zurich, Switzerland, 2017; p. 19. [Google Scholar]
- Aryal, N. Comparative Study of CSR Reporting in Finnish and UK Listed Companies; University of Arcada: Helsinki, Finland, 2014. [Google Scholar]
- Shahi, A.; Issac, B.; Modapothala, J. Reliability assessment of an intelligent approach to corporate sustainability report analysis. Lect. Notes Electr. Eng. 2015, 313, 233–240. [Google Scholar]
- Wilson, A.; Rayson, P. Automatic Content Analysis of Spoken Discourse: A Report on Work in Progress, Corpus Based Computational Linguistics; Rodopi: Amsterdam, The Netherlands, 1993. [Google Scholar]
- Guthrie, J.; Abeysekera, I. Content analysis of social, environmental reporting: What is new? J. Hum. Resour. Costing Account. 2006, 10, 114–126. [Google Scholar] [CrossRef] [Green Version]
- Ameri Sianaki, O.; Yousefi, A.; Tabesh, A.R.; Mahdavi, M. Machine learning applications: The past and current research trend in diverse industries. Inventions 2019, 4, 8. [Google Scholar] [CrossRef] [Green Version]
- Espinosa-Leal, L.; Chapman, A.; Westerlund, M. Autonomous industrial management via reinforcement learning. J. Intell. Fuzzy Syst. 2020, 39, 8427–8439. [Google Scholar] [CrossRef]
- Teoh, T.T.; Heng, Q.; Chia, J.; Shie, J.; Liaw, S.; Yang, M.; Nguwi, Y.Y. Machine Learning-based Corporate Social Responsibility Prediction. In Proceedings of the IEEE International Conference on Cybernetics and Intelligent Systems (CIS) and IEEE Conference on Robotics, Automation and Mechatronics (RAM), Bangkok, Thailand, 18–20 November 2019; pp. 501–505. [Google Scholar]
- Krappel, T.; Bogun, A.; Borth, D. Heterogeneous Ensemble for ESG Ratings Prediction. arXiv 2021, arXiv:2109.10085. [Google Scholar]
- Isaksson, R.; Steimle, U. What does GRI reporting tell us about corporate sustainability? TQM J. 2009, 21, 168–181. [Google Scholar] [CrossRef] [Green Version]
- Knebel, S.; Seele, P. Quo vadis GRI? A (critical) assessment of GRI 3.1 A+ non-financial reports and implications for credibility and standardization. Corp. Commun. Int. J. 2015, 20, 196–212. [Google Scholar] [CrossRef]
- Lozano, R.; Huisingh, D. Inter- linking issues and dimensions in sustainability reporting. J. Clean. Prod. 2011, 19, 99–107. [Google Scholar] [CrossRef]
- Initiative, G.R. G4 Sustainability Report Guidelines—Reporting Principles and Standard Disclosures; GRI: Amsterdam, The Netherlands, 2013. [Google Scholar]
- Initiative, G.R. First Global Sustainability Reporting Standards Set to Transform Business; GRI: Amsterdam, The Netherlands, 2016. [Google Scholar]
- Kolk, A. A decade of sustainability reporting: Developments and significance. Int. J. Environ. Sustain. Dev. 2004, 3, 51–64. [Google Scholar] [CrossRef] [Green Version]
- Kolk, A. Trends in sustainability reporting by the Fortune Global 250. Bus. Strategy Environ. 2003, 12, 279–291. [Google Scholar] [CrossRef]
- Bjørn, A.; Bey, N.; Georg, S.; Røpke, I.; Hauschild, M. Is Earth recognized as a finite system in corporate responsibility reporting? J. Clean. Prod. 2017, 163, 106–117. [Google Scholar] [CrossRef] [Green Version]
- Freundlieb, M.; Teuteberg, F. Corporate social responsibility reporting-a transnational analysis of online corporate social responsibility reports by market–listed companies: Contents and their evolution. Int. J. Innov. Sustain. Dev. 2013, 7, 1–26. [Google Scholar] [CrossRef]
- Liew, W.; Adhitya, A.; Srinivasan, R. Sustainability trends in the process industries: A text mining-based analysis. Comput. Ind. 2014, 65, 393–400. [Google Scholar] [CrossRef]
- Székely, N.; Brocke, J. What can we learn from corporate sustainability reporting? Deriving propositions for research and practice from over 9,500 corporate sustainability reports published between 1999 and 2015 using topic modelling technique. PLoS ONE 2017, 12, e0174807. [Google Scholar] [CrossRef] [PubMed] [Green Version]
- Yamamoto, Y.; Miyamoto, D.; Nakayama, M. Text-Mining Approach for Estimating Vulnerability Score. In Proceedings of the 2015 4th International Workshop on Building Analysis Datasets and Gathering Experience Returns for Security (BADGERS), Kyoto, Japan, 5 November 2015; pp. 67–73. [Google Scholar]
- Chae, B.; Park, E. Corporate Social Responsibility (CSR): A Survey of Topics and Trends Using Twitter Data and Topic Modeling. Sustainability 2018, 10, 2231. [Google Scholar] [CrossRef] [Green Version]
- Benites-Lazaro, L.; Giatti, L.; Giarolla, A. Sustainability and governance of sugarcane ethanol companies in Brazil: Topic modeling analysis of CSR reporting. J. Clean. Prod. 2018, 197, 583–591. [Google Scholar] [CrossRef]
- Blei, D.M.; Ng, A.Y.; Jordan, M.I. Latent dirichlet allocation. J. Mach. Learn. Res. 2003, 3, 993–1022. [Google Scholar]
- Tremblay, M.; Parra, C.; Castellanos, A. Analyzing Corporate Social Responsibility Reports Using Unsupervised and Supervised Text Data Mining. In Proceedings of the International Conference on Design Science Research in Information Systems, Dublin, Ireland, 20–22 May 2015; pp. 439–446. [Google Scholar]
- Modapothala, J.; Issac, B. Analysis of Corporate Environmental Reports Using Statistical Techniques and Data Mining. arXiv 2014, arXiv:1410.4182. [Google Scholar]
- Modapothala, J.; Issac, B.; Jayamani, E. Appraising the Corporate Sustainability Reports–Text Mining And Multi-Discriminatory Analysis. In Innovations in Computing Sciences and Software Engineering; Springer: Dordrecht, The Netherlands, 2010; pp. 489–494. [Google Scholar]
- Liu, S.; Chen, S.; Li, S. Text-Mining Application on CSR Report Analytics: A Study of Petrochemical Industry. In Proceedings of the Advanced Applied Informatics (IIAI-AAI), 2017 6th IIAI International Congress on, Hamamatsu, Japan, 9–13 July 2017; pp. 76–81. [Google Scholar]
- Jones, K.S. A statistical interpretation of term specificity and its application in retrieval. J. Doc. 1972, 28, 11–21. [Google Scholar] [CrossRef]
- Mandal, A.; Ghosh, K.; Ghosh, S.; Mandal, S. Unsupervised approaches for measuring textual similarity between legal court case reports. Artif. Intell. Law 2021, 29, 417–451. [Google Scholar] [CrossRef]
- Chen, Q.; Peng, Y.; Lu, Z. BioSentVec: Creating sentence embeddings for biomedical texts. In Proceedings of the IEEE International Conference on Healthcare Informatics (ICHI), Xi’an, China, 10–13 June 2019; pp. 1–5. [Google Scholar]
- Nadif, M.; Role, F. Unsupervised and self-supervised deep learning approaches for biomedical text mining. Briefings Bioinform. 2021, 22, 1592–1603. [Google Scholar] [CrossRef] [PubMed]
- Baggio, R.; Valeri, M. Network science and sustainable performance of family businesses in tourism. J. Fam. Bus. Manag. 2020, 12, 200–213. [Google Scholar] [CrossRef]
- Behrens, J.T. Principles and procedures of exploratory data analysis. Psychol. Methods 1997, 2, 131. [Google Scholar] [CrossRef]
- Komorowski, M.; Marshall, D.C.; Salciccioli, J.D.; Crutain, Y. Exploratory data analysis. Second. Anal. Electron. Health Rec. 2016, 1, 185–203. [Google Scholar]
- Cox, V. Exploratory data analysis. In Translating Statistics to Make Decisions; Springer: Berlin/Heidelberg, Germany, 2017; pp. 47–74. [Google Scholar]
- Morgenthaler, S. Exploratory data analysis. Wiley Interdiscip. Rev. Comput. Stat. 2009, 1, 33–44. [Google Scholar] [CrossRef]
- Singhal, A. Modern information retrieval: A brief overview. IEEE Data Eng. Bull. 2001, 24, 35–43. [Google Scholar]
- Baeza-Yates, R.; Ribeiro-Neto, B. Modern Information Retrieval; ACM press: New York, NY, USA, 1999; Volume 463. [Google Scholar]
- Schütze, H.; Manning, C.D.; Raghavan, P. An introduction to information retrieval. In Web Information Retrieval; Springer: Berlin/Heidelberg, Germany, 2007; pp. 3–11. [Google Scholar]
- Nadkarni, P.M.; Ohno-Machado, L.; Chapman, W.W. Natural language processing: An introduction. J. Am. Med. Informatics Assoc. 2011, 18, 544–551. [Google Scholar] [CrossRef] [PubMed] [Green Version]
- Hu, W.; Dang, A.; Tan, Y. A survey of state-of-the-art short text matching algorithms. In Proceedings of the International Conference on Data Mining and Big Data, Belgrade, Serbia, 14–20 July 2019; pp. 211–219. [Google Scholar]
- Jivani, A.G. A comparative study of stemming algorithms. Int. J. Comp. Tech. Appl. 2011, 2, 1930–1938. [Google Scholar]
- Global Report Initiative. GRI 305: Emissions 2016. 2016. Available online: https://www.globalreporting.org/standards/media/1012/gri-305-emissions-2016.pdf (accessed on 1 July 2021).
- Korenius, T.; Laurikkala, J.; Järvelin, K.; Juhola, M. Stemming and Lemmatization in the Clustering of Finnish Text Documents. In Proceedings of the Thirteenth ACM International Conference on Information and Knowledge Management, Washington, DC, USA, 8–13 November 2004; pp. 625–633. [Google Scholar]
- Mikolov, T.; Chen, K.; Corrado, G.; Dean, J. Efficient Estimation of Word Representations in Vector Space. arXiv 2013, arXiv:1301.3781. [Google Scholar]
- Mikolov, T.; Sutskever, I.; Chen, K.; Corrado, G.S.; Dean, J. Distributed representations of words and phrases and their compositionality. In Proceedings of the Advances in Neural Information Processing Systems, Lake Tahoe, Nevada, 5–10 December 2013; pp. 3111–3119. [Google Scholar]
- Blei, D.M. Probabilistic topic models. Commun. ACM 2012, 55, 77–84. [Google Scholar] [CrossRef] [Green Version]
- Kessler, J.S. Scattertext: A Browser-Based Tool for Visualizing How Corpora Differ. arXiv 2017, arXiv:1703.00565. [Google Scholar]
- Cleverdon, C.W. On the inverse relationship of recall and precision. J. Doc. 1972, 28, 195–201. [Google Scholar] [CrossRef]
- Vasiliev, Y. Natural Language Processing with Python and SpaCy: A Practical Introduction; No Starch Press: San Francisco, CA, USA, 2020. [Google Scholar]
- Loper, E.; Bird, S. Nltk: The Natural Language Toolkit. arXiv 2002, arXiv:cs/0205028. [Google Scholar]
- Pedregosa, F.; Varoquaux, G.; Gramfort, A.; Michel, V.; Thirion, B.; Grisel, O.; Blondel, M.; Prettenhofer, P.; Weiss, R.; Dubourg, V.; et al. Scikit-learn: Machine learning in Python. J. Mach. Learn. Res. 2011, 12, 2825–2830. [Google Scholar]
- Rehurek, R.; Sojka, P. Software framework for topic modelling with large corpora. In Proceedings of the LREC 2010 Workshop on New Challenges for NLP Frameworks, Valletta, Malta, 19–21 May 2010. [Google Scholar]
- Abadi, M.; Barham, P.; Chen, J.; Chen, Z.; Davis, A.; Dean, J.; Devin, M.; Ghemawat, S.; Irving, G.; Isard, M.; et al. Tensorflow: A system for large-scale machine learning. In Proceedings of the 12th USENIX Symposium on Operating Systems Design and Implementation (OSDI 16), Savannah, GA, USA, 2–4 November 2016; pp. 265–283. [Google Scholar]
- Friedl, J.E. Mastering Regular Expressions; O’Reilly Media, Inc.: Newton, MA, USA, 2006. [Google Scholar]
- Lacoste, A.; Luccioni, A.; Schmidt, V.; Dandres, T. Quantifying the Carbon Emissions of Machine Learning. arXiv 2019, arXiv:1910.09700. [Google Scholar]
- Budanitsky, A.; Hirst, G. Evaluating wordnet-based measures of lexical semantic relatedness. Comput. Linguist. 2006, 32, 13–47. [Google Scholar] [CrossRef]
Publisher’s Note: MDPI stays neutral with regard to jurisdictional claims in published maps and institutional affiliations. |
© 2022 by the authors. Licensee MDPI, Basel, Switzerland. This article is an open access article distributed under the terms and conditions of the Creative Commons Attribution (CC BY) license (https://creativecommons.org/licenses/by/4.0/).

