1. Introduction
There is a lot of capital invested in the early stage of agricultural production and planting, and farmers are therefore subject to financial constraints [
1]. With the rapid development of agricultural product supply chains, the problem of farmers’ financial constraints in the early stages of agricultural production and planting has become increasingly serious [
2]. The traditional financing method for farmers is to borrow from banks [
3], but due to insufficient collateral for farmers, their loans from banks are limited. To solve the problem of financing difficulties, e-commerce companies—as retailers within the supply chain—provide financing services for farmers [
4], such as Jingnongdai from JD.com, Wangnongdai from Alibaba, and Huinongdai from Suning. The e-commerce financing model can realize a synergy between online and offline resources and reduce supply chain costs.
However, agriculture is significantly affected by natural factors such as weather and climate [
5], and the supply chain of agricultural products carries the risk of output uncertainty [
6]. In practice, farmers’ production and operation scales are small, and they are risk-averse to output uncertainty [
7,
8]. Farmers’ risk-averse attitude affects the equilibrium decision-making of supply chain members [
9].
Issues such as agricultural supply chains and supply chain finance have been widely discussed theoretically [
10,
11,
12]; but to the best of our knowledge, there are few studies on financing options for agricultural supply chains. In practice, the risk-averse attitude of farmers not only affects their decision-making on production input, but the optimal decision of e-commerce as a member of the supply chain is also affected by the risk attitude of farmers. Existing theories and practices ignore the impact of farmers’ risk attitudes on their choice of agricultural supply chain financing strategies. Therefore, this study aimed to bridge this gap by addressing the following questions:
(1) When considering farmers’ risk attitudes, what are the optimal decisions of e-entrepreneurs and farmers under different financing strategies?
(2) How do factors such as farmers’ risk aversion, expected output factors, and e-commerce’s interest rates affect the formulation of optimal decisions?
(3) How do farmers choose their financing strategies?
To answer these questions, this study focuses on agricultural supply chains that consist of e-commerce companies and capital-constrained farmers. Farmers have two financing strategies: bank financing (farmers obtain loans from banks) and e-commerce financing (farmers obtain loans from e-commerce). We reveal the optimal decision for the supply chain of agricultural products under the influence of farmers’ risk attitudes and other factors. We then obtain the financing preferences of farmers by comparing and analyzing the profit models under different financing strategies.
Our study contributes in three ways. First, farmers’ risk-averse attitudes affect the supply chain’s overall decision making. We apply the CvaR method to study how farmers with uncertain output risks determine production decisions when their capital is limited to fill the gap in previous studies. Second, we analyze the influence of factors—such as farmers’ risk attitudes—on the optimal decision-making of agricultural product supply chains. Finally, e-commerce companies were introduced into supply chain finance programs. In the cases of bank financing strategy (BF) and e-commerce financing strategy (RF), we innovatively explore the impact of farmers’ risk preferences and other factors on farmers’ financing preferences and help farmers with financial constraints to choose the best financing plan, which is an area to be explored. We find that farmers with low risk aversion prefer to choose the e-commerce financing strategy when the e-commerce’s interest rates are low. In addition, the risk-averse attitude of farmers will lead to lower equilibrium decisions of farmers and e-commerce, which is not conducive to the benefits of farmers and e-commerce. A higher expected output factor reduces the production input of farmers and the purchase price of e-commerce products. When the expected output factor is low, the financing strategy of e-commerce is only affected by the interest rate, and the lower interest rate will create more value for e-commerce.
The remainder of this paper is organized as follows. The relevant literature is summarized in
Section 2. A description of the model and its assumptions are presented in
Section 3. The optimal BF and RF strategies are described in
Section 4.
Section 5 presents the numerical analysis.
Section 6 presents the conclusions and management insights. All of the proofs are provided in
Appendix A.
2. Literature Review
2.1. Agricultural Product Supply Chain
The uncertainty of output in the agricultural product supply chain is a risk that is difficult to grasp in agricultural production decision making. Natural disasters such as climate change will lead to a reduction in agricultural production, which is the main factor affecting the agricultural product market [
13,
14,
15]. Assouto et al. also confirmed that weather-induced uncertainty in agricultural output increases market price volatility [
16]. Therefore, scholars have focused on the impact of output uncertainty on supply chains in related research on agricultural supply chains. For example, Liu, Deng and Shi et al. studied the problem of agricultural supply chain coordination under stochastic output [
17,
18]. Wang et al. studied the impact of adverse weather on optimal decision-making in the supply chain of agricultural products [
19].
This demonstrates the importance of considering random output in the agricultural supply chain. However, the above studies mainly focused on the impact of output uncertainty on the decision making of supply chain operations, and few studies have considered the problem that farmers’ production is constrained by funds. During the operation of the agricultural product supply chain, the optimal decision of the supply chain will inevitably be affected when the farmers are constrained by funds; therefore, the operational decision of the agricultural product supply chain without considering financial constraints may not be the optimal decision.
2.2. Supply Chain Finance
With the rapid development of Internet technology, the integrated development of supply chain finance and Internet technology has produced a supply chain finance model with the participation of e-commerce, and its related theoretical research has also received extensive attention. Chen et al. proposed an online supply chain financing model based on commodity mortgages [
20]. To evaluate dynamic credit lines and provide timely and efficient financing services for supply chain members, Cai et al. compared and analyzed the optimal decision-making and profit of each member of the supply chain under the traditional financing model and e-commerce financing model, emphasizing that the online supply chain financing strategy is more conducive to improving business efficiency [
21,
22,
23,
24]. Furthermore, Tao et al. found that supply chain finance can effectively reduce the cost in the supply chain and improve the efficiency of the supply chain through the use of digital applications and technologies such as e-commerce platforms and the Internet of Things [
25]. From the perspective of development trends, an e-commerce financing strategy will become an important driving force for solving agricultural financing problems and aiding agricultural revitalization.
The above studies seldom considered the characteristics of agriculture. Furthermore, they are all based on the assumption that the decision maker is risk-neutral. The practice shows that farmers’ production scales are generally small, and their ability to resist risks is weak. In the production process of agricultural products, farmers are prone to the risk of yield uncertainty, which often leads to their risk appetite being risk averse.
2.3. Risk Measurement Method
At this stage, scholars mainly use mean variance [
26], value-at-risk [
27], and conditional value-at-risk [
28] methods to describe the risk-aversion behavior of supply chain members. Markowitz first proposed measuring the return using the mean value and measuring the risk using the variance [
29], which made a qualitative leap in the development of financial investment. However, because the mean-variance method treats the upper and lower deviations from the mean equally, it has the disadvantage that it cannot accurately describe the avoidance behavior of decision makers with different preferences. The VaR method defines the maximum loss faced by decision makers at a certain confidence level. It is highly generalized, concise, and easy to understand, and is also suitable for decision-makers to understand the overall level of a bank’s market risk. This approach has a limited effect on specific risk management processes such as price volatility sensitivity [
30]. Since then, the conditional value-at-risk method has been derived, which overcomes the shortcomings of the above methods and has certain advantages, helping decision-makers understand the maximum risks and losses that may occur. It has also been widely used by scholars in academic research. Ye et al. studied the decision-making problem of an agricultural product supply chain composed of risk-averse farmers and risk-neutral companies based on the CVaR criterion [
31]. Huang et al. used the conditional value-at-risk (CVaR) method to characterize the risk attitude of manufacturers and analyzed the optimal strategy for each member of the supply chain [
32].
The above research shows that the CVaR method can accurately assess the risk preference of decision-making entities in the supply chain, but it does not consider the influence of the characteristics of the agricultural supply chain and financing strategies on equilibrium decision-making. It is undeniable that the output uncertainty risk of agricultural products and farmers’ preferences and financing rates are both important factors influencing the optimal decision of each member of the supply chain.
3. Model Description and Assumptions
3.1. Model Description
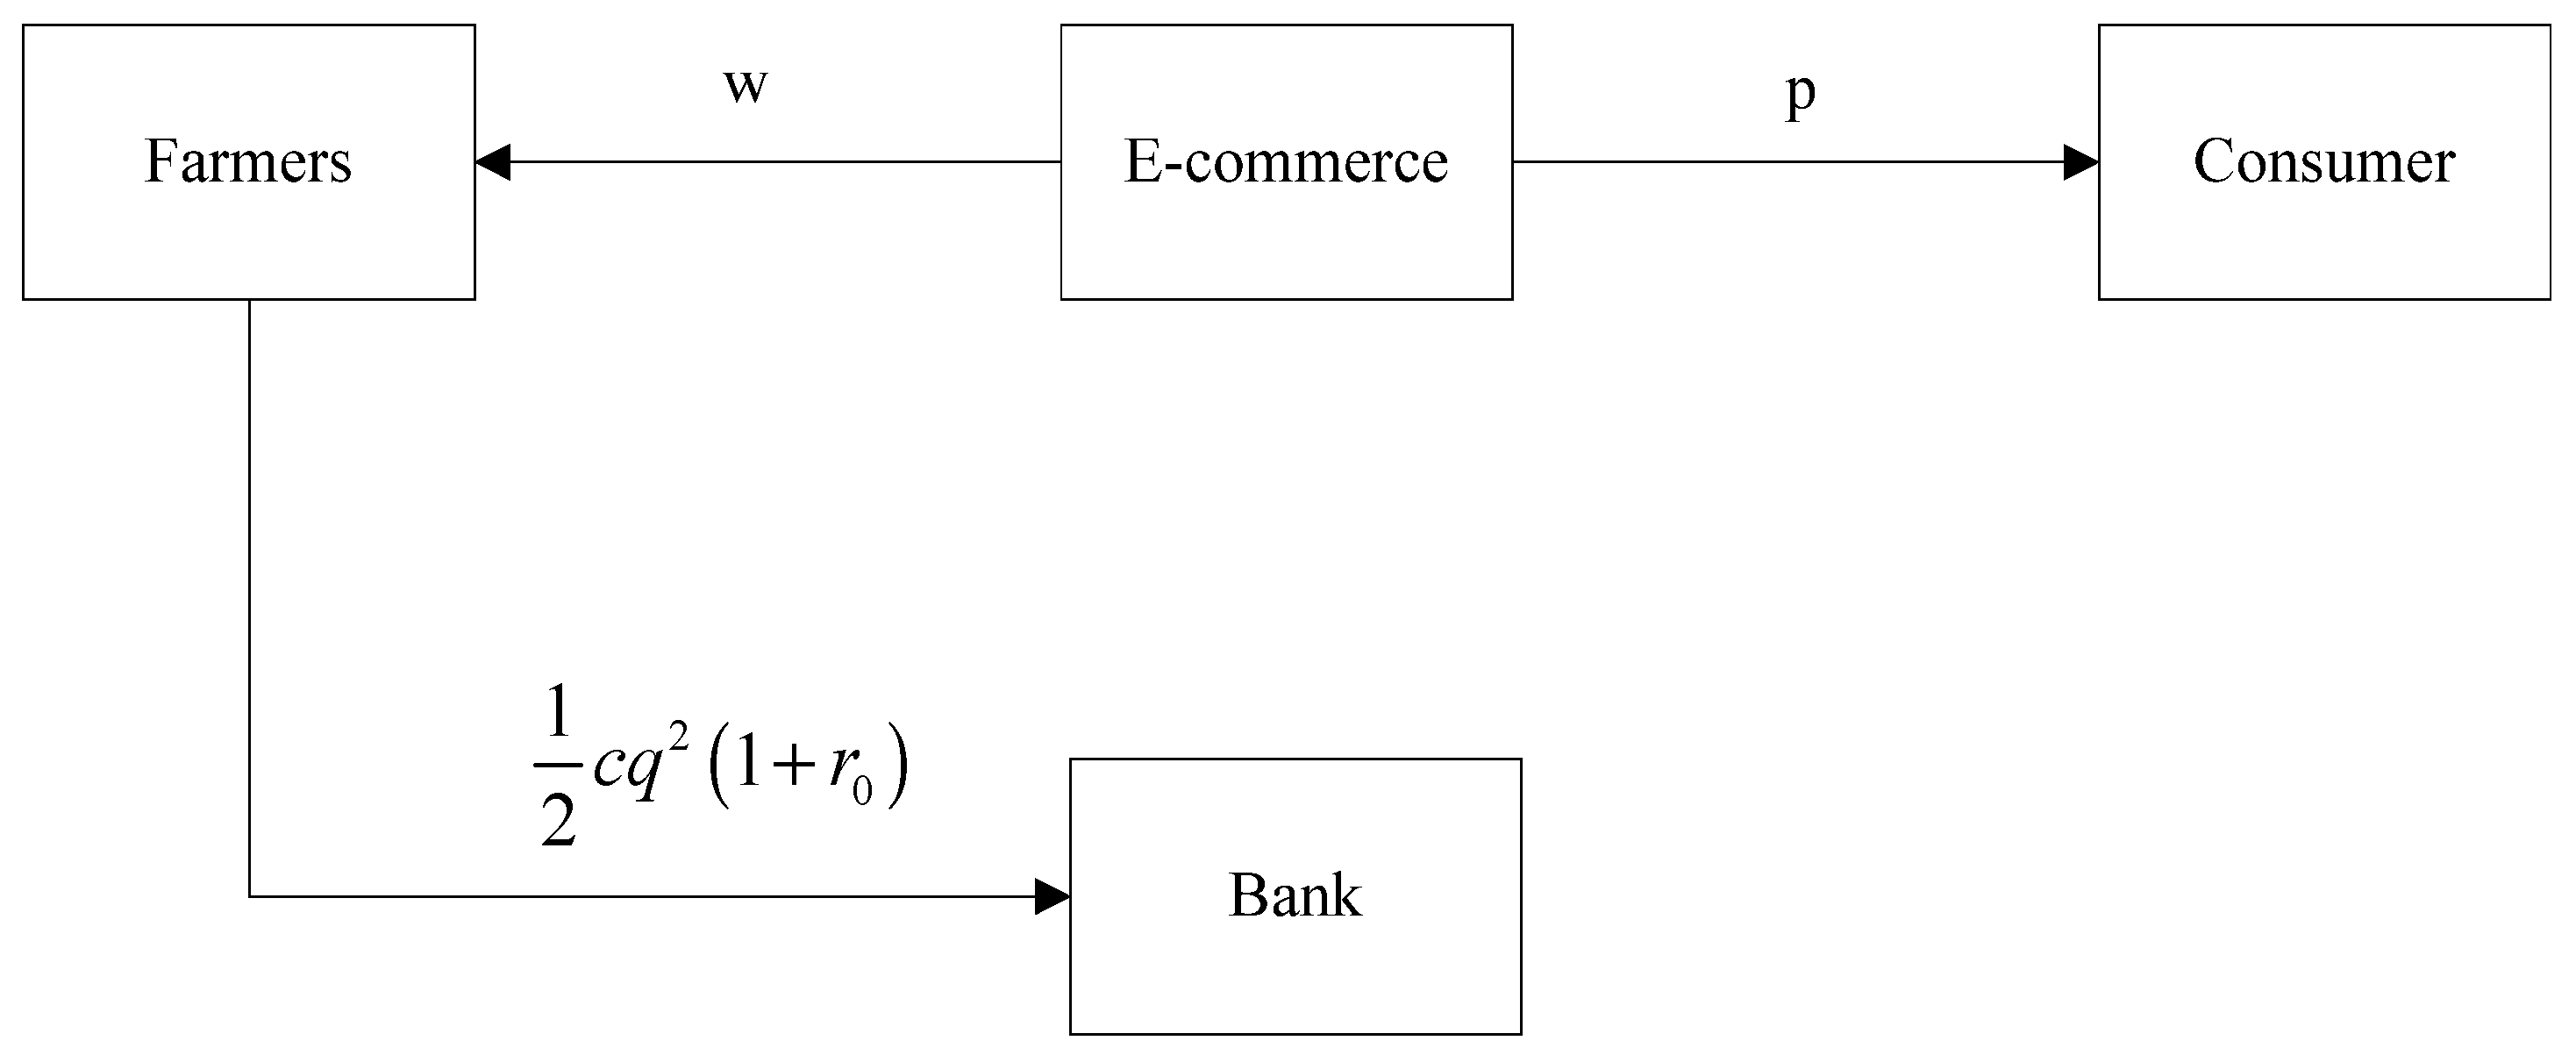
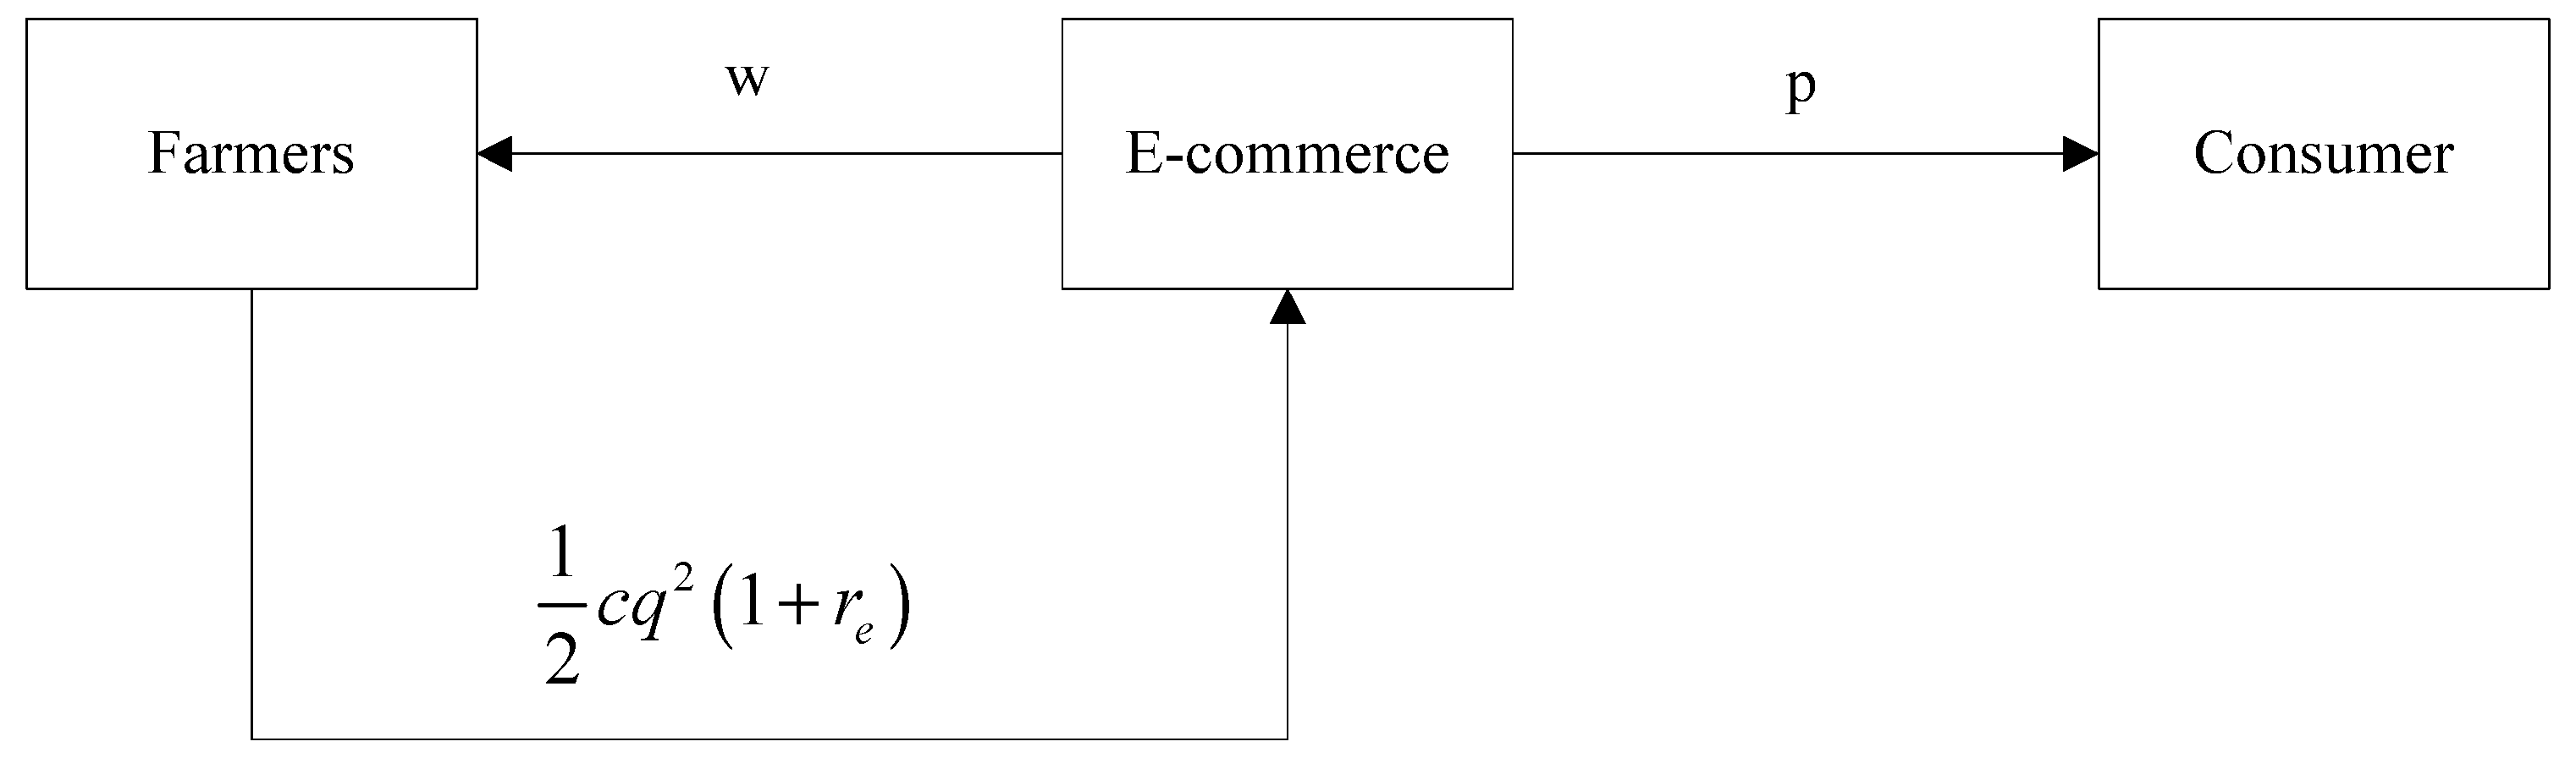
E-commerce and farmers form secondary agricultural product supply chains. We use the Steinberg game model. At this time, e-commerce are the leaders and farmers are followers. The decision-making sequence is as follows: ① In the early stage of agricultural product planting (), the e-commerce company sets the purchase price according to the agricultural product market. ② The farmer determines the input quantity for agricultural product production according to the purchase price. ③ According to the production cost, the farmer lends money to the bank at the interest rate or to the e-commerce business at , and the money is only used for the production of agricultural products. ④ After the production of agricultural products (), they are traded between e-commerce and farmers. If farmers choose to borrow money from e-commerce in the early stage of production, e-commerce must deduct the principal and interest of the loan and deliver the remaining purchase money to the farmers. If farmers choose bank loans, they will repay the loan principal and interest to the bank after receiving all purchase money. ⑤ After the end of the sales season (), the e-commerce company receives all the sales revenue from agricultural products.
The difference between the e-commerce financing strategy and the bank financing strategy is that when e-commerce participates in financing, in addition to being the fund provider for farmers, it is also responsible for the purchase and sale of agricultural products, and its interest rate affects the optimal decision making of supply chain members. The specific operational processes of the different financing modes are shown in
Figure 1 and
Figure 2.
3.2. Assumptions
Before constructing the decision-making model of the agricultural product supply chain under different financing modes, this study proposes the following basic assumptions:
A1—The initial capital of farmers in the initial stage of agricultural product planting is zero. Jing et al. also made the same assumption [
33].
A2—The moral hazard of e-commerce and farmers is not considered, that is, e-commerce and farmers will not subjectively default.
A3—Assume that all rates are annualized rates, the loan term is 1 year, and the time value of funds is not considered.
A4—Drawing on the results of Nasiri et al. [
34], it is assumed that the production cost of agricultural products is
, where
is the production effort cost coefficient of farmers. Under the bank financing strategy, the production cost of farmers is
. Under the e-commerce financing strategy, the production cost of farmers is
, where
is the bank’s interest rate.
is the interest rate of e-commerce.
A5—According to the actual situation of agricultural production, it is assumed that the output of agricultural products is , where is the output factor of agricultural products, which is a continuous, non-negative random variable. The probability density function and cumulative distribution function are and , respectively. At the same time, and .
A6—According to the supply and demand relationship under market economy conditions, the uncertainty of the output of agricultural products will affect the supply of agricultural products, and then affect the market prices of agricultural products. Therefore, it is assumed that the inverse demand for agricultural products is linear—namely,
—where
represents the suffocation price; that is, if the sales price of agricultural products is greater than
, consumers will not buy.
represents consumers’ price sensitivity to agricultural products. Boyabatli et al. [
35] made the same assumption [
34].
A7—Assuming that the output of agricultural products is all sold, and there is no residual at the end of the period.
A8—The research by domestic and foreign scholars has proved that farmers’ risk preference is highly risk-averse due to the low income of farmers and their poor ability to resist risks. Therefore, this study assumes that farmers are risk-averse.
A9—The cost of capital for e-commerce is the same as the bank’s risk-free rate (Kouvelis et al.) [
36].
For the convenience of subsequent discussions, note that stands for bank financing strategy, for e-commerce financing strategy, for farmers, and for e-commerce.
4. Financing with Bank or E-Commerce
4.1. Bank Financing Strategy (BF)
According to the general definition of CVaR, the decision-making objective function of farmers with risk-averse attitudes is
Among them, represents the quantile of the random output factor and represents the risk aversion coefficient of farmers. The larger the value of , the lower the risk aversion of farmers. The value of equals 1, which means that farmers are risk-neutral.
In the bank financing model, e-commerce is responsible only for the purchase and sale of agricultural products. At this time, the decision-making objective function of e-commerce is
From this, the expected revenue function of e-commerce can be rewritten as
Combining Equations (1) and (3), the reverse induction method is used to solve the expected return function of e-commerce and risk-averse farmers, and the equilibrium decision of e-commerce and farmers under the bank financing strategy is obtained.
Theorem 1. Under the bank financing strategy, risk-averse farmers and risk-neutral enterprises make balanced decisions to maximize their own interests. The e-commerce’s decisions on the purchase price of agricultural products and farmers’ production inputs are as follows:
At this time, the optimal benefits of farmers and e-commerce are: 4.2. E-Commerce Financing Strategy (EF)
Under the e-commerce financing strategy, the decision-making objective function of farmers with a risk-averse attitude is
The income structure of farmers under the e-commerce financing strategy is the same as that under the bank financing strategy, the difference is the interest rate value.
At this time, the decision-making objective function of risk-neutral e-commerce is
Under e-commerce financing strategy, the income structure of e-commerce has changed. In addition to obtaining income from the sale of agricultural products , they obtain loan income by providing financing services to farmers ().
Substitute
,
, and
into Equation (9). The expected profit function of e-commerce can be rewritten as
Theorem 2. Under the e-commerce financing strategy, the e-commerce’s decision on the purchase price of agricultural products and the farmers’ production input decision are as follows:
At this time, the optimal income of farmers and e-commerce are: Corollary 1. With the increase in the expected output factor, the production input of farmers and the purchase price decision of e-commerce in the two financing strategies first increase and then decrease, and the income of farmers first increases and then decreases, while the income of e-commerce always increases.
Corollary 1 shows that the decision-making of farmers’ production input is largely affected by the expected output factor of agricultural products due to the uncertainty of the output of agricultural products, which in turn affects the income of farmers and e-commerce. Therefore, it is necessary to conduct research on agricultural supply chain financing decision making considering farmers’ risk-aversion attitudes.
Corollary 2. When considering the risk attitude of farmers, the equilibrium strategies under the two financing strategies are to reduce the production input and increase the purchase price of agricultural products.
Corollary 2 shows that a high degree of risk aversion of farmers leads to low acceptance of the results of risks, and it is difficult for them to expand the production scale in the early stages of production and planting of agricultural products. To stimulate farmers to increase production scale, e-commerce must increase the purchase of agricultural products. When the purchase price rises, the production cost of e-commerce increases, and its order quantity decreases accordingly, which is not conducive to the expansion of the production scale of agricultural products, thus forming a vicious circle. This reduces the robustness of the agricultural product supply chain and increases the difficulty of supply chain management. It can be seen that considering the risk attitude of farmers is crucial to e-commerce and farmers’ decision-making.
Corollary 3. The expected returns of e-commerce firms and farmers under different financing strategies are both decreasing functions of farmers’ risk aversion.
Corollary 3 shows that whether it is an e-commerce financing strategy or bank financing strategy, the higher the risk aversion of farmers, the lower the profitability of e-commerce and farmers. E-commerce companies cannot obtain more value if they do not consider the risk attitudes of farmers when formulating optimal strategies.
4.3. Comparative Analysis
Corollary 4. When , .
Corollary 4 shows that only when the risk aversion degree and expected output factor of farmers meet can e-commerce providing financing services for farmers at a lower interest rate stimulate farmers to expand their production scale; otherwise, the e-commerce financing model will be unfavorable for farmers to expand their production scale. E-commerce provides financing services for risk-averse farmers at lower interest rates, which not only relieves farmers’ financial constraints but also reduces their production costs. In other words, even if farmers are more sensitive to the risk of output uncertainty, they will still appropriately expand their production scale when e-commerce provides them with lower-interest-rate financing services.
Corollary 5. When , .
Corollary 5 shows that whether the e-commerce financing strategy is conducive to enhancing the e-commerce’ ability to negotiate the purchase price is only affected by the e-commerce interest rate and bank interest rate, and has nothing to do with the risk aversion of farmers and the expected output factor. That is, when is used, the purchase price of agricultural products under the e-commerce financing strategy is higher than that under the bank financing strategy. Although the e-commerce financing strategy solves the problem of farmers’ financial constraints, it does not necessarily improve e-commerce negotiation ability. To avoid higher interest rates from dampening farmers’ enthusiasm for production and planting, e-commerce will be willing to increase the purchase price of agricultural products. Regardless of the degree of risk aversion and expected output of farmers, as long as the interest rate of e-commerce is higher than the bank interest rate, the purchase price of agricultural products needs to be increased for e-commerce financing. This is because, even if the risk aversion and expected output of farmers are small, the higher the e-commerce financing interest rate, the higher the production cost for farmers. Therefore, raising the purchase price of agricultural products through e-commerce can encourage farmers to expand their scale of production and obtain more economic benefits.
Corollary 6. (1) Risk aversion coefficients,, expected output factor and e-commerce interest, , ,
(2) Risk aversion coefficients , expected output factor , and e-commerce interest rate , and , , or and , and .
Corollary 6 shows that the choice of farmers and e-commerce financing strategies is simultaneously affected by expected output factors, farmers’ risk aversion, and e-commerce interest rates. Only when the expected output factor, risk aversion of farmers, and interest rate of e-commerce meet certain conditions will farmers choose an e-commerce financing strategy to relieve capital pressure. When the degree of risk aversion and the expected output factor are within a certain range, e-commerce companies obtain higher value by participating in financing at lower interest rates.
5. Numerical Analysis
To intuitively explore the operational law of the agricultural product supply chain and the significance of financing decision-making considering farmers’ risk attitude, a numerical analysis is carried out on the following two aspects: (1) The impact of farmers’ expected output factors on equilibrium decision-making and financing strategy selection. (2) The impact of farmers’ risk aversion and e-commerce interest rates on equilibrium decision-making and financing strategy selection. Since actual product data are difficult to obtain, based on the correlation in economic data, it is assumed that ; ; ; ; .
5.1. Impact of Farmers’ Expected Output Factors on Equilibrium Decision-Making and Financing Strategy Selection
Let and . We analyze the impact of farmers’ expected output factors on equilibrium decision making and financing strategy selection.
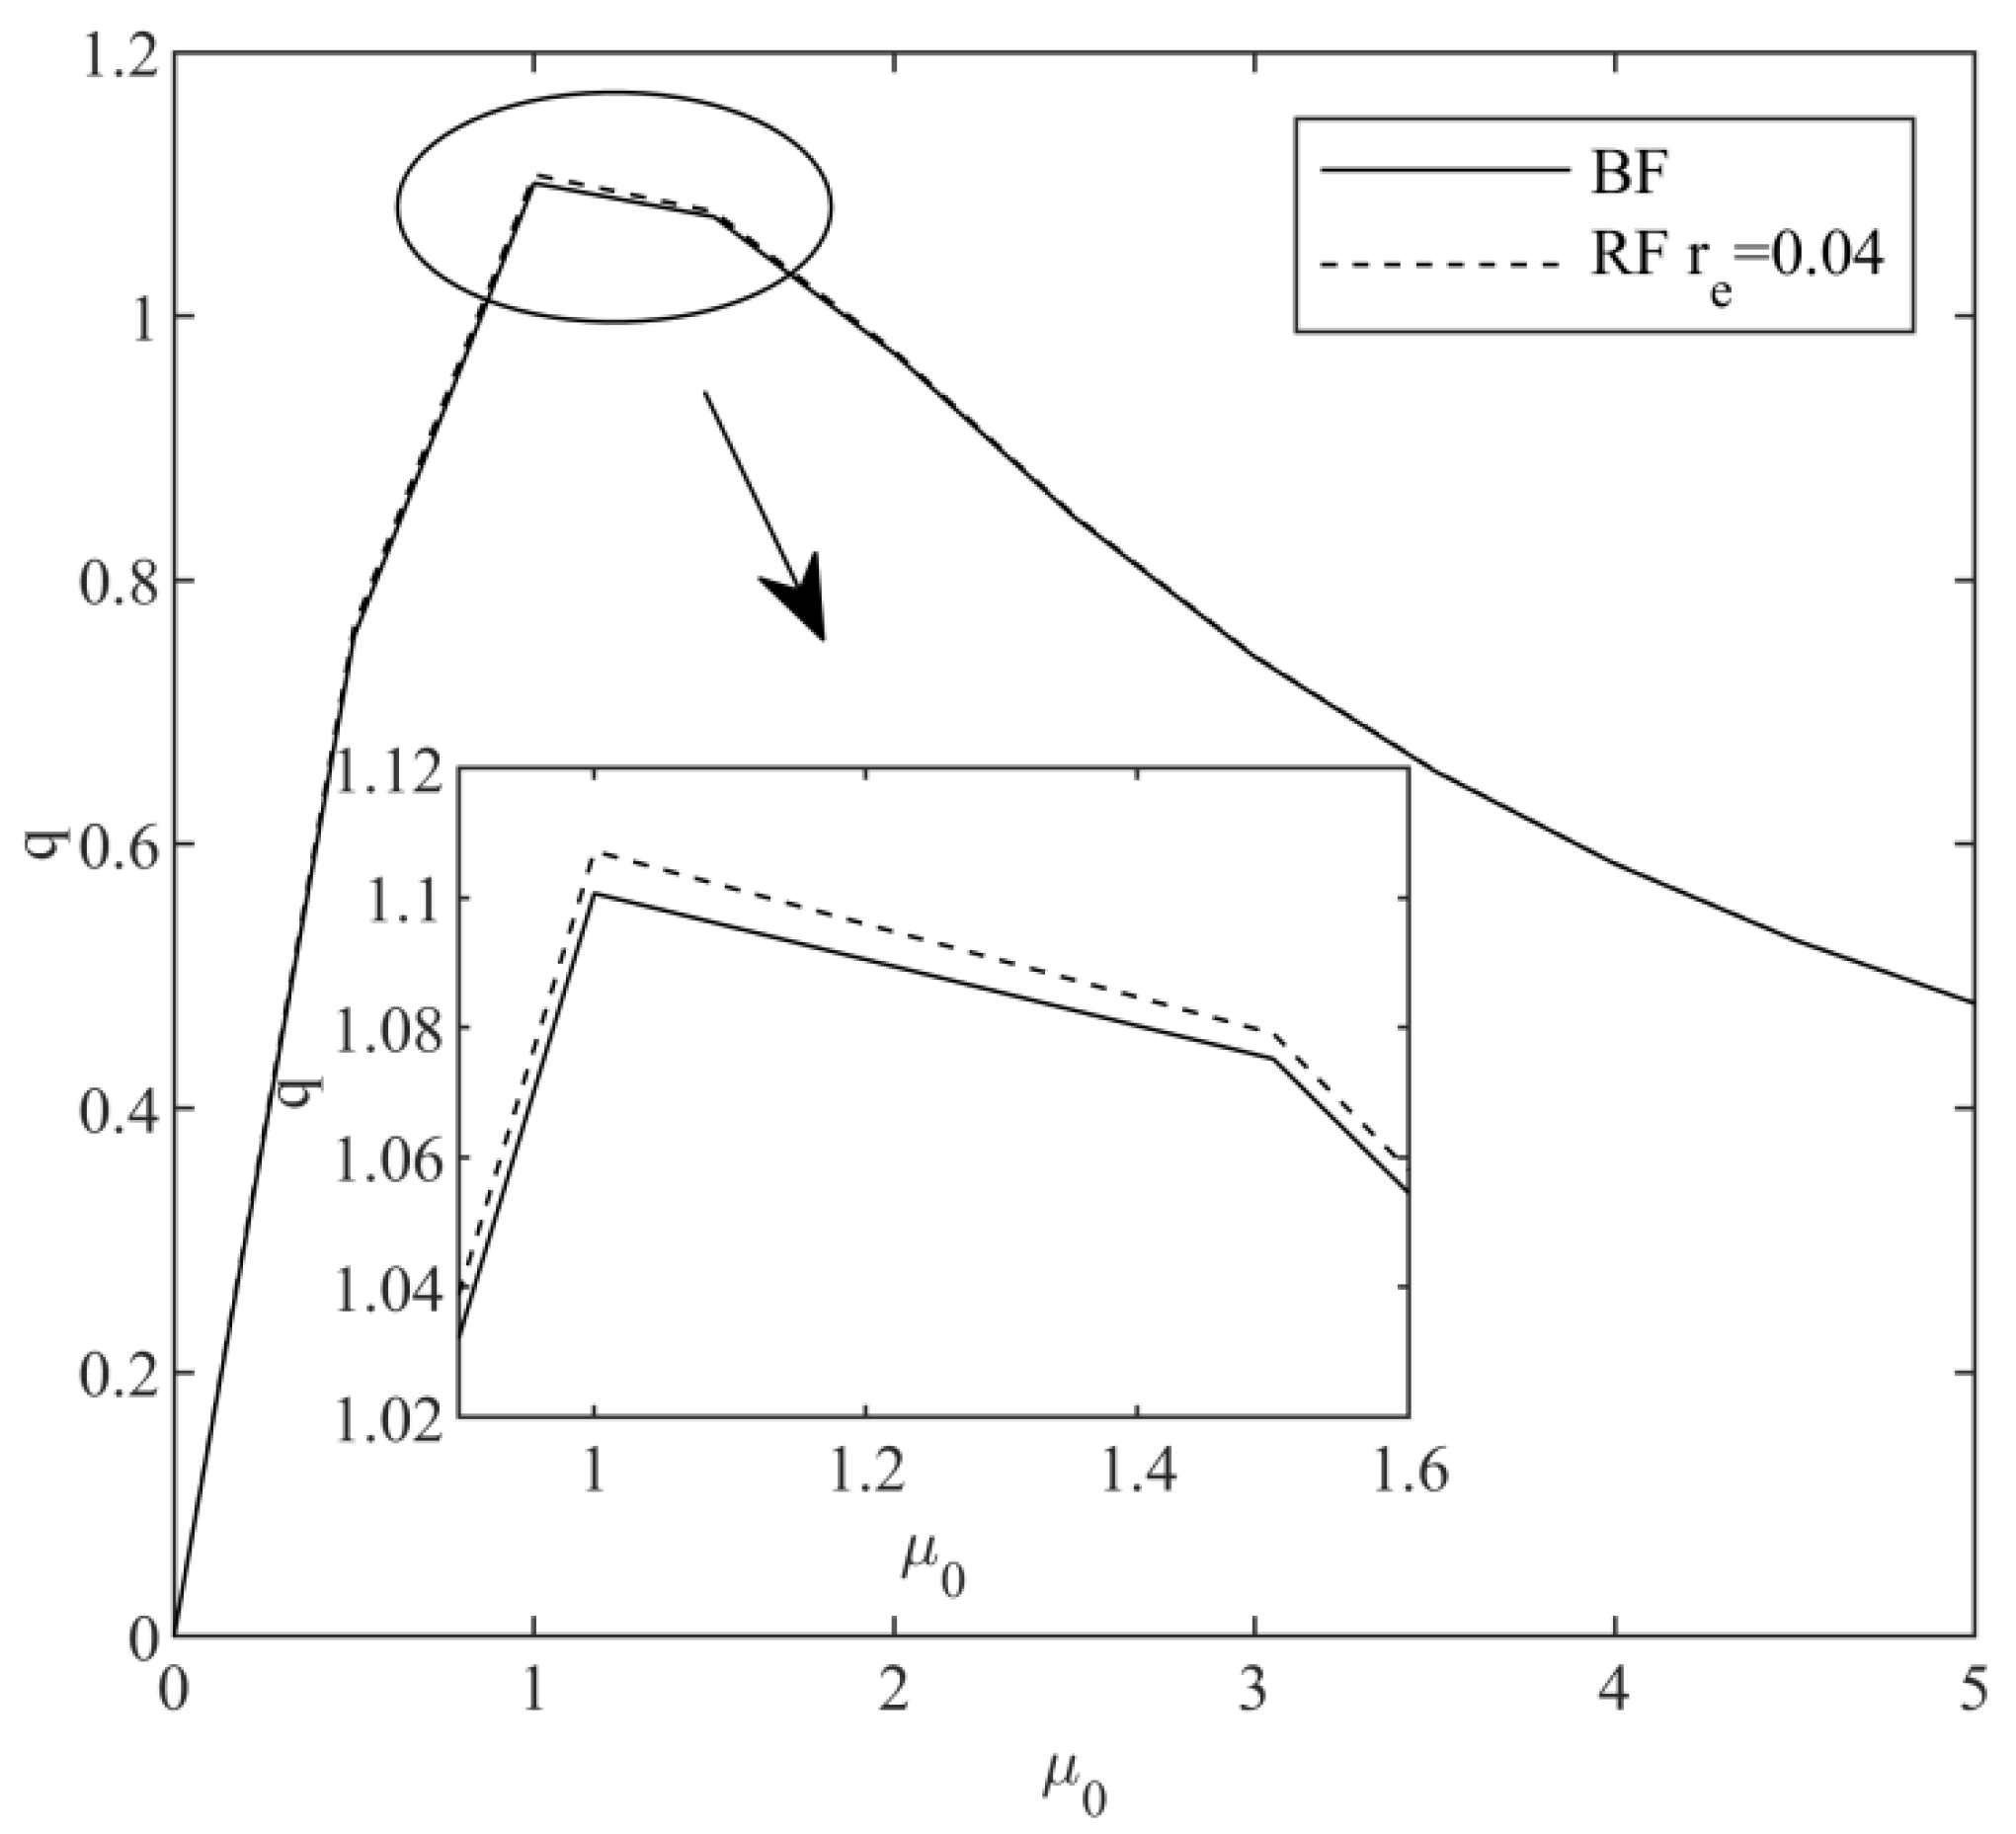
Figure 3 shows the effect of the expected output factor of agricultural products on the optimal production input of the product.
Figure 3 shows that the optimal production input of farmers first increases and then decreases, with an increase in the expected output factor. In other words, when the expected output rate of agricultural products is lower than a certain threshold, farmers with lower risk aversion are willing to increase their production input of agricultural products as the expected output rate increases. When the expected output factor is higher than a certain value, farmers gradually reduce the amount of production input to prevent the loss of interest. Under the e-commerce financing strategy, the optimal production input of agricultural products is always higher than that under the bank financing strategy, which effectively shows that e-commerce provides financing services for farmers with low-risk aversion at lower loan interest rates and can effectively solve the problem for farmers and the problem of financial constraints is conducive to the large-scale production of farmers. The results in Corollary 1 are verified.
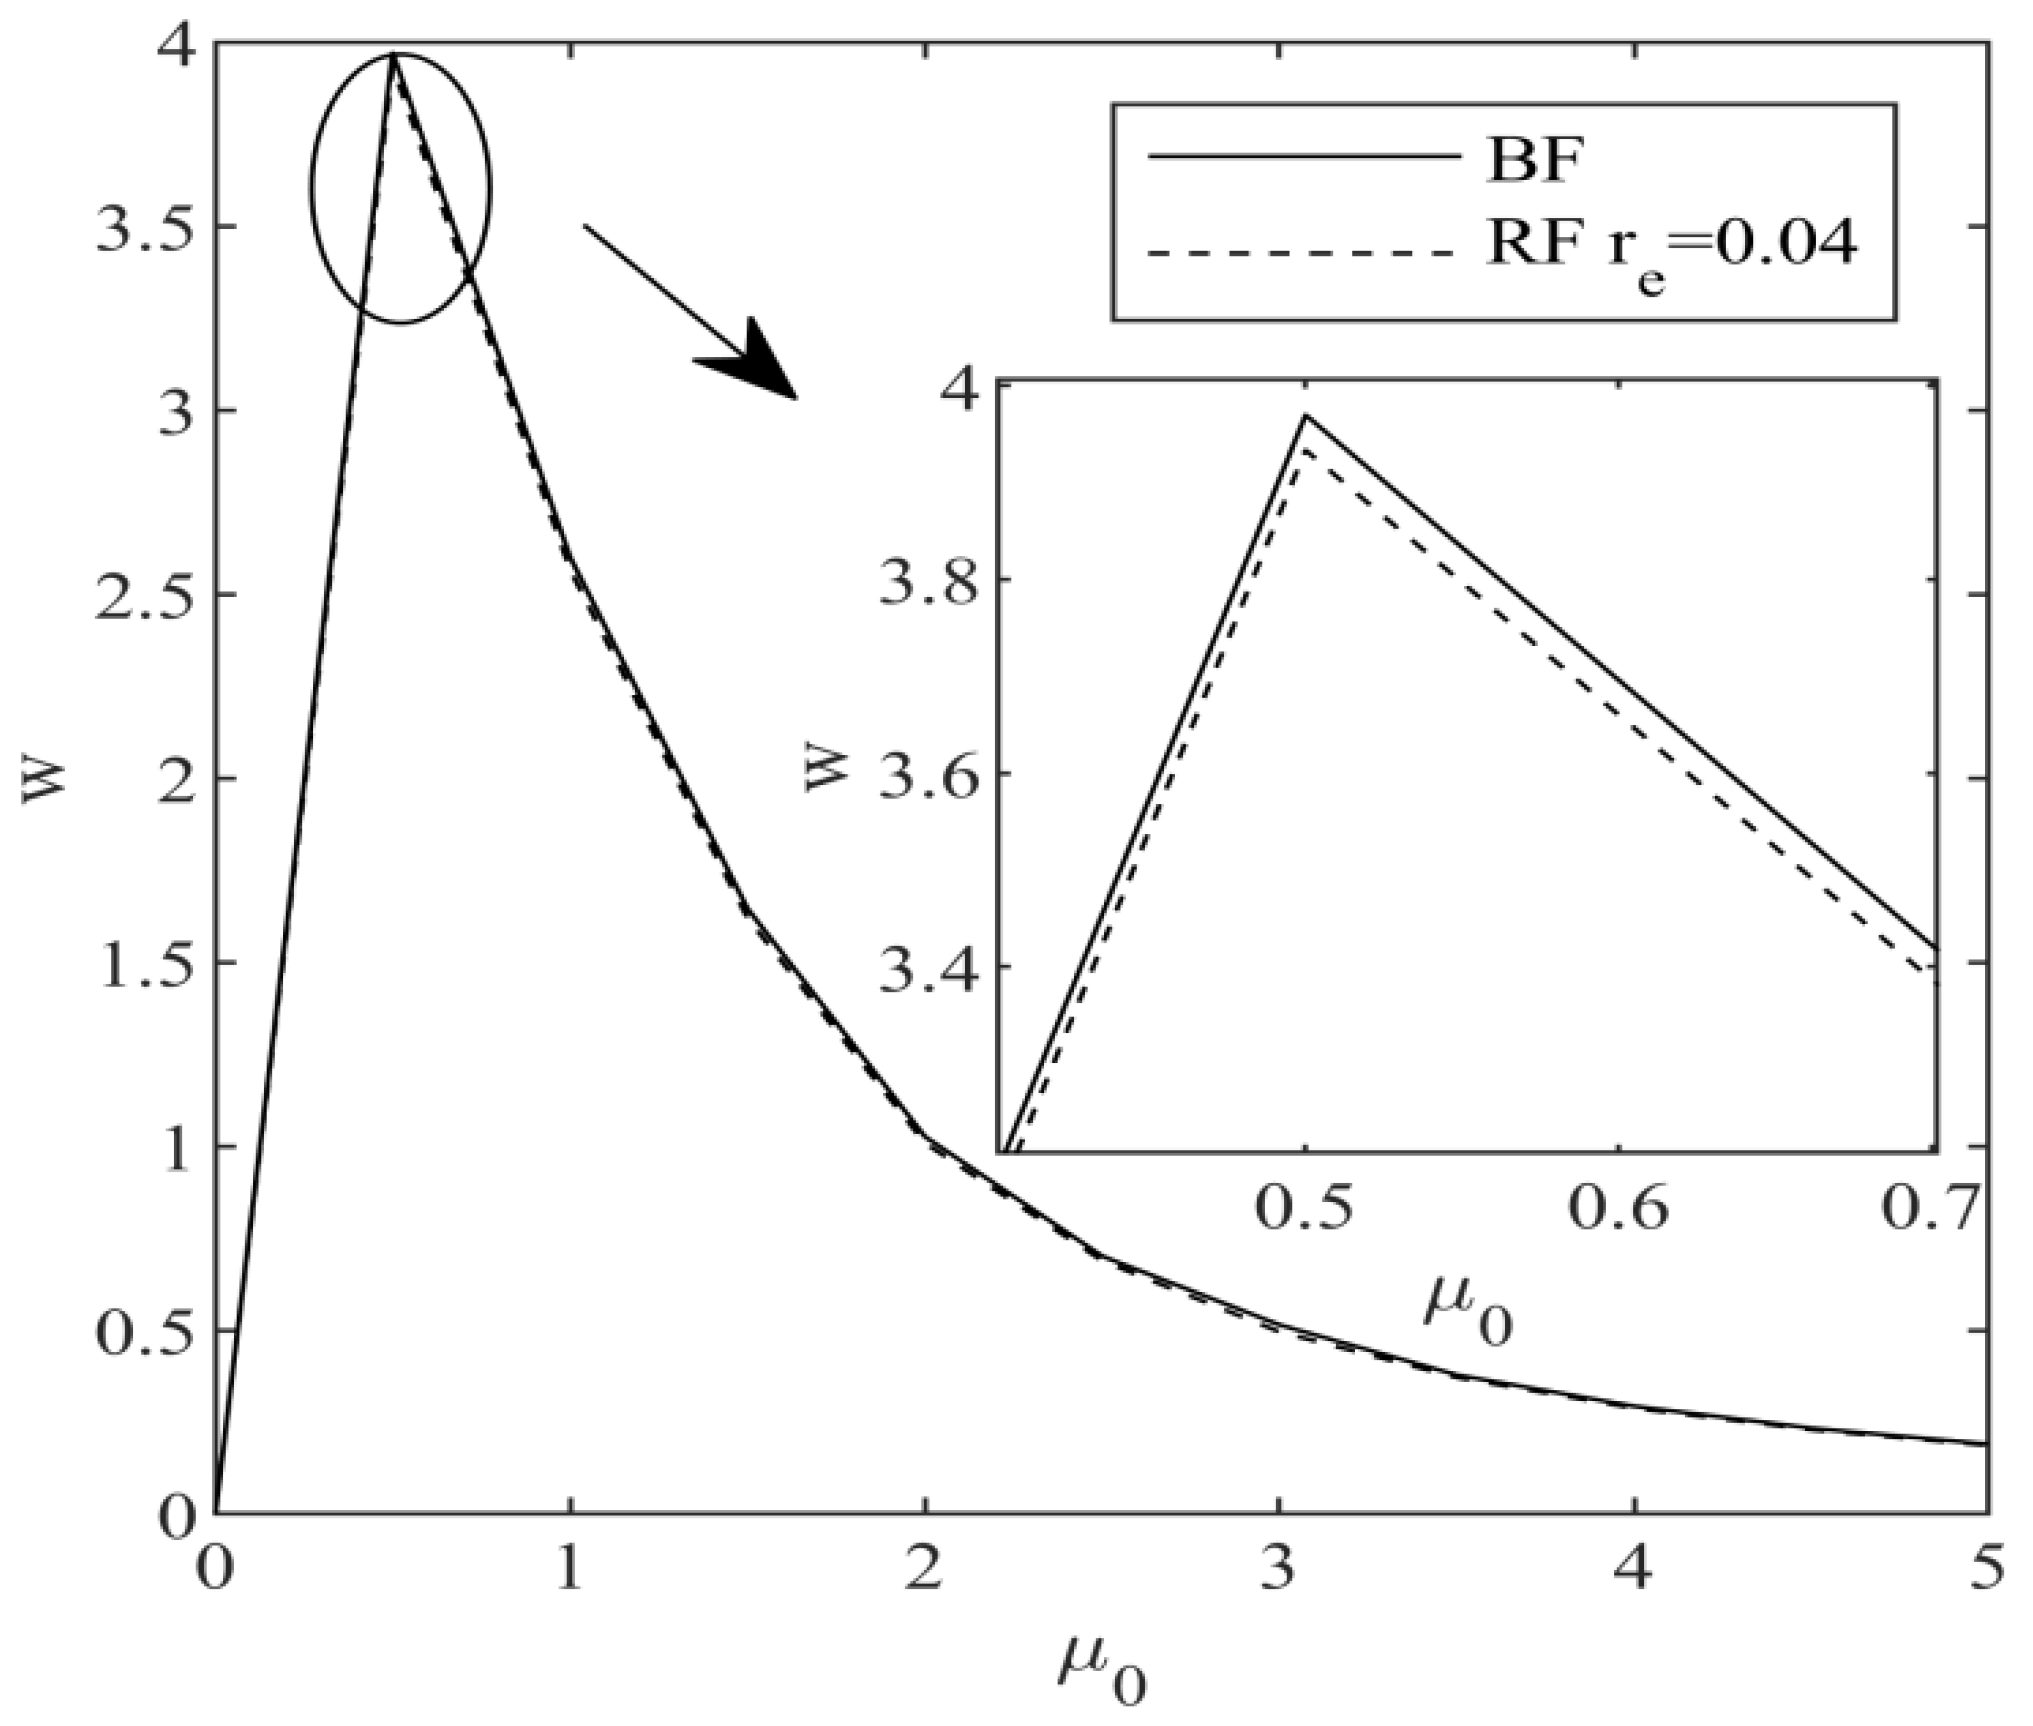
Figure 4 shows the effect of the expected output factor of agricultural products on the optimal purchase price.
Figure 4 shows that the optimal purchase price of agricultural products determined by e-commerce first increased and then decreased with an increase in the expected output factor. That is, when the output factor of agricultural products is lower than a certain value, the purchase price of agricultural products increases with an increase in output factor. When the output factor of agricultural products is higher than a certain value, the optimal purchase price of agricultural products decreases with an increase in the expected output factor. This shows that when the expected output of agricultural products is small, in order to stimulate farmers to produce, as the expected output factor of agricultural products increases, e-commerce companies are willing to pay higher purchase prices for agricultural products. Agricultural product output increases when the expected output factor is high. At this point, the marginal cost of e-commerce increases. To maximize its own interests, e-commerce reduces the purchase price of agricultural products. Under the e-commerce financing strategy, the purchase price of agricultural products is always lower than that of the bank financing strategy, which shows that e-commerce provides financing services for farmers with low risk aversion at lower interest rates. The e-commerce company’s negotiating ability will be enhanced greatly.
Table 1 describes the impact of the expected output factor of agricultural products on the expected returns of e-commerce and farmers. The expected profits of farmers first increase and then decrease with an increase in expected output factor. In other words, there is a critical point in
. When the output factor is less than
, farmers’ profits increase with an increase in the expected output factor. When the output factor is greater than
, farmers’ profits increase with an increase in the expected output factor. However, the decline indicates that the higher the expected output factor, the more favorable it is. When the expected output factor is higher, the farmer’s output will be greater, which will lead to the phenomenon of ‘low-cost grains hurting farmers’ during the sales period. In addition, farmers with low risk aversion will choose the e-commerce financing strategy only when the expected output factor is less than
, farmers with low-risk aversion will choose the e-commerce financing strategy. The expected return of e-commerce always increases with the increase in the expected output factor, and the return of e-commerce under the e-commerce financing strategy is always higher than that of the bank financing strategy, which shows that for farmers with low risk aversion, e-commerce is willing to pay more low-interest rates to provide financing services for them, and in order to maximize their own interests, it is hoped that the expected output factor for farmers is higher.
5.2. Impact of Farmers’ Risk Aversion and E-Commerce Interest Rates on Equilibrium Decision-Making and Financing Strategy Selection
Let We analyzed the impact of farmers’ risk aversion and e-commerce interest rates on the decision-making results of e-commerce and farmers under different financing strategies.
Figure 5 depicts the curve of the optimal production input of agricultural products with the risk aversion of farmers (the greater the risk aversion coefficient, the lower the risk aversion) under the e-commerce and bank financing strategies. It can be seen from the figure that, whether it is an e-commerce financing strategy or a bank financing strategy, the optimal production input of agricultural products decreases with an increase in farmers’ risk aversion. This shows that farmers’ risk-averse attitudes limit their production and planting. By comparing the optimal production input under different financing strategies, we find that when the e-commerce’s interest rates are high, the production input in the e-commerce financing strategy is smaller than that under the bank financing strategy. When e-commerce interest rates are low, the amount of production input is always higher than that under the bank financing strategy, which shows that when considering farmers’ disgust with production uncertainty, e-commerce providing financing services for farmers do not necessarily increase farmers’ production input. E-commerce must reduce interest rates to improve farmers’ production plant positivity.
Figure 6 depicts the curve of the optimal purchase price of agricultural products with the risk aversion of farmers under e-commerce financing and bank financing strategies. We find that whether it is an e-commerce financing strategy or a bank financing strategy, the optimal purchase price of agricultural products increases with an increase in farmers’ risk aversion. This shows that farmers’ increased risk aversion improves their ability to negotiate with e-entrepreneurs. At the same time, when e-commerce profits are high, the purchase price of agricultural products increases. This is because when farmers choose an e-commerce financing strategy, they not only bear the risk of uncertainty in the output of agricultural products, but also pay higher financing costs. To stimulate farmers’ production and planting, e-commerce can only increase the purchase price of agricultural products and transfer part of the profits to farmers.
Table 2 shows that, with the increase in risk aversion, the profits of e-commerce and farmers decrease. The results of Corollary 3 are verified. The uncertain risk of the output of agricultural products reduces the profits of farmers but also damages the profits of e-commerce. When the risk aversion of farmers is higher than a certain value, only when the interest rates of e-commerce are low, the expected profits of farmers will be higher than that of the bank financing strategy. That is to say, farmers with high-risk aversion will choose the e-commerce financing strategy when the e-commerce’s interest rates are low. The farmers with low risk aversion will choose the e-commerce financing strategy when the e-commerce’s interest rates are high. When the e-commerce’s interest rates are high, the profits of the e-commerce under the e-commerce financing strategy are lower than that under the bank financing strategy. E-commerce provide financing services for farmers with higher risk aversion at lower interest rates, which can achieve a win-win situation for both e-commerce and farmers. For farmers with low risk aversion, the higher interest rates set by e-commerce will encourage farmers to choose the e-commerce financing model.
6. Conclusions
This study describes a secondary agricultural supply chain consisting of risk-neutral e-commerce and risk-averse farmers. Faced with the two financing scenarios of bank financing and e-commerce financing, on the basis of considering output uncertainty and farmers’ risk attitudes, we constructed a decision-making model of the agricultural product supply chain under different financing strategies.
Our work is beneficial to both e-commerce companies and farmers. We analyzed the impact of farmers’ risk aversion, expected output factors, and e-commerce interest rates on the equilibrium decision-making results of supply chain entities. The main findings are as follows. (1) The higher expected output factor of agricultural products does not always increase farmers’ enthusiasm for production and planting. In order to avoid ‘low price of grain hurting farmers’, when the expected output factor is higher than a certain value, farmers will reduce production input quantity. At the same time, the wholesale price of e-commerce first increased and then decreased; the profits of farmers first increased and then decreased with the increase in the expected output factor, while the profits of e-commerce always increase. (2) Farmers’ risk aversion restricts their production of agricultural products. Although the purchase price of agricultural products for e-commerce has increased, it has reduced the profits of e-commerce and farmers. (3) The financing strategy of the capital-constrained agricultural product supply chain is affected by the expected output factor, degree of risk aversion, and financing interest rates of e-commerce. When the expected output factor is low, farmers with high-risk aversion will choose the e-commerce financing strategy when the e-commerce’s interest rates are low, while farmers with low risk aversion will choose the e-commerce financing strategy when the e-commerce’s interest rates are high. E-commerce can achieve a win-win situation by providing financing services to farmers at lower interest rates.
Based on the above research results, the following management implications are obtained: First, when the expected output factor is low, farmers with low risk sensitivity should improve their credit by repaying loans in a timely manner to improve their ability to obtain financing from banks and enhance their profit. Second, e-commerce should help farmers achieve large-scale and intensive operations by providing technical support for farmers with high sensitivity and regular training, and provide them with lower interest rate financing services to reduce farmers’ production costs and improve the expected output rate of farmers to obtain maximum economic benefits. Third, the government should provide subsidies for e-commerce to reduce the capital cost of e-commerce participation in financing and ease the financial pressure of e-commerce. At the same time, it should provide preferential policies for farmers to reduce their risk.
This study examines the optimal decision making and financing mode selection of risk-averse farmers and risk-neutral e-commerce companies under different financing strategies and draws meaningful conclusions. A survey designed to collect empirical data from real farmers could provide more valid, verifiable, and more generalizable results related to the subject of study. This is one of the limitations of our study. In the future, the direction of in-depth research will be the introduction of agricultural insurance, how to change the optimal decision-making, and financing strategy selection of the supply chain under the action of agricultural insurance.
Author Contributions
Conceptualization, S.B.; Data curation, X.J.; Funding acquisition, S.B.; Investigation, X.J.; Methodology, S.B. and X.J.; Supervision, X.J.; Validation, X.J.; Visualization, S.B.; Writing—Original draft, X.J. All authors have read and agreed to the published version of the manuscript.
Funding
This research was funded by the National Natural Science Foundation of China (grant no. 71671054), Heilongjiang Provincial Natural Science Foundation Joint Guidance Project (grant no. LH2021G014), Heilongjiang Philosophy and Social Sciences Research Planning Project (grant no. 20GLB114, 21GLC187), and Harbin University of Commerce 2021 Graduate Innovative Research Fund Project (grant no. YJSCX2021-690HSD).
Institutional Review Board Statement
Not applicable.
Informed Consent Statement
Not applicable.
Data Availability Statement
The data that support the findings of this study are available from the corresponding author upon reasonable request.
Conflicts of Interest
The authors declare no conflict of interest.
Appendix A
Proof of Theorem 1. From formula (1), we can get , because of , the expected profits of the risk-averse farmers under the bank financing strategy is a concave function of the input amount of agricultural production. Let , we can get . Substituting into Formula (3), we obtain .
Due to , the expected profits of risk-neutral e-commerce in the bank financing strategy are a concave function of the purchase price of agricultural products. Let , we can get . Bringing into , we obtain the optimal production input function for farmers: . Substituting and into Equations (3) and (5) to obtain the optimal profits of farmers and e-entrepreneurs under the bank financing strategy. □
Proof of Theorem 2. From Formula (8), we can get . Due to , the expected profits of farmers under the e-commerce financing strategy is a concave function of the input of agricultural production. Let , we can get .
Substituting into Equation (10) to obtain , because of , the expected profits of e-commerce under the e-commerce financing strategy are concave functions of the purchase price of agricultural products. Let , we can be . By inserting into , we obtain . Substituting and into Equations (8) and (10), we obtain the optimal profits of farmers and e-commerce under the e-commerce financing strategy. Certificate completed. □
Proof of Corollary 1. By calculating the partial derivation of the expected output factor for Equations (4)–(7) and (11)–(14), we obtain
It can be seen that there is a threshold , when , , , , , , otherwise , , , , , . For , no matter how changes, there is always and . □
Proof of Corollary 2. We calculate the partial derivation of the risk aversion coefficient of farmers for Formulas (4), (5), (11), and (12) respectively, we can get:
when
,
,
,
,
. □
Proof of Corollary 3. We calculate the partial derivation of the risk aversion coefficient of farmers for Formulas (6), (7), (13), and (14), respectively, and obtain:
When , , , , . □
Proof of Corollary 4. When , . □
Proof of Corollary 5. Because of
when
and
. □
Proof of Corollary 6. (1) Let , we can get
(2) Let , and we can trigger . Therefore, and or and , and . □
References
- Li, X.; Sun, Y. Network Evolutionary Game-Based Diffusion Mechanism regarding the Nonperformance of Farmers in Agricultural Supply Chain Finance. Discrete Dyn. Nat. Soc. 2022, 2022, 8550974. [Google Scholar] [CrossRef]
- Yu, Z.; Rehman Khan, S.A. Evolutionary game analysis of green agricultural product supply chain financing system: COVID-19 pandemic. Int. J. Logist. 2021, 25, 1115–1135. [Google Scholar] [CrossRef]
- Luo, Y.; Deng, T.; Wei, Q.; Xiao, G.; Ling, Q. Optimal Financing Decision in a Contract Food Supply Chain with Capital Constraint. Complexity 2021, 2021, 8925102. [Google Scholar] [CrossRef]
- Deng, L.; Wang, S.; Wen, Y.; Li, Y. Incorporating ‘Mortgage-Loan’ Contracts into an Agricultural Supply Chain Model under Stochastic Output. Mathematics 2022, 10, 85. [Google Scholar] [CrossRef]
- Su, Y.; Gabrielle, B.; Makowski, D. The impact of climate change on the productivity of conservation agriculture. Nat. Clim. Change. 2021, 11, 628–633. [Google Scholar] [CrossRef]
- Aslam, M. Aggregative effect on rice production due to climate change using index number under indeterminate environment: A case study from Punjab, Pakistan. Theor. Appl. Climatol. 2022, 147, 283–290. [Google Scholar] [CrossRef]
- Jin, J.; Xuhong, T.; Wan, X.; He, R.; Kuang, F.; Ning, J. Farmers’ risk aversion, loss aversion and climate change adaptation strategies in Wushen Banner, China. J. Environ. Plann. Man. 2020, 63, 2593–2606. [Google Scholar] [CrossRef]
- Si, R.; Aziz, N.; Liu, M.; Lu, Q. Natural disaster shock, risk aversion and corn farmers’ adoption of degradable mulch film: Evidence from Zhangye, China. Int. J. Clim. Chang. Str. 2021, 13, 60–77. [Google Scholar] [CrossRef]
- Freudenreich, H.; Musshoff, O. Experience of losses and aversion to uncertainty-experimental evidence from farmers in Mexico. Ecol. Econ. 2022, 195, 107379. [Google Scholar] [CrossRef]
- Yin, M.; Li, G. Supply Chain Financial Default Risk Early Warning System Based on Particle Swarm Optimization Algorithm. Math. Probl. Eng. 2022, 2022, 7255967. [Google Scholar] [CrossRef]
- Luo, Q.; Liao, R.; Li, J.; Ye, X.; Chen, S. Blockchain Enabled Credibility Applications: Extant Issues, Frameworks and Cases. IEEE Access 2022, 10, 45759–45771. [Google Scholar] [CrossRef]
- Corcioli, G.; Medina, G.D.S.; Arrais, C.A. Missing the Target: Brazil’s Agricultural Policy Indirectly Subsidizes Foreign Investments to the Detriment of Smallholder Farmers and Local Agribusiness. Front. Sustain. Food Syst. 2022, 5, 796845. [Google Scholar] [CrossRef]
- Ochou, F.; Quirion, P. Impact of climate change on agriculture: Quantifying the price bias in econometric approaches. Rev. Econ. 2022, 73, 43–67. [Google Scholar] [CrossRef]
- Zhao, X.; Calvin, K.V.; Wise, M.A.; Patel, P.L.; Snyder, A.C.; Waldhoff, S.T.; Hejazi, M.I.; Edmonds, J.A. Global agricultural responses to interannual climate and biophysical variability. Environ. Res. Lett. 2021, 16, 104037. [Google Scholar] [CrossRef]
- Yu, Y.; Clark, J.S.; Tian, Q.; Yan, F. Rice yield response to climate and price policy in high-latitude regions of China. Food Secur. 2022. [Google Scholar] [CrossRef]
- Assouto, A.B.; Houensou, D.A.; Semedo, G. Price risk and farmers’ decisions: A case study from Benin. Sci. Afr. 2020, 8, e311. [Google Scholar] [CrossRef]
- Liu, X.; Shen, X.; You, M. Study on Coordination and Optimization of Contract Farming Supply Chain Based on Uncertain Conditions. Sci. Program. Neth. 2020, 2020, 8858812. [Google Scholar] [CrossRef]
- Shi, Y.; Wang, F. Agricultural Supply Chain Coordination under Weather-Related Uncertain Yield. Sustainability 2022, 14, 5271. [Google Scholar] [CrossRef]
- Wang, X.; Sun, S. Optimal Decisions for Contract Farming under Weather Risk. Discret. Dyn. Nat. Soc. 2022, 2022, 9668872. [Google Scholar] [CrossRef]
- Chen, Y.; Chai, Y.; Liu, Y.; Sun, H. Novel transaction financing model towards electronic commerce. In Proceedings of the Electronic System-Integration Technology Conference, Amsterdam, The Netherlands, 17–20 September 2012. [Google Scholar]
- Cai, S.; Yan, Q. Online sellers’ financing strategies in an e-commerce supply chain: Bank credit vs. e-commerce platform financing. Electron. Commer. Res. 2022, 2022, 1–32. [Google Scholar] [CrossRef]
- Yang, H.; Zhen, Z.; Yan, Q.; Wang, H. Mixed financing scheme in a capital-constrained supply chain: Bank credit and e-commerce platform financing. Int. Trans. Oper. Res. 2022, 29, 2423–2447. [Google Scholar] [CrossRef]
- Yan, N.; Zhang, Y.; Xu, X.; Gao, Y. Online finance with dual channels and bidirectional free-riding effect. Int. J. Prod. Econ. 2021, 231, 107834. [Google Scholar] [CrossRef]
- Tang, R.; Yang, L. Financing strategy in fresh product supply chains under e-commerce environment. Electron. Commer. Res. Appl. 2020, 39, 100911. [Google Scholar] [CrossRef]
- Tao, Y.; Yang, R.; Zhuo, X.; Wang, F.; Yang, X. Financing the capital-constrained online retailer with risk aversion: Coordinating strategy analysis. Ann. Oper. Res. 2022, 2022, 493. [Google Scholar] [CrossRef] [PubMed]
- Yang, H.; Zhuo, W.; Shao, L.; Talluri, S. Mean-variance analysis of wholesale price contracts with a capital-constrained retailer: Trade credit financing vs. bank credit financing. Eur. J. Oper. Res. 2021, 294, 525–542. [Google Scholar] [CrossRef]
- Qazi, A.; Simsekler, M.C.E. Worst Expected Best method for assessment of probabilistic network expected value at risk: Application in supply chain risk management. Int. J. Qual. Reliab. Manag. 2021, 39, 155–175. [Google Scholar] [CrossRef]
- Fan, Y.; Feng, Y.; Shou, Y. A risk-averse and buyer-led supply chain under option contract: CVaR minimization and channel coordination. Int. J. Prod. Econ. 2020, 219, 66–81. [Google Scholar] [CrossRef]
- Markowitz, H.M. Portfolio selection. J. Financ. 1952, 7, 77. [Google Scholar] [CrossRef]
- Artzner, P.; Delbaen, F.; Eber, J.; Heath, D. Coherent Measures of Risk. Math Financ. 1999, 9, 203–228. [Google Scholar] [CrossRef]
- Ye, F.; Lin, Q.; Li, Y. Coordination for contract farming supply chain with stochastic yield and demand under CVaR criterion. Oper. Res. Ger. 2020, 20, 369–397. [Google Scholar] [CrossRef]
- Huang, F.; He, J.; Lei, Q. Coordination in a retailer-dominated supply chain with a risk-averse manufacturer under marketing dependency. Int. T Oper. Res. 2020, 27, 3056–3078. [Google Scholar] [CrossRef]
- Jing, B.; Seidmann, A. Finance sourcing in a supply chain. Decis. Support Syst. 2014, 58, 15–20. [Google Scholar] [CrossRef]
- Nasiri, F.; Zaccour, G. An exploratory game-theoretic analysis of biomass electricity generation supply chain. Energ. Policy 2009, 37, 4514–4522. [Google Scholar] [CrossRef]
- Boyabatlı, O.; Kleindorfer, P.R.; Koontz, S.R. Integrating Long-Term and Short-Term Contracting in Beef Supply Chains. Manage. Sci. 2011, 57, 1771–1787. [Google Scholar] [CrossRef] [Green Version]
- Kouvelis, P.; Zhao, W. Financing the Newsvendor: Supplier vs. Bank, and the Structure of Optimal Trade Credit Contracts. Oper. Res. 2012, 60, 566–580. [Google Scholar] [CrossRef]
| Publisher’s Note: MDPI stays neutral with regard to jurisdictional claims in published maps and institutional affiliations. |
© 2022 by the authors. Licensee MDPI, Basel, Switzerland. This article is an open access article distributed under the terms and conditions of the Creative Commons Attribution (CC BY) license (https://creativecommons.org/licenses/by/4.0/).


