1. Introduction
CAVs are developing at a rapid pace with their autonomous driving, internet connectivity and other technological means [
1,
2,
3]. Their development and industrialization is a hot and emerging area at the forefront of world science and technology [
4]. Compared to HVs (human-driven vehicles), CAVs have the potential to improve link capacity [
5,
6,
7], traffic flow stability [
8,
9] and road safety [
10,
11]. The entry of intelligent CAVs into urban transport networks and the competition with traditional transport modes for limited road resources, and how to maximize the use of road resources to improve the overall efficiency of the transport system, are key issues in transport planning in the connected environment [
12,
13]. At the same time, a long transition period is needed for the replacement of non-connected vehicles by CAVs, and traffic planning must be based on the reality of long-term coexistence of heterogeneous traffic streams [
14,
15]. The installation of dedicated lanes for CAVs can provide a separate operating environment for CAVs, but it is a large investment and takes up a lot of existing road resources. When the penetration of CAVs is low, dedicated lanes for CAVs cannot be used efficiently and can even harm the overall performance of the transport network. Currently, bus lanes are widely used, but many of these lanes are located in older urban areas, where the number of lanes is limited and demand is high during commuting hours, making these hours “no or few buses in dedicated lanes and large queues in other lanes” [
16,
17]. The allocation of separate rights of way for CAVs based on existing bus lanes is a reasonable option for the design of transport networks in a connected environment. In other words, a joint lane is set up for the combined traffic of cars and buses, and this joint lane allows only the CAVs and buses to travel.
Broadly speaking, the design of dedicated lanes in the urban road network is part of the optimization of the layout of the urban transport network problems. Such problems are inherently challenging to solve [
12]. In previous studies [
18,
19], researchers have transformed network equilibria into mixed integer linear programming by means of nonlinear complementarity conditions, which are then solved using solvers such as the CPLEX Optimizer. According to existing studies [
20], the key design notion of urban traffic network deployment optimization is: The travel behavior choices of travelers in the traffic network are predicted and the equilibrium state of the traffic system operation is obtained during the network deployment design process. Simultaneously, the general architecture and shape of the traffic network are defined by optimizing the network topology in order to maximize traffic operation efficiency. In the network deployment optimization process, a bi-level program model for network optimization must be constructed, where the lower-level is a multi-class user travel behavior prediction model, and the upper-level is a road network deployment decision model, whether for traditional traffic flow or for future mixed connected and non-connected traffic flow.
In order to verify the rationality of such joint dedicated lanes and to find a method for planning the layout of such lanes, a bi-level planning model is designed in this paper. The lower level of the model captures a multi-class network equilibrium consisting of three types of bus, CAV and HV. In a partially networked environment, the value of travel time for a CAV will be lower than that of an HV due to significant differences in the operating characteristics of non-networked vehicles and networked vehicles [
21]. This is because users of net-connected vehicles are able to do other things without having to drive the vehicle. At the same time, a different utility function needs to be used [
22], with not connected vehicles achieving UE (user equilibrium) through mutual gaming between vehicles, and CAVs pursuing SO (system optimality) through mutual cooperation. Therefore, the traffic distribution model should have both a user-equilibrium utility function and a system-optimal utility function. Therefore, the traffic assignment model should have both a user equilibrium utility function and a system optimal utility function. The upper-level searches for the optimal joint lane deployment solution considering the minimum total system travel cost. Traditional network topology decision variables tend to characterize changes in the capacity of node sections or road sections, but in a mixed flow environment, network topology decision variables also need to be able to characterize the setting of dedicated lanes, dedicated roads or dedicated zones for CAVs [
23]. To solve the bi-level optimization model, an integrated solution framework combining GA (genetic algorithm) and the diagonalized MSWA algorithm is proposed. The GA is used to solve the optimal implementation of the joint lane and the diagonalized MSWA (method of successive weighted averaging) algorithm is used to solve the multi-class network equilibrium in the lower level.
In addition, a number of results were obtained through numerical examples. Firstly, in the Nguyen–Dupuis network, the implementation of joint dedicated lanes can reduce the total system cost by about 7.26%, the bus user travel cost by 7.51% and the CAV user travel cost by 7.44%. Secondly, as the frequency of bus departures increases, system travel costs are reduced and bus travel costs are increased. The construction of joint dedicated lanes will not only further reduce the total system cost, but also mitigate the elevated cost of bus travel. Finally, CAV penetration affects the effectiveness of joint dedicated lane deployment. Specifically, a better optimization effect is achieved when the penetration rate of CAVs is below 40%. In short, the contributions of this study are as follows.
(1) A joint dedicated lane for CAVs and buses is proposed, which not only saves road resources that provide relatively independent right-of-way for CAVs at the initial stage of CAV development, but also solves the problem of under-utilization of bus lanes.
(2) A bi-level programming model is established to solve the joint dedicated lane deployment planning problem.
(3) A GA and diagonalized MSWA algorithm is designed to solve the joint dedicated lane deployment planning problem, and finally, numerical examples are conducted to verify the solution.
The details of the latter paper are as follows:
Section 2 reviews the literature on heterogeneous traffic flows, enhancing the utilization of bus lanes and CAV dedicated lanes. The bi-level model and solution algorithms are presented in
Section 3 and
Section 4;
Section 5 shows the numerical experiment. Finally,
Section 6 summarizes the conclusions and suggestions for future research.
2. Literature Review
In this paper, the relevant literature is grouped into three categories. First, research on the link capacity of heterogeneous traffic flows in a connected environment is presented. Secondly, the efforts and contributions of scholars to improve the efficiency of bus lane utilization are provided. Finally, the researchers’ explorations of networked vehicle lanes are shown.
2.1. Previous Research on Heterogeneous Traffic Flows
Regarding the study of link capacity of heterogeneous traffic flows in a networked state, transportation experts have studied mixed traffic capacity from a variety of perspectives, all concluding that CAV mixing impacts road capacity. However, some of the results only reveal qualitative associations from the simulation direction. Van den Berg, et al. [
24] reviewed the literature on CAV road capacity and found that the change of CAV on capacity was not the same in different research scenarios. Road capacity in heterogeneous traffic streams composed of CAV and HV increase with the proportion of CAV. From the standpoint of theoretical analytical methodologies employing microsimulation techniques, Talebpour and Mahmassani [
25] evaluated road capacity changes under mixed CAV traffic flows. It was discovered that as the use of CAVs grew, there were variances in their influence on road capacity. Chen, et al. [
26] suggested a heterogeneous traffic stream variable headway time spacing method and utilized numerical simulations to show that CAV vehicles may improve traffic flow stability and increase road capacity. Some scholars have provided quantitative links to a degree, but they often make more assumptions and cover a broader number of elements. Levin and Boyles [
27] used a car-following model with driver response time to forecast road capacity in mixed traffic circumstances. Chen, et al. [
28] looked into a method for determining the capacity of a heterogeneous traffic stream that included CAV and HV in a traffic equilibrium condition. This considers (1) the prevalence of autonomous cars, (2) the microscopic features of HVs and CAVs (e.g., vehicle row length and spacing), and (3) varied lane regulations to support CAVs, such as CAV-only lanes and mixed-use lanes. Liu, et al. [
29] studied the reserved capacity and road right-of-way redistribution strategies under different mixed scenarios, developed a theoretical model of motorway roadway capacity, theoretically analyzed the impact of market penetration rate on roadway capacity, and validated the model through numerical analysis.
2.2. Available Studies on Enhancing the Utilisation of Bus Lanes
The problem of underutilized bus lanes, according to researchers, may be handled by establishing intermittent bus lanes. Intermittent bus lanes are devoted to buses when they are present in the lane, but they can be used by conventional vehicles once the buses have departed. Viegas and Lu [
30] were the first to propose the notion of intermittent bus lanes in 1996. This idea of optimizing the use of dedicated lanes is feasible, but the trade-off between efficiency and cost still needs to be investigated, so Zhu [
31] used metacellular automata to simulate intermittent bus lanes and compared the results to road sections without bus lanes and regular bus lanes, demonstrating the feasibility of intermittent lanes. Many scholars have since proposed many different control strategies in order to improve the utilization of intermittent lanes. Ma and Xu [
32] suggested a junction priority control approach with intermittent bus lanes after conducting simulation research on the spatial and temporal priority control strategies for BRT (Bus Rapid Transit) lanes. Wu [
33] developed a meta-automaton following model based on a combination of following pairs and a lane change model that reflects the characteristics of conventional vehicles changing lanes in intermittent bus-only lanes and used these two models to simulate the operation state of intermittent bus-only lanes. However, because the aforementioned intermittent lanes are aimed towards buses and ordinary automobiles, which are already inefficient to pass by manually driven ordinary cars, the efficiency increase is still restricted. To promote optimal utilization of bus lanes, Hoonsiri [
16] proposed intermittent bus lanes for BRT and regular buses.
2.3. Existing Explorations on CAV Dedicated Lanes
There is little research on dedicated lanes for CAVs, which may be separated into two categories; one that looks at dedicated lane access techniques. Lui and Song [
13] presented an autonomous vehicle toll (AVT) lane that allows autonomous vehicles to pass for free while conventional vehicles must pay to go and investigated the best AVT and AV lane arrangement. Chen, et al. [
34] suggested and showed the feasibility and efficacy of enabling autonomous cars to use BRT lanes. The other looks at solely networked dedicated lane deployment tactics. Chen, et al. [
18] suggested a time-based CAV lane for heterogeneous traffic flow networks that considers permeability variations. Ghiasi, et al. [
35,
36] created a mixed traffic capacity analysis model based on Markov chains, and a lane management model was built based on this model to calculate the number of lanes devoted to CAV on a highway in order to maximize the highway’s capacity. Rad, et al. [
37] developed a conceptual framework based on relevant literature to examine the process of establishing CAV lanes, use regulations, and other factors, as well as the link between traffic safety and efficiency. Lin [
12] suggested a bi-level programming methodology for determining the best deployment, while taking economic and environmental sustainability into account.
2.4. Summary of Literature Reviews
To summarize the current state of the research, many researchers have produced major accomplishments in their research on heterogeneous traffic streams, intermittent bus lanes and CAV lanes, but further in-depth research on the following issues is still needed.
(1) Previous studies on heterogeneous traffic streams in the connected environment often lack bus flow. However, bus flows should not be neglected as they are also ground transportation. Furthermore, in heterogeneous traffic streams, the driving behavior of connected and non-connected vehicles differs considerably, resulting in a more difficult heterogeneous traffic stream assignment problem than the traditional traffic assignment problem. Ordinary traffic assignment is based on user equilibrium, whereas heterogeneous traffic streams assignment uses distinct path selection criteria for each user. The majority of current heterogeneous traffic stream research focuses on determining the influence of microscopic heterogeneous traffic stream features, with little attention paid to the heterogeneous traffic stream allocation problem on macroscopic road networks. As a result, the assignment of traffic with heterogeneous traffic streams containing buses, as well as the optimization of the macroscopic road network structure based on traffic allocation, remain unexplored.
(2) In order to address the problem of underutilization of bus lanes, although many scholars have proposed dynamic or intermittent bus lane control methods to improve the efficiency of their use, such intermittent lanes often have complex rules and are geared towards the uncontrollable nature of ordinary vehicles and the fact that when traffic volumes are too high, they usually interfere with the movement of buses in the bus lane, resulting in difficult implementation and limited efficiency gains. The emergence of CAVs, the controlled vehicles, makes it possible to easily increase the utilization of bus lanes, and the conversion of bus lanes into combined bus and CAV lanes is an effective means of improving the underutilization of bus lanes.
(3) Dedicated lanes for CAVs are still in the early stages of development. The majority of studies focus on providing separate rights of way for CAVs, neglecting the reality that demand for road resources fluctuates depending on the degree of CAV penetration. Planning dedicated lanes for CAVs is an effective means to promote the development of CAVs and improve traffic conditions. But it is influenced by various aspects, such as the scale of CAVs, traffic conditions and policy guidance. Road conditions and construction costs are two fairly important prerequisites. Considering road conditions, urban roads have limited resources and usually have dedicated lanes for buses already in place, and considering construction costs, direct construction of connected lanes is often too costly. Few previous researchers, on the other hand, have connected the under-utilization of bus lane resources to CAV demand for dedicated lanes. Therefore, a combination of realistic surface traffic flows and actual road conditions is needed to study the deployment of joint dedicated lanes for CAVs and buses.
For problem (1), the paper considers the heterogeneous traffic streams of conventional vehicles, CAVs and buses. Based on the existing research, the laws for other different mixing situations are summarized and generalized from the law of mixing between conventional vehicles and buses and the law of mixing between conventional vehicles and CAVs, so as to reason out the relationship equation between the road section capacity and the mixing ratio of each traffic flow accordingly. In the face of problem (2), the joint lane proposed in this study is analogous to the intermittent bus lane for CAVs. It makes acceptable use of the adjustable qualities and real-time information interaction characteristics of CAVs, and efficiently enhances the lane usage efficiency when compared to a regular intermittent bus lane. In response to question (3), the proposed joint dedicated lane addresses the need for dedicated lanes in the early stages of CAV growth, avoiding the waste of resources in building separate dedicated lanes for CAVs while providing CAVs with relatively independent driving rights of way.
3. Methodology
3.1. Basic Assumptions
The following are the basic assumptions made in this article.
(1) There are only three modes of transportation, conventional vehicles, CAVS and buses, between the origin and destination.
(2) In terms of mode choice and path selection, under a given penetration rate of CAVs, a fixed proportion of users choose CAVs to travel and select paths according to the system optimum, i.e., SO users; the remaining users choose their travel mode according to the user balance principle, i.e., UE users, conventional vehicle users choose paths according to user balance, and bus users travel according to established routes.
(3) In the road network, the joint dedicated lane is built on the outermost lane of the road link where a joint dedicated lane for CAVs and buses is considered to be selectively built on roads covered by bus routes. A reasonable adjustment to the road network at different stages of the development of CAVs can be made.
3.2. Description of a Multi-Modal Traffic Network
In general, a road network is composed of road segments and nodes, and a road network that contains multiple types of users is described as
.
is the set of nodes in the network.
represent the origin point, road network node and destination point, respectively.
is the set of origin and destination pairs;
is the set of links.
indicates links covered by bus routes and
indicates links not covered by bus routes. Link
consists of
(
) lanes and the single lane capacity of link
is
.
indicates the set of travel mode types,
represent the ordinary conventional vehicle mode, the CAVs travel mode and the bus travel mode, respectively. The choice of travel mode is related to the broad travel costs of the three modes. The broad costs of both conventional vehicles and CAV travel mainly include travel time, fuel costs and parking fees, while the broad costs of public transport travel include walking time at the starting and ending points, ride time, fares and in-vehicle comfort, etc. The choice of transport mode is a complex decision-making process, influenced by a variety of factors, many of which are difficult to quantify. Usually, discrete choice models (random utility theory) are taken as the basic theoretical approach to user travel mode selection. Two commonly used discrete choice models are the logit choice model and the probit choice model [
20]. Due to its closed probability expression formula, the logit choice model has become the most widely used form of mode sharing function [
38]. For the three modes of travel—conventional vehicles, CAVs and buses, where the demand for conventional vehicles and buses is not fixed and users play each other based on generalized travel costs to eventually reach user equilibrium, while for CAVs with a given road network penetration, the travel demand is fixed.
To facilitate this presentation, the key variable notations used hereafter are summarized in
Table 1.
For simplicity’s sake, assume that conventional vehicles and CAVs ride as one person per vehicle, that the public transport vehicles are all of the same type and that the capacity is B persons per bus. The transport demand is (). The road network penetration of the CAV is , then the traffic shared by the CAV is and the traffic shared by the conventional vehicle and the traffic shared by the bus by the logit function of the generalized travel costs.
For the conventional vehicle traffic demand
, note that the conventional vehicle travel path set is
and the path flow is
(
), then the conventional vehicle flow
on link
can be expressed as:
For the bus traffic demand
, note that the bus travel path set is
and the path flow is
(
), then the bus flow
on link
can be expressed as:
For the CAV demand
, note that the CAV travel path set is
and the path flow is
(
), then the CAV flow
on link
can be expressed as:
3.3. Path Generalized Travel Costs Considering Bus Congestion Effects
In the traffic allocation phase of the four stages of traffic planning, the traffic flow is to be assigned by taking into account the time impedance of a particular road section. The correction for the travel time of a road section can be determined from the relationship between travel time and the traffic volume of the road section, i.e., the road resistance function. The most common road resistance function is the BPR function [
39].
For a purely conventional vehicle traffic flow, the travel time on link
is given by the BPR function as:
where
is the free-flow time of the car on link
,
is the single-lane capacity,
and
are the parameters corresponding to a normal car.
There is a considerable amount of research [
40,
41] available on the heterogeneous traffic stream of buses and conventional vehicles, and the travel times of conventional vehicles and buses on a road link can usually be expressed separately as:
where
K is the bus commutation factor, which is only relevant for the type of bus,
is the free-flowing travel time of the bus on link
.
and
are the parameters corresponding to the bus.
In contrast, there are fewer existing studies for heterogeneous traffic streams of CAVs and conventional vehicles. According to existing studies [
42], let the proportion of road links with CAVs be
, and according to the BPR function it is known that the travel time of conventional vehicles and buses on link
can usually be expressed, respectively, as:
where
is the free-flowing travel time of the CAV on link
,
and
are the parameters corresponding to the CAV, and the single-lane capacity
in link
is a function of the proportion of CAV sections
. In order to unify the equations, by a simple mathematical conversion (10) and (11)
can be converted to
, and we have:
L is the commutation factor for the CAVs in the heterogeneous traffic stream and is a function of the proportion of CAV sections
. At this point (10) and (11) can be reduced to expressions similar to (8) and (9):
To describe travel times more succinctly and clearly, we assume a random mix of CAVs and conventional vehicles; there are four vehicle-following scenarios:
According to
Figure 1, the following headway time distances corresponding to the four following scenarios are:
By calculating the average headway from the mixing ratio, it can be shown that the single lane capacity function for a road link can be expressed as:
Substituting (2)–(12) and
into Equation (12) gives:
In summary, for road link
and traffic mode
, the BPR function shows:
where
m is the corresponding mode of transport,
K is the bus discount factor, which relates to the bus type, and
L is the CAV discount factor, which relates to the proportion of CAV sections.
For a set of OD pairs
w on path
p, the cost of a passenger trip choosing either the conventional vehicle or the CAV mode can be expressed uniformly as:
where
is the time value of the trip, related to comfort, generally
;
is the price per unit of time for fuel consumption, and
is the cost of parking.
The degree of crowding in the bus, which is connected to the demand for traffic on the road section for bus travel users, the frequency of bus departures, and the rated number of people on board, affects the comfort level of bus passengers. As a result, the BPR function should be used to adjust the generalized trip cost for passengers taking the bus mode, yielding the following results.
where
and
are congestion utility parameters,
B is the nominal number of people on board the bus and
F is the frequency of bus departures.
is the number of interchanges on route
p,
is the waiting time conversion factor, and
is the bus fare.
3.4. Multi-Principle Traffic Assignment Model under Heterogeneous Traffic Streams
While users who choose to travel by bus or HV choose their route by considering the minimization of their own travel costs, users of CAV travel with their vehicles controlled by a control center and plan their route according to the system’s optimum conditions based on the current state of the road network.
For non-connected car users, the traditional Beckmann equation only applies to a single conventional vehicle user. Considering that there are also bus users among non-connected car users in addition to conventional vehicle users, the equilibrium state travel cost is introduced to specifically describe the equilibrium state model. Let
and
denote the travel costs of conventional vehicle users and bus users on OD pair w in equilibrium, respectively. Then, at equilibrium, we have:
where
is the flow of traffic for the car user choosing path
and
is the flow of traffic for the bus user choosing path
. Then for a given OD pair
w we have:
where
and
represent the demand for conventional vehicles and buses on OD pair w, respectively.
As can be seen from the analysis in
Section 3.3, for a given total demand
(
) and CAV penetration
on OD pair
w, the sum of car and bus demand is also fixed, and the equilibrium, i.e.,
and
, is divided between these two modes by the Logit function of the generalized path travel cost, respectively.
where
and
are empirical reference coefficients for demand classification.
In the non-equilibrium state, note that
and
are the average travel costs of a car and a bus, respectively.
As for the users of CAVs, the objective is to minimize the total travel cost for all users of the whole system, so the multi-class user traffic allocation model in a heterogeneous traffic stream environment can be formulated as:
(1), (3), (5), (17)–(20), (22)–(29).
3.5. Deployment Model for Joint Dedicated Lane Deployment under Heterogeneous Traffic Stream
When link
has no dedicated lanes, the travel time
for each mode section can be expressed as (2.18), if a joint dedicated lane (number of lanes) is provided on the outside of link
, the travel time for each mode section can be expressed, ignoring the mutual interference between the lanes, as:
Taking the decision variable as
,
when a bus lane is provided on link
and
otherwise, the travel time of users choosing mode
m on link
can be expressed uniformly as:
The deployment design of the joint lane is a network-level optimization, and its objective should be to minimize the total travel cost of the entire transport system. The sum of the travel cost of the users of the entire network is expressed as the sum of the total travel cost of the users of conventional vehicles, the total travel cost of the users of public transport and the total cost of the users of CAV travel. Therefore, the joint lane planning model is as follows.
where
represents the shortest length of continuous joint dedicated road construction and
represents the shortest length of continuous sections without dedicated roads;
,
,
,
,
and
are obtained by solving the lower model (1), (3), (5), (17)–(20), (22)–(29) and (31).
4. Solution Algorithms
The lower-level model is solved using a diagonalized MSWA algorithm, defining the marginal cost of travel for link
as
, which is optimal for the system when an additional passenger is added to path
f and the marginal time remains constant (proof below).
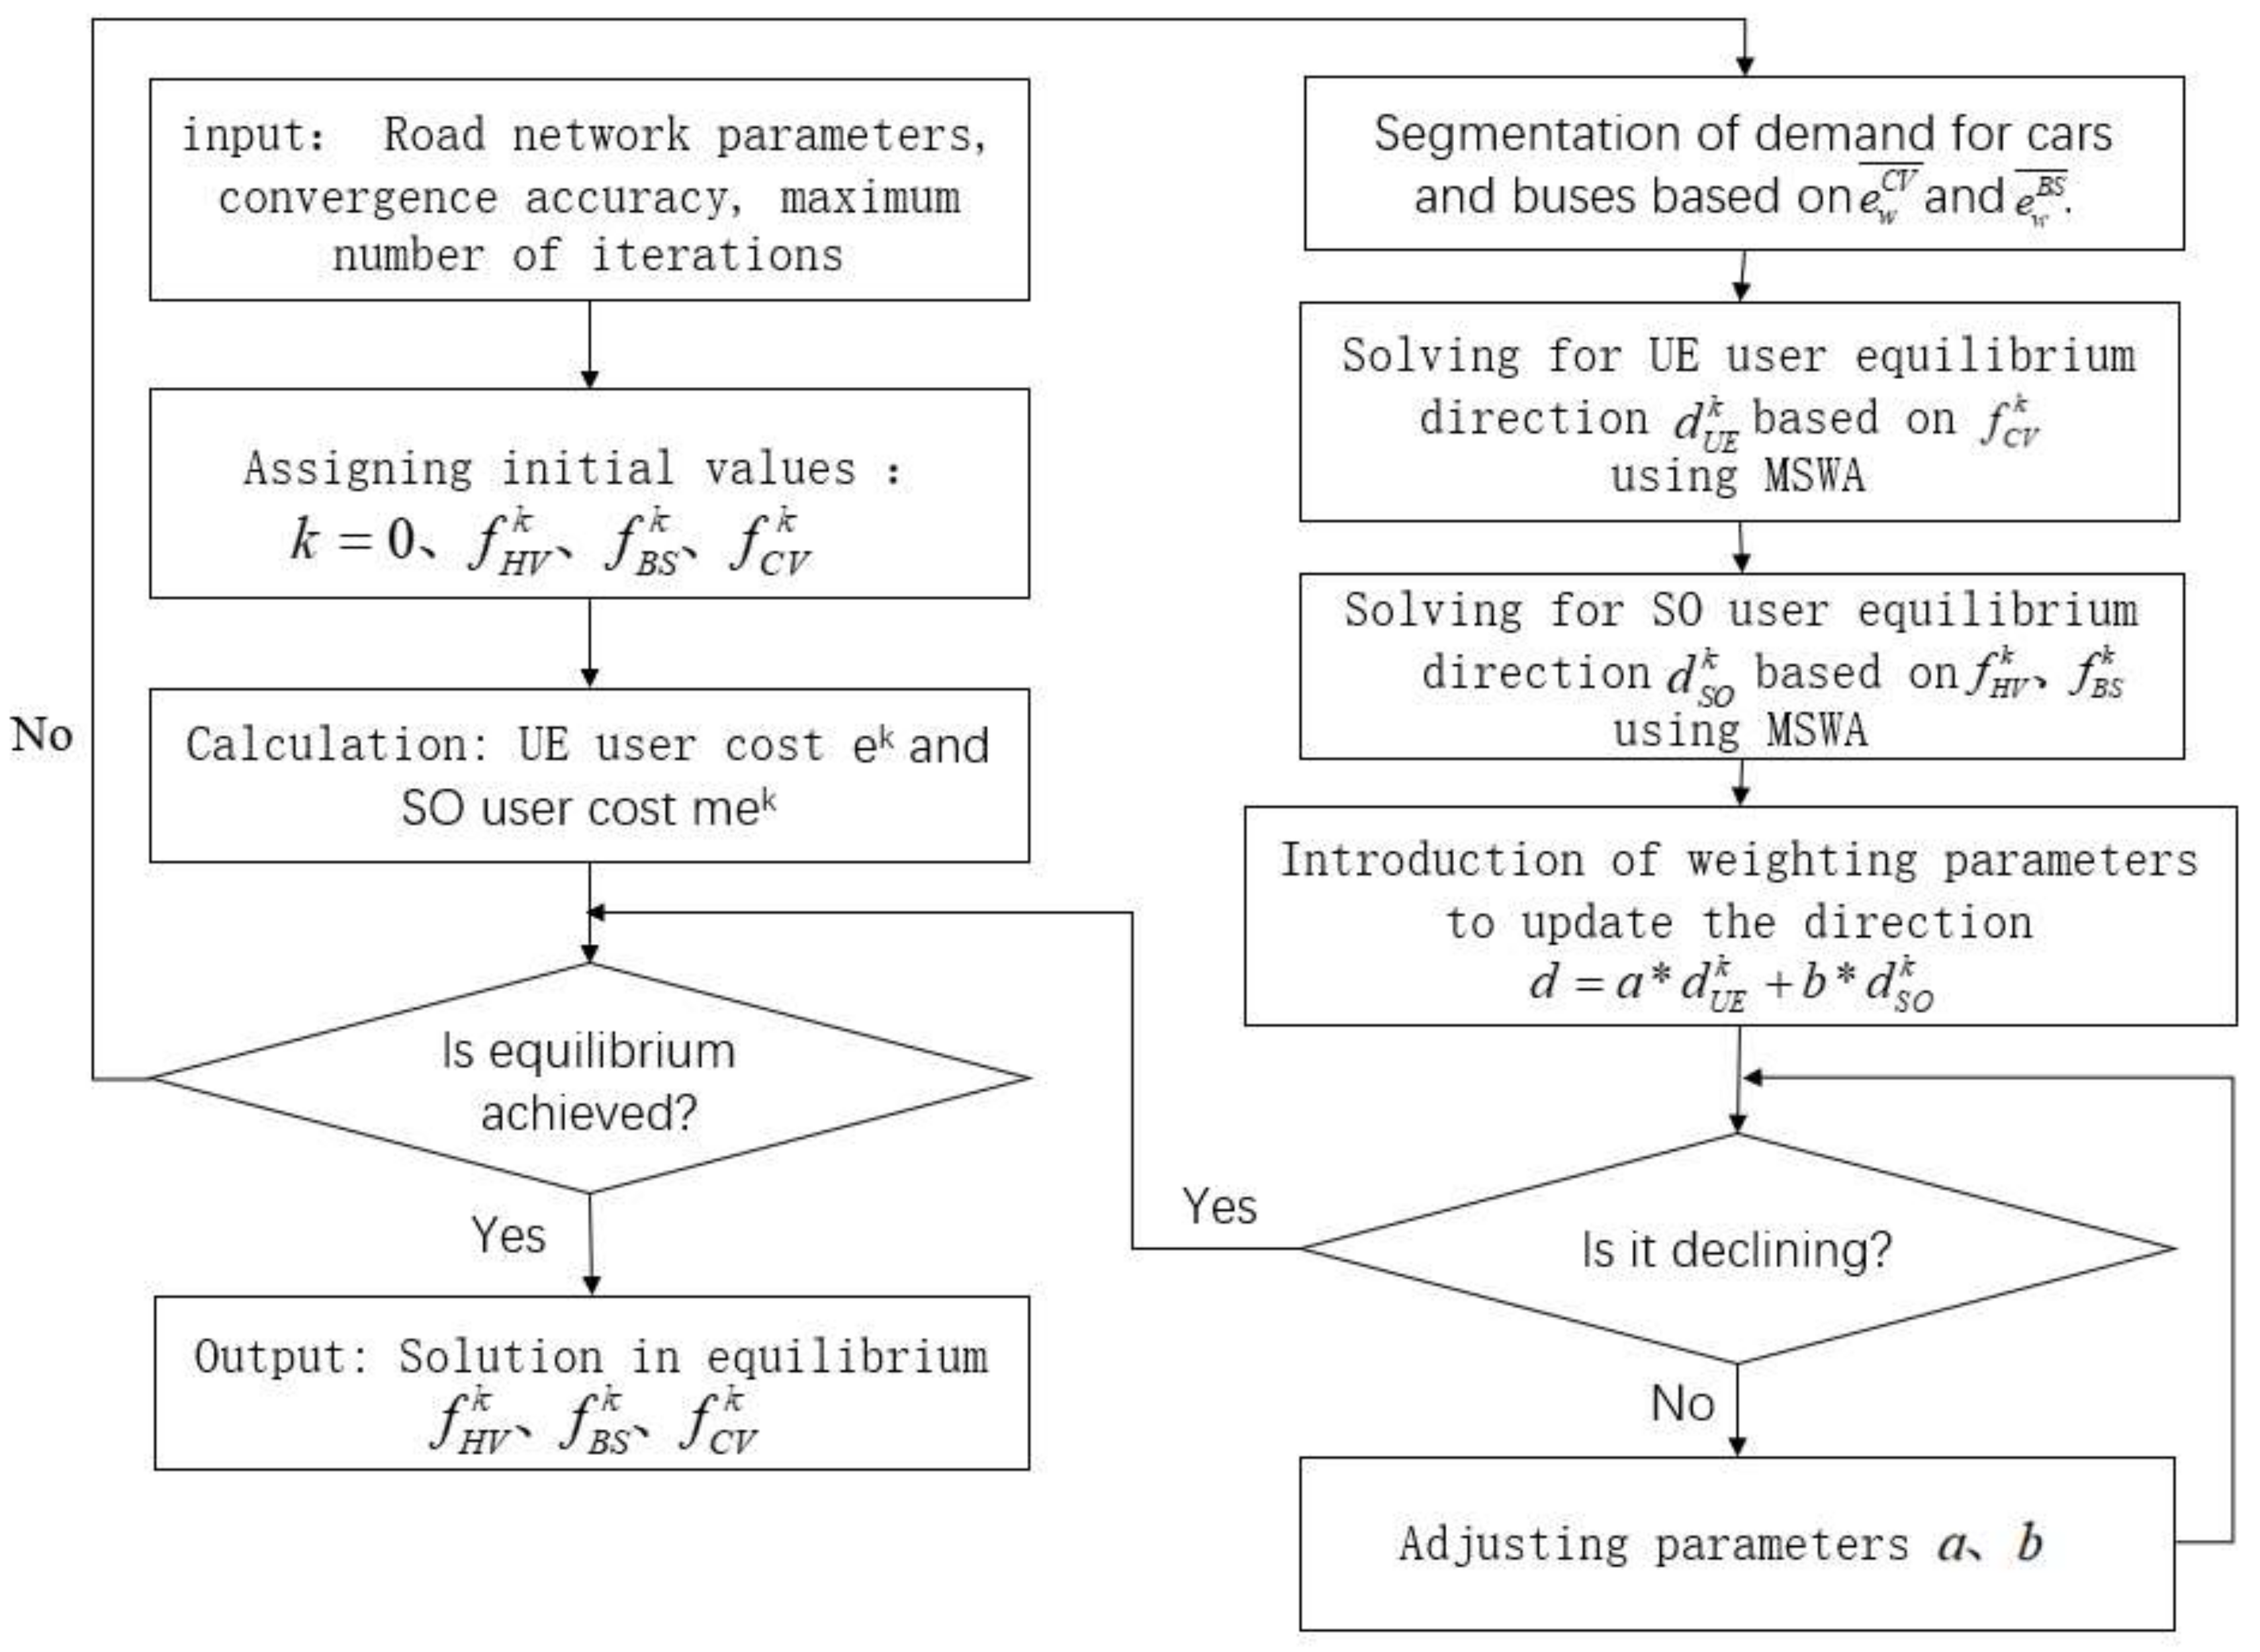
Therefore, the final equilibrium state is that all UE users of the same OD pair travel at the same cost and all OS users of the same OD pair travel at the same marginal cost. For this model, the diagonalized F-W algorithm can be used to solve it, the lower-level model solution algorithm is specified in
Figure 2.
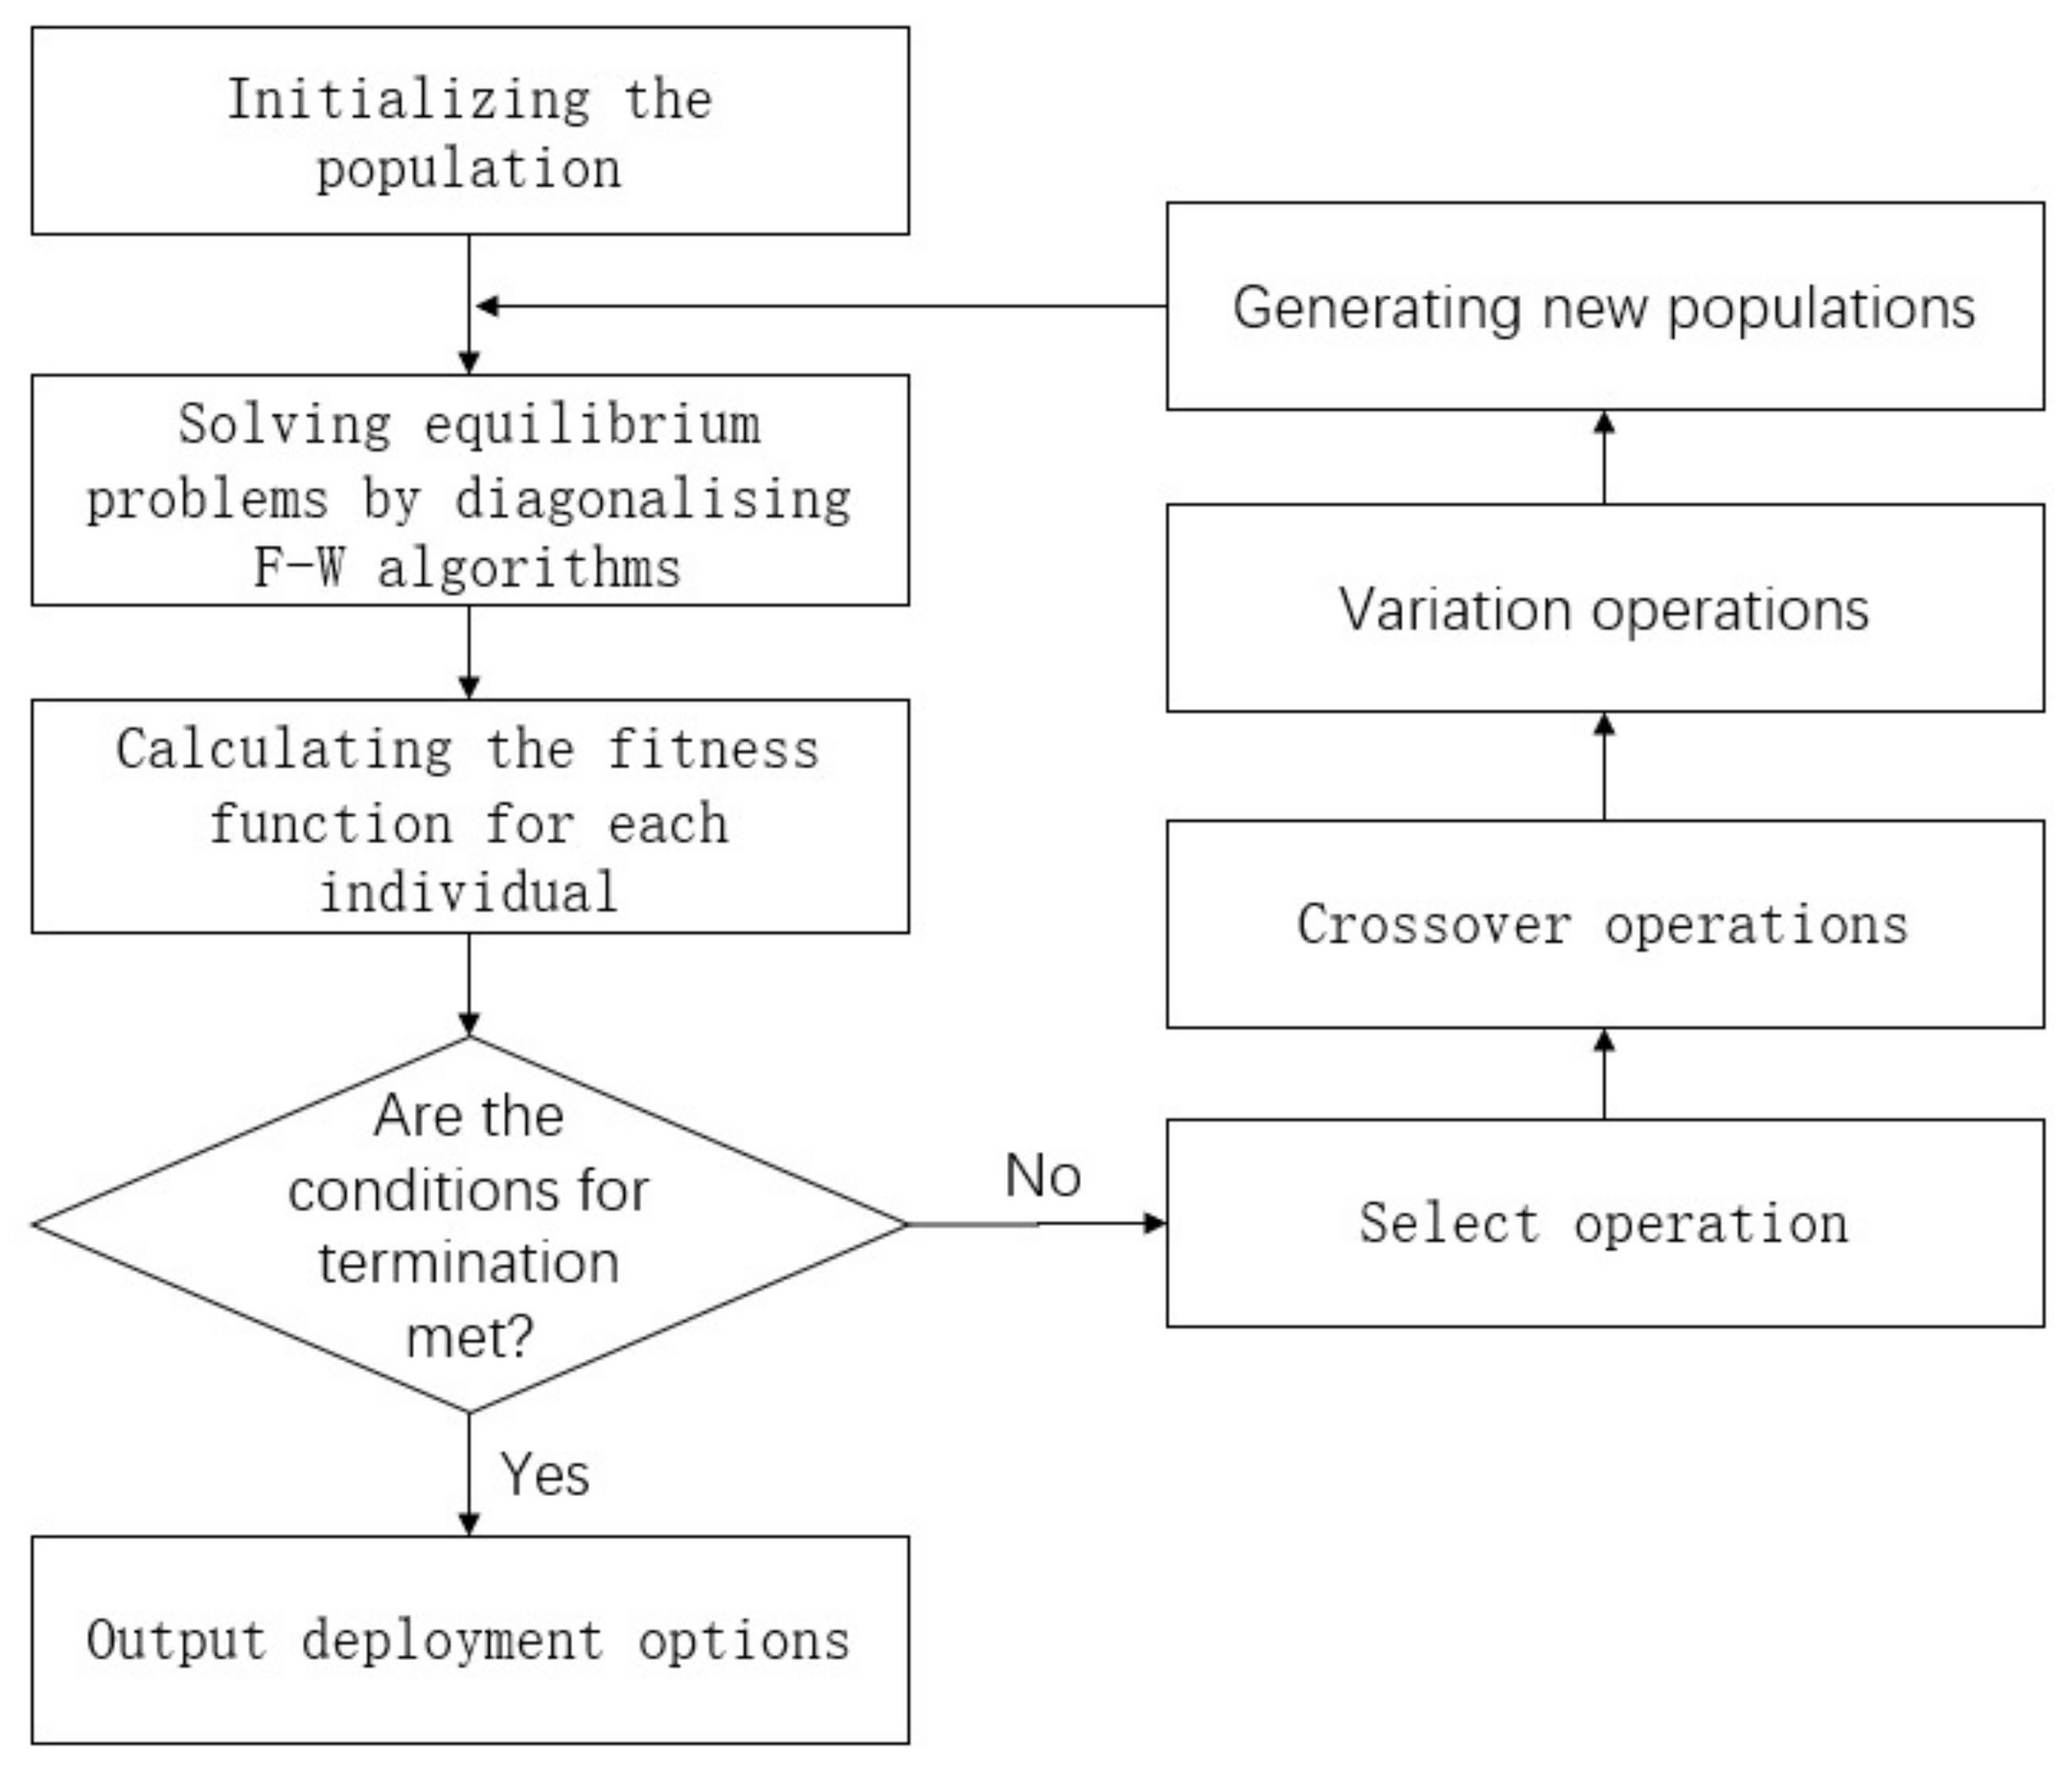
The upper-level model is solved using a genetic algorithm. The joint dedicated road deployment planning problem is actually a road network level planning problem, and the problem of finding its optimal solution is actually a mixed integer non-linear planning problem, which belongs to the NP-hard problem. The genetic algorithm is used to solve the joint dedicated road planning model, which has strong global search capability and high compatibility, and can find the dedicated road deployment solution that makes the objective function optimal as soon as possible.
The decision variable is binary encoded, i.e., the ordered arrangement of parameter above is used as the decision variable, and the encoding is illustrated with a length equal to the total number of sections of joint dedicated lanes that can be built, and the initial population is randomly generated according to the 0–1 chromosome encoding.
Afterwards, a feasibility test is performed to replace or eliminate individuals in the initial population that do not meet the constraints, and the inverse of E in the objective function (36) is used as the fitness function, and the algorithm flow is shown in
Figure 3.
5. Numerical Examples
5.1. Nguyen–Dupuis Network Description
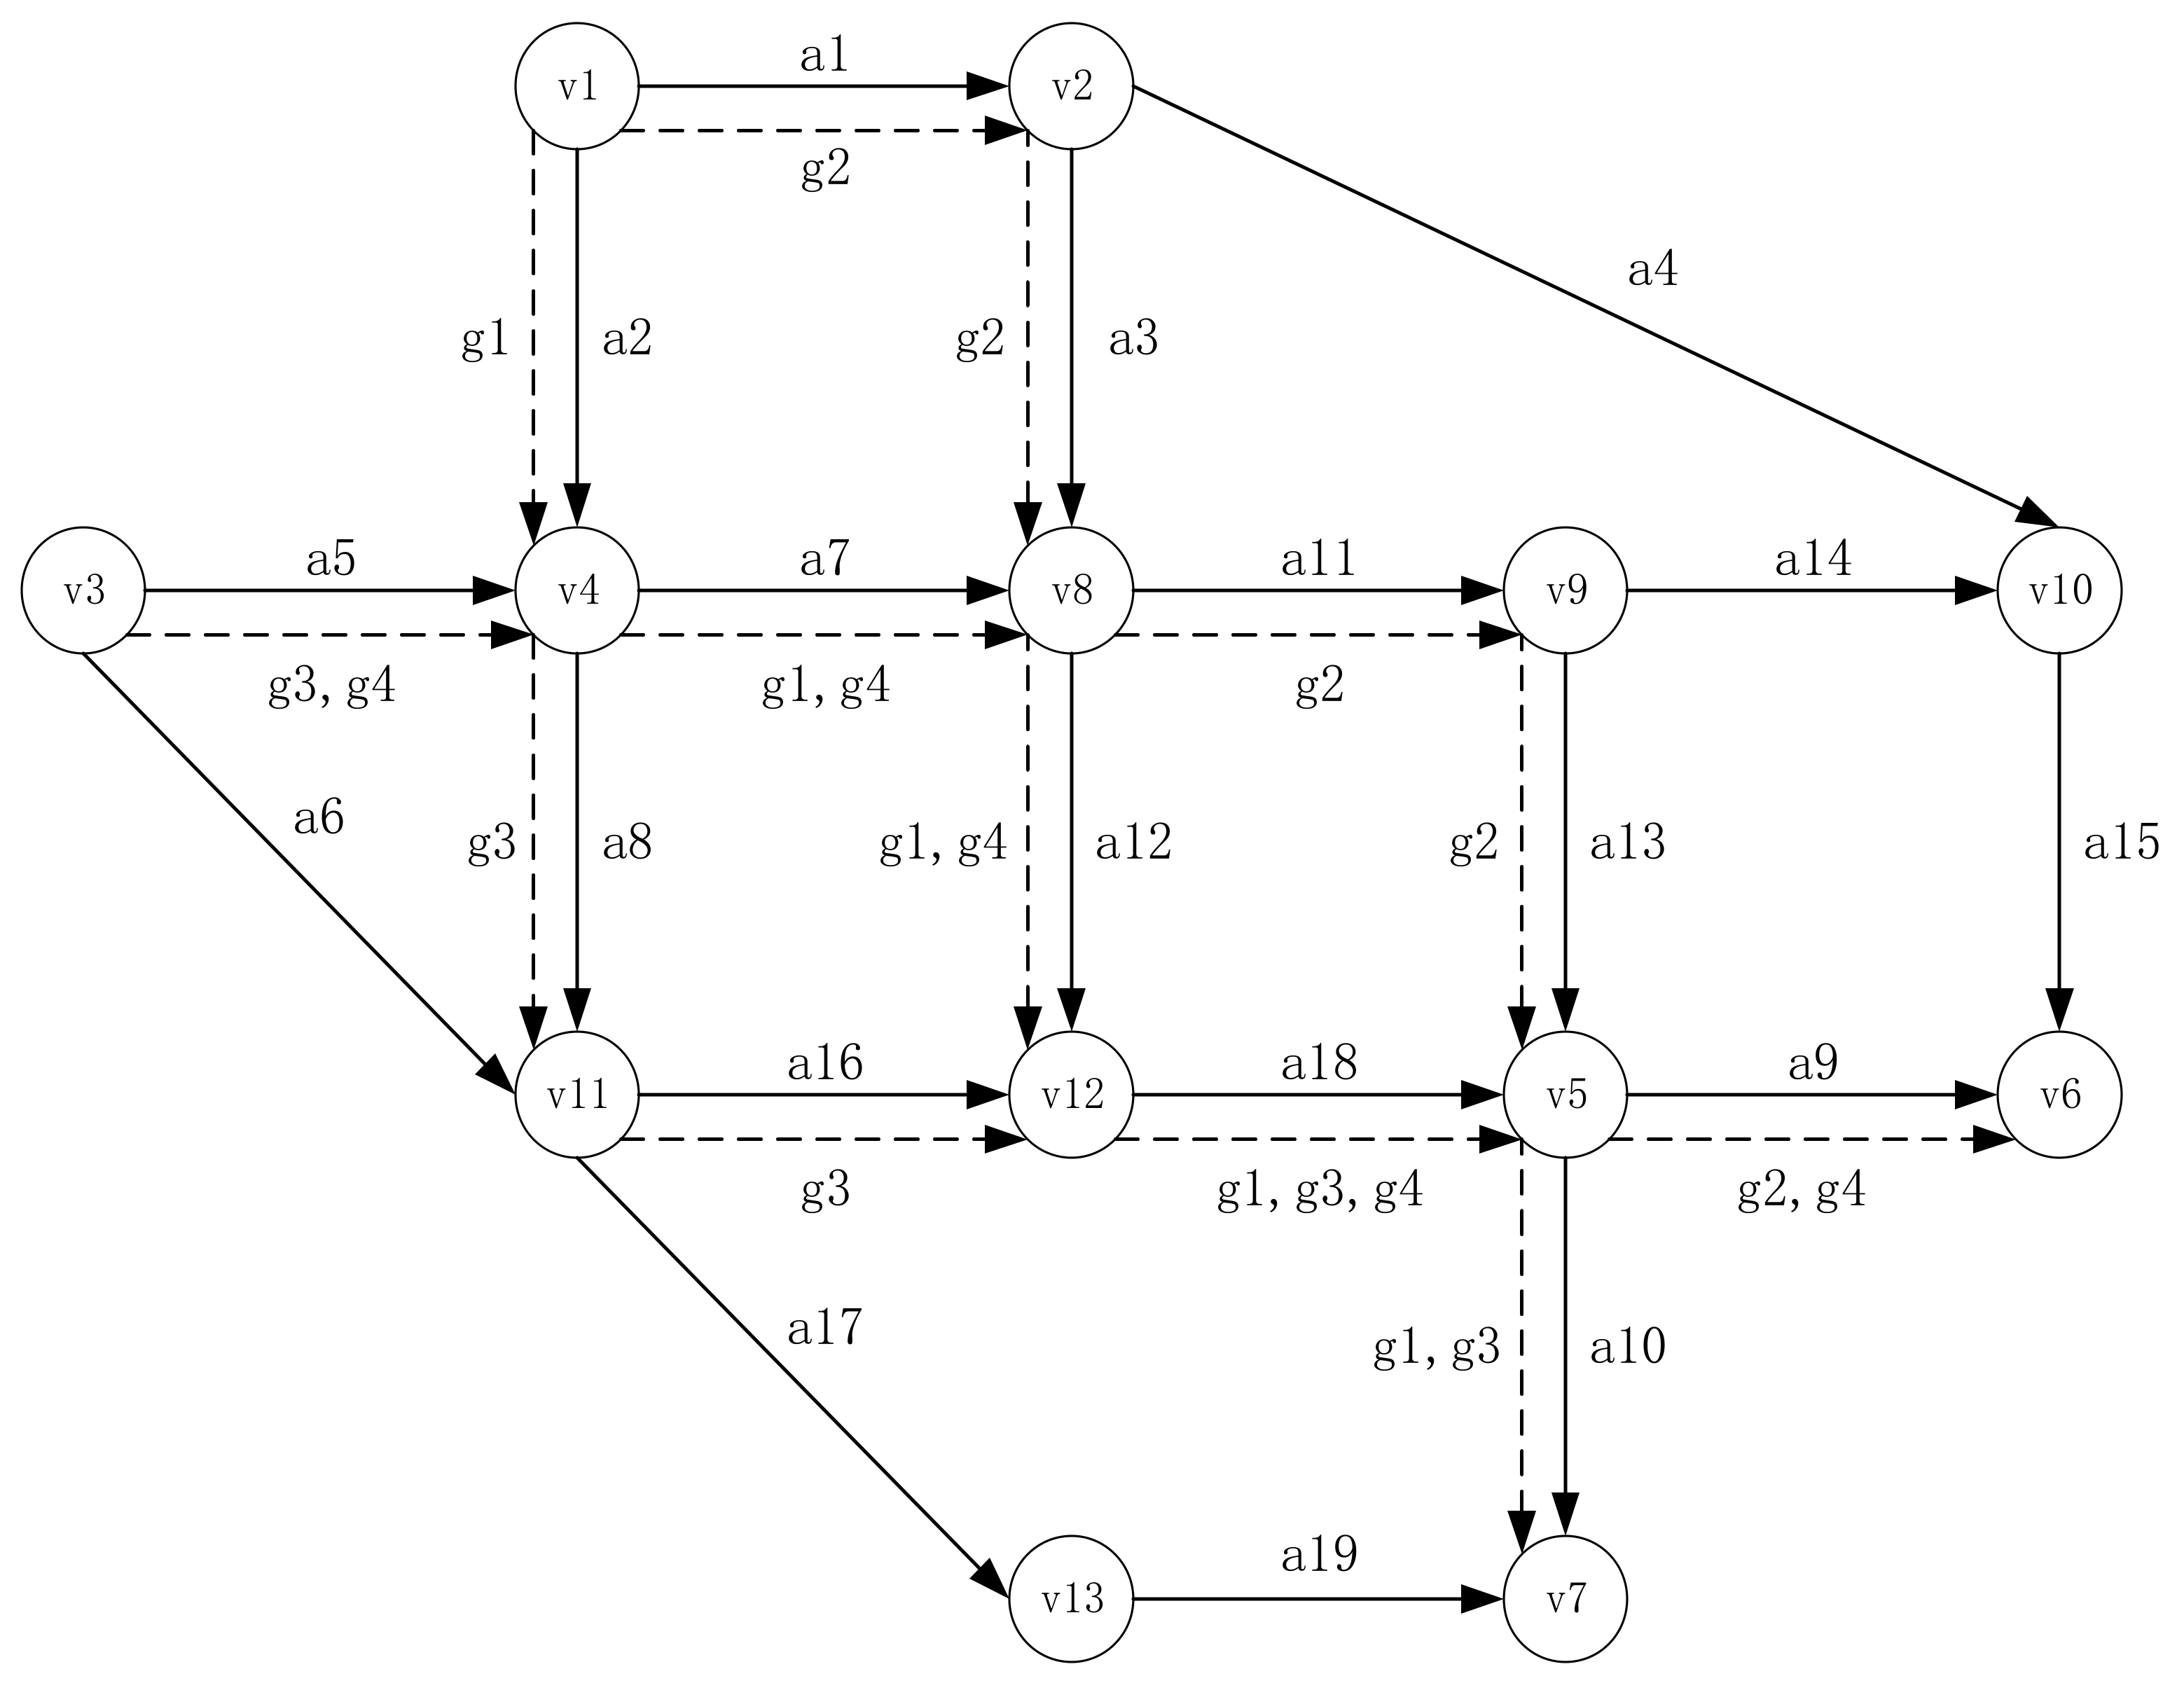
The proposed model and algorithm are implemented in the Nguyen–Dupuis network (
Figure 4), which contains 13 nodes, 19 links, four OD pairs, and four bus lines. All links have three lanes, and single lane capacity of 400 pcu/h. The specific attributes of the road network are shown in
Table 2, except that the free flow time for each road link of the network link is the same as that of a conventional vehicle, and the free flow time for each road link of a bus is 1.2 times that of a conventional vehicle. To simplify the problem, it is assumed that there is a fixed bus line between each OD pair, and the travel demand between each OD pair and the frequency of departure of the corresponding line are shown in
Table 3, and the remaining parameters are taken as shown in
Table 4.
5.2. Basic Scenario Analysis
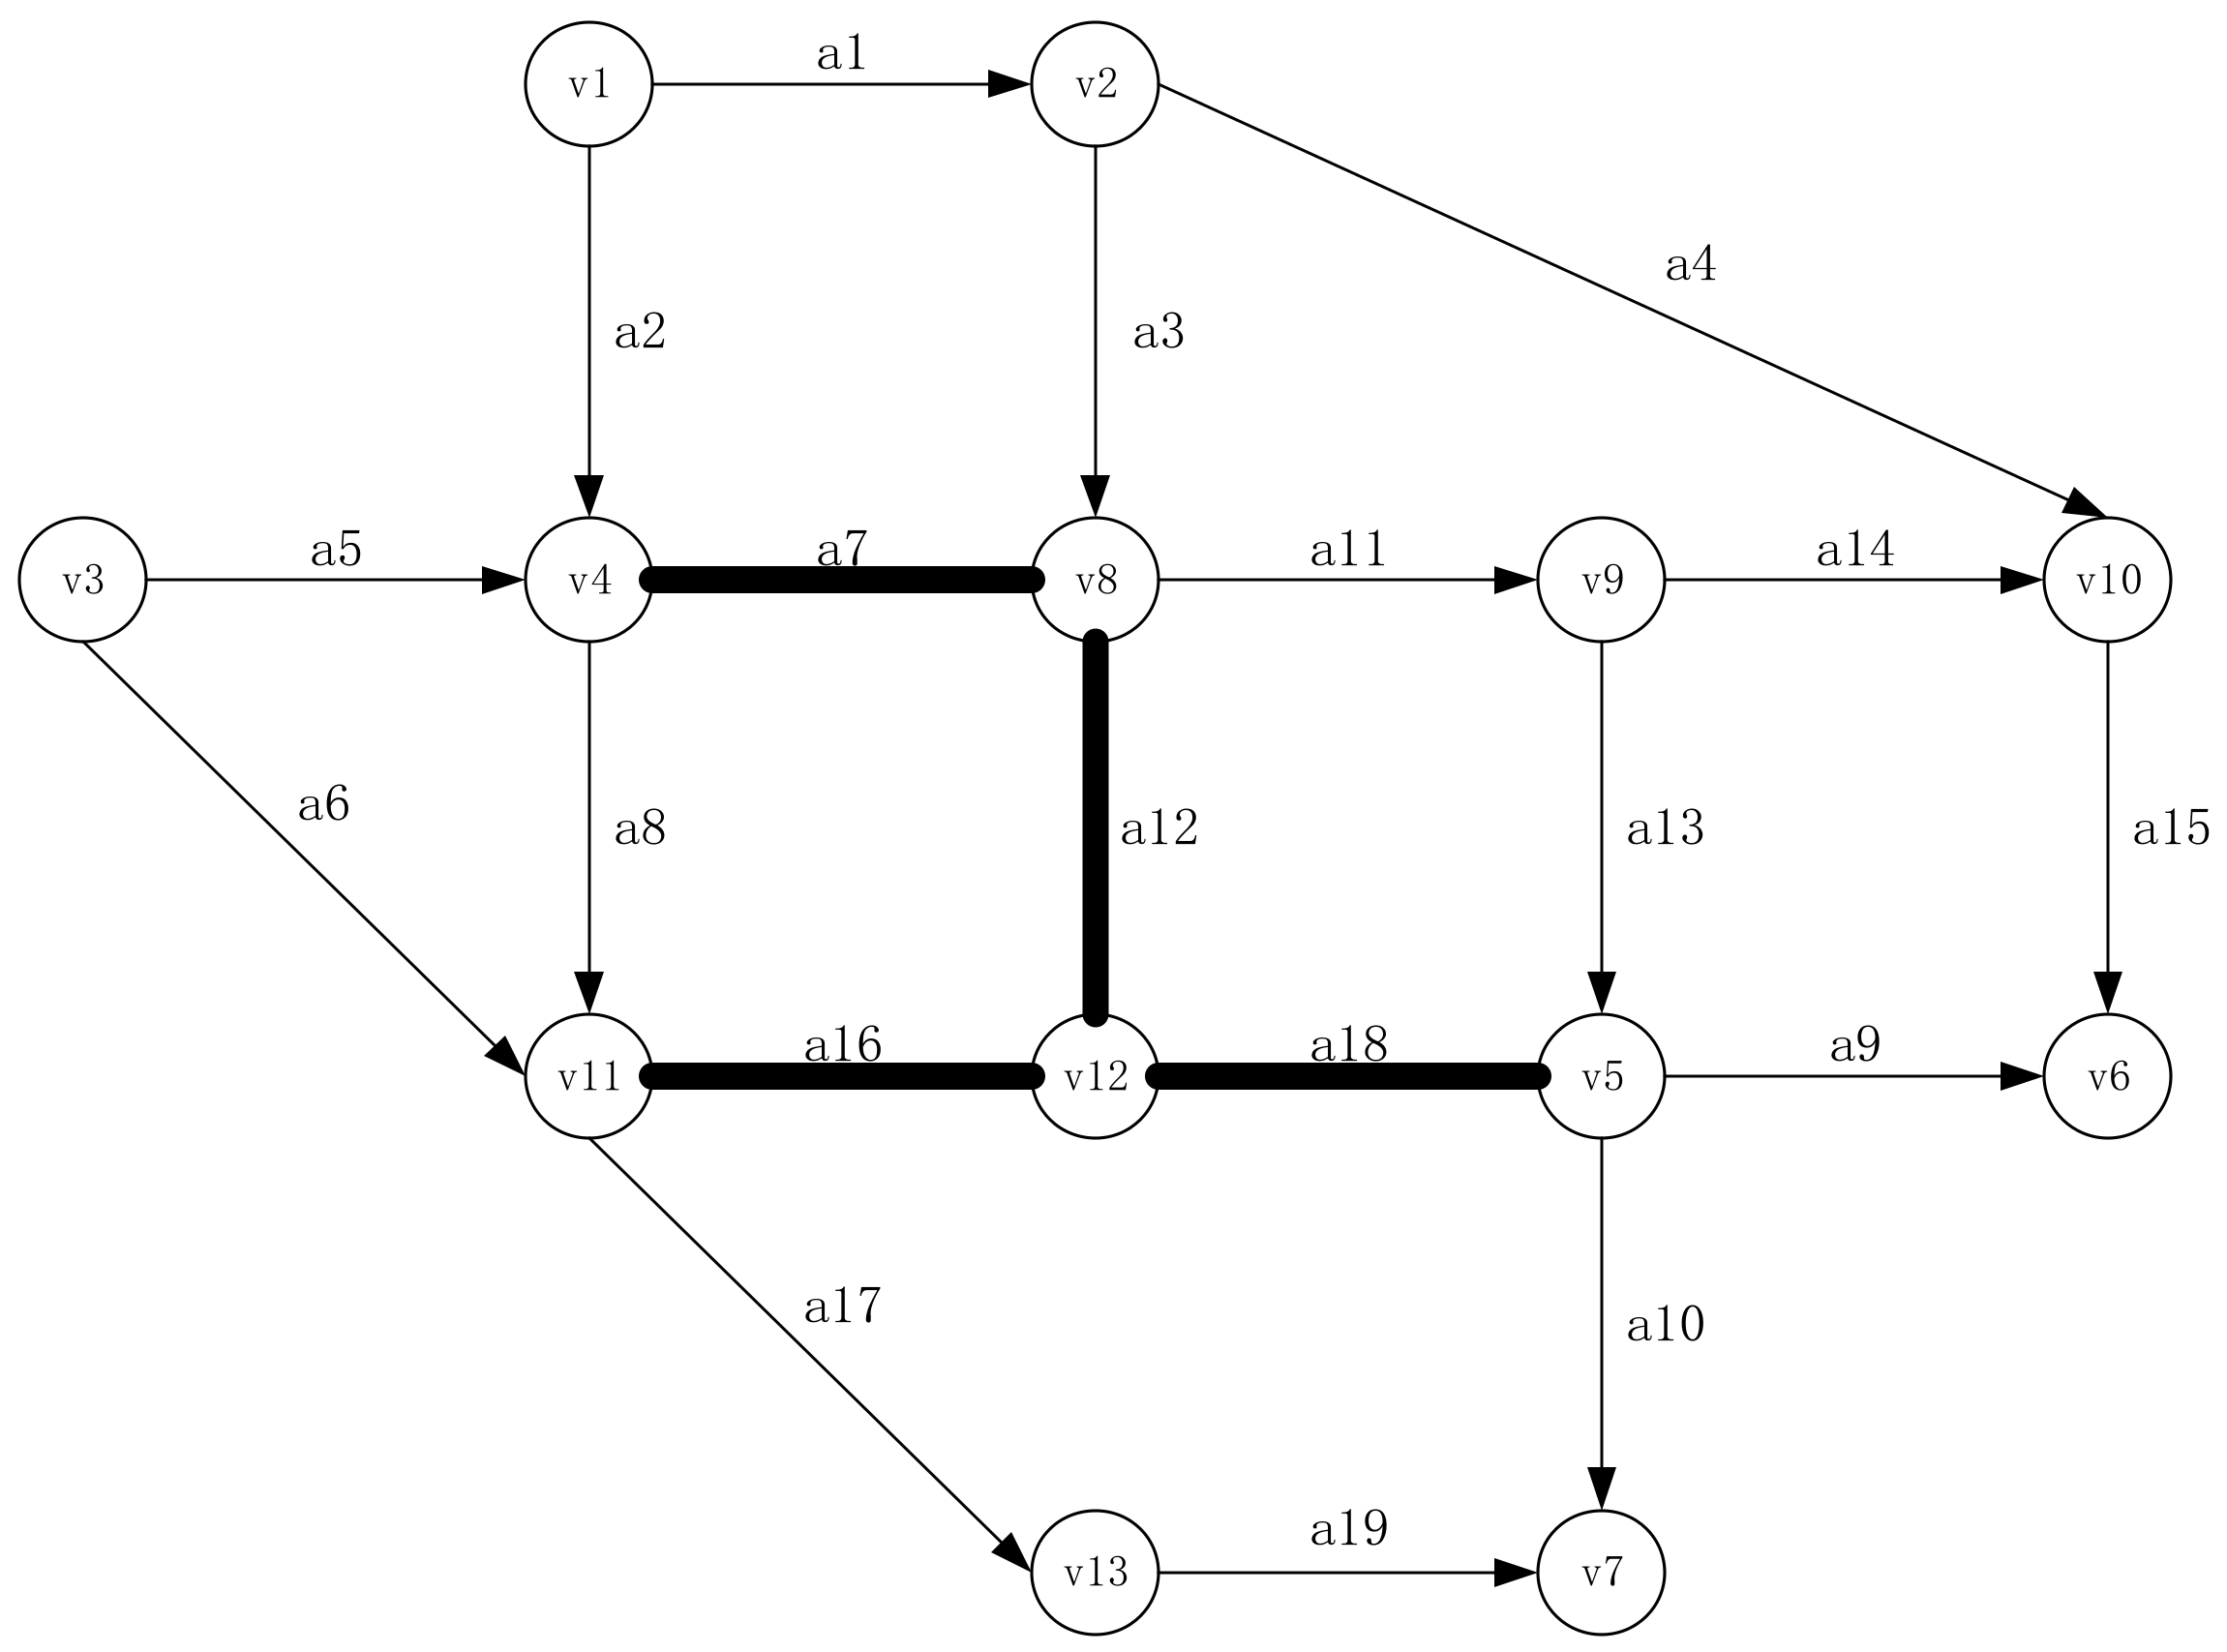
Taking the CAV penetration rate to be 30%, the optimal deployment scheme based on the above data and algorithm is shown in
Figure 5.
The scenario before and after construction is contrasted to illustrate the possibility of creating a joint dedicated lane.
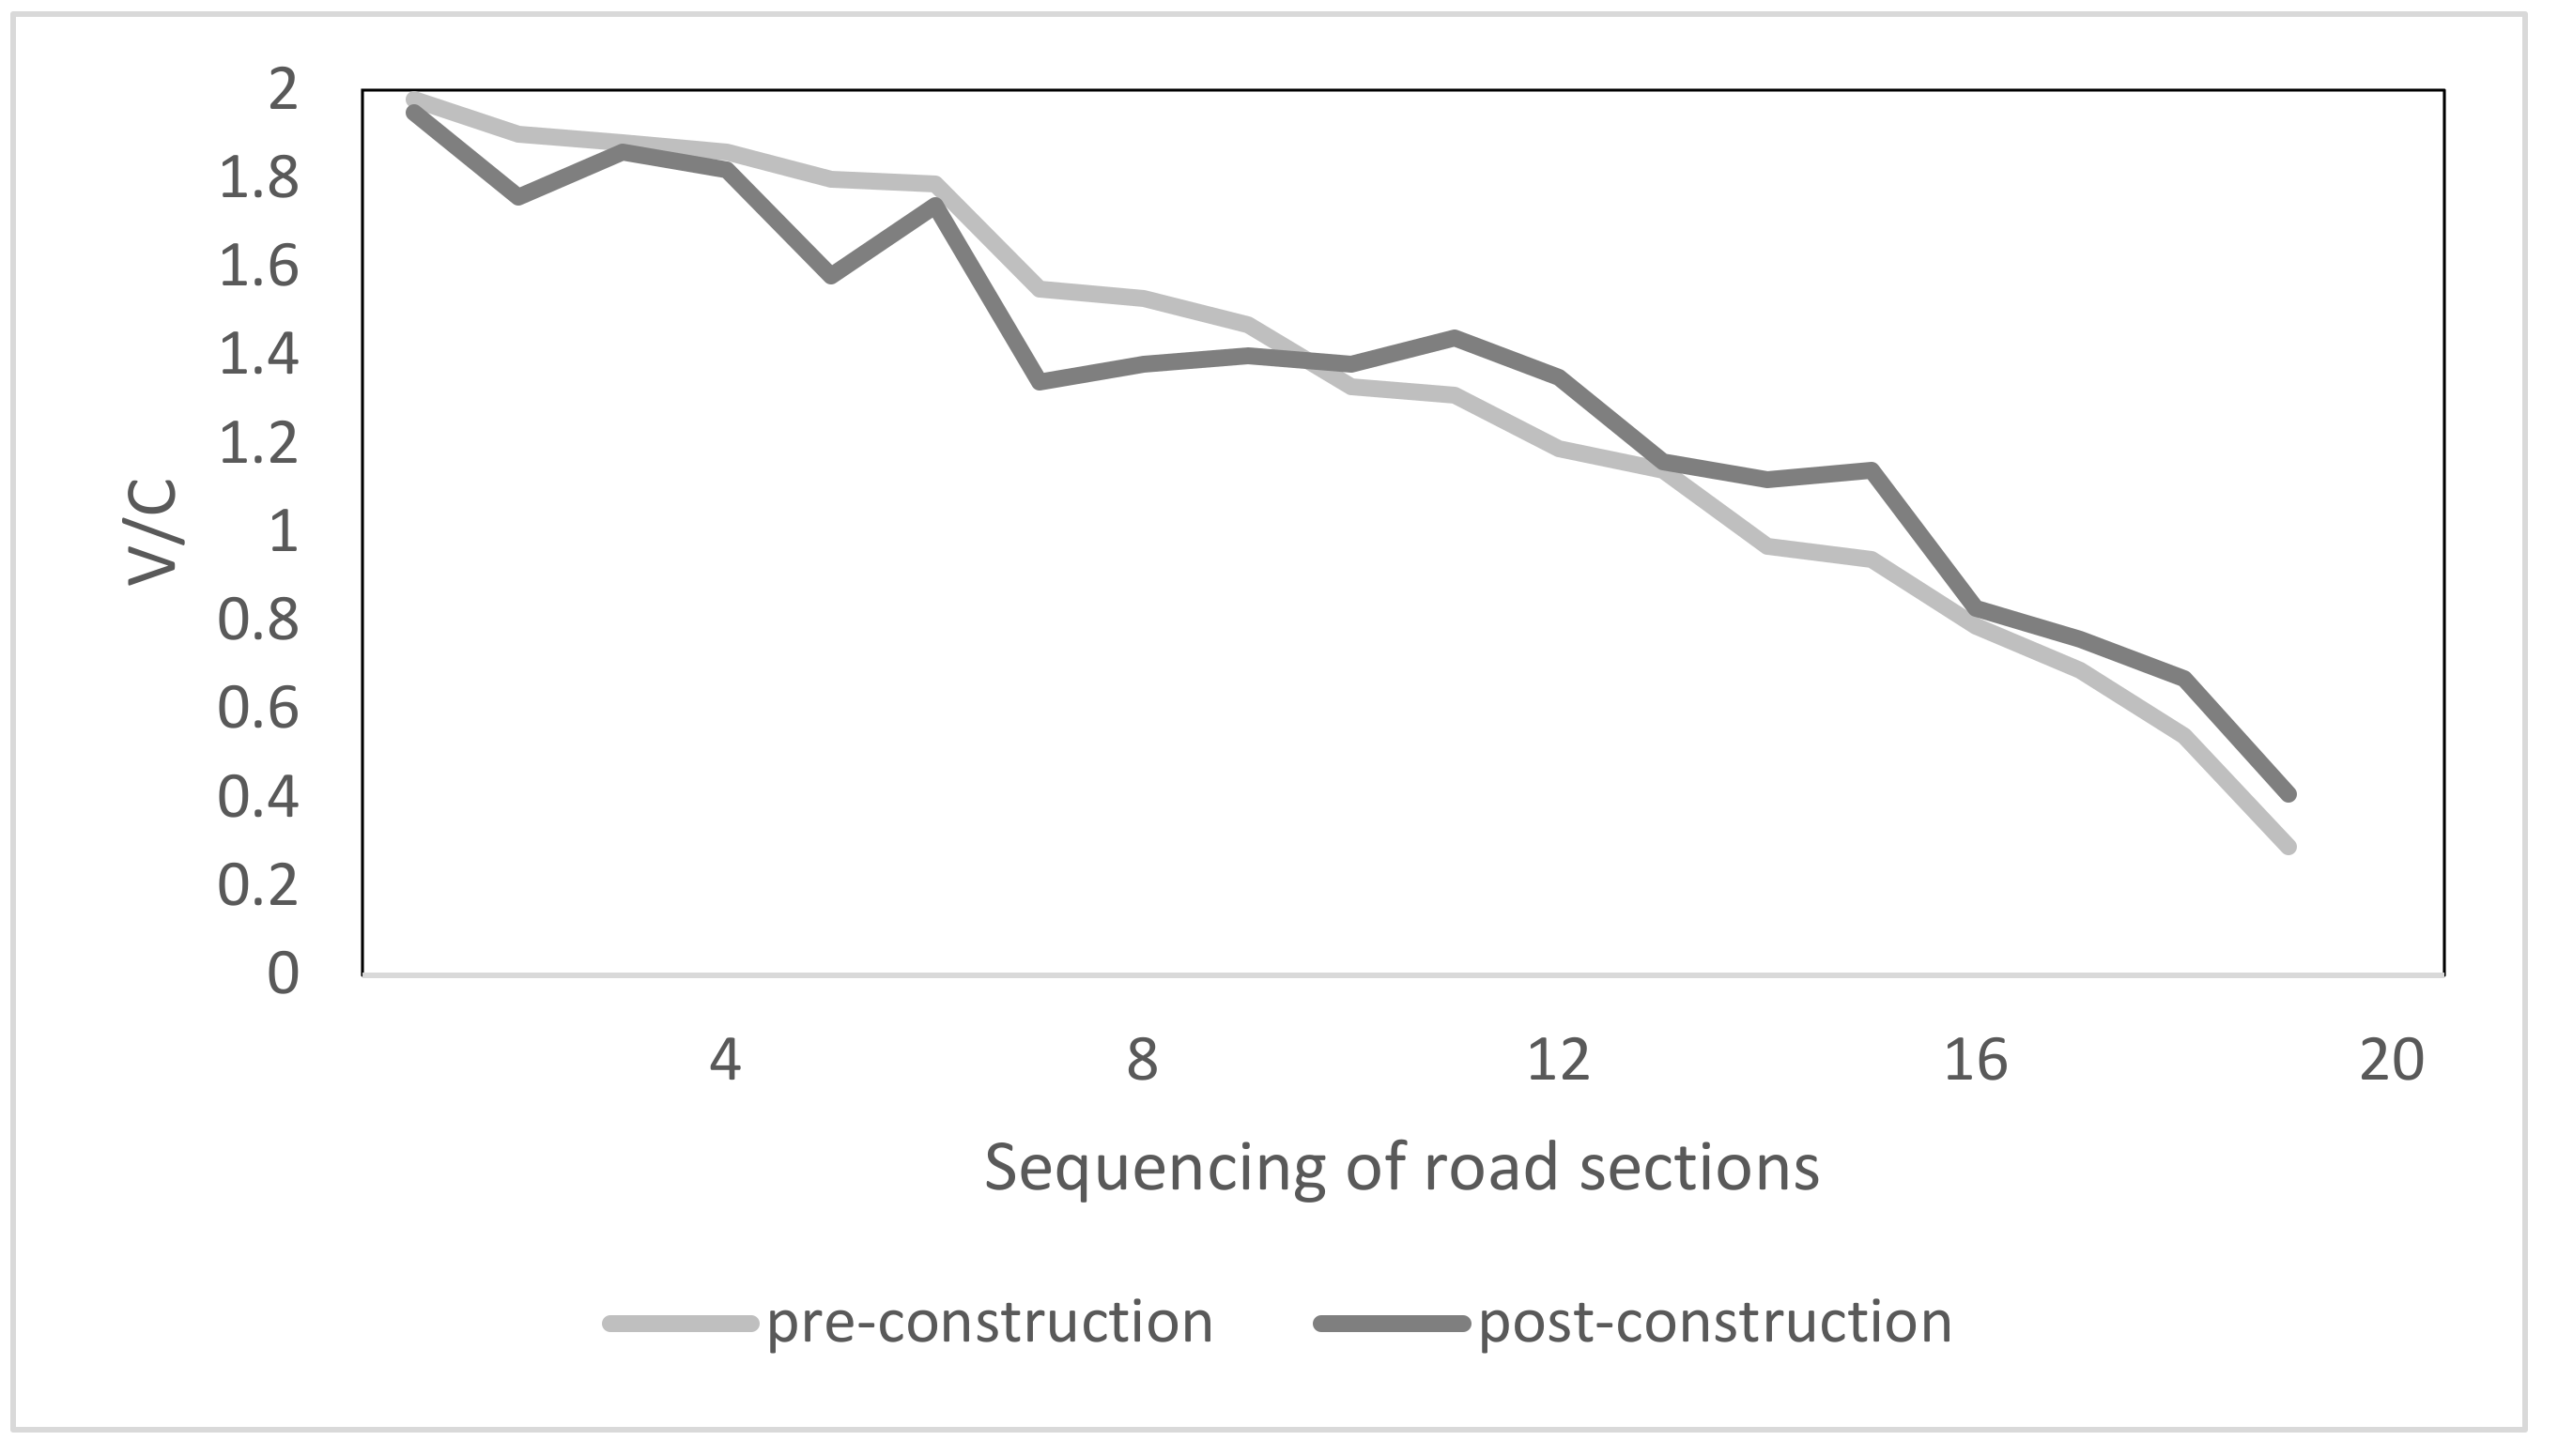
The values of saturation V/C (traffic flow to capacity ratio), for each road section before the installation of the lane are ranked from highest to lowest. The horizontal coordinate is the ranking number of the link. Then the V/C of each road section after the construction of the joint lane is compared with that before the construction, as shown in
Figure 6.
Joint dedicated lanes are utilized to optimize the network by balancing passenger flows between over-congested and over-sparse areas, as shown in
Figure 6.
The calculations yield the total system travel costs, transit user travel costs and CAV user travel costs for different scenarios and are shown in
Table 5 and
Figure 7.
According to
Table 5 and
Figure 7, it can be seen that the total system cost is reduced by 7.26%, the cost of travel for transit users by 7.51% and the cost of travel for CAV users by 7.44% compared to the period before the joint lanes were installed. It can therefore be seen that:
(1) The provision of joint dedicated lanes can reduce the total cost of the system and achieve optimization of the road network.
(2) The installation of joint dedicated lanes can effectively reduce the travel costs of bus users and CAV users and help to increase the sharing rate of buses and the penetration rate of CAVs.
5.3. Sensitivity Analysis
5.3.1. Frequency of Bus Departures
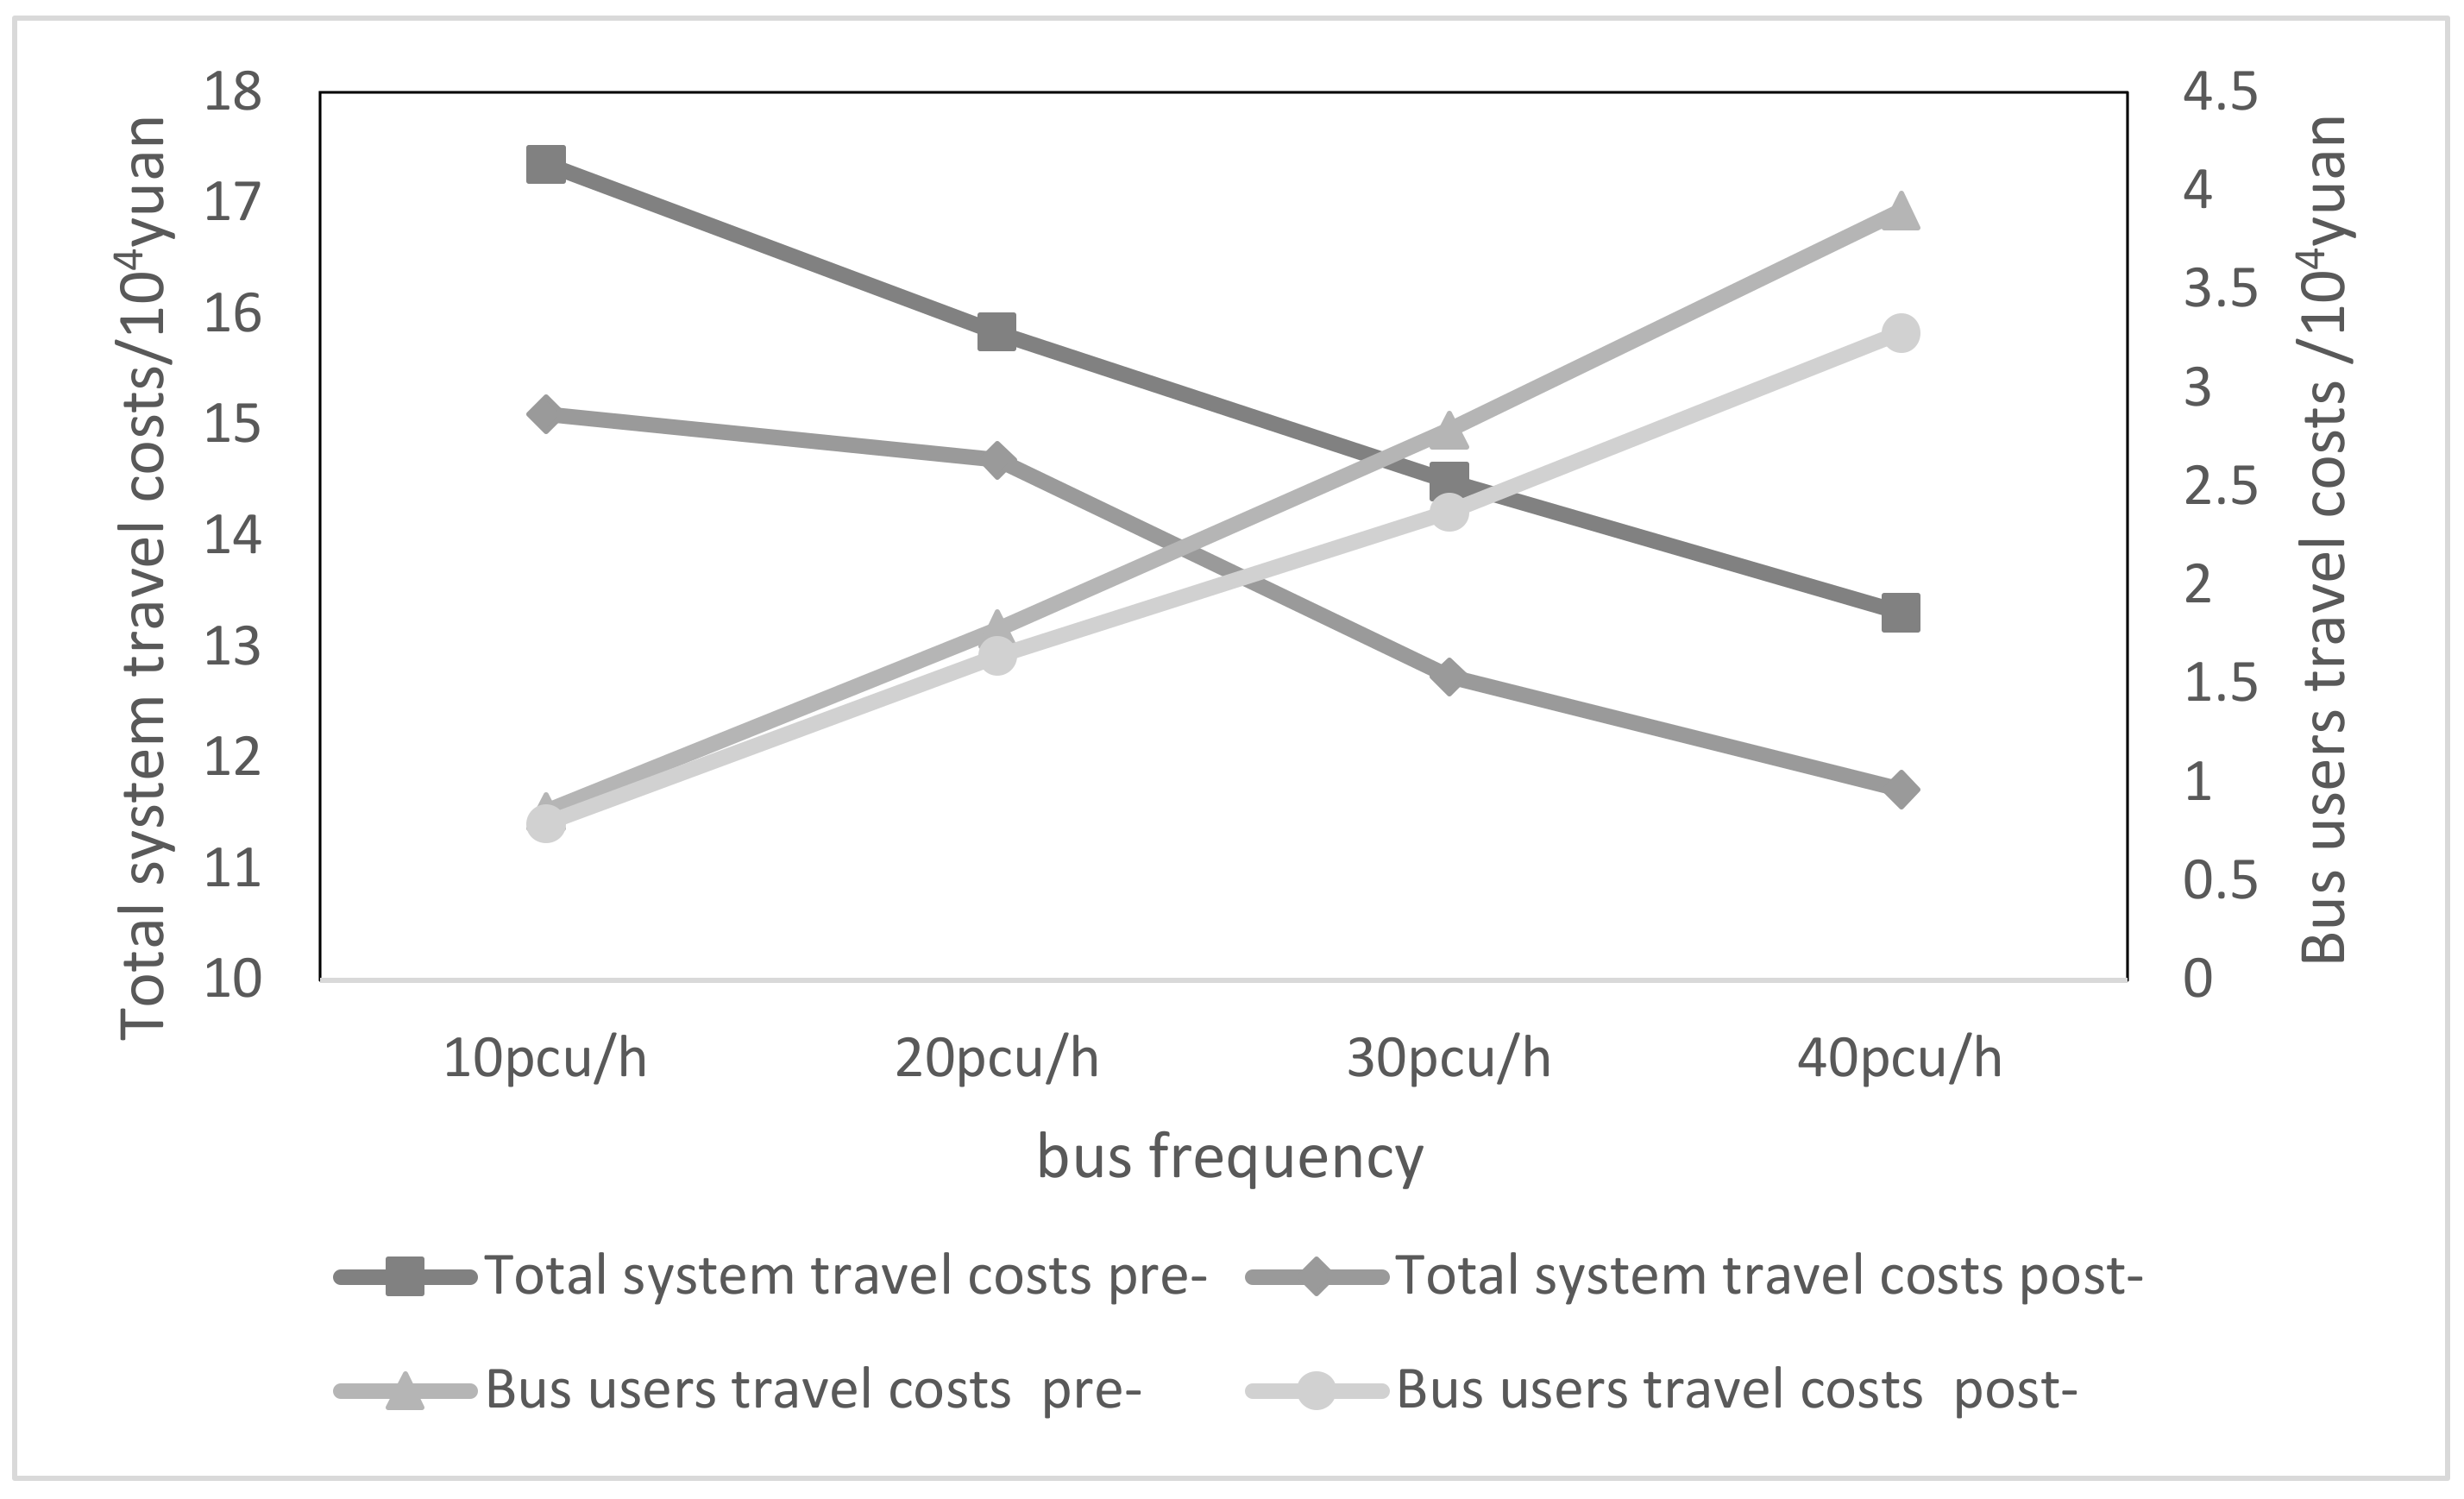
The frequency of bus departures determines the number of buses in the road network and also affects the average waiting time of bus users and their comfort level when travelling by bus, which in turn affects the travel cost of bus users and the total cost of the system. Therefore, four different bus departure frequencies are considered: 10 buses/h, 20 buses/h, 30 buses/h and 40 buses/h. The results of the calculation are shown in
Figure 8.
From
Figure 8 it can be seen as follows.
(1) A decrease in overall system costs and an increase in total bus costs will come from increasing the frequency of bus departures. Because the quality of bus service will improve as the frequency of bus departures rises, some conventional vehicle users will opt to travel by bus as a consequence. On the one hand, this transition optimizes the system and lowers the overall cost of travel; on the other hand, it changes the total cost composition and raises the total cost of bus users. However, it is not the case that an increase in bus departures all the time will always optimize the system. When the frequency of departures is too high, the gap between adjacent buses decreases, the maximum queue length for the CAV convoys will also be reduced, and the efficiency of the network link traffic will be reduced.
(2) The frequency of bus departures has a distinctly different impact on the total cost of the system and the total cost of the bus users, so the impact of the frequency of bus departures must be taken into account when planning joint lanes.
(3) Joint lanes can reduce the total cost of bus users to a certain extent due to the increase in frequency, i.e., they can effectively reduce the cost of individual bus trips and contribute to the increase in the bus share.
5.3.2. Penetration Rates of CAVs
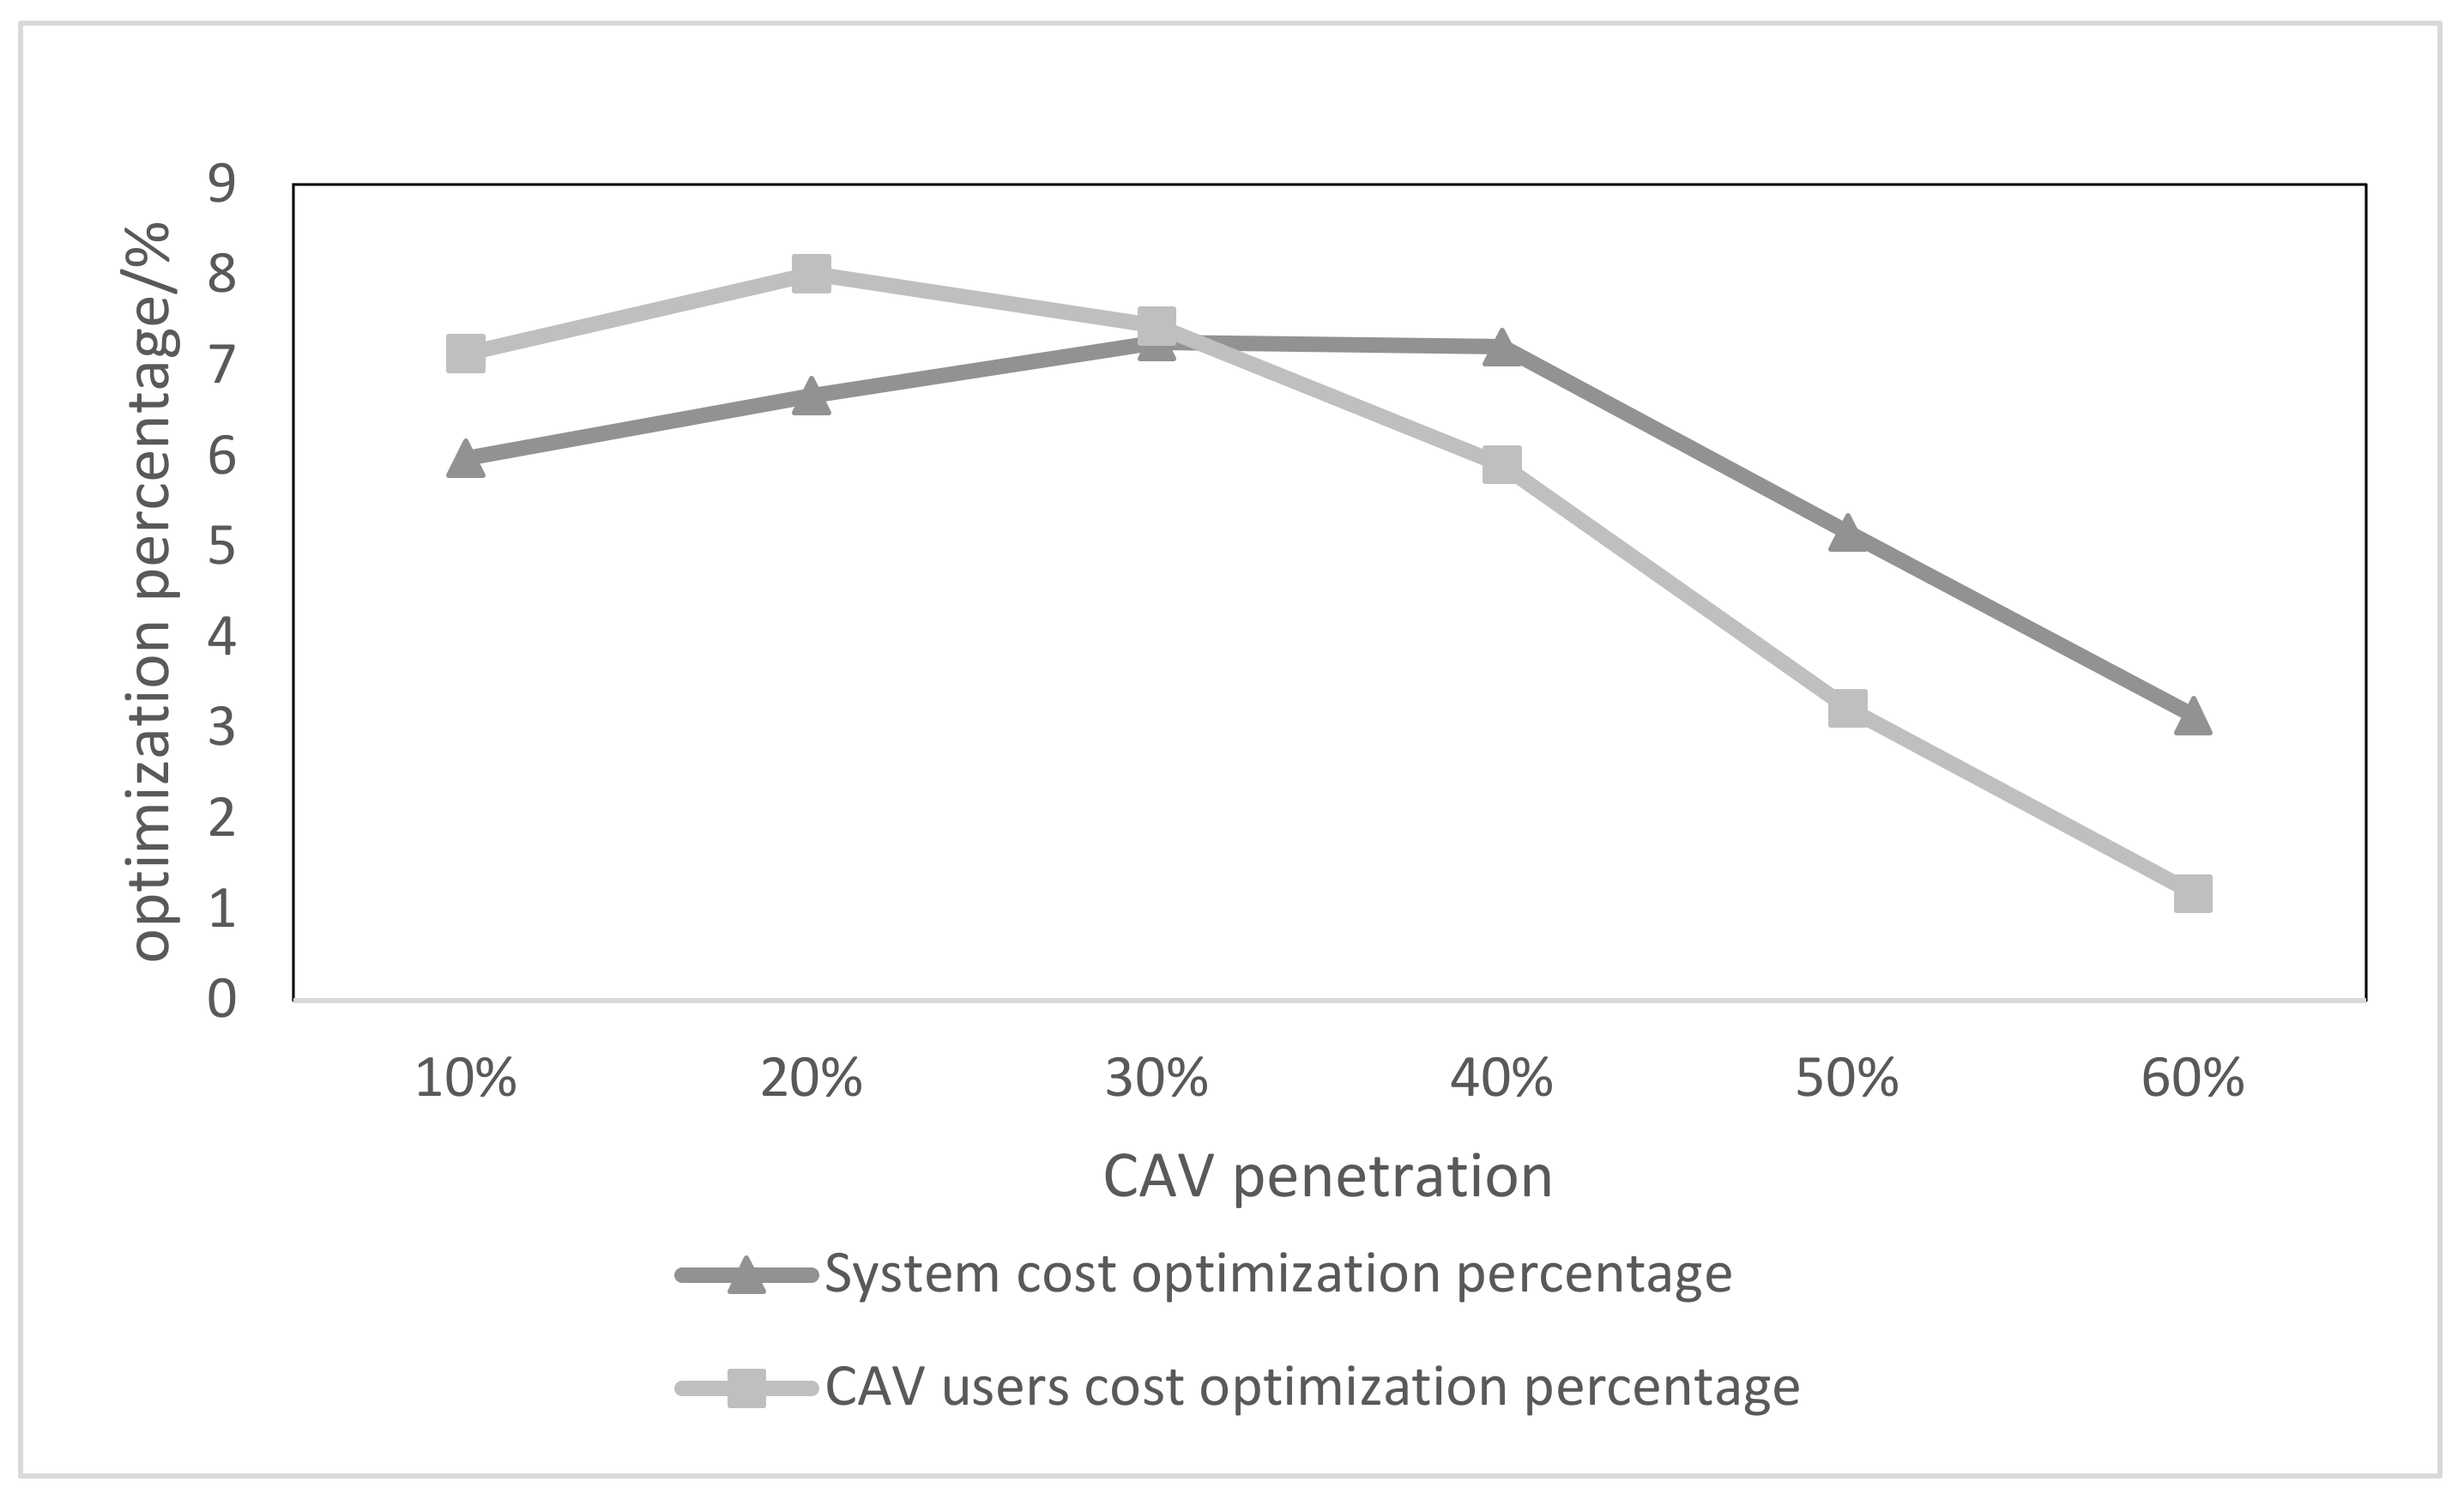
When the penetration rate is too low, building a joint lane may instead waste road resources, while when the penetration rate is too high, building a joint lane may make the joint lane too crowded and affect the normal passage of buses. Therefore, the penetration rates of CAVs were selected: 10, 20, 30, 40, 50 and 60%, and the optimization ratio (cost reduction ratio) when planning a joint lane was calculated as shown in
Figure 9.
When joint bus and CAV lanes are set up, the system optimization ratio and the CAV user optimization ratio both tend to increase and then decrease as the penetration rate of CAVs increases, but the two highest values are not synchronized. When the penetration rate is lower than 30%, the proportion of CAV user optimization is higher than the proportion of system optimization; when the penetration rate is higher than 40%, the proportion of system optimization is higher than the proportion of CAV user optimization. On the whole, when the penetration rate is below 40%, the planning and deployment of joint bus and net-associated vehicle lanes has a good optimization effect, and when the penetration rate is above 50%, the optimization effect will continue to decrease.
6. Conclusions
The planning approach for dedicated lanes on a road network with a mix of traffic, conventional vehicles, CAVs and buses, is investigated in this article. In this study, we propose a novel joint dedicated lane that allows buses and CAVs to travel simultaneously and develop a bi-level program model for the deployment of joint dedicated lanes.
We first evaluate the traffic features of heterogeneous traffic streams at the micro level, and then use the BPR function and certain mathematical derivations to determine the journey time of road sections under various mixed situations, from which the travel cost function of each mode is inferred. Whereas the lower-level model is an equilibrium issue based on the cost function, the upper-level model uses the joint dedicated lane deployment scheme as the decision variable, and the goal is to minimize the overall system travel cost. The diagonalized MSWA method is used to solve the lower level, while a genetic algorithm is used to solve the top level. The Nguyen–Dupuis network is utilized to validate the model solution, and it is also used to conduct a sensitivity analysis of the bus departure frequency and CAV penetration. The analysis leads to the following findings based on the preceding experiments.
(1) The creation of dedicated lanes for CAVs and buses can lower system travel costs and increase the road network’s operating efficiency. The joint lanes may efficiently optimize a road network with a mix of conventional vehicles, CAVs and buses, and this optimization is fundamentally done by balancing traffic between over-congested and over-sparse road portions, resulting in a decrease in system travel costs. Furthermore, the creation of shared lanes has been demonstrated to be helpful in lowering travel costs for all modes, particularly for networked automobile and transit users.
(2) Setting up joint lanes offers buses an independent right-of-way to travel without interference from conventional vehicles, lowering the overall cost of travel for bus riders, encouraging more people to take the bus, and increasing the bus’s share of the market. As the frequency of bus departures rises on the road network, it can minimize bus users’ waiting time as well as improve passenger comfort due to the crowding effect, lowering bus users’ travel costs. Because conventional vehicles and buses compete, some conventional vehicle users change to bus users, boosting the total cost of bus user trips. Nevertheless, the establishment of shared dedicated lanes can mitigate this negative feedback effect and assist in increasing the number of people who take the bus.
(3) Setting up joint dedicated lanes in the early stages of CAV development can lower CAV users’ travel costs and encourage additional CAVs to enter the road network. Joint dedicated lanes give CAVs a reasonably independent right-of-way to drive without interference from conventional vehicles. When the penetration rate of CAVs is low, as the penetration rate of CAVs grows, the optimization efficiency of joint dedicated lanes on CAV user cost and total system cost improves. But as the penetration rate of CAVs increases, the optimization efficiency begins to decline. As a result, it is preferable to build joint dedicated lanes at the start of CAV growth.
The suggested model can be explored and extended in future studies in the following ways:
(1) This model is based on the BPR function at the macro level, and future studies can employ simulation for more micro-level examination to determine the impact of CAVs on capacity under varied heterogeneous traffic stream circumstances.
(2) The range of proportions of CAVs deployed for joint dedicated lanes on networks with various topological properties needs to be considered.
(3) Regulated route choice has an impact on the individual travel experience of the CAV user, who is unable to pick the best route for himself and has to make some compromises for the system. It is worth taking it into account in future research.

