Article

Achieving Transformative Change in Food Consumption in Austria: A Survey on Opportunities and Obstacles

1
BioInvasions, Global Change, Macroecology Group, Department of Botany and Biodiversity Research, University of Vienna, 1030 Vienna, Austria
2
Environment Agency Austria, Spittelauer Lände 5, 1090 Vienna, Austria
*
Author to whom correspondence should be addressed.
Sustainability 2022, 14(14), 8685; https://doi.org/10.3390/su14148685
Submission received: 11 May 2022 / Revised: 1 July 2022 / Accepted: 8 July 2022 / Published: 15 July 2022
(This article belongs to the Section Sustainable Agriculture)

Abstract

:
Modern agriculture negatively impacts on global biodiversity by converting natural and extensively used habitats into intensely managed systems, and by releasing pollutants, including greenhouse gases. Since the demand for certain food products determines what is grown, consumer behavior is key to reduce food system related biodiversity losses. Here, we used an online survey targeting consumers in Austria to identify opportunities and barriers for consuming more sustainably. Respondents were split into two groups according to their affinity for nature conservation topics. In total, we received 320 completed responses, of which 264 participants described themselves as being concerned with environmental and conservation issues (called henceforth “nature conservation-affine”), while 56 participants identified themselves as distant to nature conservation (called henceforth “nature conservation-distant”). In general, the majority of respondents were concerned about aspects such as animal welfare or regionality when buying food. Split into the two above-mentioned groups, however, substantial differences emerged for most replies. For example, respondents from the nature conservation distant group had greater doubts about the advantages of organic food compared to conventionally produced food and frequently stated (45%) that they would rather not include biodiversity impacts in their food purchasing decisions. Similarly, we found a significantly greater willingness to buy vegetarian meat substitutes in the nature conservation affine group because of biodiversity and climate impacts of meat production. Overall, this study provides important insights into opportunities and obstacles for advancing sustainable food consumption from a consumer perspective; in particular, awareness of and affinity to conservation emerge as major factors on dietary preferences. Finally, we found that those individuals who are more interested in nature conservation issues are also more likely to be aware of how their diet affects biodiversity.

1. Introduction

Widespread biodiversity loss is recognized as one of the most critical environmental problems. Species extinction rates are several orders of magnitude higher than the pre-human background rate, with hundreds of anthropogenic vertebrate extinctions documented in prehistoric and historic times, justifying the claim that the Earth’s biota is entering a sixth “mass extinction” [1]. With regards to human impacts, agriculture is the largest contributor to biodiversity loss due to pervasive consequences for species of the expansion and intensification of land use worldwide [2].
Modern agriculture causes biodiversity loss by converting natural habitats into intensely managed systems, and by releasing pollutants, including greenhouse gases [3]. The expansion and intensification of agricultural activity is threatening a minimum of 5407 species—i.e., 62% of those listed by the IUCN as threatened or near-threatened [4]. Since the demand for certain food products determines what is grown, consumer behavior is key to prevent further land-use driven biodiversity loss. Unfortunately, the present food production, food supply, and food consumption systems do not align well with present and future human needs [5]. In order to meet the needs of a richer and more urbanized growing world population, food production and consumption must undergo a radical transformational change. This requires rethinking how food should be produced, processed, distributed, and consumed [6]. It was shown, for example, that the production of animal protein, owing to the area demand of cropland for feed, has a particularly high impact on biodiversity [7]. Consequently, shifting diets to reduce high levels of meat consumption is a key leverage point for tackling biodiversity loss and climate change. Globally, about 30% of current biodiversity loss and 15% of greenhouse gas emissions are linked to animal husbandry [8]. By adopting a vegetarian diet worldwide, the projected need for cropland in 2050 could be reduced by 600 million ha [8]. A shift to sustainable diets would further trigger upstream effects in agricultural produce processing chains. Thus, a set of steps has been identified as essential for making European diets more sustainable [9]: (i) raising the share of vegetables, pulses, grains and fruits; (ii) reducing meat and dairy products substantially; and (iii) organic products should be preferred over conventionally produced ones. Other factors essential for sustainable food systems are reducing food waste, consuming products seasonally and regionally, and reducing transport routes from the point of sale to home [9].
Here, we address opportunities and challenges for a transformative change towards sustainable dietary choices from the perspective of consumers in Austria. Specifically, we address the following research questions by using an online survey and by separating the target population into two contrasting groups in terms of their affinity to nature conservation issues. We then ask: (1) What does food consumption behavior look like and what are the main factors that determine it? (2) What are the main obstacles encountered by consumers that limit progress towards a transition to sustainable food consumption? (3) Which tools (e.g., labels, footprint information) could support a transformative change in food consumption? Given the disproportional strong impact of meat in diets on biodiversity [8], we placed a specific focus on assessing the role of meat and vegetarian alternatives to meat in diets.

2. Materials and Methods

2.1. Survey Design

We designed a nto five thematic blocks and contained a total of 23 questions (File S1 in Supplementary Materials). The thematic blocks were (i) patterns of food consumption (N = 4 questions), (ii) nutrition (N = 4), (iii) perceived environmental relevance of food consumption (N = 6), (iv) food consumption behavior during COVID-19 (N = 3), and (v) personal data (N = 6). We used a four-point Likert scale for elucidating respondents’ opinions about certain statements. For analyses, we divided the respondents into two groups based on their self-assessment of the final question of the survey (“Are you concerned with environmental protection or nature conservation?”). The answer options were: “Yes, I am involved in this professionally”, “Yes, my education is related to this”, “Yes, I deal with this in my free time”, “Yes, I take environmental protection and nature conservation into account in my everyday life”, “No, I do not deal with this”. The first four answer options were combined into one respondents group called “nature conservation-affine” (NA). Respondents who had selected the last answer option were assigned to the “nature conservation-distant” (ND) group.

2.2. Sampling Design

We applied the non-probability method of self-selective convenience sampling [10,11] which is widely used in socio-ecological research. We note that this type of sample selection has several limitations and therefore the sample must be considered as not necessarily representative of the target population (i.e., Austrian consumers), however, convenience sampling has many practical advantages (e.g., low cost; participation is possible for every member of the target population). Convenience sampling is particularly useful when stratified randomized sampling is not possible, e.g., because the sample is very large—as would be the case with the total population of Austria [12]. For the online survey, the software Limesurvey 3.21.1 was used, and the survey was made freely available on the internet. The survey was conducted in German language because the target group was people living in Austria. The survey was open from 14 December 2020 to 9 February 2021. The following social media have been used for distributing the survey: Facebook (https://www.facebook.com/, accessed on 15 February 2021), WhatsApp, and e-mail. As the convenience sampling method was used, we used specific channels of these media for distributing the survey. On Facebook, for example, the link to the survey was posted on the profile of the lead author and in several groups such as “Billa Österreich”, “Penny”, etc. A few participants were contacted directly via e-mail or chat message.

2.3. Scope and Questions of the Survey

In the opening section of the survey, we asked which aspects play a role in individual dietary preferences (File S1 in Supplementary Materials). Secondly, we investigated the dietary choices of respondents and the willingness to change these. Four questions dealt with the composition of the diet, with a focus on the role of meat and alternatives to meat in diets. This section included a question on whether vegetarian meat substitutes were known and whether consumers would be interested in buying these. Thirdly, six questions asked whether respondents bought organic or conventional products. Then, respondents were asked whether they would be interested in receiving information on the biodiversity footprint of food products and how such information should be presented. Finally, six questions asked for personal data of respondents (age, education, origin, gender) and interest in and attitude towards nature conservation.

2.4. Data Analysis

In total, 417 participants started the survey, of which 320 (77%) fully completed it. Non-completed surveys (N = 97) were excluded from analyses. Data was extracted from LimeSurvey at the end of the survey period and transferred to SPSS Statistics. For some questions, not all respondents provided answers as they could skip questions based on the answer given to a previous question. Thus, sample sizes are somewhat smaller than the total number of completed surveys for some questions. To analyze differences between both population groups (i.e., NA versus ND), we tested for statistically significant differences of replies by using chi-squared tests [13] for nominal scale response variables and Mann–Whitney U-tests [14] for ordinal scale ones. Analyses were done with SPSS Statistics.

3. Results

3.1. Distribution of Participants across Groups

Participants of the survey (N = 320) were mostly female (70%) with a primary residence in cities with populations greater than 100,000 (51%). Age groups were well distributed across respondents, with the largest proportion (34%) being 20 to 29 years old. In terms of education, the highest level completed was an academic degree for 34% of the participants, a high school degree for 44%, with most others having completed an apprenticeship. Respondents’ residence was dominantly the Federal State of Vienna (52%), and the states of Lower Austria (20%) and Burgenland (15%) were also well represented. A total of 51% of participants stated that they reside in a municipality of >100,000 inhabitants; 25% specified the size of their municipality as 2001 to 100,000 inhabitants.
A total of 264 participants (83%) classified themselves as concerned with environmental and nature conservation issues. These respondents specified that they were professionally (N = 39 cases), as part of their education (N = 56), recreationally (N = 120), or in their everyday life (N = 212) involved in environmental or nature conservation (many respondents selected more than one of these four options—16 even selected all four) and were thus considered to be nature conservation affine (NA). On the other hand, 56 participants (18%) were nature conservation distant (ND), i.e., they did not concern themselves with nature conservation issues. We visually inspected differences between replies of different population groups, such as comparing male/female or urban/rural, but differences were small and are not presented here.

3.1.1. General Results

The first question inquired about the place where the respondents’ usually buy their food. As three response options were given, a total number of 624 answers were obtained from the 320 respondents. Of these, 313 respondents bought their food in supermarkets or discount stores (50% of the answers, 97% of the participants), while 116 respondents bought it organic or health food stores (19% of the answers, 36% of the participants) (Figure 1). A total of 86 respondents indicated that they buy at least part of their food at markets (14% of the answers, 27% of the participants) and 58 respondents buy directly from farmers (9% of the answers, 18% of the participants). All answer options that had to do with orders at delivery services, as well as the category “other”, were chosen rarely.

3.1.2. Results for the Total Sample

For 93% of the respondents, it was important or very important that food production takes animal welfare into account, and for 92% of respondents that it is produced in Austria (Figure 2). When asked about their diet, the largest proportion of respondents (85%) stated to eat meat, of which 49% ate meat several times a week and 10% did so daily (Figure 3). Some 6% of the respondents were vegan, 4% were vegetarian, and 3% pescetarian.

3.2. Comparison among Groups with Different Affinity to Nature Conservation

In the following, we compare the replies from the nature affine (NA) respondents with those from the nature distant (ND) ones. On reducing meat consumption, some differences emerged between the replies of both groups (Figure 4). The answer option “I would reduce my meat consumption if the associated climate impact were pointed out on the packaging”, achieved the highest value within the NA group (17%), but at the same time the lowest value for the ND group (7%); this difference is significant (chi-square test: χ2(1) = 6.619; p = 0.01). In contrast, the highest value for the ND group was for the answer option “I do not want to reduce my meat consumption” (23%), and this was again significantly different from the NA group (chi-square test: χ2(1) = 4.457; p = 0.035). It is worth mentioning that the answer option “I would reduce my meat consumption if there were better meat-free alternatives” was selected by a share of 16% for both groups.
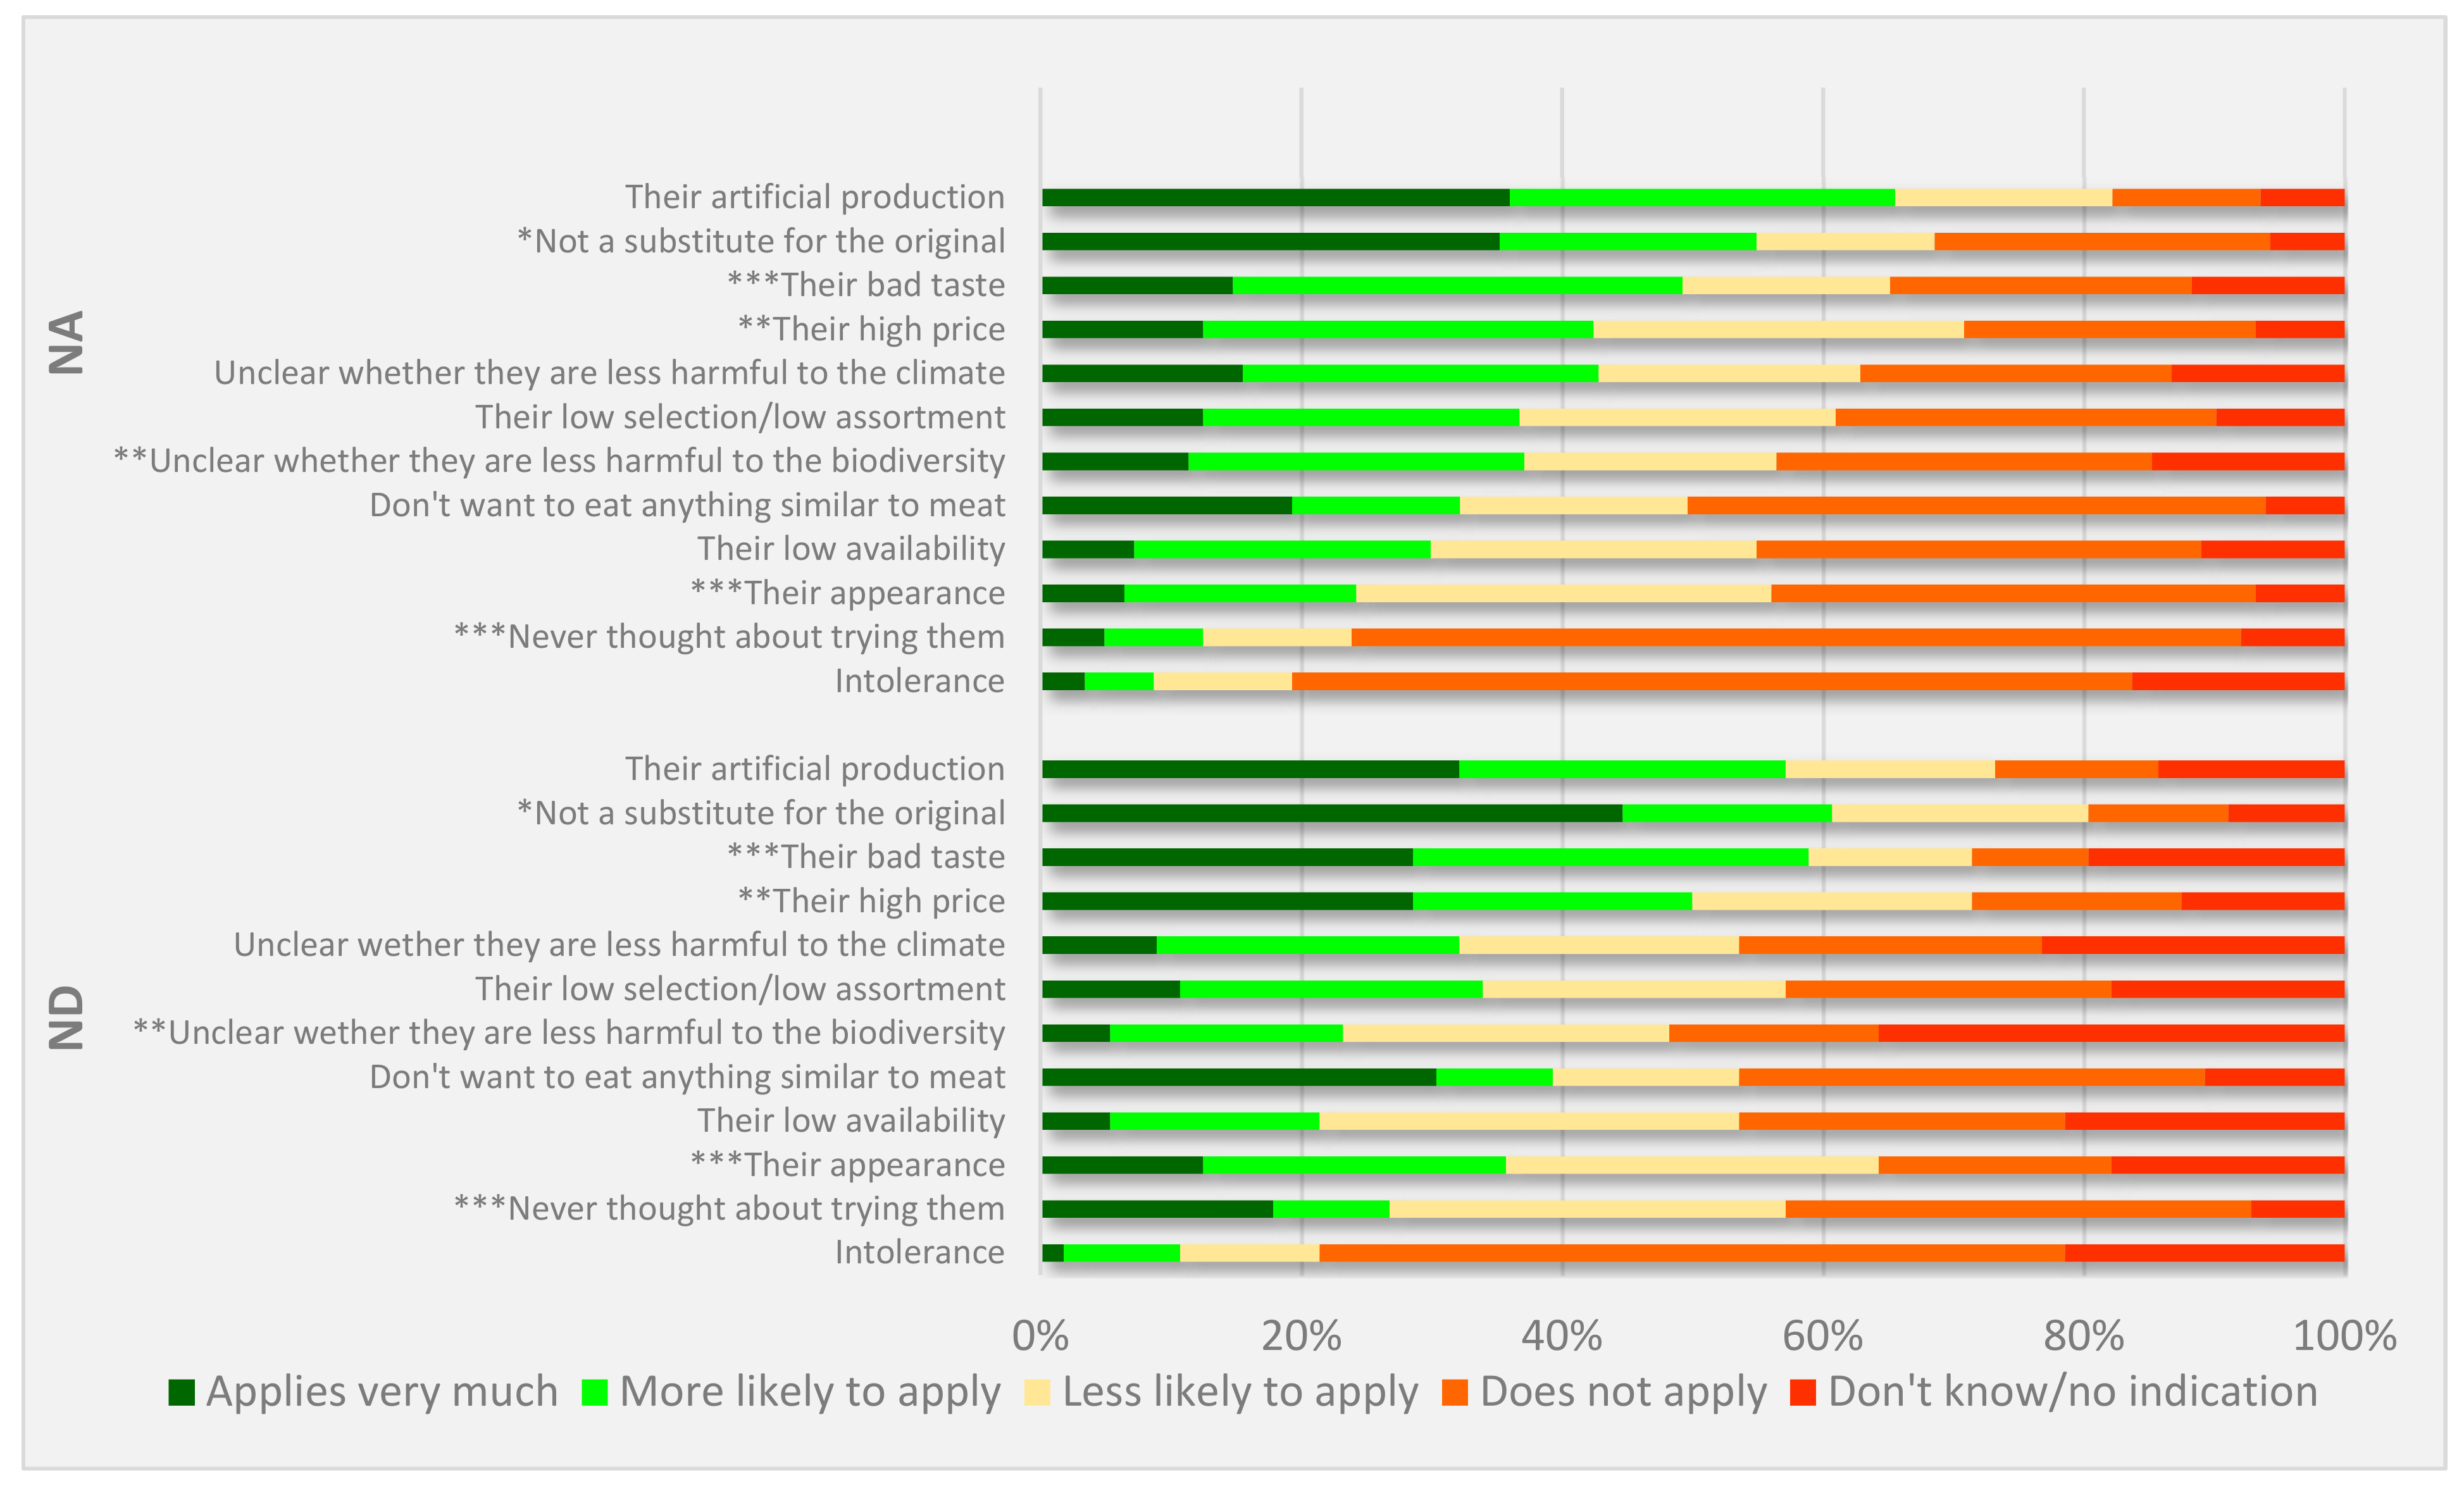
The question why respondents do not buy (more often) vegetarian meat substitutes again highlighted differences between both groups (Figure 5). The answer option “Because it is unclear whether they are less harmful to biodiversity than meat” showed particularly strong differences between groups (Mann–Whitney U test: z = −2.45; p = 0.014), with a total of 37% of the NA group selecting the response options “Applies very much” and “More likely to apply”, compared to only 23% of the ND group. In contrast, no significant differences were found between groups for the option “Because it is unclear whether they are less harmful to the climate than meat” (Mann–Whitney U test: z = −0.50; p > 0.05). Further, there were significant differences among the two groups regarding the option “Their high price”: only 13% of the NA group selected “Applies very much”, compared to 29% of the ND group (Mann–Whitney U test: z = −2.57; p = 0.010). In addition to these factors, the following answer options were also selected significantly more often by the ND group: “Never thought about trying them” (Mann–Whitney U test: z = −4.04; p < 0.001), “Their appearance” (Mann–Whitney U test: z = −3.68; p < 0.001), “Their bad taste” (Mann–Whitney U test: z = −3.29; p = 0.010) and “Not a substitute for the original” (Mann–Whitney U test: z = −2.10; p = 0.036).
Differences between both target groups also occurred for the question about what discourages respondents from buying organic food (Figure 6). Both groups selected “Applies very much” and “More likely to apply” answers more often for the option “There is a wider choice in the conventional products” (NA: 16%, 42%; ND: 23%, 61%), whereas the ND group also selected these answers more frequently for the option “The conventional product is cheaper” (30%, 41%). This was not the case for the NA group; these individuals used the mentioned response options significantly less often and had their focus on the selection of “Less likely to apply” and “Does not apply” (Mann–Whitney U test: z = −3.103; p = 0.002). In the NA group, the answer option that gained the second most agreement was: “The organic product is not available where I shop” (“Applies very much”: 16%, “More likely to apply”: 61%). This again differs significantly from the ND group where less agreement was obtained (Mann–Whitney U test: z = 2.528; p = 0.011). The response option “I generally doubt the advantages of organic food over conventional products” received the least agreement from both groups (NA: “Applies very much” = 2%, “More likely to apply” = 6%; ND: “Applies very much” = 14%, “More likely to apply” = 16%), but even here differences between the two groups could still be detected, with the group “nature conservation-distant” stating agreement more often (Mann–Whitney U test: z = −3.749; p < 0.001).
When asked about the relevance of a biodiversity footprint for food purchasing decisions, a very different picture emerged between the groups (Figure 7). The NA group gave strong agreement to including such a biodiversity footprint (“Fully consider” = 25%, “Perhaps consider” = 63%), while the ND group significantly more often (Mann–Whitney U test: z = 6.353; p < 0.001) chose the other answer options (“Rather not consider” = 45%, “Not consider at all” = 11%). A very differentiated opinion emerged even within the ND group as 25 respondents from this group were positively inclined towards the biodiversity footprint, while 31 persons would rather reject it.
Regarding the form of presenting a biodiversity footprint, the answer “certification” was frequently selected by both groups (48%) (Figure 8). For the ND group, this answer was chosen the most often, while this was the case with the answer “key figures” (53%) for the NA group. In the ND group, however, only 29% selected this answer, which corresponds to a significant difference between the groups (chi-square test: χ2(1) = 10.726; p = 0.001). Significant differences were also found for the answers “illustrations” (chi-square test: χ2(1) = 5.175; p = 0.023) and “website” (chi-square test: χ2(1) = 4.812; p = 0.028), both of which were selected more often by the NA group (25% and 19%) than by the ND group (11% and 7%). Both groups selected the answer “Biodiversity footprint should not be presented separately, but should be integrated into other data” in very small proportions (NA: 6%, ND: 11%), and no significant difference was found among the groups here (chi-square test: χ2(1) = 1.266; p > 0.05).

4. Discussion

4.1. Food Consumption Patterns in Austria

Most of the respondents of this survey buy from conventional supermarkets or discounters. Furthermore, the majority of respondents stated that aspects such as environmental protection and animal welfare were of importance when it comes to food consumption. Animal welfare was the answer option that was selected the most often. Nevertheless, few respondents indicated that they would be willing to reduce their meat consumption due to animal suffering.
According to two recent studies, the proportion of vegetarians is 4% and vegans is 2% in the Austrian population [15,16]. In our survey, the share of vegetarians (4%) and vegans (6%) is slightly higher than in the national population. These minor differences might be caused by the high proportion of respondents in our sample who are aware of nature conservation issues. This is consistent with a recently published study that suggested a positive relationship between knowledge of the effects of dietary choices on biodiversity and dietary preferences [17]. It can therefore be assumed that those individuals of the population who are intrinsically more interested in nature conservation issues are also more likely to be aware of how their diet affects biodiversity. Similarly, another study found that knowledge about climate change is related to reduced meat consumption [18]. On the other hand, the same study also showed that health concerns, such as information about the higher risk of heart and cancer diseases due to high levels of meat consumption, lead to a much stronger reduction in meat consumption.

4.2. Obstacles to Transformative Change in Food Consumption

The majority of respondents do not consider it important whether a food product is endowed with a label or not. For example, only 15% indicated that they would “rather not consider” the biodiversity footprint and 5% would “not consider it at all” in their purchasing decisions. This is consistent with findings from Germany [19,20] and seems to relate to a mistrust of consumers to such labels [21,22]. However, this mistrust has decreased over time, as a recent consumer survey has revealed [23]. Among other things, German consumers were asked about the importance of quality labels on food, and it was shown that trust in quality labels has increased by a total of 11% compared to 2017. Along with trust, the proportion of purchase decisions for which quality labels are taken into account, has risen by 12%. As in our study, the concerns of the usefulness of labels was particularly high in the ND group, it is likely that the concept of the biodiversity footprint was either not fully appreciated, or the respondents did not care whether a label was available or not. This is in line with the findings of a German study that showed that trust in a label as well as willingness to buy increases after participants in a survey have received more information about a label [20]. In addition, it has been shown that “ […] labels are the primary source of consumer trust […], but these labels must be noticed and understood before consumers will actively seek them out” [24].
In addition to the credibility of such labels, the form of presentation is also relevant to consumers’ purchasing decisions. The two most popular forms of presentation for a biodiversity footprint were certification and presenting key figures. This is not consistent with other studies, which found that respondents mostly wanted text as the form of presentation [20]. For the majority of the respondents in our study, it was important that the biodiversity footprint should be presented independently and not be integrated into a more generic environmental impact indicator. This is not in line with the findings from Rupprecht and colleagues [25], who argue that there are many different labels on the market, which makes it difficult for consumers to recognize which information can be trusted and which cannot. Accessibility—i.e., the availability of certain foods at the location of grocery shopping and sufficient assortment of products—was identified as the second major barrier to survey participants’ food consumption decisions.
Vegetarian meat substitutes have gained substantial public interest in recent years. A total of 23% of the respondents in this study consider plant-based substitutes a good alternative for meat products. Nevertheless, the majority of the respondents indicated that they would consider a reduction in meat consumption if better vegetarian meat substitutes were available. This also coincides with the notion that currently sold products are not fully accepted as a substitute for the original (i.e., meat). According to a recent report of the German Federal Environmental Agency [26], the amount of 1.2 million Google searches in Germany in 2018 indicates an increase in the interest in meat substitutes. This trend report also investigated the acceptance of vegetarian meat substitutes with similar results as in our study. The participants perception that there are not enough suitable alternatives to meat products can be explained by the fact that meat substitutes have only recently come to the fore. This goes along with another major obstacle, i.e., the technical means of production of those substitutes. This was often cited as a barrier by the respondents in this study. Other studies [27] have previously reported on consumer concerns regarding the means of producing such substitutes. However, there is consensus in several studies, e.g., [27,28], that such meat substitutes are rapidly becoming more popular.
Regarding the purchase of organic products, respondents selected two major reasons for deciding against buying these: The first one was unavailability at the place of grocery shopping. Since the majority of respondents indicated that they purchase at least part of their food in supermarkets, it can be assumed that the supply in supermarkets is regarded as insufficient. The related second reason was the wider choice in conventional products. These results were rarely highlighted in previous studies. Instead, the reasons which were most often mentioned against a purchase decision of organic food were high price [29,30,31] and lack of consumer awareness and motivation [32].
Monetary aspects in the form of food prices [33] as well as in the form of the income of the respondents [34] are an essential factor on dietary choices. This is in line with our results, whereby the ND group in particular stated that organic products are often too expensive. However, several studies have shown that food consumption preferences are complex and cannot be explained by monetary aspects alone. For example, Buder and Hamm [35] showed that socio-economic factors such as income hardly play a role for buying organic food. This is supported by Visschers et al. [36], who found that both the product price and household income do not influence the purchase of organic food. Our results also align well with this finding, as only 18% of the respondents stated that they would reduce their meat consumption if meat would be more expensive.
In terms of food consumption, we found major differences between the NA and the ND groups (e.g., in consideration of a biodiversity footprint and willingness to reduce meat consumption due to climate change and biodiversity impacts). These results support findings from the literature which suggest that there is a strong relationship between environmental attitudes and dietary choices. According to these findings, consumers with a high environmental awareness are more likely to change their behavior to protect the environment [37]. Visschers et al. [36] found that attitudes toward environment protection were actually the strongest predictor of environmentally friendly food purchasing behavior. A weak positive correlation between purchasing behavior and environmental awareness was also shown [36].
Compared to other factors such as income, age, and gender having significant effects on people’s diet, Pack [38] stated that “the educational level is seen as the strongest determinant, because education is a precondition for the understanding of health and environmental-related information”. It is also often discussed that there is a connection between the aspects of income, education, and nature conservation-friendly behavior. Since in this study the ND group stated significantly more often that they would not buy organic products due to their higher prices, such interrelatedness of factors can also be assumed. For example, Schäufele and Hamm [39] indicated that positive attitudes towards topics such as “environmental protection” and “sustainable consumption” lead to more organic products being purchased. Likewise, it was shown that buyers of organic food were more highly educated and received a higher income. Another example are the findings of Stolz et al. (2017): respondents with a higher level of education more often indicated that they buy organic products, income groups differ significantly from each other, and the contribution to environmental protection was seen as an essential aspect when buying organic food [40]. These findings can be seen as an explanation for our results.

5. Conclusions

This survey identifies several important factors that are essential for dietary decisions. In general, various policy instruments can influence consumers’ decisions, and these can be divided into three groups: economic, regulatory, and social instruments. Depending on the goal of the policy instruments and the target population, different instruments should be employed in concert [38]. Based on our results, three essential instruments can be identified. First of all, raising public awareness is of particular importance. This is reflected especially in the answers given by the ND group. This suggests that it makes a big difference to what extent consumers are familiar with the issues of nature and environmental protection and that individuals need to have adequate knowledge. This goal could be supported by campaigns promoting a more environmentally sustainable diet and informing consumers about the environmental impacts of their food consumption patterns. Two things must be taken into account here: (1) Most effective forms of information can vary depending on who should be addressed (e.g., different media) and (2) a large part of the Austrian population cannot be reached with nature conservation arguments. Within this study, the ND group indicated that only 11% of them would be willing to reduce meat consumption due to climate change and biodiversity loss issues. This is consistent with the findings of Sanchez-Sabate and Sabaté [41] that the population of highly industrialized affluent countries is not willing to reduce meat consumption for environmental concerns. For this target group, it would be crucial to raise their awareness on how functional ecosystems also benefit their own wellbeing, e.g., via ecosystem services. To further reduce meat consumption, raising awareness about health aspects regarding meat consumption should also be achieved. In line with this, it is important to improve the rather poor image of vegetarian meat substitutes by highlighting the advantages (e.g., health promotion, environment, and animal welfare) of these products over meat consumption. The same applies when comparing conventional and organic products. In its work program, the Austrian sustainability strategy [42] is already heading this way, for example, by further expanding a web portal (www.bewusstkaufen.at, accessed on 13 March 2021) for sustainable consumption, as an information and networking platform which offers consumers a more complete overview of the product range and increases awareness for sustainable consumption. When it comes to public education, it is important to consider that there is a substantial attitude–behavior gap. This means that people do not always act the same way in everyday life as they claim to in surveys. There are several reasons for this gap between attitude and behavior. Farjam et al. [43] mention, for instance, that the effect of environmental attitude on contributions, while positive in principle, depends on the cost of such behavior. Further underlying factors are personal norms and utilitarian values of the respondents [44] and if an issue is mentally connected with other aspects, such as health concerns [45]. That said, raising concern may have positive effects, for instance, by increasing support for more ambitious environmental policies [43], but other instruments are also required.
Secondly, it is essential to make product information available to consumers, e.g., via product labels. The lack of trust in those labels was recognized as a major problem. To increase trust, it is important that labels are certified from independent institutions [21]. Jahn et al. [46] state that trust in quality labels heavily depends on the type of external audits and their implementation. In contrast to so-called self-proclaimed labels, it is important that independent labels are verified by institutions such as NGOs. Because of this independent approval, the ability to lead to higher credibility results in a competitive advantage [47]. Rupprecht and colleagues [25] found that so-called “expert labels” are rated as very trustworthy by the population. Thus, independent third parties—whether in the form of scientific experts or institutions—could provide a trustworthy source and ensure that confidence in seals increases.
Thirdly, it is desirable to increase the supply of sustainable products. For example, a large proportion of the respondents stated that they would be willing to consume alternative products to meat, but that the technical way of production (e.g., adding additives) would discourage them. Since such products are only just emerging, great potential is seen here for expanding the variety of products. According to a study by the German Environment Agency [26], however, Europe is already the largest market for vegetarian meat substitute products. In this study, it is mentioned that this has been particularly evident since 2010 in the increased number of product launches, with around 470 new products being brought onto the market in Europe in 2016. Furthermore, the consumption of vegetarian meat substitutes in Germany is increasing, but its market volume is still small compared to that of the meat industry (6% in 2017). Because the respondents stated that organic products were not available at their preferred place of grocery shopping, it would be an important step to increase the variety of organic products by adding more of them to the assortment. However, both retail food stores and discounters have substantially increased their range of organic products in recent years. For instance, the managing director of one of the largest Austrian discounters announced in an interview that the organic range was doubled to 140 products from autumn 2020 to spring 2021 [47]. At the same time, RollAMA [47] announced in a press release that the organic share of groceries in the food retail sector has been increasing continuously for years and reached a double-digit value for the first time in June 2020 with ten percent. Milk and eggs account for the highest organic share in Austrian food retailers.
To conclude, our study provides important insights into opportunities and obstacles for advancing towards sustainable food consumption from a consumer perspective. It shows that awareness of and affinity to conservation issues is a major factor in food purchase decisions. In particular, we found that individuals who are more interested in nature conservation issues are also more likely to be aware of how their diet affects biodiversity.

Supplementary Materials

The following supporting information can be downloaded at: https://www.mdpi.com/article/10.3390/su14148685/s1. File S1. Structure and questions of the online survey.

Author Contributions

V.H. and S.S. conceptualized the study, V.H. analyzed the data and led the writing. V.H., F.E., K.P.Z. and S.S. discussed the results and contributed to the writing, K.P.Z. performed additional analyses. All authors have read and agreed to the published version of the manuscript.

Funding

The contributions by F.E., K.P.Z. and S.S. were funded by the Austrian Climate and Energy Fund within the framework of the “ACRP” Program (Project “Conservation under Climate Change: Challenges, Constraints and Solutions”; Number KR17AC0K13678). F.E. appreciates funding by the BiodivERsA—Belmont Forum Project “AlienScenarios” (FWF project no I 4011-B32). Open Access Funding by the Austrian Science Fund (FWF).

Institutional Review Board Statement

Not applicable.

Informed Consent Statement

Informed consent was obtained from all subjects involved in this study and anonymity was guaranteed.

Data Availability Statement

Data are available on request from the lead or senior authors of the study.

Acknowledgments

We are grateful for all experts who have supported this study by completing the survey. Open Access Funding by the Austrian Science Fund (FWF).

Conflicts of Interest

The authors declare no conflict of interest.

References

  1. Ceballos, G.; Ehrlich, P.R.; Barnosky, A.D.; García, A.; Pringle, R.M.; Palmer, T.M. Accelerated modern human–induced species losses: Entering the sixth mass extinction. Sci. Adv. 2015, 1, e1400253. [Google Scholar] [CrossRef] [PubMed] [Green Version]
  2. Díaz, S.; Settele, J.; Brondízio, E.S.; Ngo, H.T.; Guèze, M.; Agard, J.; Arneth, A.; Balvanera, P.; Brauman, K.A.; Butchart, S.H.M.; et al. Summary for Policymakers of the Global Assessment Report on Biodiversity and Ecosystem Services of the Intergovernmental Science-Policy Platform on Biodiversity and Ecosystem Services; IPBES Secretariat: Bonn, Germany, 2019; p. 56. [Google Scholar]
  3. Dudley, N.; Alexander, S. Agriculture and biodiversity: A review. Biodiversity 2017, 18, 45–49. [Google Scholar] [CrossRef]
  4. Maxwell, S.L.; Fuller, R.A.; Brooks, T.M.; Watson, J.E. Biodiversity: The ravages of guns, nets and bulldozers. Nature 2016, 536, 143–145. [Google Scholar] [CrossRef] [PubMed]
  5. Lairon, D. Biodiversity and sustainable nutrition with a food-based approach. In Sustainable Diets and Biodiversity; Burlingame, B., Dernini, S., Eds.; Food and Agriculture Organization of the United Nations: Rome, Italy, 2012; pp. 31–35. [Google Scholar]
  6. Ferranti, P.; Berry, E.; Jock, A. Encyclopedia of Food Security and Sustainability: General and Global Situation; Elsevier: Amsterdam, The Netherlands, 2018. [Google Scholar]
  7. Wilting, H.C.; Schipper, A.M.; Bakkenes, M.; Meijer, J.R.; Huijbregts, M.A. Quantifying biodiversity losses due to human consumption: A global-scale footprint analysis. Environ. Sci. Technol. 2017, 51, 3298–3306. [Google Scholar] [CrossRef]
  8. Stoll-Kleemann, S.M.; Schmidt, U.J. Reducing meat consumption in developed and transition countries to counter climate change and biodiversity loss: A review of influence factors. Reg. Environ. Change 2017, 17, 1261–1277. [Google Scholar] [CrossRef] [Green Version]
  9. De Schutter, L.; Bruckner, M.; Giljum, S. Achtung: Heiß und Fettig—Klima & Ernährung in Österreich—Auswirkungen der Österreichischen Ernährung auf das Klima; WWF Österreich: Vienna, Austria, 2015; pp. 58–59. [Google Scholar]
  10. Bethlehem, J.; Biffignandi, S. Handbook of Web Surveys; John Wiley & Sons: Hoboken, NJ, USA, 2011; pp. 443–448. [Google Scholar]
  11. Höbart, R.; Schindler, S.; Essl, F. Perceptions of alien plants and animals and acceptance of control methods among different societal groups. NeoBiota 2020, 58, 33. [Google Scholar] [CrossRef]
  12. Etikan, I.; Musa, S.A.; Alkassim, R.S. Comparison of convenience sampling and purposive sampling. Am. J. Theor. Appl. Stat. 2016, 5, 1–4. [Google Scholar] [CrossRef] [Green Version]
  13. Pearson, K. On the criterion that a given system of deviations from the probable in the case of a correlated system of variables is such that it can be reasonably supposed to have arisen from random sampling. Philos. Mag. J. Ser. 1900, 50, 157–175. [Google Scholar] [CrossRef] [Green Version]
  14. Mann, H.B.; Whitney, D.R. On a test of whether one of two random variables is stochastically larger than the other. Ann. Math. Stat. 1947, 18, 50–60. [Google Scholar] [CrossRef]
  15. APA-OTS Österreich. Meinungsraum.at-Studie: Veganer Würden Bis zu 50 Prozent Mehr für Lebensmittel Bezahlen. 2018. Available online: https://www.ots.at/presseaussendung/OTS_20180419_OTS0105/meinungsraumat-studie-veganer-wuerden-bis-zu-50-prozent-mehr-fuer-lebensmittel-bezahlen-anhang (accessed on 24 July 2021).
  16. AMA. 25 Jahre Einkaufen: Megatrends Convenience und Bio. 2019. Available online: https://amainfo.at/article/25-jahre-einkaufen-megatrends-convenience-und-bio (accessed on 24 July 2021).
  17. Iseli, D. Psychologische Einflussfaktoren auf die Entscheidung für OderGegen Eine Vegane Ernährung. Bachelor’s Thesis, Fachhochschule Nordwestschweiz, Olten, Switzerland, 2018. [Google Scholar]
  18. Heil, E.A.; Evang, E.; Metz, M.; Schneider, K. Einflussfaktoren auf den Fleischkonsum; Poster at 52; Wissenschaftlicher Kongress der Deutschen Gesellschaft für Ernährung: Halle, Germany, 2015. [Google Scholar]
  19. Albersmeier, F.; Mörlein, D.; Spiller, A. Zur Wahrnehmung der Qualität von Schweinefleisch beim Kunden, Diskussionsbeitrag; No. 0912; Department für Agrarökonomie und Rurale Entwicklung (DARE), Georg-August-Universität Göttingen: Göttingen, Germany, 2009. [Google Scholar]
  20. Weinrich, R. Labelling policies for food. Ph.D. Thesis, Georg-August-Universität Göttingen, Göttingen, Germany, 2015. [Google Scholar]
  21. Karstens, B.; Belz, F.M. Information asymmetries, labels and trust in the German food market: A critical analysis based on the economics of information. Int. J. Advert. 2006, 25, 189–211. [Google Scholar] [CrossRef]
  22. Köhler, S. Entwicklung des Konsums von ökologisch erzeugten Lebensmitteln in Bayern-dargestellt am Vergleich von Konsumentenbefragungen aus den Jahren 2004, 1998 und 1992. Ph.D. Thesis, Technische Universität München, München, Germany, 2008. [Google Scholar]
  23. PricewaterhouseCoopers GmbH Wirtschaftsprüfungsgesellschaft. Bio im Aufwind. Konsumentenbefragung zu Bio-Lebensmitteln und Deren Kennzeichnung, Frankfurt/Main, Germany. 2021. Available online: https://www.pwc.de/de/handel-und-konsumguter/pwc-bio-im-aufwind.pdf (accessed on 11 August 2021).
  24. Perrini, F.; Castaldo, S.; Misani, N.; Tencati, A. The impact of corporate social responsibility associations on trust in organic products marketed by mainstream retailers: A study of Italian consumers. Bus. Strategy Environ. 2010, 19, 512–526. [Google Scholar] [CrossRef]
  25. Rupprecht, C.D.; Fujiyoshi, L.; McGreevy, S.R.; Tayasu, I. Trust me? Consumer trust in expert information on food product labels. Food Chem. Toxicol. 2020, 137, 111170. [Google Scholar] [CrossRef] [PubMed]
  26. Umweltbundesamt. Fleisch der Zukunft: Trendbericht zur Abschätzung der Umweltwirkungen von Pflanzlichen Fleischersatzprodukten, Essbaren Insekten und In-Vitro-Fleisch. Umweltbundesamt, Dessau, Germany. 2019. Available online: https://www.umweltbundesamt.de/sites/default/files/medien/1410/publikationen/2020-06-25_trendanalyse_fleisch-der-zukunft_web_bf.pdf (accessed on 11 August 2021).
  27. Köster, J. Die Wahrnehmung Deutscher Verbraucher von In-Vitro-Fleisch als Alternative zur Konventionellen Fleischherstellung—Eine Empirische Analyse der Chancen und Herausforderungen. Bachelor’s Thesis, Hochschule für Angewandte Wissenschaften Hamburg, Hamburg, Germany, 2019. [Google Scholar]
  28. Chemnitz, C.; Wenz, K. Fleischatlas; Heinrich Böll Stiftung: Berlin, Germany, 2021; Available online: https://www.boell.de/de/fleischatlas (accessed on 2 April 2022).
  29. Kiy, M.; Terlau, W. Konsumentenbefragungen zum Thema “Fair Trade” und “Bio” an Hochschulen in Nordrhein-Westfalen. In Der Verantwortungsvolle Verbraucher: Aspekte des Ethischen, Nachhaltigen und Politischen Konsums; Bala, C., Schuldzinski, W., Eds.; Verbraucherzentrale Nordrhein-Westfalen e.V.: Düsseldorf, Germany, 2015; Volume 3, pp. 41–58. [Google Scholar]
  30. Richter, T. Der Biomilchmarkt aus Sicht der Konsumenten; Herbstmilchtagung der Bio Suisse, Olten, Schweiz; Forschungsinstitut für Biologischen Landbau: Frick, Switzerland, 26 November 2003. [Google Scholar]
  31. Koerber, K.V.; Kretschmer, J. Die Preise von Bio-Lebensmitteln als Hürde bei der Agrar- und Konsumwende. Ernährung Im Fokus 2001, 1, 278–282. [Google Scholar]
  32. Lehner, N.; Fiala, V.; Freyer, B. Einstellungen, Einflussfaktoren und Verhaltensmuster zu Bio-Konsum—Eine Fallstudie über Mehrpersonenhaushalte mit geringer Kaufkraft. In Innovatives Denken für Eine Nachhaltige Land- und Ernährungswirtschaft, Contributions to the 15th Proceedings of the Science Conference on Organic Farming, Kassel, Germany, 5–8 March 2019; Verlag Dr. Köster: Berlin, Germany, 2019. [Google Scholar]
  33. Glanz, K.; Basil, M.; Maibach, E.; Goldberg, J.; Snyder, D.A.N. Why Americans eat what they do: Taste, nutrition, cost, convenience, and weight control concerns as influences on food consumption. J. Am. Diet. Assoc. 1998, 98, 1118–1126. [Google Scholar] [CrossRef]
  34. Friedl, B.; Omann, I.; Pack, A. Socio-economic drivers of (non-) sustainable food consumption. An analysis for Austria. In Proceedings of the Launch Conference of the Sustainable Consumption Research Exchange, Wuppertal, Germany, 23–25 November 2006; pp. 39–58. [Google Scholar]
  35. Buder, F.; Hamm, U. Determinanten der Nachfrage ökologischer Lebensmittel. In Proceedings of the Scientific Conference on Organic Farming, Gießen, Germany, 15–18 March 2011; Verlag Dr. Köster: Berlin, Germany, 2011. [Google Scholar]
  36. Visschers, V.; Tobler, C.; Cousin, M.E.; Brunner, T.; Orlow, P.; Siegrist, M. Konsumverhalten und Förderung des Umweltverträglichen Konsums; Bericht im Auftrag des Bundesamtes für Umwelt BAFU: Ittigen, Switzerland, 2009; 121p. [Google Scholar]
  37. Haubach, C.; Moser, A.; Schmidt, M.; Wehner, C. Die Lücke schließen—Konsumenten zwischen ökologischer Einstellung und nicht-ökologischem Verhalten. Wirtschaftspsychologie 2013, 15, 43–57. [Google Scholar]
  38. Pack, A. The Environmental Sustainability of Household Food Consumption in Austria: A Socio-Economic Analysis. Master’s Thesis, Universität Graz, Graz, Austria, 2006. [Google Scholar]
  39. Schäufele, I.; Hamm, U. Bestimmungsgründe für den Kauf von Öko-Lebensmitteln: Liegen produktgruppenspezifische Unterschiede vor? In Innovatives Denken für Eine Nachhaltige Land-Und Ernährungswirtschaft, Contributions to the 15th Proceedings of the Science Conference Organic Farming, Kassel, Germany, 5–8 March 2019; Verlag Dr. Köster: Berlin, Germany, 2019. [Google Scholar]
  40. Stolz, H.; Blattert, S.; Rebholz, T.; Stolze, M. Biobarometer Schweiz: Wovon die Kaufentscheidung für Biolebensmittel abhängt. Agrar. Schweiz 2017, 8, 62–69. [Google Scholar]
  41. Sanchez-Sabate, R.; Sabaté, J. Consumer attitudes towards environmental concerns of meat consumption: A systematic review. Int. J. Environ. Res. Public Health 2019, 16, 1220. [Google Scholar] [CrossRef] [Green Version]
  42. Farjam, M.; Nikolaychuk, O.; Bravo, G. Experimental evidence of an environmental attitude-behavior gap in high-cost situations. Ecol. Econ. 2019, 166, 106434. [Google Scholar] [CrossRef] [Green Version]
  43. Park, H.J.; Lin, L.M. Exploring attitude–behavior gap in sustainable consumption: Comparison of recycled and upcycled fashion products. J. Bus. Res. 2020, 117, 623–628. [Google Scholar] [CrossRef]
  44. Redondo, I.; Puelles, M. The connection between environmental attitude–behavior gap and other individual inconsistencies: A call for strengthening self-control. Int. Res. Geogr. Environ. Educ. 2017, 26, 107–120. [Google Scholar] [CrossRef]
  45. Jahn, G.; Schramm, M.; Spiller, A. The reliability of certification: Quality labels as a consumer policy tool. J. Consum. Pol. 2005, 28, 53–73. [Google Scholar] [CrossRef]
  46. Salzburger Nachrichten. Penny will Anfang 2021 das Bio-Sortiment Verdoppeln. 27 October 2020. Available online: https://www.sn.at/wirtschaft/oesterreich/penny-will-anfang-2021-das-bio-sortiment-verdoppeln-94763011 (accessed on 8 September 2021).
  47. RollAMA Marketing GesmbH. Marktentwicklung Bio 1. Quartal 2021. Haushaltspanel 2.800 Österreichischer Haushalte, Vienna, Austria. 2020. Available online: https://amainfo.at/fileadmin/user_upload/Charts_PA_RollAMA2021.pdf (accessed on 20 April 2022).
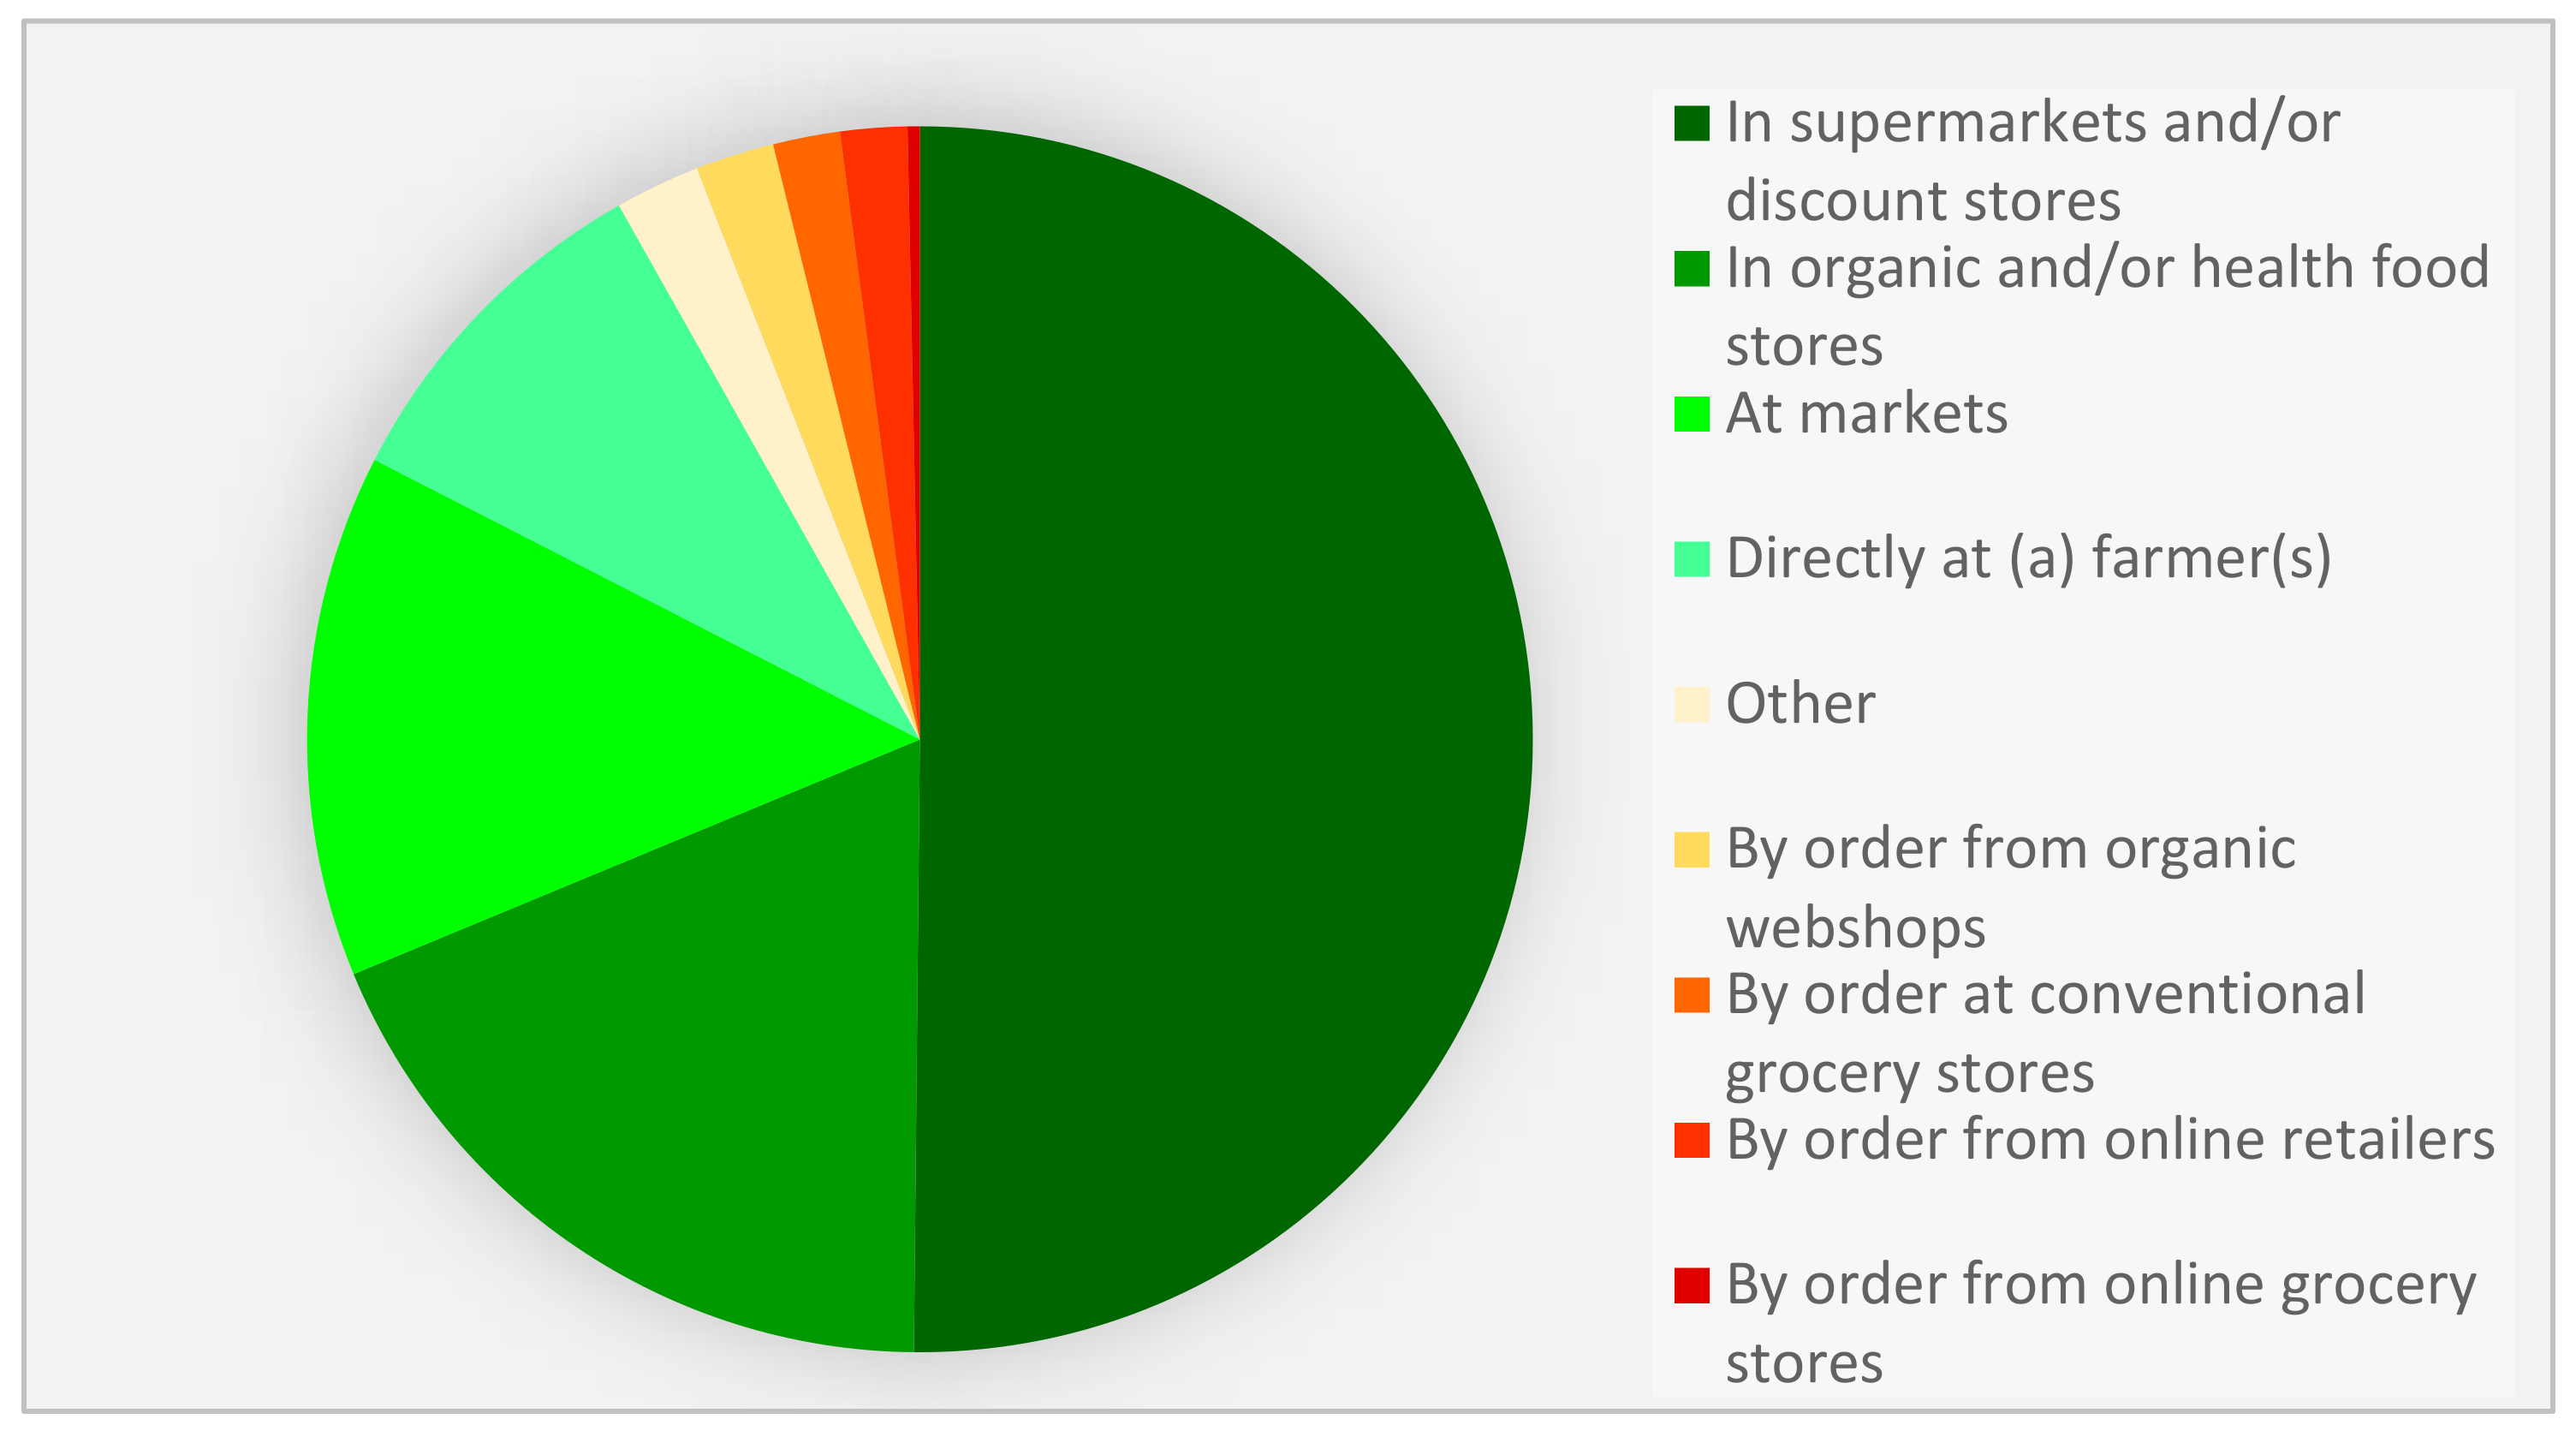
Figure 1. Respondents’ statements about where they usually buy their groceries. Data in % of responses (N = 624). Original question: “Where do you usually buy your groceries?”.
Sustainability 14 08685 g001
Figure 2. Respondents’ statements about the importance of certain aspects when buying food. Data in % of participants (N = 320). Original question: “How important is it to you that what you eat every day…?”.
Sustainability 14 08685 g002
Figure 3. The answers provided by the respondents about their diets. Data in % of participants (N = 320). Original question:” Which statement best applies to your diet?”.
Sustainability 14 08685 g003
Figure 4. Respondents’ statements about their motivations for reducing their meat consumption, split into both survey groups. Data in % of responses. The results for NA (N = 419) are presented by the outer circle and ND (N = 83) by the inner circle. Original question: “The following are statements regarding the reduction of meat consumption. I would reduce my meat consumption…”.
Sustainability 14 08685 g004
Figure 5. Respondents’ statements about their barriers to eating more vegetarian meat substitutes, split into nature affine (NA) and nature distant (ND) respondents. Data in % of participants. The results for NA (N = 264) are presented on the upper side and ND (N = 56) below. Significant differences: p < 0.05 *, p < 0.01 **, and p < 0.001 ***. Original question: “What most discourages you from consuming (more) meat substitutes?”.
Sustainability 14 08685 g005
Figure 6. The reasons of the respondents to decide against buying organic food, split into nature affine (NA) and nature distant (ND) respondents. Original question: “If you choose not to eat organic food, what are your reasons?”.
Sustainability 14 08685 g006
Figure 7. Respondents’ statements about whether they would include the biodiversity footprint in their purchasing decision, split into nature affine (NA) and nature distant (ND) respondents. Data in % of participants. The results for NA (N = 264) are presented by the outer circle and ND (N = 56) by the inner circle. Original question: “There are currently considerations to label certain foods in the store with a biodiversity footprint. Would you include the biodiversity footprint of a food in your purchase decision? I would…”.
Sustainability 14 08685 g007
Figure 8. Respondents’ statements about how this biodiversity footprint should be presented, split into nature affine (NA) and nature distant (ND) respondents. Data in % of responses. The results for NA (N = 460) are presented by the outer ring and ND (N = 77) by the inner ring. Original question: “How do you think this biodiversity footprint should be presented?”.
Sustainability 14 08685 g008
Publisher’s Note: MDPI stays neutral with regard to jurisdictional claims in published maps and institutional affiliations.