Article

Effects of the Olympic Announcement and the Actual Event on Property Values: The Case of the 2018 PyeongChang Winter Olympic Games

1
Department of Sport & Outdoor, Eulji University, Seongnam 13135, Korea
2
Department of Sport Industry and Leisure, Kookmin University, Seoul 02707, Korea
3
Department of Practical Physical Education, Dongyang University, Dongducheon 11307, Korea
4
Department of Physical Education, Seoul National University, Seoul 08826, Korea
5
College of Sport Science, Sungkyunkwan University, Suwon 16419, Korea
6
Department of Marine Sports, Pukyong National University, Busan 48513, Korea
*
Author to whom correspondence should be addressed.
Sustainability 2022, 14(14), 8687; https://doi.org/10.3390/su14148687
Submission received: 2 June 2022 / Revised: 13 July 2022 / Accepted: 14 July 2022 / Published: 15 July 2022
(This article belongs to the Special Issue Sustainability in the Sports Market and Sports Events)

Abstract

:
This study investigates the effects of the Olympic announcement and the actual event on property values in the host region using the case of the 2018 PyeongChang Winter Olympic Games. We collected Korean government-issued apartment transaction data in the host city, Gangneung, and other cities. We performed propensity score matching to generate a suitable control group compared to units in Gangneung and exploited difference-in-difference analyses to test the impact of the announcement and the actual event separately. The results show that the Olympic announcement increased property values in Gangneung by 5.5% compared to propensity-matched units, and the effects are mostly shown in units in downtown Gangneung. Units close to the KTX station and the Olympic arena observed additional increases in housing prices. During the actual Olympic event, property values in Gangneung increased by 8.3% after the KTX station opened, but the actual event period and Athletes’ Village opening did not generate additional effects. The additional increases in housing prices close to the opening of the KTX station were found for units close to the KTX station, the Olympic arena, and Athletes’ Village.

1. Introduction

Scholarly debates on the economic impact of so-called Mega Sports Events (MSEs) have lasted for a long period of time. Depending on the method chosen to measure the economic impacts of MSEs, such as the Olympic Games, the FIFA World Cup, and world championships, scholars have argued that there are little to no long-term economic impacts [1].
Scholars who posit that MSEs have effects on the local economy often provide reasons such as increased infrastructure development, tourism, and investment. MSEs still seem to offer unique opportunities to the potential host cities since they can still expect various outcomes. For example, hosting the Olympic Games leaves a legacy of increased transportation infrastructure and environmental improvement projects triggered by the Olympic Games, increased national image, the revitalization of the local economy through continuous tourist inflow, and an improved quality of life among local residents [2,3]. However, due to the continuous rising costs of hosting such events, the number of cities that desire hosting such MSEs has decreased [4].
Recent efforts to identify the positive economic impacts of MSEs have led to the conclusion that hosting MSEs such as the Olympics bring positive impacts on the price of assets such as stock market and property values during the announcement phase of these events [5,6]. This is assumed to be because as soon as an event such as the Olympic Games is announced, the expectations for the mid- to long-term residential, environmental, and economic development in the host city are reflected in the future values of various Olympics-related companies and the host city. This is the reason we can observe a positive surplus in the stock market for Olympic Games-related companies during the announcement period [7], as well as in the average property values of the host region [8].
The purpose of this study is to identify the impacts of MSEs, specifically the Olympic Games, on the property values in the hosting region. We divided the study into two separate events regarding hosting the Olympic Games, the hosting announcement period and the actual event period, and tested whether both events generated a positive impact on the housing prices separately. The data were collected over six years: three years (2010 to 2012) to test the effects of the announcement and another three years (2017 to 2019) to test the effects of the actual sporting event. The hosting announcement was made on 6 July 2011 and the Winter Olympic Games took place from 9 to 25 February 2018. We set the host city of Gangneung as the treatment city, and propensity score matching was performed to construct a suitable control group. Heterogeneous effects between units in downtown Gangneung and Jumunjin and in proximity to Olympic-related facilities were also tested. Results indicate that the Olympic hosting announcement increased property values in Gangneung by 5.5% compared to propensity-matched units, and the effects were mostly shown in the units in downtown Gangneung. Units close to the Korea Train Express (KTX) station and the Olympic arena experienced additional increases in housing prices. Within the actual Olympic Games period, the opening of the KTX station had the largest positive impact on property values; property values in Gangneung increased by 8.3% after the KTX station opened. The additional effects were found for units close to the KTX station, the Olympic arena, and the Athletes’ Village.

2. Literature Review

2.1. Olympic Games and Economic Impact

The topic of the economic impact of the Olympic Games is debatable not only in academia but also in practice. Normally, sporting events such as the Olympics have two different types of economic impact. First, there are direct impacts, which include the amount per capita that spectators from the foreign economy, who came to the host city only for the event, spend while attending the Games as well as investments implemented to rebuild infrastructure. Second, there are indirect impacts, such as the promotional effect on the nation’s image. Despite the fact that hosting the Olympic Games is extremely expensive, the motivations for cities to host the Games are closely linked to various stakeholders, including political and social decisions. Kontokosta [9] argued that a host city views the Olympic Games as an opportunity to make a political statement, create a marketing image, attract international investment, increase tourism, foster urban development, and spur economic activity. According to studies by Firgo [10] and Scandizzo and Pierleoni [11], positive economic impacts include increased economic activity due to investment, job creation, increased labor supply, increased living standards, and a rise in income.
Empirical evidence mostly reports little to no economic impact of hosting the Olympic Games on employment [12,13,14] or on taxable sales [15,16]. Baade and Matheson [2] explain this with substitution and crowding-out effects, which indicate that positive spending on Olympic-related goods and services were just substituted from other spending (substitution effect), and regular tourists or business travelers tend to avoid the Olympic periods due to large crowds (crowding-out effect). Negative economic impacts are also reported for a variety of reasons. The high costs of staging the event (costs of opening and closing ceremony, security, and construction of infrastructure), increase in local authority debt, tax increases, environmental damage, pollution, and gentrification process [2] all impact the local economy. Further negative economic impacts of hosting the Olympic Games occur long after the Games finish. Since many stadiums and infrastructure were built for only 15 days of events, it creates ongoing maintenance fees after the event. These structures are called white elephants. Almost every summer, Olympic Games—such as 2004 Athens, 2008 Beijing, 2012 London, and 2016 Rio—had white elephants [9,17].

2.2. Olympic Games and Property Value

In his study analyzing the effects of five Summer Olympic Games and one Winter Olympic Games from 1984 to 2000 on the property values in host cities, Kontoskosta [9] found that the impact of the Olympics on property values varied depending on the characteristics of the host city. Out of six Olympic Games, only the 1992 Barcelona and 2000 Sydney Games experienced an increase in property values, while 1996 Atlanta experienced a decrease of 9.4% after the Summer Olympic Games. The 1988 Olympic Games in Seoul had no significant effect on property values, whereas the 2000 Summer Olympics in Sydney resulted in a 13.9% increase in property values. Based on those findings, the author concluded that the success or failure of property value depends on the degree to which systematic and integrated Olympic-related investments are made in the host city.
Ahlfeldt and Maennig [18] estimated the impact of multipurpose Olympic venues on land values in Berlin, Germany with a hedonic price model and found positive proximity effects of a new venue. They found the positive impact of New Wembley and Emirates Stadiums in London, England, on housing prices with a difference-in-difference model for the construction announcement, construction period, and opening.
Hur and Kim [19] examined the impact of the 2018 PyeongChang Winter Olympic Games on the property value of the host region. The study specifically divided two groups—the host region and the non-host region—to compare the effect of the announcement on property values. They included factors such as distance from the ocean, elementary schools, middle schools, high schools, public service offices, hospitals, train stations, and bus stops. Analyzing data from 2009 to 2017, the property values of both hosting and non-hosting regions increased by 3.8% to 6.2% after the announcement of the Winter Olympic Games.
The above studies indicate that the increase in property values was the result of the anticipated socioeconomic benefits, including event-related infrastructure and venues, that can be gained in hosting Olympic Games or from the construction of new stadiums/venues. This is mainly because sports facilities, venues, and other elements of infrastructure attract sports-related assets to the community after hosting the major sports event. They create legacies, such as sports franchise teams or sports facilities, and lead to an increase in property values. A study by Hyun [20] provides evidence for this assertion. The study revealed that apartment prices within 3 km of a new stadium jumped by 6% after its opening.
On the other hand, there are some other studies that have found that property values around the venue are negatively impacted due to heavy traffic, noise, and trash generated by professional sports facilities around the stadium. Humphreys and Nowak [21] found increased housing prices after team departure, Joshi et al. [22] found a reduced property values after the promotion of MLS team in Seattle, and Bradbury [23] did not find positive returns on property assessments after the announcement of a new baseball stadium and the actual construction in Cobb County, Georgia.

2.3. Property Values in Korea

Similarly to the stock market, the value of real estate in Korea is highly dependent on economic changes. This is because property markets fluctuate depending on the interests of stakeholders. The majority of the factors that determine property value can be explained by the hedonic price theory. The hedonic price theory states that the price of a general good is determined by gathering various attributes surrounding that good [24]. In addition, when the model is applied to property values, it explains that several characteristics determine property prices and that each of these characteristics contributes to the overall property price. Previous studies noted that hedonic price modeling can be explained by three main categories: locational, structural, and neighborhood characteristics [25,26].
Studies on Korean property values have some unique features. As more than 50% of Koreans live in apartment complexes [27], most studies on property values focus on apartment units [28]. These studies have identified the determinants of property values such as unit characteristics, which include unit size, floors, and the number of bedrooms and bathrooms, as well as apartment complex characteristics, which include apartment age, the number of units in the apartment complex, floor area ratio, building coverage, and parking space. Finally, neighborhood characteristics, which include proximity to a subway station, schools, local hospitals, parks, and the number of public transportation options, all influence property values.
Song and Han [29] concluded in their study that the number of bathrooms, building coverage, floors, and public transportation options affected the price of property among apartments in the Seoul metropolitan area. Jung [30] also argued for the large number of apartment floors, a number of bedrooms, apartment size, and public transportation options affected the price of housing, while floors, a number of bedrooms, and public transportation options affected the price for small-size apartment in the Seoul metropolitan area. Other studies on Korean property values stated that apartments near schools, local hospitals, and sports facilities are more expensive [31,32].

3. Empirical Method

3.1. Data

PyeongChang 2018, the 2018 Winter Olympics, was held between 9 and 25 February 2018 in PyeongChang and Gangneung in the Gangwon province of the Republic of Korea. Ahead of the official selection, PyeongChang competed with two other cities, Munich and Annecy, to host the Winter Olympic Games. On 6 July 2011, PyeongChang was selected as the host city at the 123rd IOC Session in Durban, South Africa. PyeongChang Winter Olympic Games venues and infrastructure were built in two different areas: PyeongChang mountain cluster, where all the skiing event venues were built, and Gangneung coastal cluster includes indoor sports events. The Korean government spent about USD 13 billion on preparing and staging the Games [33]. Pyeongchang Olympic Games Organising Committee [34] noted that 77.3% of the financial spending was put into social overhead capital such as a new highway and the Korea Train Express (KTX) stations and railroad connecting Seoul, PyeongChang, and Gangneung, and the other, around 20%, was spent on building venues. This construction was planned before the official selection.
This study focuses on apartment sales in Gangneung only for following reasons. First, while Gangneung is one of the major cities in Gangwon Province and a typical mid-size city in Korea with a population over 200,000, PyeongChang is a rural mountain area with ski resorts and a population of around 40,000. Thus, apartment sales in Gangneung would be better suited to study the effect of hosting the Olympic Games. Second, the majority of Korean households reside in apartments. Moreover, while details of any unit of apartment sales (e.g., road address) are available in raw data, we have limited access to detailed data on other types of housing (e.g., a single house). Since units within an apartment complex share many amenities, it is relatively easy to control for these amenities. For this reason, previous studies on Korean housing transactions have focused on apartment sales only [28,35].
Within this timeline of the PyeongChang Winter Olympic Games, we divided two different events—the announcement of the Games and the actual event period—to test the effect of each event on housing prices. This approach was based on Preuss [36] and Cashman [37], in which they argued that investments for the Olympic Games usually happens before the opening ceremony, and regional development is conducted during the biding period. Therefore, we conducted two different sample periods; to test the effect of the announcement, we set up a sample period between 2010 and 2012, and to test the effect of the opening of the KTX station and the actual event, we set up a sample period between 2017 and 2019. Every apartment unit sale has to be reported to the Ministry of Land, Infrastructure, and Transport (MOLIT) by law, and the MOLIT collects and publishes housing transaction data on the website http://rt.molit.go.kr/ (accessed on 30 April 2022). The data contain detailed information of every apartment transaction, such as price, transaction date, size, floor, construction year, and road address. We collected housing transaction data between 2010 and 2012 and between 2017 and 2019 from the MOLIT website.
Previous studies on the Korean housing market have identified the further determinants of housing prices such as unit-specific features (the number of bedrooms and bathrooms) and apartment-complex-specific features (the number of units in the complex, floor area ratio, building coverage, parking place, distance to closest elementary school or hospital). However, MOLIT transaction data do not cover this information. Thus, we further collected these variables in the following steps.
First, we performed a ‘naïve selection’ of cities that are comparable to Gangneung using city-level population, gross domestic product, and the number of crimes per 100,000 population, which were collected from the Korean Statistical Information Service (https://kosis.kr, accessed on 30 April 2022) and the Korean Prosecution Service (https://www.spo.go.kr/site/spo/crimeAnalysis.do, accessed on 30 April 2022). This naïve selection is essential for collecting further information, as raw MOLIT transaction data have too many unit transactions (around 50,000 transactions per month) and most of them are not comparable to the apartment units in Gangneung. As a result, 10 cities were selected and 78,220 transactions between 2010 and 2012 and 68,449 transactions between 2017 and 2019 remained. Table 1 shows features of the cities compared to Gangneung.
After the naïve selection, we further collected unit-specific features (the number of bedrooms and bathrooms) and apartment-complex-specific features (the number of units in the complex, floor area ratio, building coverage, and parking place availability) by applying web scrapping from http://kbland.kr/ (accessed on 30 April 2022). After excluding missing values on collected variables, the sample’s size reduced to 47,919 transactions in the 2010–2012 sample and 31,394 transactions in the 2017–2019 sample.
Lastly, we collected a list of elementary schools and hospitals with a road address from the Korean Educational Statistics Service (https://kess.kedi.re.kr, accessed on 30 April 2022) and the Korean Healthcare Bigdata Hub (http://gisopendata.hira.or.kr, accessed on 30 April 2022). After collection, we calculated the distance between every transaction unit to the closest elementary school and hospital. Table 2 and Table 3 show the descriptive statistics of apartment transactions in Gangneung and naïve-selected cities in the 2010–2012 and 2017–2019 samples, respectively.
For the 2010–2012 sample, the average price was 112,851,400 KRW (around 90,000 USD) and ranged from 7,500,000 to 680,000,000 KRW. The average unit size was 72.45 square meters. The mean floor level was 7.3 and ranged from the first basement level to the 29th floor. The average numbers of bedrooms and bathrooms were 2.9 and 1.5, respectively. The average apartment age was 12.5 years old, and the average number of units in the apartment complex was 547.3. The mean of floor area ratio was 218.6%, and the building coverage was 21.42%. The mean number of parking spaces per unit was 0.937. The average distance to closest hospital and school was 3.1 km and 0.49 km, respectively.
For the 2017–2019 sample, the average price was 140,171,940 KRW (around 110,000 USD) and ranged from 9,500,000 to 788,000,000 KRW. The average unit size was 70.06 square meters. The mean floor level was 7.7 and ranged from the first basement level to the 39th floor. The average of the number of bedrooms and bathrooms was 2.8 and 1.5, respectively. The average apartment age was 18.6 years old, and the average number of units in the apartment complex was 551.1. The mean of floor area ratio was 219.3% and the building’s coverage was 21.34%. The mean number of parking spaces per unit was 0.901. The average distances to the closest hospital and school were 2.85 km and 0.48 km, respectively.

3.2. Analysis

Before estimating the treatment effect, propensity score matching was employed to construct an appropriate control group of the units in naïve-selected cities. Propensity score matching was introduced by Rosenbaum and Rubin [38] and has been widely used to assess causal relationships with quasi-experimental settings (i.e., the lack of random assignment). The matching technique assumes that outcomes are independent of group participation (units in Gangneung, which hosted the Olympics) conditional on a set of observed variables [38,39]. We used variables that are likely to determine housing prices, which include unit-specific features (unit size and floor and the number of bedrooms and bathrooms), apartment-complex-specific features (age, the number of units, floor area ratio, building coverage, parking spaces, and distance to the closest hospital and school), and city-specific features (city population, GRDP, and crime rates). Following Song [40], we use one-to-one nearest neighbor matching for each unit in Gangneung with a replacement.
As a result of propensity-score matching, 2181 unit transactions were matched for 4989 unit transactions in Gangneung for the 2010–2012 sample and 2014 unit transactions were matched for 3737 unit transactions in Gangneung for the 2017–2019 sample. 
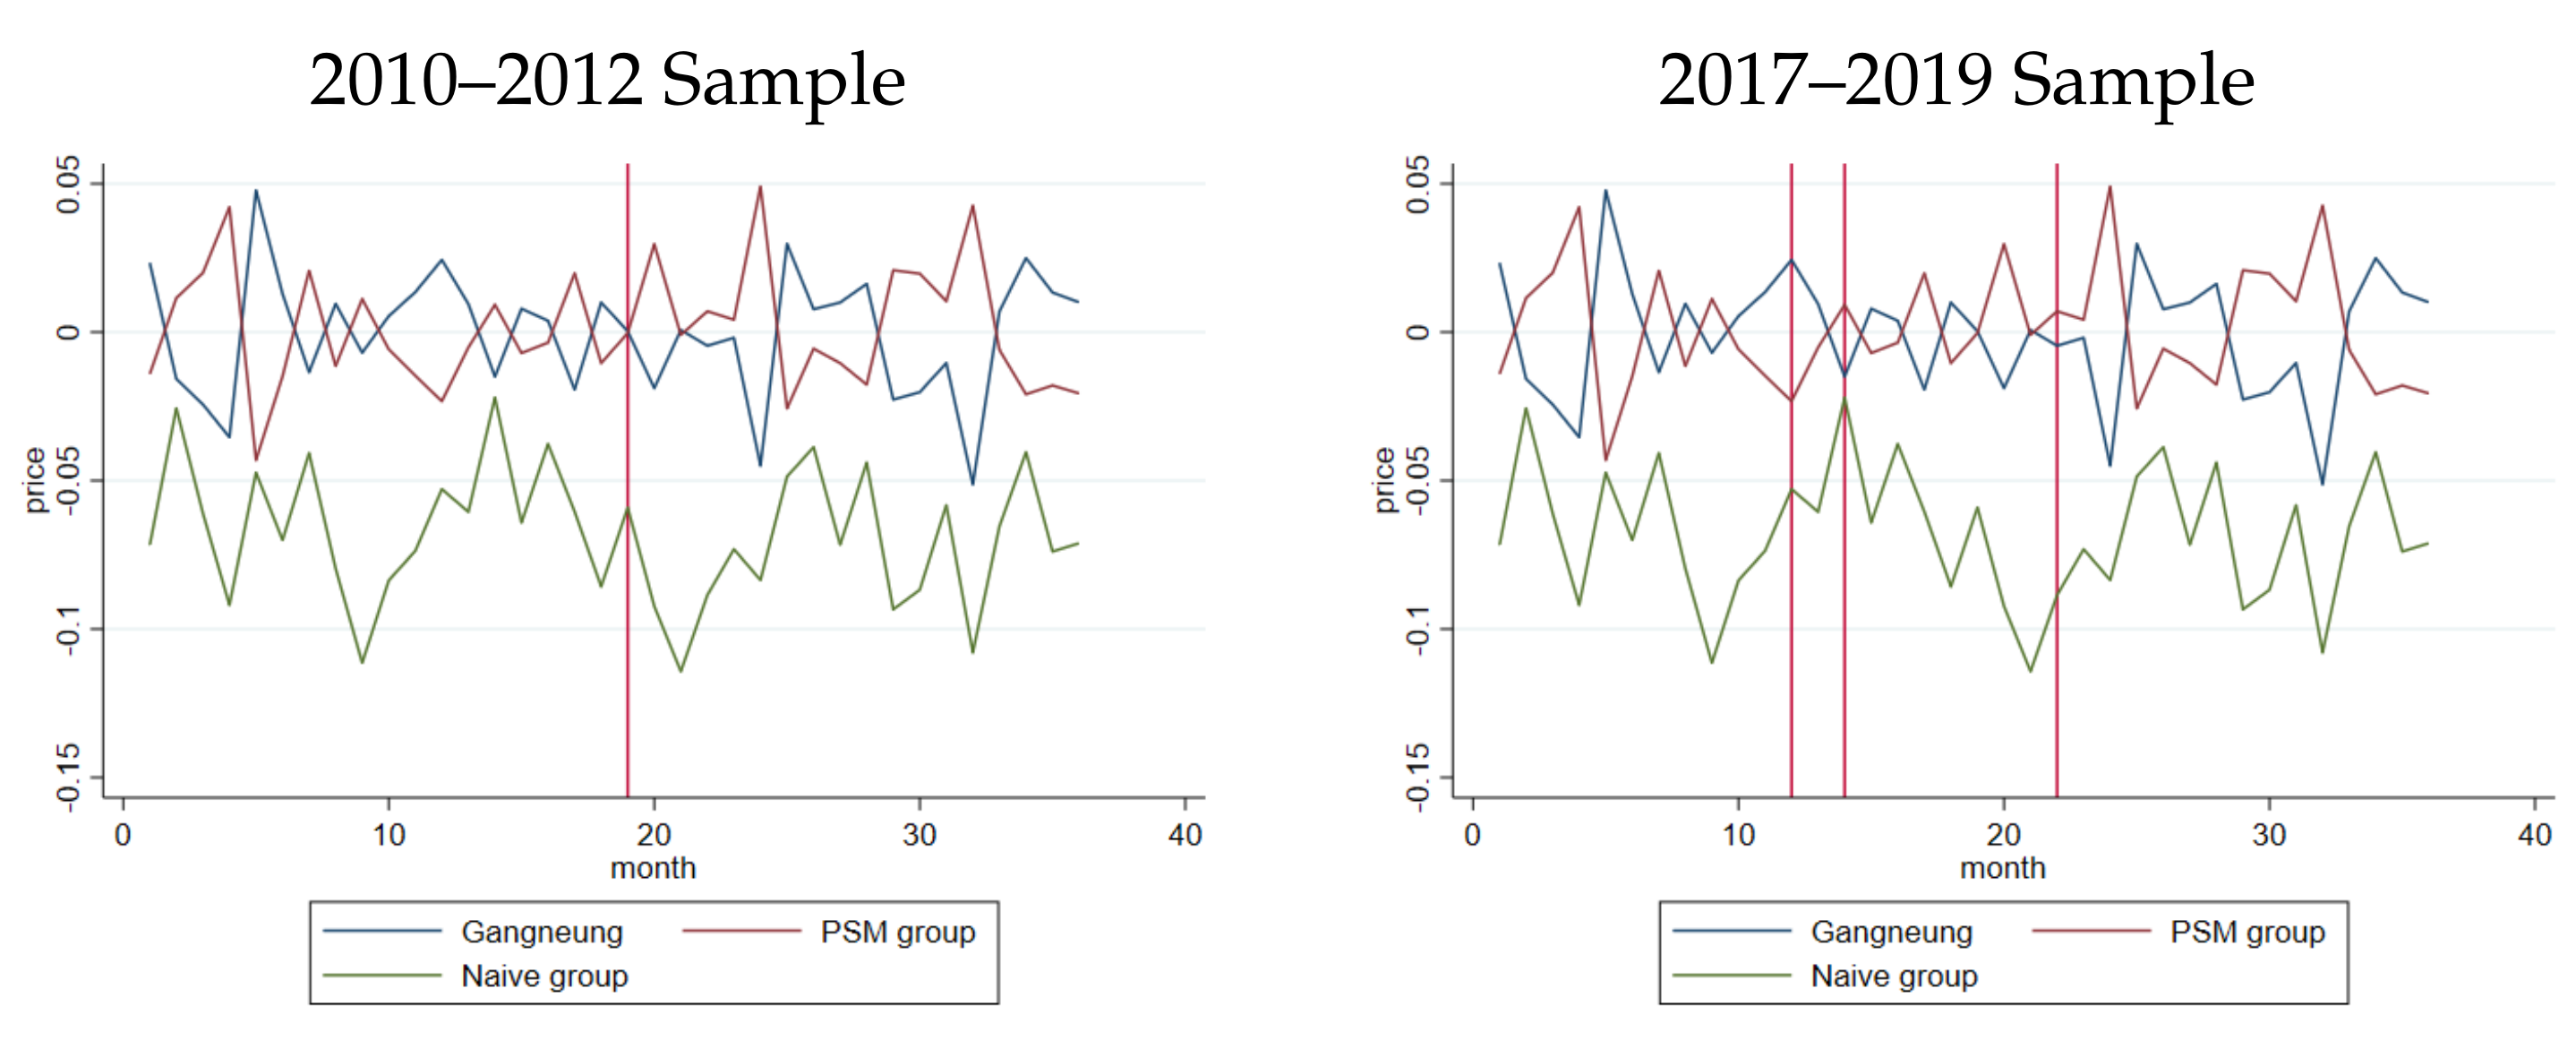
Figure 1 shows the time trends of the monthly average transaction price after controlling for unit-specific, apartment-specific, and city-specific variations for the 2010–2012 and 2017–2019 samples. The vertical line in the 2010–2012 sample in Figure 1 indicates the month that the announcements were made, and vertical lines for the 2017–2019 sample indicate the months that KTX stations reopened, the month the Olympic Games were held, and when Athletes’ Village opened for the public. For both graphs, transaction prices of units in naïve-selected cities are quite low and show more fluctuations compared to those in Gangneung. The transaction prices of the matched units in Figure 1 show similar trends to units in Gangneung, which supports the parallel pre-trend assumptions for applying a difference-in-difference analysis.
After applying propensity score matching, a difference-in-difference approach was used to estimate the treatment effect with the 2010–2012 sample. Since a hedonic price model was used for analyzing housing prices [21,28,40], we modified the hedonic price model as follows:
l n ( p r i c e ) i j t = β 0 + β 1 G N j P O S T t + γ UNIT ijt + δ APT ijt + α i + λ t + u i j t
where l n ( p r i c e ) i j t represents the logged transformed price of sold unit i in city j on transaction day t. G N j P O S T t equals 1 for treatment city, Gangneung, after the announcement of hosting the Olympic Games was made. UNIT ijt is a vector of unit specific variables, such as unit size, floor number, and the number of bedrooms and bathrooms. APT ijt is a vector of apartment complex specific variables, such as age, the number of units, floor area ratio, building coverage, parking space, and distance to closest hospital and school. α i and λ t denote city-fixed effects and year-month fixed effects, respectively. u i j t is a heteroscedastic unobservable error term. The equation error term was assumed to be correlated within the city, and we clustered the standard errors accordingly. In this empirical setting, β 1 captures the effect of Olympic announcements on housing prices in Gangneung. We expect positive β 1 if the Olympic announcement increased housing prices in the host area.
Apartment complexes in Gangneung are classified into two different regions: the downtown Gangneung area and the Jumunjin area. Figure 2 shows the distribution of apartment sales data in Gangneung in the 2010–2012 sample. Sky-blue dots show the location of sold units in downtown Gangneung and dark-blue dots show the location of sold units in Jumunjin. From 7785 transactions in the entire Gangneung area, 73% are located in the downtown area and 27% are located in the Jumunjin area in the 2010–2012 sample. As shown in Figure 2, apartment units in Jumunjin are quite far from downtown Gangneung, around 13 km away from the KTX station. As the Olympics-related facilities are located in downtown Gangneung, we expected that the effects of the Olympic announcement would be reflected in the downtown area more clearly. Therefore, the following empirical model was derived to test this heterogeneous effect:
l n ( p r i c e ) i j t = β 0 + β 1 D T G N i P O S T t + β 2 J M J i P O S T t + γ UNIT ijt + δ APT ijt + α i + λ t + u i j t
where D T G N i P O S T t is equal to 1 for the units in downtown Gangneung after the announcement of hosting the Olympic Games was made, and J M J i P O S T t equals 1 for units in Jumunjin after the announcement of hosting the Olympic Games was made. The estimation approach and all other variables are the same as in Equation (1). Within this setting we expected that β 1 would be greater than β 2 if the effects of the Olympic announcement are shown in downtown Gangneung rather than Jumunjin:
l n ( p r i c e ) i j t = β 0 + β 1 G N j P O S T t + β 2 K T X i P O S T t + β 3 A R N i P O S T t + β 4 V L G i P O S T t + γ UNIT ijt + δ APT ijt + α i + λ t + u i j t
where K T X i P O S T t , A R N i P O S T t , and V L G i P O S T t equal 1 for units that are located in a 1 km radius from the Olympic arena, Athletes’ Village, and the KTX station, respectively, after the announcement date. If the effects of the announcement are shown in units close to the Olympic facilities, we expected positive β 2 , β 3 , and β 4 .
In the 2017–2019 sample, there were three events that were likely to affect housing price: the KTX station opening on 22 December 2017, the Olympic Games being held between 9 and 25 February 2018, and civilian residents starting to move into Athletes’ Village on 1 October 2018. We derived a difference-in-difference model to test the effects of the opening of the KTX station, the actual event, and Athletes’ Village opening on housing prices using the 2017–2019 sample:
l n ( p r i c e ) i j t = β 0 + β 1 G N j P O S T K T X t + β 2 G N j P O S T O M P t + β 3 G N j P O S T V L G t + γ UNIT ijt + δ APT ijt + α i + λ t + u i j t
where G N j P O S T K T X t , G N j P O S T O M P t , and G N j P O S T V L G t equal to 1 for the units in Gangneung after the opening of the KTX station, the actual Olympic period, and Athletes’ Village opening. For the 2017–2019 sample, we also tested the heterogeneous effects for units close to the Olympic facilities, as shown in Equation (3).

4. Results and Discussion

Table 4 shows the results of difference-in-difference analysis with the 2010–2012 sample. Column (1) in Table 4 shows the results from Equation (1). For unit-specific features, the housing prices rose for units with a larger size, higher floor, and more bedrooms and bathrooms. For apartment-complex-specific features, housing prices were higher for newer apartments, lower building coverage ratio, more parking spaces per unit, and being closer to an elementary school. These results were consistent with the previous literature on Korean housing prices [29,30,31].
The coefficient on the treatment effects, β 1 in Equation (1), captures the effect of the Olympic announcement on housing prices in Gangneung. The estimated coefficient is positive and statistically significant. After the announcement, housing prices increased by 5.5% in Gangneung compared to propensity score-matched units. This finding is consistent with Hur and Kim (2020), who found 3.7% to 6.0% increases in housing prices after the announcement.
This study also estimates the heterogeneous effects according to the housing location in Gangneung. As mentioned, housing units in Gangneung can be divided two different regions: downtown Gangneung and Jumunjin. If the effect of the announcement exists, it should be reflected in downtown area more where Olympic-related facilities are located.
Column (2) in Table 4 shows the heterogeneous effects depending on the unit’s location in Gangneung. As shown, the units in downtown Gangneung experienced announcement effects on housing prices (a 5.7% increase), and the estimated coefficient for units in Jumunjin was not statistically significant. The announcement effects on prices were reflected only in the units in downtown Gangneung, as expected.
Furthermore, we tested whether the heterogeneous effects for units close to Olympic facilities also exist. As shown in column (3), units in a 1 km radius from the KTX station observed an additional 3.5% increase in housing prices, and units in a 1 km radius from the Olympic arena observed an additional 6.7% increase in housing prices. Units in a 1 km radius from the Athletes’ Village did not have any heterogeneous effects.
Table 5 shows the results of the difference-in-difference analysis with the 2017–2019 sample. Columns (1), (2), and (3) in Table 5 show the results of testing the effect of the opening of the KTX station, Olympic event period, and Athletes’ Village opening separately. Column (4) shows the results of Equation (3). In column (1), housing prices rise for apartments that are larger, on a higher floor, and those that have more bedrooms and bathrooms. For apartment-complex-specific features, housing prices are higher for newer apartments, more units, lower floor area ratio, more parking spaces per unit, and those that are located closer to an elementary school. These results are consistent with the previous literature on Korean housing prices [29,30,31].
Column (1) in Table 5 also shows the effect of the opening of the KTX station on housing prices in Gangneung. As shown, housing prices in Gangneung rose by 6.7% after the KTX station opened compared to propensity-score matched units. It seems that the Olympic period had a similar effect (a 5.9% increase in housing prices), but Athletes’ Village opening did not show a significant effect. In column (4), these three events were tested together. As shown, only the opening of the KTX station shows a positive and significant effect. Housing prices in Gangneung rose by 8.3% after the KTX station opened. The Olympic period and Athletes’ Village opening did not generate additional increases in housing prices.
We further estimated the heterogeneous effects of the opening of the KTX station according to housing locations in Gangneung. As shown in column (5), units in a 1 km radius from the KTX station observed an additional 4.6% increase in housing prices, units in a 1 km radius from the Olympic arena observed an additional 5.7% increase in housing prices, and units in a 1 km radius from the Athletes’ Village observed an additional 9.2% increase in housing prices.
As the results of the study show, it is clear that the Olympic Games announcement affected the housing prices of the host region. Unit transaction prices increased by 5.5% after the announcement in Gangneung compared to propensity-score-matched units, which is consistent with the previous findings of Hur and Kim [19]. Furthermore, the results show that the impact was shown in downtown Gangneung where the Olympic facilities are located, and units close to Olympic facilities also observed additional increases in housing prices, with the exception of Athletes’ Village, which confirm that the estimated effects are driven by the Olympic announcement.
Units close to Athletes’ Village did not experience additional increases in prices from the announcement. This seems to be due to Athletes’ Village’s location. As shown in Figure 1, Athletes’ Village was planned to be located in the eastern part of Gangneung, which was less urbanized and developed in 2010; only a few apartments existed there. Since Athletes’ Village was planned to be sold to the public, the results may indicate that supply shocks canceled out the positive impact of the Olympic announcement. The results also report that there had been increases in housing price in Gangneung during the Olympic period. Among Olympic-period events, the opening of the KTX station dominated the overall impact compared to the actual event period and Athletes’ Village opening. The impact of the opening of the KTX station can be explained by Diao, Leonard, and Sing [41], who found that opening new rail lines increased housing prices within 600 m of the stations. Gadzinski and Radzimski [42] also pointed out that 20% of research participants were willing to pay a higher price for homes located near train stations. It seems that Gangneung residents prefer easy access to Seoul via the KTX station.
The actual Olympic periods and Athletes’ Village opening did not generate additional increases in housing prices. This may indicate that Gangneung citizens think that the opening of the KTX station is a more important event compared to the actual Olympic Games and Athletes’ Village. This may reflect a belief that infrastructure construction such as the KTX station generates additional long-term economic impact regardless of the existence of the impact, as previous studies noted [2].
The impact of KTX station opening was higher on units close to Olympic-related facilities, including units close to the Athletes’ Village. The result supports that the estimated effects are more likely to be driven by hosting the Olympic Games. The units close to Athletes’ Village also noted an additional impact on housing prices. Even though Athletes’ Village provides around 3400 new units, which is around 7.5% of the total apartment units in Gangneung, it can be seen as a supply shock, but demand seems to have reacted to the effect of hosting the Olympic Games and the opening of the KTX station.

5. Robustness Checks

As shown in Table 2 and Table 3, there are many missing values in the apartment-complex-specific variables, such as floor area ratio, building coverage, and parking space per unit. Since these apartment-complex-specific variations are time-invariant, the apartment complex’s fixed effects can control for not only these variations but also any unobservable features of the apartment complex. Moreover, observations with missing values can be used with the apartment complex’s fixed effects. Therefore, we estimated the model including the apartment complex’s fixed effects instead of the city’s fixed effects as a robustness check to test whether the results are sensitive towards missing values and any possible unobservable factors.
Table 6 shows the results of the robustness check with the 2010–2012 sample. We only included treatment-effect-related coefficients in Table 6 and the full results are available upon request. Note that we have more observations (10,348 unit transactions) compared to Table 4 (7170 unit transactions) as we are able to include observations with missing values. Similarly to the results in Table 4, housing prices in Gangneung rose by 4.8% after the announcement compared to the propensity-score-matched units. The effects are shown in units in downtown Gangneung mostly (4.9% increase), while units in Jumunjin do not change housing prices after the announcement. The only difference between the results here and in Table 4 was that there were no heterogeneous effects for units close to the Olympic facilities. This difference may have arisen since we used the apartment complex’s fixed effects. The distance to Olympic-related facilities is also apartment-complex-specific and involves time-invariant variations. Therefore, an apartment complex’s fixed effects may take heterogeneous effects for units close to Olympic facilities.
Table 7 shows the results of the robustness check with the 2017–2019 sample. We only include treatment-effect-related coefficients in Table 7 and the full results are available upon request. Note that we have more observations (8490 unit transactions) compared to Table 5 (5751 unit transactions) as we are able to include observations with missing values. Similarly to the results in Table 5, the opning of the KTX station increased housing prices in Gangneung by 8.9%, and the Olympic periods increased housing prices by 9.2%. On the other hand, the effect of Athletes’ Village opening is both positive and significant (8.2%). Moreover, column (4) reports that the opening of the KTX station has lowest impact (3.0%), and Olympic periods and Athletes’ Village opening has significant impacts (4.2% and 3.6%, respectively). Heterogeneous effects for units close to Olympic-related facilities are not found in Table 7. As discussed, the apartment complex’s fixed effects may counter these effects.
Overall, the effects of the announcement and the KTX station opening are consistently found in the robustness check. Heterogeneity for units close to the Olympic facilities are not found due to the apartment complex’s fixed effects. Lastly, we found only partial evidence supporting the effects of the actual Olympic event and Athletes’ Village opening on housing prices.

6. Conclusions

This paper investigates the impact of the Olympic announcement and the actual Olympic event on property values in the hosting region. We accessed apartment unit transaction data from the MOLIT and further applied web-scrapping to collect unit and apartment complex details. After applying propensity score matching, we assessed the impact of the Olympic announcement and the actual Olympic event separately with difference-in-difference analysis. As a result, we found that 5.5% increases in housing prices in Gangneung compared to propensity-score-matched units after the announcement. The estimated effects are mostly shown in downtown Gangneung, where the Olympic facilities are located, and units close to the KTX station and the Olympic Arena observed additional increases in housing prices.
We also found that housing prices increased 6.7% to 8.3% in Gangneung after the KTX station opened. Units close to the KTX station, the Olympic Arena, and Athletes’ Village observed an additional impact on housing. Our results from the robustness check also report an additional impact of the actual event periods and Athletes’ Village opening on housing prices, but this result is not supported by our main analysis.
While we found a positive impact of hosting the Olympic Games on local property values, it is questionable whether the results represent positive externalities relative to the host region. although previous papers often regard this as spillover [43]. It is obvious that owners enjoyed increases in housing prices, but the increases can be regarded as rent-seeking increases because tenants—mostly poorer than owners—may be crowded out of the downtown area to somewhere outside the city, which could drive more inequality [44].
We only tested the relatively short-term impact of the Olympics announcement and the actual event on property values. The PyeongChang Winter Olympic Games were held in early 2018, and we limited our data collection to unit transaction data up to 2019 due to the Coronavirus Pandemic in 2020. Since the investment of infrastructure is likely to generate long-term benefits [2], future studies with longer periods of time are clearly needed. Although we utilized detailed unit transaction data from the Korean government and web scrapping technology, further studies with other Olympic Games in various regions should be implemented to generalize the results to other candidate cities that want to host a mega-event.

Author Contributions

Conceptualization, S.-J.H., W.-J.L., S.-H.K., S.-H.Y. and D.K.; methodology, S.-J.H., H.P. and D.K.; formal analysis, H.P. and D.K.; data collection, S.-H.Y. and W.S.R.; writing—original draft preparation, S.-J.H., W.S.R., H.P. and D.K.; writing—review and editing, S.-J.H., W.-J.L., S.-H.K. and D.K. All authors have read and agreed to the published version of the manuscript.

Funding

This study was supported by the Ministry of Education of the Republic of Korea and the National Research Foundation of Korea (NRF-2020S1A5A2A03046802).

Conflicts of Interest

The authors declare no conflict of interest.

References

  1. Humphreys, J.M.; Plummer, M.K. The Economic Impact on the State of Georgia of Hosting the 1996 Summer Olympic Games; Technical Report; University of Georgia: Athens, GA, USA, 1995. [Google Scholar]
  2. Baade, R.A.; Matheson, V.A. Going for the gold: The economics of the Olympics. J. Econ. Perspect. 2016, 30, 201–218. [Google Scholar] [CrossRef] [Green Version]
  3. International Olympic Committee. Legacy Strategic Approach: Moving Forward. 2017. Available online: https://www.olympic.org/~/media/Document%20Library/OlympicOrg/Documents/Olympic~Legacy/IOC_Legacy_Strategy_Full_version.pdf?la=en (accessed on 30 April 2022).
  4. Evans, G. Olympic Games: Why Cities are Snubbing the “Greatest Show on Earth”. BBC News, 18 November 2018. Available online: https://www.bbc.com/news/world-46236682(accessed on 30 April 2022).
  5. Hayduk, T., III. Who Benefitted From the PyeongChang Olympic Announcement? Evidence From the South Korean Stock Market. J. Sport. Econ. 2022, 23, 39–75. [Google Scholar] [CrossRef]
  6. Mirman, M.; Sharma, R. Stock market reaction to Olympic Games announcement. Appl. Econ. Lett. 2010, 17, 463–466. [Google Scholar] [CrossRef]
  7. Berman, G.; Brooks, R.; Davidson, S. The Sydney Olympic Games announcement and Australian stock market reaction. Appl. Econ. Lett. 2000, 7, 781–784. [Google Scholar] [CrossRef]
  8. Kavetsos, G. The impact of the London Olympics announcement on property prices. Urban Stud. 2012, 49, 1453–1470. [Google Scholar] [CrossRef] [Green Version]
  9. Kontokosta, C. The price of victory: The impact of the Olympic Games on residential real estate markets. Urban Stud. 2012, 49, 961–978. [Google Scholar] [CrossRef]
  10. Firgo, M. The causal economic effects of Olympic Games on host regions. Reg. Sci. Urban Econ. 2021, 88, 103673. [Google Scholar] [CrossRef]
  11. Scandizzo, P.L.; Pierleoni, M.R. Assessing the olympic games: The economic impact and beyond. J. Econ. Surv. 2018, 32, 649–682. [Google Scholar] [CrossRef]
  12. Jasmand, S.; Maennig, W. Regional income and employment effects of the 1972 Munich Summer Olympic Games. Reg. Stud. 2008, 42, 991–1002. [Google Scholar] [CrossRef] [Green Version]
  13. Baumann, R.; Engelhardt, B.; Matheson, V.A. Employment effects of the 2002 winter Olympics in salt lake city, Utah. Jahrbücher Natl. Stat. 2012, 232, 308–317. [Google Scholar]
  14. Feddersen, A.; Maennig, W. Mega-Events and sectoral employment: The case of the 1996 Olympic Games. Contemp. Econ. Policy 2013, 31, 580–603. [Google Scholar] [CrossRef] [Green Version]
  15. Porter, P.K.; Fletcher, D. The economic impact of the Olympic Games: Ex ante predictions and ex poste reality. J. Sport Manag. 2008, 22, 470–486. [Google Scholar] [CrossRef] [Green Version]
  16. Baade, R.; Baumann, R.; Matheson, V.A. Slippery slope? Assessing the economic impact of the 2002 winter Olympic games in Salt Lake City, Utah. Rég. Dév. 2010, 31, 81–91. [Google Scholar]
  17. Drummond, R.; Cronje, J. Building a white elephant? The case of the Cape Town Stadium. Int. J. Sport Policy Politics 2019, 11, 57–78. [Google Scholar] [CrossRef]
  18. Ahlfeldt, G.M.; Maennig, W. Impact of sports arenas on land values: Evidence from Berlin. Ann. Reg. Sci. 2010, 44, 205–227. [Google Scholar] [CrossRef] [Green Version]
  19. Hur, C.; Kim, K. The influence of PyeongChang 2018 Olympic Winter Games’ bid announcement on the real estate prices of the host regions: An application of the difference-in-difference analysis. Korean J. Sport Manag. 2020, 25, 79–95. [Google Scholar] [CrossRef]
  20. Hyun, D. The effect of sports stadium opening on house prices: Evidence from the Suwon baseball stadium. Hous. Stud. Rev. 2021, 29, 101–126. [Google Scholar]
  21. Humphreys, B.R.; Nowak, A. Professional sports facilities, teams and property values: Evidence from NBA team departures. Reg. Sci. Urban Econ. 2017, 66, 39–51. [Google Scholar] [CrossRef]
  22. Joshi, A.; Horn, B.P.; Berrens, R.P. Major league soccer expansion and property values: Do sports franchises generate amenities or disamenities? Appl. Econ. 2020, 52, 4881–4899. [Google Scholar] [CrossRef]
  23. Bradbury, J.C. Does hosting a professional sports team benefit the local community? Evidence from property assessments. Econ. Gov. 2022, 2022, 1–34. [Google Scholar] [CrossRef]
  24. Monson, M. Valuation using hedonic pricing models. Cornell Real Estate Rev. 2009, 7, 62–73. [Google Scholar]
  25. Potrawa, T.; Tetereva, A. How much is the view from the window worth? Machine learning-driven hedonic pricing model of the real estate market. J. Bus. Res. 2022, 144, 50–65. [Google Scholar] [CrossRef]
  26. Chau, K.W.; Chin, T. A critical review of literature on the hedonic price model. Int. J. Hous. Sci. Its Appl. 2003, 27, 145–165. [Google Scholar]
  27. Statistics Korea. 2020 Population and Housing Census. 2021. Available online: http://kostat.go.kr/portal/eng/pressReleases/7/2/index.board?bmode=download&bSeq=&aSeq=391586&ord=1 (accessed on 30 April 2022).
  28. Ahn, K.; Jang, H.; Song, Y. Economic impacts of being close to subway networks: A case study of Korean metropolitan areas. Res. Transp. Econ. 2020, 83, 100900. [Google Scholar] [CrossRef]
  29. Song, K.; Han, C. The Analysis of Correlation among Decision Factors in Real Estate Prices Using Graph Centrality; The Korean Institute of Information Scientists and Engineers: Seoul, Korea, 2020; pp. 1501–1503. [Google Scholar]
  30. Jung, S. A Study on the Determinants of Apartment Price in the Seoul Metropolitan Area: Focused on Seongdong-gu and Mapo-gu Small & Large Apartments (Masters Dissertation). Ph.D. Thesis, Hanyang University, Seoul, Korea, 2019. [Google Scholar]
  31. Kim, H.; Park, S.W.; Lee, S.; Xue, X. Determinants of house prices in Seoul: A quantile regression approach. Pac. Rim Prop. Res. J. 2015, 21, 91–113. [Google Scholar] [CrossRef]
  32. Park, D.W.; Lee, J.H. An analysis on the determinant of high-tech complexion neighborhood rental and transaction price of apartment. Korea Real Estate Soc. 2012, 35, 255–270. [Google Scholar]
  33. Kim, T.; Stephen, W. Pyeongchang Olympics: Costly Venues May Eventually Be Razed. AP News, 20 September 2018. [Google Scholar]
  34. Pyeongchang Olympic Games Organising Committee. Olympic Games Impact (OGI) Study for the Pyeongchang Olympic and Paralympic Winter Games. 2016. Available online: https://library.olympics.com/Default/doc/SYRACUSE/166669/olympic-games-impact-ogi-study-for-the-2018-pyeongchang-olympic-and-paralympic-winter-games-the-pyeo?_lg=fr-FR (accessed on 30 April 2022).
  35. Kim, H.S.; Lee, G.E.; Lee, J.S.; Choi, Y. Understanding the local impact of urban park plans and park typology on housing price: A case study of the Busan metropolitan region, Korea. Landsc. Urban Plan. 2019, 184, 1–11. [Google Scholar] [CrossRef]
  36. Preuss, H. Calculating the regional economic impact of the Olympic Games. Eur. Sport Manag. Q. 2004, 4, 234–253. [Google Scholar] [CrossRef]
  37. Cashman, R. Impact of the Games on Olympic Host Cities: University Lecture on the Olympics. 2010. Available online: http://ceo.uab.cat/pdf/cashman_eng.pdf (accessed on 30 April 2022).
  38. Rosenbaum, P.R.; Rubin, D.B. The central role of the propensity score in observational studies for causal effects. Biometrika 1983, 70, 41–55. [Google Scholar] [CrossRef]
  39. Lechner, M. A note on the common support problem in applied evaluation studies. Ann. d’Écon. Stat. 2008, 91/92, 217–235. [Google Scholar] [CrossRef] [Green Version]
  40. Song, Z. The Capitalization of School Quality in Rents in the Beijing Housing Market: A Propensity Score Matching Method. Buildings 2022, 12, 485. [Google Scholar] [CrossRef]
  41. Diao, M.; Leonard, D.; Sing, T.F. Spatial-difference-in-differences models for impact of new mass rapid transit line on private housing values. Reg. Sci. Urban Econ. 2017, 67, 64–77. [Google Scholar] [CrossRef]
  42. Gadziński, J.; Radzimski, A. The first rapid tram line in Poland: How has it affected travel behaviours, housing choices and satisfaction, and apartment prices? J. Transp. Geogr. 2016, 54, 451–463. [Google Scholar] [CrossRef]
  43. Bradbury, J.C.; Coates, D.; Humphreys, B.R. The impact of professional sports franchises and venues on local economies: A comprehensive survey. SSRN Pap. 2022, 1–62. Available online: https://papers.ssrn.com/sol3/papers.cfm?abstract_id=4022547 (accessed on 30 April 2022). [CrossRef]
  44. Fuller, G.W.; Johnston, A.; Regan, A. Housing prices and wealth inequality in Western Europe. West Eur. Politics 2020, 43, 297–320. [Google Scholar] [CrossRef] [Green Version]
Figure 1. Monthly average of price after controlling for covariates.
Sustainability 14 08687 g001
Figure 2. The location of housing unit in Gangneung.
Sustainability 14 08687 g002
Table 1. Features of Gangneung and Naïve Selected Cities.
Year20102017
City NameGRDPPopulationCrime RatesGRDPPopulationCrime Rates
Gangneung6,970,208218,4714503.575,295,106215,9143594.95
Gyeongsan13,811,253266,0363341.657,666,389282,6262637.05
Gimcheon7,162,397127,8893547.615,287,573140,7652923.31
Nonsan6,621,540119,2223990.873,662,308123,7743482.96
Mokpo6,201,899249,9606594.264,100,412233,9484389.01
Suncheon10,395,398258,6705038.085,963,037266,8093590.96
Andong5,063,605166,1974127.634,450,569165,7043112.78
Jeongeup5,375,950110,3523607.552,881,171109,2632877.46
Jecheon4,741,590134,6983598.423,123,530136,9293280.53
Chuncheon8,667,960276,2324294.947,481,252283,7423570.15
Chungju9,934,218203,2124014.036,975,877212,2743348.03
Table 2. Descriptive Statistics of the 2010–2012 Sample.
VariableObsMeanStd. Dev.MinMax
Price94,15711,285.147064.27275068,000
Unit size94,15772.45126.03519.99244.958
Unit floor94,1577.2984.703−129
# of bedrooms79,2802.8750.61116
# of bathrooms79,2801.5040.50313
Apartment age94,15712.4697.31041
# of units in apartment79,280547.337324.755101792
Floor area ratio62,271218.56158.23350775
Building coverage62,10921.428.773298
Parking space per unit67,3140.9370.3450.1352.535
Distance to closest hospital94,0023.1084.1840.06427.18
Distance to closest School94,0020.4960.3460.0212.097
Table 3. Descriptive Statistics of the 2017-2019 Sample.
VariableObsMeanStd. Dev.MinMax
Price81,87614,017.1948489.43995078,800
Unit size81,87670.05622.69312.149244.071
Unit floor81,8767.7265.017−139
# of bedrooms52,5922.8330.58715
# of bathrooms52,5921.470.50213
Apartment age81,87618.5918.437147
# of units in apartment52,592551.089321.83101792
Floor area ratio40,070219.31956.52950775
Building coverage39,93421.3368.067298
Parking space per unit44,0990.9010.3250.1352.535
Distance to closest hospital72,9662.8453.7040.08327.18
Distance to closest School72,9660.4770.330.0432.097
Table 4. Difference-in-Difference Results: 2010–2012 Sample.
(1)(2)(3)
Treatment Effects0.055 *** 0.052 ***
(0.014) (0.014)
TE in Downtown Gangneung 0.057 ***
(0.014)
TE in Jumunjin −0.06
(0.108)
TE within 1 km of KTX 0.035 *
(0.018)
TE within 1 km of Arena 0.067 ***
(0.013)
TE within 1 km of Village 0.003
(0.02)
Unit Size0.006 ***0.006 ***0.006 ***
(0.001)(0.001)(0.001)
Unit Floor0.010 ***0.010 ***0.010 ***
(0.000)(0.000)(0.000)
# of Bedrooms0.130 ***0.130 ***0.129 ***
(0.033)(0.033)(0.033)
# of Bathrooms0.181 ***0.181 ***0.180 ***
(0.027)(0.027)(0.027)
Apartment Age−0.031 ***−0.031 ***−0.031 ***
(0.003)(0.003)(0.003)
# of Units0.0030.0030.003
(0.004)(0.004)(0.004)
Floor Area Ratio0.0250.0260.023
(0.026)(0.025)(0.026)
Building Coverage−0.013 ***−0.013 ***−0.013 ***
(0.001)(0.001)(0.001)
Parking Space per Unit0.140 ***0.140 ***0.140 ***
(0.039)(0.039)(0.039)
Distance to Hospital0.0260.0290.027
(0.026)(0.027)(0.026)
Distance to School−0.177 ***−0.177 ***−0.177 ***
(0.04)(0.04)(0.04)
Intercept8.314 ***8.31 ***8.314 ***
(0.071)(0.068)(0.071)
Observations717071707170
Adj R20.8850.8850.885
City Fixed Effectsyesyesyes
Year-month Fixed Effectsyesyesyes
Notes: * p < 0.10; ** p < 0.05; *** p < 0.01. Cluster-corrected standard errors at the apartment-complex level in parentheses.
Table 5. Difference-in-Difference Results: 2017–2019 Sample.
(1)(2)(3)(4)(5)
TE after KTX Opening0.067 ** 0.083 ***0.078 ***
(0.028) (0.021)(0.021)
TE after Olympics 0.059 * −0.015−0.017
(0.028) (0.016)(0.016)
TE after Village Opening 0.038−0.004−0.006
(0.031)(0.024)(0.024)
TE after KTX Opening 0.046 **
within 1 km of KTX (0.019)
TE after KTX Opening 0.057 ***
within 1 km of Arena (0.016)
TE after KTX Opening 0.092 ***
within 1 km of Village (0.008)
Unit Size0.006 ***0.006 ***0.006 ***0.006 ***0.006 ***
(0.001)(0.001)(0.001)(0.001)(0.001)
Unit Floor0.010 ***0.010 ***0.010 ***0.010 ***0.010 ***
(0.001)(0.001)(0.001)(0.001)(0.001)
# of Bedrooms0.196 ***0.196 ***.196 ***0.196 ***0.195 ***
(0.018)(0.018)(0.018)(0.018)(0.018)
# of Bathrooms0.169 ***0.169 ***0.169 ***0.169 ***0.166 ***
(0.016)(0.016)(0.015)(0.016)(0.015)
Apartment Age−0.029 ***−0.029 ***−0.029 ***−0.03 ***−0.029 ***
(0.002)(0.002)(0.002)(0.002)(0.002)
# of Units0.012 ***0.012 ***0.011 ***0.012 ***0.012 ***
(0.002)(0.002)(0.002)(0.002)(0.002)
Floor Area Ratio−0.044 **−0.044 **−0.044 **−0.044 **−0.046 **
(0.015)(0.015)(0.014)(0.015)(0.015)
Building Coverage−0.001−0.001−0.001−0.001−0.001
(0.002)(0.002)(0.002)(0.002)(0.002)
Parking Space per Unit0.157 ***0.157 ***0.158 ***0.157 ***0.158 ***
(0.027)(0.027)(0.027)(0.027)(0.027)
Distance to Hospital−0.001−0.001−0.001−0.001−0.001
(0.02)(0.02)(0.02)(0.02)(0.02)
Distance to School−0.148 *−0.148 *−0.150 **−0.148 *−0.146 *
(0.068)(0.068)(0.067)(0.067)(0.068)
Intercept8.687 ***8.692 ***8.706 ***8.688 ***8.68 ***
(0.052)(0.053)(0.056)(0.052)(0.055)
Observations57515751575157515751
Adj R20.8660.8660.8660.8660.867
City Fixed Effectsyesyesyesyesyes
Year-month Fixed Effectsyesyesyesyesyes
Notes: * p < 0.10; ** p < 0.05; *** p < 0.01. Cluster-corrected standard errors at the apartment-complex level in parentheses.
Table 6. Results of Robustness Check: 2010–2012 Sample.
(1)(2)(3)
Treatment Effects0.048 ** 0.050 **
(0.021) (0.022)
TE in Downtown 0.049 **
(0.021)
TE in Jumunjin −0.016
(0.054)
TE within KTX 1 km −0.075
(0.069)
TE within Arena 1 km 0.063
(0.082)
TE within Village 1 km 0.074
(0.052)
Observations10,34810,34810348
Adj R20.9550.9550.955
Apartment Complex Fixed Effectsyesyesyes
Year-month Fixed Effectsyesyesyes
Notes: * p < 0.10; ** p < 0.05; *** p < 0.01. Cluster-corrected standard errors at the apartment-complex level in parentheses.
Table 7. Results of Robustness Check: 2017–2019 Sample.
(1)(2)(3)(4)(5)
TE after KTX Opening0.089 *** 0.030 *0.029 *
(0.014) (0.017)(0.018)
TE after Olympics 0.092 *** 0.042 **0.042 **
(0.014) (0.017)(0.017)
TE after Village Opening 0.082 ***0.036 **0.036 **
(0.015)(0.015)(0.015)
TE after KTX Opening 0.012
within KTX 1 km (0.03)
TE after KTX Opening 0.009
within Arena 1 km (0.048)
TE after KTX Opening −0.013
within Village 1 km (0.015)
Observations84908490849084908490
Adj R20.9590.9590.9590.9600.960
Apartment Complex Fixedyesyesyesyesyes
Effects Year-month Fixed Effectsyesyesyesyesyes
Notes: * p < 0.10; ** p < 0.05; *** p < 0.01. Cluster-corrected standard errors at the apartment-complex level in parentheses.
Publisher’s Note: MDPI stays neutral with regard to jurisdictional claims in published maps and institutional affiliations.

