1. Introduction
Global warming increases the range of climate-system changes, leading to frequent occurrences of extreme precipitation, high temperature, and drought events, which seriously threaten the safety of global ecological and environmental systems [
1]. The Intergovernmental Panel on Climate Change (IPCC) pointed out in the Sixth Assessment Report (AR6) [
2] that the temperature will continue to increase in the early 21st century. Compared with 1850–1900, the global warming predicted by the end of the 21st century (2081–2100) will reach 1.02–5.62 °C, which will have a profound impact on social development [
3,
4,
5]. Located at high altitudes, the Qinling Mountains in China are sensitive to climate change. These mountains are also known as the ‘central water tower’ of China, as its precipitation directly affects the water supply for production activities and the supply of drinking water for nearly 100 million people in the Guanzhong and Beijing–Tianjin–Hebei regions.
Research shows that the decrease in annual precipitation in the Qinling Mountains is closely related to the East Asian and South Asian summer monsoons and the Southern Oscillation, and the rate is −11.95 mm/10a (1964–2017) [
6,
7]. From 1960 to 2015, extreme precipitation events in the Qinling Mountains decreased, while their intensity increased, with change rates of 35.1 and −7.1 mm/10a in the north and south, respectively [
8,
9]. Most studies on extreme precipitation events in the Qinling Mountains have focused on annual and seasonal variations, influencing factors, and change trends during historical periods [
10,
11,
12], paying little attention to future precipitation changes in the Qinling Mountains. At present, the consistency of research results on future precipitation in the Qinling Mountains is poor. Owing to differences between single-climate models, different studies reported widely differing results. For example, some studies used the NEX-BCC model to predict future precipitation changes in the region and found that the average daily precipitation in the Qinling Mountains will generally increase in the future, with a linear trend between 1.83 mm/10a and 2.20 mm/10a [
13]. In contrast, other studies used the MPI-ESM-LR climate model to predict the future average precipitation in the region, reporting a linear trend between −22 mm/10a and 0.85 mm/10a [
14]. Therefore, the prediction of future climate change in the Qinling Mountains with multi-model coupling would be helpful in exploring the climate-change law in mountainous areas and provide reference for regional water-resources planning.
Previous studies on future precipitation change in the Qinling Mountains were all based on the results of the CMIP5 coupled model in the IPCC’s Fifth Assessment Report (AR5) [
13,
14]. Nevertheless, the newly released CMIP6 model is significantly improved compared to CMIP5. CMIP6 uses shared socioeconomic pathways (SSPs) and continues the representative concentration pathways (RCPs) of the previous version, enriches future-prediction scenarios, and improves simulations [
15,
16,
17]. The new scenarios include not only changes in population, economy, ecology, resources and other factors, but also measures and technologies addressing climate change. By designing new scenario-prediction tests with different combinations of SSPs and radiation forcing, different changes in global climate in the future can be predicted under the control of different emission scenarios, policies, and measures. In this manner, evaluation variables can be made more comprehensive and more systematic, so scenarios closer to objective reality can be simulated [
18,
19,
20].
At present, studies on climate change in the Qinling mountains using CMIP6 model data are still in their infancy, and studies on spatio-temporal changes in the future precipitation in the Qinling Mountains, using CMIP6 data under different SSP scenarios, are lacking. To address this issue, this study evaluated the ability of multi-model coupling in simulating annual-precipitation change in the historical period of the Qinling Mountains (1961–2014) using the published CMIP6-scenario-model data, and analyzed the spatio-temporal distribution and mechanism of future precipitation change in the Qinling Mountains. The findings provide a scientific basis for formulating regional water-resources response strategies under the background of future climate change.
2. Data and Methods
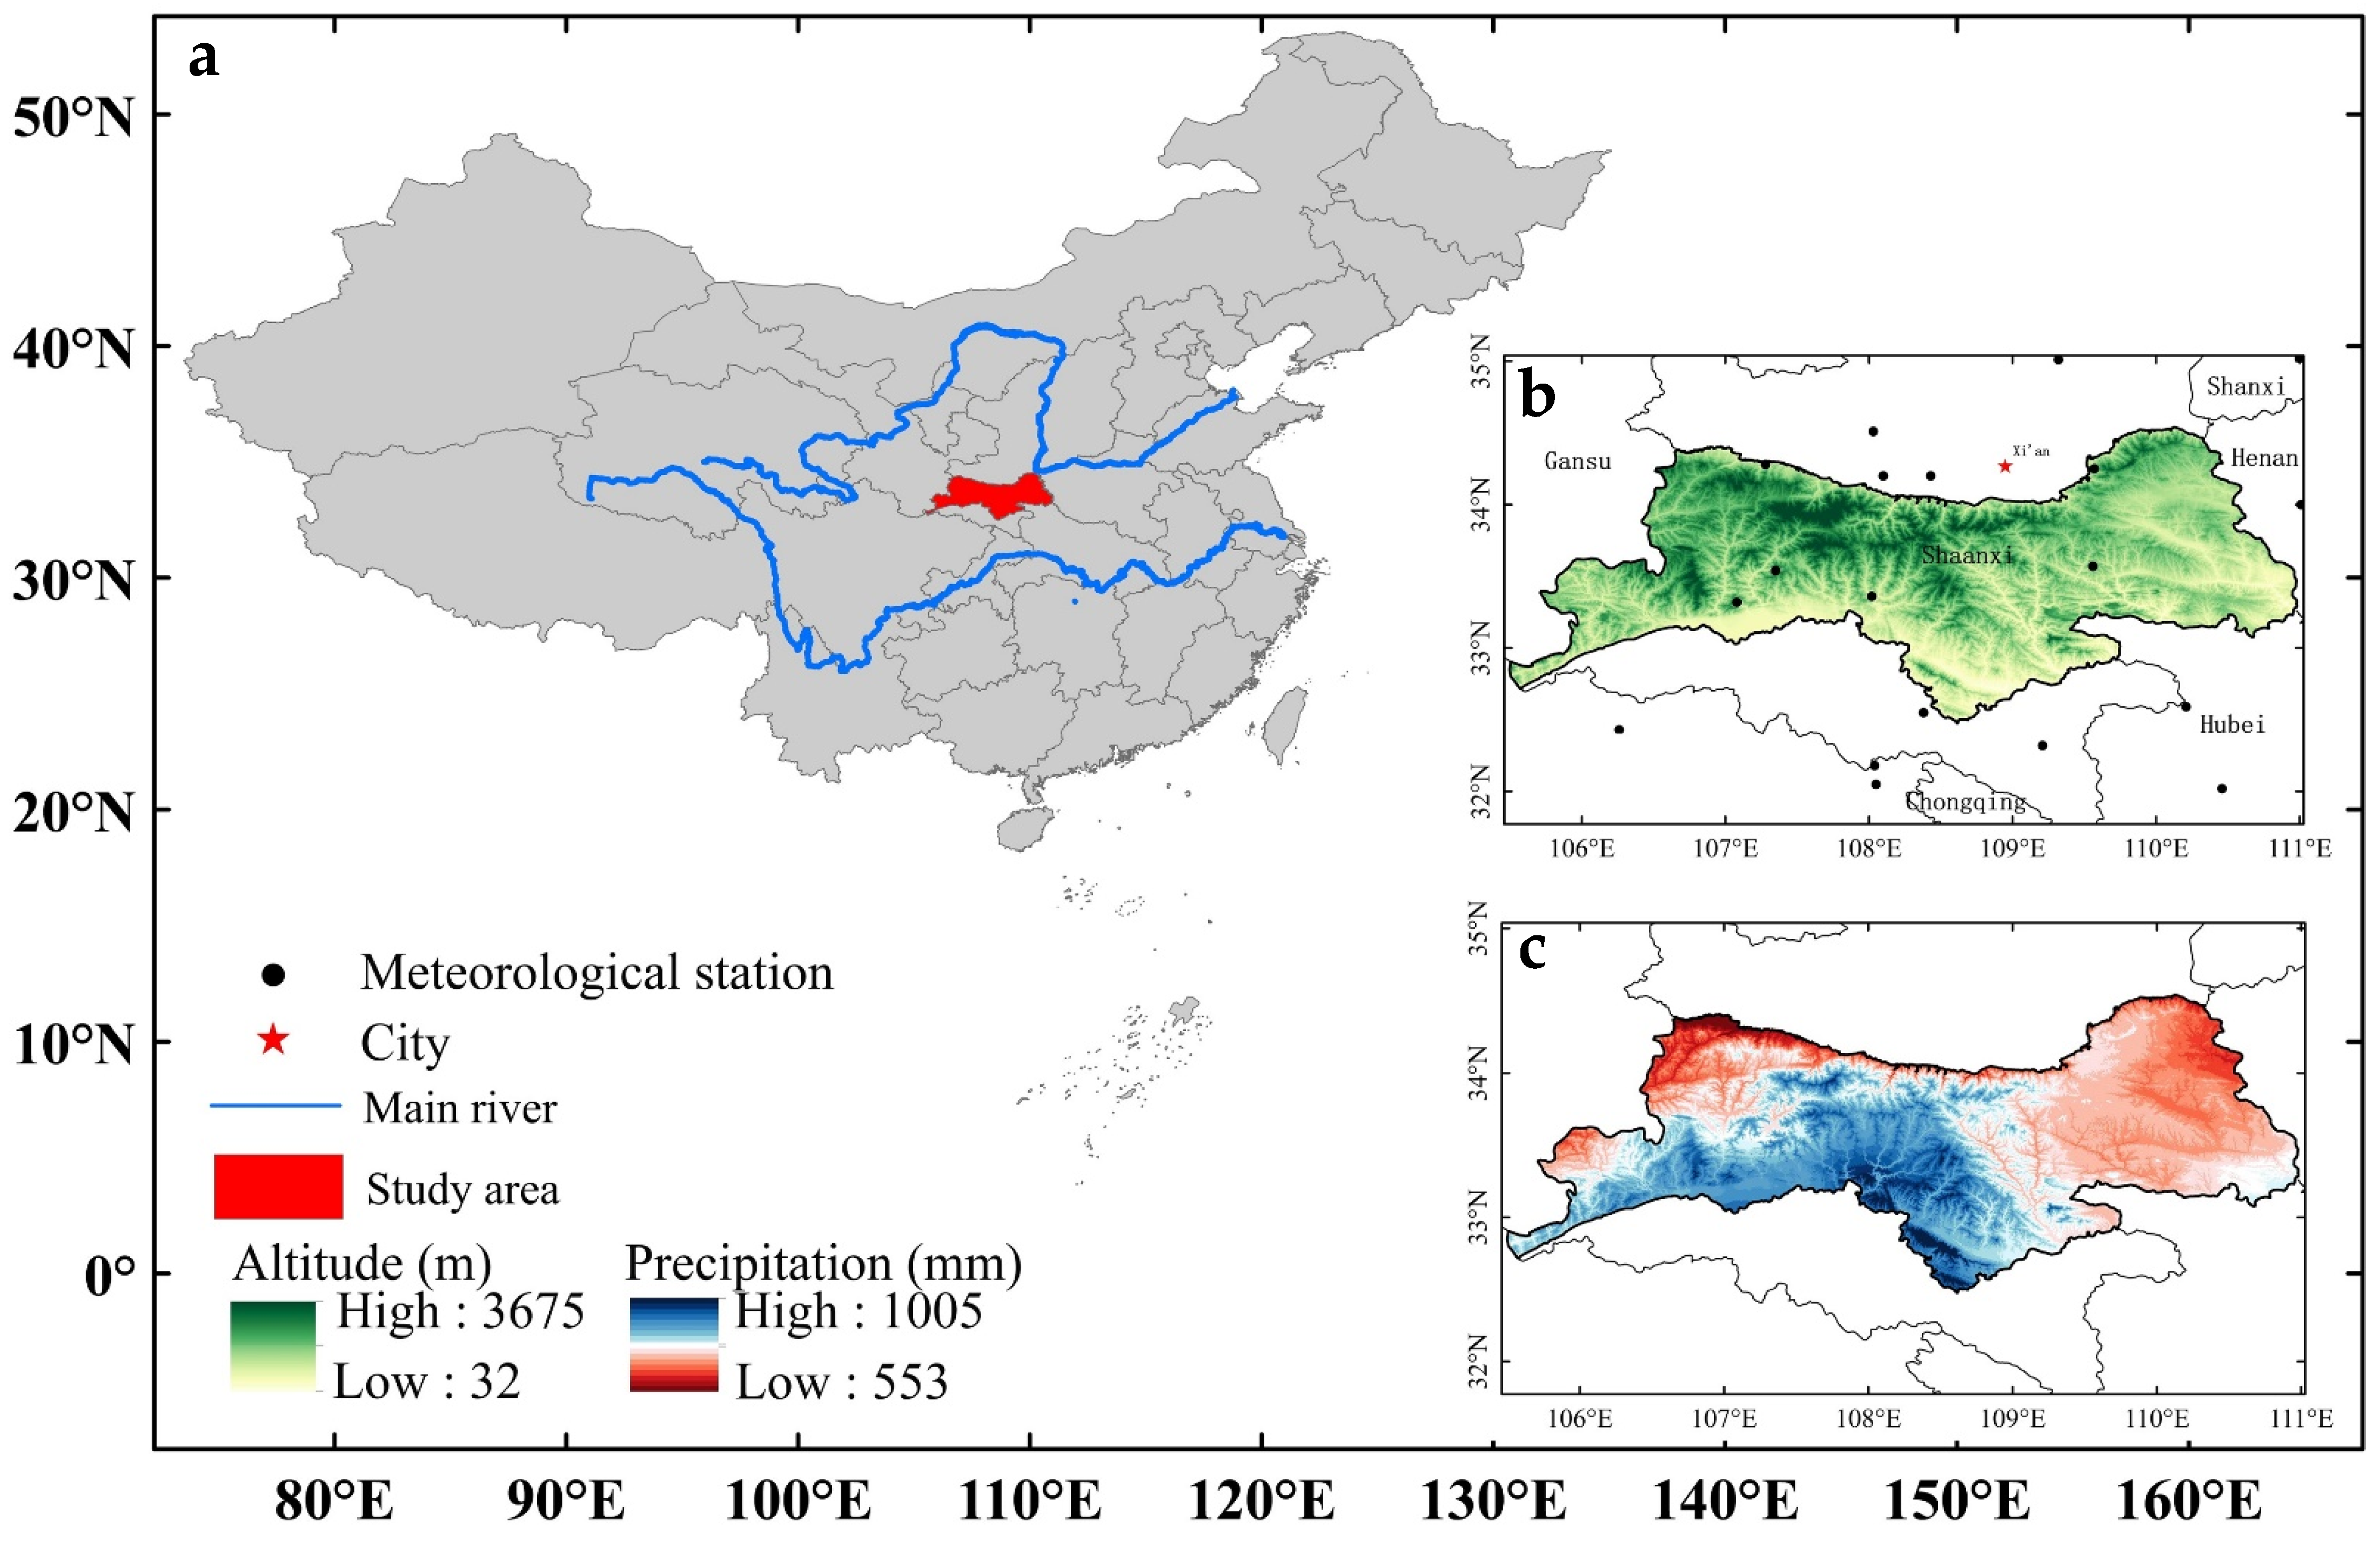
The Qinling Mountains are the dividing line between the north subtropical zone and the warm temperate zone in China. These mountains are also the watershed between the Yellow River and the Yangtze River. With their unique geographical location, they serve as an important ecological barrier in China. In this study, the hinterland of the Qinling Mountains in Shaanxi province, located at 32°–35° N and 105°–111° E, was taken as the study area. The study area covers approximately 62,000 km2, and has an altitude range of 198–3675 m, with an average altitude of approximately 1600 m (
Figure 1). The annual precipitation of the Qinling Mountains is 545–1155 mm (1959–2015), with an average of 825 mm [
21]. Precipitation exhibits wide spatial variability and uneven seasonal distribution, with the southern part receiving more precipitation than the north.
2.1. Data
The CMIP6 model comes from different institutions around the world. Due to the differences in the physical process considered by the institutions and the different components of the land surface, atmosphere, and ocean adopted by the model of the same institution, the adaptability of the CMIP6 model in various regions is also distinct, and the simulation results are quite different. Since the simulation-effect evaluation of the CMIP6 model on precipitation in the Qinling Mountains has not been carried out, the nine CMIP6 models that have been released by the seven institutions with complete simulation scenarios are selected as the basic data for this study (
Table 1) (
https://esgf-node.llnl.gov/projects/cmip6/, accessed on 9 June 2022). The historical period of the CMIP6 model is 1850–2014, and the future period is 2015–2100. From the CMIP6-model data, four development scenarios were selected, namely SSP1, SSP2, SSP3, and SSP5, which represent sustainable development, moderate development, local development, and conventional development, respectively. Those were combined with the four Representative Concentration Pathways (RCPs) of CMIP5, SSP1-2.6, SSP2-4.5, SSP3-7.0, and SSP5-8.5, which were selected as the basic data for predicting future climate change [
22,
23]. It should be noted that in this study, the multi-model ensemble (MME), the best-model ensemble (BM), and the worst-model ensemble (WM) were added on the basis of evaluating the applicability of the nine models. This method has been widely used in the evaluation of CMIP models, and some studies have pointed out that the multi-mode set is more reliable than a single-model simulation [
24].
As the reference observation data for model evaluation, a surface climate dataset (
https://data.cma.cn/, accessed on 1 May 2021) provided by the National Meteorological Information Center was adopted. Meanwhile, the monthly average-precipitation data (hereinafter referred to as observation data) of 22 meteorological stations with complete data from 1970 to 2014 for the Qinling Mountains and its surrounding areas were selected, to evaluate the simulation performance of CMIP6 over the historical period.
2.2. Methods
2.2.1. Model Evaluation and Data Correction
In this study, when evaluating the simulation effect of CMIP6 data on precipitation in the Qinling Mountains, the bilinear interpolation method was used to interpolate CMIP6 data to the longitude and latitude of the meteorological station. Then, the model data and observation data in the historical period (1970–2014) were compared, and the Taylor diagram method was used to evaluate the simulation ability. Specifically, on the standardized Taylor diagram [
25], the standard deviation, root-mean-square error, and correlation coefficient of the model simulation data and observation data on temporal and spatial scales were drawn, in order to directly reflect the ability of the model to simulate the spatio-temporal variation of the annual precipitation of the Qinling Mountains in the historical period. In order to reduce systematic errors of the model, linear regression was performed to correct the deviation of the optimal dataset. In addition, to compare the change amplitude in different periods and integrate the characteristics of climate change in the Qinling Mountains with existing results of relevant studies using CMIP6 [
26], the reference period was set as 1995–2014.
2.2.2. Data-Downscaling Method
In the processing of precipitation data for the future period, the bilinear interpolation method was used to uniformly interpolate the CMIP6 dataset to the resolution of 0.5° × 0.5°, and linear regression was then performed to correct the error of the optimal model data according to the historical data. Finally, thin-plate-spline interpolation was used to uniformly interpolate the optimal model data to the 1 km × 1 km grid. The thin-plate-spline interpolation method takes into account some variables, such as altitude, longitude, and latitude, which can facilitate the spatial interpolation of meteorological elements with high precision. In addition, this method has also been successfully applied to the study of climate change in the Qinling Mountains [
27]. The formula is as follows:
Zi is the dependent variable at the point in the interpolation space
i (
i = 1,...,
N).
xi is the latitude vector
d about a spline independent variable.
f is the unknown smooth function about
xi.
yi is the dimension vector
p about an independent covariate.
b is the dimension coefficient
p of
yi.
ei is the random error of an independent variable with an expected value of 0 and a variance of
wiσ2.
wi is the known local-variation coefficient as the weight,
σ2 is the error variance and is constant at all data points but is generally unknown [
28]. When the term
f (
xi) is missing, the function and coefficient vector can be estimated by least squares:
Jm(f) is the function measuring the complexity of f (xi). It is defined as the integral of the m partial derivative of function f, and p is a smoothing parameter.
3. Results and Analysis
3.1. Precipitation-Simulation Ability of the CMIP6 Model
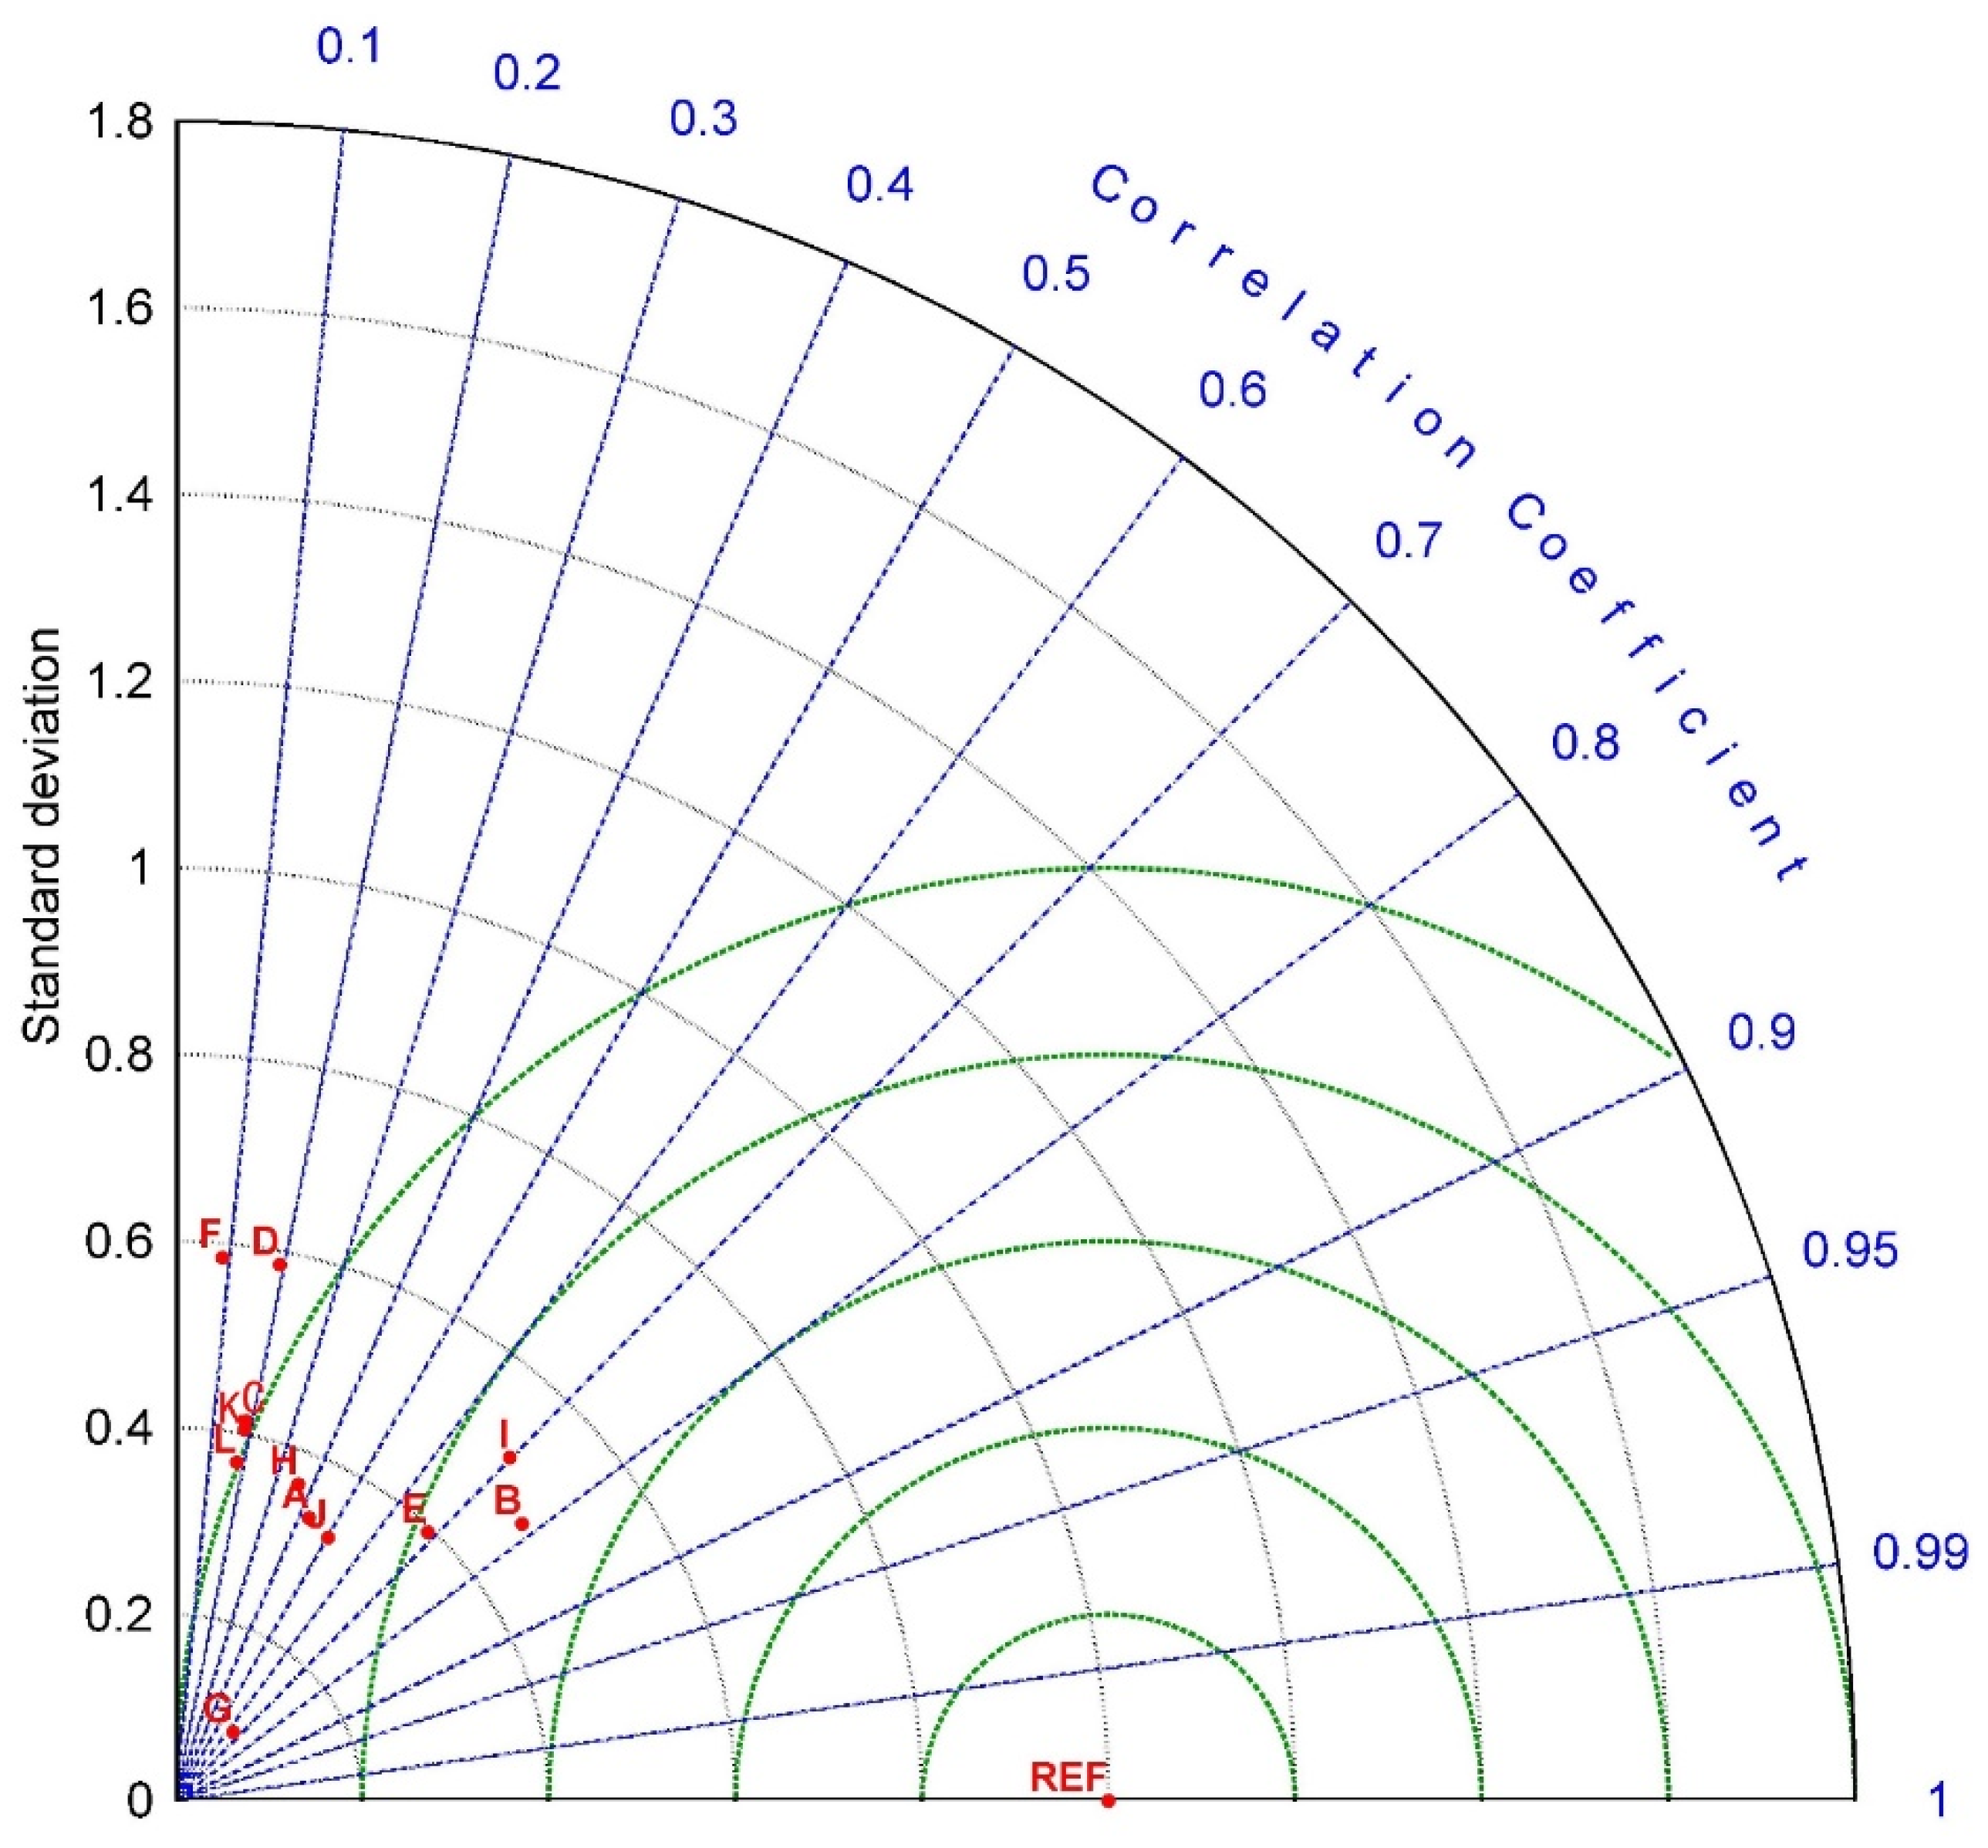
According to the Taylor diagram (
Figure 2), the 12 CMIP6 datasets showed large differences in simulating the spatial distribution of precipitation in the Qinling Mountains during the historical period. The correlation coefficients between measured and simulated annual precipitation were concentrated between 0.1 and 0.8, with an average value of 0.36. The ratio of standard deviation between the model simulation and observation ranged between 0.09 and 0.59, and the root-mean-square error after standardization ranged between 0.71 and 1.12. According to the evaluation, the simulation effect of the BM dataset comprising CanESM5, EC-Earth3-Veg, INM-CM4-8, and INM-CM5-0 was better than that of all individual datasets, and also better than those of the MME datasets and WM datasets, which comprised EC-Earth3-Veg-LR, ACCESS-ESM1-5, NESM3, and SAM0-UNICON. From the Taylor diagram, the correlation coefficient, standard deviation ratio, and normalized root-mean-square error were found to be 0.8, 0.51, and 0.71, respectively. As shown in
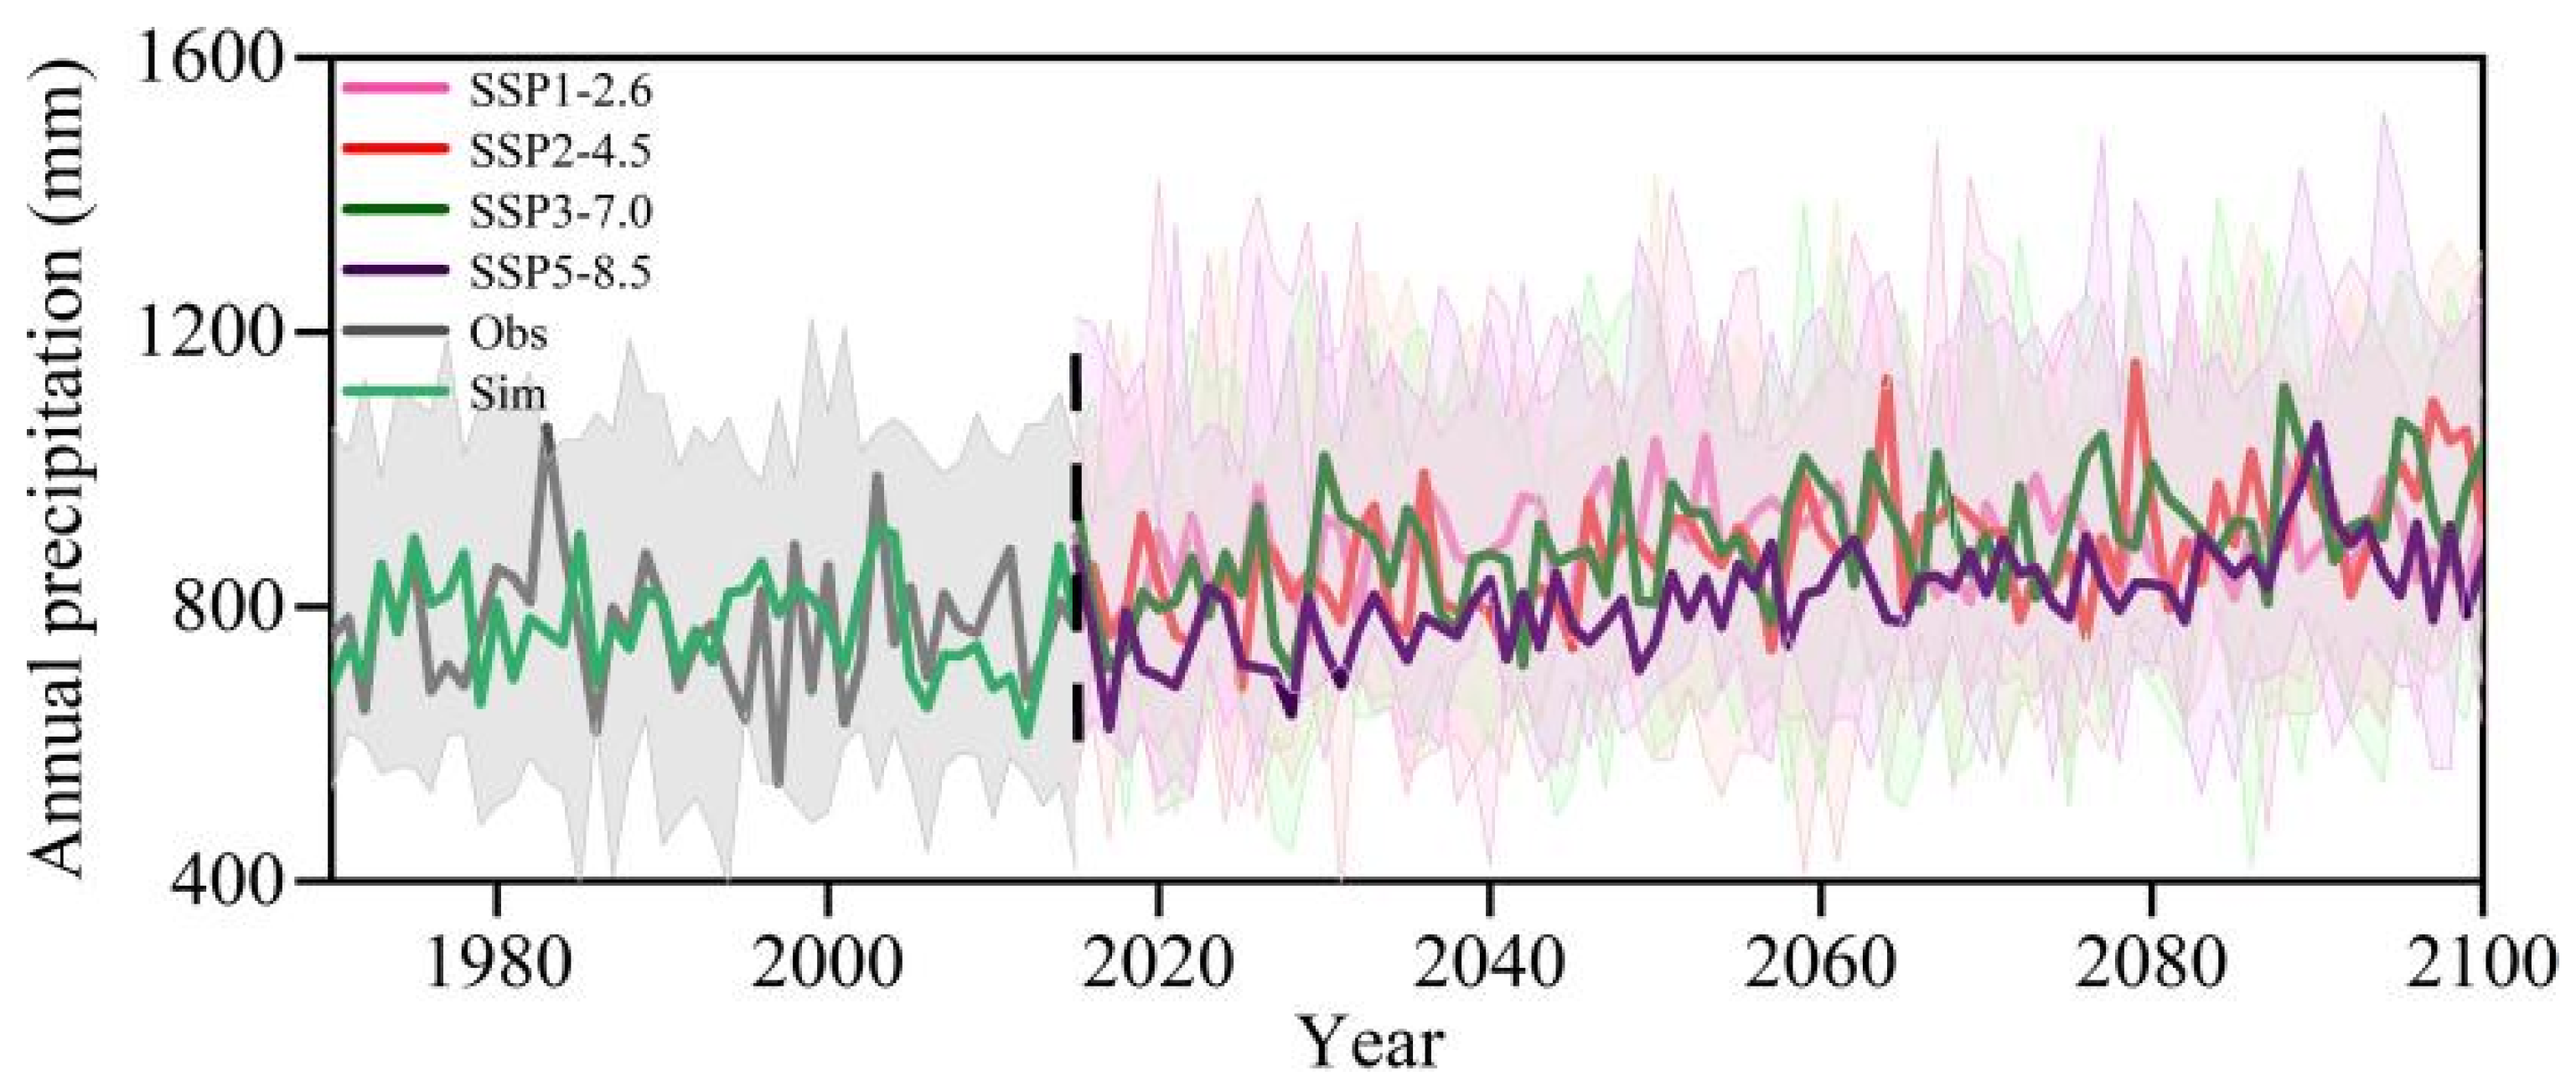
Figure 3, changes in the annual precipitation in the Qinling Mountains from 1970 to 2014 were further compared between observations at 22 meteorological stations and the BM dataset. The annual precipitation from the BM dataset was between 614 and 914.6 mm, with a change rate of −6.7 mm/10a. The annual precipitation from the observations at 22 meteorological stations was 543.9–1062.1 mm, with a change rate of −2.1 mm/10a. On this basis, the simulation results using the BM dataset were used to investigate the precipitation change in the Qinling Mountains in the 21st century.
3.2. Temporal and Spatial Distribution of Precipitation Change in the Qinling Mountains from 2015 to 2100
3.2.1. Temporal Change
Based on the corrected BM data, the change trend of annual precipitation in the Qinling Mountains under different SSP scenarios (SSP1-2.6, SSP2-4.5, SSP3-7.0, and SSP5-8.5) from 2015 to 2100 was obtained. The difference in the magnitude of the predicted precipitation under the four scenarios was relatively small. The multi-year average precipitation was 893, 879.8, 894.3, and 810.8 mm, respectively. The Z-value of the M-K test was greater than 1.96, representing a significant increasing trend of precipitation over 86 years. Compared with the reference period (1995–2014), precipitation in mountainous areas in 2100 under the four scenarios will have increased by 161, 153.4, 258.6, and 94.2 mm, respectively.
3.2.2. Spatial Distribution
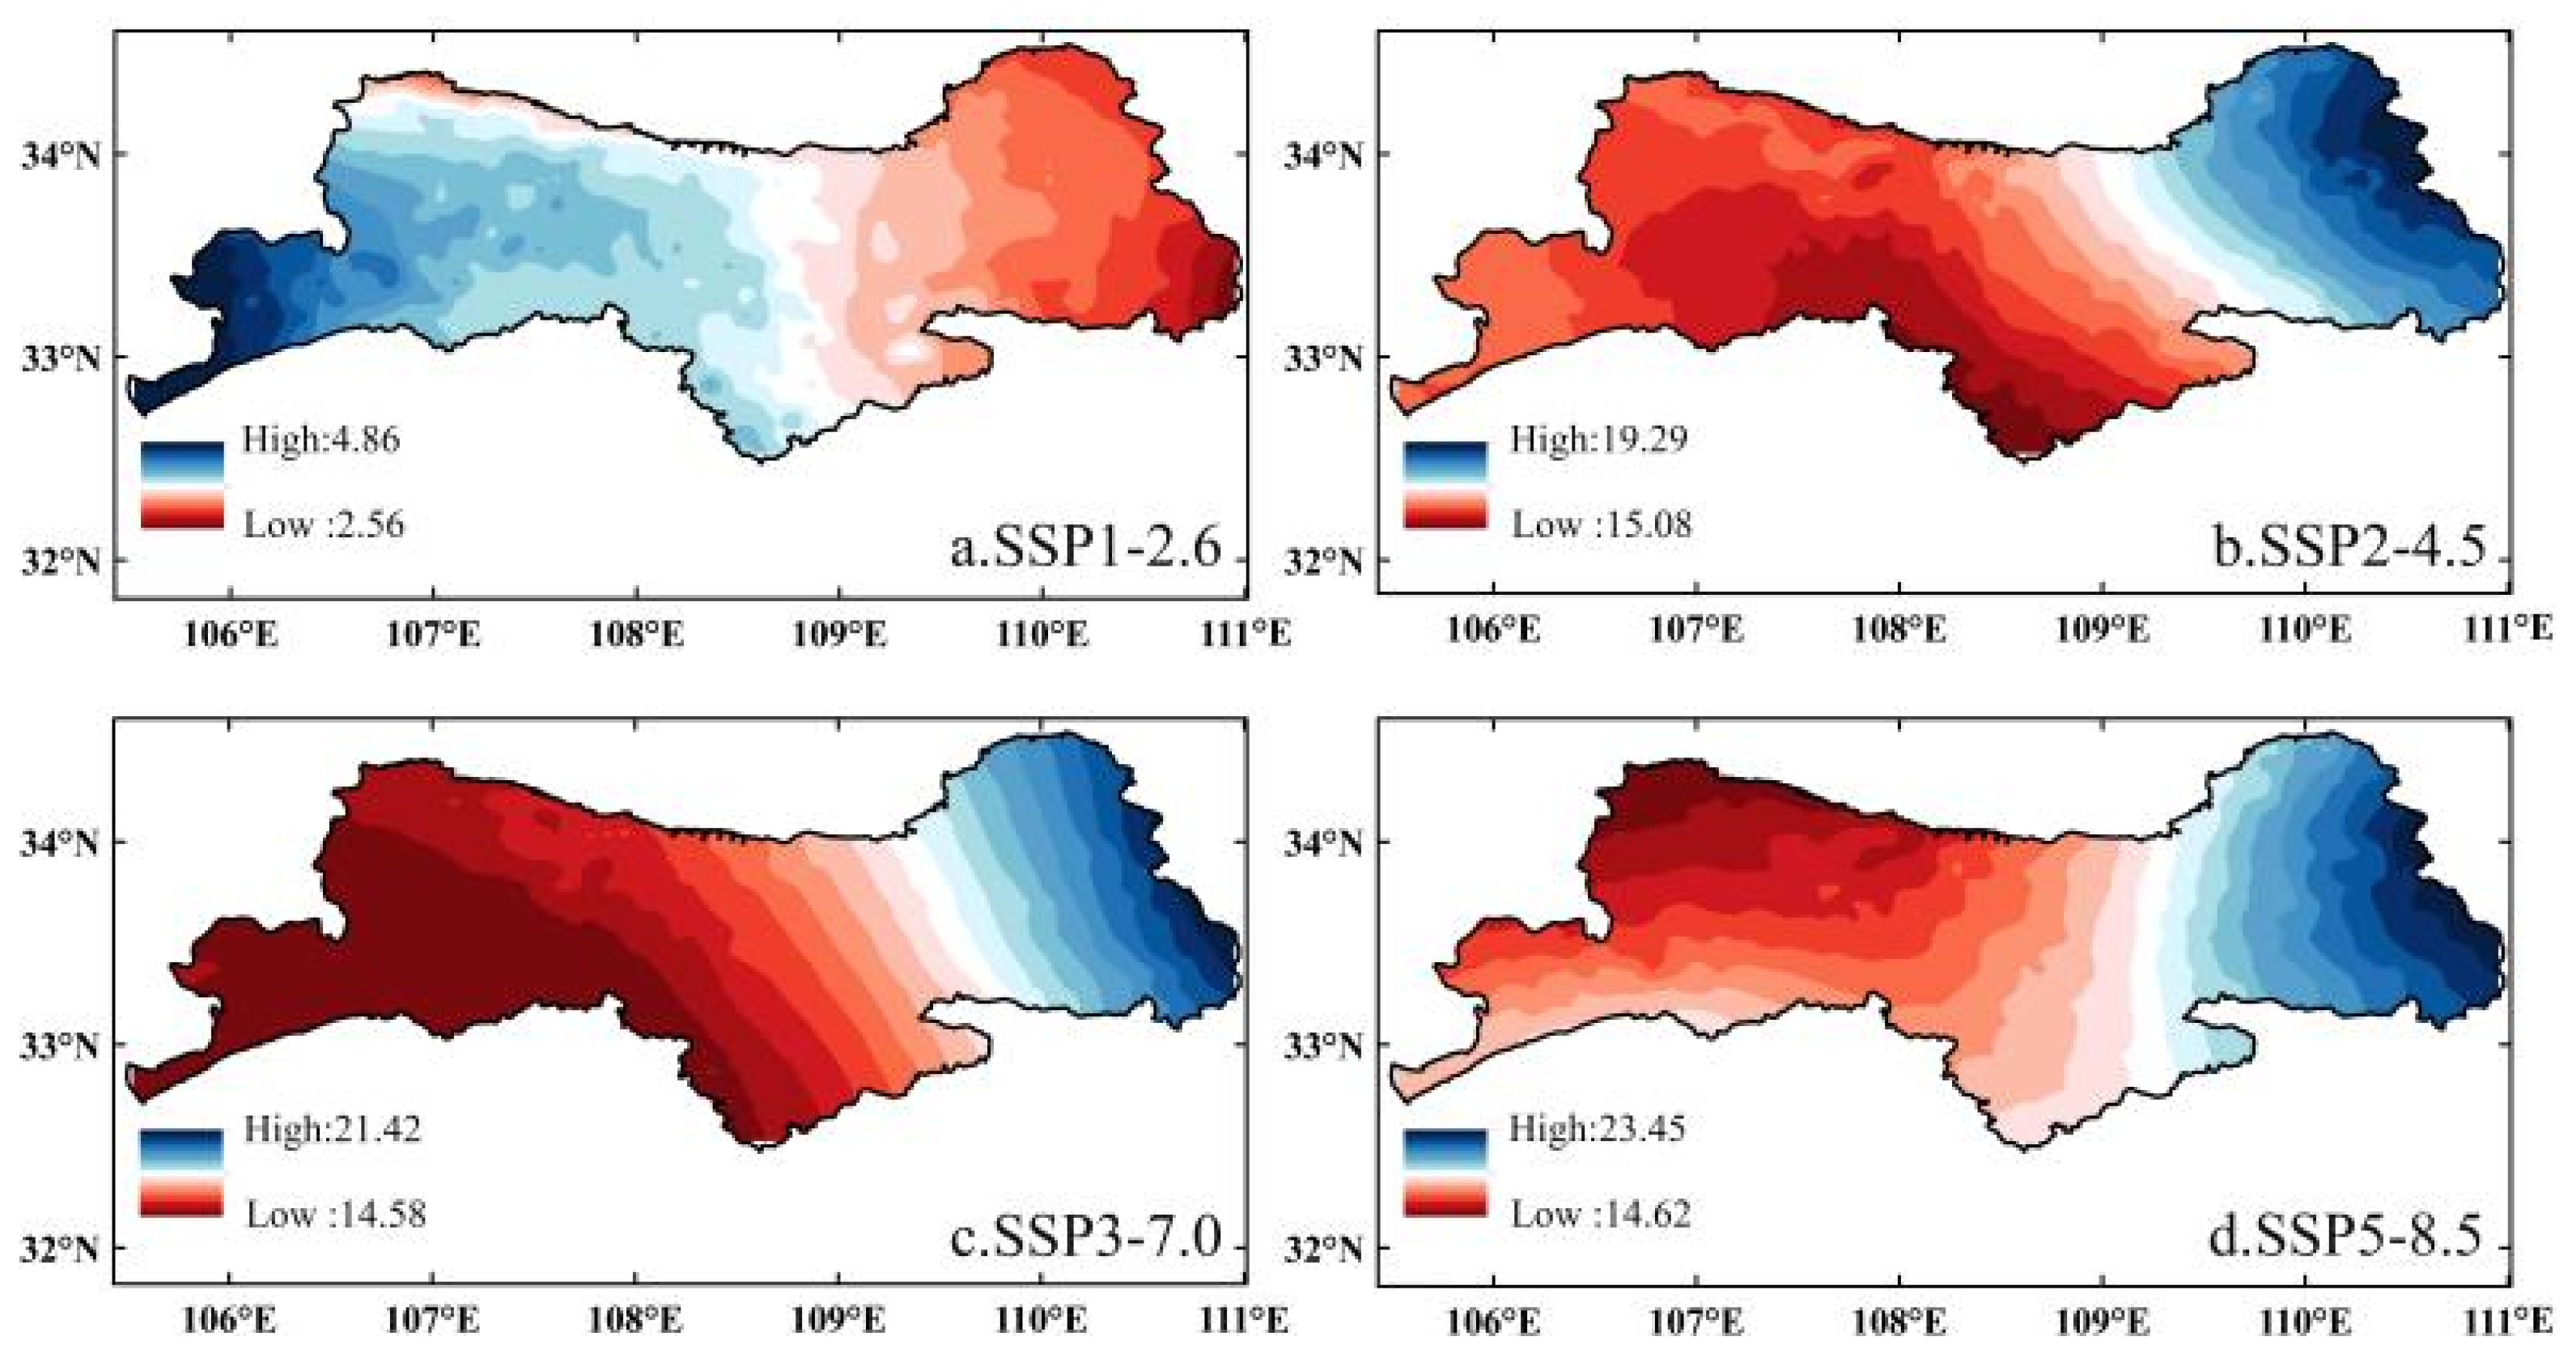
Using the BM dataset, the spatial-linear-variation trend of precipitation in the Qinling Mountains from 2015 to 2100 was obtained (
Figure 3). The spatial-variation trend of precipitation was found to widely vary under different scenarios (
Figure 4). Under SSP1-2.6, the largest precipitation-increase trend was observed in the western Jialing River area (33°29′–33°45′ N, 105°72′–106°29′ E) and the smallest in the eastern Danjiang area (33°06′–33°84′ N, 110°47′–110°98′ E). The spatial-distribution pattern of precipitation-change trends under the other three scenarios were similar. The precipitation-increase center is located in the Danjiang area, while the area with the smallest increase trend is concentrated in the Jialing River area. Under the scenarios of SSP1-2.6, SSP2-4.5, SSP3-7.0, and SSP5-8.5, the spatial variation of precipitation in the mountainous areas are 4.4 mm/10a (2.55–4.86 mm/10a), 18.5 mm/10a (15.08–19.3 mm/10a), 18.1 mm/10a (14.57–21.42 mm/10a), and 19.1 mm/10a (14.63–23.46 mm/10a), respectively. With the scenario changing from low to high emissions, on the one hand, the increase rate of precipitation continues to increase; on the other hand, the spatial difference of the increase rate also gradually increases. For example, the precipitation increase rate in the Danjiang area accelerates from 2.55 mm/10a under SSP1-2.6 to 23.46 mm/10a under SSP5-8.5. The differences between the Jiangling River area and the Danjiang area are 2.31 mm/10a under SSP1-2.6 and 8.83 mm/10a under SSP5-8.5.
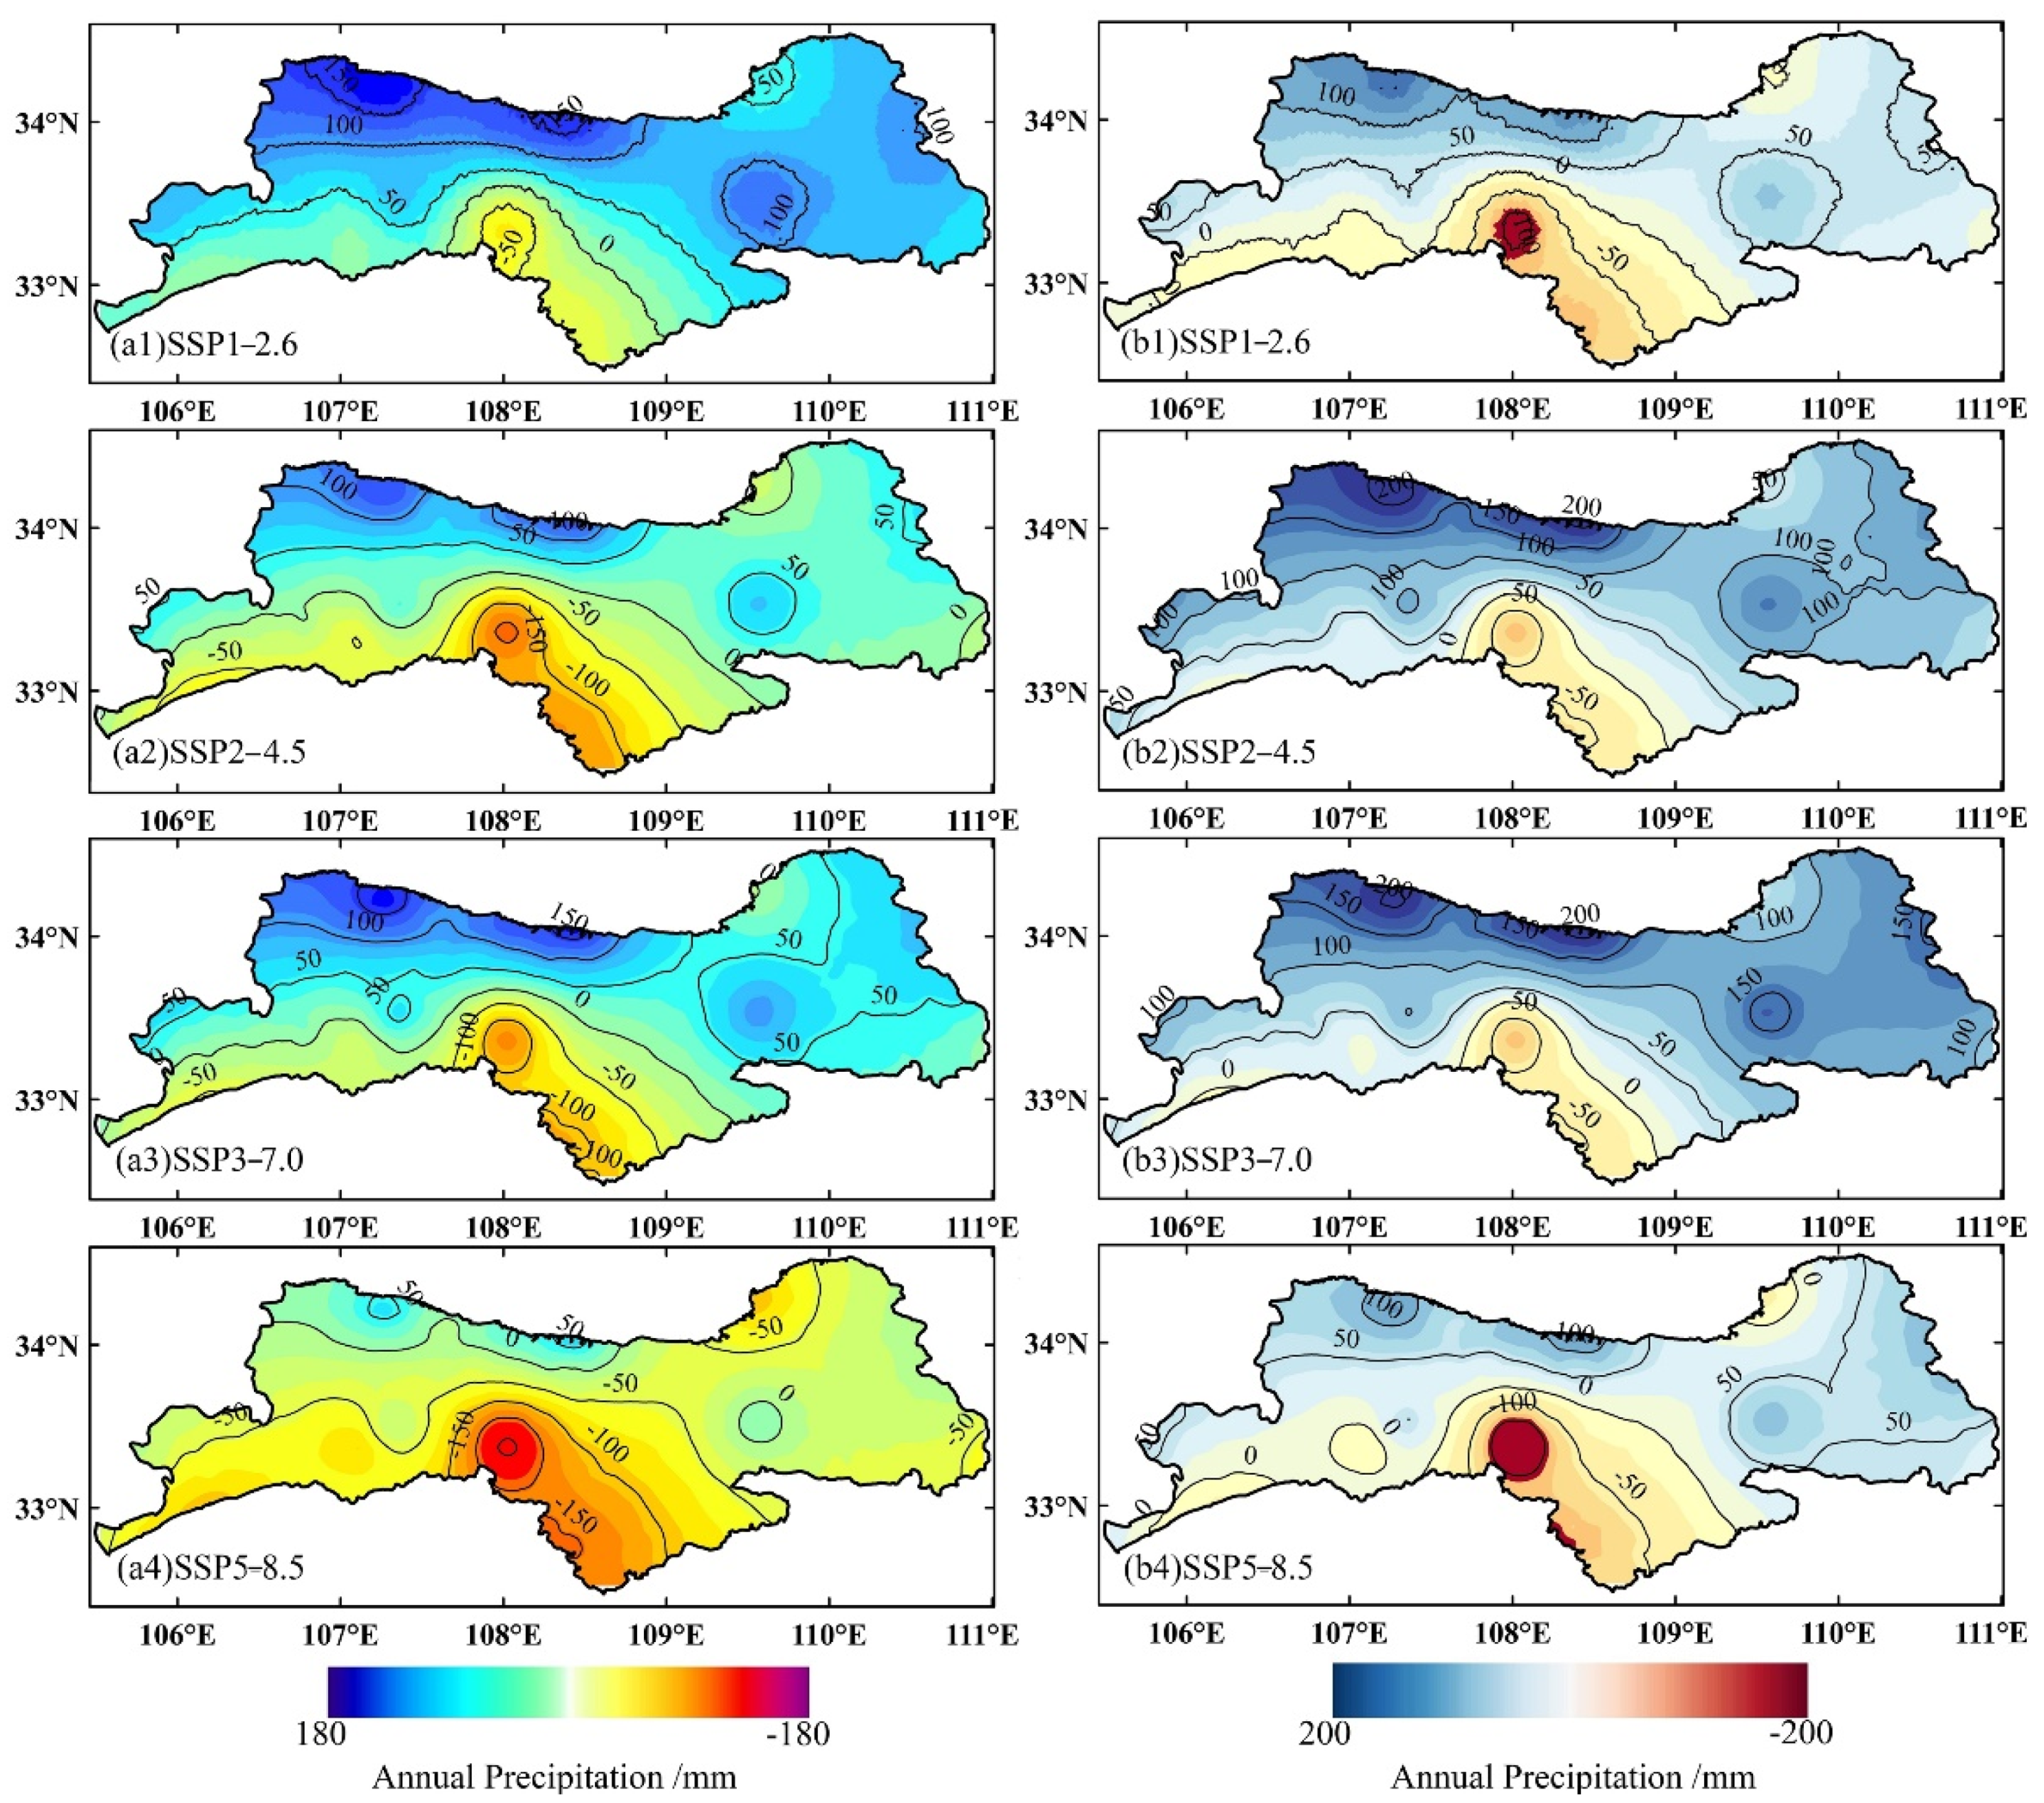
3.2.3. Variation Range of Precipitation over the Qinling Mountains during the Middle and Late 21st Century
The middle and end of this century are important periods for assessing climate change in the Qinling Mountains in the 21st century. Compared with the historical period (1995–2014), the meteorological elements of the Qinling Mountains simulated using BM data show different change rates and amplitudes under different SSP scenarios in the middle of the 21st century (2041–2060) and the end of the 21st century (2081–2100). However, the spatial distributions are essentially similar (
Figure 5). Areas with large increases in precipitation are concentrated in the northwest of the mountain areas, especially in the Heihe area (33°72′–34°05′ N, 107°71′–108°31′ E) at the north foot of the Qinling Mountains, whereas the smallest increase is observed in the Ziwu River area (32°95′–33°21′ N, 107°93′–108°35′ E) in the south.
Under SSP1-2.6, the average annual precipitation in the middle (2041–2060) and end (2081–2100) of the 21st century in the Qinling Mountains will increase by 64.1 mm (−99.4–194.1 mm) and 29.5 mm (−133.2–163.5 mm), respectively, compared with the reference period (1995–2014). Compared with the middle period, the increase in precipitation at the end of the 21st century is small, indicating that under the low forcing scenario, the increase in precipitation in the Qinling Mountains will gradually slow down in the future. Under SSP2-4.5, the annual precipitation in the middle and end of the 21st century will increase by 7 mm (−161.9–143.3 mm) and 77.2 mm (−91.7–214.5 mm), respectively, compared with the reference period. Under SSP3-7.0, the average annual precipitation in the middle and end of the 21st century will increase by 28.8 mm (−139.2–166.7 mm) and 82.9 mm (−90.5–214.5 mm), respectively. Under SSP5-8.5, the average annual precipitation in the middle and end of the 21st century will increase by −51 mm (−208.3–65.1 mm) and 21.2 mm (−145.1–126.9 mm), respectively. Under this scenario, the precipitation increase will increase at the end of the 21st century, indicating that the increase rate of precipitation will accelerate under the conditions of high social vulnerability and anthropogenic radiation forcing.
4. Discussion
In the Qinling Mountains, precipitation is mainly concentrated in the flood season (May–September), accounting for approximately 75% of the observed total annual precipitation (1970–2015). Therefore, precipitation in the flood season determines the change of the total precipitation in the Qinling Mountains. Flood-season precipitation in the Qinling Mountains has been found to be generally controlled by the south winds [
29], comprising the southeast wind from the equatorial western Pacific region and the southwest wind from the Bay of Bengal and the northern South China Sea [
30,
31]. In abnormally rainy years, influenced by the subtropical high in the western Pacific, the southerly wind is strengthened northward and meets the southward northerly airflow moving eastward from the Lake Baikal area in the Qinling area, resulting in more precipitation [
32,
33]. In abnormally low rainfall years, the Qinling area is mainly controlled by the northerly wind. The warm and humid water vapor from India and the Bay of Bengal is weak and not conducive to northward transport, and, thus, it provides less precipitation [
34].
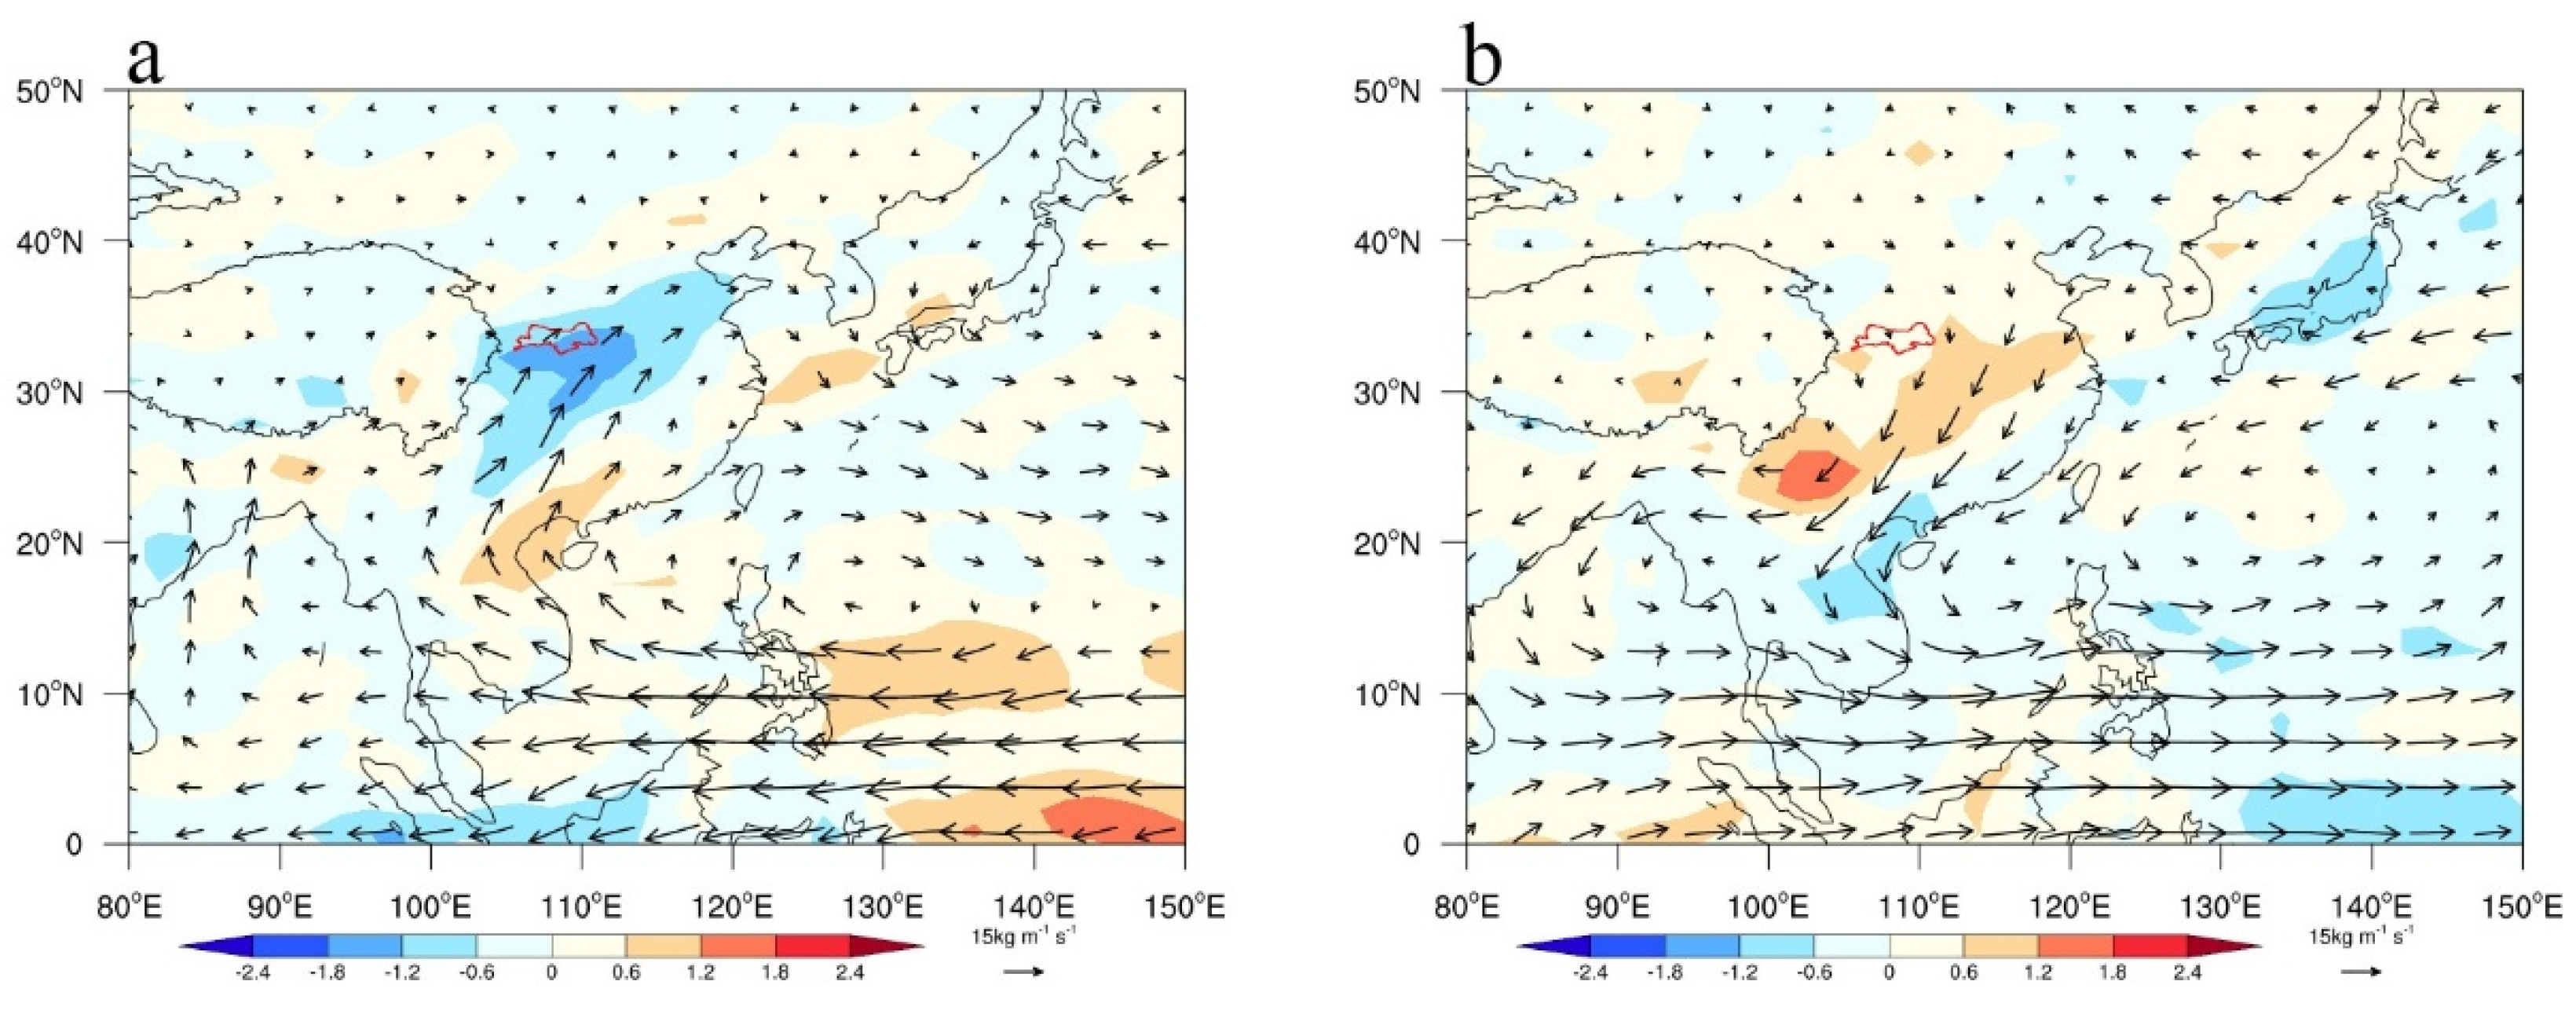
In this study, years with precipitation higher than one standard deviation are defined as rainy years, whereas those with precipitation lower than one standard deviation are defined as less rainy years. Comparing the water-vapor flux and divergence field in the flood season of abnormal years under different emission scenarios in 2015–2100 from the BM dataset (
Figure 6), the reason for the change in flood-season precipitation was found to be essentially consistent with that of the historical period. In other words, the abnormal increase (decrease) of water-vapor transport in the south induces the abnormal increase (decrease) of flood-season precipitation. In rainy years, the southeast water vapor from the equatorial western Pacific and the southeast water vapor from India and the northern Bay of Bengal increase significantly. In the eastern Tibetan Plateau, including the Qinling Mountains, atmospheric convergence is strengthened, and convective activity is vigorous. Under changing scenarios with continuously increasing emissions, water-vapor transport via the southwest airflow from India and the Bay of Bengal to the Qinling Mountains increases, which may be related to the enhancement of the South Asian summer monsoon. Water vapor transport from the equatorial western Pacific to the west is enhanced and transformed into the southwest airflow in the Bay of Bengal to the Qinling Mountains, resulting in an abnormal increase in precipitation in the flood season of the Qinling Mountains. In less rainy years, the reason for the decrease in precipitation in the flood season in Qinling is the same as that in the historical period. In other words, the Qinling area is mainly controlled by northerly airflow, its atmospheric dispersion is strengthened, its convective activity is weakened, the India–Burma trough is weak at low latitudes, and the arrival of southwest airflow to the Qinling Mountains is restricted.
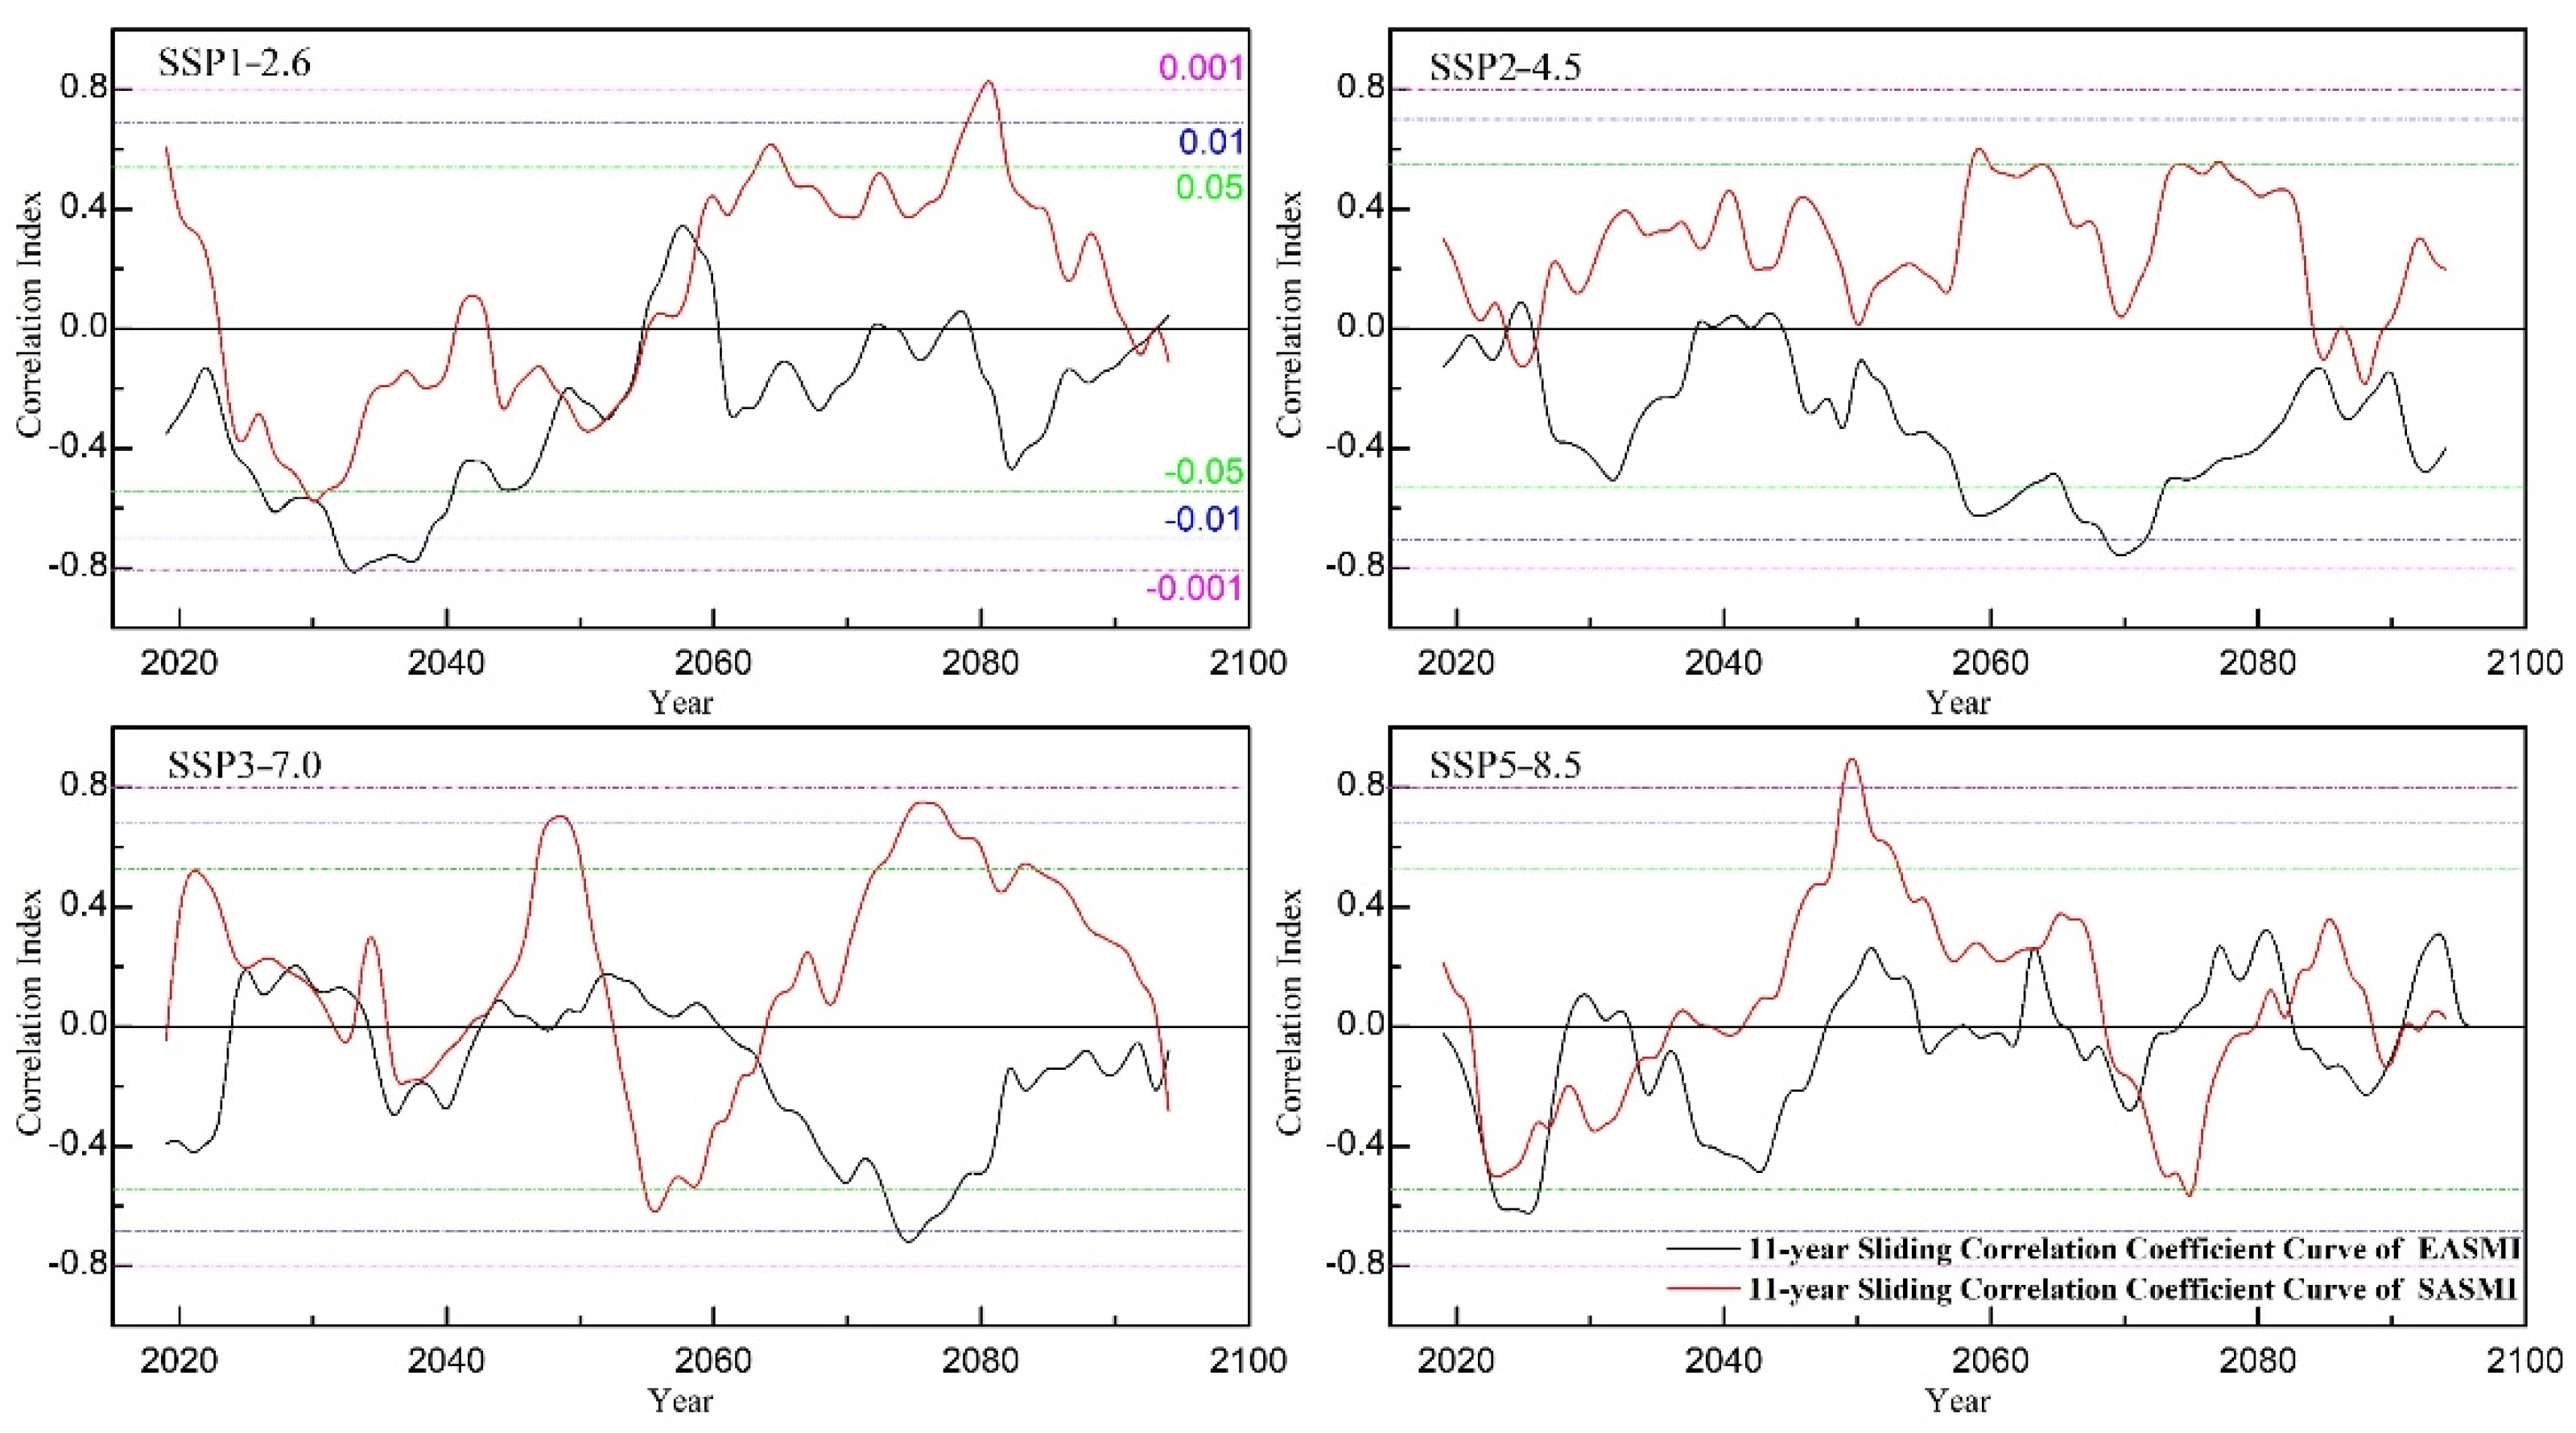
In order to explore the relationship between precipitation and monsoon in the Qinling Mountains, a correlation analysis was performed between the East Asia Summer Monsoon Index (EASMI) and South Asia Summer Monsoon Index (SASMI), and precipitation was defined by Zhang and Goswami [
35,
36]. As shown in
Figure 7 and
Table 2, negative and positive correlations were observed between precipitation and the East Asian summer monsoon and South Asian summer monsoon, respectively, which is similar to the results of Li et al. [
37]. Under the low-emission scenario (SSP1-2.6), flood-season precipitation in the Qinling Mountains is significantly affected by the East Asian summer monsoon, reaching the significance level of 0.01. This indicates a strong correlation between flood-season precipitation in 2020–2050 and the East Asian summer monsoon. The correlation coefficient between the South Asian summer monsoon and flood-season-precipitation continues to rise in 2050–2090. Under SSP2-4.5, the correlation coefficient between precipitation and the East and South Asian summer monsoons reaches the level of 0.001, with strong correlations during 2060–2080. Compared with SSP1-2.6, the South Asian monsoon has stronger control over precipitation in the Qinling Mountains. Under SSP3-7.0, the correlation coefficients between precipitation and the East and South Asian summer monsoons are −0.26 and 0.34, respectively. During 2060–2100, precipitation shows strong negative correlation with the East Asian monsoon but strong positive correlation with the South Asian monsoon, indicating that the control of the South Asian summer monsoon on precipitation in the Qinling Mountains is further strengthened. Under SSP5-8.5, the correlation coefficients between precipitation and the East and South Asian summer monsoons are −0.23 and 0.48, respectively, which means that the region is affected by the East Asian summer monsoon and South Asian summer monsoon. At the same time, the impact of the South Asian summer monsoon on precipitation is more significant in the flood season.
On the whole, with changing scenarios of increasing emission, the water vapor transported westward from the Pacific to the Bay of Bengal continues to increase, and the southeast water-vapor transport from the Western Pacific weakens. With the increase in southwest water-vapor transport from the Indian Ocean and the western Pacific through the north of the Bay of Bengal, precipitation in the flood season of the Qinling Mountains will change from southeast transport of water vapor to southwest transport in the future.
5. Conclusions
To investigate precipitation changes in the Qinling Mountains in the 21st century, CMIP6 datasets were evaluated against observation data. The four-model ensemble (BM) was found to outperform most single models in simulating precipitation. Using the simulation results of the revised BM data, the annual precipitation in the Qinling Mountains was found to increase from 2015 to 2100 at rates of 4.4 mm/10a, 18.5 mm/10a, 18.1 mm/10a, and 19.1 mm/10a under SSP1-2.6, SSP2-4.5, SSP3-7.0, and SSP5-8.5, respectively. Over the 86 years, precipitation shows an increasing trend and passes the M-K significance-level test. Compared with the reference period from 1995 to 2014, by the middle of this century (2041–2060), the average annual precipitation in the Qinling Mountains will increase by 64.1 mm, 7 mm, 28.8 mm, and −51 mm, respectively, while by the end of this century (2081–2100), it will increase by 29.5 mm, 77.2 mm, 82.9 mm, and 21.2 mm, respectively. Precipitation exhibits different change rates and ranges under different scenarios, but areas with a large precipitation increase are concentrated in the northwest of the mountain areas, whereas the smallest increase is observed in the Ziwu River area in the south.
Precipitation change in the flood season of the Qinling Mountains is mainly controlled by southeast and southwest monsoon. In abnormally rainy years, water vapor from the equatorial western Pacific and northward airflow from India and the Bay of Bengal increases significantly. Under changing scenarios with increasing emission, water-vapor transport via southwest airflow from India and the Bay of Bengal to the Qinling Mountains continues to increase. In less rainy years, the Qinling area is mainly controlled by northerly airflow, atmospheric dispersion is strengthened, convective activity is weakened, and precipitation is reduced. With scenarios of increasing emission, the impact of the South Asian summer monsoon on precipitation change in the flood season of the Qinling Mountains becomes more significant.
Author Contributions
Conceptualization, Z.Z. and K.D.; methodology, Z.Z.; software, Z.Z.; validation, Z.Z., H.L. and Y.M.; formal analysis, Z.Z.; investigation, Z.Z.; writing—original draft preparation, Z.Z. and K.D.; supervision, R.C.; resources, Z.Z.; data curation, Z.Z. and H.L.; writing—review and editing, Z.Z., K.D. and H.L.; visualization, Z.Z.; supervision, K.D.; project administration, K.D. and H.L.; funding acquisition, K.D. and H.L. Moreover, K.D. and H.L. assisted in collecting, analyzing, and interpreting data as well as in writing the manuscript and deciding on the results for publication. All authors have read and agreed to the published version of the manuscript.
Funding
This research was funded by the National Natural Science Foundation of China (41771030) and the National Natural Science Foundation of China (41901071).
Data Availability Statement
Data available in a publicly accessible repository that does not issue DOIs. Publicly available datasets were analyzed in this study. This data can be found here: (
https://esgf-node.llnl.gov/projects/cmip6/, accessed on 9 June 2022).
Conflicts of Interest
The authors declare that they have no known competing financial interest or personal relationships that could have appeared to influence the work reported in this paper.
Abbreviations
The following abbreviations are used in this manuscript:
| IPCC | Intergovernmental Panel on Climate Change |
| CMIP | Coupled Model Intercomparison Project |
| SSP | Shared Socioeconomic Pathway |
References
- Babaousmail, H.; Hou, R.T.; Ayugi, B.; Sian, K.T.C.L.K.; Ojara, M.; Mumo, R.; Chehbouni, A.; Ongoma, V. Future changes in mean and extreme precipitation over the Mediterranean and Sahararegions using bias-corrected CMIP6 models. Int. J. Climatol. 2022, 1–18. [Google Scholar] [CrossRef]
- IPCC. Climate Change 2021: The physical science basis. In Future Global Climate: Scenario-42 Based Projections and Near-Term Information; Cambridge University Press: Cambridge, UK, 2021; pp. 1–195. [Google Scholar]
- Liang, Y.; Gillett, N.P.; Monahan, A.H. Climate model projections of 21st century global warming constrained using the observedwarming trend. Geophys. Res. Lett. 2020, 12, e2019GL086757. [Google Scholar]
- Zhou, T.-J.; Chen, Z.-M.; Chen, X.-L.; Zuo, M.; Jiang, J.; Hu, S. Interpreting IPCC AR6: Future global climate based on projection under scenarios and on near-term information. Clim. Change Res. 2021, 17, 652–663. [Google Scholar]
- Wang, Y.; Li, H.; Wang, H.; Sun, B.; Chen, H. Evaluation of CMIP6 model simulations of extreme precipitation in China and comparison with CMIP5. Acta Meteorol. Sin. 2021, 79, 369–386. [Google Scholar]
- Liu, H.; Dend, C.H.; Shao, J.G.; Guo, Y. Spatiotemporal variations of precipitation and the north-south differences in the QinlingMountains from 1964 to 2017. Res. Soil Water Conserv. 2021, 2, 210–223. [Google Scholar]
- Meng, Q.; Bai, H.; Sarukkalige, R.; Fu, G.; Jia, W.; Zhang, C. Annual and seasonal precipitation trends and their attributions in the Qinling Mountains, a climate transitional zone in China. Theor. Appl. Climatol. 2021, 144, 401–413. [Google Scholar] [CrossRef]
- Tianyuan, Y.; Shuyan, Y.; Fumin, L. Relationship between the Summer Extreme Precipitation in the South and North of the Qinling Mountains and the Western Pacific Subtropical High. Arid. Zone Res. 2019, 36, 1379–1390. [Google Scholar] [CrossRef]
- Li, S.; Yang, S.; Liu, X. Spatiotemporal variability of extreme precipitation in north and south of the Qinling-Huaihe region and influencing factors during 1960–2013. Prog. Geogr. 2015, 3, 354–363. [Google Scholar]
- Shao, Y.; Mu, X.; He, Y.; Sun, W.; Zhao, G.; Gao, P. Spatiotemporal variations of extreme precipitation events at multi-time scales in the Qinling-Daba mountains region, China. Quat. Int. 2019, 525, 89–102. [Google Scholar] [CrossRef]
- Li, C.; Zhang, H.; Singh, V.P.; Fan, J.; Wei, X.; Yang, J.; Wei, X. Investigating variations of precipitation concentration in the transitional zone between Qinling Mountains and Loess Plateau in China: Implications for regional impacts of AO and WPSH. PLoS ONE 2020, 15, e0238709. [Google Scholar] [CrossRef]
- Song, D.; Yan, J.; Ma, L. Study on climatic differentiation in the South and North Qinling Mountains in recent 50 Years. Arid. Zone Res. 2011, 28, 492–498. [Google Scholar]
- Pan, L.J.; Zhang, H.F. Simulation and projection of climate change in Qinling and surrounding areas with NEX-BCC model. Adv. Earth Sci. 2011, 9, 933–994. [Google Scholar]
- Liu, J.; Deng, L.; Fu, G.; Bai, H.; Wang, J. The applicability of two statistical downscaling methods to the Qinling Mountains. J. Appl. Meteorol. Sci. 2018, 29, 737–747. [Google Scholar]
- O’Neill, B.C.; Tebaldi, C.; Van Vuuren, D.P.; Eyring, V.; Friedlingstein, P.; Hurtt, G.; Knutti, R.; Kriegler, E.; Lamarque, J.-F.; Lowe, J.; et al. The scenario model intercomparison project (ScenarioMIP) for CMIP6. Geosci. Model Dev. 2016, 9, 3461–3482. [Google Scholar] [CrossRef] [Green Version]
- Ukkola, A.M.; De Kauwe, M.G.; Roderick, M.L.; Abramowitz, G.; Pitman, A.J. Robust future changes in meteorological drought in CMIP6 projections despite uncertainty in precipitation. Geophys. Res. Lett. 2020, 47, e2020GL087820. [Google Scholar] [CrossRef]
- Eyring, V.; Bony, S.; Meehl, G.A.; Senior, C.A.; Stevens, B.; Stouffer, R.J.; Taylor, K.E. Overview of the Coupled Model Intercomparison Project Phase 6 (CMIP6) experimental design and organization. Geosci. Model Dev. 2016, 9, 1937–1958. [Google Scholar] [CrossRef] [Green Version]
- Jiang, D.; Hu, D.; Tian, Z.; Lang, X. Differences between CMIP6 and CMIP5 models in simulating climate over China and the East Asian monsoon. Adv. Atmos. Sci. 2020, 37, 1102–1118. [Google Scholar] [CrossRef]
- Zhang, L.-X.; Chen, X.-L.; Xin, X.-G. Short commentary on CMIP6 scenario model intercomparison project (ScenarioMIP). Clim. Change Res. 2019, 15, 519–525. [Google Scholar]
- Zhao, Z.C.; Luo, Y.; Huang, J.B. The detection of the CMIP5 climate model to see the development of CMIP6 earth system models. Clim. Change Res. 2018, 14, 643–648. [Google Scholar]
- Meng, Q.; Bai, H.Y.; Guo, S.Z. Spatia F temporal Variation of Precipitation in Qinling Area in Recent 50 Years Based on Anusplin. Res. Soil Water Conserv. 2020, 2, 206–212. [Google Scholar]
- Yang, X.; Zhou, B.; Xu, Y.; Han, Z. CMIP6 evaluation and projection of temperature and precipitation over China. Adv. Atmos. Sci. 2021, 38, 817–830. [Google Scholar] [CrossRef]
- Yue, Y.; Yan, D.; Yue, Q.; Ji, G.; Wang, Z. Future changes in precipitation and temperature over the Yangtze River Basin in China based on CMIP6 GCMs. Atmos. Res. 2021, 264, 105828. [Google Scholar] [CrossRef]
- Taylor, K.E. Summarizing multiple aspects of model performance in a single diagram. J. Geophys. Res. Atmos. 2001, 106, 7183–7192. [Google Scholar] [CrossRef]
- Jia, K.; Ruan, Y.; Yang, Y.; You, Z. Assessment of CMIP5 GCM simulation performance for temperature projection in the Tibetan Plateau. Earth Space Sci. 2019, 6, 2362. [Google Scholar] [CrossRef]
- Jiang, J.; Zhou, T.; Chen, X.; Zhang, L. Future changes in precipitation over Central Asia based on CMIP6 projections. Environ. Res. Lett. 2020, 15, 54009. [Google Scholar] [CrossRef]
- Fick, S.E.; Hijmans, R.J. WorldClim 2: New 1-km spatial resolution climate surfaces for global land areas. Int. J. Climatol. 2017, 37, 4302–4315. [Google Scholar] [CrossRef]
- Lu, F.Z.; Lu, H.Y. A high-resolution grid dataset of air temperature and precipitation for Qinling-Daba Mountains in central China and its implications for regional climate. Acta Geogr. Sinca 2019, 74, 875–888. [Google Scholar]
- Wang, Y.; Feng, J.; Li, J. Interannual variation of summer precipitation in the eastern of northwest China and its relationship with circulation. Plateau Meteorol. 2020, 39, 290–300. [Google Scholar]
- Liu, C. Climate Change and Its Difference Between Southern and Northern Qinling in Shaanxi Province. Master’s Thesis, Lanzhou University, Lanzhou, China, 2016. [Google Scholar]
- Meng, Q.; Bai, H.; Sarukkalige, R.; Fu, G.; Jia, W.; Zhang, C. An analysis of climate characteristic of rainfall in Qinling in autumn. Sci. Meteorogica Sin. 2008, 144, 415–420. [Google Scholar]
- Pan, L.; Zhang, H.; Chen, X.; Zou, T.; Zhang, K. Dominant modes of summer precipitation in Qinling and surrounding areas. Trans. Atmos Sci. 2018, 41, 377–387. [Google Scholar]
- Bi, J.X. Composition of Stable Isotopes of Precipitation and the Water Vapor Sources in the Northern Part of Qinling. Master’s Thesis, Northwest University, Xi’an, China, 2018. [Google Scholar]
- Liu, X.; Fang, J.; Yang, X.; Li, X. Climatology of dekadly precipitation around the Qinling mountains and characteristics of its atmospheric circulation. Arid. Meteorol. 2003, 21, 8–13. [Google Scholar]
- Zhang, Q.Y.; Tao, S.Y.; Chen, L.T. The inter-annual variability of East Asian summer monsoon indices and its association with the pattern of general circulation over East Asia. Acta Meteorol. Sin. 2003, 61, 559–568. [Google Scholar]
- Goswami, B.; Krishnamurthy, V.; Amalai, H.A. A broad-scale circulation index for the interannual variability of the Indian summe monsoon. Q. J. R. Meteorol. Soc. 1999, 125, 611–633. [Google Scholar] [CrossRef]
- Yatagai, A.; Yasunari, T. Interannual variations of summer precipitation in the arid/semiarid regions in China and Mongolia; Their regionality and relation to the Asian summer monsoon. J. Meteorol. Soc. Jpn. 1995, 73, 909–923. [Google Scholar] [CrossRef] [Green Version]
| Publisher’s Note: MDPI stays neutral with regard to jurisdictional claims in published maps and institutional affiliations. |
© 2022 by the authors. Licensee MDPI, Basel, Switzerland. This article is an open access article distributed under the terms and conditions of the Creative Commons Attribution (CC BY) license (https://creativecommons.org/licenses/by/4.0/).


