1. Introduction
Nitrogen and phosphorus pollutants in water discharged from the paddy field are a source of agricultural non-point source pollution, threatening the receiving water. In the Netherlands, the total nitrogen and total phosphorus provided by agricultural non-point sources account for 60% and 40–50% of the total pollution of the water environment [
1]. In China, 63.3% of lake water bodies have eutrophication, and more than 50% of the nitrogen and phosphorus load comes from agricultural non-point sources [
2]. In order to carry out this problem, many scholars are currently trying to adopt different measures to reduce the nitrogen and phosphorus pollutants in water discharged from the paddy field.
In these measures, nitrogen and phosphorus pollutants are mainly reduced from the source via the discharge method, such as artificial wetlands, the ecological floating bed, ecological bank protection, and other technical measures. Different types of wetland technologies have made progress in the purification of paddy field backwater. The technologies combining vertical flow constructed wetland (IVCW) and controlled aeration frequency constructed wetland has very obvious removal rates for total nitrogen and total phosphorus, some as high as 91.9% and 62.3% [
3,
4,
5,
6,
7,
8,
9]. The technology of the ecological floating bed can choose different types of plants to remove a variety of pollutants. It can also be combined with other technologies, and the removal rate of total nitrogen and total phosphorus can reach 71.4% and 51.0% [
10,
11,
12,
13,
14,
15]. Ecological revetment technology in water quality treatment projects has also been widely recognized [
16,
17,
18,
19,
20,
21]. Nevertheless, the applications of these techniques in removing pollutants from the drainage water of the paddy field are limited. For example, the requirement of water storage space for wetland technology limits its large-scale promotion and application in paddy field drainage ditches. The technology of the ecological floating bed is restricted due to the change in the water level in the drainage ditch of the paddy field during the growing season, which will be affected by the water area, water depth, flow rate, and other factors. Ecological revetment technology is rarely recognized in the competition of reducing nitrogen and phosphorus pollutants in water discharged from the paddy field due to the input and frequency of use. In view of the existing technology and the actual situation of the drainage of paddy fields, the drainage ditch that connects the source of the discharge to the river ditch has become an advantageous space for intercepting non-point source pollutants. It also can reduce the content of pollutants in the downstream receiving water body through a series of functions such as sediment adsorption, plant absorption, biological absorption, and degradation [
22,
23]. These purification functions of the drainage ditch basically depend upon the hydraulic residence time. Through a field investigation, we found that the pollutant content in the paddy field water discharged before the rice transplanting was high, but the purification functions of the drainage ditch for the nitrogen and phosphorus pollutants were insufficient due to the flow rate being too fast. In the existing research on technology, we also found that the purification process of the nitrogen and phosphorus pollutants occurs in the water body with the premise of a low flow rate. Therefore, in order to lower the flow rate, lengthen the hydraulic residence time, and improve the purification functions of the drainage ditch for nitrogen and phosphorus pollutants, the matrix dam is set in the drainage ditch of the paddy field because the matrix dam has the effect of absorbing and slowing down the flow rate. However, the location of the matrix dam in the drainage ditch of the paddy field and its effect on the flow rate require further study and explanation.
In view of the problem of the layout and size of the matrix dam in the drainage ditch of the paddy field, this study determined the optimal setting position and the optimal thickness of the matrix dam by observing the changes in flow rate and water level based on the physical model test.
2. Materials and Methods
2.1. Water Circulation System
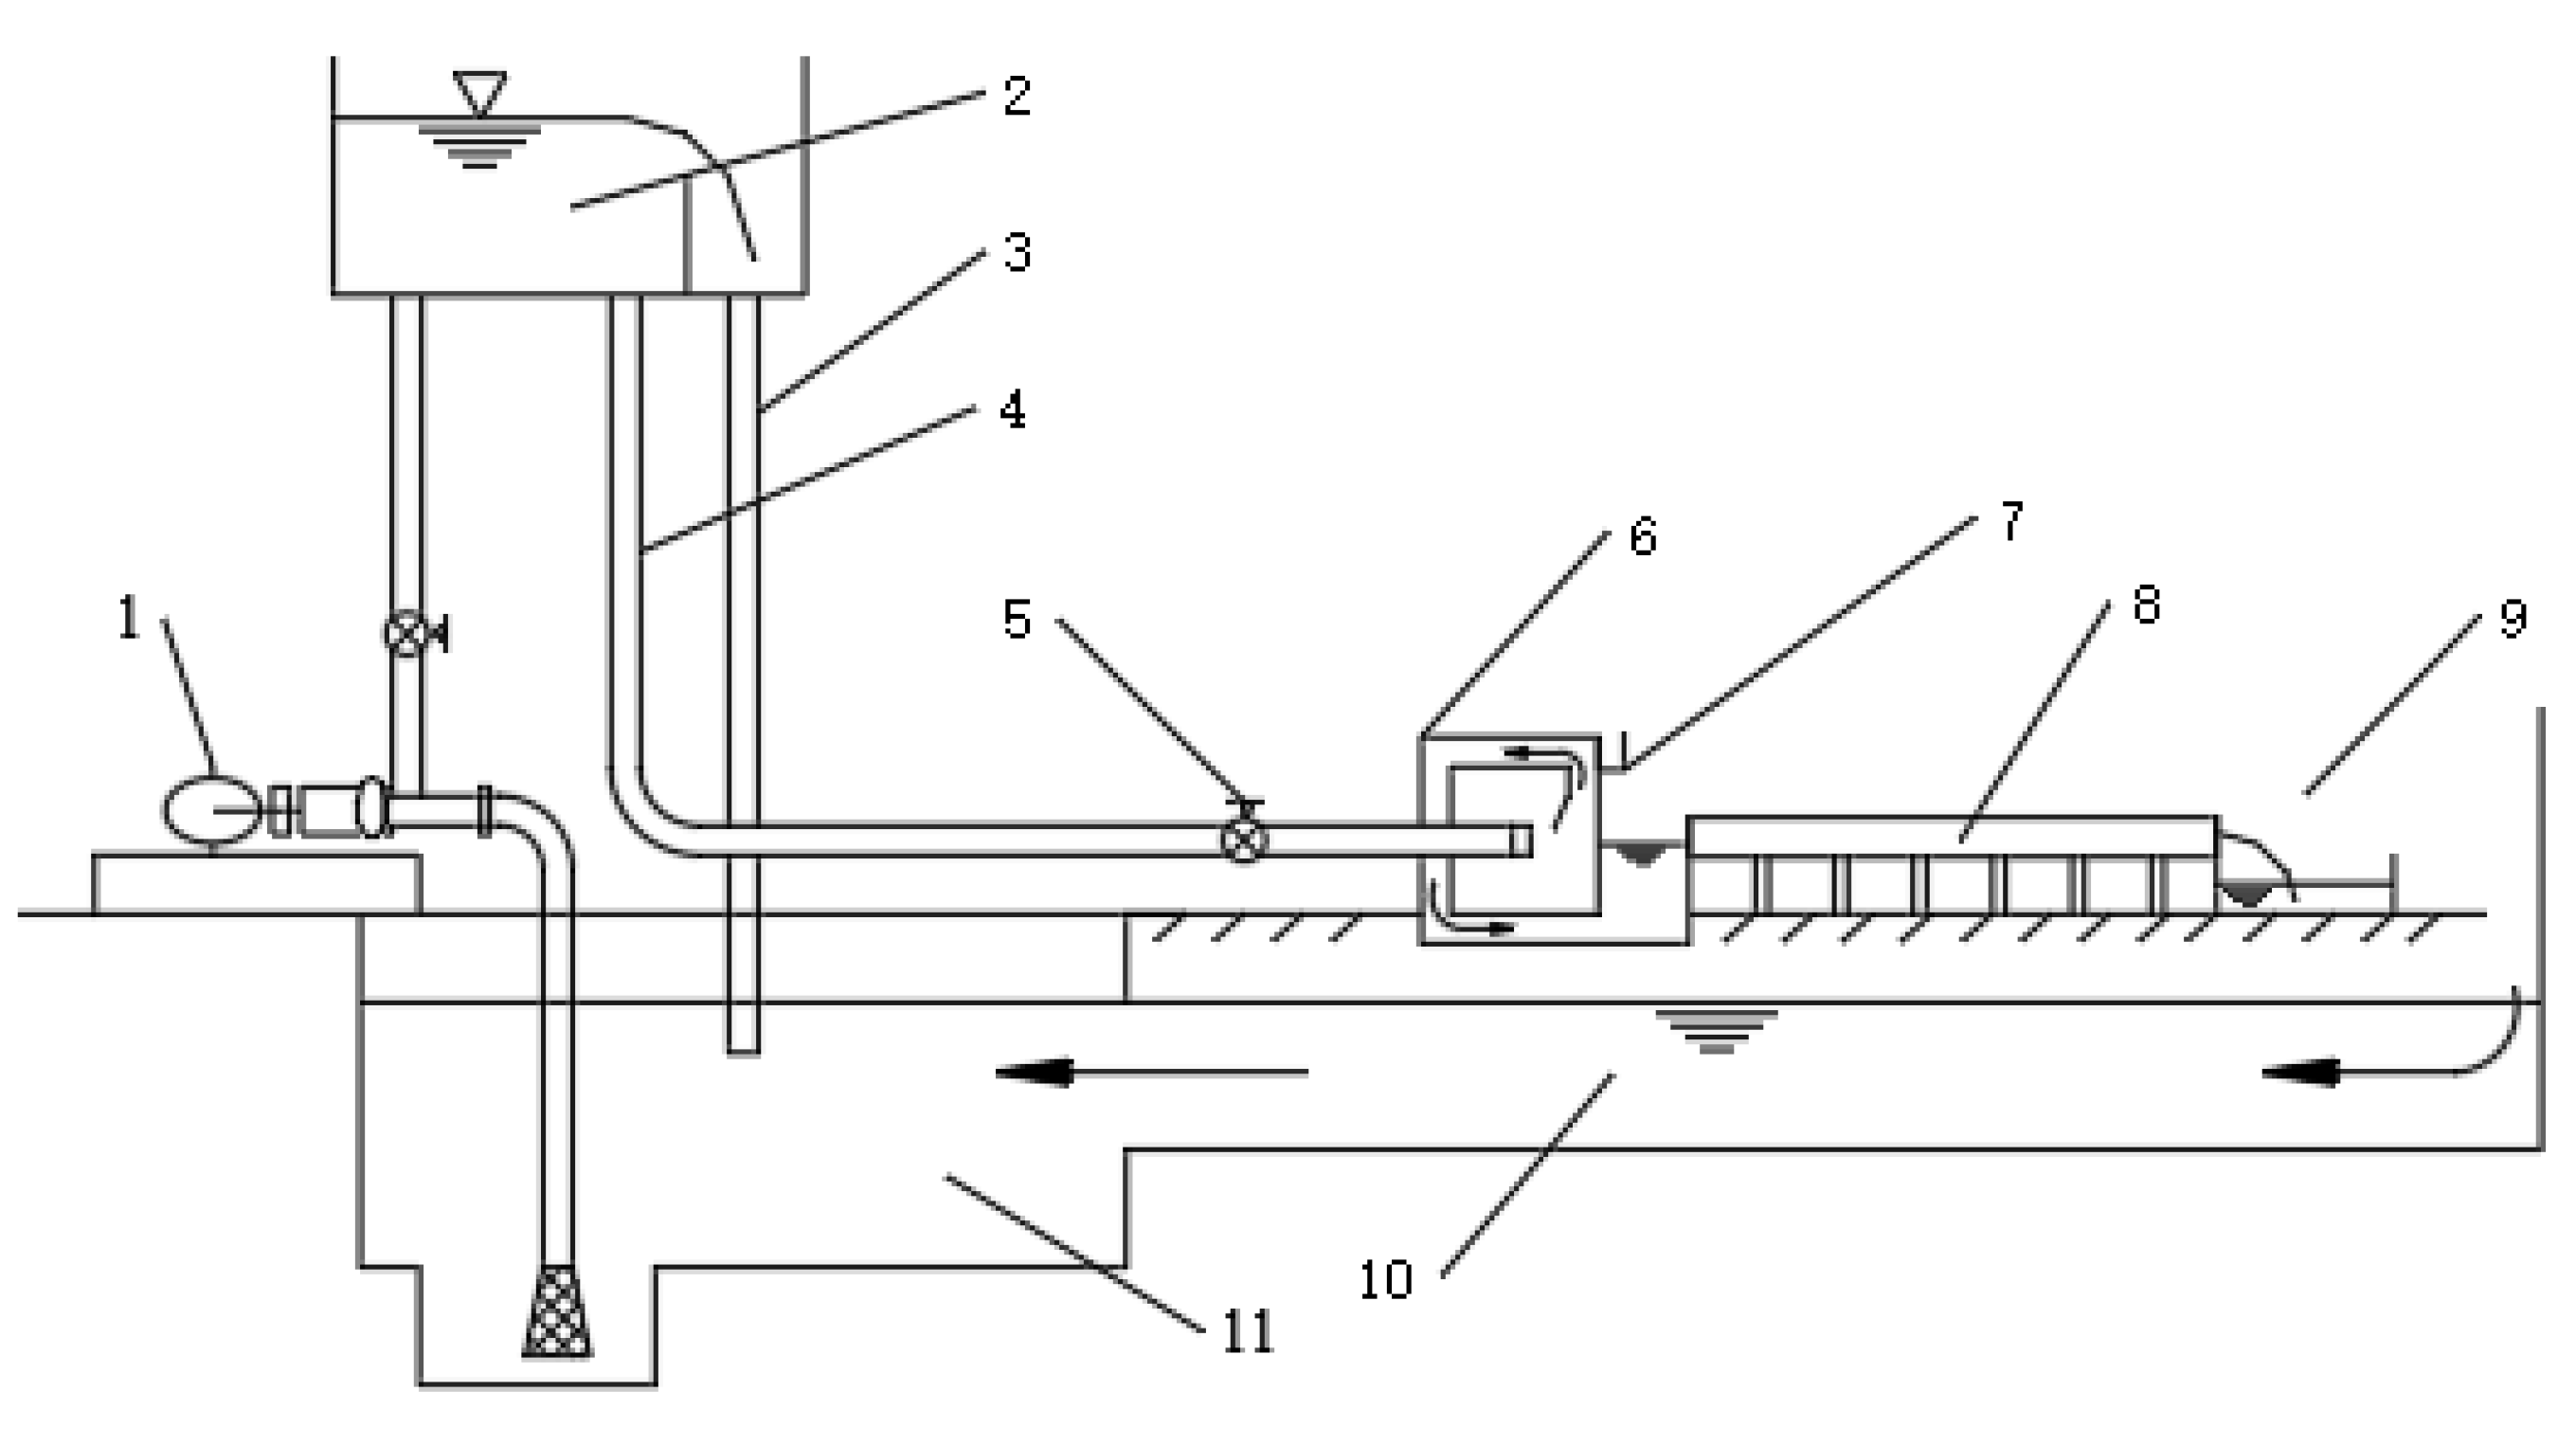
This physical model test was conducted using the water circulation system shown in
Figure 1. It mainly consists of four parts: A water supply system, flow control system, water delivery system, and water storage system. The water supply system includes a water tower (width × length × height of 5 m × 3 m × 2 m) and overflow tube (diameter of 0.25 m). The flow control system includes a water pump (rated flow of 60 L/s), an inlet valve, an inlet chamber (width × length × height of 5 m × 3 m × 1.5 m), and a water level stylus. The water delivery system includes a water outlet pipe (diameter of 0.25 m) and a flume. The water storage system includes a water storage pond (width × length × height of 20 m × 15 m × 2 m), a tail tank (width × length × height of 1.2 m × 0.7 m × 1.2 m), and a return water gallery (width × length × height of 4 m × 1 m × 0.5 m).
The specific operation process of the water circulation system is as follows: The water stored in the water storage pond was pumped into the horizontal tower, and the over-flowed water flowed back to the water storage pond through the overflow pipe to keep the water head stable. Then, the inlet valve was opened and adjusted to allow water to enter the inlet chamber and obtain the required discharge by reading the water level stylus. The accuracy of the water level stylus was 0.0001 m. Then, the water flowed into the tail tank after passing through the flume. After precipitating impurities there, it returned to the storage pond and entered the next cycle.
This study was carried out in the flume of the circulation system. The total length of the flume was 13.8 m with a ratio drop of 2%, and this slope was the same as the real ditch. Its cross-section was an isosceles trapezoid with a slope ratio of 1:2. Its bottom width was 0.4 m and its height was 0.22 m. These sizes are the same as a real ditch in a paddy field. Its material was a steel plate with a roughness value of 0.027, as shown in
Figure 2.
2.2. Design and Location of the Matrix Dam
The matrix dam was composed of the matrix and the wire skeleton. The height of the wire skeleton was 0.1 m and its thickness was set to 0.3 m, 0.4 m, and 0.5 m. Its structure is shown in
Figure 3 (thickness of 0.3 m). The matrix was a zeolite with an average particle size of 9–12 mm. The use of zeolite as the filling material of the matrix dam was due to its well-developed pore structure, large specific surface area, and stable physical and chemical properties [
24,
25,
26,
27].
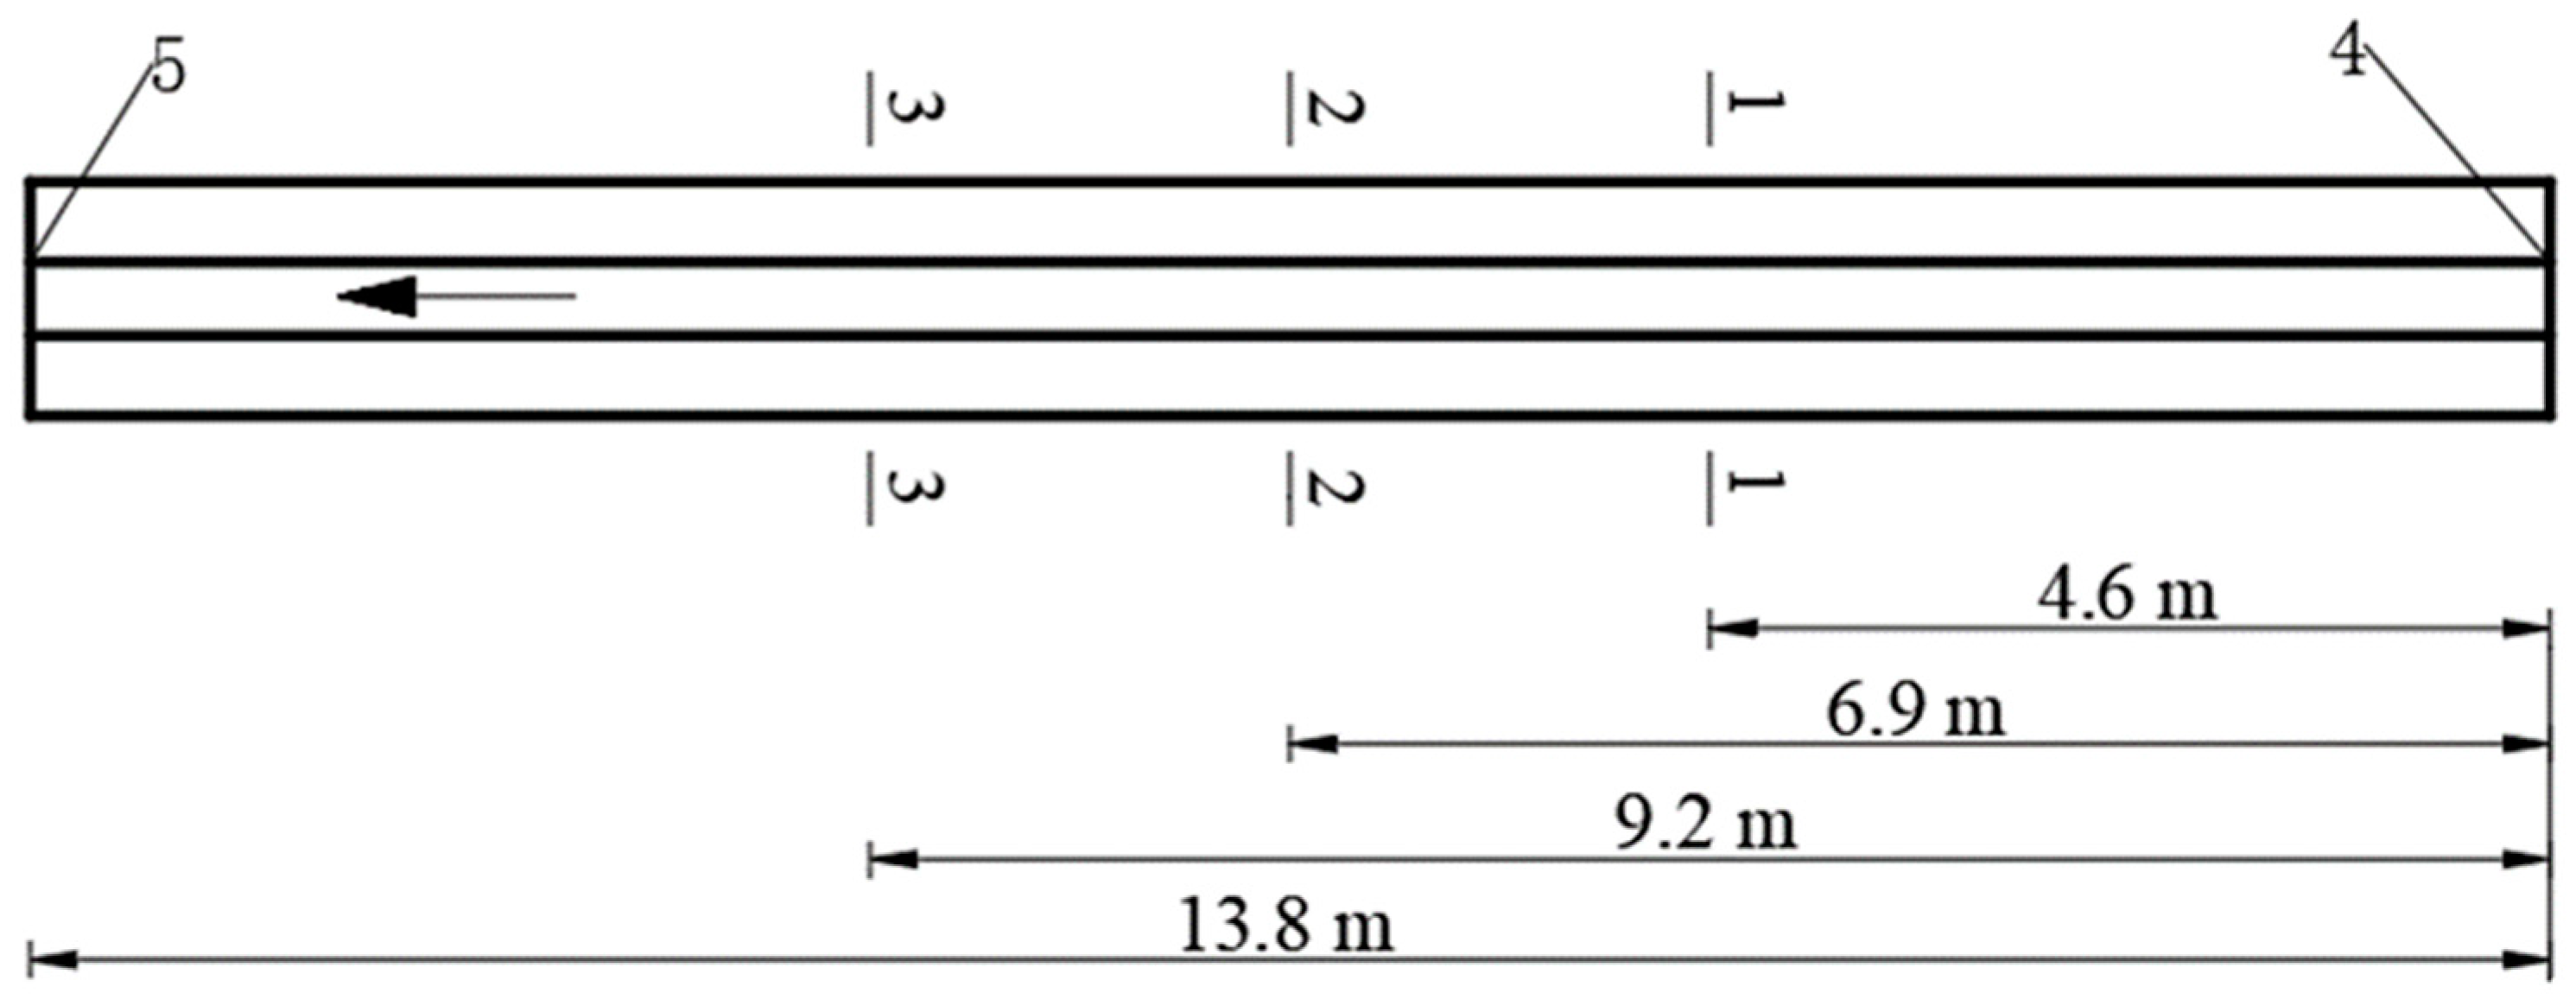
In this study, three sections were selected as the placement positions of the matrix dam in the flume. They were 1/3, 1/2, and 2/3 of the length of the flume, that is, 4.6 m, 6.9 m, and 9.2 m from the flume inlet. They were marked as section 1-1, section 2-2, and section 3-3, as shown in
Figure 4.
2.3. Determination of the Measuring Velocity Section
In order to observe the effect of the matrix dam on the flow rate, 10 measuring velocity sections (A-A, B-B (1,2,3), C-C (1,2,3), D-D (1,2,3)) were selected according to the location of the matrix dam. When the matrix dam was located in different sections, the locations of the measuring velocity section also changed. Measuring velocity section A-A was located 0 m from the flume inlet and did not change with the position of the matrix dam. Measuring velocity section B-B was located between the matrix dam and the inlet, while measuring velocity section C-C was 0.1 m upstream of the matrix dam. Measuring velocity section D-D was approximately 0.8 m downstream of the matrix dam, as shown in
Figure 5. When the matrix dam was set at section 1-1, measuring velocity section B1-B1 was 2.3 m from the flume inlet, measuring velocity section C1-C1 was 4.3 m, and measuring velocity section D1-D1 was 5.6 m, as shown in
Figure 5a. When the matrix dam was set at section 2-2, measuring velocity section B2-B2 was at 3.45 m, measuring velocity section C2-C2 was at 6.6 m, and measuring velocity section D2-D2 was at 7.9 m, as shown in
Figure 5b. When the matrix dam was set at section 3-3, measuring velocity section B3-B3 was at 4.6 m, measuring velocity section C3-C3 was at 8.9 m, and measuring velocity section D3-D3 was at 10.2 m, as shown in
Figure 5c.
Three measuring points were selected for each measuring velocity section, and the interval of the measuring points was 0.2 m. They were located in the left, middle, and right positions of the flume, as shown in
Figure 5. The velocity of each measurement point was measured 3 times. The velocity measuring instrument was a photoelectric propeller flow meter (LS300-A portable flow meter). The measurement range was 0.001–4.000 m/s, and the error was less than 1.5%.
2.4. Test Conditions
In order to observe the slowing effect of the matrix dam on the flow rate, a discharge of 20 L/s was determined in this study by the pre-experiment. Combining the different positions and thicknesses of the matrix dam, the experimental conditions are shown in
Table 1. The velocity measuring section without the matrix dam in the flume was the same as the velocity measuring section with the matrix dam set at section 2-2; that is, the velocities were measured at section A-A, section B2-B2, section C2-C2, and section D2-D2.
3. Results
3.1. The Effect of the Location of Matrix Dam on the Flow Rate
When the matrix dams were set at different positions, the corresponding flow rate, water level, and decreasing amplitude of the flow rate at each section are shown in
Figure 6 and
Figure 7. These results were obtained under the condition that the thickness of the matrix dam was 0.3 m and the discharge was 20 L/s. In
Figure 6, regardless of the location of the matrix dam, the flow rates of the three upstream sections decreased from the flume inlet to the front of the dam, and the decrease amplitude gradually increased from the flume inlet to the front of the dam. The flow rate of section C-C in front of the matrix dam was the lowest, with an average value of 0.150 m/s, and the decrease amplitude was more than 80%, which is due to the blocking effect of the matrix dam. That is, the water needs to adjust internally after it encounters resistance. The kinetic energy was gradually converted into potential energy, which was reflected by the decrease in the flow rate and the increase in the water level (shown in
Figure 6). In
Figure 6, the values of the water level in front of the dam were 0.168 m, 0.155 m, and 0.155 m when the matrix dam was set at section 1-1, 2-2, and 3-3, respectively, which are significantly higher than the corresponding water level of 0.042, 0.042, and 0.042 m in the flume without the matrix dam, which fully illustrates the decrease effect of the matrix dam on the flow rate. The flow rate downstream of the matrix dam was essentially the same as the average flow rate in the flume without the matrix dam, and its average value was approximately 0.978 m/s. There was also no obvious change in the water level, with an average value of 0.043 m. This is because the potential energy was converted into kinetic energy after the water flowed over the matrix dam, that is, the water level decreased and the flow rate increased.
Figure 7 shows that with the change in the position of the matrix dam (movement from the inlet to the outlet), the values of the flow rate in each velocity measuring section were also different. Among them, the change in flow rate at section A-A was the most obvious, and the decrease amplitude gradually decreased with the increase in the distance from the matrix dam. When the matrix dam was set at section 1-1, the distance between section A-A and the matrix dam was 4.3 m, and the flow rate of section A-A was 0.316 m/s, which was approximately 68% lower than that without the matrix dam. When the matrix dam was set at section 2-2, the distance between section A-A and the matrix dam was 6.6 m, and the flow rate of section A-A was 0.500 m/s, which was approximately 49% lower than that without the matrix dam. When the matrix dam was set at section 3-3, the distance between section A-A and the matrix dam was 9.2 m, and the flow rate was 0.530 m/s, which was approximately 45% lower than that without the matrix dam. The inlet flow rate changed due to the blocking effect of the matrix dam, which leads to the mutual conversion of energy (kinetic energy into potential energy), which was reflected in the water level upstream of the matrix dam gradually increasing. The rise of the water level hindered the flow of the subsequent water flow, which, in turn, caused the subsequent flow rate to decrease and the water level to increase. The change law of this chain reaction on the water level is that the lower the water level was, the farther away the matrix dam, which was consistent with the water level test results of this experiment, as shown in
Figure 6.
When the matrix dam was set at different sections, the effect degree on the flow rate was different. When the matrix dam was set at section 1-1, the flow rates from section A-A to section C1-C1 were reduced by 0.159 m/s, with an average decrease of 12% per meter; when the matrix dam was set at section 2-2, the flow rates from section A-A to C2-C2 were reduced by 0.331 m/s, with an average decrease of 10% per meter; when the matrix dam was set at section 3-3, the flow rate from section A-A to section C3-C3 was reduced by 0.360 m/s, with an average decrease of 8% per meter. In summary, when the matrix dam was set at section 3-3, it had the strongest effect on the overall flow rate upstream of the matrix dam.
It has been established that controlling the flow rate of water discharged from the paddy field in the drainage ditch is beneficial in improving the removal efficiency of nitrogen and phosphorus. When the flow rate is between 0.05 and 0.06 m/s, the removal efficiency of nitrogen ranges from 15.2% to 12.3%, and the removal efficiency of phosphorus is 12.5% [
28,
29,
30]. If the matrix dam was applied downstream of the drainage ditch, the whole flow rate could be decreased by 80%, and even more than 80% due to the low slope and high roughness of the real drainage ditch. The upstream flow rate in the drainage ditch of the paddy field was lower than 0.15 m/s by our observation after the matrix dam was applied, and the downstream flow rate was lower than 0.06. Therefore, the removal efficiency of nitrogen and phosphorus in the drainage ditch can be improved when the matrix dam is set in the drainage ditch.
3.2. The Effect of the Matrix Dam Thickness on Flow Rate
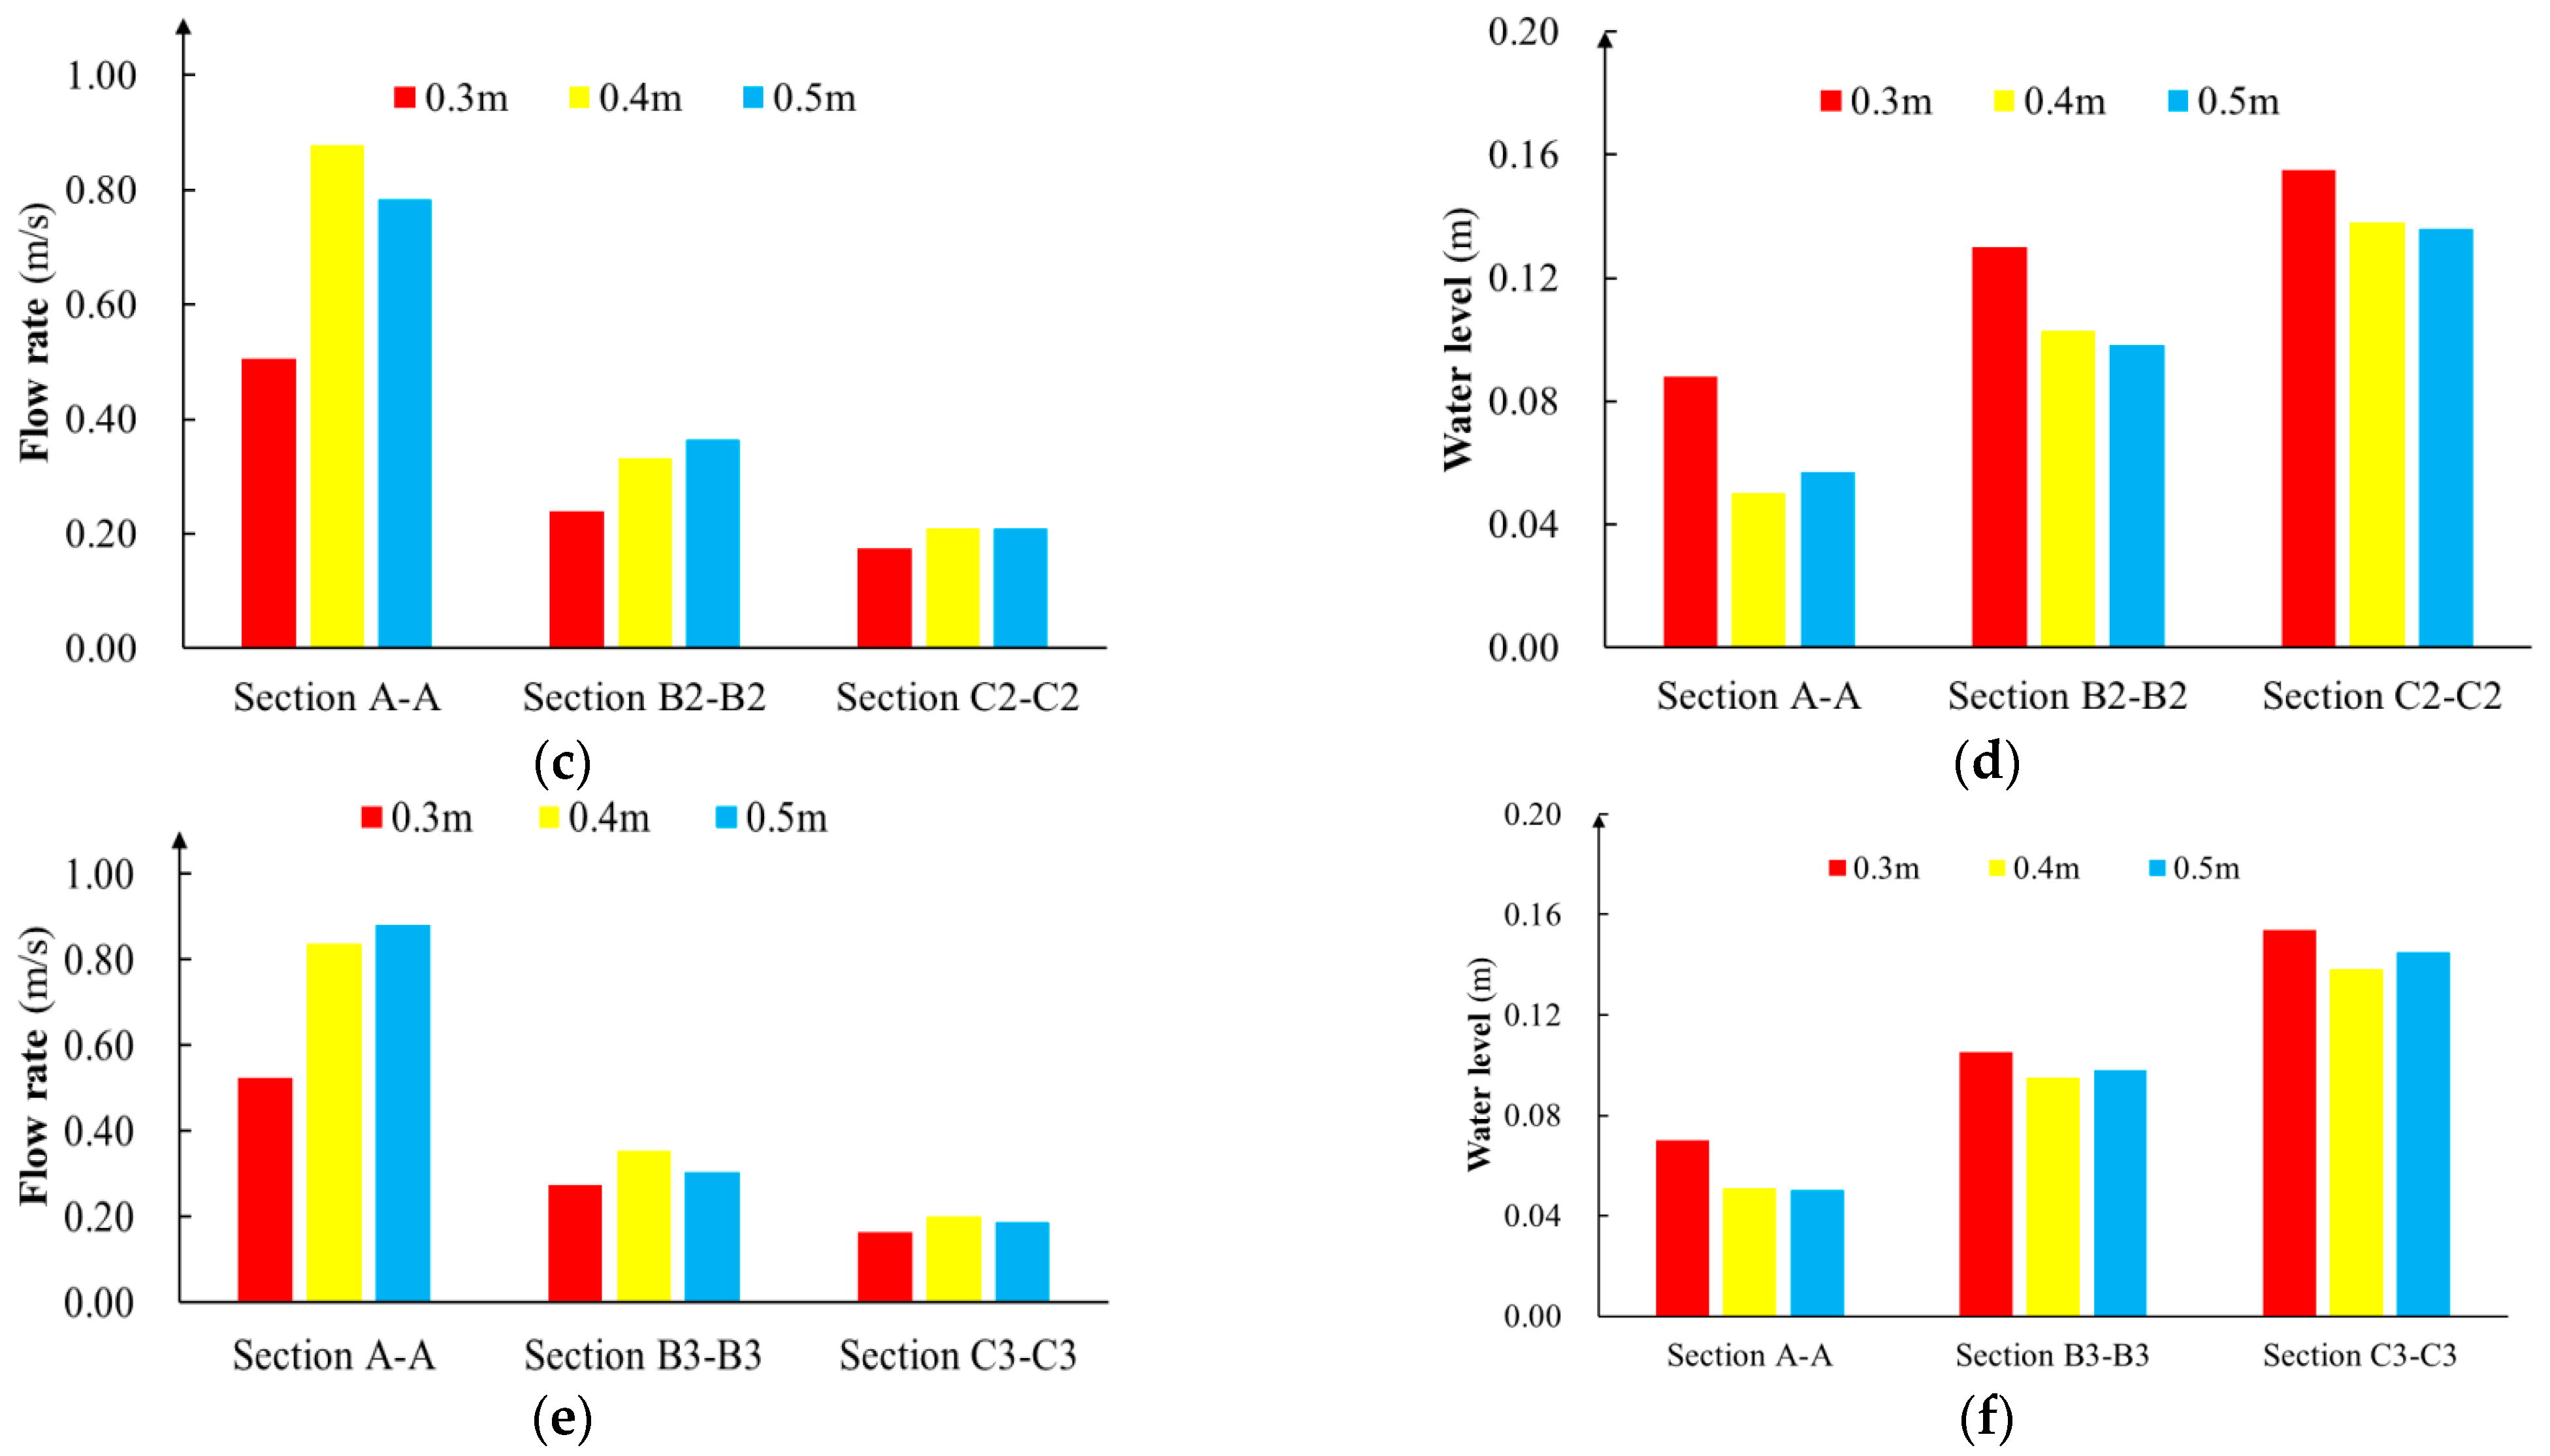
The matrix dams with three thicknesses all decreased the flow rate upstream, but the reduction amplitudes were different, as shown in
Figure 8 and
Table 2. We can see that the effect of three thicknesses of matrix dams on lowing the flow rate of the A-A section is as follows: When the matrix dams with a thickness of 0.3, 0.4, and 0.5 m were set in section 1-1, the flow rates of section A-A were 0.316, 0.416, and 0.377 m/s, respectively. The decrease amplitudes of the flow rate were 69%, 59%, and 63%. When the matrix dam was set at section 2-2, with a thickness of 0.3 m, 0.4 m, and 0.5 m, the flow rates of the A-A section were 0.505, 0.878, and 0.783 m/s, and the decrease amplitude was 50%, 14%, and 23%, respectively. When the matrix dam was set at section 3-3, with a thickness of 0.3 m, 0.4 m, and 0.5 m, the flow rates of the A-A section were 0.524, 0.836, and 0.882 m/s, and the decrease amplitude was 46%, 14%, and 9%, respectively. This change law of the flow rate is mainly due to the energy of the water being converted after being blocked, which is specifically the conversion between the flow rate and the water level, as shown in
Figure 8b,d,f. When the flow rate was relatively large, the corresponding water level was low. It can be concluded that the matrix dam with a 0.3 m thickness had the greatest effect on the flow rate of the A-A section, and the decrease amplitude of the flow rate was the largest. The effect of the three thicknesses of matrix dams on sections B-B and C-C was similar to that of section A-A. That is, the flow rate of the upstream section of the matrix dam increased with the thickness of the matrix dam, and the decrease amplitude decreased with the thickness of the matrix dam. Based on this, we concluded that the matrix dam with a 0.3 m thickness was the best design thickness under the test conditions.
4. Discussion
We found that the matrix dam can significantly reduce the flow velocity in the drainage channel model. The results show that no matter where the matrix dam was located in the flume, the velocity of the measured section in front of the dam was the lowest, and the blocking effect of the matrix dam on velocity was above 80%. When the matrix dam was located at the end of the flume, its blocking effect on the upstream water flow was the most obvious. That is, when the matrix dam was located 9.2 m from the flume entrance, the flow velocity decreased from 1.02 m/s at the entrance to 0.152 m/s at the front of the dam, decreasing by 0.09 m/s per meter, which shows that the reduction degree of the flow velocity was 85%.
The proper combination of the velocity reduction ability of the matrix dam and the farmland drainage ditch will further promote the purification function of the drainage ditch. Some studies show that the farmland drainage ditch intercepts, absorbs, and degrades pollutants through media such as plants and microorganisms in the ditch, so as to realize the function of purifying farmland drainage water, which is realized under the premise of a low drainage flow rate [
31,
32,
33]. When the flow rate is low compared to the starting speed of the granular matter, the granular matter cannot continue to move with the flow and will settle to the bottom of the ditch, thus realizing the interception effect of the matrix dam in the ditch interior [
34,
35]. In this study, the starting velocity of the granular matter in a drainage ditch was calculated by using the formula of sediment starting velocity [
36]:
where
is the starting velocity of the granular matter, m/s.
h is the water depth, m, and we set this at 0.4 m in this paper.
d is the diameter of the sediment, and we set this at 0.1 mm in this paper.
is the density of the sediment, kg/m
3, and we set it at 2650 kg/m
3 in this paper.
is the water density, and we set it at 1000 kg/m
3.
g is the gravitational acceleration, and we set it at 9.8 m/s
2.
According to the above formula and parameter description, the starting velocity of the sediment in the drainage ditch was 0.195 m/s. Combined with the field monitoring results of our research group, the water velocity in the drainage ditch of this paddy field was approximately 0.48–0.6 m/s. If a matrix dam is installed in this drainage ditch, the maximum velocity in front of the dam is 0.12 m/s, which cannot meet the requirements of sediment start-up. Therefore, particulate pollutants larger than 0.1 mm can be intercepted in front of the dam. The current limiting effect of the matrix dam is significantly better than that of planting submerged plants and ecological revetment and can play a better role in plant absorption and microorganism degradation in the drainage ditch [
23].
We also found that the function of setting the matrix dam in the drainage ditch is similar to that of wetland technology, the technology of the ecological floating bed, and ecological revetment technology. All of them can reduce the nitrogen and phosphorus pollutants in the water discharged from the paddy field. However, this method has more significant advantages. Compared with other methods, this method can guarantee normal drainage, does not need an additional storage area, and is especially suited to variable water levels.
5. Conclusions
In this study, we analyzed the decrease amplitude and change trend of the flow rate as a function of the position and thickness of the matrix dam in the flume, and we can draw the following conclusions.
The matrix dam decreased the flow rate upstream, and the flow rate changed with the placement position of the matrix dam, that is, the flow rate of the upstream section decreased with the distance between the flume inlet and the matrix dam. The controlling effect on the flow rate in front of the dam was the best, with an average decrease of 80%. The larger the upstream flow rate was, the farther away from the matrix dam. Under this test condition, the matrix dam had the strongest effect on the upstream flow rate when it was set at section 3-3, and the flow rate decreased by 8% per meter.
The effect of the thickness of the matrix dam on the flow rate is that the flow rate decreased with the increase in the thickness. The decrease amplitude also decreased with the increase in thickness of the matrix dam. Under this test condition, the matrix dam with a thickness of 0.3 m had the most obvious slowing effect on the upstream flow rate, which was the best thickness design under this test condition.
The conclusions of this experiment can provide guidance for the design and use of matrix dams and save materials and costs for the application of matrix dams in paddy drainage ditches, which provide theoretical support for the promotion of matrix dams to reduce nitrogen and phosphorus pollutants in water discharged from paddy fields. The matrix dam is assumed to be applied to the actual drainage ditch, which can intercept the particulate pollution and promote the absorption of soluble pollutants. Their effectiveness in intercepting and removing nitrogen and phosphorus will be our further study focus.
Author Contributions
H.L. conceived and designed the experiment idea; H.Y. performed the experiments; H.Y. and H.L. analyzed the data; H.Y., H.S., F.S., C.J., J.C. and H.L. wrote the paper. All authors have read and agreed to the published version of the manuscript.
Funding
This research was funded by The National Key Research and Development Program of China (2018YFD0800904) and the Key project of water Conservancy Science and Technology Plan of Zhejiang Province, China (RB2114).
Institutional Review Board Statement
Not applicable.
Informed Consent Statement
Not applicable.
Data Availability Statement
Not applicable.
Conflicts of Interest
All authors have read and approved this version of the article, and due care has been taken to ensure the integrity of the work. None of the material in the papers has been published or submitted elsewhere. No conflict of interest exists in the submission of this manuscript.
References
- Boers, P.C.M. Nutrient emissions from agriculture in the Netherlands, causes and remedies. Water Sci. Technol. 1996, 33, 183–189. [Google Scholar] [CrossRef]
- Sun, B.; Ma, Y.; Hu, S.; Lu, Q.; Zhang, W.; Fang, F. Study on agricultural non-point source pollution model and its application. Agro-Environ. Dev. 2013, 30, 1–5. [Google Scholar]
- Fan, J.; Zhang, J.; Ngo, H.H.; Guo, W.; Yin, X. Improving low-temperature performance of surface flow constructed wetlands using Potamogeton crispus L. plant. Biores. Technol. 2016, 218, 1257–1260. [Google Scholar] [CrossRef] [PubMed]
- Zheng, Y.; Wang, X.C.; Dzakpasu, M.; Ge, Y.; Zhao, Y.; Xiong, J. Performance of a pilot demonstration-scale hybrid constructed wetland system for on-site treatment of polluted urban river water in Northwestern China. Environ. Sci. Pollut. Res. 2016, 23, 447–454. [Google Scholar] [CrossRef] [PubMed]
- Wang, G.; Li, Y.; Liu, H.; Wright, A. Development of the wetland condition index (WCI) by combining the landscape development intensity index (LDI) and the water environment index (WEI) for humid regions of China. Water 2019, 11, 620. [Google Scholar] [CrossRef] [Green Version]
- Bai, X.; Zhu, X.; Jiang, H.; Wang, Z.; He, C.; Sheng, L.; Zhuang, J. Purification effect of sequential constructed wetland for the polluted water in urban river. Water 2020, 12, 1054. [Google Scholar] [CrossRef] [Green Version]
- Zhou, X.; Han, Y.; Wang, Y. Study on the effect of porous subsurface flow constructed wetland on sewage purification. IOP Conf. Ser. Earth Environ. Sci. 2020, 446, 032056. [Google Scholar] [CrossRef]
- Xu, P.; Xiao, E.; He, F.; Xu, D.; Zhang, Y.; Wang, Y.; Wu, Z. High performance of integrated vertical-flow constructed wetland for polishing low C/N ratio river based on a pilot-scale study in Hangzhou, China. Environ. Sci. Pollut. Res. 2019, 26, 22431–22449. [Google Scholar] [CrossRef]
- Angassa, K.; Assefa, B.; Kefeni, K.K. Brewery industrial wastewater treatment through mesocosm horizontal subsurface flow constructed wetland. Environ. Syst. Decis. 2022, 42, 265–275. [Google Scholar] [CrossRef]
- Zhang, H.; Han, J.; Chen, F.; Yuan, Q. Review on plants selection and application effects in ecological floating beds based on water purification. IOP Conf. Ser. Earth Environ. Sci. 2021, 647, 012186. [Google Scholar] [CrossRef]
- Zhang, Z.; Liu, Y.; Hu, S.; Wang, J.; Qian, J. A new type of ecological floating bed based on ornamental plants experimented in an artificially made eutrophic water body in the laboratory for nutrient removal. Bull. Environ. Contam. Toxicol. 2021, 106, 1–8. [Google Scholar] [CrossRef] [PubMed]
- Samal, K.; Kar, S.; Trivedi, S. Ecological floating bed (EFB) for decontamination of polluted water bodies: Design, mechanism and performance. J. Environ. Manag. 2019, 251, 109550. [Google Scholar] [CrossRef] [PubMed]
- Wang, Y.; Yin, X.; Cai, Y.; Yang, Z. An enhanced system with macrophytes and polyurethane sponge as an eco-technology for restoring eutrophic water: A pilot test. Water 2019, 11, 1828. [Google Scholar] [CrossRef] [Green Version]
- Pan, J.; Li, R.; Sun, B.; Liu, W.; Gao, R. The effect of aeration on the purification rate using microporous aeration-ecological floating island technology. IOP Conf. Ser. Earth Environ. Sci. 2021, 634, 012010. [Google Scholar] [CrossRef]
- Wang, W.H.; Wang, Y.; Wei, H.S.; Wang, L.P.; Peng, J. Stability and purification efficiency of composite ecological floating bed with suspended inorganic functional filler in a field study. J. Water Process Eng. 2020, 37, 101482. [Google Scholar] [CrossRef]
- Wang, W.H.; Wang, Y.; Sun, L.Q.; Zheng, Y.C.; Zhao, J.C. Research and application status of ecological floating bed in eutrophic landscape water restoration. Sci. Total Environ. 2020, 704, 135434.1–135434.17. [Google Scholar] [CrossRef]
- Song, J.; Li, Q.; Wang, X.C. Superposition effect of floating and fixed beds in series for enhancing nitrogen and phosphorus removal in a multistage pond system. Sci. Total Environ. 2019, 695, 133678. [Google Scholar] [CrossRef]
- Wu, Y.; Dai, H.; Wu, J. Comparative study on influences of bank slope ecological revetments on water quality purification pretreating low-polluted waters. Water 2017, 9, 636. [Google Scholar] [CrossRef] [Green Version]
- Wang, L.; Ye, X.; Du, X. Suitability evaluation of river bank filtration along the Second Songhua River, China. Water 2016, 8, 176. [Google Scholar] [CrossRef] [Green Version]
- Tang, V.; Fu, D.; Ngoc Binh, T.; Rene, E.; Sang, T.; Singh, R. An investigation on performance and structure of ecological revetment in a sub-tropical area: A case study on Cuatien River, Vinh City, Vietnam. Water 2018, 10, 636. [Google Scholar] [CrossRef] [Green Version]
- Wang, B.; Gao, J.; Wang, Y.; Yang, J.; Gu, L.; Gao, Y. Effectiveness evaluation of ecological revetment of Yongding river in Beijing. Soil Water Conserv. China 2014, 2014, 10–13. [Google Scholar]
- Zhang, Y. Removal Effect and Management Measures of Nitrogen and Phosphorus in Agricultural Drainage Ditches Dissertation. Doctoral's Dissertation, University of Chinese Academy of Sciences, Beijing, China, 2013. [Google Scholar]
- Zhang, Y.; Yan, B.; Liu, X.; Wang, L.; Cao, H. Measures for controlling phosphorus from agricultural non-point source pollutions in drainage ditch systems. Chin. J. Soil Sci. 2012, 43, 745–750. [Google Scholar]
- Maharjan, A.K.; Mori, K.; Toyama, T. Nitrogen removal ability and characteristics of the laboratory-scale tidal flow constructed wetlands for treating ammonium-nitrogen contaminated groundwater. Water 2020, 12, 1326. [Google Scholar] [CrossRef]
- Zheng, L.; Chen, Y.; Zhou, S.; Chen, Y.; Wang, X.; Wang, X.; Zhang, L.; Chen, Z. Nitrogen removal for liquid-ammonia mercerization wastewater via partial nitritation/anammox based on zeolite sequencing batch reactor. Water 2020, 12, 2234. [Google Scholar] [CrossRef]
- Galamini, G.; Ferretti, G.; Medoro, V.; Tescaro, N.; Faccini, B.; Coltorti, M. Isotherms, kinetics, and thermodynamics of NH4+ adsorption in raw liquid manure by using natural chabazite zeolite-rich tuff. Water 2020, 12, 2944. [Google Scholar] [CrossRef]
- Chen, Y.; Wang, F.; Lu, Y.; Ding, J.; Chen, X.; Qi, Y.; Jia, X. Research on dynamic adsorption effect of ammonia nitrogen in water by zeolite reactor. J. Hangzhou Norm. Univ. Nat. Sci. Ed. 2019, 18, 504–509. [Google Scholar]
- Luo, H.; Guan, L.; Jing, Z.; Zhang, Z.; Hu, X.; Tao, M.; Wang, Y. Influence of filter layer positions and hydraulic retention time on removal of nitrogen and phosphorus by porous asphalt pavement. Water Sci. Technol. 2020, 81, 445–455. [Google Scholar] [CrossRef]
- Zheng, B. The Efficiency and Influencing Factors of Ecological Ditch to Remove Nitrogen and Phosphorus Pollution from Agricultural Surface Sources. Master’s Thesis, Northwest Normal University, Lanzhou, China, 2020. [Google Scholar]
- Zheng, L. Study on the Purification Technology of the Major Pollutants Nitrogen and Phosphorus of Farmland Drainage. Master’s Thesis, Hunan Agricultural University, Changsha, China, 2011. [Google Scholar]
- Huang, Y.Q.; Chen, T.T.; Li, Y.; Huang, Z.G.; Li, J.Y.; Dai, L.; Wang, X.; Guo, H.; Liu, X.M.; Kang, Z.W. Effectiveness of grass planting in drainage ditches to intercept nitrogen and phosphorus pollution from farmland into rivers. J. Plant Nutr. Fertil. 2021, 11, 1993–2000. [Google Scholar]
- Fu, D.; Gong, W.; Xu, Y.; Singh, R.P.; Surampalli, R.Y.; Zhang, T.C. Nutrient mitigation capacity of agricultural drainage ditches in Tai Lake basin. Ecol. Eng. 2014, 71, 101–107. [Google Scholar] [CrossRef]
- Tian, X.; Zhou, Y.C.; Cai, X.L.; Ma, L.P.; Liu, X.Y. Effects of different plant species hedgerows on interception of non-point source pollutants in sloping cultivated land. J. Agro-Environ. Sci. 2015, 3, 494–500. [Google Scholar]
- Zhang, L.J.; Ju, X.T.; Ji, Y.Z.; Zhang, F.S.; Peng, Z.P. Effects of fallow and plant growth in summer on the movement of residual nitrate in aquic soil on North China Plain. J. Plant Nutr. Fertil. 2010, 2, 312–320. [Google Scholar]
- Smith, D.R. Assessment of in-stream phosphorus dynamics in agricultural drainage ditches. Sci. Total Environ. 2009, 12, 3883–3889. [Google Scholar] [CrossRef] [PubMed]
- Zhang, H.W. A unified formula for incipient velocity of sediment. J. Hydraul. Eng. 2012, 12, 1387–1396. [Google Scholar]
| Publisher’s Note: MDPI stays neutral with regard to jurisdictional claims in published maps and institutional affiliations. |
© 2022 by the authors. Licensee MDPI, Basel, Switzerland. This article is an open access article distributed under the terms and conditions of the Creative Commons Attribution (CC BY) license (https://creativecommons.org/licenses/by/4.0/).


