Article

Study of the Air Leakage Mechanism and the Suitable Gas Drainage Volume with the Upper Tunnel

1
School of Resources and Civil Engineering, Northeastern University, Shenyang 110819, China
2
School of Safety Engineering, North China Institute of Science and Technology, Sanhe 065201, China
*
Author to whom correspondence should be addressed.
Sustainability 2022, 14(14), 8614; https://doi.org/10.3390/su14148614
Submission received: 10 May 2022 / Revised: 11 July 2022 / Accepted: 12 July 2022 / Published: 14 July 2022
(This article belongs to the Special Issue Advances in Mine Safety Science and Engineering)

Abstract

:
Gas drainage in an upper tunnel effectively prevents the gas overrun of the working face. However, the upper tunnel gas drainage quickly leads to air leakage and increases the risk of spontaneous coal combustion in the goaf. To reveal the influence of an upper tunnel gas drainage on the spontaneous combustion of coal in the goaf, the formation of an air leakage channel, the gas emission, and the distribution of the intuitive combustion danger area were studied through a numerical simulation and field measurement. The results indicated that the effective drainage section of the upper tunnel was behind the working face within a certain distance, and the air leakage mode presented the stereoscopic air leakage characteristics of high and low positions coexisting in the goaf. The spontaneous combustion danger area distribution increased gradually with the gas drainage volume increasing. However, the gas concentration in the upper corner decreased with the extraction quantity. Then a safe gas drainage volume was determined by comparing and analyzing the coal gas emission and spontaneous combustion with different extraction quantities.

1. Introduction

Gas emissions from coal seams are impacted by the quantity of gas contained in the seam and the mining depth. Managing and controlling these emissions can be challenging and may significantly impact numerous health and safety aspects of the mining operation. These gases refer to carbon monoxide (CO), hydrogen sulfide (H2S), nitrogen dioxide (NO2), sulfur dioxide (SO2), ammonia (NH3), hydrogen (H2), and so on. Once basic ventilation systems are not sufficient to maintain the gas concentrations within the statutory limits, the production safety in coal mines is endangered [1,2]. Diverse gas drainage technologies have been widely applied to address the gas accumulation of the upper corner and have achieved outstanding effects in recent years [3]. As one of the commonly used gas drainage technologies, an upper tunnel was adopted to administer the gob gas, especially in high gassy and extra-thick coal seams [4,5,6]. To improve the efficiency of the gas drainage, the upper tunnel is usually arranged in the fracture zone with high gas desorption and permeability [7,8,9,10]. In the process of mining, the generation and development of fractures enhance the permeability and create favorable conditions for gas desorption, diffusion, and seepage [2,11,12]. The layout of the upper tunnel makes full use of the abovementioned effects, showing high-efficiency gas drainage. Driven by the negative pressure and the concentration gradient, the gob gases, in the forms of diffusion and seepage, flow into the upper tunnel along with the fissure, and the gas accumulation in the gob is relieved.
Gas drainage of the upper tunnel leads to air leakage in the gob because of the negative pressure and developed fractures. The coal mining face needs fresh air blowing away toxic and harmful substances at the working site while providing oxygen to staff. Due to the action of air pressure, part of the fresh air will enter the goaf near the working face when the spontaneous combustion of coal in the goaf disaster occurs when mining, to control the air volume into the goaf and control the air leakage rate. The mine air leakage can reduce the working surface’s sufficient air volume, destroy the ventilation system’s reliability and stability of the airflow, increase the useless power consumption, and accelerate the spontaneous combustion of combustible minerals. Negative pressure is the driving force of air leakage and is reflected by the variation in gas drainage volume. As an important drainage parameter, the influence of the gas drainage volume on air leakage was fully investigated, and the results illustrate that the air leakage volume increases with increasing gas drainage volume [13,14,15]. The developed fractures are the preconditions of the air leakage flow field. Due to the influence of mine pressure and upper roadway fractures, the developed fractures play roles as air leakage channels, which are conducive to the final formation of the air leakage flow field. Zhang et al. established a numerical model to study the relationship between gas drainage and spontaneous coal combustion according to the connectivity degree of fractures. The effects of ventilation flux in the working face, gas drainage flow in the upper corner, gas drainage flow in the high-drainage roadway, fracture grout sealing, nitrogen injection flow on the airflow field, gas concentration field, oxygen concentration field, and the temperature field in the completely connected and partially connected zones, were analyzed [16]. However, as an internal factor of the air leakage environment, the development of fractures in the mining process was neglected. Guo et al. developed a conceptual model with overlying channels for optimal gas drainage [17]. Wang et al. obtained the static distribution law of gas by studying the spatial distribution law of harmful gas in the overlying goaf when the overlying coal was not mined. They obtained the dynamic distribution law of toxic gas in the goaf by discussing the dangerous gas spatial distribution and migration law in the overlying coal mining process [18]. The overlying channel was located vertically at the low part of the overburden fracture zone immediately above the caving zone or gob and was well connected to the gob gas. With a similar layout as the overlying channel, the upper tunnel not only connects to the gob gas but also provides the air leakage channel. As the overlying strata are caving, the location of the effective drainage section of the upper tunnel also changes. By affecting the flow direction of the gob gas, the effective drainage section creates low-pressure sinks and impacts the gob flow field [19,20]. In consideration of air leakages, the location of the effective drainage section of the upper tunnel caused by the roof collapsing is also worthy of discussion. Based on these studies, Chen et al. studied the coupling relationship between the negative pressures of cross-sectional drainage and the different positions of nitrogen injection. They calculated the relationship between the optimal nitrogen injection point N(x) and the cross-cutting (x) working distance through simulation results and the Newtonian interpolation polynomial analysis. The results provided scientific guidance for fire prevention in nitrogen-injected coal mines [21].
Gas drainage of the upper tunnel results in more air leakage; therefore, it increases the risk of self-heating of coal. The heat generated by oxidation makes the coal temperature continue to rise, exceeding the critical temperature of self-heating (from 60 to 80 °C), the temperature increase of coal accelerates sharply, and the oxidation process accelerates. The dry distillation of coal begins to produce aromatic hydrocarbons (CxHy), hydrogen (H2), more carbon monoxide (CO), and other combustible gases that must be managed or mitigated. This stage is the self-heating stage. On the other hand, measures taken to prevent self-heating in coal may limit the effectiveness of the gas drainage of the upper tunnel. The gas drainage of the upper tunnel and the prevention of self-heating in coal are restricted by each other [22,23]. Therefore, a general adjustment model of the gas drainage volume should be provided to coordinate the contradiction between the gas drainage of the upper tunnel and the prevention of self-heating in coal. Tang et al. studied the variation in air leakage along with the gas drainage volume and the air volume and proposed an appropriate air supply and gas drainage volume corresponding to a certain working face for the sake of reducing the air leakage and controlling gas emissions [24]. However, since the conditions of different working faces are different, it is better to propose a universal model for the coordinated control of self-heating in coal and gas disasters.
The above research results lay a foundation for studying the interaction between gas drainage and air leakage in the upper tunnel and the critical influence of the two on the self-heating in the coal seam. However, the previous research did not put forward a general coordinated control model of self-heating in coal and gas disasters due to the different working conditions.
Based on this, to assist the treatment of air leakage and lower the risk of self-heating in coal associated with the gas drainage of the upper tunnel, a series of fast Lagrangian analysis of continua (FLAC3D) and computational fluid dynamics (CFD) modeling studies were performed to understand the air leakage mechanism, including the breaking process of the upper tunnel, the location of the effective drainage section of the upper tunnel, and the air leakage flow fields. A site study was carried out at the Gengcun mine during the advance of the 13,190 working face to verify the validity of the simulation results for further investigation.

2. Site Conditions

The selected 13,190 working face is in the Gengcun mine, which is located west of the Yima coalfield, San Menxia city, Henan Province, China. The location of the Gengcun mine and the relevant stratigraphic sections are shown in Figure 1. The coal-bearing stratum of the Gengcun mine is the Middle Jurassic Yima Formation, with a thickness of 25.12–114.50 m. The major coal seams are 1-2, 2-1, 2-2, and 2-3, and the 13,190 working face mainly mines the 2-3 coal seam. The average thickness of coal seam 2-3 is approximately 16 m, which is mainly composed of mudstone and sandy mudstone. The working face adopts mechanized top-caving mining, and the depth of the mining level is approximately 500–600 m. The cutting height is 2.6 m, and the caving height is more than 12 m.
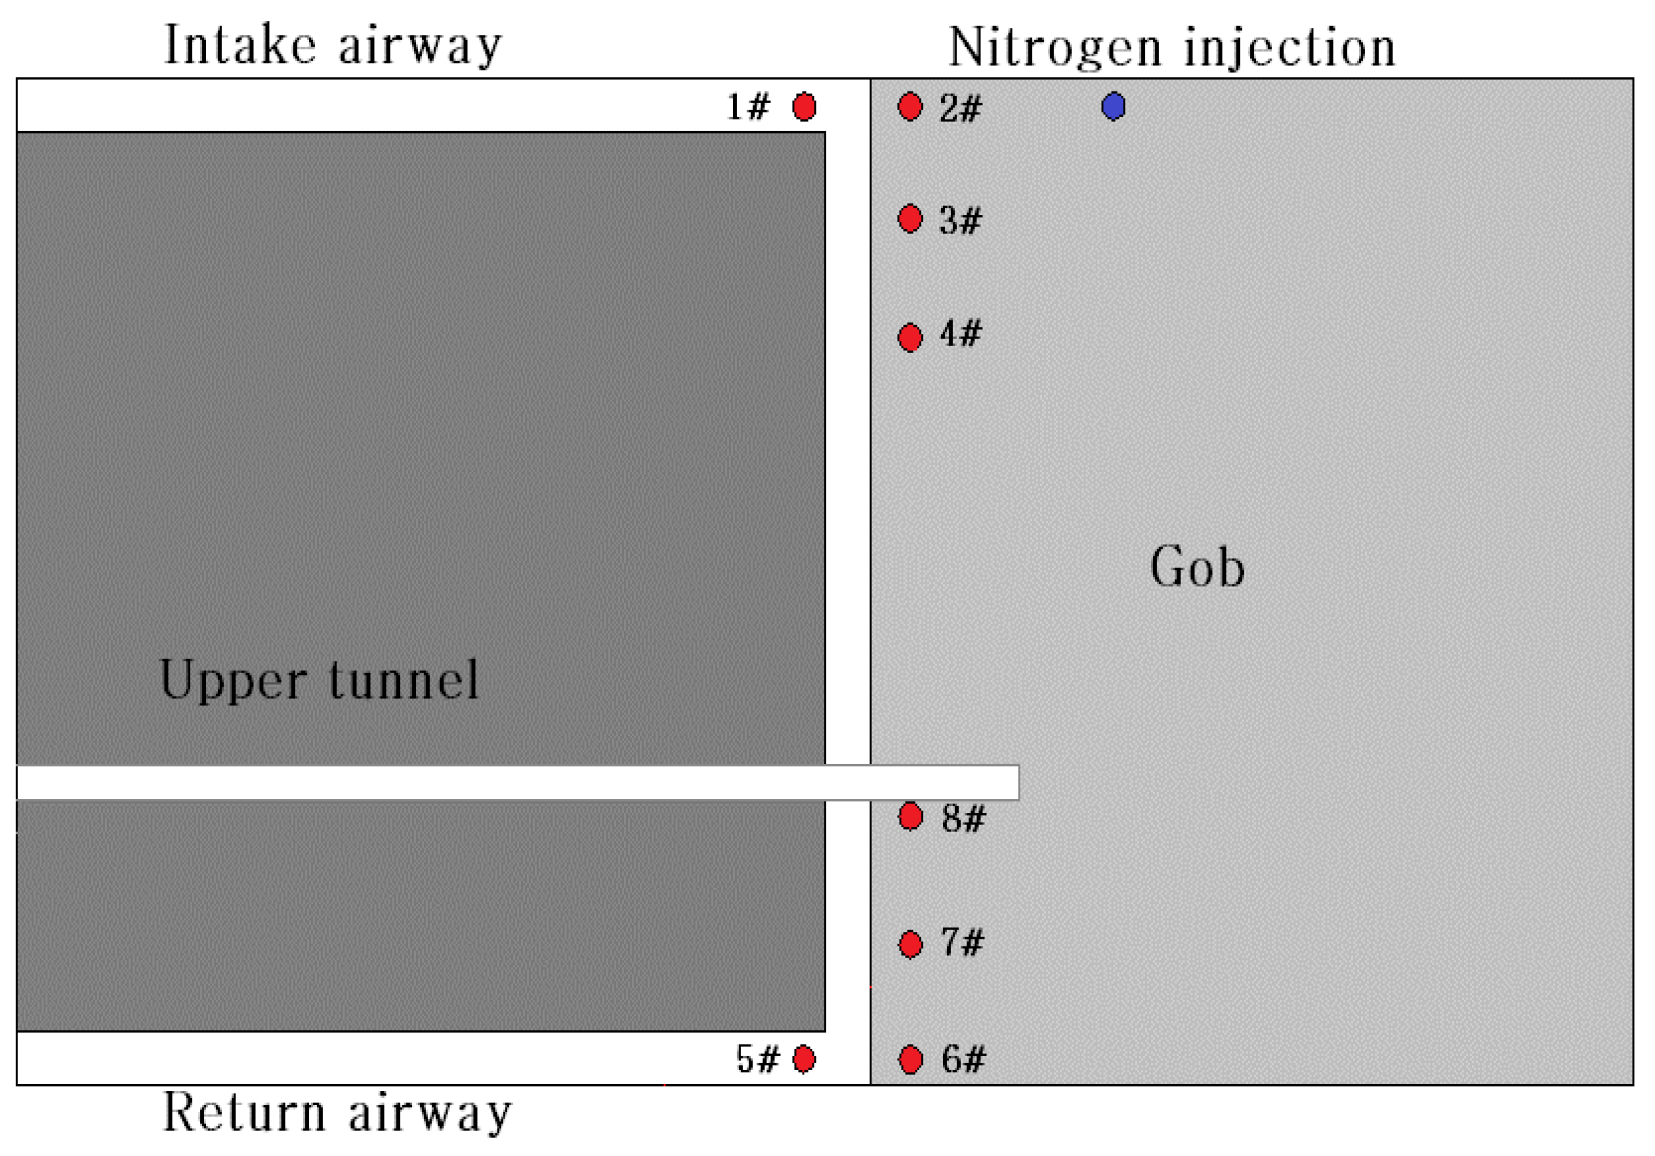
The 13,190 working face is 180 m wide and 1146 m long. The layout of the 13,190 working face is shown in Figure 2. Coal seam 2-3 is prone to spontaneous combustion, and the shortest period of spontaneous coal combustion is 30 days. During the mining process, nitrogen was injected into the gob to reduce the risk of self-heating in coal, and the injection position was 30 m away from the working face. The total gas emission of the 13,190 working face is approximately 22.4–32.5 m3/min. Gas drainage of the upper tunnel was adopted to control the methane level of the coal mine. The upper tunnel was arranged in the fracture zone of the overlying strata, departing 30 m from the floor. The horizontal distance between the upper tunnel and the return airway is 20 m, and the cross-section of the upper tunnel is 2 × 2 m. The sizes of the intake airway and return airway are 4 × 3.2 and 4 m × 3.5 m, respectively.
To monitor the distribution of the oxidation zone in the gob, there are eight measuring points of the beam tube system to detect the change in the oxygen volume fraction with the advance of the working face, as shown in Figure 2. Measuring point numbers 1#, 2#, 3#, and 4# were arranged near the intake airway at intervals of 10 m, and measuring point number 4 was 20 m from the intake airway. Measuring point numbers 5, 6, 7, and 8 were arranged near the return airway at an interval of 10 m, and measuring point number 8 was 20 m from the return airway.

3. Development of Air Leakage

3.1. Formation of Air Leakage Channel

In the mining process, the expansion of the caving zone indicates the development of fractures in the overlying strata. The fractures exist as the flow channels of gas migration and provide the possibility for air leakage. With the advancement of the working face, the upper tunnel fractures and, thus, directly changes the location of the effective drainage section. The location of the effective drainage section determines the position of the low-pressure sink and finally influences the air leakage flow field. To simulate the formation of the air leakage channel, the breaking process of the upper tunnel and the location of the effective drainage section were investigated in FLAC3D.

3.1.1. Model Settings

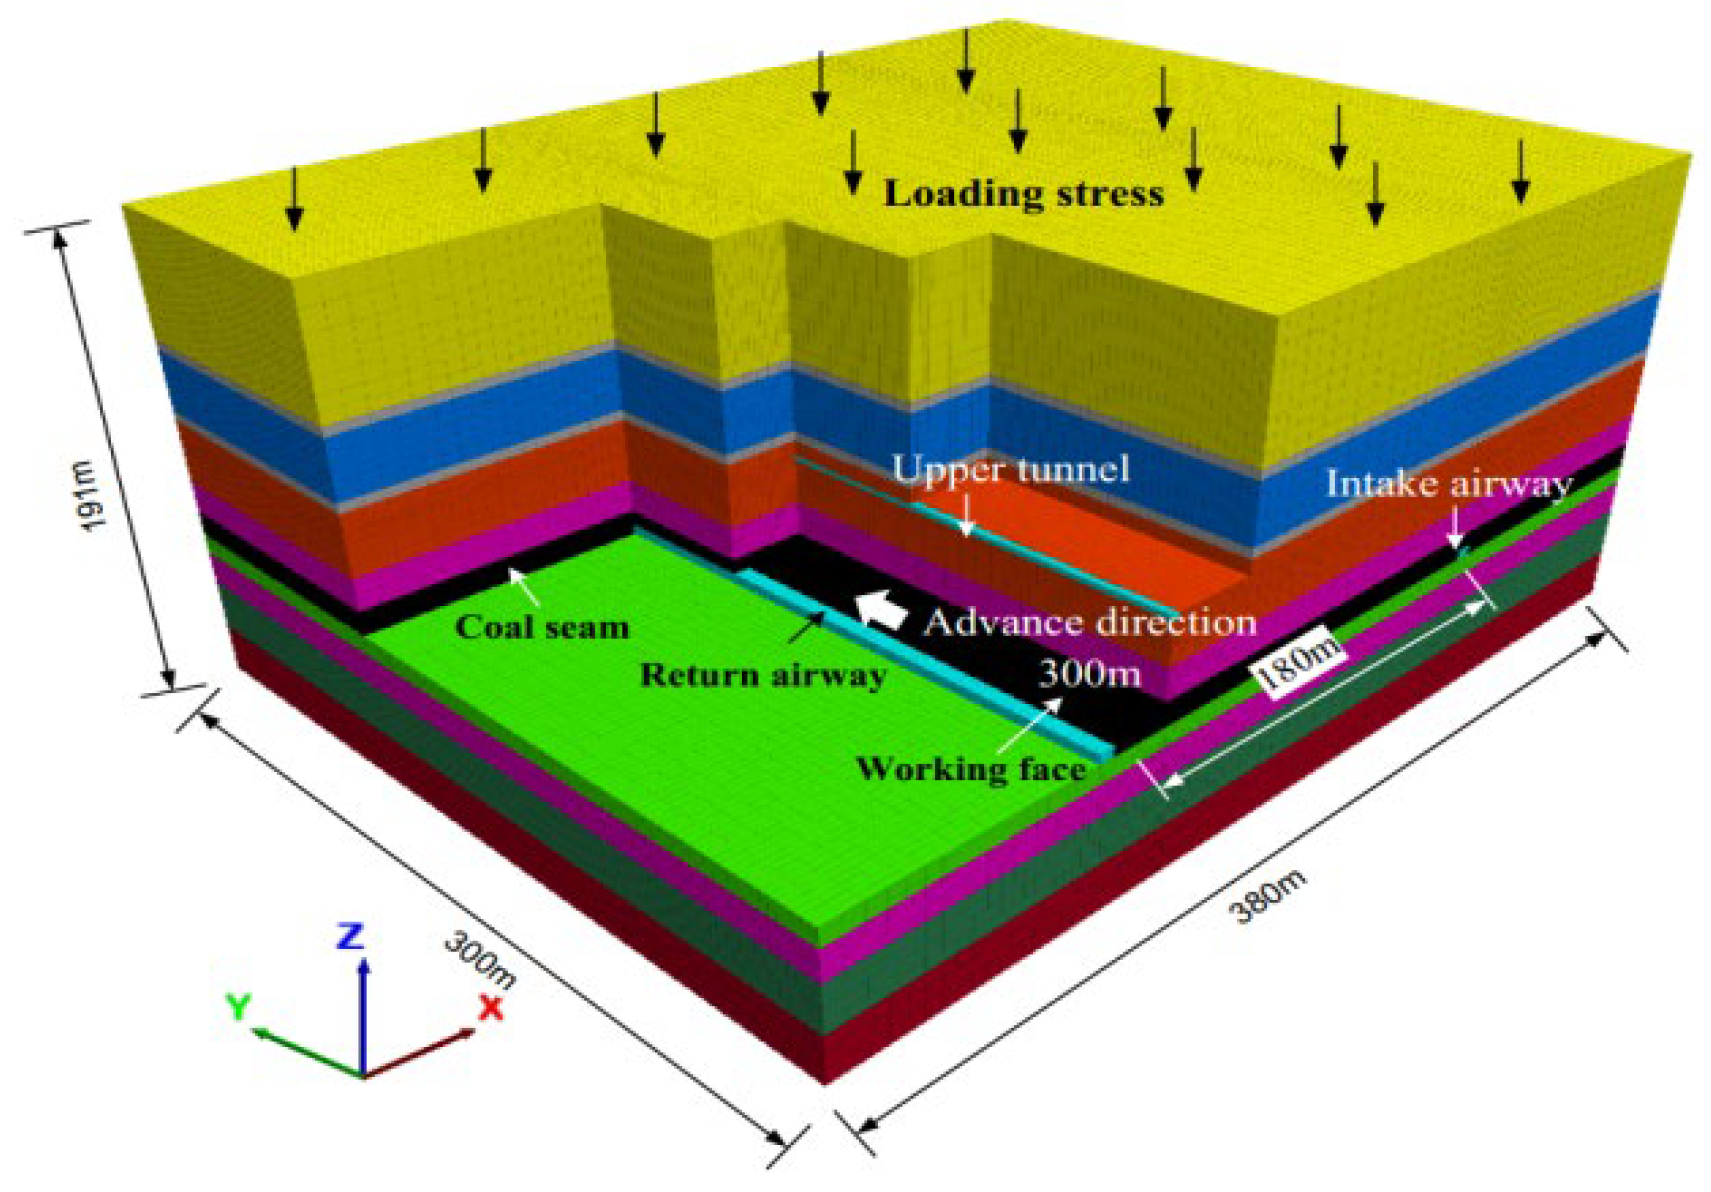
According to the actual geological conditions of the 13,190 working face and the sphere of influence of the excavation activities, a physical model was set up with dimensions of 380 × 300 × 191 m, as shown in Figure 3. Combined with the geological prospecting report, based on improving the convergence and reliability of the simulation calculation, the physical and mechanical parameters of the rocks are given in Table 1. The bottom and edges of the model were set as “no slippage”. A vertical load of 11.75 MPa was applied to the upper boundary of the model to mimic the overburden weight when the working face was at a depth of 550 m. The lateral pressure coefficient was defined as 1.0. The model calculation complied with the Mohr–Coulomb yield criterion. The processes of numerical calculations were initial parameters and stress assignment, excavation tunnel (intake airway, return airway, upper tunnel), stepwise excavation of the working face, and input results.

3.1.2. Breaking Process of Upper Tunnel

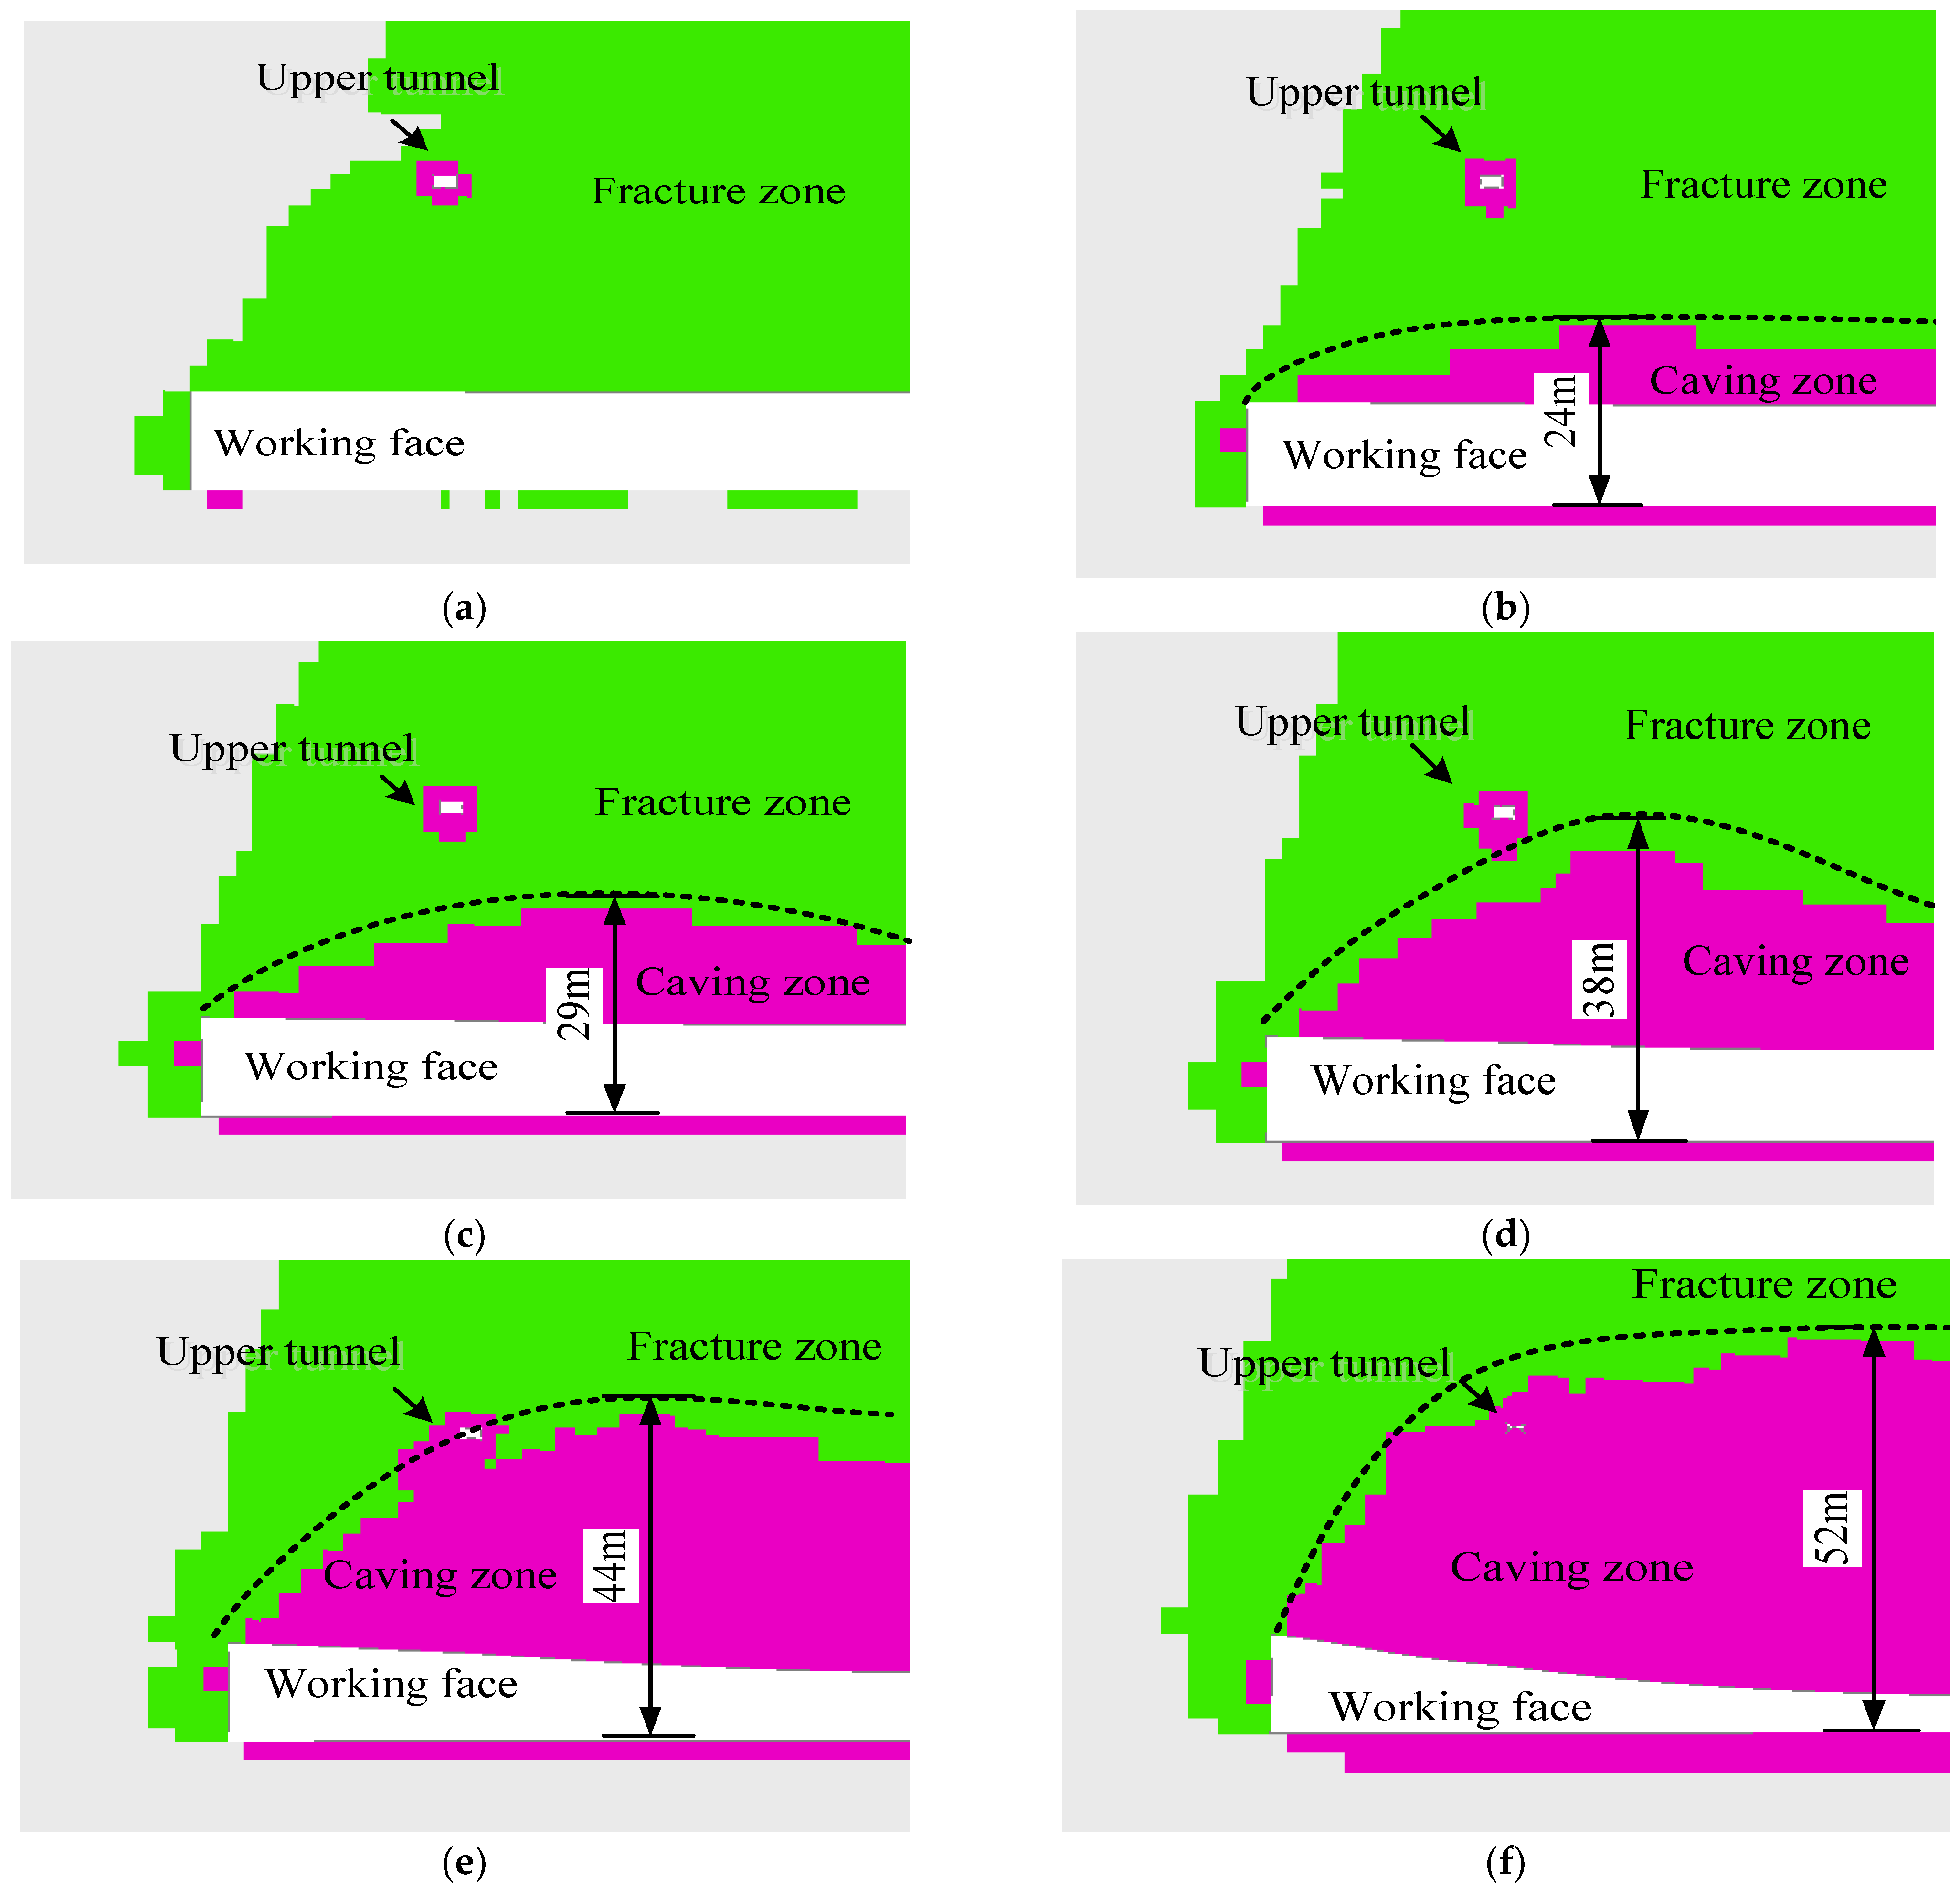
Due to the influences of rock fracturing stresses causing mining pressure, the upper tunnel experienced a breaking process. To study the development of fractures, the deformation of the upper tunnel under different advancing distances of the working face is shown in Figure 4.
The upper tunnel was initially arranged in the fracture zone. As shown in Figure 4a, the shape of the upper tunnel remained intact when the working face advanced 60 m. After that, the upper tunnel began to deform but was not broken when the working face advanced 80 m, and the caving zone expanded and included the upper tunnel, as shown in Figure 4b. As the working face advanced, the upper tunnel deformed seriously and finally broke, as shown in Figure 4c,d. The spatial layout of the upper tunnel displayed similar results when the working face advanced between 120 and 150 m. This illustrates that the upper tunnel incurred periodic deformation and breaking when the working face advanced 120 m.
With the caving zone expanding, the visible part of the upper tunnel was located in the crossing area between the caving zone and the fracture zone in the gob. The fractures developed on the upper tunnel breaking, which provided a favorable environment for gas migration and air leakage.

3.1.3. Effective Drainage Section of Upper Tunnel

Through the analysis of the breaking process, the location of the effective drainage section of the upper tunnel was at a certain distance behind the working face, as shown in Figure 4. Due to the negative pressure of gas drainage, the effective drainage section of the upper tunnel can create a low-pressure sink that impacts the gas migration and the flow fields of air leakage.
To determine the exact location of the effective drainage section, the cross-sections of the upper tunnel at different distances behind the working face were obtained when the working face advanced 150 m, as shown in Figure 5. The closure degree of the cross-sections represented the deformation of the upper tunnel. When the location of the cross-section was within 12 m behind the working face, the shape of the cross-sections slightly changed, as shown in Figure 5a–d. When the location of the cross-section was 15 m behind the working face, the cross-section was seriously deformed, as shown in Figure 5e. When the cross-section was almost closed, the location of the cross-section was 18 m behind the working face. Accordingly, it is clear that the upper tunnel broke, and the location of the effective drainage section of the upper tunnel was 18 m behind the working face. Meanwhile, combined with the expansion of the caving zone seen in Figure 4 and Figure 5, it can be determined that the height of the collapse zone was 52 m.

3.1.4. Model Test by Weighting Interval

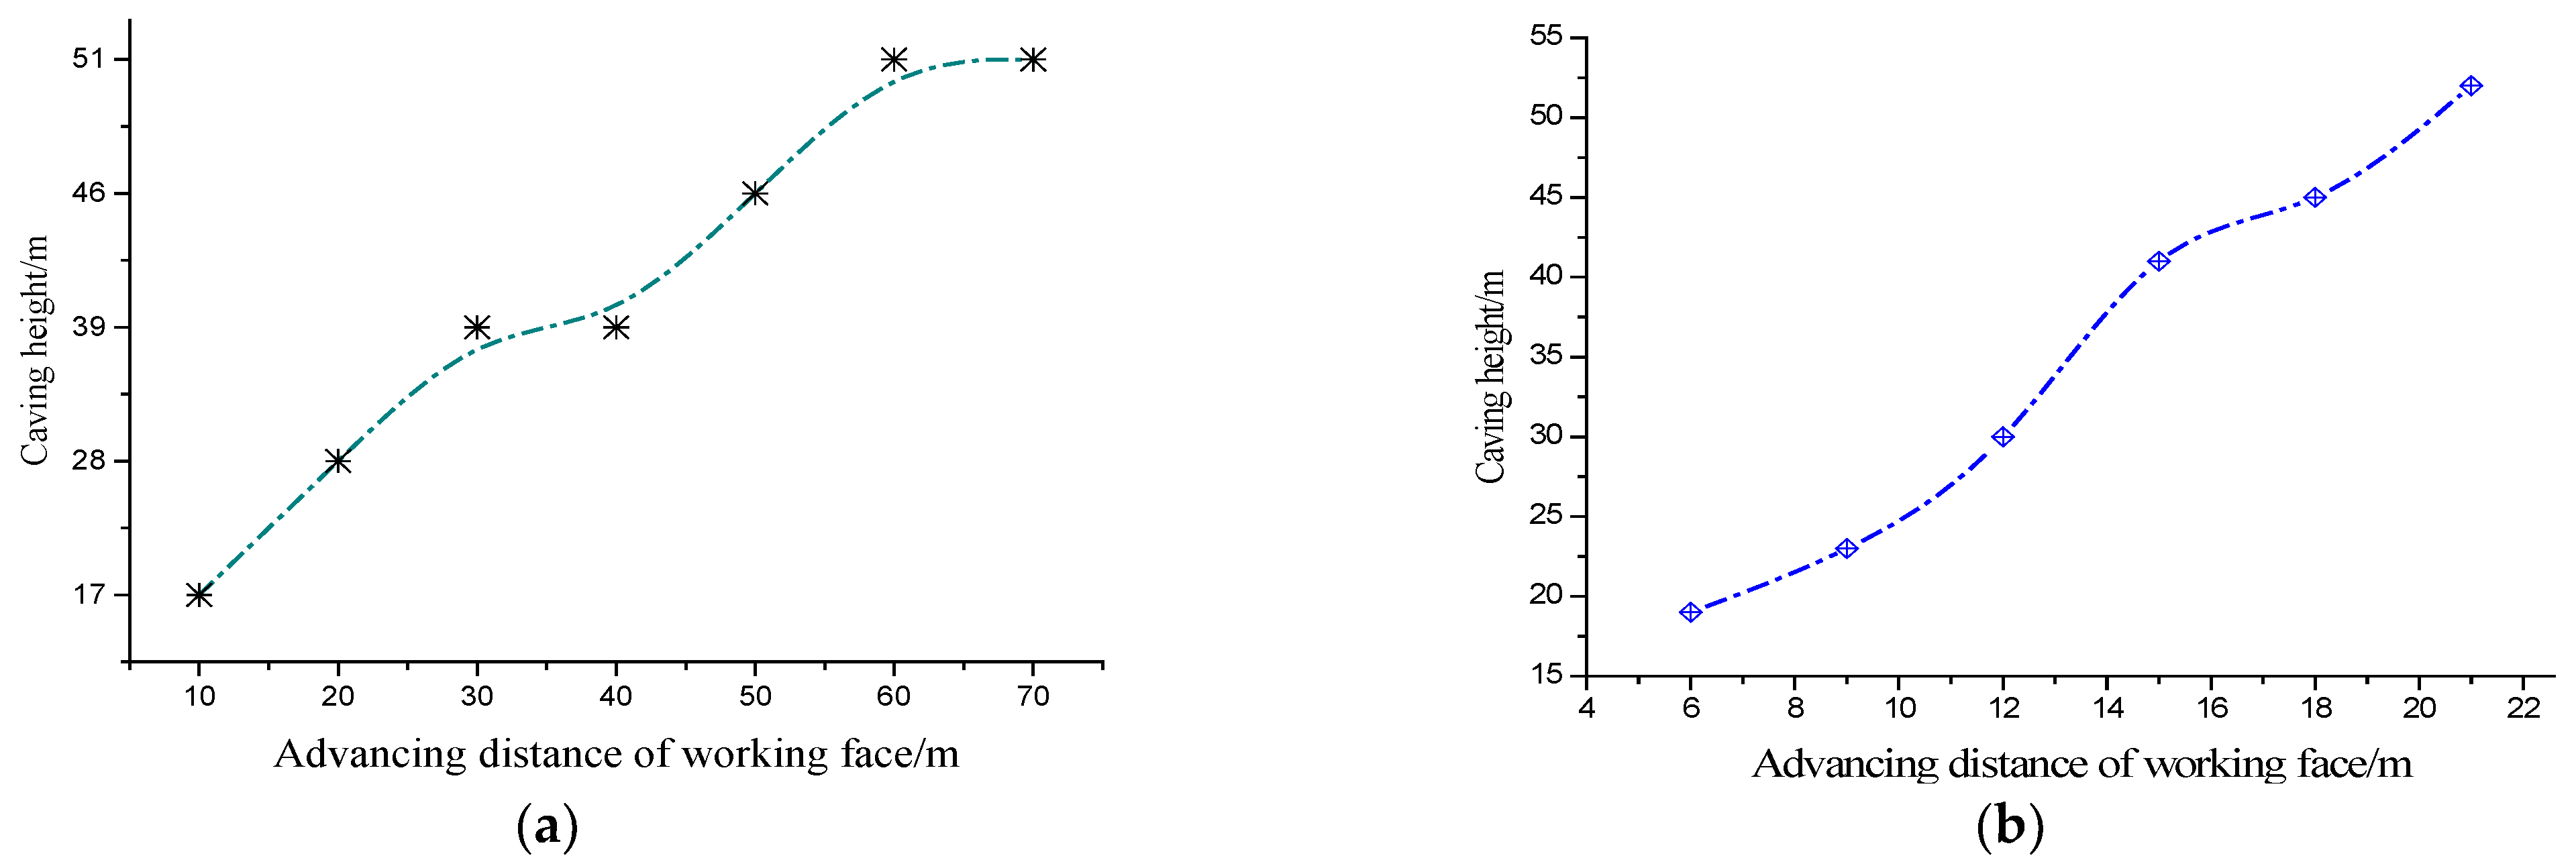
To verify the validity of the numerical simulation, the first weighting interval and periodic weighting intervals were investigated in the model for comparison with the field data. The simulation results show that the caving heights at different advancing distances are shown in Figure 6. The variation in the caving height in the first weighting was obtained by the step excavation method, with an excavation step of 10 m, as shown in Figure 6a. Then, based on the completion of the first weighting, the model continued to be solved by the step excavation method with an excavation step of 3 m. Figure 6b shows that the caving height varied with the advancing distance after the first weighting.
As shown in Figure 6a, the variation in the caving height experienced two stages. In the early period, the caving height increased sharply with the increase in the advancing distance. As the excavation proceeded, the increase of the caving height slowed down gradually after an inflection appeared. Thus, it can be determined that the first weighting had been completed, and the first weighting interval was approximately 40 m. From Figure 6b, after the first weighting, the caving height increased linearly with the increase of the advancing distance, and the periodic weighting interval can be determined when an inflection appeared at 15 m. The caving height was 51 m when the advancing distance was 21 m; thus, the periodic weighting was basically completed.
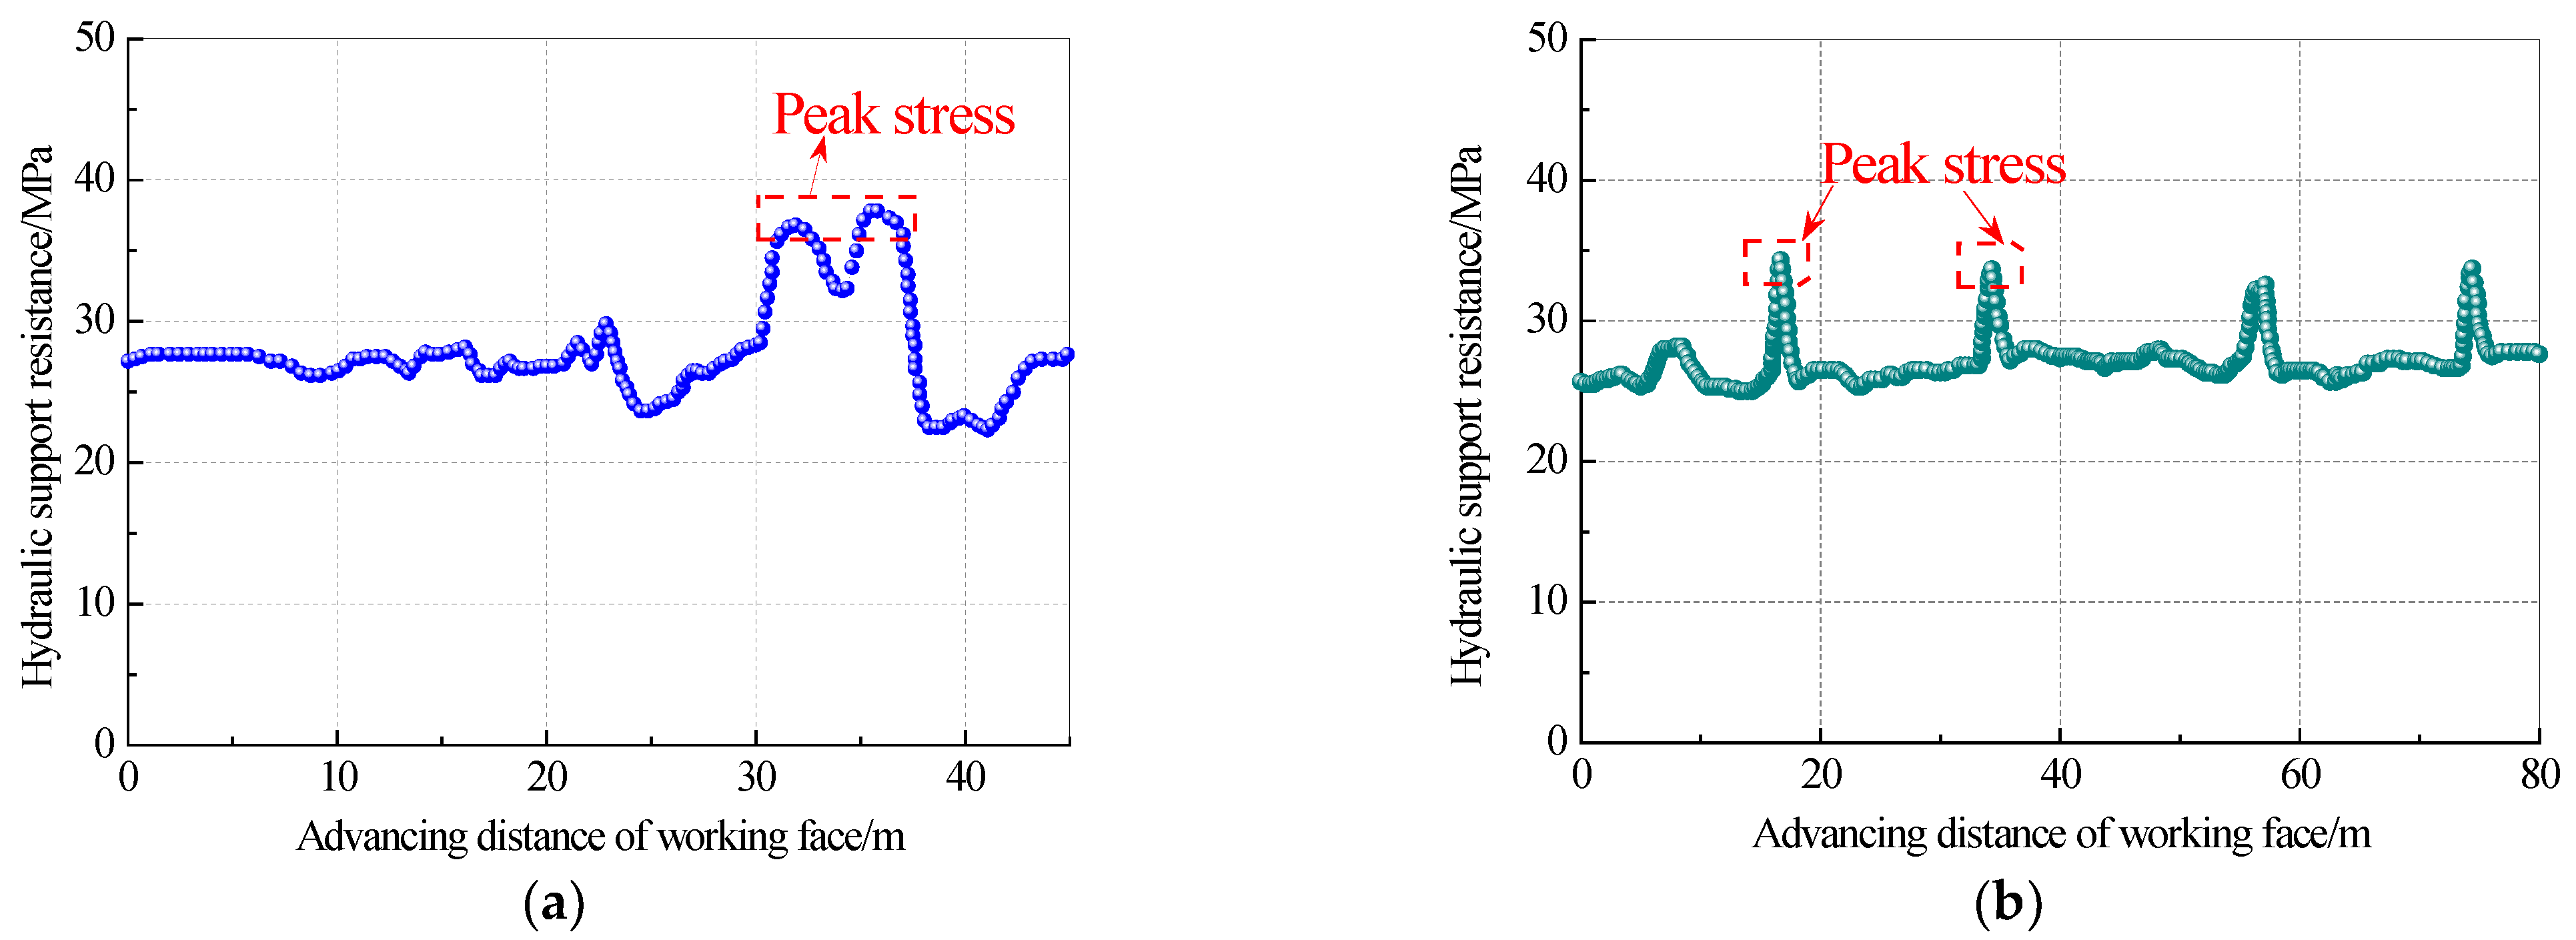
During the mining process, the field-measured curve of the relationship between the hydraulic support resistance and the advancing distance was obtained, as shown in Figure 7. As shown in Figure 7a, the hydraulic support resistance increased significantly when the advancing distance was 33 m, and the peak value of the hydraulic support resistance appeared at 37 m. Thus, the measured first weighting interval was approximately 37 m. Similarly, after the first weighting, the hydraulic support resistance presented a periodic change, and the periodic weighting interval can be obtained as 17 m in Figure 7b. Through the first weighting and periodic weighting intervals, the simulation results agree well with the measured data, and the rationality of the numerical model was confirmed.
With the advance of the working face, the overlying strata caved, leading to the expansion of the caving zone. The upper tunnel was initially laid in the fracture zone and was eventually surrounded by the caving zone. Owing to the deformation and breaking of the upper tunnel, the location of the effective drainage section was 18 m behind the working face. Schatzel et al. described a study to provide direct measurements of longwall mining-induced changes to fluid flow properties in overlying strata and reported that the permeability increased by a hundred to a thousand times in the overburden strata [25]. D. P. Adhikary and Guo conducted tests in the roof strata of a longwall gob, and their results indicated the possibility of a more than 1000-fold increase in permeability due to longwall mining [11,17]. With overburdened strata caving and upper tunnel breaking, the development of fractures not only contributed to gas desorption and migration but also provided a flow channel for air leakage. The above conclusions will be helpful in further studying the influence of the gas drainage of the upper tunnel on the air leakage in the gob.

3.2. Flow Field of Air Leakage

Because of the spatial layout, the upper tunnel was well connected to the gob gas and achieved high-efficiency drainage but resulted in air leakage. The gas drainage resistance of the upper tunnel decreased with the development of fractures during the mining process. To determine the air leakage patterns under the gas drainage of the upper tunnel, the air leakage flow fields in the gob were studied in a CFD model, where the length of the upper tunnel was 18 m at the rear of the working face based on Section 3.1.

3.2.1. Governing Equations

The air leakage flow in the longwall mine gob area was treated as laminar flow in a porous medium by Darcy’s law, while the airflow in the ventilation airway was simulated as a fully developed turbulent flow. The three-dimensional governing equation of gob gas flow at a steady state can be obtained as:
v = k μ p
where v is the Darcy velocity vector, m/s; p is the gas pressure, Pa; μ is the gas dynamic viscosity Pa·s; k is the permeability of porous media in m2.
To simulate the distribution of oxygen concentration in the gob during the gas drainage of the upper tunnel, the oxygen mass transfer in porous media is given by:
n c t + ( n D c ) + u c ) = w
where c is the concentration of oxygen, D is the diffusion coefficient of oxygen, and w is the source or sink of oxygen during transmission.
The permeability k is a function of porosity n and is defined by Equation (3) using the Blake–Kozeny formula [26,27,28], and Dp is the harmonic average particle size in m.
k = D p 2 150 n 3 1 n 2
The porosity n can be obtained by the bulking factor Kp in the gob and is expressed by Equation (4).
n ( x , y , z ) = 1 1 K p ( x , y , z )
According to the law of mining pressure, Kp follows the law of attenuation of the negative exponent in Equation (5) [29,30].
K p ( x , y , z ) = K p ( x , y ) × K p ( z ) = ( K p + ( K p 0 K p ) e a d ) × ( 1.083 0.017 ln z )
where K p 0 is the bulking factor before compacting, K p is the bulking factor after compacting, a is the bulking factor attenuation ratios in the dip and strike directions of the face with respective values of 0.037 and 0.268 m−1, d is the distance from any coordinate point in the gob to the boundary, m, and z is the height of the coordinate point. In this paper, the value of K p 0 = 1.35 and that of K p = 1.15.
The bulking factor Kp, porosity n, and permeability k are shown in Figure 8a–c, respectively.

3.2.2. Boundary Conditions

A steady-state model was built with the site conditions of the 13,190 working face. Ignoring the influence of a deeper gob on the air leakage flow field, the fully developed gob was 300 m long in this study. The width of the working face was 180 m. The height of the gob was 60 m. The length of the intake airway and return airway were both 15 m, with a section size of 4 × 3.3 m. The upper tunnel was 30 m away from the floor, the horizontal distance between the upper tunnel and the return airway was 20 m, and the cross-section of the upper tunnel was 2 × 2 m. The location of the effective drainage section was 18 m behind the working face. Section (a) of the intake airway is defined as the inlet of the CFD model. Section (b) of the upper tunnel and Section (c) of the return airway are defined as the outlets of the model. The physical model is shown in Figure 9. The 3D permeability model, as shown in Figure 8c, was incorporated into the CFD model by the UFD function. The boundary conditions and source items of the CFD model are listed in Table 2.
According to the actual ventilation conditions, the air volume was 1300 m3/min; thus, Section (a) of the intake airway was set as the velocity inlet at 1.64 m/s. The gas drainage volume of the upper tunnel was 180 m3/min, and the boundary of Section (b) was set as an outflow at 0.75 m/s. The total gas emission volume was 23.5 m3/min. The nitrogen injection was regarded as a point source on the floor, with a volume of 50 m3/min, departing 30 m from the working face. The joint surfaces of the working face and the gob, as well as the gob and upper tunnel, were set as the interior wall; the remaining boundaries are defined as no slip.

3.2.3. Flow Field Characteristics

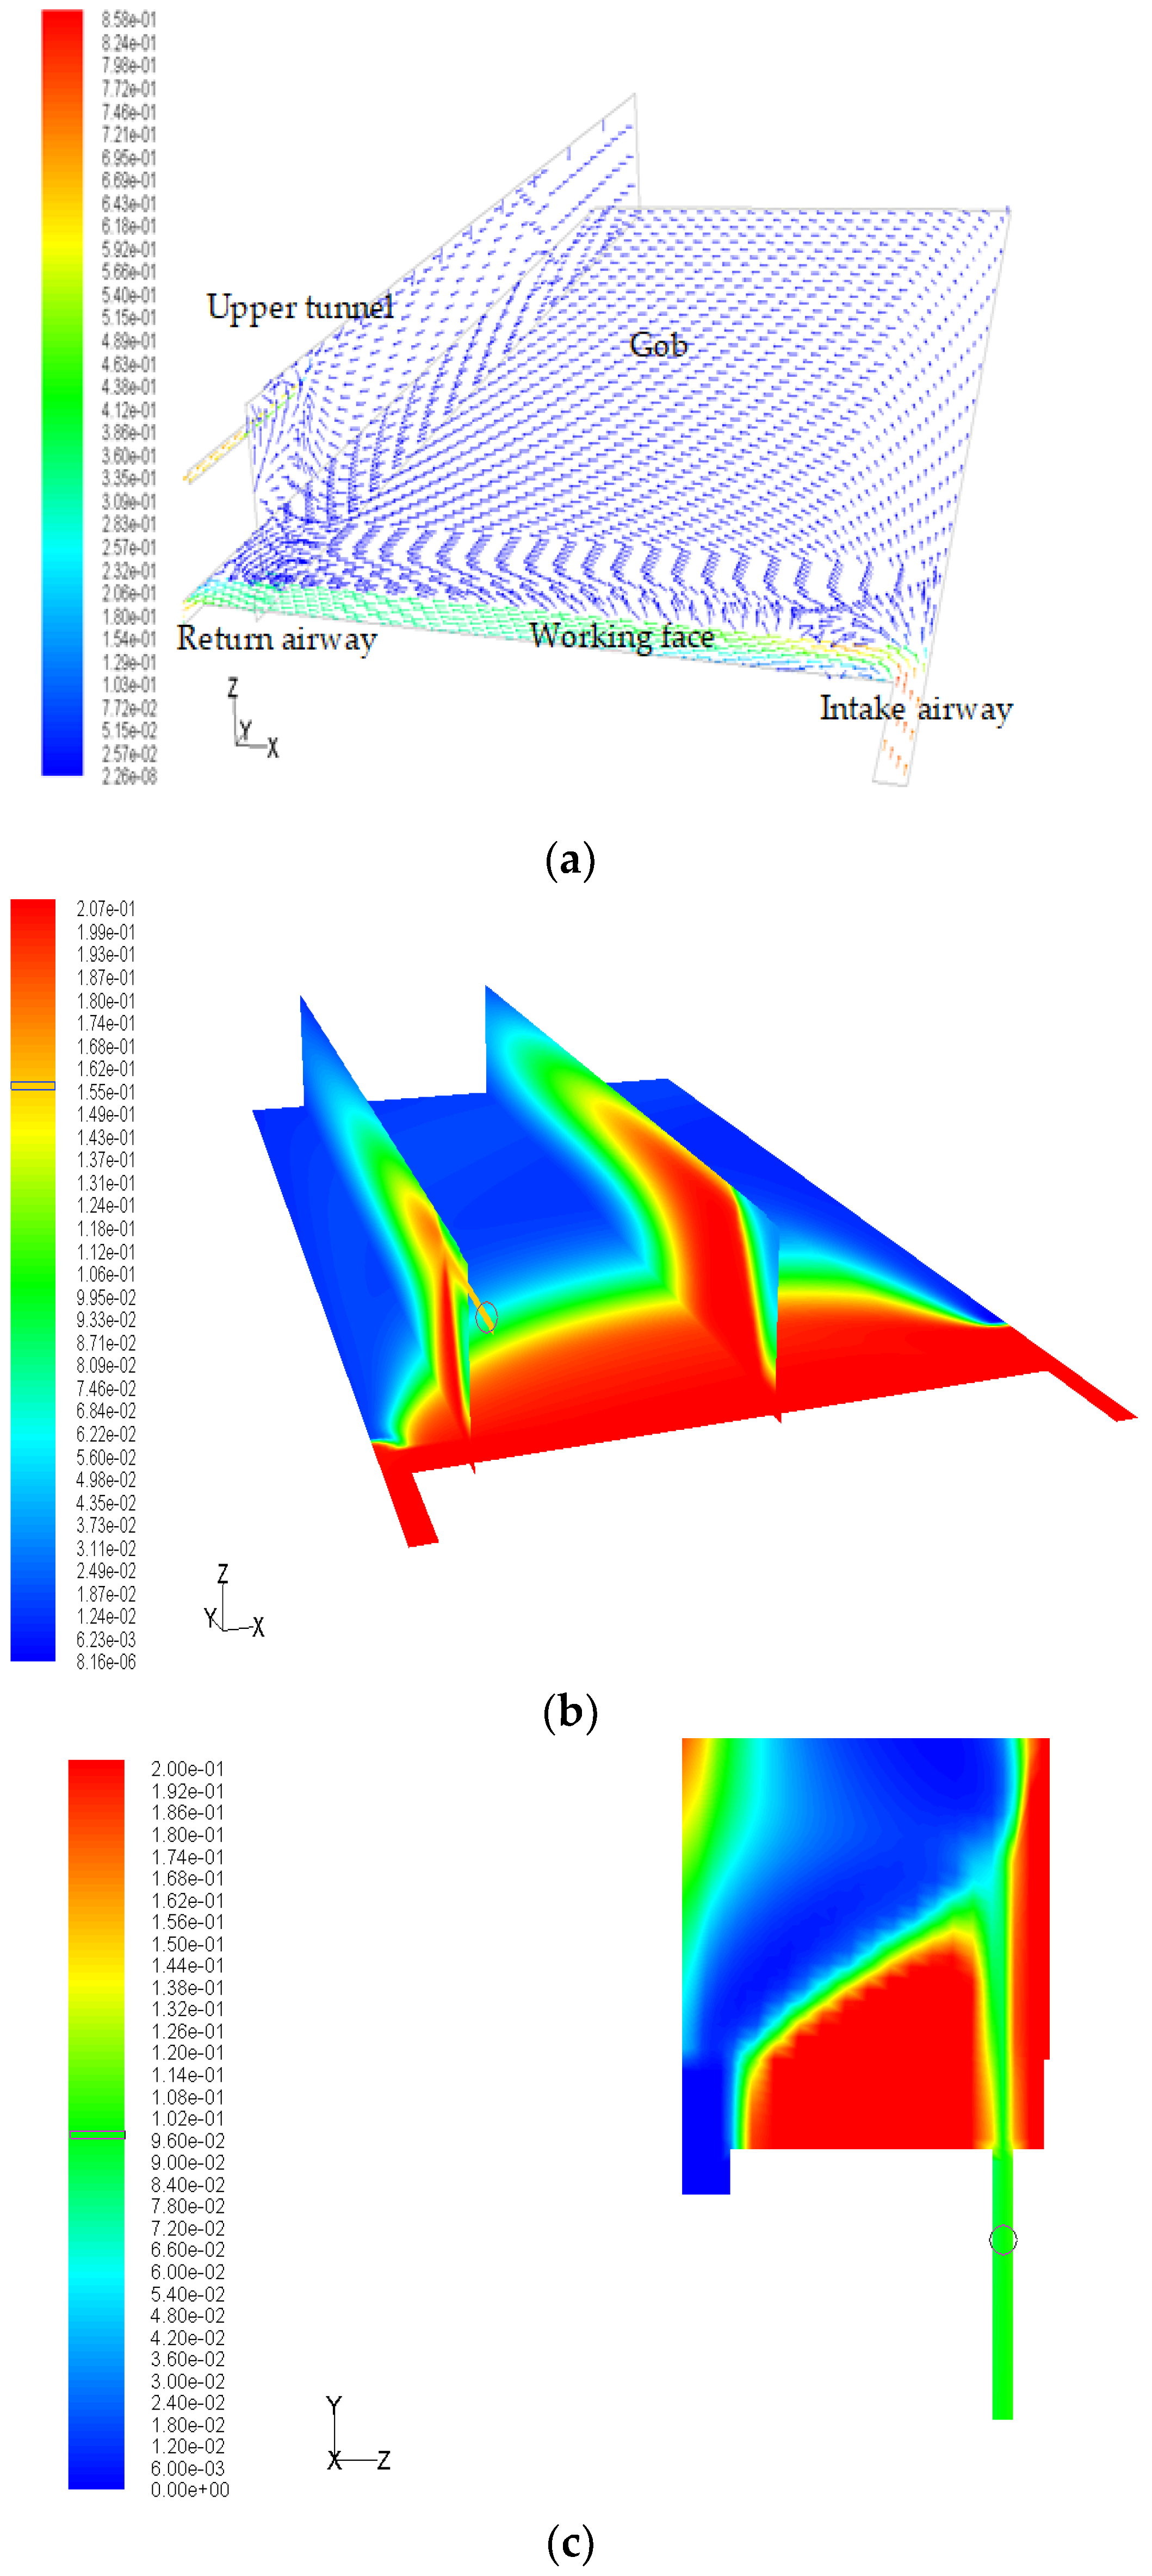
During the gas drainage of the upper tunnel, the air leakage flow fields in the gob were redistributed to new characteristics due to the spatial layout of the upper tunnel and the position of the low-pressure sink. Under the prerequisites for fissure development, the migration and distribution of the air leakage should be addressed, which is conducive to further determination of the influence of the gas drainage of the upper tunnel on the air leakage flow field. The air leakage schematic diagram is shown in Figure 10a, the distribution of the oxygen volume fraction is given in Figure 10b, and the gas volume fraction of the upper tunnel is shown in Figure 10c.
The air leakage flow presents the pattern of “a source and two sinks” in the gob, as shown in Figure 10a. The corner of the intake airway was the source of air leakage, and the low-pressure sinks were the upper corner and the gas drainage section. The complexity of the air leakage in the gob under the gas drainage of the upper tunnel was greater than that of a common ventilation system. The characteristics of the air leakage flow fields in the gob during the gas drainage of the upper tunnel are as follows: (1) the air leakage was segmented into two parts and presented a stereoscopic distribution compared with the “U” ventilation system; (2) a part of the air leakage flowed into the deeper gob and was finally extracted by the upper tunnel, defined as the high-position air leakage; (3) the remainder of the air leakage flow was through the gob and eventually back to the return airway, defined as low-position air leakage.
After determining the flow paths of the air leakage, the mass transfer of oxygen was subsequently studied, as shown in Figure 10b. Since the air leakage from the intake airway into the gob had a certain initial velocity, the distribution of the air leakage in the x–y plane was asymmetric. The scope of the air leakage near the intake airway was clearly deeper than that near the return airway in the gob. The air leakage flowed into the upper tunnel because of the low-pressure sink, and the oxygen volume fraction of the upper tunnel was in the range from 15.5% to 16.2%, with an average of 15.8%. In Figure 10c, the average gas volume fraction of the upper tunnel is approximately 9.8%.
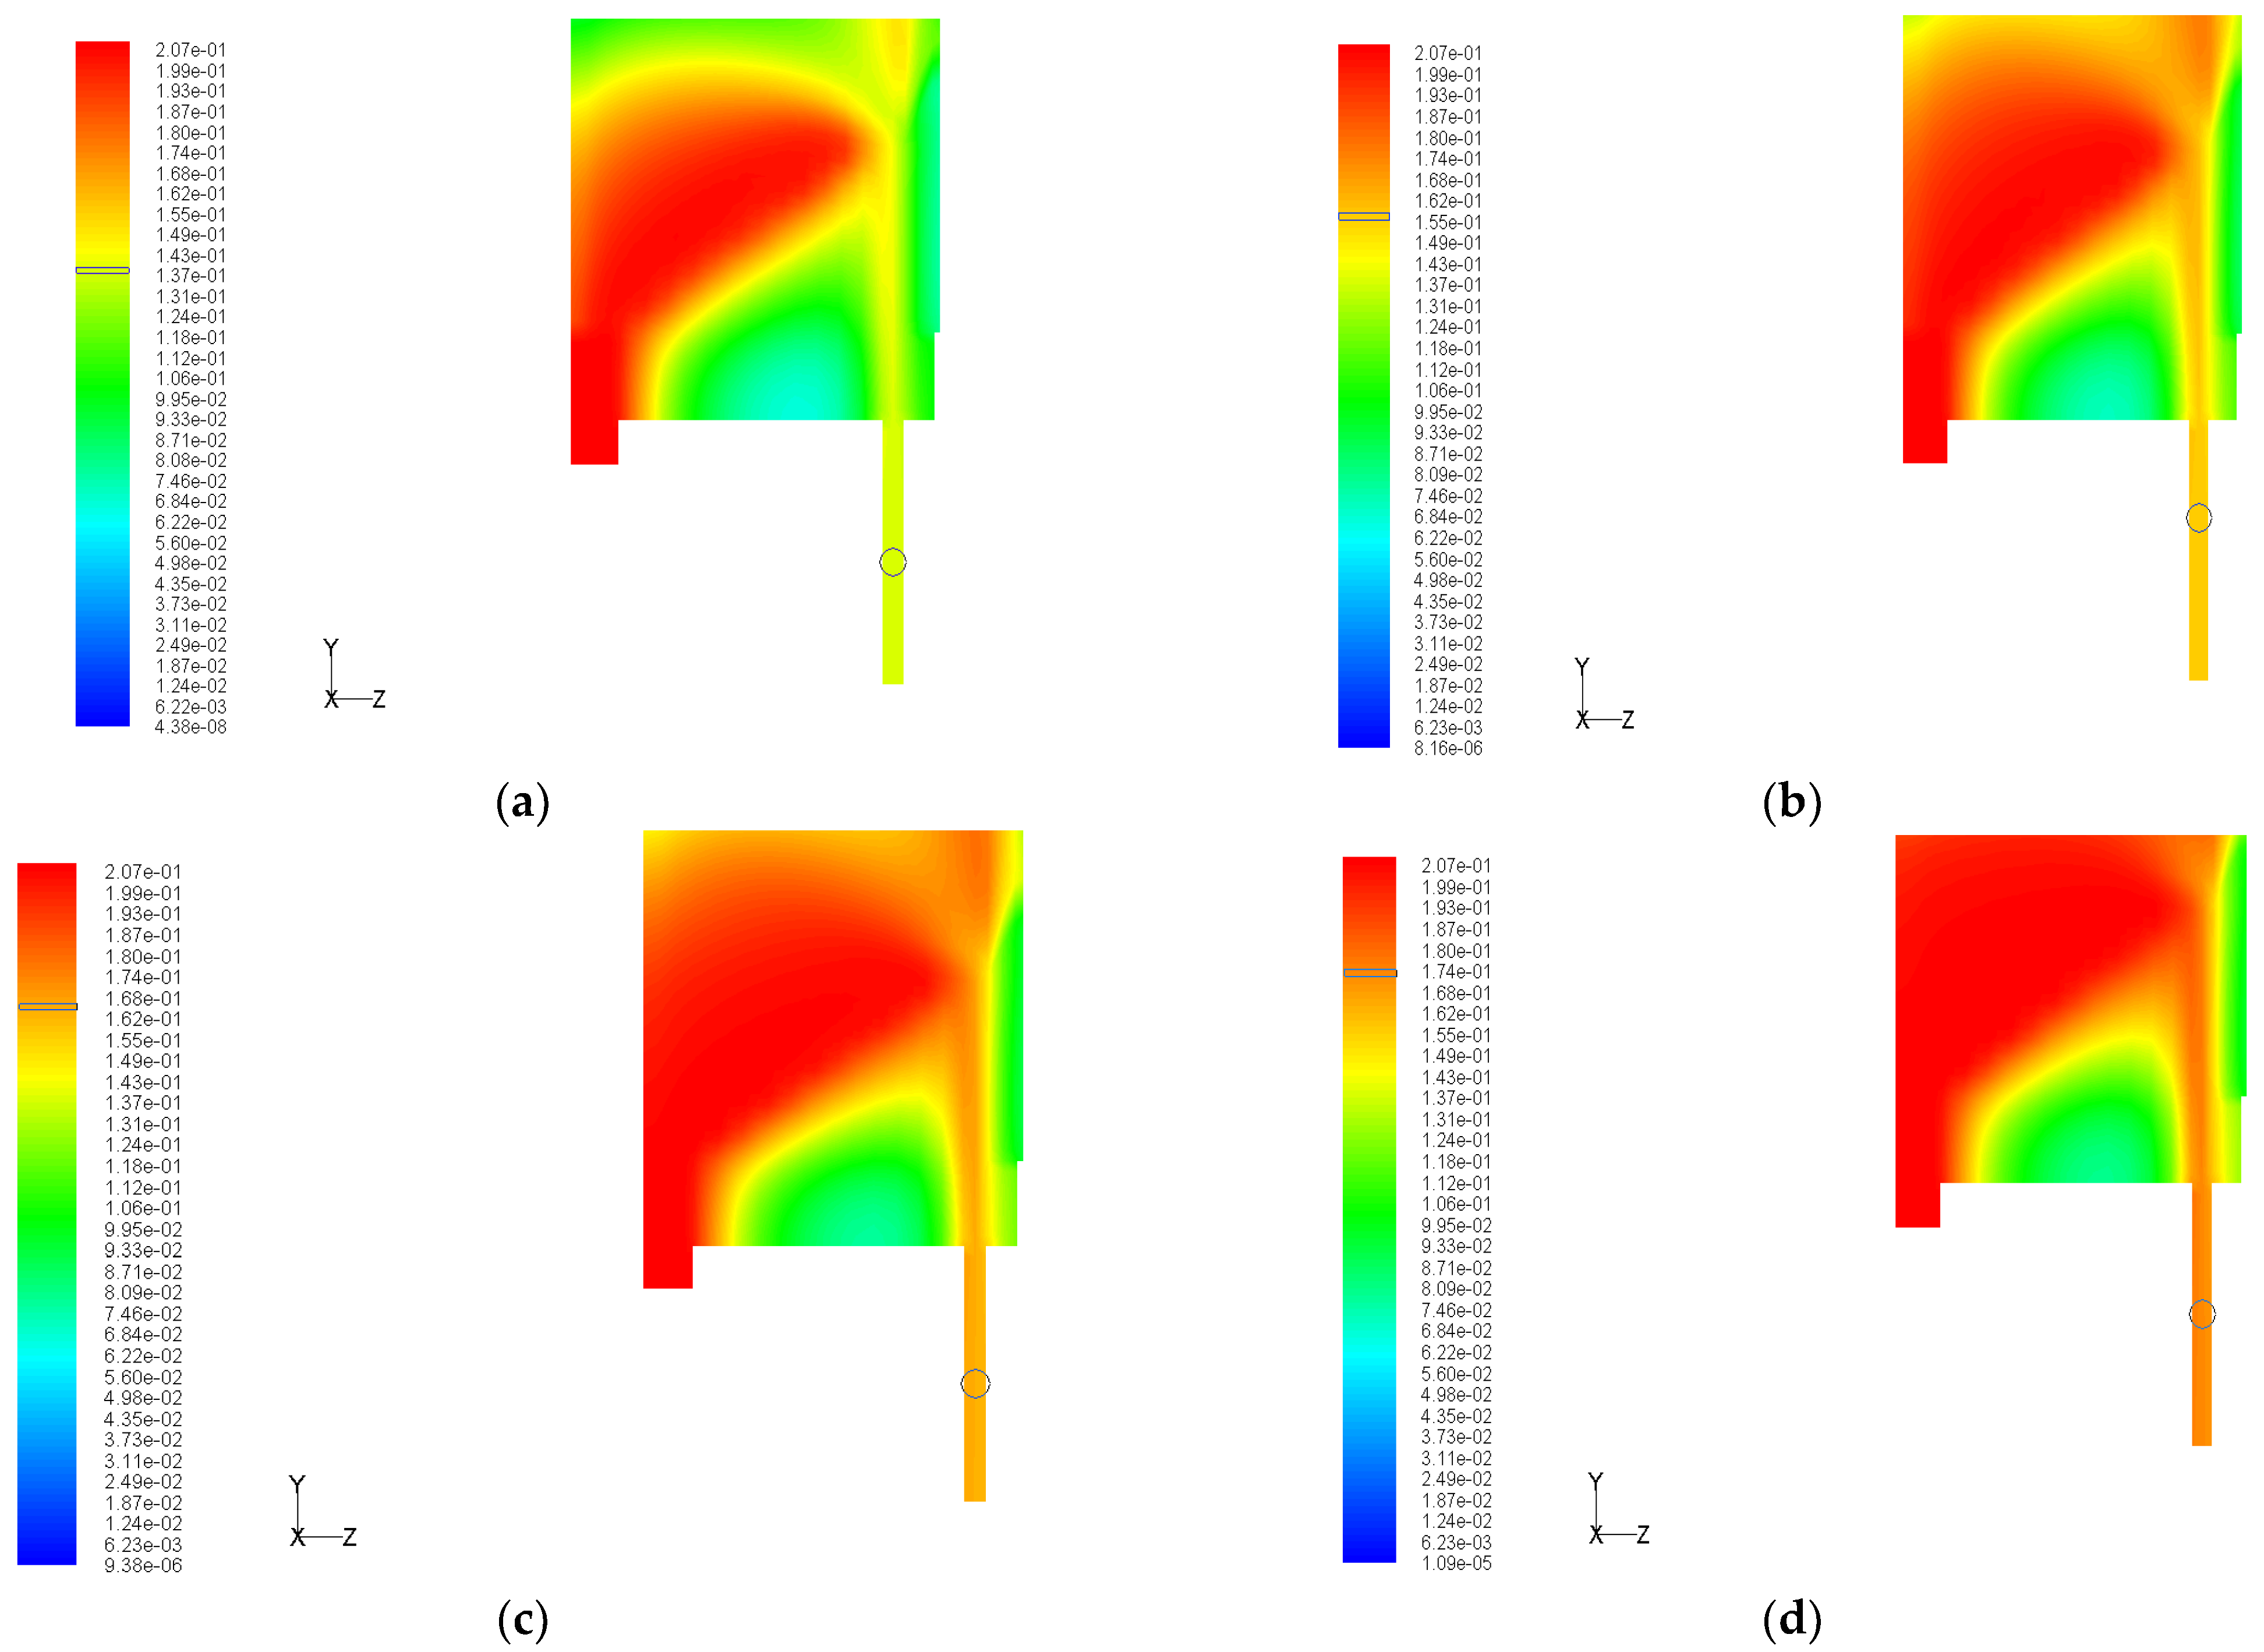
To more intuitively display the influence of the gas drainage volume on the air leakage, the oxygen volume fraction of the upper tunnel was investigated at different drainage volumes, as shown in Figure 11. The oxygen volume fractions were 14.1%, 15.8%, 16.4%, and 17.4%, corresponding to gas drainage volumes of 120, 180, 240, and 300 m3/min, respectively. The oxygen volume fraction of the upper tunnel increased with increasing gas drainage volume. According to the principle of conservation of mass, the air leakage volume during the gas drainage of the upper tunnel also increased, which is unfavorable in preventing spontaneous coal combustion.

3.2.4. Verification of CFD Modelling

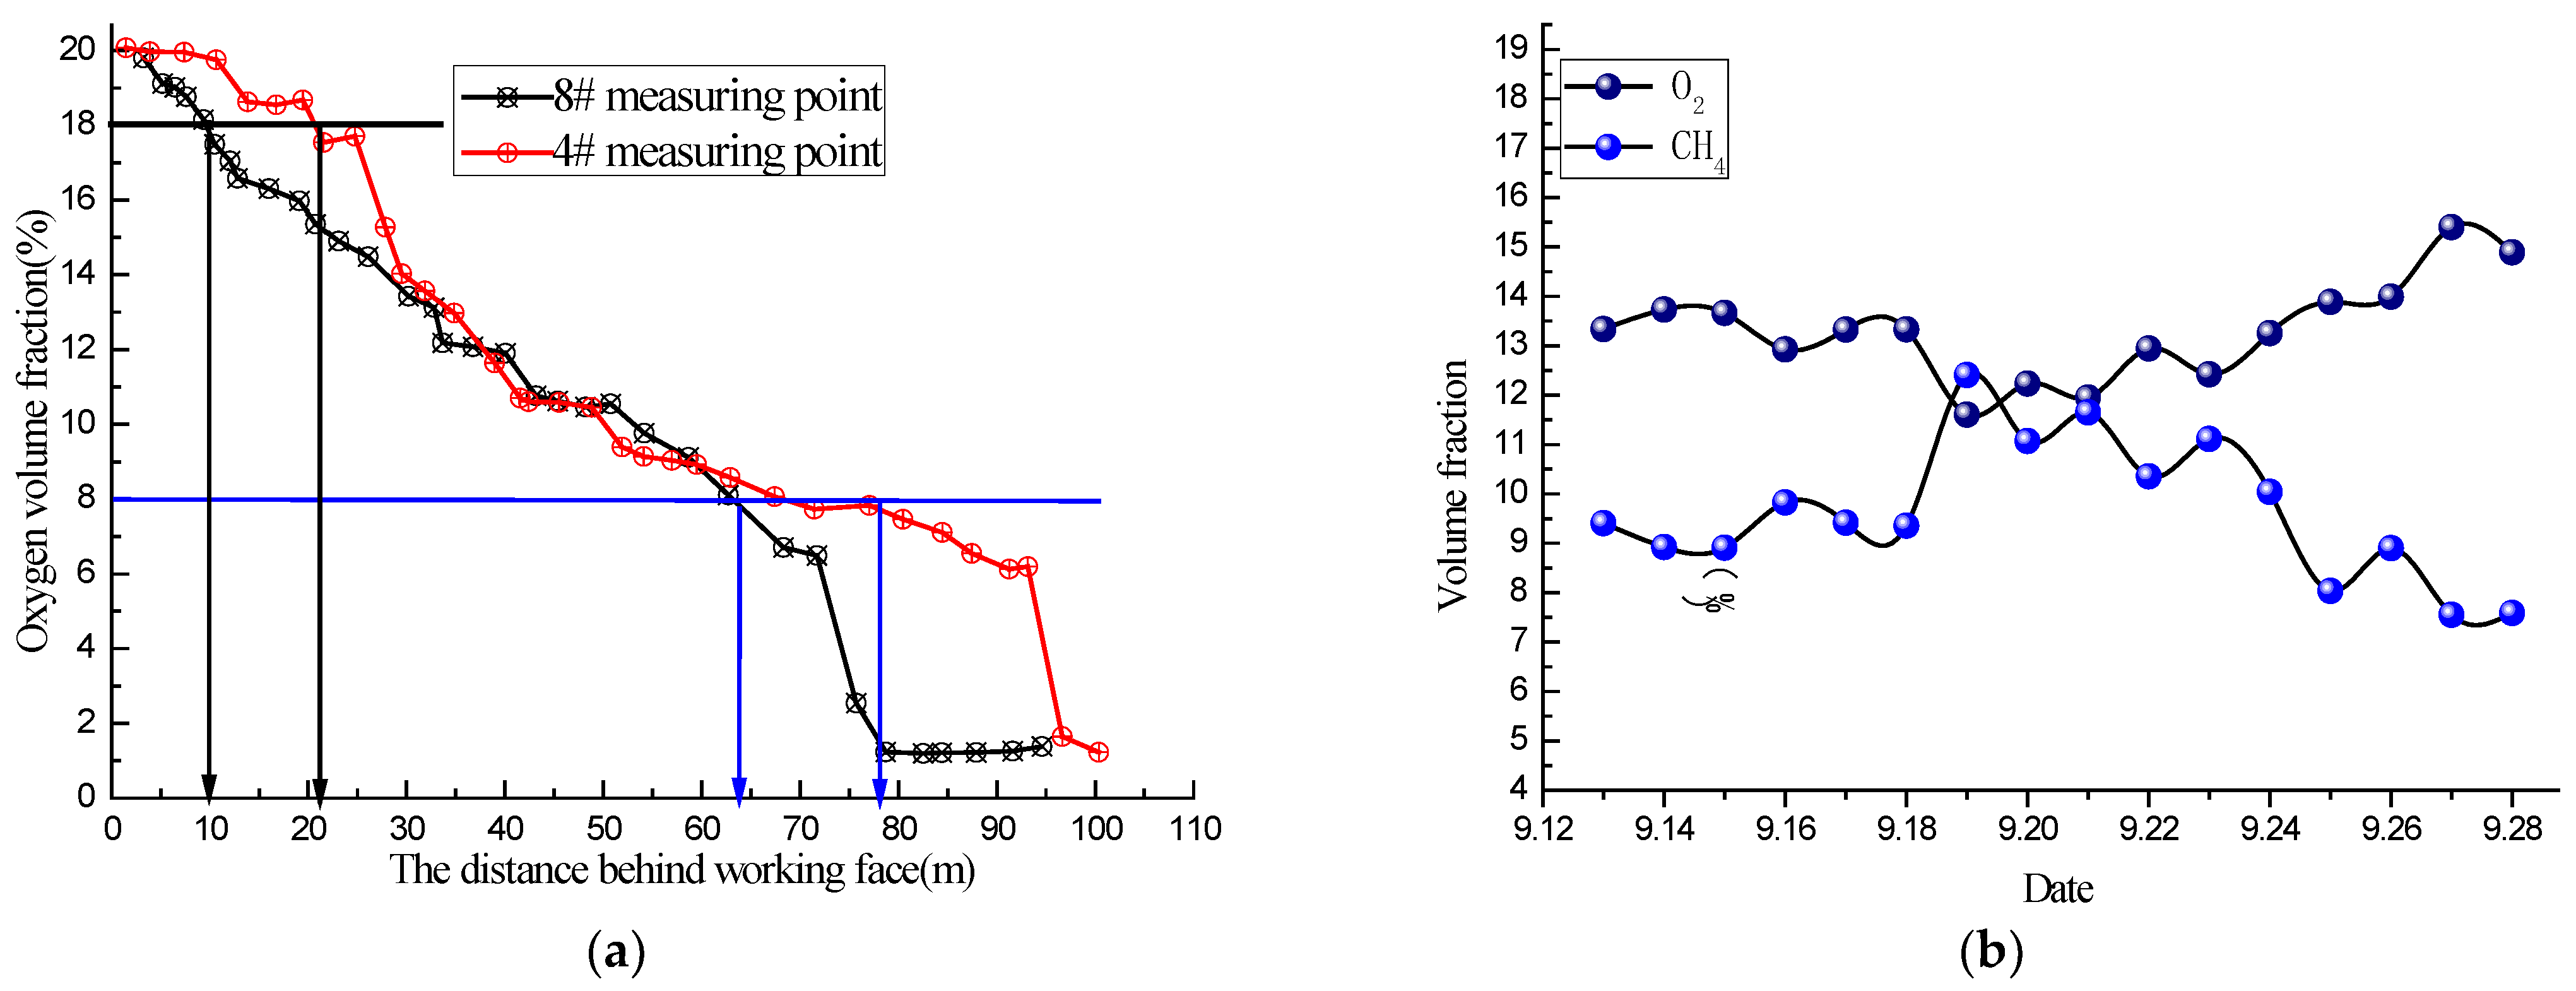
During the mining process, the oxygen volume fraction in the gob was detected by the measuring points of the beam tube system. The variations in the oxygen volume fractions at measuring point numbers 4# and 8# are shown in Figure 12a. In one on-site sampling period, the changes in the oxygen and gas volume fractions of the upper tunnel are shown in Figure 12b.
From the on-site measured data, the oxidation zone was distributed in the range of 10–78 m in Figure 12a; the average gas volume fraction was 9.67%, and the average oxygen volume fraction was 13.31% in Figure 12b.
The oxygen and gas volume fractions of the upper tunnel were 9.8% and 15.8%, respectively, as shown in Figure 10b,c. Thus, the simulation results and the on-site measured data agree well with each other, which illustrates the reliability of the CFD model.
Through the analysis of the air leakage flow fields under the gas drainage of the upper tunnel, the air leakage was segmented into two parts: high-position air leakage and low-position air leakage. Furthermore, the oxygen volume fraction of the upper tunnel increased with the increase in gas drainage volume, which indicated the intensifying air leakage. With the goal of gas control and self-heating in coal prevention, a suitable gas drainage volume of the upper tunnel should be determined.

4. Determination of the Suitable Gas Drainage Volume

Increasing the gas drainage volume of the upper tunnel is the commonly used method to improve the efficiency of the gas drainage, but this approach leads to intensifying the air leakage, which has an adverse impact on preventing self-heating in coal. On the other hand, although lowering the gas drainage volume can reduce the risk of self-heating in coal, it often results in a gas overrun of the working face. Accordingly, an appropriate gas drainage volume should not only control the gas which does not exceed the limit in working face and the upper corner but also ensure that the width of the oxidation zone in the gob is in a safe range.
To determine the suitable gas drainage volume, the gas volume fraction of the return airway and the width of the oxidation zone in the gob were investigated at gas drainage volumes of 120, 180, and 240 m3/min, as shown in Figure 13. Combined with the gas control effect and oxidation zone width, the suitability of the gas drainage volume was evaluated, as shown in Table 3. When the gas drainage volume was 120 m3/min, the gas volume fraction of the upper corner was close to the critical value of 1%, which was beyond the limit for controlling gas disasters. Similarly, when the gas drainage volume was 240 m3/min, the width of the oxidation zone in the gob was 73 m, exceeding the maximum acceptable width of the oxidation zone. When the gas drainage volume was 180 m3/min, both the gas emission and self-heating in coal could be better controlled.

5. Conclusions

Gas drainage of the upper tunnel is one of the commonly used gas drainage technologies in China. According to the spatial layout of the upper tunnel, the air leakage mechanism, including the fracture development rules, the location of the effective drainage section, and the air leakage flow fields, were numerically studied, and the safe gas drainage volume of the upper tunnel was determined. The following conclusions were drawn.
(1)
The breaking process and the location of the effective drainage section of the upper tunnel were determined. With the advance of the working face, the upper tunnel was finally located at the junction of the caving zone and fracture zone. The upper tunnel showed periodic deformation and breaking, and the developing fractures provided channels for air leakage. The location of the effective drainage section was 18 m behind the working face of the gob.
(2)
The characteristics of air leakage influenced by the upper tunnel were identified. The air leakage was segmented into two parts, high-position air leakage and low-position air leakage, which were stereoscopic distributions.
(3)
The influences of the gas extraction amount on gas emission and the distribution of the spontaneous combustion danger area in the goaf were clarified. Increasing the gas drainage volume led to an increase in the distribution of the spontaneous combustion danger area, which was adverse to the prevention of self-heating in coal. However, the gas concentration in the upper corner decreased with the increase in the extraction quantity. According to the simulation results, the actual gas extraction parameters of the mine were guided by comparing and analyzing the gas emission and spontaneous combustion of coal with different extraction quantities. The safe gas drainage volume was determined. This method effectively prevents spontaneous coal seam combustion in the goaf and gas accumulation in the upper corner; it lays the foundation for safe and efficient mine mining.

6. Discussion

This paper studied the formation of air leakage channels in the advancing process of the working face, including the crushing process of the upper tunnel and the expansion of the caving zone. The location of the effective drainage section of the upper tunnel was obtained and applied to the CFD model to solve the air leakage flow field in the goaf. Finally, the appropriate gas drainage amount was determined by the simulation results. It made up for the problems from previous articles (which paid little attention to the location of the effective drainage section and the air leakage flow field under the gas drainage of the upper tunnel) and achieved good results, providing references for future research on the air leakage mechanism of the upper tunnel and the appropriate gas drainage capacity.

Author Contributions

Conceptualization, C.Z., T.C. and S.L.; data curation, T.C. and X.N.; written—original draft preparation, C.Z. and T.C.; resources, T.C.; methodology, C.Z. and T.C.; funding acquisition, S.L. All authors have read and agreed to the published version of the manuscript.

Funding

This research was funded by the National Natural Science Foundation of Hebei Province (E2019508124, 2018GJJG474, 3142018038) and the National Natural Science Foundation of China (41771404, 51774114, 52104193).

Institutional Review Board Statement

Studies not involving humans or animals.

Informed Consent Statement

Not applicable.

Data Availability Statement

Data available on request from the authors.

Acknowledgments

This work was conducted in the context of self-heating in coal in the gob of the Gengcun mine. We want to thank the engineers and managers of the Gengcun mine for their information and suggestions. We would also like to thank the editors and the reviewers for their help with the original manuscript.

Conflicts of Interest

The authors declare no conflict of interest.

References

  1. Diamond, W.P.; Garcia, F. Prediction of Longwall Methane Emissions: An Evaluation of the Influence of Mining Practices on Gas Emissions and Methane Control Systems; Report of Investigations No.9649; National Institute for Occupational Safety and Health: Pittsburgh, PA, USA, 1999. [Google Scholar]
  2. Karacan, C.Ö.; Esterhuizen, G.S.; Schatzel, S.J.; Diamond, W.P. Reservoir simulation based modelling for characterizing longwall methane emissions and gob gas venthole production. Int. J. Coal Geol. 2007, 71, 225–245. [Google Scholar] [CrossRef]
  3. Qin, Z.Y.; Yuan, L.; Guo, H.; Qu, Q.D. Investigation of longwall gob gas flows and borehole drainage performance by CFD simulation. Int. J. Coal Geol. 2015, 150–151, 51–63. [Google Scholar] [CrossRef]
  4. Zhou, F.B.; Xia, T.Q.; Wang, X.X.; Zhang, Y.F.; Sun, Y.N.; Liu, J.S. Recent developments in coal mine methane drainage and utilization in China: A review. J. Nat. Gas Sci. Eng. 2016, 31, 437–458. [Google Scholar] [CrossRef]
  5. Chu, T.X.; Jiang, D.Y.; Yu, M.G.; Chen, Y.X. Study on mechanism of inducing coal spontaneous combustion and safe gas drainage volume under roof tunnel gas drainage. J. China Coal Soc. 2016, 41, 1701–1710. (In Chinese) [Google Scholar] [CrossRef]
  6. Xie, S.R.; Zhao, Y.J.; Zhang, S.B.; Yang, H.Z.; Xiao, D.C.; Tian, C.Y. Mechanism and experiment of substituting high drainage roadway with directional long drilling group to extract pressure-relief gas. J. Cent. South Univ. 2012, 19, 2591–2597. [Google Scholar] [CrossRef]
  7. Chu, T.X. Research on the coupling effects between stereo gas drainage and coal spontaneous combustion. In Proceedings of the 1st International Symposium on Mine Safety Science and Engineering (ISMSSE), Beijing, China, 21–23 September 2011; pp. 218–227. [Google Scholar] [CrossRef] [Green Version]
  8. Chu, T.X.; Li, P.; Chen, Y.X. Risk assessment of gas control and spontaneous combustion of coal under gas drainage of an upper tunnel. Int. J. Min. Sci. Technol. 2019, 29, 491–498. [Google Scholar] [CrossRef]
  9. Wang, L.; Cheng, Y.P.; Li, F.R.; Wang, H.F.; Liu, H.B. Fracture evolution and pressure relief gas drainage from distant protected coal seams under an extremely thick key stratum. J. China Univ. Min. Technol. 2008, 18, 182–186. (In Chinese) [Google Scholar] [CrossRef]
  10. Liu, H.Y.; Cheng, Y.P.; Zhou, H.X.; Wang, H.F.; Chen, H.D. Fissure evolution and evaluation of pressure-relief gas drainage in the exploitation of super-remote protected seams. Min. Sci. Technol. 2010, 20, 178–182. [Google Scholar] [CrossRef]
  11. Guo, H.; Adhikary, D.P.; Craig, M.S. Simulation of mine water inflow and gas emission during longwall mining. Rock Mech. Rock Eng. 2009, 42, 25–51. [Google Scholar] [CrossRef]
  12. Li, S.G.; Xiao, P.; Pan, H.Y.; Lin, H.F.; Cheng, L.H. Experimental investigation on the seepage law of pressure-relieved gas under the influence of mining. Saf. Sci. 2012, 50, 614–617. [Google Scholar] [CrossRef]
  13. Shao, H.; Jiang, S.G.; Wang, L.Y.; Wu, Z.Y. Bulking factor of the strata overlying the gob and a three-dimensional numerical simulation of the air leakage flow field. Min. Sci. Technol. 2011, 21, 261–266. [Google Scholar] [CrossRef]
  14. Wu, J.J.; Liu, X.C. Risk assessment of underground coal fire development at regional scale. Int. J. Coal Geol. 2011, 86, 87–94. [Google Scholar] [CrossRef]
  15. Yu, Z.Y.; Yang, S.Q.; Qin, Y.; Hu, X.C.; Cheng, J.W. Experimental study on the gob flow field of the ‘‘U+I” type ventilation system for a comprehensive mechanized mining face. Min. Sci. Technol. 2015, 74, 603–622. [Google Scholar] [CrossRef]
  16. Zhang, C.; Jiao, D.; Zhang, M.; Huang, G. Study on multipoint and zoning coordinated prevention of gas and coal spontaneous combustion in highly gassy and spontaneous combustion-prone coal seam. ACS Omega 2022, 7, 17305–17329. [Google Scholar] [CrossRef] [PubMed]
  17. Guo, H.; Yuan, L.; Shen, B.; Qu, Q.D.; Xue, J. Mining-induced strata stress changes, fractures and gas flow dynamics in multi-seam longwall mining. Int. J. Rock Mech. Min. Sci. 2012, 54, 129–139. [Google Scholar] [CrossRef]
  18. Wang, D.; Zhang, P.; Zhang, Y.; Tu, S.; Wang, J.; Hao, Z. Distribution characteristic and migration mechanism of toxic gases in goafs during close-distance coal seam mining: A case study of shaping coal mine. ACS Omega 2022, 7, 7403–7413. [Google Scholar] [CrossRef]
  19. Guo, H.; Todhunter, C.; Qu, Q.; Qin, Z.Y. Longwall horizontal gas drainage through goaf pressure control. Int. J. Coal Geol. 2015, 150–151, 276–286. [Google Scholar] [CrossRef]
  20. Qin, C.; Huang, Q.; Wang, S.; Li, J.; Ju, S.; Wang, G. Prevention and control of spontaneous combustion of residual coals in acid-soaked goaf in gas drainage condition. Adv. Civ. Eng. 2022, 1668952. [Google Scholar] [CrossRef]
  21. Chen, L.; Qi, X.; Li, Y.; Xin, H.; Liang, Z. Coupling relation between the location of cross-cut negative pressure and injecting nitrogen into coal mine goaf. ACS Omega 2021, 6, 8189–8198. [Google Scholar] [CrossRef] [PubMed]
  22. Zhang, M.H.; Wu, S.Y.; Wang, Y.W. Research and application of drainage parameters for gas accumulation zone in overlying strata of gob area. Saf. Sci. 2012, 50, 778–782. [Google Scholar] [CrossRef]
  23. Hu, X.; Yang, S.; Zhou, X.; Yu, Z.; Hu, C. Coal spontaneous combustion prediction in gob using chaos analysis on gas indicators from upper tunnel. J. Nat. Gas Sci. Eng. 2015, 26, 461–469. [Google Scholar] [CrossRef]
  24. Tang, M.; Jiang, B.Y.; Zhang, R.Q.; Yin, Z.Q.; Dai, G.L. Numerical analysis on the influence of gas drainage on air leakage in the gob. J. Nat. Gas Sci. Eng. 2016, 33, 278–286. [Google Scholar] [CrossRef]
  25. Schatzel, S.J.; Karacan, C.Ö.; Dougherty, H.; Goodman, G.V. An analysis of reservoir conditions and responses in longwall panel overburden during mining and its effect on gob gas well performance. Eng. Geol. 2012, 127, 65–74. [Google Scholar] [CrossRef]
  26. Macdonald, M.J.; Chu, C.F.; Guilloit, P.P. A generalized Blake-Kozeny equation for multisized spherical particles. AlChE J. 1991, 37, 1583–1588. [Google Scholar] [CrossRef]
  27. Luo, H.; Quintard, M.; Debenest, G.; Laouafa, F. Properties of a diffuse interface model based on a porous medium theory for solid-liquid dissolution problems. Comput. Geosci. 2012, 16, 913–932. [Google Scholar] [CrossRef]
  28. Byon, C.; Kim, S.J. The effect of the particle size distribution and packing structure on the permeability of sintered porous wicks. Int. J. Heat Mass Transf. 2013, 61, 499–504. [Google Scholar] [CrossRef]
  29. Xia, T.Q.; Zhou, F.B.; Wang, X.X.; Zhang, Y.F.; Li, Y.M.; Kang, J.H.; Liu, J.S. Controlling factors of symbiotic disaster between coal gas and spontaneous combustion in longwall mining gobs. Fuel 2016, 182, 886–96. [Google Scholar] [CrossRef]
  30. Guo, G.L.; Miu, X.X.; Zhang, Z.N. Study of old goaf rupture rock deformation properties. Sci. Technol. Eng. 2002, 2, 44–47. (In Chinese) [Google Scholar] [CrossRef]
Figure 1. Locations of San Menxia city (a) and the Yima coalfield (b). Stratigraphic sections of the Gengcun mine (c) and the 2–3 coal seam (d).
Sustainability 14 08614 g001
Figure 2. The layout of the 13,190 working face.
Sustainability 14 08614 g002
Figure 3. Physical model of FLAC3D.
Sustainability 14 08614 g003
Figure 4. The deformation of the upper tunnel under different advancing distances of the working face. (a): Advanced 60 m. (b): Advanced 80 m. (c): Advanced 120 m. (d): Advanced 150 m.
Sustainability 14 08614 g004
Figure 5. The closure degree of the upper tunnel when the working face advanced 150 m. (a): Behind working face, 3 m. (b): Behind working face, 6 m. (c): Behind working face, 9 m. (d): Behind working face, 12 m. (e): Behind working face, 15 m. (f): Behind working face, 18 m.
Sustainability 14 08614 g005
Figure 6. Caving height under different advancing distances. (a) The first weighting. (b) After the first weighting.
Sustainability 14 08614 g006
Figure 7. The curves of the hydraulic support resistance and advancing distance were measured. (a) The first weighting. (b) Periodic weighting.
Sustainability 14 08614 g007
Figure 8. Seepage settings of the CFD model. (a) Bulking factor Kp. (b) Porosity n. (c) Permeability k.
Sustainability 14 08614 g008
Figure 9. The physical FLUENT model.
Sustainability 14 08614 g009
Figure 10. Air leakage flow field under gas drainage of the upper tunnel. (a) Air leakage schematic diagram. (b) Oxygen volume fraction. (c) Gas volume fraction.
Sustainability 14 08614 g010
Figure 11. The oxygen volume fraction of the upper tunnel. (a): 120 m3/min. (b): 180 m3/min. (c): 240 m3/min. (d): 300 m3/min.
Sustainability 14 08614 g011
Figure 12. The field data of the 13,190 working face. (a) Oxygen volume fraction in the gob. (b) Gas and oxygen volume fraction of the upper tunnel.
Sustainability 14 08614 g012
Figure 13. Comparison of coupling prevention results with different drainage volumes. (a) CH4 of return airway at 120 m3/min. (b) Oxidation zone at 120 m3/min. (c) CH4 of return airway at 180 m3/min. (d) Oxidation zone at 180 m3/min. (e) CH4 of return airway at 240 m3/min. (f) Oxidation zone at 240 m3/min.
Sustainability 14 08614 g013
Table 1. Physical and mechanical parameters of the joint surface.
StrataThickness/mDensity/kg/m3Bulk Modulus/GPaShear Modulus/GPaInternal Friction Angle/(°)Cohesion/MPaTensile Strength/MPa
Sandy mudstone47.5123506.3043.425324.20.50
Muddy intercalations3.5418505.0932.083263.00.28
Mudstone24.2019505.5192.519283.50.35
Muddy intercalations4.1218505.0932.083263.00.28
Fine grain sandstone25.3226007.9635.244365.51.00
Sandy mudstone14.5023506.3043.425324.20.50
Coal15.6217004.5291.742252.50.20
Mudstone5.7519505.5192.519283.50.35
Sandy mudstone10.5723506.3043.425324.20.50
Medium grain sandstone21.2527009.2266.352397.61.20
Siltstone18.6225007.0214.256344.90.80
Table 2. Boundary and source settings.
TypeIntake Airway (a)Return Airway (c)Upper Tunnel (b)
Boundary ConditionVelocity-inletOut-flowOut-flow
1.64 m/sDefault0.75 m/s
Source itemGob gas emissionNitrogen injection
23.5 m3/min50 m3/min
Interior wallWorking face Sustainability 14 08614 i001 gob, gob Sustainability 14 08614 i001 upper tunnel
Table 3. Establishment of a suitable gas drainage volume.
EvaluationMeets the Gas Emission Control?Exceeds the Max Acceptable Oxidation Zone Width?Suitable or Not?
Drainage Volume
120 m3/minNOYESNO
180 m3/minYESYESYES
240 m3/minNONONO
Publisher’s Note: MDPI stays neutral with regard to jurisdictional claims in published maps and institutional affiliations.