Article

Exploring the Climatic Potential of Somo’s Surf Spot for Tourist Destination Management

by
Anna Boqué Ciurana
1,*,
Melisa Ménendez
2,
María Suárez Bilbao
2 and
Enric Aguilar
1
1
Centre for Climate Change, C3, Geography Department, Universitat Rovira i Virgili, Vila-seca, 43480 Tarragona, Spain
2
Environmental Hydraulics Institute (IHCantabria), Universidad de Cantabria, 39005 Santander, Spain
*
Author to whom correspondence should be addressed.
Sustainability 2022, 14(14), 8496; https://doi.org/10.3390/su14148496
Submission received: 18 May 2022 / Revised: 5 July 2022 / Accepted: 8 July 2022 / Published: 11 July 2022

Abstract

:
Surfing is one of the most popular activities in coastal tourism resorts. However, the sport depends strongly on the met-ocean weather conditions, particularly on the surface wind-generated waves that reach the coast. This study provides examples of how users’ needs and user perspectives are considered by climate data specialists to develop needed, highly useful information addressing human and social needs. In this vein, the climate analysis of such data can provide input on the expected length of a surfing season, according to the surfer’s level of expertise. In addition, other water sports, such as SUP Wave and windsurfing, among others, might be indicated when surfing conditions are not optimal. Finally, the safety of surfers and other tourists who venture into the sea is also dependent on those conditions. We collaborated with the surfing community to define a series of indices for quantifying surfing days (SD), surfing days stratified by surfers’ skills (SDS), alternate offers (AOs), and surfers’ and swimmers’ safety (SuS and SwS). These are of general applications but require wind and wave data at a very fine scale as the input. To illustrate the potential of our indices, we applied them to the Somo beach (Cantabria, Spain). We downscaled a global wave hindcast dataset covering a 30-year period to a spatial resolution of 100 m to obtain wave-surfing information at Somo’s surf spot. The results confirmed Somo’s status as a year-round surf spot, with SD values of 229.5 days/year and monthly values between 22 days/month and 16 days/month. SDS showed different seasonal peaks according to the surfers’ skills. Beginners’ conditions occurred more often in the summer (18.1 days/month in July), intermediate surfers’ conditions appeared in the transitional seasons (14.1 days/month in April), and advanced and big-wave riders in the winter (15.1 days/month in January and 0.7 days/month, respectively). The AO index identified the SUP wave values of 216 days/year. Wind water sports presented values of 141.6 days/year; conversely, SUP sports were possible on only 7.4 days/year. SuS and SwS identified different seasonal hazard values, decreasing from the winter, autumn, and spring to minimum values in the summer.

1. Introduction

Climate services are defined as the provision of climate information to help individuals and organizations make climate-resilient decisions. The World Climate Conference-3 (WCC-3), organized in 2009 by the World Meteorological Organization, established the Global Framework for Climate Services (GFCS) [1]. Climate data and information are transformed into customized products to provide decision makers in climate-sensitive sectors with better information to adapt to climate variability and change [2]. The goal of climate services is to provide access to scientific knowledge and, thereby, to reduce vulnerability and create opportunities to promote innovation, business opportunities, and employment, highlighting the importance of involving users in developing climate services [3]. Research has revealed [4] that peer-reviewed literature on the availability and use of climate services in the operations and management of tourism is scarce, and that a need exists for a new generation of specialized climate information products that can enhance climate risk management amongst tourism suppliers. Adaptation to climate change is becoming more urgent, but the wealth of knowledge that informs adaptation planning and decision making is currently not being used to its full potential [5]. In this context, climate services can provide valuable information that can help society enhance resilience, survival, and even prosperity in the face of climate risk [6].
Climate assessment for recreation and tourism have increasingly become dynamic research topics, especially in the age of the anthropogenic climate crisis [7]. Coastal destinations can offer different tourist activities in the same territory and all of them are influenced by meteo-climatic conditions to a specific degree [8]. We assert that there is a need to explore the climatic viability of different activities. By doing so, the development of climate services with tailored climate information about particular destinations can shed light on system changes.
The results of this research, specifically all the information generated with the indicators, imply an improved capacity for destination managers to promote particular destinations. This can lead to a destination being promoted in a more resilient way, not only by knowing which season is better for a specific level of surfing but also by knowing the viability of offering complementary activities. Thus, destination managers can plan tourist offers better and can be prepared to adapt activities when surfing is not possible. This will lead to investing in resources, from hiring staff to planning surfing championships, that will be planned more efficiently and sustainably. Definitively, using this information will enable destination managers to apply informed climate-resilient actions in their sector.
The present research bridges the gap between users and producers of climate information in line with our previous study, in which surfers and surf companies identified which meteorological and climatological information they need access to for better surfing experiences [9]. The new contacts that were gained through the survey conducted in the previous study helped the researchers of this study refine its focus.
Climate index application and validation for tourism is a complicated topic and presents several challenges [10,11,12]. In this context, the significance of this study is the need to transform meteo-oceanic data into information that can assist decision making in coastal destinations that need sustainable development. As coastal tourist destinations can offer different activities, we focus on surfing, one of the water activities that is offered at several destinations. Following the scientific literature, we have identified a gap in this specific activity and a need to develop a climate service that addresses it. Therefore, this research aims to contribute to the development of a specific climate service for surfing by considering specific users’ needs and also by developing high-resolution meteo-oceanic data. The paper’s primary objective is to present a set of climate indices for surfing destinations, taking as its experimental area the well-known Spanish surf spot of Somo (see the next section for details). With our analyses, we achieve two secondary objectives: (1) to obtain a downscaled dataset of wave data and (2) to describe with climate data the surfing potential of Somo’s surf spot. As our results will specifically define the surfing potential of the spot, this information will assist surfing destination managers in promoting climate-resilient pathways for sustainable development in surfing tourism. In this regard, we intend to contribute modestly to the achievement of the various UN 2030 Agenda Sustainable Development Goals (SDGs), namely (3) good health and well-being, (8) decent work and economic growth, (12) responsible consumption and production, (13) climate action, (14) life below water, and (15) life on land.

2. Literature Review

Several authors have defended the idea [13] that climate change communication and user engagement can work as a tool to anticipate climate change. The visual communication of climate information is one of the cornerstones of climate services; thereby, the characteristics that make a climate service self-explanatory rely on the type of representation used. In this context, guidance on the climate information published by official bodies should adopt a consistent approach, with a clear narrative that describes the transition from science to guidance [14]. The form in which climate services information is needed for the required end-user decisions requires careful thought, including appropriate communication of the associated uncertainties using best practices and experiences from related sectors [15].
Numerous authors have discussed the importance of climate [16], weather [17,18,19,20,21], and extreme weather [22,23,24] in the establishment and choice of tourism destinations. Outdoor recreation is strongly and increasingly affected by climate change and its impacts present marked seasonal and geographical variations that determine its viability [25]. In the past, the Tourism Climate Index (TCI) [26,27] has been used in suitability analyses. Several studies calculated this index to determine the climatic comfort conditions for tourism in different areas [28,29]. Specific research has focused on exploring the state of weather and climate information for tourism and explored sustainable tourism and the grand challenge of climate change [30,31]. Regarding the idea of the TCI, other studies have developed the Holiday Climate Index (HCI) [13,14] and computed it, in a reshaped formulation, for beach and urban destinations with climate data downscaled dynamically [31]. Other studies [8] have proposed the co-creation of specific indices for each specific activity/destination. One such study described indices for beach and snow tourism [32], while others developed indices for skiing [33,34], and still others have focused on surfing [35]. Sports tourism, based either on attending a sports event or on practicing the sport, has experienced considerable growth in the last several decades. Surfing as a tourist activity has traditionally been labeled as sports tourism [36] or nautical, maritime, or marine tourism [37]. Most recently, researchers defined it as ‘blue tourism’, a concept intimately related to the blue economy and the blue growth strategy [38]. Blue tourism highlights the sea as the central resource for leisure and recreation activities and leisure and tourism industries [39,40].
Surf and surfing tourism affect the environment and depend on its preservation and there is a concern regarding not only the quality of the activity but also its sustainability. New research has ranked Cape Town beaches in terms of sustainability by using surf-tourism-related indicators [41]. Similarly, other authors have used the Driving Forces-Pressures-State-Impacts-Responses (DPSIR) framework to propose indicators to measure human activities affecting surf breaks [42]. Similarly, it has been affirmed that surf breaks are finite, valuable, and vulnerable natural resources that not only influence community and cultural identities but are also a source of revenue and provide a range of health benefits [43]. Despite this, surf breaks lack recognition as coastal resources and, therefore, the associated management measures required to maintain them. It has also been recognized that conserving biodiversity and ecosystem services requires diverse models that empower communities to act steward of such resources and also to benefit from them. They investigate the potential of surfing resources and the consciousness of surfing communities as beacons of environmental and marine biodiversity preservation. In fact, the sustainable management of these resources ensures their ability to provide for the character, economy, and development of coastal communities worldwide [44]. Valencia et al. [45] studied how surfing tourism’s effects are perceived by local residents; the results of their research have implications for surf tourism management at the destination.
Fox et al. [46] focused their research on recreational ocean users, specifically surfers, and how their blue space activities may inform the understanding of ocean processes and human–ocean interconnections. They presented novel insights about the opportunities for integrating ocean sustainability strategies through blue space activity mechanisms and coastal community engagement. They defined the surfing social-ecological system adapted from McGinnis et al. [47] and demonstrated how the human (social) and ocean (ecological) systems provide opportunities for interactions between surfers (users) and waves (resource units), producing ocean literacy understanding and awareness.
Another aspect that has an impact on the perception and development of surf is the safety of the practitioners. Mindes [48] analyzed hazards perceptions among surfers in Southern California. Rip currents are a primary mechanism associated with dangerous situations [49] and have been the focus of beachgoer education and awareness strategies [50]. Surfers and lifeguards often utilize rip currents to expedite their journey across the surf zone [51]. Attard et al. [52] found that 63% of surfers believe they have saved a swimmer’s life. The enjoyability and safety of the surfing experience are enhanced when the right information is communicated in the right way. Boqué et al. [9] surveyed surfers in Spain to explore which meteorological and climatological information they find necessary for a better surfing experience.
De Andrés et al. [53], who studied surfers’ balance during surfing activity between competitive surfers and non-competitive surfers in Somo, in collaboration with Escuela Cantabra de Surf and Somo Surf Center, defended that surfing in training and competition is characterized by a great variability of environmental factors such as different sizes and breaking shapes of the waves and changing weather conditions. Nevertheless, there are limitations and possibilities for the world surfing reserves [54] that can be assessed by surfing climatology and surfing forecasts [9].

3. Study Area, Data and Methods

3.1. Study Area

The pilot area of the Somo surf spot is part of the municipality of Ribamontán al Mar Municipality. Ribamontán al Mar is located on the northern shore of the Iberian Peninsula in the Cantabria region (Figure 1) close to its capital of Santander. It hosts Spain’s first surfing school, established in 1991. Ribamontán al Mar (declared in 2012 as a World Surfing Reserve, the first in Spain and the second in Europe) is a pioneering territory in its commitment to surfing tourism through its Surfing Competitiveness Plan (2009–2014) and in promoting territorial balance through the competitiveness of destinations, international projection, specialization of tourism products, and deseasonalization [54].
The area is characterized by an oceanic climate, specifically Cfb, in the Köpen Climate Classification [55]. The Cfb type is defined as being temperate mesothermal, without a dry season, and with a mild summer. Using monthly values, the annual thermometric regime is regular, with the highest average values in August and the lowest in January. Precipitation is significant even in the drier months [56]. Wind variations are present throughout the year. Northwest and southeast winds dominate in the winter. In the spring, northerly winds usually blow and then shift to a northeasterly direction in the summer. High-intensity winds are more frequent in the winter and at the end of autumn [57].

3.2. Data and Methods

Data for our analysis were obtained after applying the high resolution downscaled ocean waves (DOW) approach [58,59] to the global ocean waves hindcast [60] data. This hindcast is a historical hourly wave reconstruction generated with the WAVEWATCH III model [61], using the atmospheric forcing from the Climate Forecast System Reanalysis (CFSR) global reanalysis from 1979 to 2010 [62] and extended to the present by CFSv2 [63] with a ~0.2° resolution. GOW2 has global coverage with a spatial resolution of 0.5° × 0.5° and a resolution of 0.25° × 0.25° in zones near the coast. The DOW approach is a global framework to downscale waves to coastal areas, which takes into account a correction of open sea significant wave height (directional calibration). The approach combines numerical models (dynamical downscaling) and mathematical tools (statistical downscaling). First, a regional hindcast is numerically simulated with the Simulating Waves Nearshore (SWAN) model using high-resolution winds from the Cantabrian domain of downscaling winds (a 3 km historical reconstruction from global CFSR reanalysis) and the GOW2 spectral data as the boundary conditions.
Then, the DOW Cantabria database is used, which is based on regional waves as initial conditions for waves in the contours of high-resolution numerical domains, at ~100 m resolution.
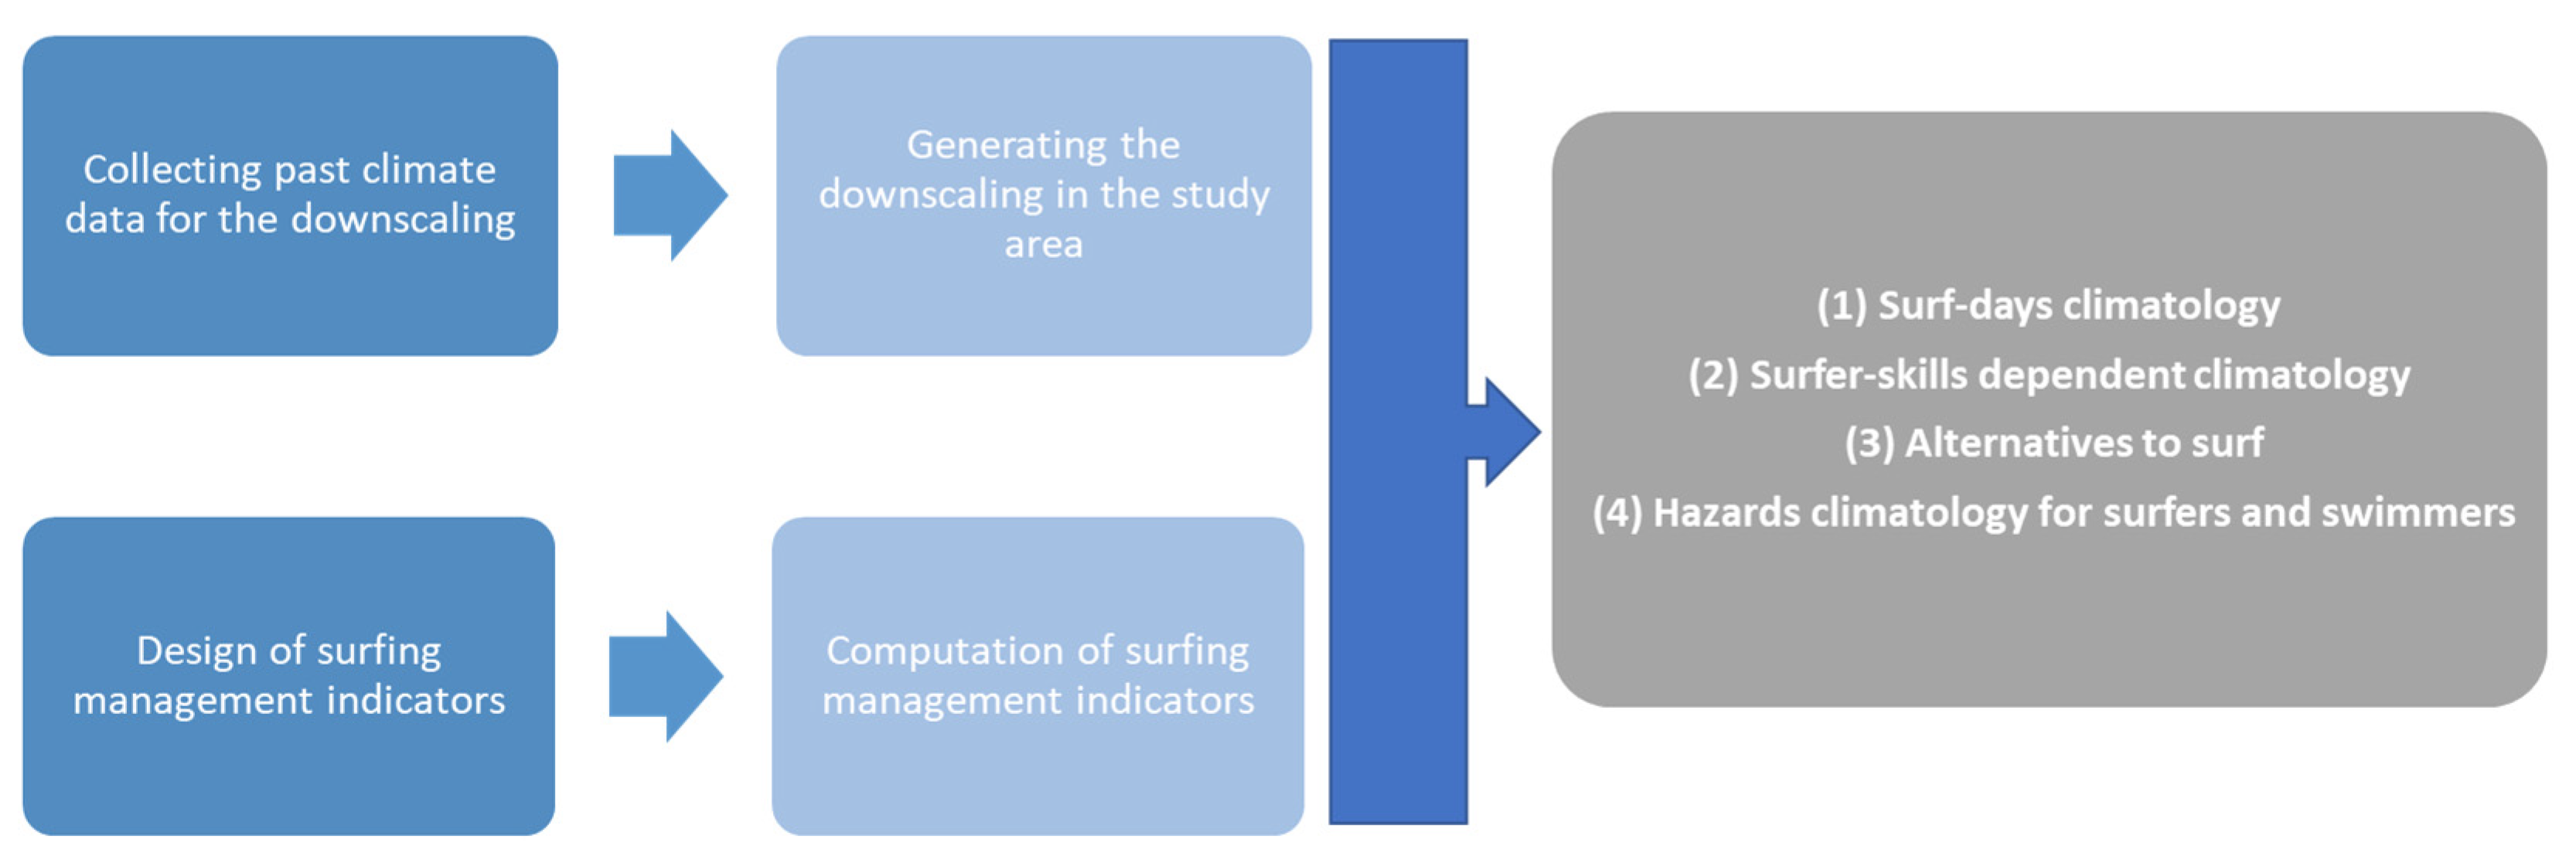
Our methodological approach (Figure 2) used significant wave height (Hm0), peak period (Tp), wind speed (Ws), and wind direction (Wd) downscaled climate data from DOW in the Somo surf spot in the definition of a climate service for the management of surfing destinations. In addition, using Hm0 and Tp as input from DOW, we computed the wave energy flux (We) with the following formula [64]:
W e = H m 0 2 T p W e = w a v e   e n e r g y   f l u x H m 0 = significant wave height T p = p e a k   w a v e   p e r i o d
We designed the surfing management indicators by combining the variables previously described and constraining hourly data to daylight time (obtained through the R package suncalc, https://cran.r-project.org/web/packages/suncalc/suncalc.pdf) when surfing activity was concentrated. We obtained (1) a daily surf climatology, (2) a surfer-skill climate indicator, (3) an index for alternatives to surfing, and (4) a hazard climate indicator for surfers and swimmers.
Surfing climatology yields the number of expected surfing days per year, i.e., days when, following Espejo et al. [65] and Boqué et al. [35], Hm0 ≥ 0.5, Tp ≥ 6, and Ws < 20. Days that do not meet these requirements are considered non-surfing times. For these periods, we described and indexed combining Hm0 and Ws to suggest to surfers and surf schools the best surf-related alternatives (e.g., other water sports), according to the state of the wind and the sea. We considered a surf-related activity to be any activity requiring the use of a board. We grouped them as (1) Stand Up Paddle Surf (SUP) activities, for which waves are not required, e.g., SUP yoga, SUP Pilates on board, or a water polo match using surfboards [66]; (2) SUP activities that require waves and are similar to surfing—called SUP Wave; and (3) sports such kitesurfing, in which wind speed is the key element [67]. These activities and their optimal values of Hm0 and Ws are shown in Table 1.
The second index (Table 2) categorizes the Hm0 values as different surf-skill levels (i.e., beginner, intermediate, advanced, or big wave rider). The values of the different intervals are an adaptation of Hutt et al. [68], who defined the maximum and minimum values of wave height according to the surfers’ skills. We also combined these values for the peak period following the thresholds suggested by Espejo et al. [65].
To compute these two monthly indices from hourly observations, we used our own formula as follows:
I m = (   o b s c r m )   o b s m n m  
where I m (Equation (2)) corresponds to the monthly indicator for a specific month and expresses the number of complete days that meet a set of given conditions, regardless of how they are distributed within the month; o b s c r m is the number of hourly observations that meet the required conditions; o b s m is the total number of observations per month; and n m is the number of days in that month (e.g., 31 in January, 28/29 in February, etc.).
For the hazard indicator, we followed Attard et al. [52], who demonstrated that surfers do well in locations that can be hazardous to swimmers. In line with Attard’s approach [52], we used Hm0, Ws, Wd, and We, according to formula II. Following Koon et al. [69], Mazzone [70], Whitcomb [71], and Miloshis et al. [72], we computed hazard scores for intermediate surfers, the third general degree established by the surfing Spanish federation framework, and intermediate swimmers, according to the classification of the Real Federación Española de Natación achieving the level fry 2. As swimmers’ and surfers’ interactions with the ocean are intrinsically different, we defined specific cut-off points for each, as reflected in Table 3, and attribute values from 0 to 4 to each condition to create a composite index that can take values between 0 and 10. Maximum values (10) relate to hazardous conditions; minimum values (0) relate to conditions without hazards.
We obtained each daily hazard indicator by selecting the maximum hourly value of the hazard score per day. These values were packaged (1) in the form of calendars and in graphical time series where maximum monthly values are shown, as we will present in Section 4.
For SD, SDS, and AO, we represent the monthly values as boxplots, and we also show the annual values in a graphical time series to observe the evolution for the 1985–2015 period. For all sets of indicators, the Mann–Kendall test was calculated to explore the trends. For SuS and SwS, we represent the annual mean of the monthly mean of the daily maximum value in the time series.

4. Results

4.1. Surf Climatologies

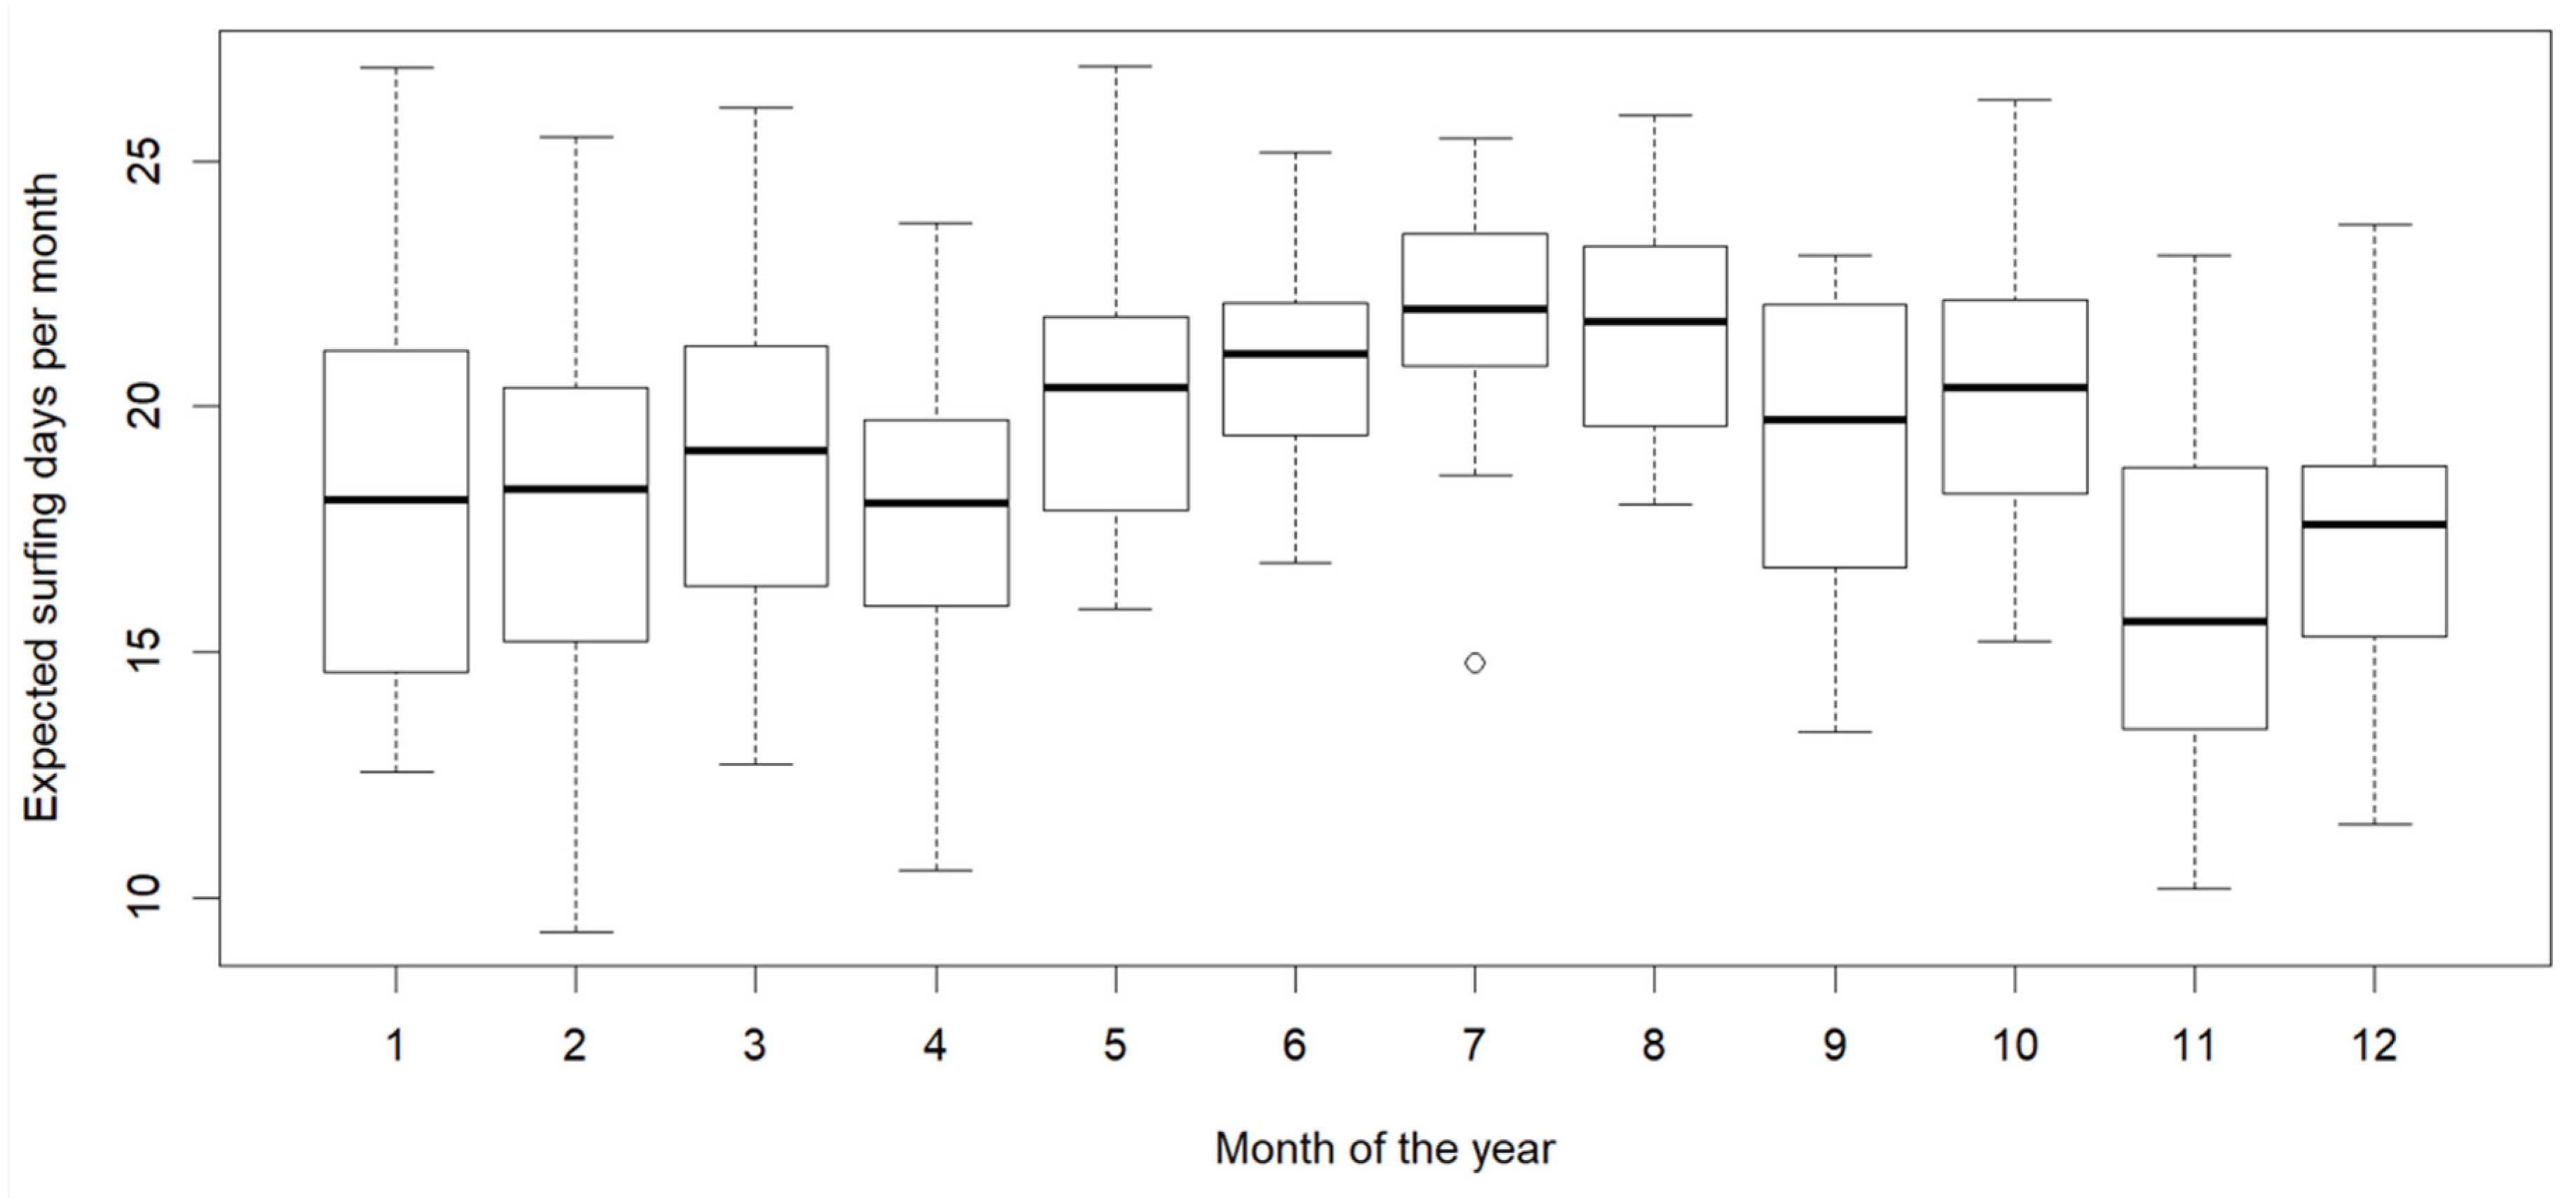
Figure 3 presents the monthly climatology of the expected surfing days computed from 1985–2015 at the Somo surf site. The annual number of expected surfing days was 229.5. The highest monthly value corresponded to July (22 days), followed by August (21.7 days/month) and June (21 days/month). Lower values corresponded to November (16.3 days/month), February (16.9 days/month), December (17.8 days/month), and April (17.9 days/month). The winter months (December, January, and February) showed larger interquartile ranges.
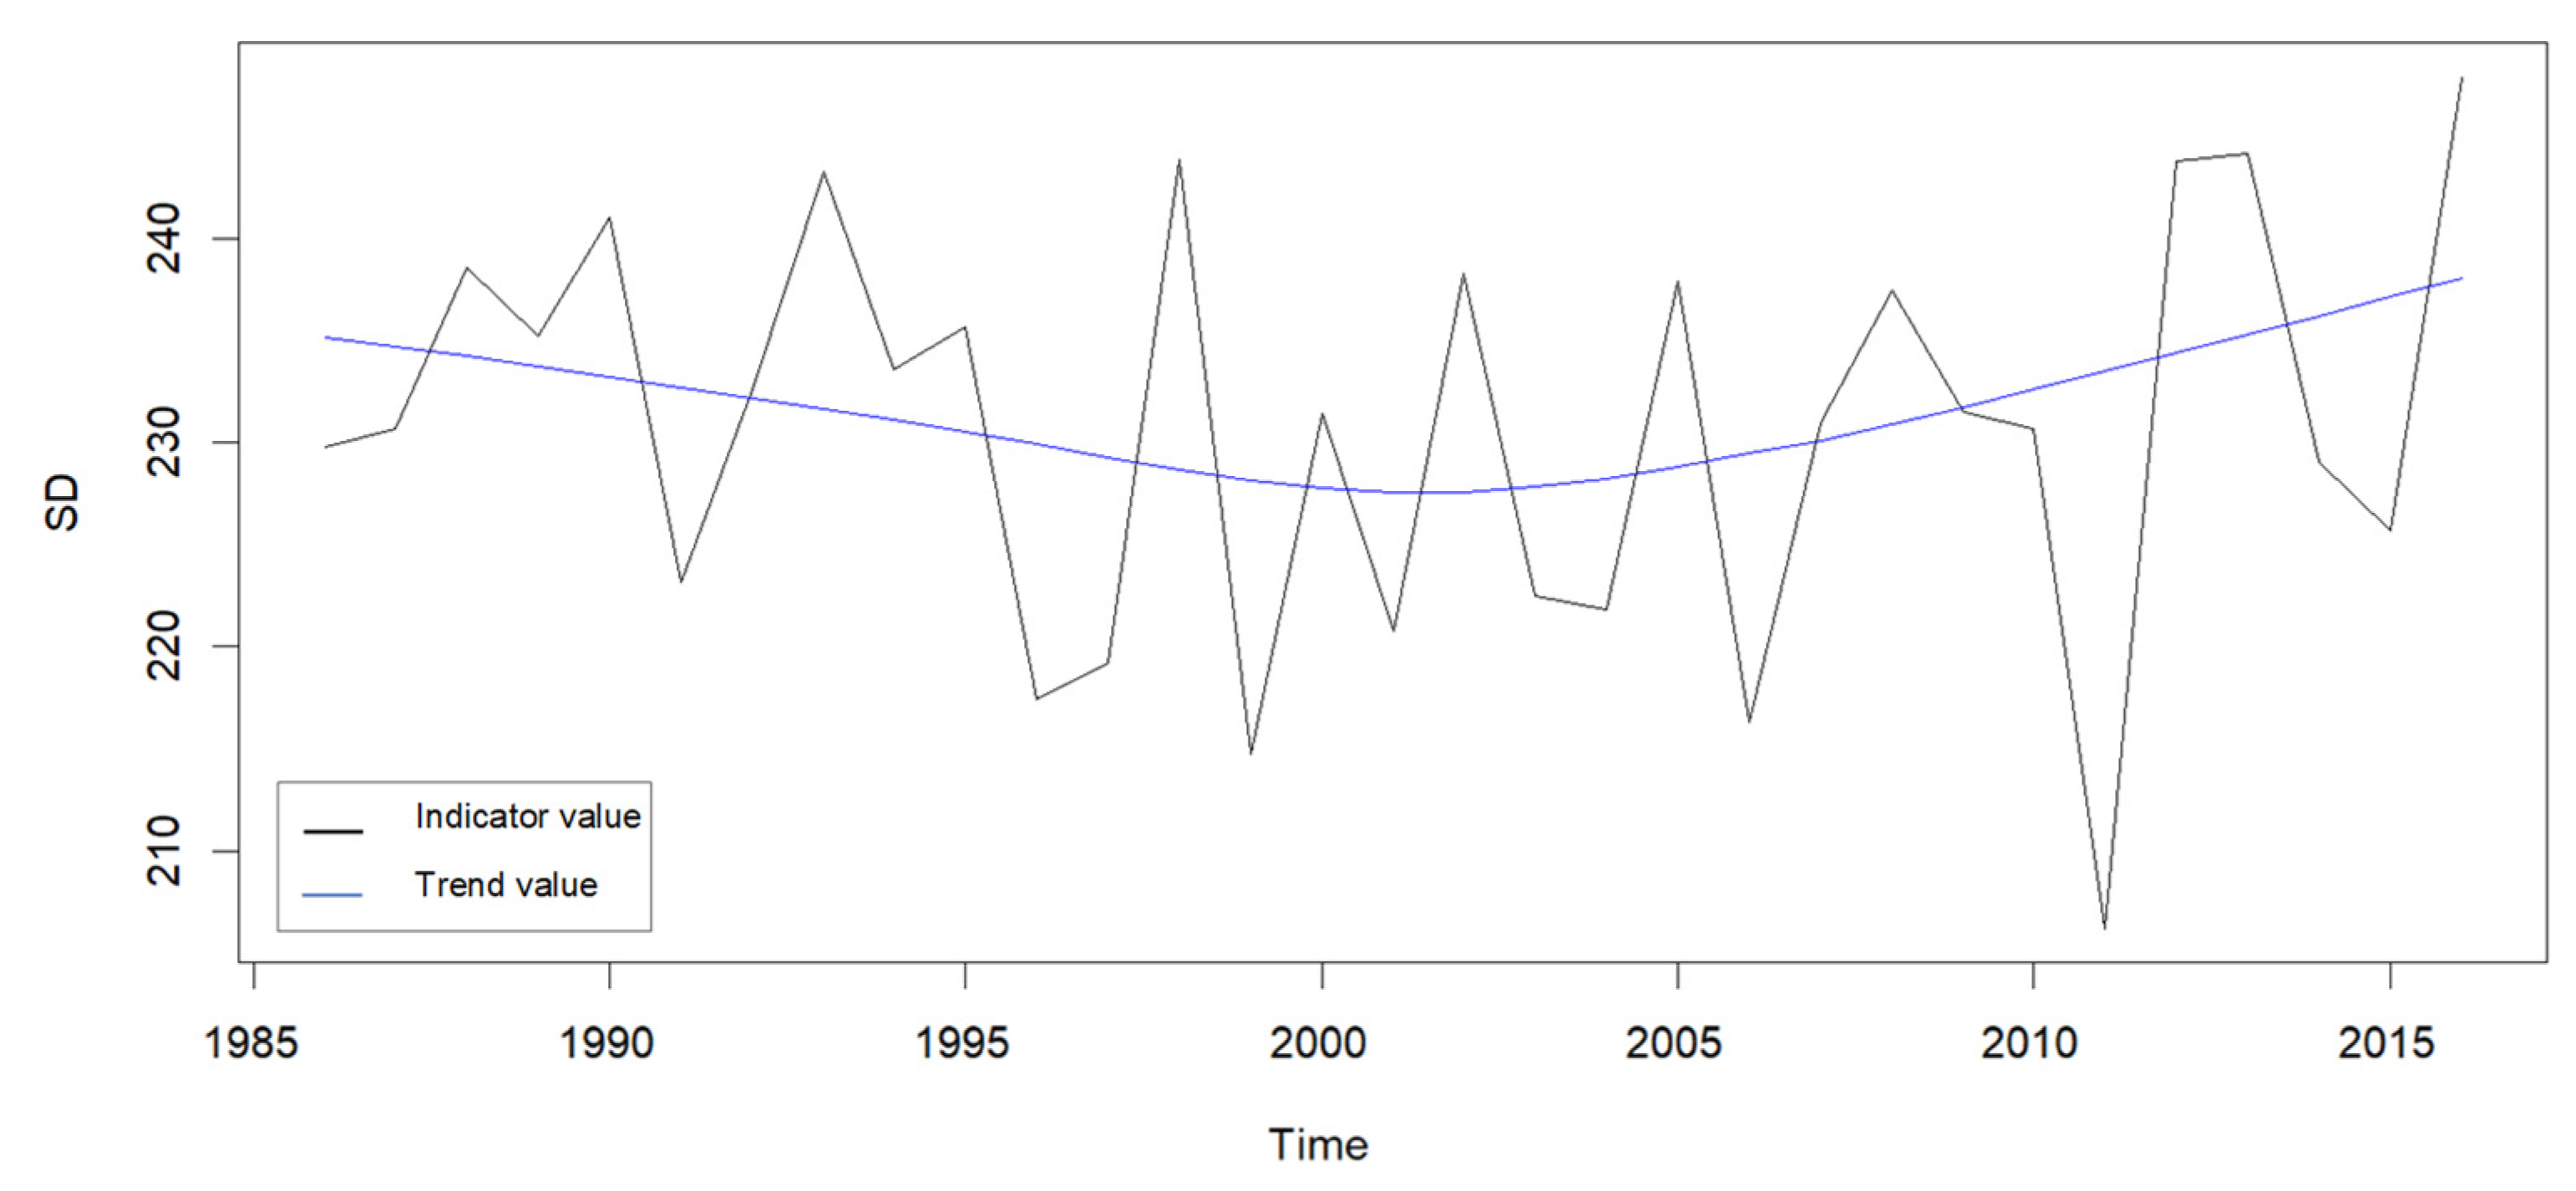
Figure 4 shows the evolution of the annual SD for the 1985–2015 period. The SD annual values ranged from 247.8 days (the year 2015) to 206.19 days (the year 2010). The plot shows the variation of the annual SD between the years; the standard deviation corresponded to 10.09 days.
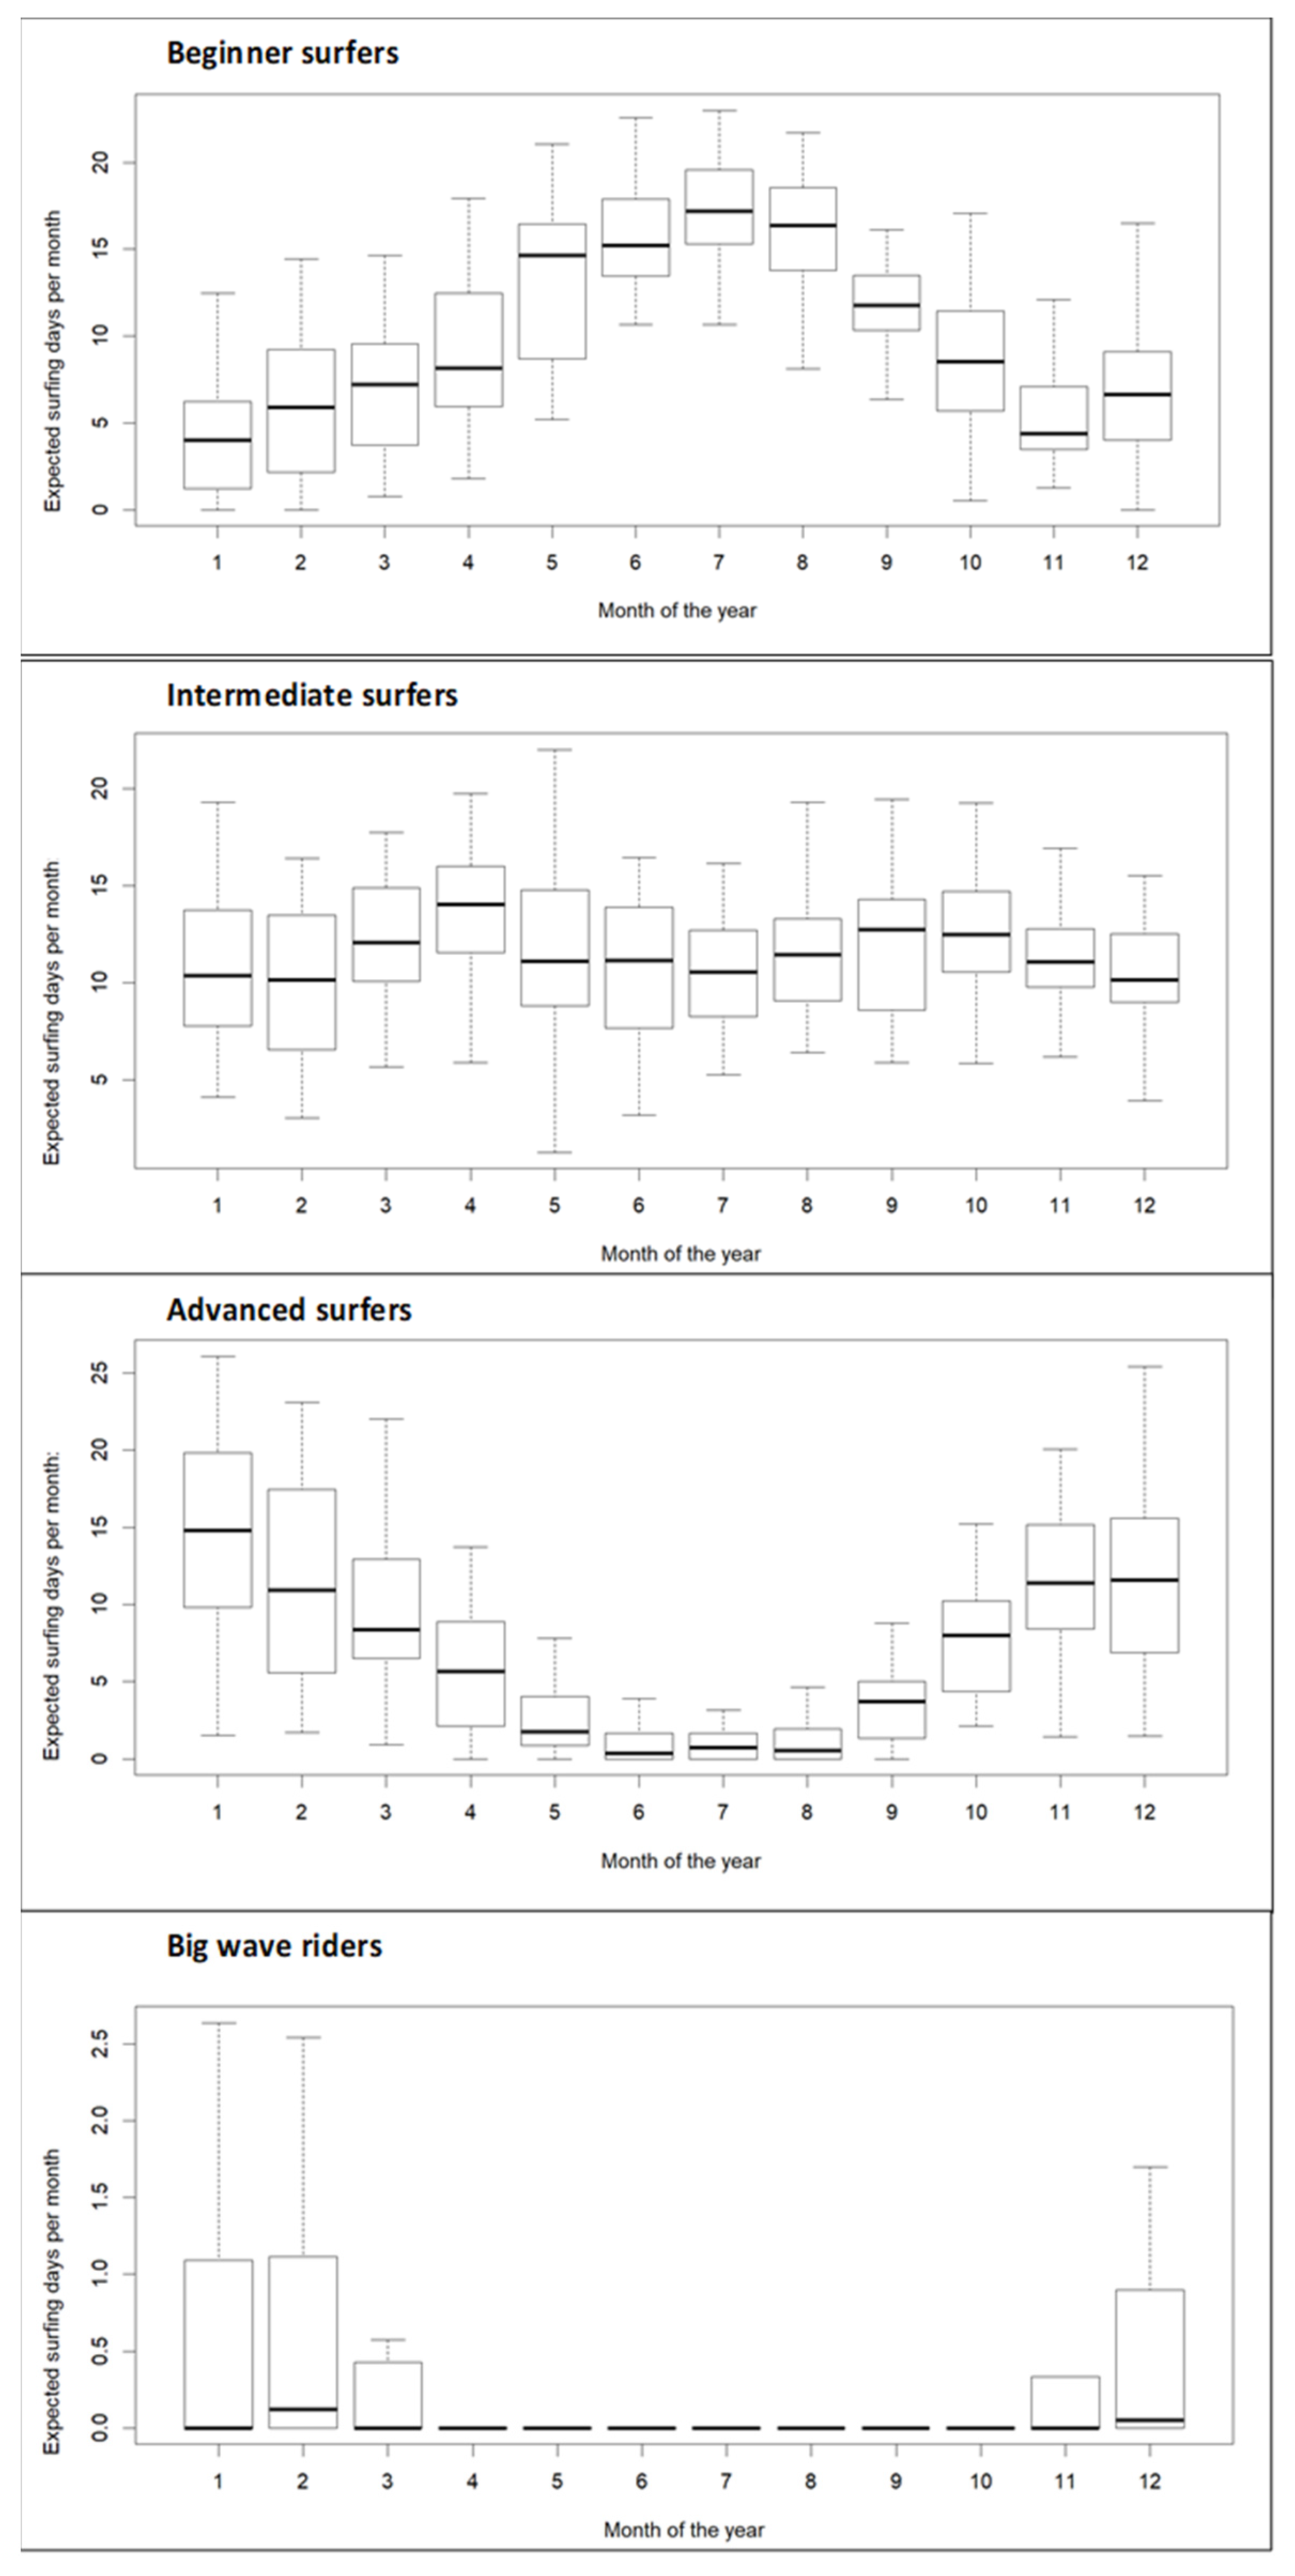
Figure 5 adds the consideration of the surfer’s skill level. Our results showed that, depending on the practitioner’s skills, the season shifted from summer to winter, opening the door to the deseasonalization of tourist resorts. In this regard, the peak number of the expected days for the beginners clustered again in the summer: June (17.3 days/month), July (18.19 days/month), and August (17.2 days/month). By contrast, intermediate surfers should expect to find a larger number of optimal days in the transition seasons, with peaks in April (14.4 days/month) and September (13.4 days/month). Finally, advanced surfers and big wave riders will find better conditions in the winter. For advanced surfers, the expected days peaked in January (15.1 days) and December (12.3 days/month). Big wave riders should expect <1 day/month, concentrated throughout the period of the November–April semester and peaking in January (0.7 days/month).
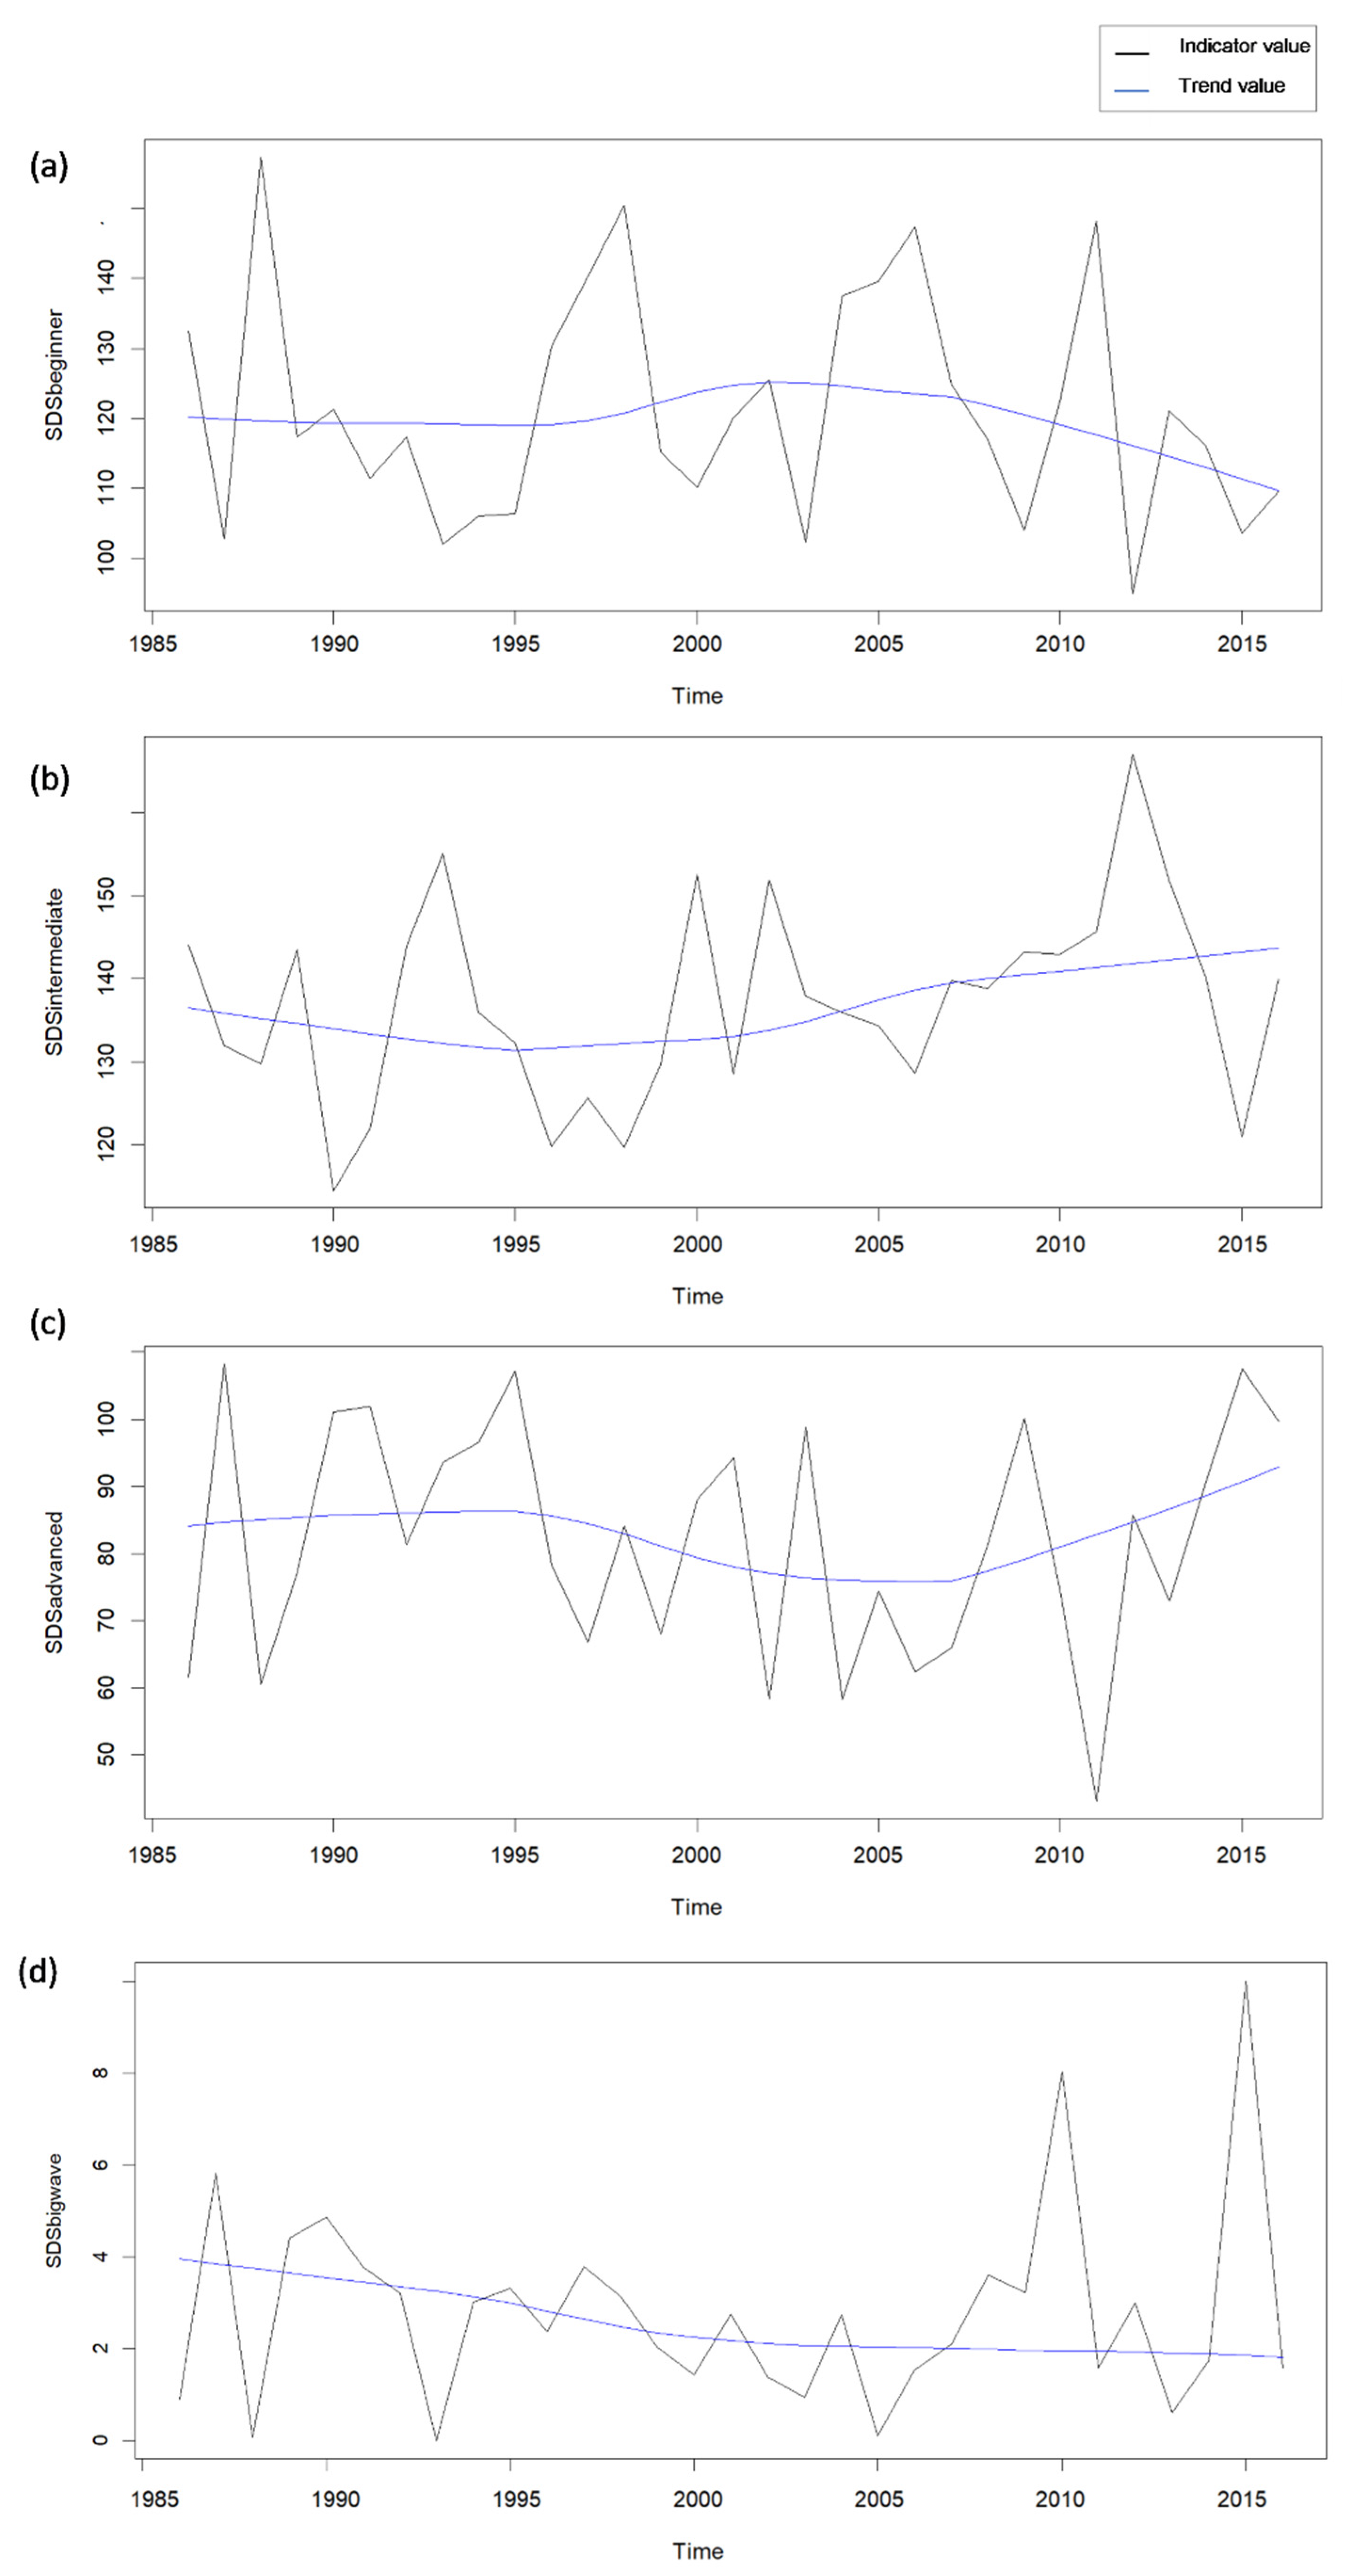
Figure 6a–d show the SDS annual evolution and trend for the 1985–2015 period. The maximum SDS were detected on surfing days for intermediate surfers at 167.02 days (in 2011), followed by beginners with 157.36 days (in 1985), 108.21 days (in 1986) for advanced surfers, and 10.02 days (in 2014) for big wave riders. The minimum SDS annual values were ranked from big wave riders with 0 days (in 1992), advanced surfers with 43.16 days (the year 2010), beginners with 94.94 days (the year 2011), and intermediates with 114.5 days (in 1989). The standard deviation ranged from 2.19 days (big wave riders) to 17.41 days for advanced surfers. The case for intermediates was 11.89 days and for beginners was 16.2 days.

4.2. Alternative Offer

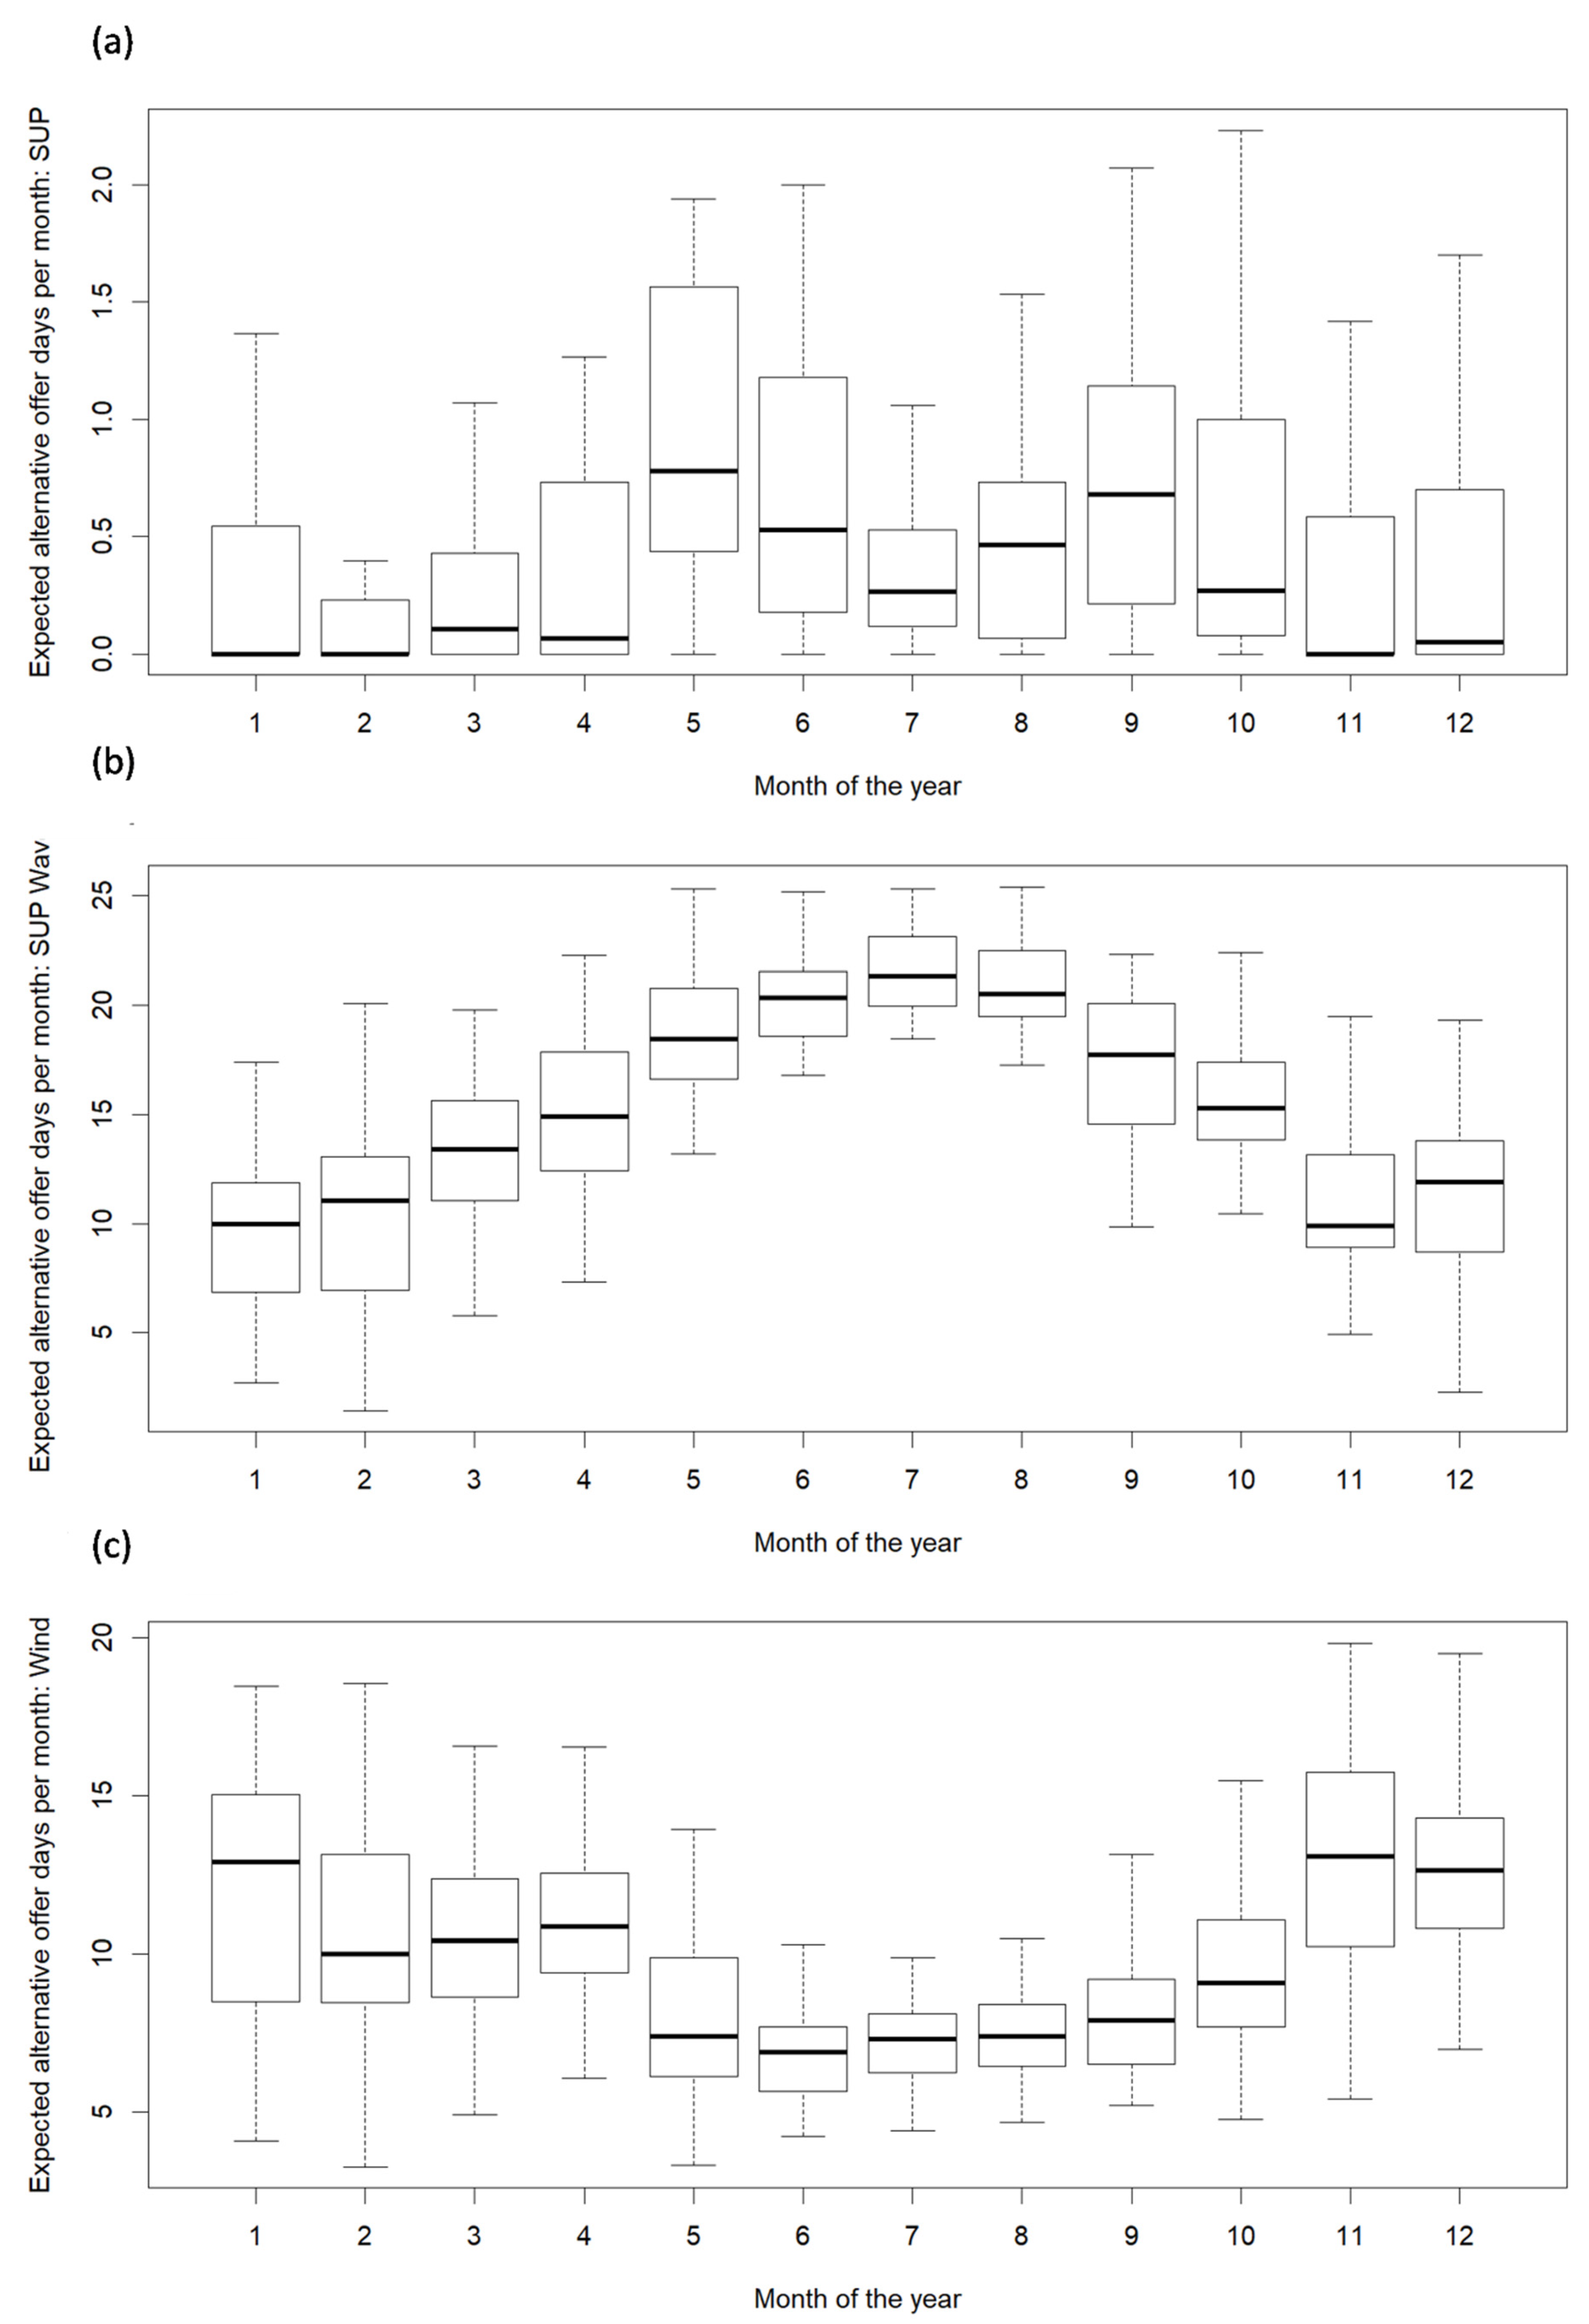
Days when environmental conditions do not favor surfing might still be suitable for alternative water sport activities (Figure 7a–c). From the series of activities considered in Section 3, in the case of the Somo surf spot, the surf activity offered most frequently was SUP Wave (216 days/year); specifically, July (22.7 days/month) had the largest number of expected days. Kitesurfing was the alternative surf activity offered second most frequently (141.6 days/year), and the spring and summer months presented the lowest values for expected kitesurfing days per year, linked with summer’s calm winds. SUP yoga (7.4 days/year) was the alternative that offered lower possibilities, which indicates that if the activity needs to be promoted, it should probably ubicate in rivers next to the main surf spot. SUP Wave and kitesurfing seemed to be complementary, as when there is so much wind to practice SUP Wave, there is enough wind to practice kitesurfing, wing, or windsurfing. The high values for these wind activities were present specifically in autumn and winter: November (15.8 days/month), December (16 days/month), and January (16.8 days/month). A good period for practicing SUP Wave is during the spring and summer, and at the beginning of autumn: May (21 days/month), June (22 days/month), July (22.7 days/month), August (22.4 days/month), and September (19.6 days/month).
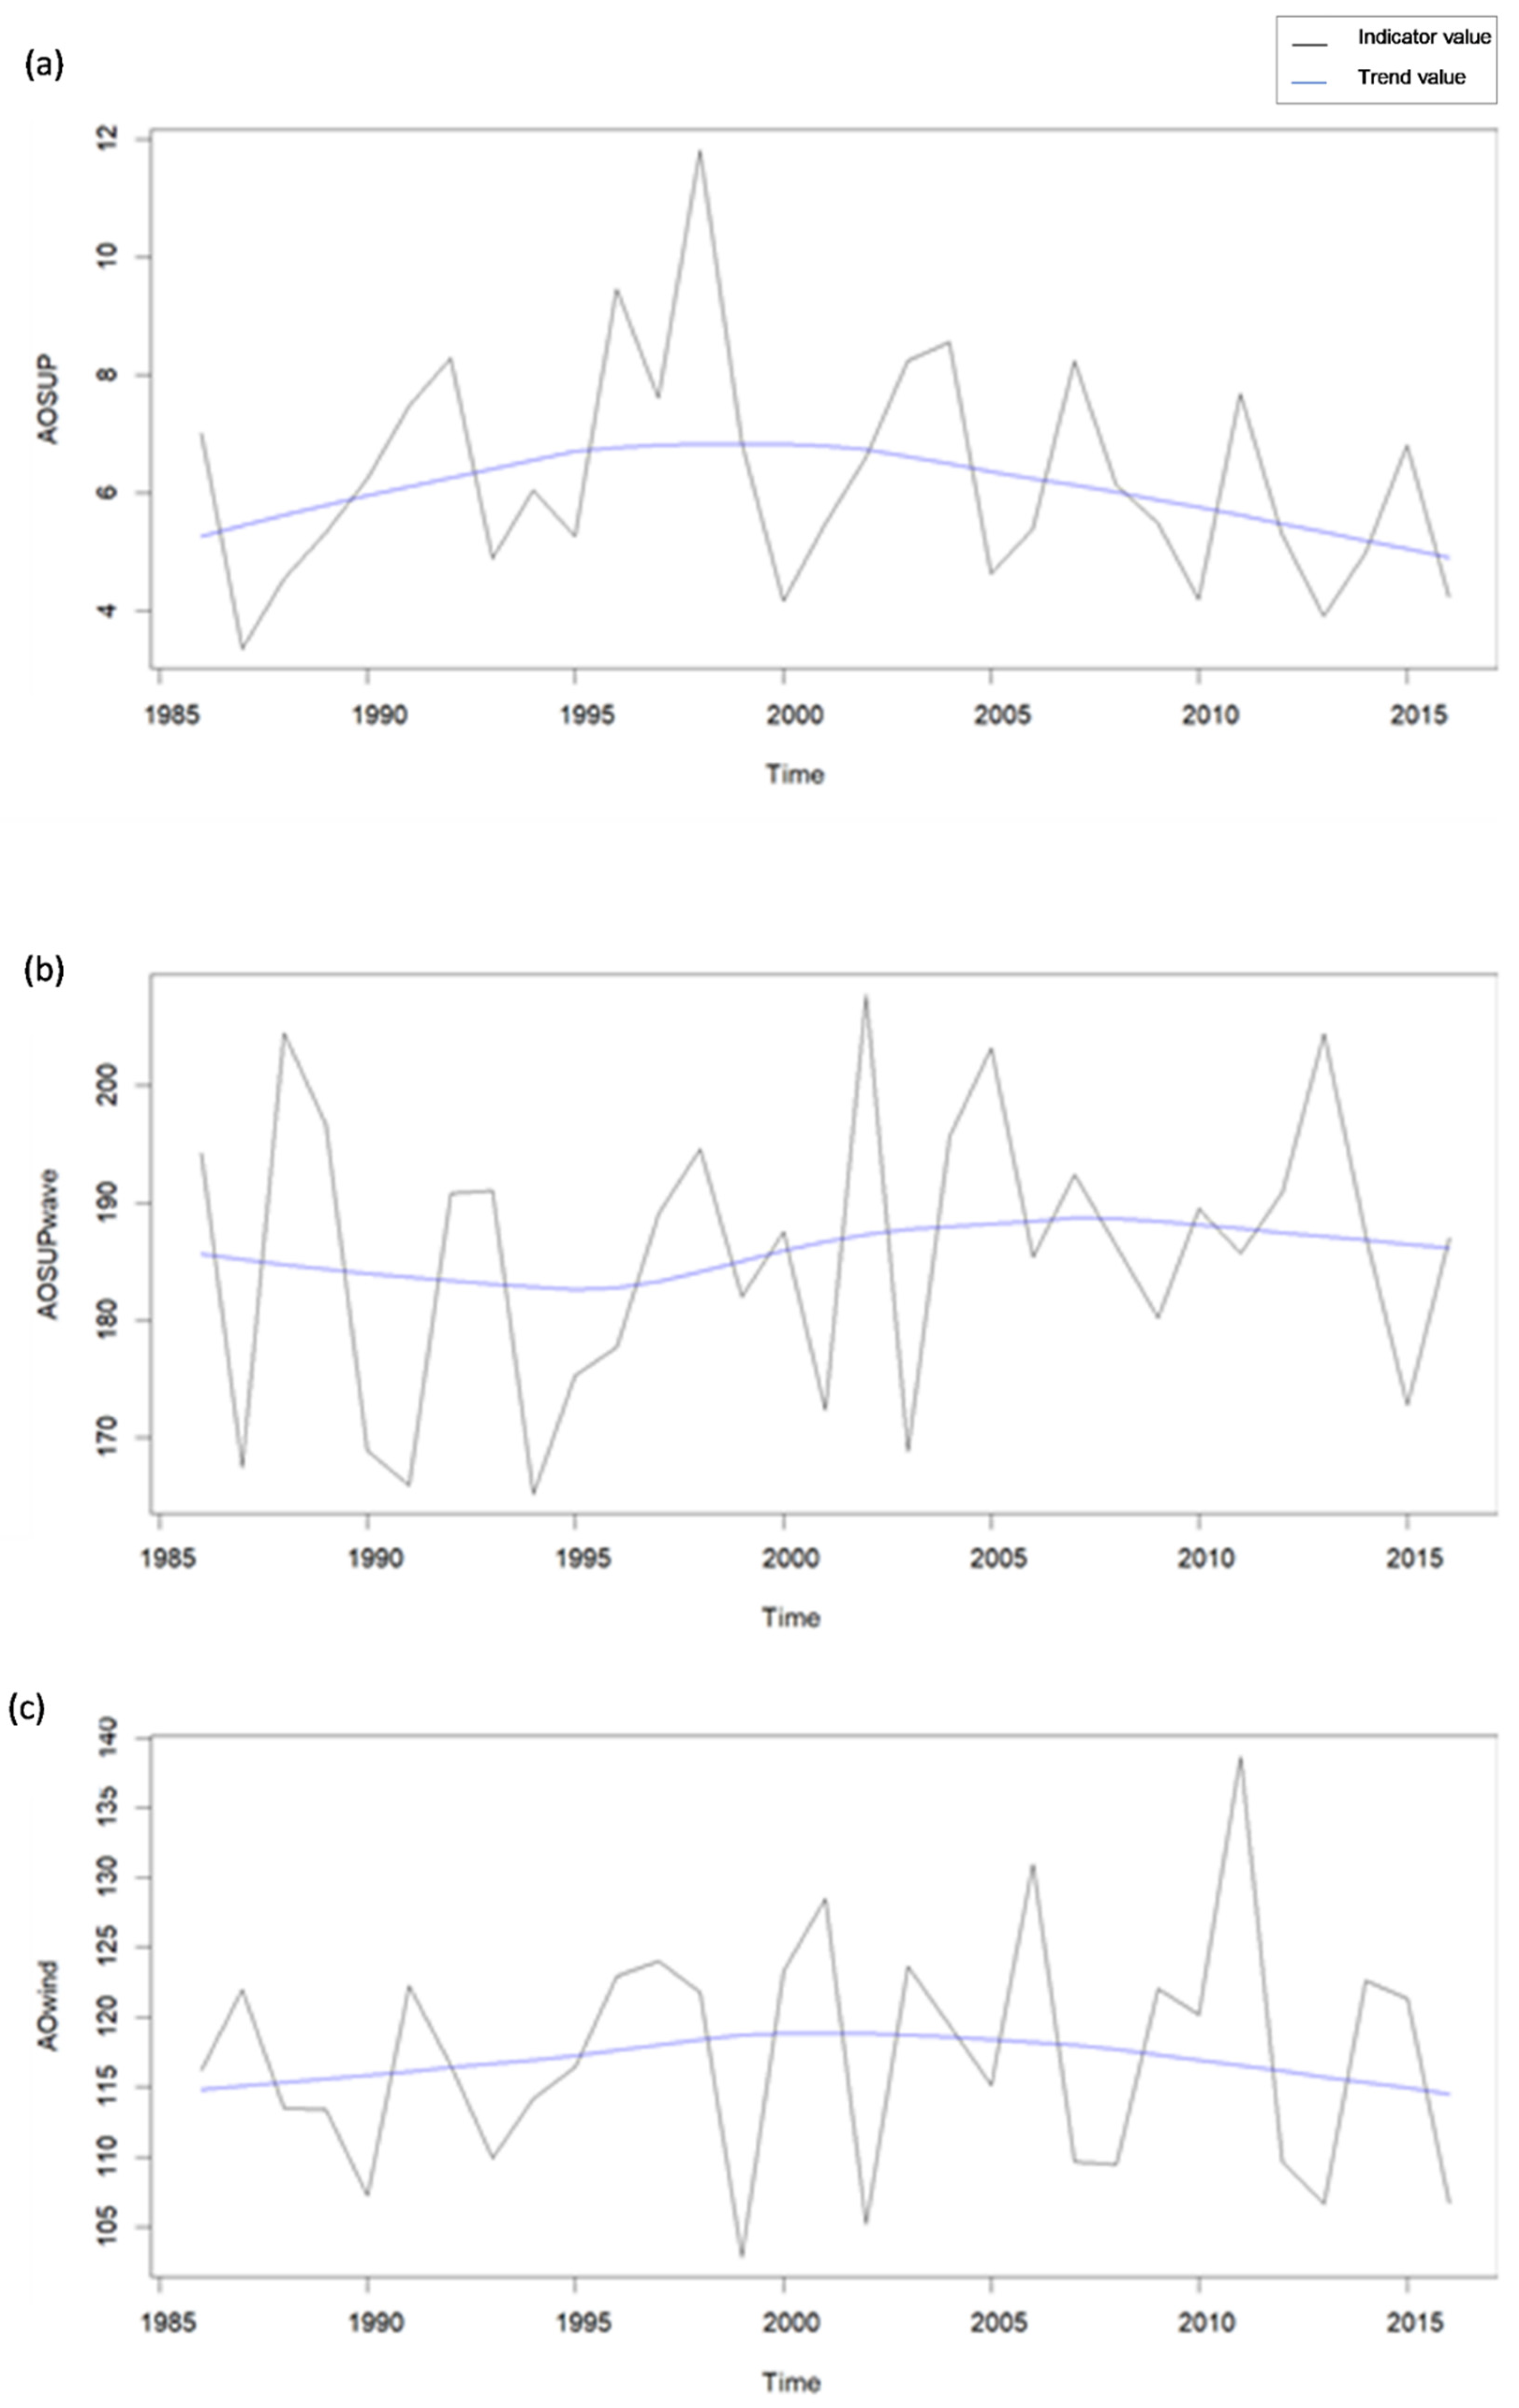
Figure 8a–c shows the annual AO evolution and trend for the 1985–2015 period. The Mann–Kendall test denoted the absence of a trend in the data. For the annual AO values, SUP-related activities presented the lowest values of annual days: a minimum of 3.35 days in 1986 and a maximum days of 11.81 days in 1997. SUP Wave presented a maximum of 207.74 annual days in 2001 and a minimum of 165.23 days in 1993. Wind and water sports such as windsurfing, wing surfing, or kitesurfing presented high maximum annual values in 2010, corresponding to 138.71 days, and lower values were in 1998, corresponding to 102.89 days.

4.3. Hazards Management for Surfers and Swimmers

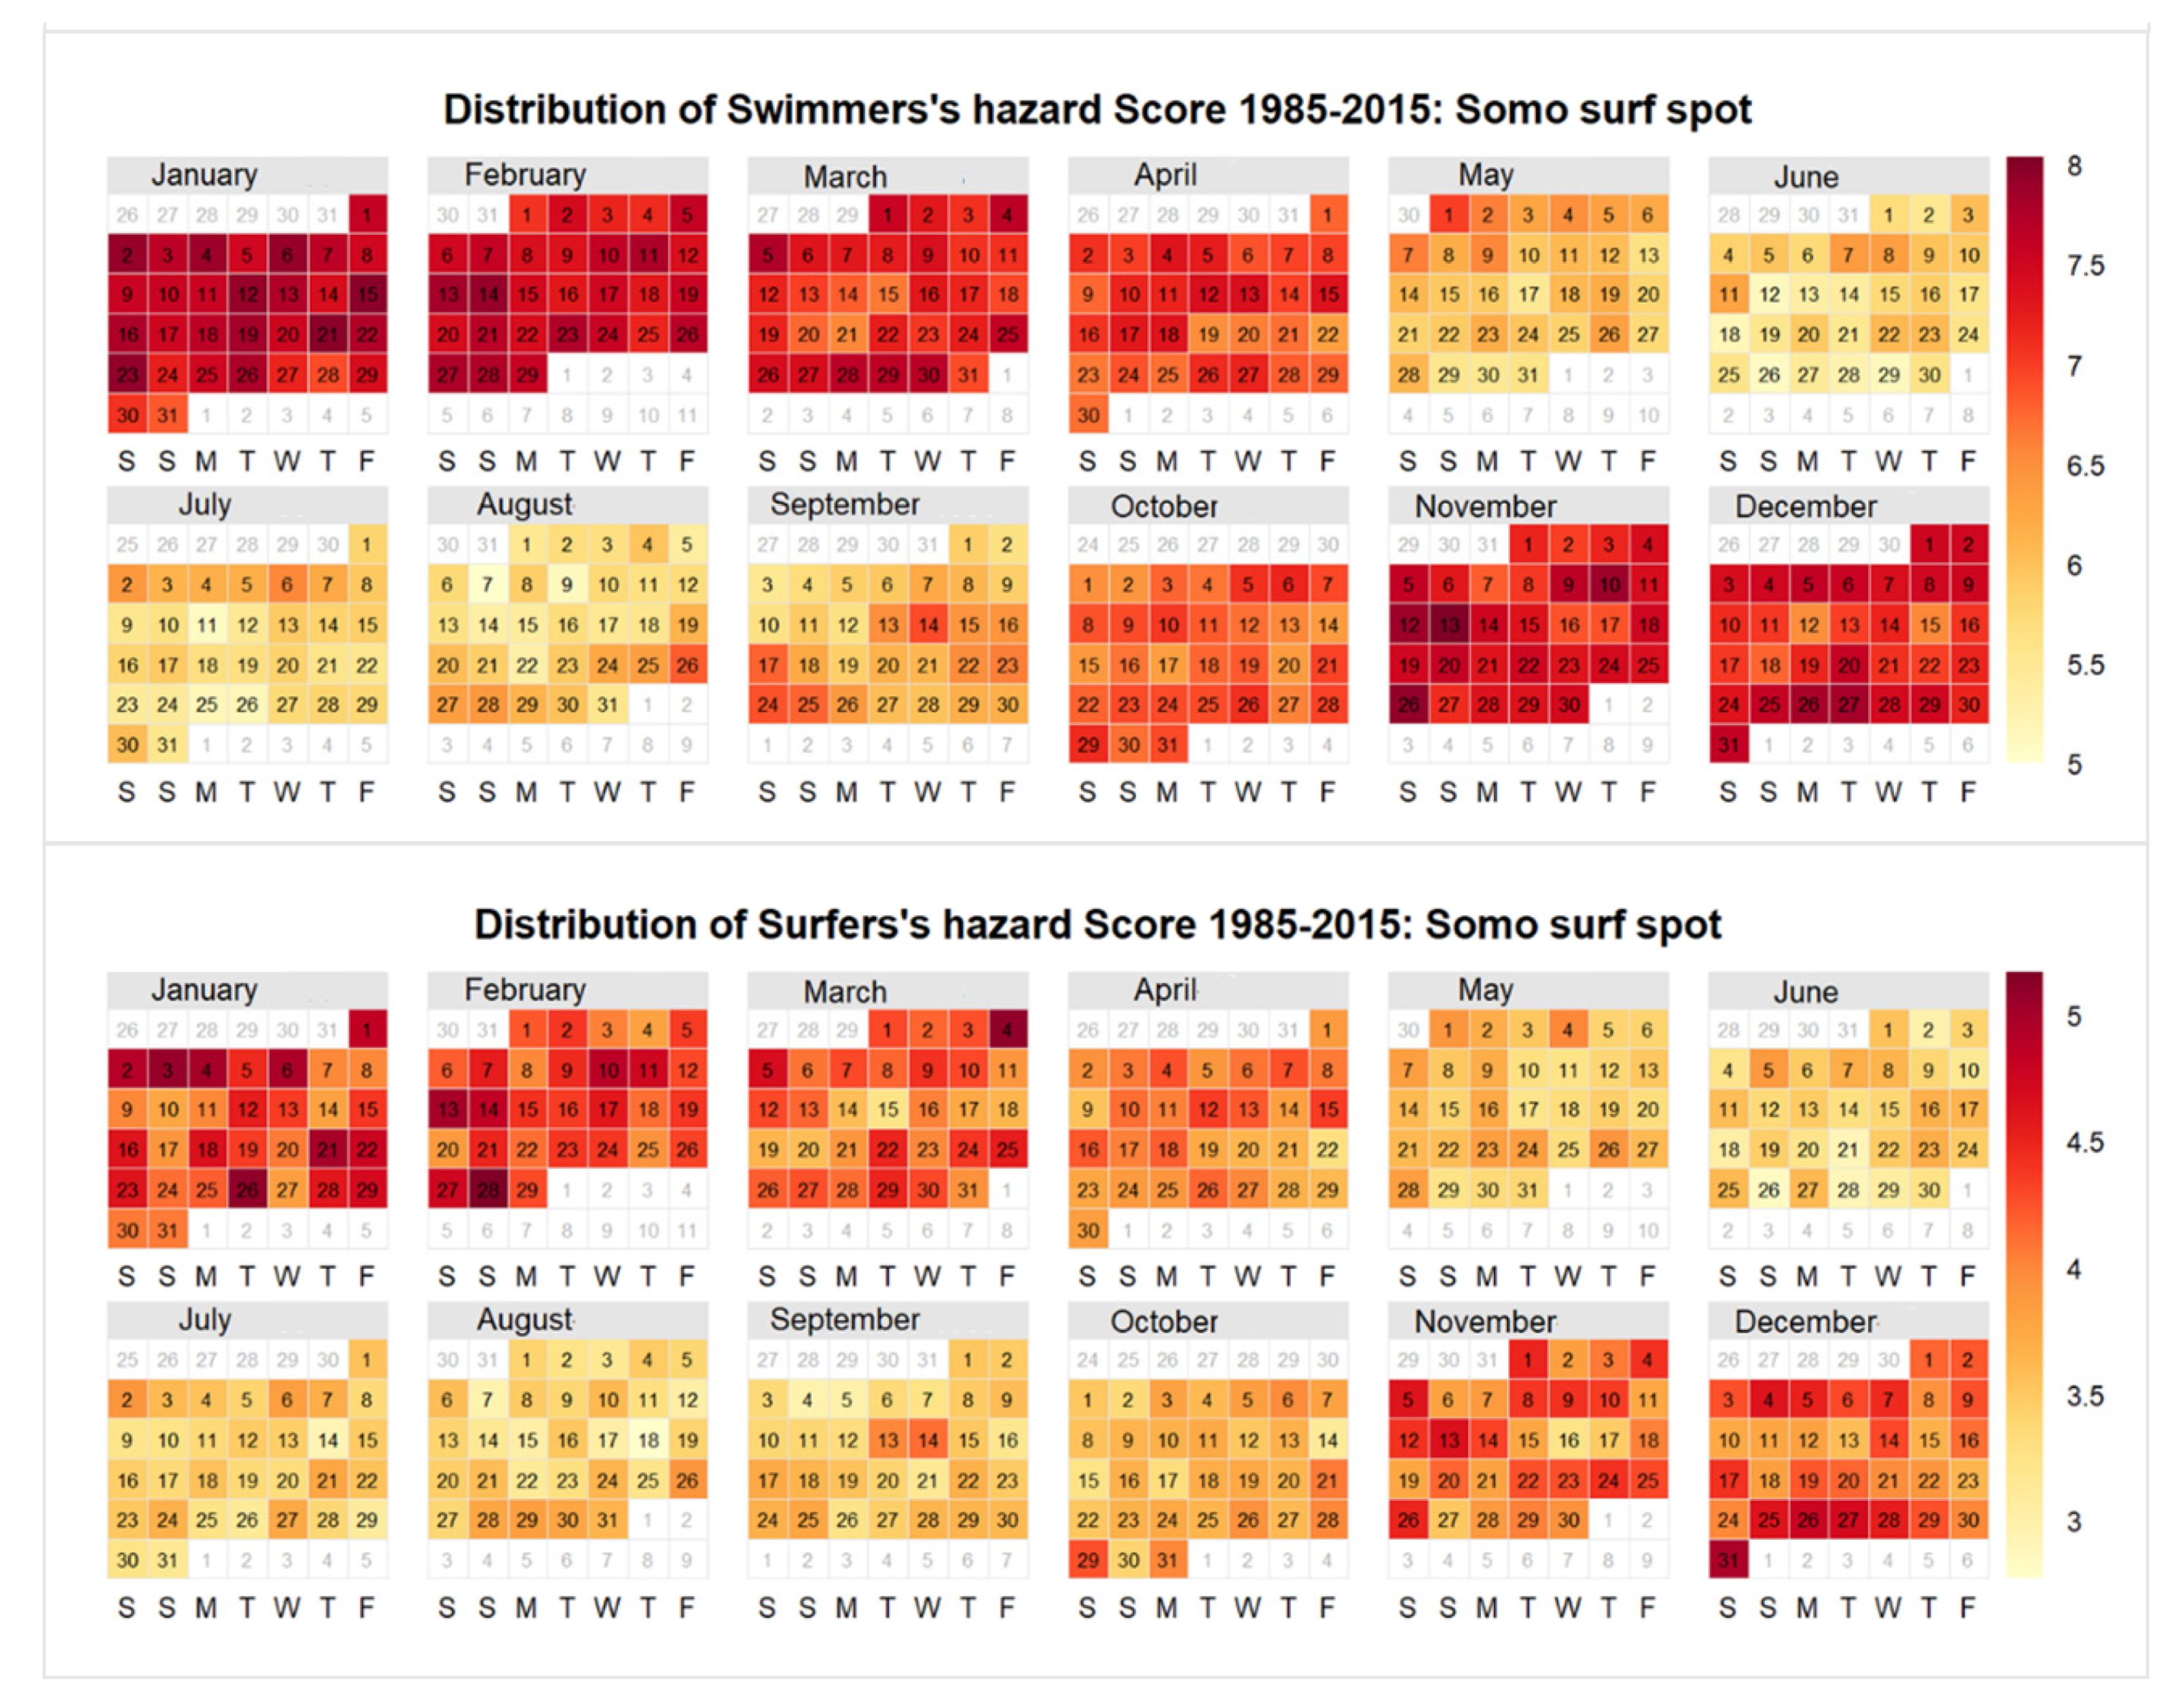
As expected, the results showed that, in the coordinates of the Somo surf spot, the hazard score was higher for swimmers than for surfers (Figure 9). The maximum possible values were 10 for both swimmers and surfers, and even so, at any time of the studied period, a score of 10 was reached. The scores for surfers were always lower than those for swimmers (Figure 9). Higher hazard values were present in the winter, autumn, and spring; lower values corresponded to the summer season. After analyzing higher scores for surfers versus swimmers year round, we found the following values: January (4.1 vs. 7.3), February (4.2 vs. 7.3), March (3.9 vs. 7), April (3.7 vs. 6.7), November (4.4 vs. 7.8), and December (3.9 vs. 7).
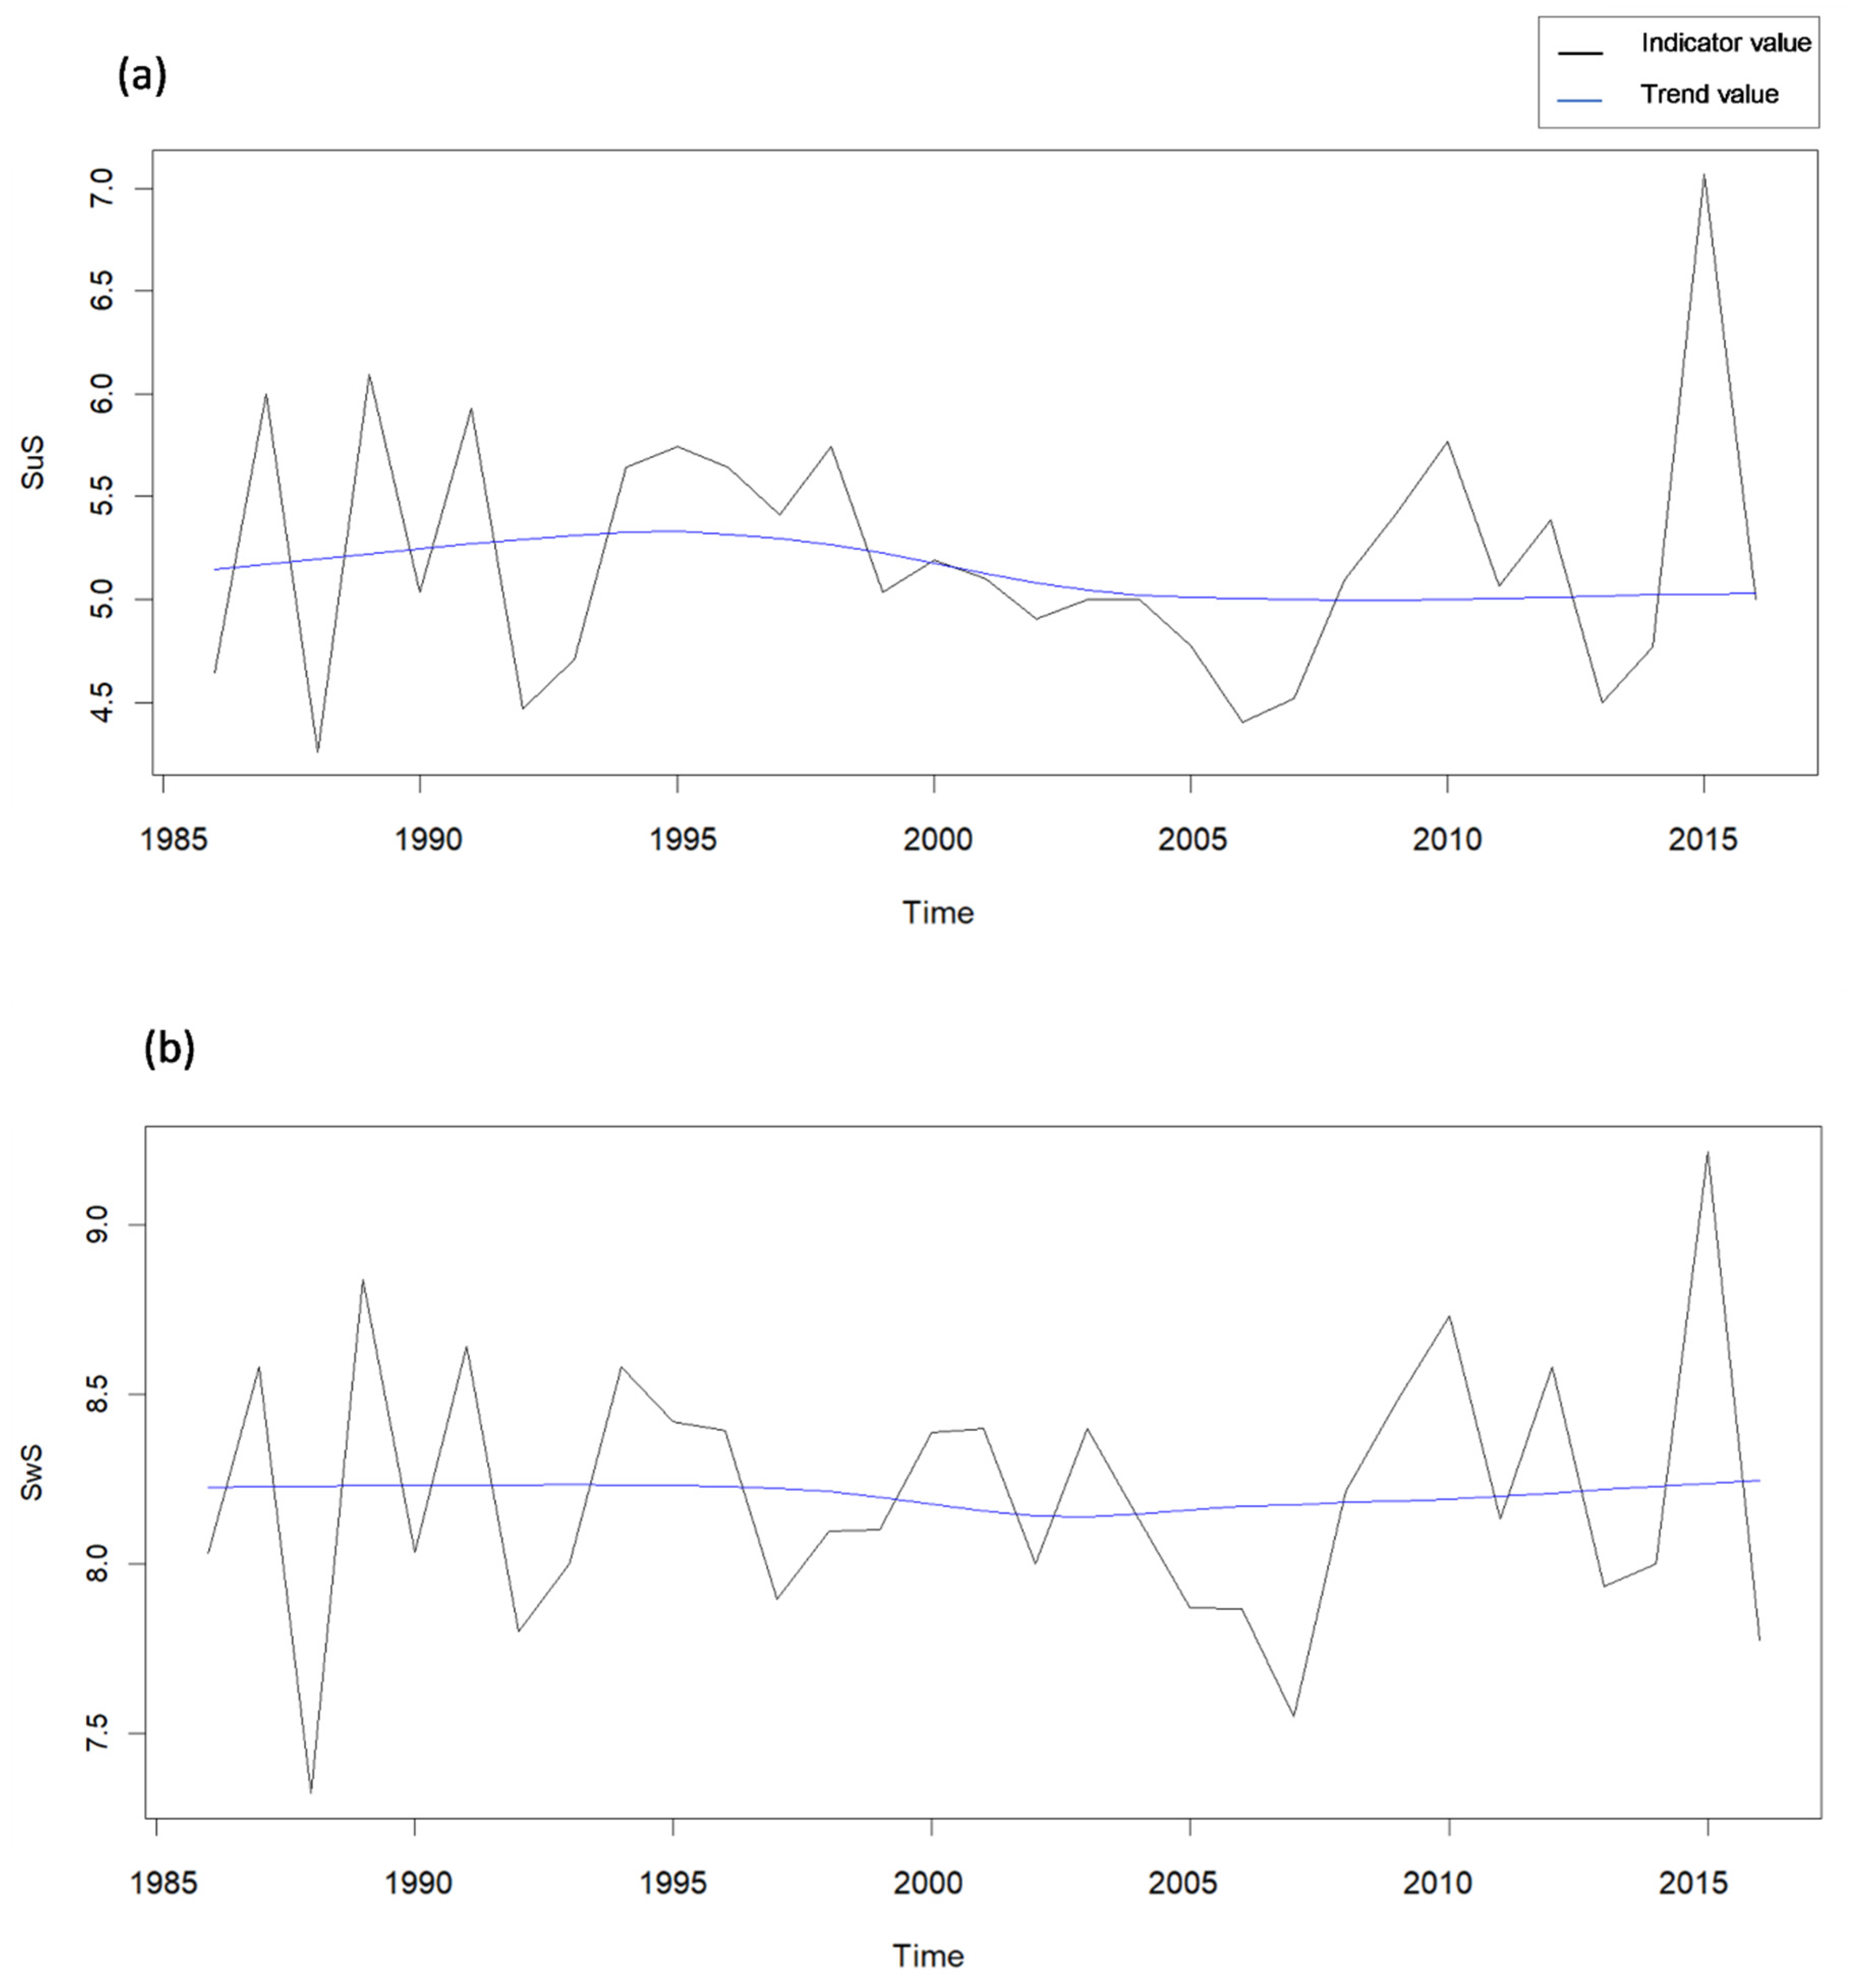
Figure 10a,b presents the evolution and trend of the annual values of SwS and SuS for the 1985–2015 period. The highest values for SwS and SuS were in 2014 (a score of 9.21 vs. 7.07) and the lowest happened in 1987 (a score of 7.32 vs. 4.25).
The Mann–Kendall test denoted the absence of significant trends in the series of all the indicators, characterized by interannual variability.

5. Discussion

As described in Section 3, surfing days were computed considering peak period (Tp), significant wave height (Hm0), wind direction (Wd), and wind speed (Ws) parameters. The highest values in the summer will probably be linked to the period of calm winds in the area. Nevertheless, the months in the winter that presented lower values will probably present high values in other spots of the east of the beach where the wind speed is not as high as in this region due to orientation and exposure factors. These results improved those of Boqué et al. [35], who calculated expected surfing days without considering wind direction and wind speed, basing their calculations only on buoy data information from Puertos del Estado and Instituto Marinha Portugal.
As Scarfe et al. [73] suggested, we have developed a surfing wave climatology intended as an information resource for surfing management. Espejo et al. [65] developed a global index for analyzing surfing climatic potential, but the horizontal spatial resolution of ocean data was coarser than ours. Espejo et al. [65] based their analysis on a global scale, while we focused on the local scale by utilizing downscaled data with a hybrid method. Tausía [74] studied the surfing conditions in the Somo surf spot with a slightly coarser spatial resolution of 100 m, focusing on the numerical simulation of the physical processes that affect surfing waves.
Advanced surfers had a higher number of expected days per month from October to April. Intermediate surfing days per month had fewer fluctuations year round. As suggested by Hutt [68], surf breaks were classified according to surfing skills. In this sense, we followed Barlow et al. [75], who examined the effect of wave conditions and surfer ability on performance and the physiological response of recreational surfers. Hence, by combining climatic conditions and surfing levels as defined by Hutt [68], we see that we can contribute to the knowledge about expected surfing days by considering surfers’ skills. Thus, we have more evidence about how different sizes of waves are associated with the balance of surfers during surfing activities, which will depend on surfers’ skills as De Andrés et al. [53] stated.
These results provide important insights into demonstrating the different capacities for offering water-related activities for a specific territory. In some cases, lectures on the deseasonalization of the tourist activity are supported by the offer of other kinds of tourist products. Peñas de Haro [76], defended deseasonalizing sun and beach tourism in Mallorca, which is typically concentrated in the summer months. The deseasonalization proposal is based on the offer of surfing and body surfing activities, as these activities are possible when sun and beach climatic requirements are not in their best conditions. Martín et al. [77] also presented a proposal for the diversification of products in consolidated tourist destinations, giving special mention to the possibility of promoting Costa del Sol as a surfing destination. Even so, these studies did not specifically analyze climate data to determine the exact climatology of the products that can diversify the tourist offer, which is one of the aims of our study.
Regarding the hazard information from swimmers, as stated by Short et al. [78], rip currents and beach hazards have an impact on public safety and have implications for coastal management. We believe that surfers and lifeguards can assist swimmers in a hazardous situation and that swimmers should have lessons on rip current escape strategies [72]. In the event that a swimmer does not know how to escape from a rip current, surfers and lifeguards, who know how rip currents work [50], can perform a rescue [51]. Surfers possess this ability because they usually use rip currents to arrive at the surfing waiting-area zone for surfing [50]. Therewith, we consider in which moments surfers present the highest hazard score because, in that situation, they are not going to be able to rescue swimmers. During these times, lifeguards should check on both surfers and swimmers. Based on climatic conditions, our results reveal the difference between swimmers’ and surfers’ hazards, and thus, this information can assess lifeguards’ decision making related to which periods are better for assisting only swimmers and which are important for assessing the safety of both swimmers and surfers. In Somo, lifeguards are only present during the summer months; therefore, this information can be of value when deciding whether to extend the period of lifeguards’ presence if required.

6. Conclusions and Perspectives

León et al. [79] explained that the tourism sector is recognized as being highly vulnerable to climate change, and research supporting destinations to enhance their resilience capacities is still considered scarce. As Bradshaw [80] found, a review of the related tourism literature raises awareness of surfing as a sport, tourism, and innovation opportunities for policymakers in the context of a highly entrepreneurial country, highlighting the benefits that surf tourism offers for sustainable growth and positioning surf tourism as an innovative product.
Our research represents an advance in the knowledge of (1) the expected surfing conditions, (2) the expected surfing conditions related to surfers’ skills, (3) the expected conditions for alternative surf offers, and (4) the expected hazard conditions and their differences for surfers and swimmers. Our case is applied in Somo’s surf spot but the general framework can work as a model for other specific surfing destinations, specifically sandy beaches. Surfing destinations with point breaks and estuaries propagations of swell should follow another approach; nevertheless, surfing management indicators can be applied in the same way.
Following Borne [81], who defended the functions of academic and more-popular literature within different language games, academic accounts can seem turgid, dense, and overcomplicated, while popular media may sometimes be seen as repeating banal and superficial observations. However, the scope for surfing-related authors to seek to bridge the gap between scholarship and surfing culture is exceedingly broad. For this reason, we developed specific indicators and represented them to assist surfing destination managers to be better prepared to make climate-smart decisions as recommended by the Global Framework for Climate Services [2]. In this vein and following Kumar et al. [82], who explored how the visualization and communication of the forecast support the end users’ decision making, our graphics in the results section are designed to be simple and easy to interpret for surfing destination managers, surf schools, and surfers, among others.
Our results contribute to the blue economy knowledge, as Spinrad [83] highlighted that the new blue economy is realized as the commercialization of value-added data, information, and knowledge about the marine environment. The economic benefits are enabled by dramatic improvements in observational capabilities and the development of predictive models. Increases in the volume, diversity, and quality of data, as well as more skillful methods of forecasting and nowcasting, make possible the production of products and services enhancing traditional components of the blue economy.
Surf tourism development provides economic opportunities to residents in coastal destinations, yet it has also been criticized for associations with gentrification, pollution, and inequality. The pandemic exacerbated existing sustainability challenges by accelerating development near surf breaks in Bocas del Toro, Panama. Mach [84] also found that there is an urgent need for stakeholders in surf communities, and particularly surf tourism business owners, to cooperate to preserve surf experiences that are vital to residents’ mental and physical health and well-being as well as attractiveness as a surf tourism destination. As Mach et al. [85] explained, we defend the idea that surfing tourism deserves a more significant place in funding initiatives, discussions, and research related to fostering sustainable development from ocean resources in the rapidly changing world.
Our research can modestly contribute to Spain’s goals for its Sustainable Tourism Strategy 2030. This is because, in 2019, the general guidelines of the Sustainable Tourism Strategy were presented, but surfing tourism was not mentioned.
This study presents a foundation for surfing climate service surfing. Future work will apply our indices to other surf spots and will validate the predictability of the indices. In addition, more indicators can be generated to assess surfing activities if more variables are added; an example is wetsuit recommendations if seawater temperature is analyzed. The present study has focused on surf tourism, but the methodology can be applied to other outdoor and sport-tourism-related activities following Silva et al. [86] and other dimensions of adventure tourism [87].
As surfers have their experiential standards for the surfability of particular places and conditions, and following Hutt et al. [68], research can affirm that, depending on surfing skills, surfers will be able to perform in specific meteo-oceanic conditions or not. The general idea is that the advanced surfers can surf in all conditions when they are not adverse. Conversely, beginning surfers cannot perform in all situations. Nevertheless, when high waves that are beneficial for advance surfers occur, beginners may sometimes also surf, but not in the same area. Advanced surfers will surf in the green wave area and beginners will surf in the white water area. The standards of surfers will depend on the level of practice, i.e., beginner, intermediate, advanced, and big wave rider, and on style, i.e., body board, skim, shortboard, longboard—for this reason, in general terms, some beaches are better for beginners and others for advanced surfers. Even so, as meteo-conditions are constantly changing, there is no general surf clue that can help the surfing community. For this reason, the present research has focused on developing those different needs identified from the survey profiling different kinds of surfers: beginners, intermediates, advanced, and big wave riders [9]. Relatedly, future research may explore the provision of an app with reactive programming for surfers that could help them to set preferences for meteo-oceanic variables.
Future research may also explore the needs of actual resort managers and/or developers by means of focus groups, adapting Font et al.’s [8] methodology to better re-design a climate service. The development of this kind of research will promote the maximization of the usage of surfing resources.
Research has explored the advances in climate services in multiple fields but determining a climate service for surfing destination management through downscaled wave data with a 100 m horizontal spatial resolution has not been done before. Further research may focus on developing the same/similar indicators but while also combining surfing forecasting with the downscaling method employed in the present research. This forecast data would help destination managers formulate better marketing plans and development. The next steps of the investigation can apply the computation of the same indicators with projection data considering the different climate scenarios to study how surfing resources will change in the future.

Author Contributions

Conceptualization, A.B.C., M.M., M.S.B. and E.A.; methodology, A.B.C., M.M., M.S.B. and E.A.; software, A.B.C., M.M. and M.S.B.; validation, A.B.C., M.M., M.S.B. and E.A.; formal analysis, A.B.C., M.M., M.S.B. and E.A.; investigation A.B.C., M.M., M.S.B. and E.A.; resources, A.B.C., M.M., M.S.B. and E.A.; data curation, A.B.C., M.M., M.S.B. and E.A.; writing—original draft preparation, A.B.C.; writing—review and editing, A.B.C., M.M., M.S.B. and E.A.; supervision, A.B.C., M.M., M.S.B. and E.A.; funding acquisition, A.B.C., M.M., M.S.B. and E.A. All authors have read and agreed to the published version of the manuscript.

Funding

This research is within the INDECIS project (INDECIS is part of ERA4CS, an ERA-NET initiated by JPI Climate and funded by FORMAS (SE), DLR (DE), BMWFW (AT), IFD (DK), MINECO (ES), and ANR (FR) with co-funding by the European Union Grant 690462). This article publication was possible with the support of the Secretaria d’Universitats i Recerca del Departament d’Empresa i Coneixement de la Generalitat de Catalunya, the European Union (UE), and the European Social Fund (ESF) (Doctoral Research Grant 2021FI_B2 00147—Formació personal investigador novell).

Institutional Review Board Statement

Not applicable.

Informed Consent Statement

Not applicable.

Data Availability Statement

The data presented in this study are available on request from the corresponding author.

Conflicts of Interest

The authors declare no conflict of interest.

References

  1. World Meteorological Organization. Implementation Plan of the Global Framework for Climate Services; WMO: Geneva, Switzerland, 2014. [Google Scholar]
  2. Hewitt, C.; Mason, S.; Walland, D. The global framework for climate services. Nat. Clim. Change 2012, 2, 831–832. [Google Scholar] [CrossRef]
  3. Swart, R.; Celliers, L.; Collard, M.; Prats, A.G.; Huang-Lachmann, J.T.; Sempere, F.L.; Timmermans, W. Reframing climate services to support municipal and regional planning. Clim. Serv. 2021, 22, 100227. [Google Scholar] [CrossRef]
  4. Mahon, R.; Petrie, J.A.; Trotman, A.; Eyzaguirre, J.; Burrowes, R.; Matthews, L.; Charles, A. Climate services for tourism: Insights from Caribbean Small Island Developing States. Clim. Serv. 2021, 24, 100262. [Google Scholar] [CrossRef]
  5. André, K.; Järnberg, L.; Gerger Swartling, Å.; Berg, P.; Segersson, D.; Amorim, J.H.; Strömbäck, L. Assessing the Quality of Knowledge for Adaptation–Experiences from Co-designing Climate Services in Sweden. Front. Clim. 2021, 3, 11. [Google Scholar] [CrossRef]
  6. Ibarra, A.M.S.; Hewitt, C.; Winarto, Y.T.; Walker, S.; Keener, V.W.; Bayala, J.; van den Hurk, B. Resilience through climate services. One Earth 2021, 4, 1050–1054. [Google Scholar] [CrossRef]
  7. Demiroglu, O.C.; Saygili-Araci, F.S.; Pacal, A.; Hall, C.M.; Kurnaz, M.L. Future Holiday Climate Index (HCI) performance of urban and beach destinations in the Mediterranean. Atmosphere 2020, 11, 911. [Google Scholar] [CrossRef]
  8. Font Barnet, A.; Boqué Ciurana, A.; Olano Pozo, J.X.; Russo, A.; Coscarelli, R.; Antronico, L.; Aguilar, E. Climate services for tourism: An applied methodology for user engagement and co-creation in European destinations. Clim. Serv. 2021, 23, 100249. [Google Scholar] [CrossRef]
  9. Boqué Ciurana, A.; Aguilar, E. Which Meteorological and Climatological Information Is Requested for Better Surfing Experiences? A Survey-Based Analysis. Atmosphere 2021, 12, 293. [Google Scholar] [CrossRef]
  10. De Freitas, C.R.; Scott, D.; McBoyle, G. A second generation climate index for tourism (CIT): Specification and verification. Int. J. Biometeorol. 2008, 52, 399–407. [Google Scholar] [CrossRef]
  11. Scott, D.; Rutty, M.; Amelung, B.; Tang, M. An inter-comparison of the Holiday Climate Index (HCI) and the Tourism Climate Index (TCI) in Europe. Atmosphere 2016, 7, 80. [Google Scholar] [CrossRef]
  12. Rutty, M.; Scott, D.; Matthews, L.; Burrowes, R.; Trotman, A.; Mahon, R.; Charles, A. An Inter-Comparison of the Holiday Climate Index (HCI:Beach) and the Tourism Climate Index (TCI) to Explain Canadian Tourism Arrivals to the Caribbean. Atmosphere 2020, 11, 412. [Google Scholar] [CrossRef]
  13. Terrado, M.; Christel, I.; Bojovic, D.; Soret, A.; Doblas-Reyes, F.J. Climate change communication and user engagement: A tool to anticipate climate change. In Handbook of Climate Change Communication; Springer: Cham, Switzerland, 2018; Volume 3, pp. 285–302. [Google Scholar]
  14. Terrado, M.; Calvo, L.; Urquiza, D.; Octenjak, S.; Nicodemou, A.; Bojovic, D.; Christel, I. Towards more effective visual-isations in climate services: Best practices and recommendations (No. EMS2021-355). In Proceedings of the Copernicus Meetings, Austria, 4 May 2021. [Google Scholar]
  15. Simm, J.; Gouldby, B.; Lumbroso, D.; Matthewson, T. Effective Coastal Climate Services—An End-User Perspective for Resilient Infrastructure. Front. Mar. Sci. 2021, 1135. [Google Scholar] [CrossRef]
  16. WTO and UNEP. Climate Change and Tourism—Responding to Global Challenges; World Tourism Organization (WTO) and United Nations Environment Programme (UNEP); WTO: Madrid, Spain, 2008; p. 256. [Google Scholar]
  17. Álvarez-Díaz, M.; Rosselló-Nadal, J. Forecasting British tourist arrivals in the Balearic Islands using meteorological variables. Tour. Econ. 2010, 16, 153–168. [Google Scholar] [CrossRef]
  18. Rosselló-Nadal, J.; Riera-Font, A.; Cárdenas, V. The impact of weather variability on British outbound flows. Clim. Change 2011, 105, 281–292. [Google Scholar] [CrossRef]
  19. Førland, E.J.; Jacobsen, J.K.S.; Denstadli, J.M.; Lohmann, M.; Hanssen-Bauer, I.; Hygen, H.O.; Tømmervik, H. Cool weather tourism under global warming: Comparing Arctic summer tourists’ weather preferences with regional climate statistics and projections. Tour. Manag. 2013, 36, 567–579. [Google Scholar] [CrossRef]
  20. Day, J.; Chin, N.; Sydnor, S.; Cherkauer, K. Weather, climate, and tourism performance: A quantitative analysis. Tour. Manag. Perspect. 2013, 5, 51–56. [Google Scholar] [CrossRef]
  21. Falk, M. Impact of long-term weather on domestic and foreign winter tourism demand. Int. J. Tour. Res. 2013, 15, 1–17. [Google Scholar] [CrossRef]
  22. Forster, J.; Schuhmann, P.W.; Lake, I.R.; Watkinson, A.R.; Gill, J.A. The influence of hurricane risk on tourist destination choice in the Caribbean. Clim. Change 2012, 114, 745–768. [Google Scholar] [CrossRef]
  23. Hamzah, J.; Habibah, A.; Buang, A.; Jusoff, K.; Toriman, M.E.; Mohd Fuad, M.J.; Azima, A.M. Flood disaster, impacts and the tourism providers’ responses: The Kota Tinggi experience. Adv. Nat. Appl. Sci. 2012, 6, 26–32. [Google Scholar]
  24. Tsai, H.T.; Tseng, C.J.; Tzeng, S.Y.; Wu, T.J.; Day, J.D. The impacts of natural hazards on Taiwan’s tourism industry. Nat. Hazards 2012, 62, 83–91. [Google Scholar] [CrossRef]
  25. Arent, D.J.; Tol, R.S.J.; Faust, E.; Hella, J.P.; Kumar, S.; Strzepek, K.M.; Tóth, F.L.; Yan, D. Key economic sectors and services. In Climate Change 2014: Impacts, Adaptation, and Vulnerability; Part A: Global and Sectoral Aspects; Contribution of Working Group II to the Fifth Assessment Report of the Intergovernmental Panel on Climate Change; Field, C.B., Barros, V.R., Dokken, D.J., Mach, K.J., Mastrandrea, M.D., Bilir, T.E., Chatterjee, M., Ebi, K.L., Estrada, Y.O., Genova, R.C., et al., Eds.; Cambridge University Press: Cambridge, UK; New York, NY, USA, 2014; pp. 659–708. [Google Scholar]
  26. Mieczkowski, Z. The tourism climatic index: A method of evaluating world climates for tourism. Can. Geogr. Géographe Can. 1985, 29, 220–233. [Google Scholar] [CrossRef]
  27. Becken, S.; Hay, J.E. Tourism and climate change. In Tourism and Climate Change; Channel View Publications: Bristol, UK, 2007. [Google Scholar]
  28. Adiguzel, F.; Bozdogan Sert, E.; Dinc, Y.; Cetin, M.; Gungor, S.; Yuka, P.; Vural, E. Determining the relationships between climatic elements and thermal comfort and tourism activities using the tourism climate index for urban planning: A case study of Izmir Province. Theor. Appl. Climatol. 2021, 147, 1105–1120. [Google Scholar] [CrossRef]
  29. Adiguzel, F.; Bozdogan Sert, E.; Dinc, Y.; Cetin, M.; Gungor, S.; Yuka, P.; Vural, E.; Dogan, O.S.; Kaya, E.; Karakaya, K. Confort climático en la Argentina: Un recurso intangible para el turismo. Cuad. Geográficos 2021, 60, 52–72. [Google Scholar]
  30. Scott, D.; Lemieux, C. Weather and climate information for tourism. Procedia Environ. Sci. 2010, 1, 146–183. [Google Scholar] [CrossRef]
  31. Scott, D. Sustainable tourism and the grand challenge of climate change. Sustainability 2021, 13, 1966. [Google Scholar] [CrossRef]
  32. Olano Pozo, J.X.; Boqué Ciurana, A.; Font Barnet, A.; Russo, A.; Saladié Borraz, Ò.; Anton-Clavé, S.; Aguilar, E. Co-developing climate services with local agents: The INDECIS Snow Tourism Index. In Proceedings of the EGU General Assembly Conference Abstracts, Virtual Event, 4–8 May 2020; p. 8926. [Google Scholar]
  33. Rice, H.; Cohen, S.; Scott, D.; Steiger, R. Climate change risk in the Swedish ski industry. Curr. Issues Tour. 2021, 1–16. [Google Scholar] [CrossRef]
  34. Köberl, J.; François, H.; Cognard, J.; Carmagnola, C.; Prettenthaler, F.; Damm, A.; Morin, S. The demand side of climate services for real-time snow management in Alpine ski resorts: Some empirical insights and implications for climate services development. Clim. Serv. 2021, 22, 100238. [Google Scholar] [CrossRef]
  35. Boqué Ciurana, A.; Aguilar, E. Expected distribution of surfing days in the Iberian Peninsula. J. Mar. Sci. Eng. 2020, 8, 599. [Google Scholar] [CrossRef]
  36. Martin, S.A.; Assenov, I. The genesis of a new body of sport tourism literature: A systematic review of surf tourism research (1997–2011). J. Sport Tour. 2012, 17, 257–287. [Google Scholar] [CrossRef]
  37. Amorim, R.C.; Rocha, A.; Oliveira, M.; Ribeiro, C. Efficient delivery of forecasts to a nautical sports mobile application with semantic data services. In Proceedings of theNinth International C* Conference on Computer Science & Software Engineering, Porto, Portugal, 20–22 July 2016; C3S2E ’16. Association for Computing Machinery: New York, NY, USA, 2016; pp. 7–12. [Google Scholar]
  38. Martínez Vázquez, R.M.; Milán García, J.; De Pablo Valenciano, J. Analysis and trends of global research on nautical, maritime and marine tourism. J. Mar. Sci. Eng. 2021, 9, 93. [Google Scholar] [CrossRef]
  39. Portugal, A.C.; Campos, F.; Martins, F.; Melo, R. Understanding the relation between serious surfing, surfing profile, surf travel behaviour and destination attributes preferences. Eur. J. Tour. Res. 2017, 16, 57–73. [Google Scholar] [CrossRef]
  40. Chen, N.; Liu, J.; Ba, Z.; Zhong, J.; Liu, X. The Construction and Research of Marine Tourism Management System Based on the Perspective of Industrial Integration. J. Coast. Res. 2020, 112, 132–135. [Google Scholar] [CrossRef]
  41. Martin, S.A. The conservation of coastal surfing resources in Thailand: The Andaman Sea. In Proceedings of the International Conference on the Environment and Natural Resources (ICENR), Bangkok, Thailand, 5 November 2010; pp. 262–280. [Google Scholar]
  42. Arroyo, M.; Levine, A.; Brenner, L.; Seingier, G.; Leyva, C.; Espejel, I. Indicators to measure pressure, state, impact and responses of surf breaks: The case of Bahía de Todos Santos World Surfing Reserve. Ocean. Coast. Manag. 2020, 194, 105252. [Google Scholar] [CrossRef]
  43. Atkin, E.A.; Reineman, D.R.; Reiblich, J.; Revell, D.L. Applicability of management guidelines for surfing resources in California. Shore Beach 2020, 88, 53–64. [Google Scholar] [CrossRef]
  44. Reineman, D.R.; Koenig, K.; Strong-Cvetich, N.; Kittinger, J.N. Conservation Opportunities Arise from the Co-Occurrence of Surfing and Key Biodiversity Areas. Front. Mar. Sci. 2021, 8, 253. [Google Scholar] [CrossRef]
  45. Valencia, L.; Monterrubio, C.; Osorio-García, M. Social representations of surf tourism’s impacts in Mexico. Int. J. Tour. Policy 2021, 11, 29–51. [Google Scholar] [CrossRef]
  46. Fox, N.; Marshall, J.; Dankel, D.J. Ocean Literacy and Surfing: Understanding How Interactions in Coastal Ecosystems Inform Blue Space User’s Awareness of the Ocean. Int. J. Environ. Res. Public Health 2021, 18, 5819. [Google Scholar] [CrossRef]
  47. McGinnis, M.D.; Ostrom, E. Social-ecological system framework: Initial changes and continuing challenges. Ecol. Soc. 2014, 19, 30. [Google Scholar] [CrossRef]
  48. Mindes, A.R. The Perception of Hazards Among Surfers in Southern California; California State University: Long Beach, CA, USA, 1997. [Google Scholar]
  49. Brander, R.W. Rip currents. In Coastal and Marine Hazards, Risks, and Disasters; Elsevier: Amsterdam, The Netherlands, 2015; pp. 335–379. [Google Scholar]
  50. Brander, R.W.; Bradstreet, A.; Sherker, S.; MacMahan, J. Responses of swimmers caught in rip currents: Perspectives on mitigating the global rip current hazard. Int. J. Aquat. Res. Educ. 2011, 5, 11. [Google Scholar] [CrossRef]
  51. Dalrymple, R.A.; MacMahan, J.H.; Reniers, A.J.; Nelko, V. Rip currents. Annu. Rev. Fluid Mech. 2011, 43, 551–581. [Google Scholar] [CrossRef]
  52. Attard, A.; Brander, R.W.; Shaw, W.S. Rescues conducted by surfers on Australian beaches. Accid. Anal. Prev. 2015, 82, 70–78. [Google Scholar] [CrossRef] [PubMed]
  53. De Andrés, C.; Torrego, J.A.; Júnior, S.; Escamilla, V.; Ortiz, R.; Borgonovo, M.; del Estal, A. Valoración del Equilibrio con Y-balance Test en Surfistas de Competición y Población no Surfista en España. Available online: https://www.researchgate.net/profile/Alejandro-Martinez-22/publication/317175801_Valoracion_del_Equilibrio_con_Y-balance_Test_en_Surfistas_de_Competicion_y_Poblacion_no_Surfista_en_Espana/links/59297851458515e3d469c4af/Valoracion-del-Equilibrio-con-Y-bal (accessed on 9 June 2022).
  54. Sariego López, I.; Moreno Melgarejo, A. El desarrollo turístico y territorial basado en el Surf: Ribamontán al Mar,“Surf a Toda Costa”. Estud. Turísticos 2015, 205, 119–138. [Google Scholar]
  55. Köppen, W.P. Grundriss der Klimakunde; Walter de Gruyter GmbH: Berlin, Germany, 1931. [Google Scholar]
  56. Rafael, C. Climate Atlas of the Cantabrian Region; CMT CAS; Technical note; National Institute of Meteorology: Brasilia Brazil, 1992. [Google Scholar]
  57. Hellín Medina, J. Análisis Climatológico del Mar Cantábrico y su Influencia en la Navegación; 2009. Available online: https://upcommons.upc.edu/bitstream/handle/2099.1/7451/An%E1lisis%20Climatol%F3gico%20del%20Mar%20Cant%E1brico%20y%20su%20influencia%20en%20la%20Navegaci%F3n.pdf?sequence=1 (accessed on 9 June 2022).
  58. Camus, P.; Mendez, F.J.; Medina, R. A hybrid efficient method to downscale wave climate to coastal areas. Coast. Eng. 2011, 58, 851–862. [Google Scholar] [CrossRef]
  59. Camus, P.; Mendez, F.J.; Medina, R.; Tomas, A.; Izaguirre, C. High resolution downscaled ocean waves (DOW) reanalysis in coastal areas. Coast. Eng. 2013, 72, 56–68. [Google Scholar] [CrossRef]
  60. Reguero, B.G.; Menéndez, M.; Méndez, F.J.; Mínguez, R.; Losada, I.J. A Global Ocean Wave (GOW) calibrated reanalysis from 1948 onwards. Coast. Eng. 2012, 65, 38–55. [Google Scholar] [CrossRef]
  61. Perez, J.; Menendez, M.; Losada, I.J. GOW2: A global wave hindcast for coastal applications. Coast. Eng. 2017, 124, 1–11. [Google Scholar] [CrossRef]
  62. Saha, S.; Moorthi, S.; Pan, H.L.; Wu, X.; Wang, J.; Nadiga, S.; Tripp, P.; Kistler, R.; Woollen, J.; Goldberg, M.; et al. The NCEP Climate Forecast System Reanalysis. Bull. Am. Meteorol. Soc. 2010, 91, 1015–1058. [Google Scholar] [CrossRef]
  63. ha, S.; Moorthi, S.; Wu, X.; Wang, J.; Nadiga, S.; Tripp, P.; Behringer, D.; Hou, Y.; Chuang, H.; Iredell, M.; et al. The NCEP Climate Forecast System Version 2. J. Clim. 2014, 27, 2185–2208. [Google Scholar]
  64. Holthuijsen, L.H. Waves in Oceanic and Coastal Waters; Cambridge University press: Cambridge, UK, 2010. [Google Scholar]
  65. Espejo, A.; Losada, I.J.; Méndez, F.J. Surfing wave climate variability. Glob. Planet. Change 2014, 121, 19–25. [Google Scholar] [CrossRef]
  66. Yukawa, H.; Iino, M.; Fujiwara, T. Estimation and visualization of paddling effort for stand up paddle boarding with a geographical information system. Procedia Eng. 2015, 112, 552–555. [Google Scholar] [CrossRef]
  67. Vermeersch, W.; Alcoforado, M.J. Wind as a resource for summer nautical recreation. Guincho beach study case. Finisterra 2013, 48, 95. [Google Scholar] [CrossRef]
  68. Hutt, J.A.; Black, K.P.; Mead, S.T. Classification of surf breaks in relation to surfing skill. J. Coast. Res. 2001, 29, 66–81. [Google Scholar]
  69. Koon, W.; Rowhani-Rahbar, A.; Quan, L. Do wave heights and water levels increase ocean lifeguard rescues? Am. J. Emerg. Med. 2018, 36, 1195–1201. [Google Scholar] [CrossRef]
  70. Mazzone, W.F. Development and Evaluation of a Swimmer’s Rescue Suit; Naval Submarine Base New London: Groton CN, USA, 1961. [Google Scholar]
  71. Whitcomb, D. So Others May Live: Saving Lives, Defying Death with the Coast Guard’s Rescue Swimmers. Air Power Hist. 2008, 55, 63–64. [Google Scholar]
  72. Miloshis, M.; Stephenson, W.J. Rip current escape strategies: Lessons for swimmers and coastal rescue authorities. Nat. Hazards 2011, 59, 823–832. [Google Scholar] [CrossRef]
  73. Scarfe, B.E.; Healy, T.R.; Rennie, H.G.; Mead, S.T. Sustainable management of surfing breaks—An overview. Reef J. 2009, 1, 44–73. [Google Scholar]
  74. Tausía Hoyal, J. Spatial and temporal variability of surfing in Cantabria. Master ’s Thesis, Universidad de Cantabria (UC), Santander, Spain, 2020. [Google Scholar]
  75. Barlow, M.J.; Gresty, K.; Findlay, M.; Cooke, C.B.; Davidson, M.A. The effect of wave conditions and surfer ability on performance and the physiological response of recreational surfers. J. Strength Cond. Res. 2014, 28, 2946–2953. [Google Scholar] [CrossRef]
  76. Peñas de Haro, P. La Geografía del Surf y el Bodyboard en Mallorca, Clima y Turismo Activo. PhD Thesis, Universitat de les Illes Balears, Palma de Mallorca, Spain, 2015. [Google Scholar]
  77. Martín González, R.; Gil, A.M.L. Propuesta de diversificación de productos en destinos consolidados: El turismo de surf en la Costa del Sol Occidental. Estud. Turísticos 2014, 199, 63–88. [Google Scholar]
  78. Short, A.D.; Hogan, C.L. Rip currents and beach hazards: Their impact on public safety and implications for coastal management. J. Coast. Res. 1994, 14, 197–209. [Google Scholar]
  79. León, C.J.; Giannakis, E.; Zittis, G.; Serghides, D.; Lam-González, Y.E.; García, C. Tourists’ Preferences for Adaptation Measures to Build Climate Resilience at Coastal Destinations. Evidence from Cyprus. Tour. Plan. Dev. 2021, 1–27. [Google Scholar] [CrossRef]
  80. Bradshaw, L. Surfing the Innovation Waves: Surf Tourism in Portugal. In Tourism Innovation in Spain and Portugal; Springer: Cham, Switzerland, 2021; pp. 149–166. [Google Scholar]
  81. Borne, G. Surfing and Sustainability; Routledge: London, UK, 2018. [Google Scholar]
  82. Kumar, U.; Werners, S.E.; Paparrizos, S.; Datta, D.K.; Ludwig, F. Co-producing climate information services with smallholder farmers in the Lower Bengal Delta: How forecast visualization and communication support farmers’ decision-making. Clim. Risk Manag. 2021, 33, 100346. [Google Scholar] [CrossRef]
  83. Spinrad, R.W. The new blue economy. In Preparing a Workforce for the New Blue Economy; Elsevier: Amsterdam, The Netherlands, 2021; pp. 87–111. [Google Scholar]
  84. Mach, L.J. Surf Tourism in Uncertain Times: Resident Perspectives on the Sustainability Implications of COVID-19. Societies 2021, 11, 75. [Google Scholar] [CrossRef]
  85. Mach, L.; Ponting, J. Establishing a pre-COVID-19 baseline for surf tourism: Trip expenditure and attitudes, behaviors and willingness to pay for sustainability. Ann. Tour. Res. Empir. Insights 2021, 2, 100011. [Google Scholar] [CrossRef]
  86. Silva, G.; Correia, A.; Rachão, S.; Nunes, A.; Vieira, E.; Santos, S.; Fernandes, P.O. A Methodology for the Identification and Assessment of the Conditions for the Practice of Outdoor and Sport Tourism-Related Activities: The Case of Northern Portugal. Sustainability 2021, 13, 7343. [Google Scholar] [CrossRef]
  87. Janowski, I.; Gardiner, S.; Kwek, A. Dimensions of adventure tourism. Tour. Manag. Perspect. 2021, 37, 100776. [Google Scholar] [CrossRef]
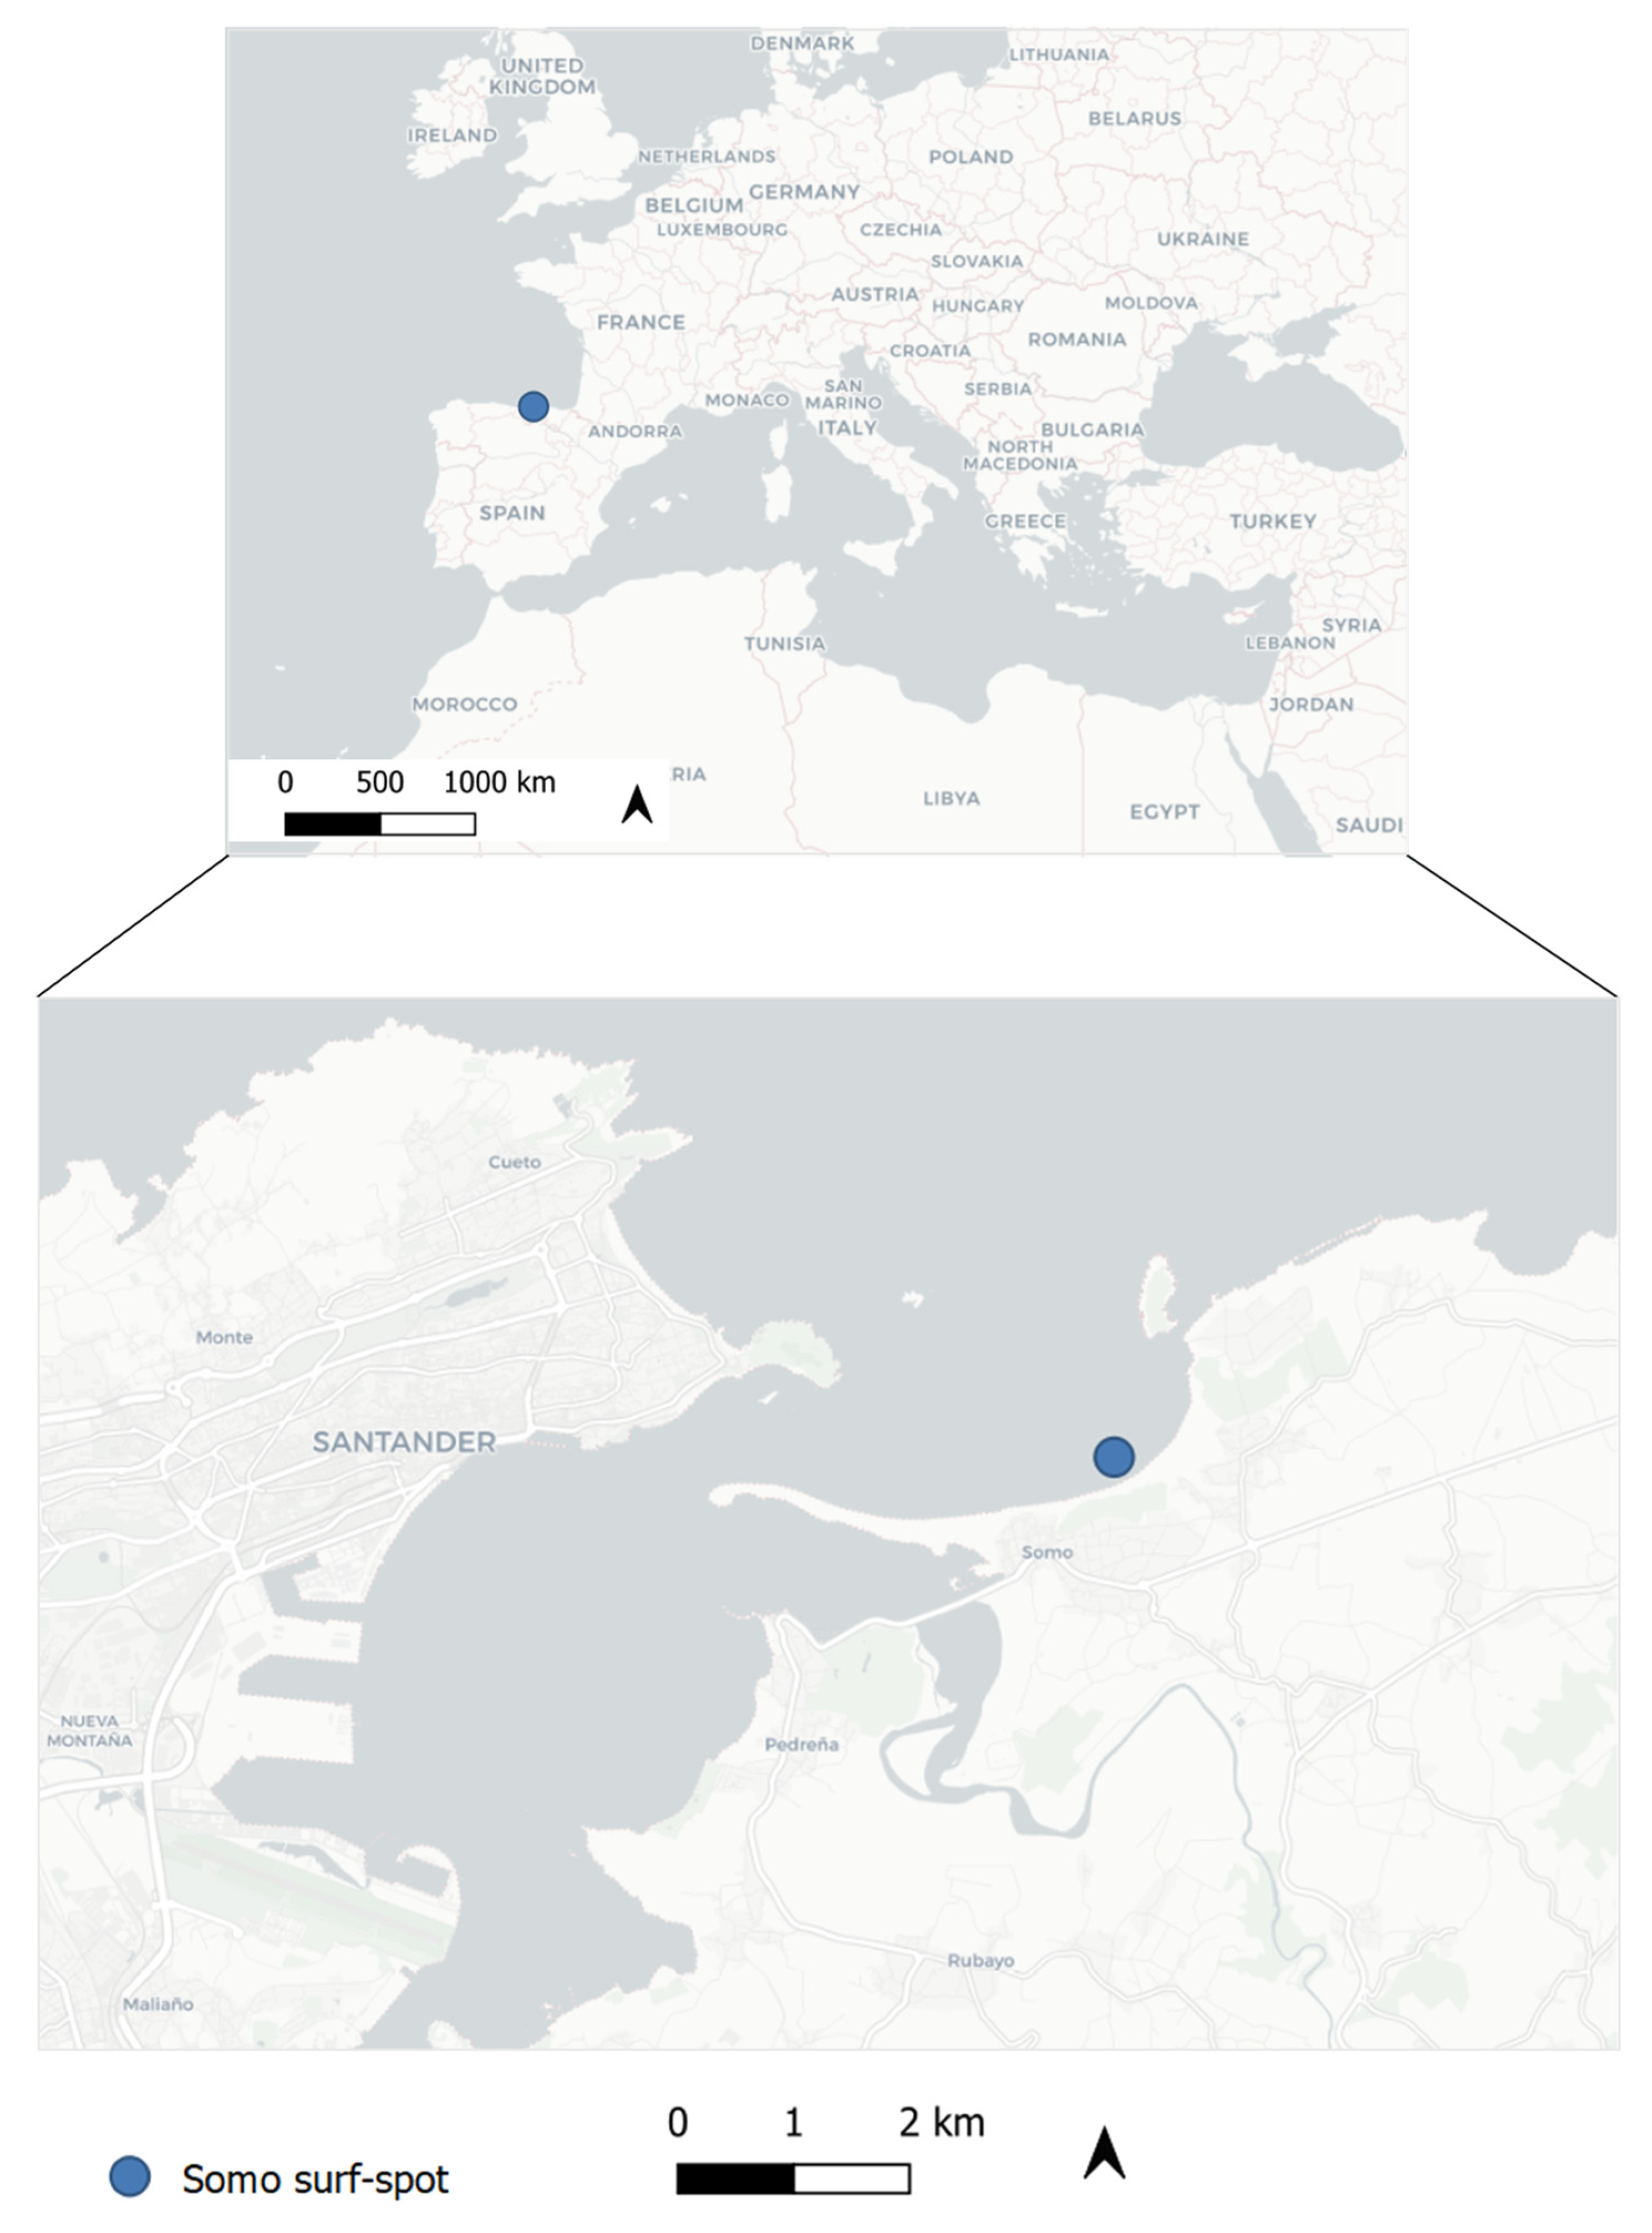
Figure 1. Somo surf spot location: global and local context.
Sustainability 14 08496 g001
Figure 2. Development workflow of the climate service for surfing destination management.
Sustainability 14 08496 g002
Figure 3. Expected distribution of surfing days per month, Somo, 1985–2015.
Sustainability 14 08496 g003
Figure 4. Evolution and trend of annual surfing days; reference period is 1985–2015 in Somo.
Sustainability 14 08496 g004
Figure 5. Expected distribution of surfing days per month sorted by surfer’s skill level; reference period is 1985–2015 in Somo.
Sustainability 14 08496 g005
Figure 6. (a) Evolution and trend of annual surfing days for beginner surfers; reference period is 1985–2015 in Somo. (b) Evolution and trend of annual surfing days for intermediate surfers; reference period is 1985–2015 in Somo. (c) Evolution and trend of annual surfing days for advanced surfers; reference period is 1985–2015 in Somo. (d) Evolution and trend of annual surfing days for big wave riders; reference period is 1985–2015 in Somo.
Sustainability 14 08496 g006
Figure 7. (a) Expected distribution of alternative offer monthly days for SUP-related sports; reference period is 1985–2015 in Somo. (b) Expected distribution of alternative offer monthly days for SUP Wave sport; reference period is 1985–2015 in Somo. (c) Expected distribution of alternative offer monthly days for wind-related sports, i.e., windsurfing, kitesurfing, wing surfing; reference period is 1985–2015 in Somo.
Sustainability 14 08496 g007
Figure 8. (a) Evolution and trend of annual alternative offer days for SUP-related sports; reference period is 1985–2015. (b) Evolution and trend of annual alternative offer days for SUP Wave sport; reference period is 1985–2015. (c) Evolution and trend of annual alternative offer days for wind-related sports, i.e., windsurfing, kitesurfing, wing surfing; reference period is 1985–2015.
Sustainability 14 08496 g008
Figure 9. Distribution of swimmers’ and surfers’ hazard score, 1985–2015: Somo surf spot.
Sustainability 14 08496 g009
Figure 10. (a) Evolution and trend of annual maximum SuS from 1985 to 2015 in Somo. (b) Evolution and trend of annual maximum SwS.
Sustainability 14 08496 g010
Table 1. Alternative surf activity definition.
Alternative Surf Activity
CategorizationConditions RequiredExplanation
SUP/SUP yoga/SUP Pilates/Surf polo better than surfingWs < 10
Hm0 < 0.5
Waves are not high enough for surfing, but wind conditions allow the practice of other related activities
SUP WaveWs < 20
Hm0 > 0.5 ≤ 1.5
Significant wave height and wind speed will probably make SUP Wave possible
Kite surfing, windsurfing, wing better than surfingWs > 20Wind speed is too extreme for surfing but is suitable for other related activities
Table 2. Surfing skill-oriented climatology definition.
Surfing Skill-Oriented Climatology
CategorizationConditions RequiredExplanation
Beginner/Longboard/Fatty boardsHm0 ≥ 0.5 < 0.9
Tp6
Small waves useful for beginners, longboarders, or fatty board riders
IntermediateHm0 ≥ 0.9 < 1.5
Tp6
Wave height is useful for intermediate surfers (in green waves) but also for beginners in white water
AdvancedHm0 ≥ 1.5 < 3
Tp6
Wave height is so high that the surfers require advanced skills to arrive at the peak zone and to surf
Big wave riderHm0 ≥ 3
Tp6
Wave height is suitable only for big wave riders and tow-in surfers
Table 3. Hazard management: surfers’ versus swimmers’ definition.
Hazard Management: Surfers versus Swimmers Definition
Variable BasedConditions Required (Swimmers)Value (Swimmers)Conditions Required (Surfers)Value (Surfers)
Wind-basedWs < 10
Wd = all directions
0Ws < 15
Wd = all directions
0
Ws ≥ 10 < 15
Wd = onshore
1Ws ≥ 15 < 20
Wd = all directions
3
Ws ≥ 10 < 15
Wd = offshore
2Wd ≥ 20
Wd = all directions
4
Ws ≥ 15 < 20
Wd = onshore
1NANA
Ws ≥ 15 < 20
Wd = offshore
3NANA
Ws ≥ 20
Wd = all directions
4NANA
Significant wave-height-basedHm0 > 0.5 < 0.91Hm0 > 1.5 > 31
Hm0 ≥ 0.9 < 1.52Hm0 ≥ 32
Hm0 > 1.53NANA
Wave energy flux-basedWe < 450We ≥ 500 < 10001
We ≥ 45 < 1001We ≥ 10004
We ≥ 100 < 10002NANA
We ≥ 10003NANA
Publisher’s Note: MDPI stays neutral with regard to jurisdictional claims in published maps and institutional affiliations.