Article

Landscape Pattern Evolution in a Mining City: An Urban Life Cycle Perspective

College of Mining Engineering, Heilongjiang University of Science and Technology, Harbin 150022, China
*
Author to whom correspondence should be addressed.
Sustainability 2022, 14(14), 8492; https://doi.org/10.3390/su14148492
Submission received: 4 June 2022 / Revised: 6 July 2022 / Accepted: 8 July 2022 / Published: 11 July 2022
(This article belongs to the Special Issue Urban Landscape Ecology and Sustainability)

Abstract

:
Quantitative studies on how mining activities shape the evolution of regional landscape patterns can contribute to the scientific understanding of how mining cities develop. Based on the theories of life cycle and landscape ecology, this paper takes Jixi, a typical Chinese mining city, as a case study to analyze the landscape pattern features at different mining city development stages. First, we constructed a mining city development cycle index system. Second, the optimal granularity for landscape pattern analysis was determined. Finally, landscape evolution was analyzed at the type and landscape levels based on the mining city development cycle. The main conclusions are: (1) Jixi has gone through four stages since 1990: lead-in (1990–1998), development (1998–2009), maturity (2009–2016), and transition (2016–2020); (2) the optimal grain size for landscape pattern analysis is 90 m; (3) through the various development stages, the landscape fragmentation degree, complexity, and diversity show a tendency to rise first and then fall. Thus, mining cities should carry out sustainable development planning from the perspective of industrial transformation in the early stages, and policy orientation in the development process should have different emphases according to each stage.

1. Introduction

Coal resource-based mining cities have been developed on the basis of coal exploration, processing, and production, and function primarily as coal providers [1]. They are essential energy resource supply bases for national economic growth [2,3]. In recent years, due to rapid economic development and the resulting increased demand for coal, China has become the world’s largest coal producer and consumer [4]. However, coal mining leads to a series of negative ecological and landscape impacts and environmental problems, including landscape structure defects and imbalances [5]. Since mining cities are typically resource dependent, most are eventually confronted with urban decline and transition caused by resource exhaustion [6,7,8]. In order to achieve sustainable development in mining cities, it is urgent to plan their overall development process and coordinate in advance their transitional stages.
Landscape pattern usually refers to the spatial distribution and configuration of the basic landscape elements in terms of their shapes and sizes [9]. Variations in landscape pattern can reflect changes in natural resource use patterns due to human activities and hidden ecological insecurity factors [10,11]. The landscape pattern of city is a direct representation of its development and economic activities; development and changes in cities can alter their landscape pattern [12,13,14]. While the economic systems in mining cities are mainly sustained by natural resources [15], their landscape patterns are influenced by multiple factors [16]. On the one hand, large areas of underground goaf (i.e., mined-out areas) have resulted from the massive exploration for mineral resources in many mining cities, leading to land subsidence that significantly influences the landscape pattern on the surface. On the other hand, land reclamation efforts in mining areas for the purpose of sustainable development have made regional landscape patterns more rational and balanced [17]. The single industrial structure and continuous resource consumption of most mining cities eventually leads to the decline of urban development and corresponding changes in the composition and structure of urban landscape types [18]. Therefore, to optimize the spatial planning and layout of mining cities, it is important to analyze the evolution of their landscape pattern and how it is related to their development, as well as hidden problems in the development process.
In recent years, quantitative studies on regional landscape pattern evolution resulting from mining activities have increased [19,20,21,22,23,24]. However, when deciding upon the period of analysis of landscape patterns, existing studies tend to take subjective approaches and randomly select research periods from 5 to 10 years. This ignores long-term landscape pattern changes and limits the capacity of the research results to accurately reflect the different evolution features in various development stages.
Lifecycle theory argues that not only living things experience processes of birth, growth, maturity, and decay [25,26,27]. This theory has been applied to many sectors, such as politics, economics, the environment, technology, and society [28,29,30,31,32]. The non-renewability of coal determines that coal mining development conforms to life cycle theory: from exploration and mining, to stable production, and finally to decay and depletion. Given that the development of mining cities has a close relationship with the life cycle of mineral resource exploitation [33], studying the development of mining cities in different periods in terms of their landscape pattern characteristics and summarizing time series relating to their life cycle and spatial structure evolution has important theoretical significance for the scientific understanding of how mining cities develop. This approach will also help to develop appropriate urban spatial planning responses and guide economic transformation in the context of urban development.
The National Sustainable Development Plan for Resource-Based Cities (2013–2020) issued by The State Council of China in 2013 defines Jixi as a typical coal resource-based mining city in China [17]. Moreover, Jixi is also among the main cities targeted by the strategies of “Eight Economic Regions” and “Ten Projects.” In Jixi, coal has been mined for years, so large areas of the natural landscape, including arable land and meadows, have been replaced by mining leases, causing damage to the ecological environment and regional landscape and threatening Jixi’s ecological safety. Based on the aim of researching the relationship between a mining city’s life cycle and urban development, this research takes Jixi as a case study and uses the theories of GIS and landscape ecology to quantitatively analyze landscape variations in different stages. The analysis procedure is shown in Figure 1. The purpose of this study is to identify the problems in the development process of mining cities and put forward suggestions for urban development. In so doing, this study aims to provide evidence of the impact for land-use planning and sustainable development in mining cities.

2. Materials and Methods

2.1. Study Area

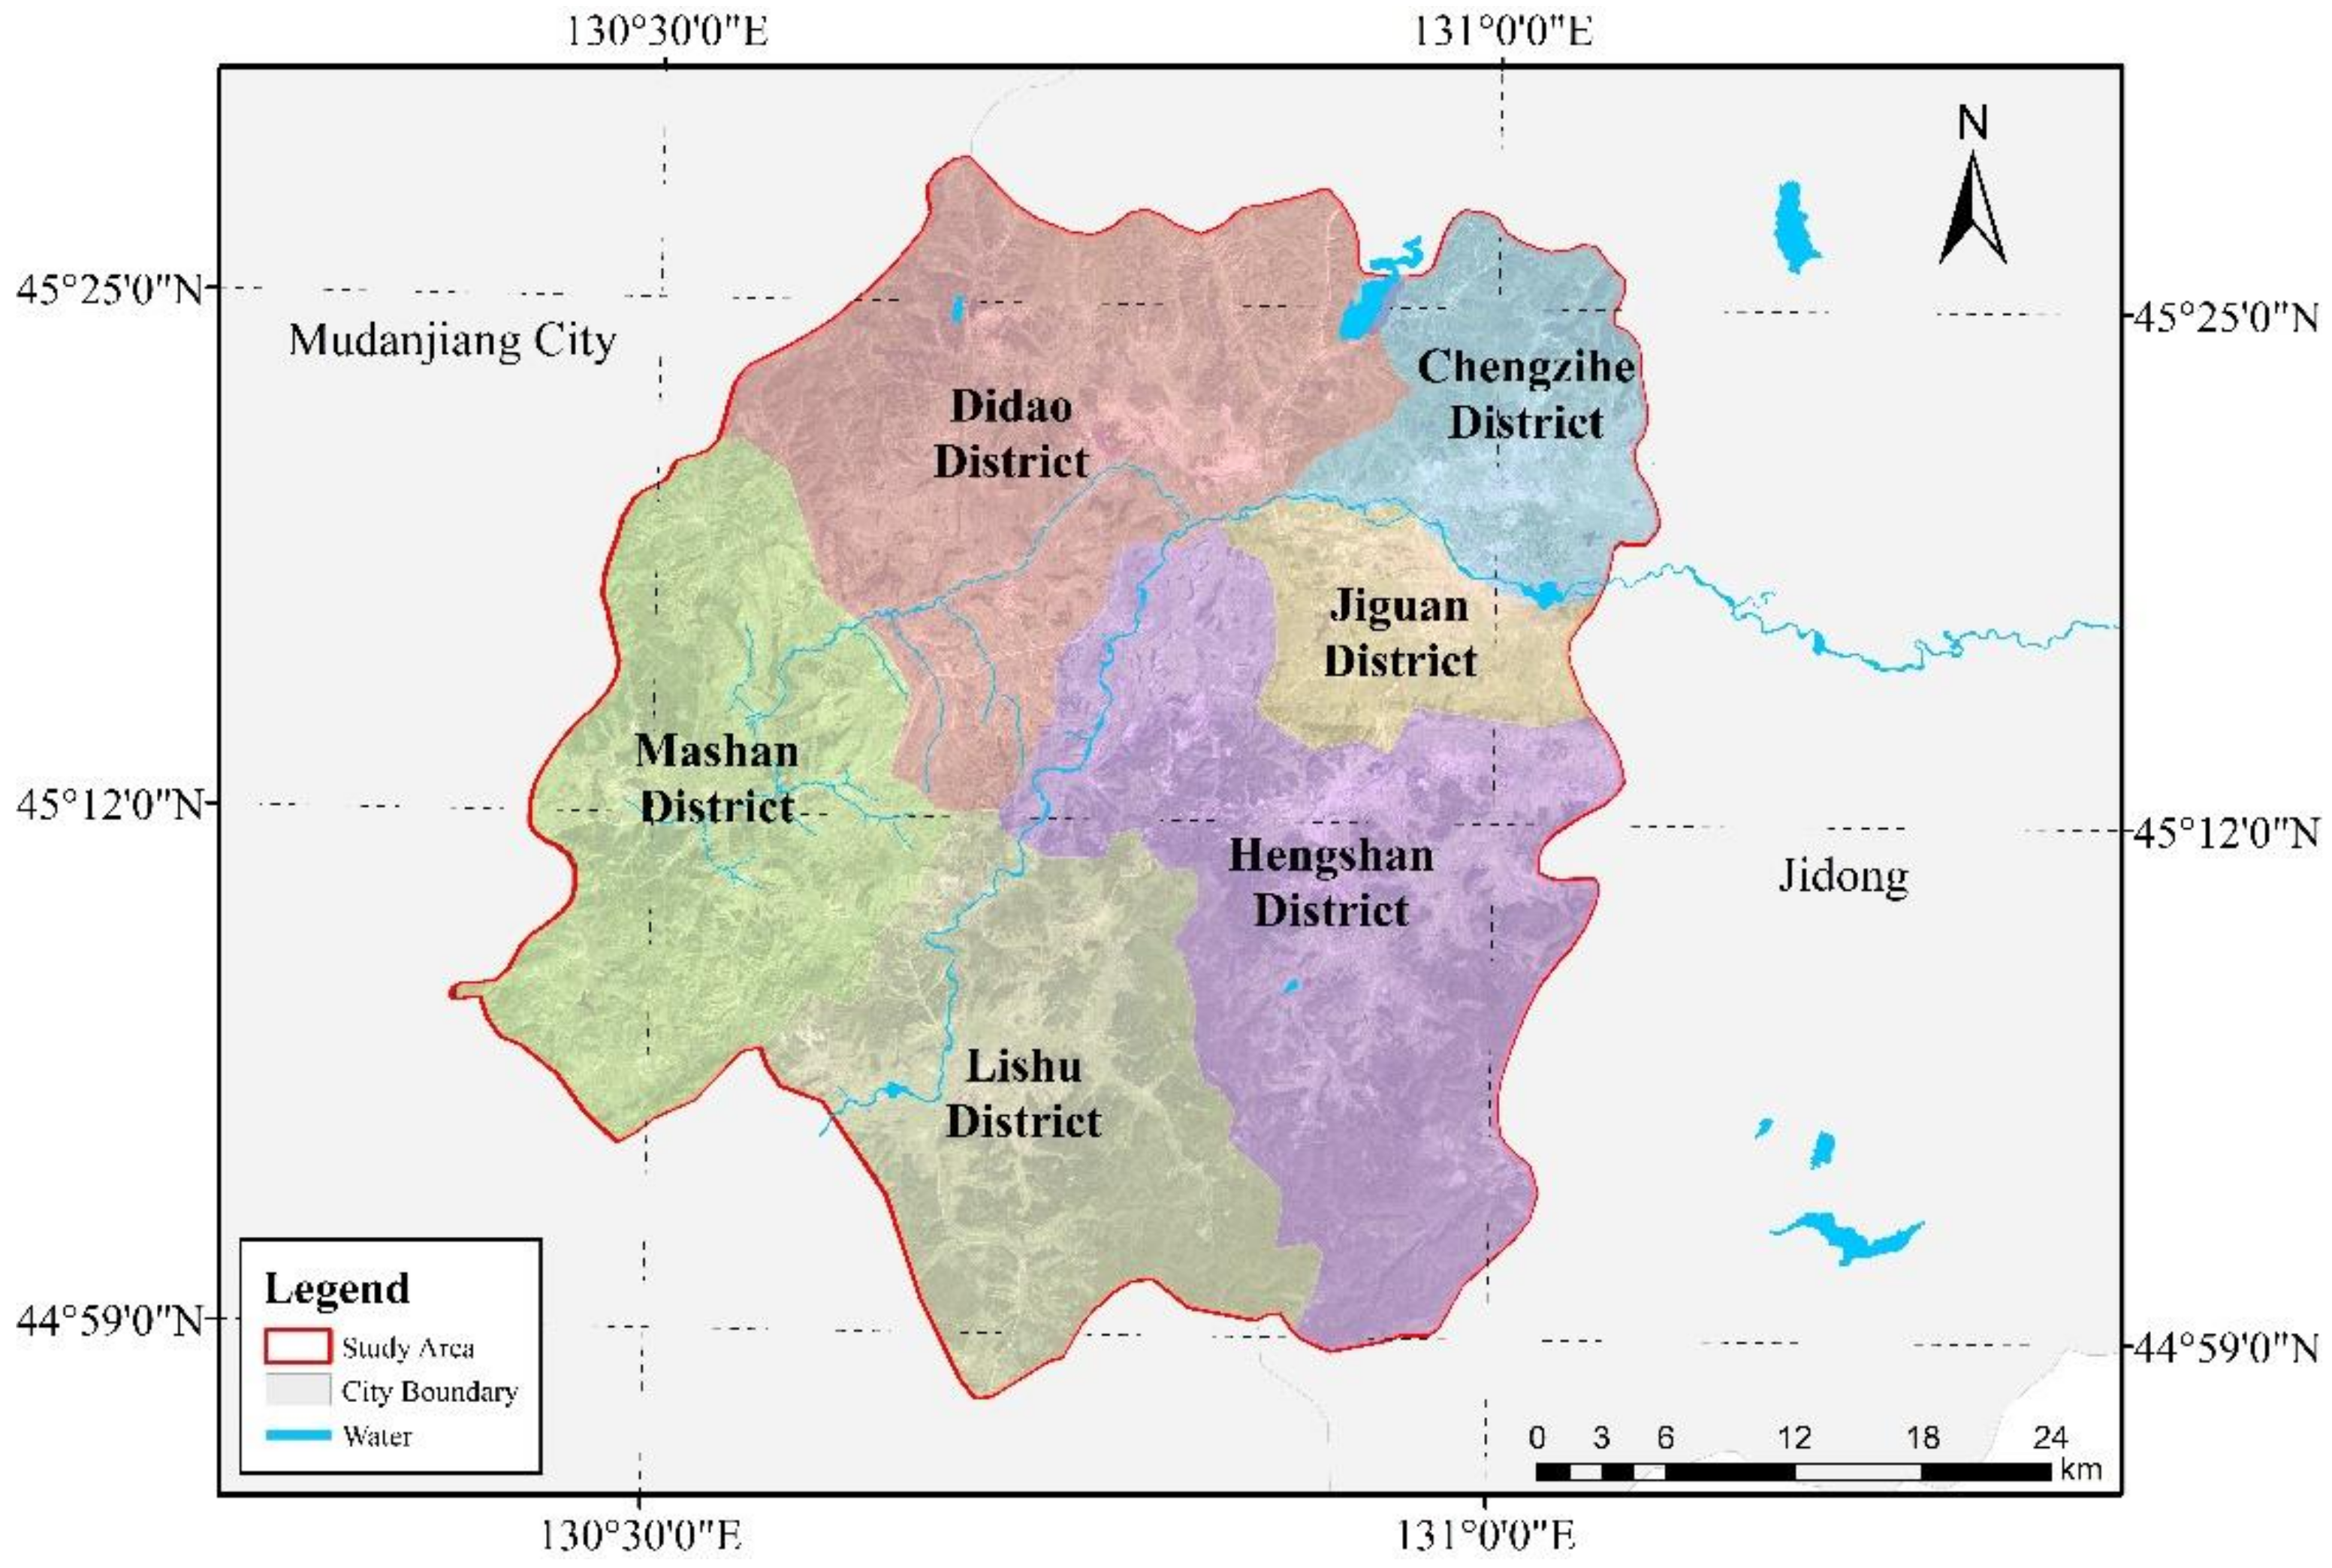
With a total area of 2.250 million km2, Jixi is located the southeast of Heilongjiang province, and has six districts: Jiguan, Hengshan, Didao, Lishu, and Mashan (Figure 2). Jixi City has a cold temperate continental monsoon climate, and its terrain is dominated by mountains, hills, and plains. It has very rich mineral resources and was once listed as the first of Heilongjiang Province’s “four coal cities.” By 2020, the remaining coal resources of Jixi City were about 5912 million tons. Abundant coal resources have laid a foundation for the development of light and heavy industry in Jixi City. However, the unsustainable exploitation of mineral resources and land resources leads to the destruction of the regional landscape ecological environment, which greatly affects the landscape pattern of the regional surface.

2.2. Data Sources

In this study, Landsat remote sensing images from 1990 to 2020 were collected as data sources with a spatial resolution of 30 m. Through visual interpretation, the landscape pattern categories in this study are defined as cultivated land, forest land, meadows, construction land, bodies of water, and unutilized land. Furthermore, this study also collected data from the Statistical Yearbook of Heilongjiang Province and the Statistical Yearbook of Jixi City between 1990 and 2021 in order to obtain indexes for all forms of socioeconomic development.

2.3. Study Methods

2.3.1. Definition of a Mining City’s Life Cycle

Theory of Urban Life Cycle

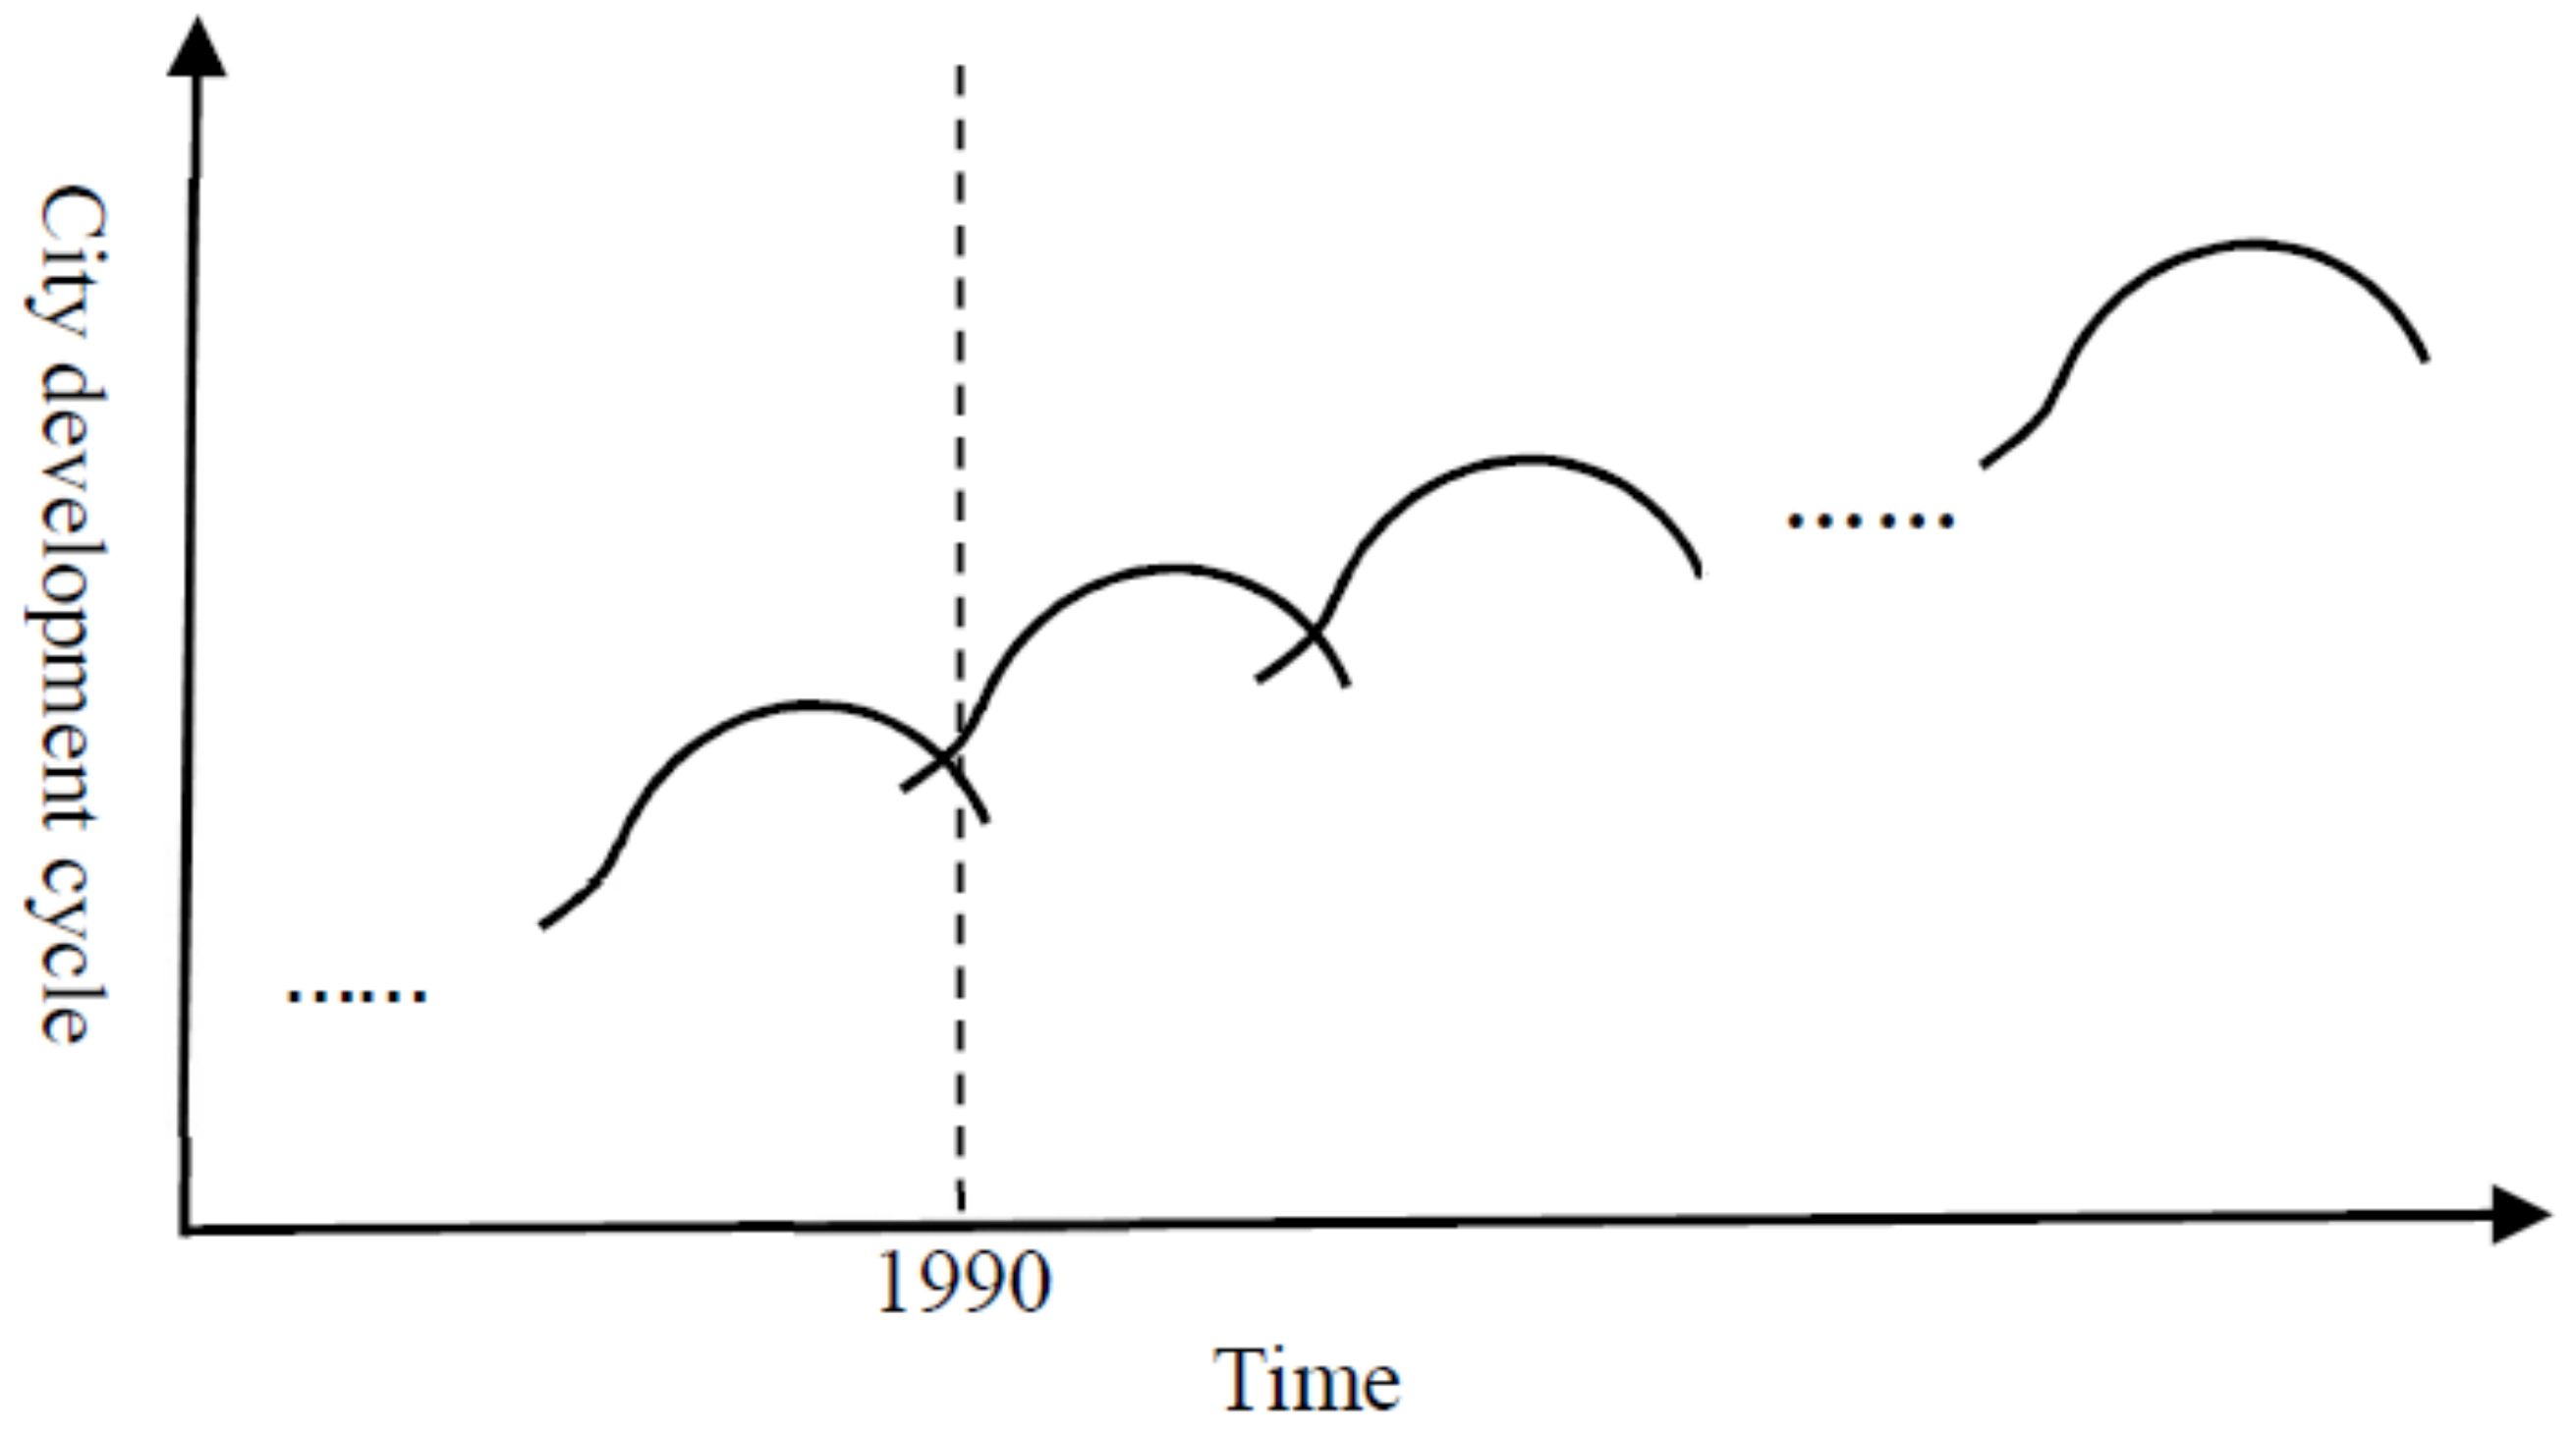
The theory of urban life cycle was proposed by Luis Suazervilla, who argued that, like living creatures, cities experience different development stages, such as birth, growth, development, and decay [34]. Since each stage is characterized by different leading factors, the development of cities is an upward spiral process; every individual stage experiences its own complete S-shaped life cycle of “birth, growth, development, and decay” [35] (Figure 3). In addition, when the development of cities cannot progress to the next cycle, cities will continue to decline; when new factors invade or substitute the preceding leading factors, cities will be transformed. These new factors that influence urban transformation may be newly discovered resources or some form of human intervention.
Since Jixi City was founded in 1956, it has been among the leading coal-exporting cities. At the end of the 1980s, China’s coal industry began to suffer from the “coal fault”; coal shortages were widespread, which greatly hindered mining cities’ economic development. During this period, as mines were dug deeper, coal mining in Jixi declined fast and the industrial chain shortened, decreasing the economic benefits of mining. Since the 1990s, the Jixi municipal government has transformed its development strategy, changing the way mineral resources are utilized, promoting various coal industry reforms, solving a series of problems that caused drastic cycles, and restraining the city’s economic development. In this way, they brought the city to a new stage of its development. Therefore, this paper chooses 1990 as the starting year in analyzing Jixi City’s new development cycle stage (Figure 3).

Features of a Mining City’s Life Cycle Stages

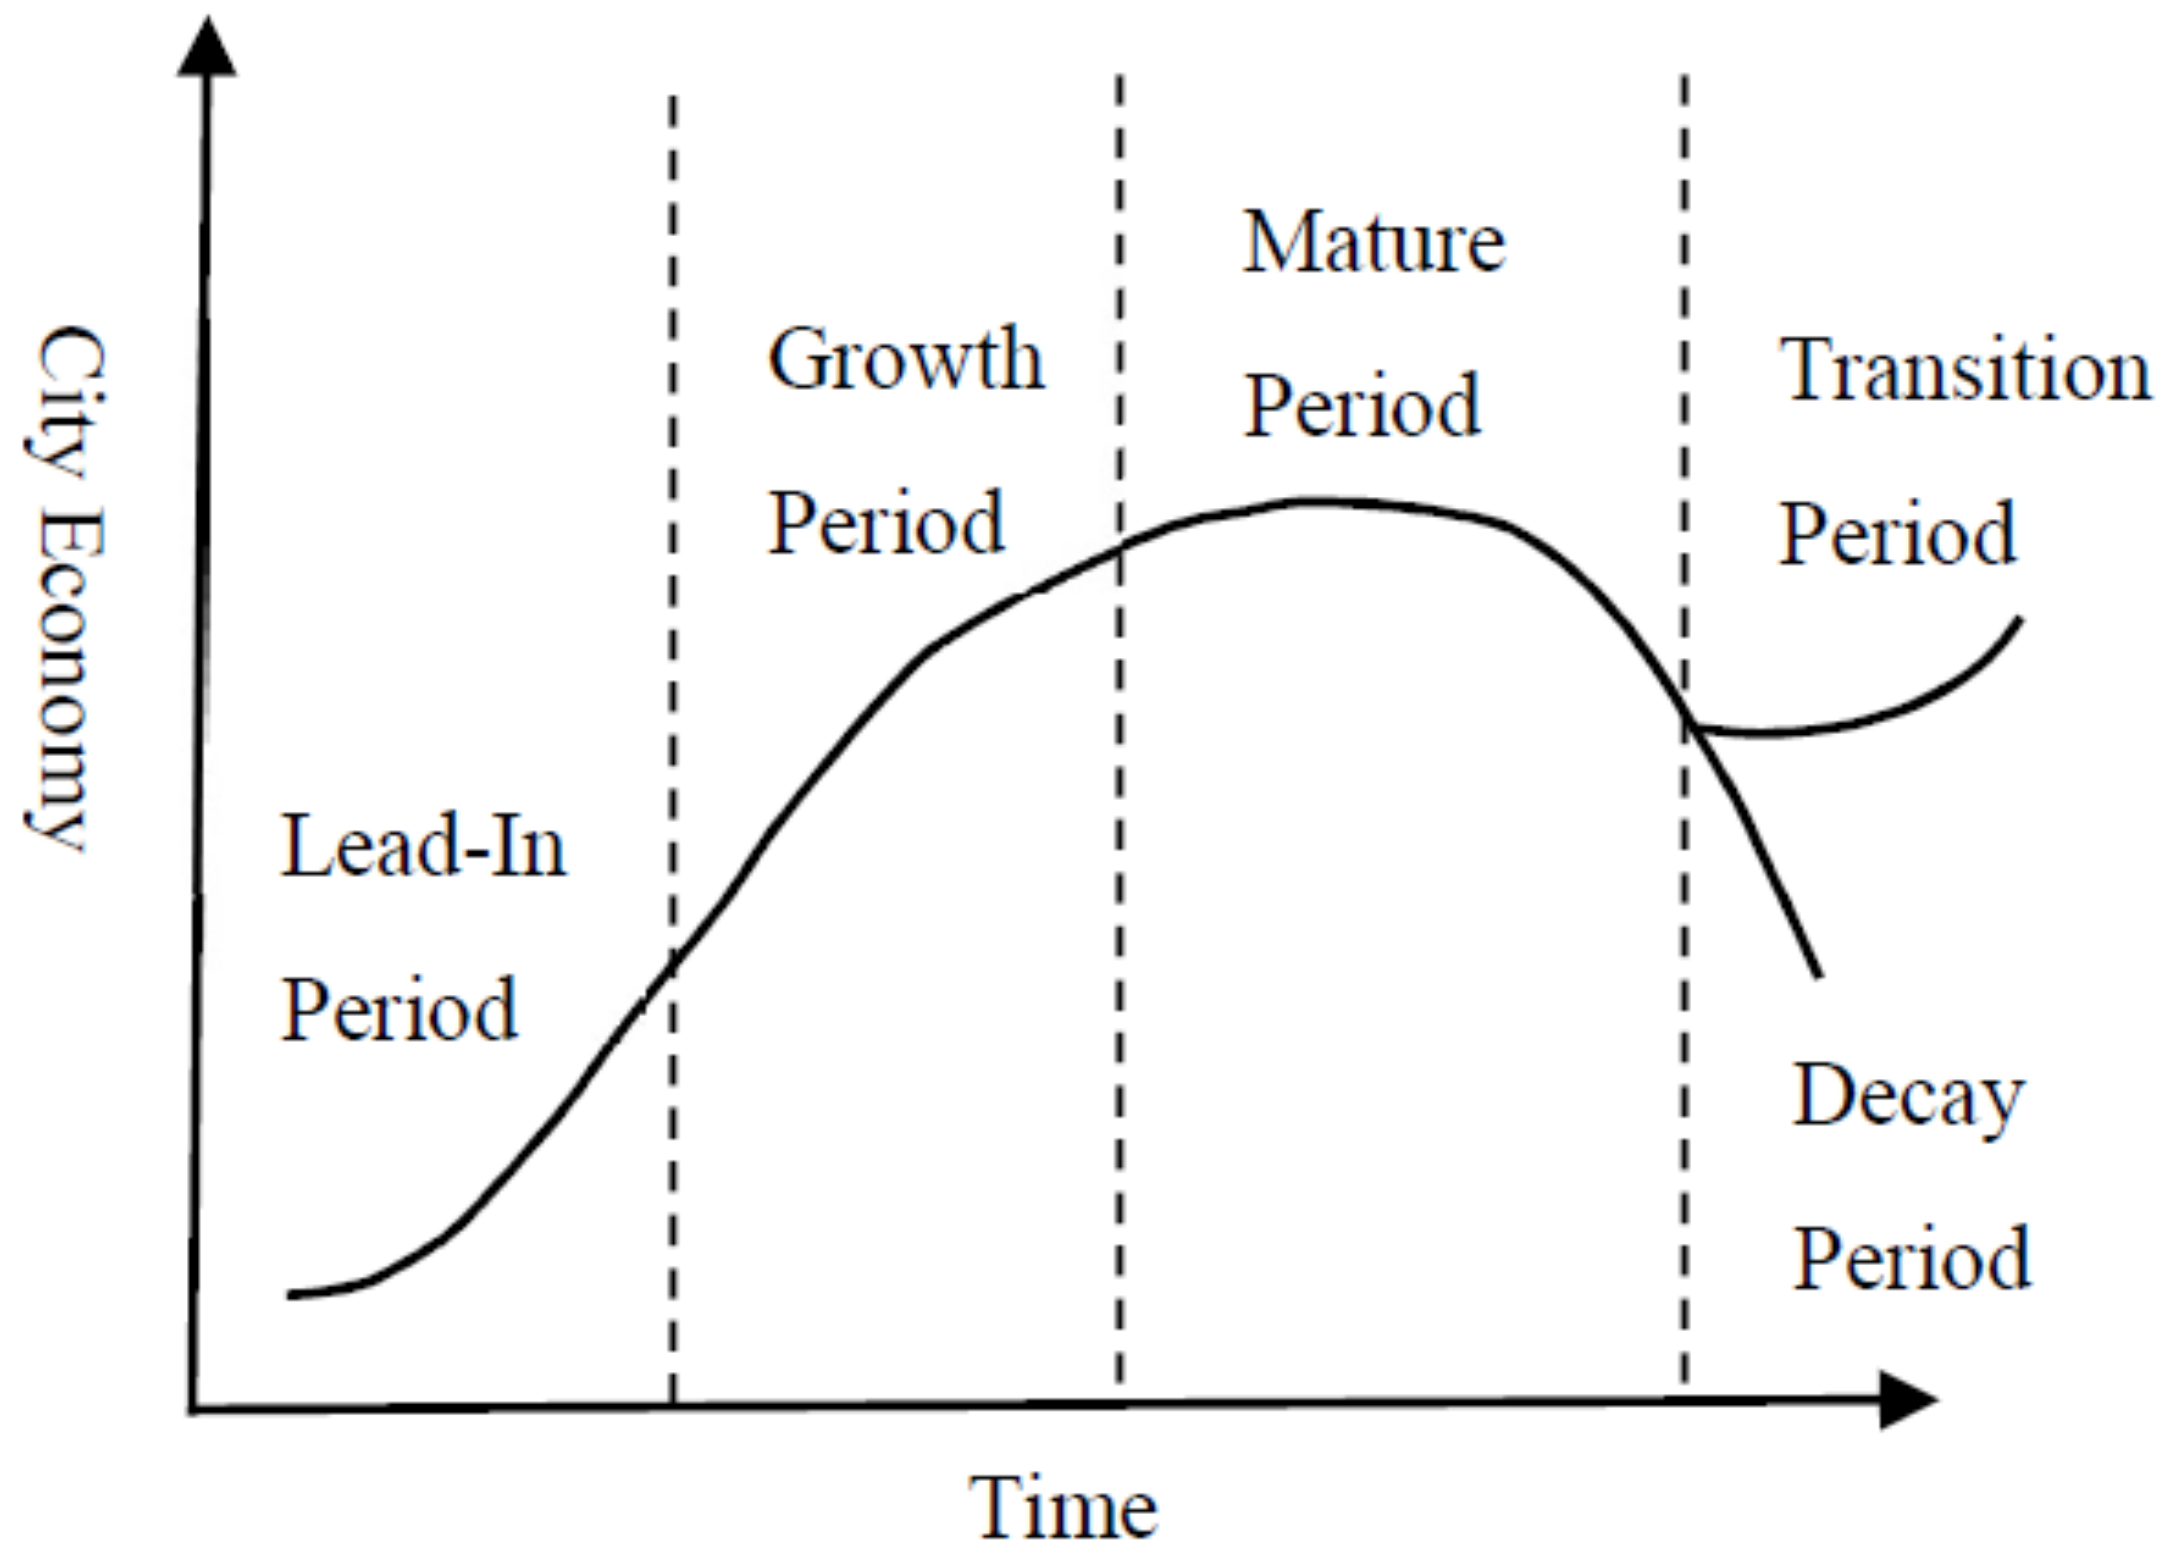
The development of mining cities conforms to both the general development law of cities while also having its own specific features [35]. Much research has indicated the obvious cyclical features of the coal industry [36,37,38,39,40], including four stages: birth, growth, maturity, and decay. Since the lifecycle in mining cities is closely related to that of the coal industry, mining cities also show an evident cyclical development, which also generally involves four periods: lead-in, growth, maturity, and transition or decay (Figure 4).
To define the different stages in the mining city development lifecycle, the key features for each stage should be taken into consideration. Based on the existing research [3,41,42,43,44], we developed an indicator system for mining cities’ lifecycle (Table 1). These indicators are classified as three types: mining scale, economic growth capacity, and employment level. Generally speaking, at the beginning of mining cities’ development, the production ratio is low, the proportion of mining-related output in GDP increases steadily, and thus the economic growth capacity and employment level rise in parallel. When mining cities develop into a certain stage, the mining industry becomes the pillar industry, the proportion of mining-related output in GDP is relatively steady, and the economic growth capacity and employment level remain relatively stable. As the coal resource is exhausted, the driver of the city’s development declines, the proportion of mining-related output value in GDP decreases, and the employment level declines too. Developing alternative industries and decreasing resource dependency are then prioritized to maintain the economic growth capacity and employment level. The varying features of the indicators in each stage are shown in Table 2.
Figure 5 shows changes in Jixi’s industrial indicators. According to Figure 5a, from 1990 to 1998, raw coal production rose, fell, and then rose again, with a relatively large variation range. From 1998 to 2012, raw coal production remained relatively steady with a slight rising tendency. From 2012 to 2016, the general trend of “four years’ hardship” in China’s coal industry saw raw coal production in Jixi continuously decrease. From 2016 to 2020, Jixi’s government optimized and adjusted the spatial structure of the mining industry and transformed and upgraded the mining methods, so that the output of raw coal tended to stabilize. Figure 5b shows that the proportion of industrial output in GDP showed a declining trend from 1990 to 1998. From 1998 to 2009, the proportion tended to remain steady before rising. From 2009 to 2016, the proportion kept declining. From 2016 to 2020, the proportion stayed steady.
Changes in GDP and GDP growth rate as well as the changing share of primary, secondary, and tertiary industries are shown in Figure 6. Figure 6a,b show that from 1990 to 2002, the GDP growth rate remained steady. From 2002 to 2012, GDP kept increasing. From 2012 to 2016, GDP declined significantly, and the growth rate dropped below zero. From 2016 to 2020, GDP recovered gradually and began to increase slowly. Figure 6c shows that from 1990 to 1998, the output values in all three industries were close and all increased slightly. From 1998 to 2009, their output value increased rapidly, though secondary industry fell behind the other two. From 2009 to 2012, secondary industry’s growth accelerated, and its output value was clearly above the other two. From 2012 to 2016, second industry’s output declined greatly while the growth rate of the first and tertiary industries also tended to slow down. From 2016 to 2020, the output value in all three industries kept relatively steady.
According to the statistical indicators of employment level in Figure 7, from 1990 to 2000, the proportion of mining staff changed greatly; with continual technology upgrading, the proportion tended to decline and the number of mining workers decreased constantly. From 2000 to 2008, the employment level in Jixi remained relatively steady. From 2009 to 2015, the proportion of mining staff maintained basically at the same level after a sharp rise. Since 2016, the proportion of mining staff has gradually declined and the number of mining employees showed the same trend.

Inflection-Point-Based Definition of a Mining City’s Lifecycle

During the process of a city’s development, there are relatively clear inflection points, that is, a time or period where quantitative change turns into qualitative change. These inflection points may occur in specific periods when key factors are changing [45]. In Jixi, the lifecycle influencing indicators show certain obvious inflection points in various stages of Jixi’s urban development (Table 3).
This study took 1998, 2009, and 2016 as the inflection point for different stages of Jixi’s urban lifecycle. The lead-in, growth, mature, and transition stages of urban development came during the periods from 1990 to 1998, 1998 to 2009, 2009 to 2016, and 2016 to 2020, respectively.

2.3.2. Optimum Analytical Grain Size of Landscape Patterns

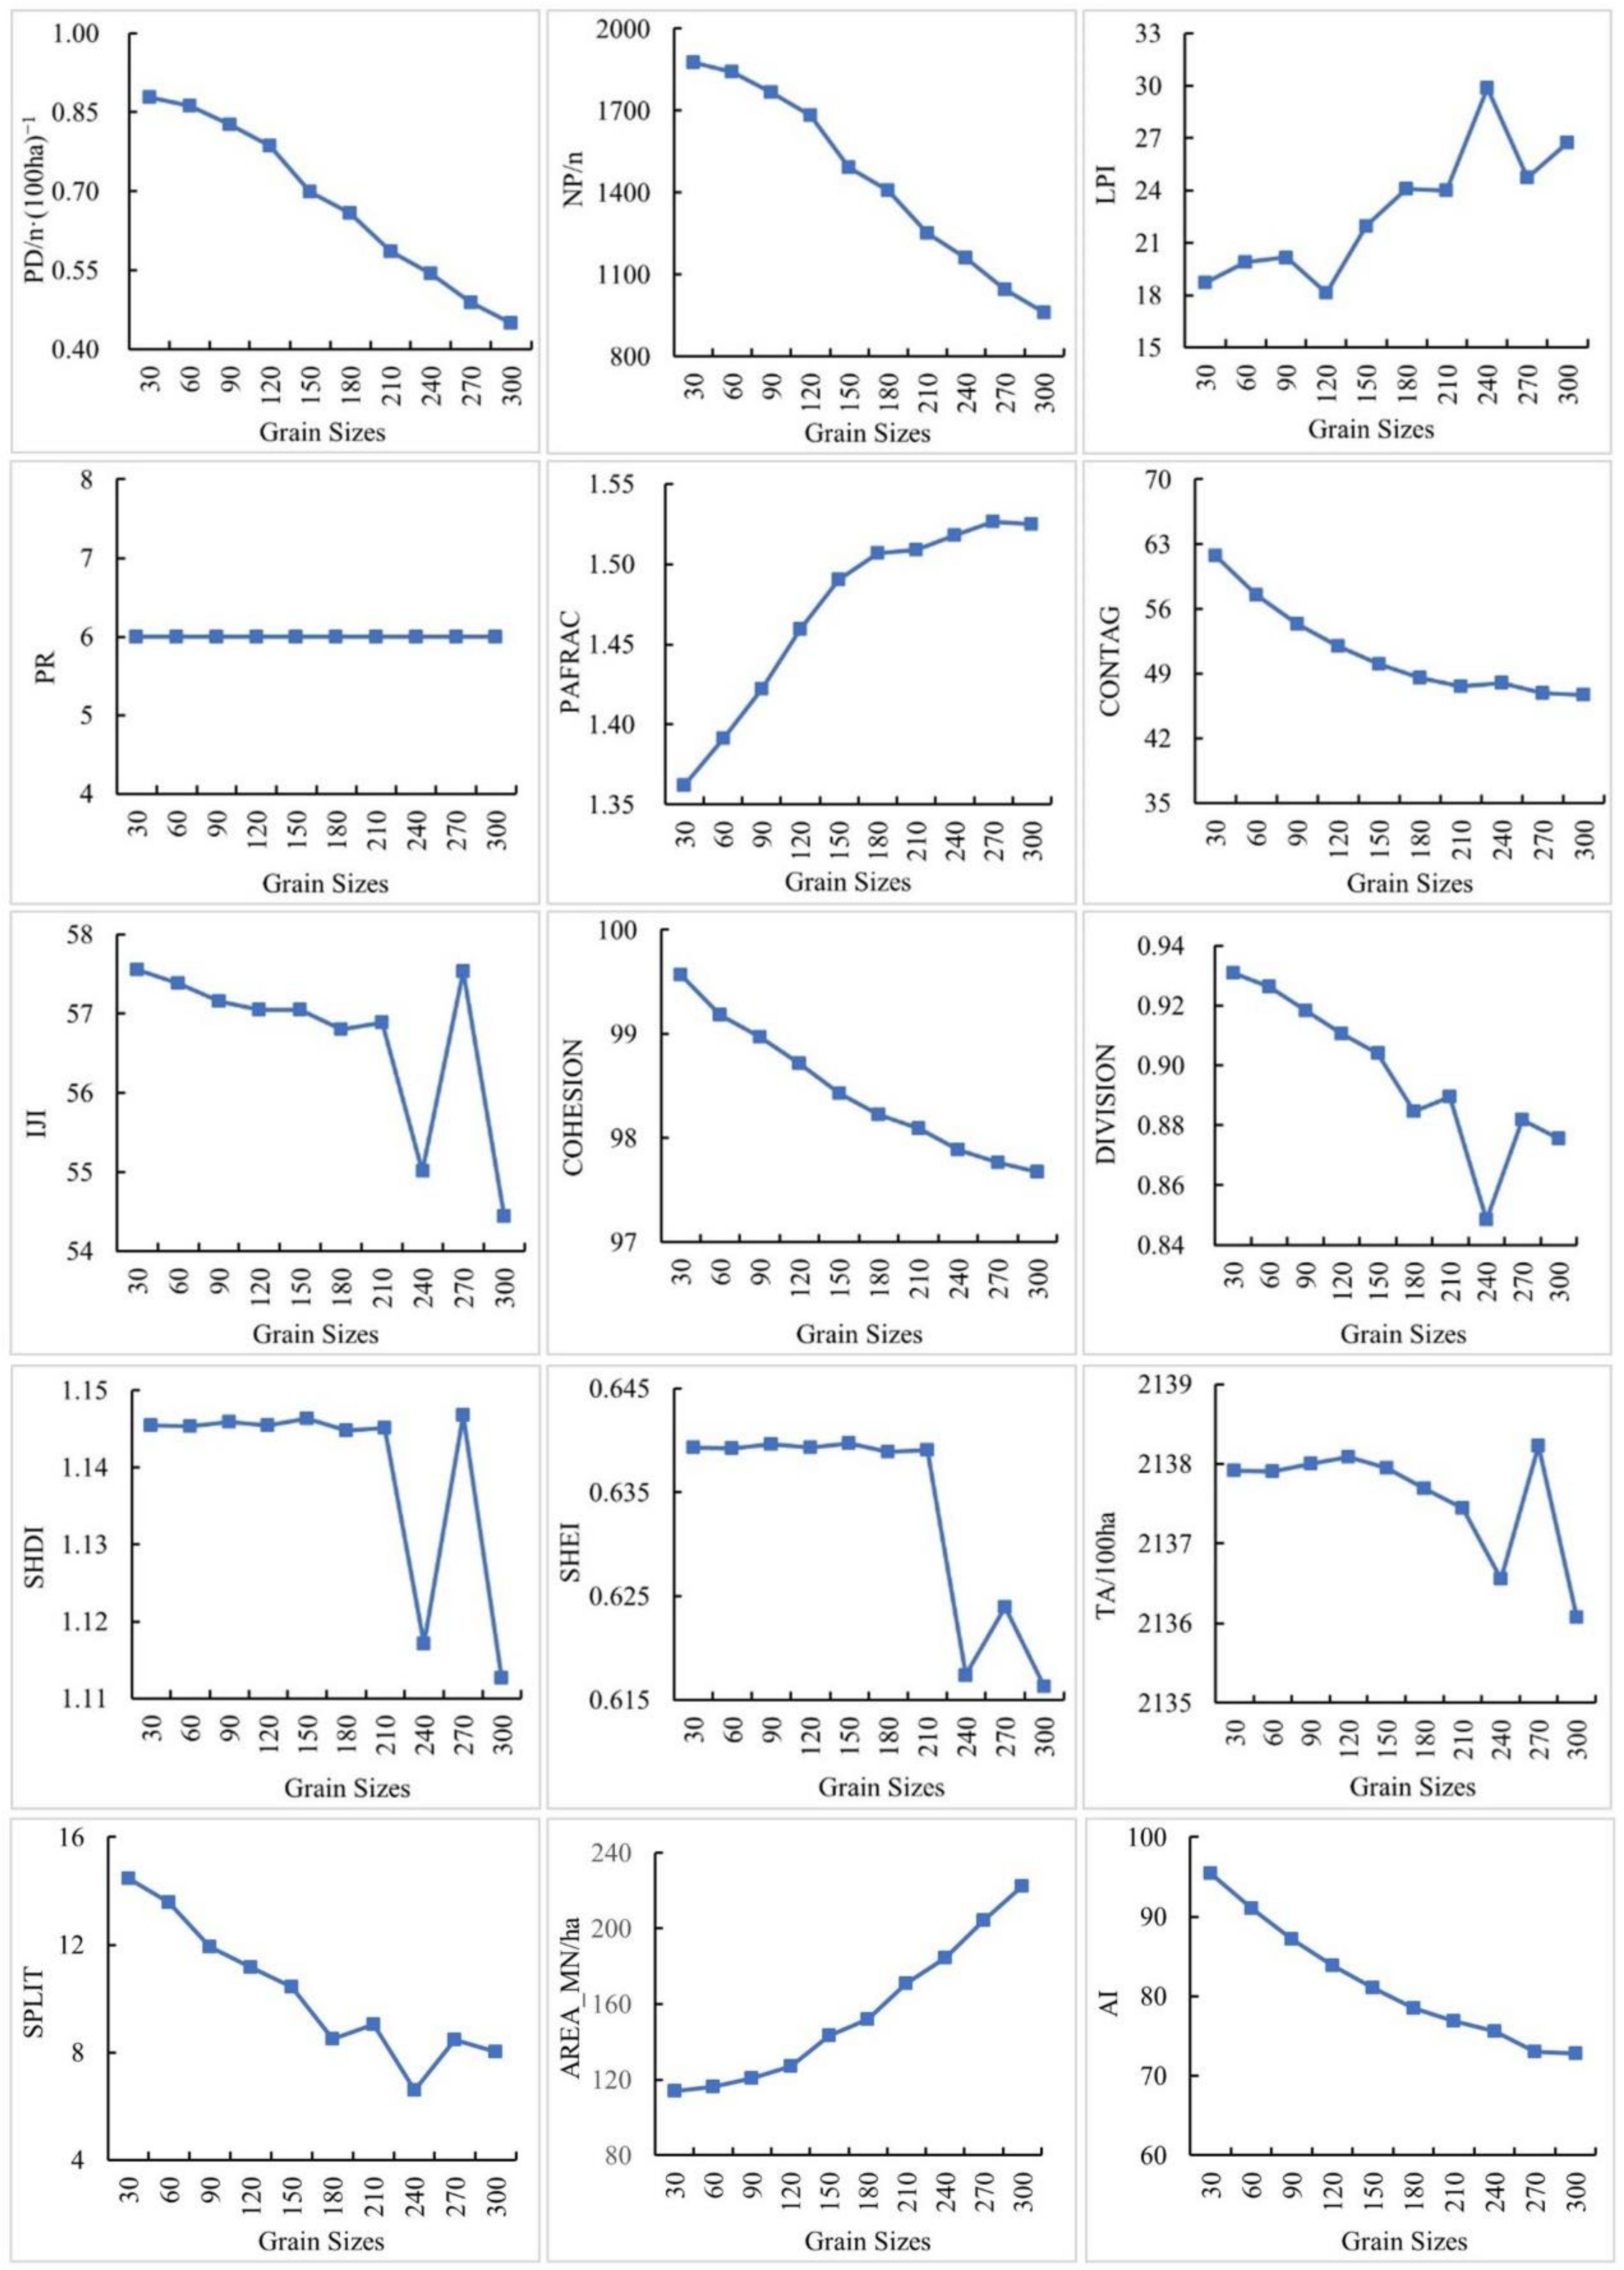
Landscape pattern indexes refer to highly concentrated landscape pattern information; they are simple quantitative indexes that reflect features of landscape structure and spatial allocation. This study selects 15 indicators that can reflect the changes of landscape pattern in mining cities, including terrain area (TA), patch number (NP), patch density (PD), largest patch index (LPI), mean patch area (AREA_MN), fractal patch (PAFRAC), contagion index (CONTAG), interspersion and juxtaposition index (IJI), cohesion index (COHESION), division index (DIVISION), split index (SPLIT), patch richness (PR), Shannon’s diversity index (SHDI), Shannon’s evenness index (SHEI), and aggregation index (AI). In determining these indexes, the choice of grain size has a decisive effect [46,47,48]. We determined the optimum analytical grain size based on an analytical approach to the way that grain size affects landscape pattern indexes and by using the information loss method.

Analysis of Landscape Index Grain Size Effect

In this paper, land use raster maps with landscape grain sizes of 60 m, 90 m, 120 m, 150 m, 180 m, 210 m, 240 m, 270 m, and 300 m are extracted based on 30 m resolution data. The software FragStats4.2 is used to calculate the selected index and establish a curve of the relation between different grain sizes and the various landscape indices. According to Figure 8, LPI, PAFRAC, IJI, DIVISION, SPLIT, SHDI, SHEI, and TA all show obvious turning points. Through the analysis, it was found that the turning points of these eight landscape indicators are 90 m, 120 m, 150 m, 180 m, 240 m, and 270 m. Within the grain size scale with respect to turning points, the variation of landscape pattern indexes tends to be steady and can effectively reflect the features of the regional landscape pattern. Compared with the small-scale data, the minimum patch area of the large-scale data is smaller. At the early stage of the increase in grain size, the loss of information is higher than that of the small-scale data, which leads to the arrival of the first scale inflection point earlier. Correspondingly, the information loss rate of the small-scale data is relatively low, and the inflection point of the first scale also arrives relatively late. However, as the grain increases further and the information continues to be lost, the accuracy of the two data is basically the same. At this time, the landscape index value is mainly affected by the grain size. Since the landscape pattern in the first grain size zone shows the most scale feature information and offers a better study scale [48], this paper chooses 90–120 m as the optimum grain size zone for analysis.

Information Loss Method for Defining the Optimum Grain Size

When statistics are converted according to different grain sizes, landscape area, perimeter, and patch index information will be lost and thus the calculated landscape index will not reflect the reality of the landscape pattern [48]. Therefore, this study identifies index loss for all these grain sizes to evaluate their loss of accuracy. The formula is as follows [49]:
M = i = 1 n A g i A b i , i = 1 , 2 , 3 , , n
P = 100 × M A b
In this formula, M is information loss; A g i is the value of Number i in the landscape grid map; A b i is the value of Number i for landscape basic data; n is the number of landscape types; A b is landscape basic data; and P is accuracy loss.
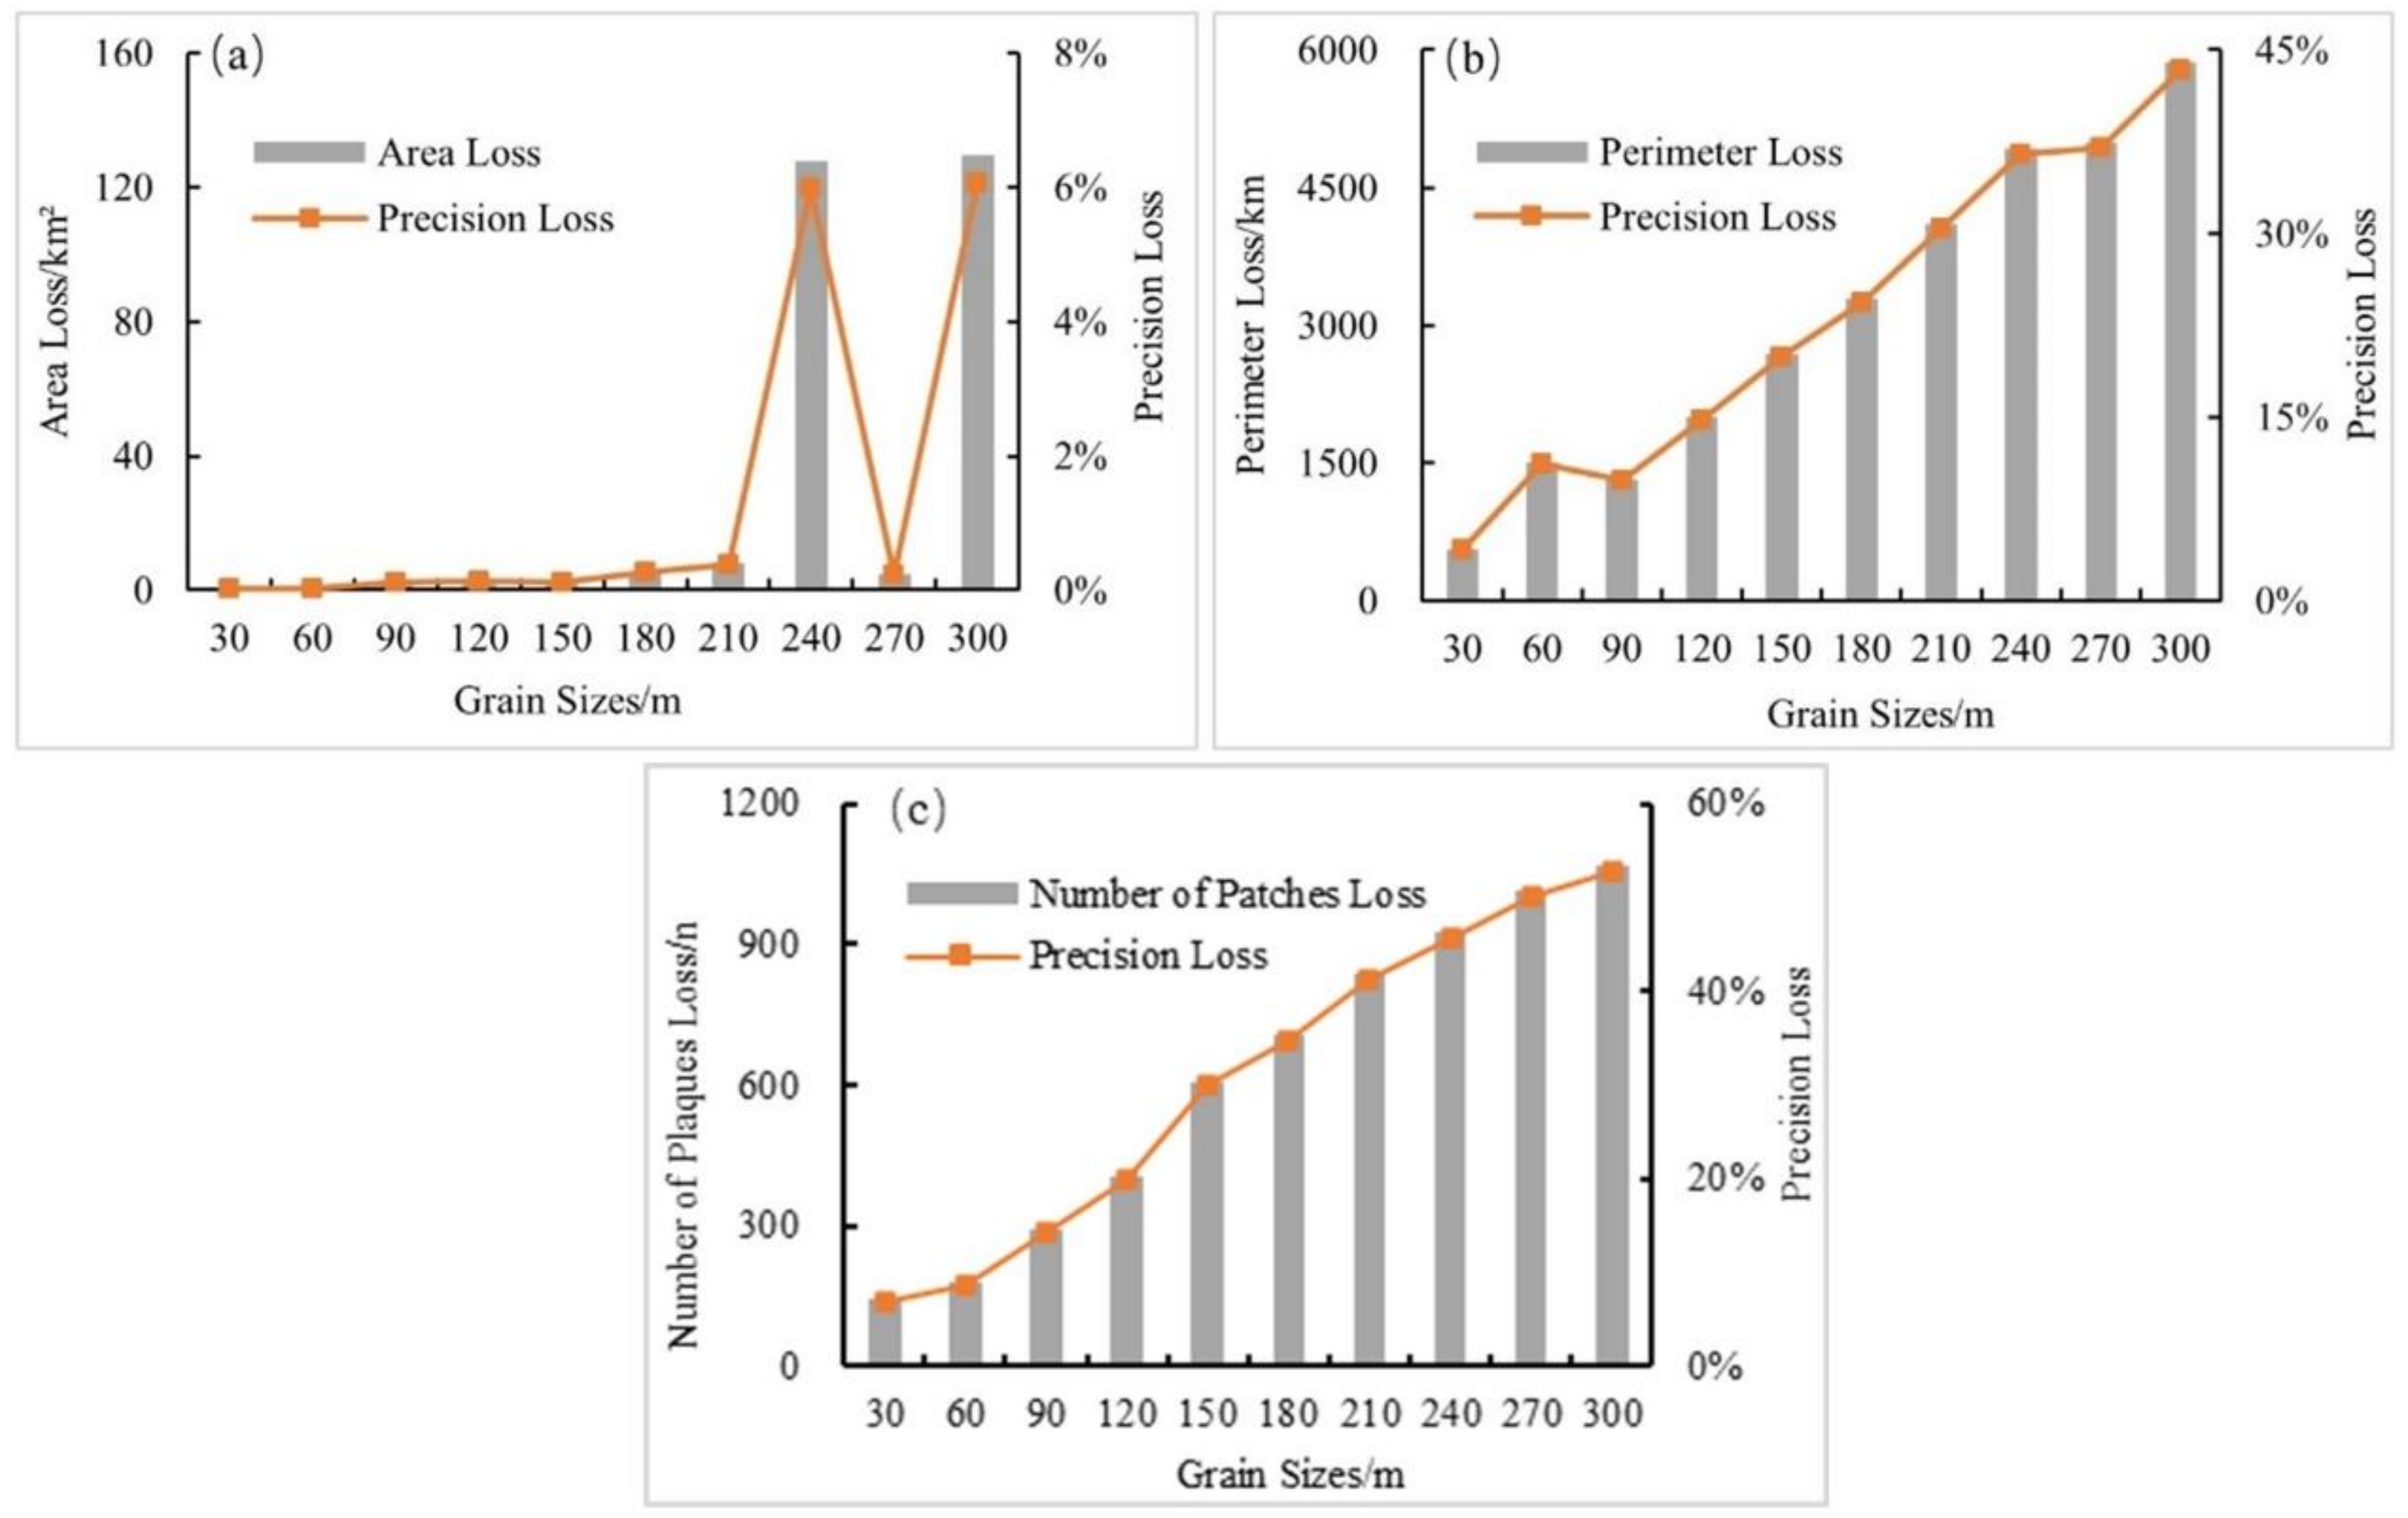
The index information loss with different grain sizes is shown in Figure 9. According to the area loss in Figure 9a, area loss reaches its lowest point at 30–210 m and 270 m. According to the perimeter loss in Figure 9b, with increased grain size, perimeter loss shows an overall increasing trend; the lowest points are at 30 m and 90 m. According to patch loss in Figure 9c, with increased grain size, patch loss gradually rises. Through comparing and analyzing the information loss of the three indexes with different grain sizes, and combined with the optimum grain size zone (90–120 m), 90 m was determined as the optimal grain size for landscape pattern analysis in Jixi City.

3. Results and Analysis

In order to reveal the way that Jixi’s landscape pattern has changed at various stages, this study takes the mining city development life cycle defined above as a framework. We examine variations at landscape-type level and general evolution features at the landscape level based on the framework’s developmental stages.

3.1. Features of Landscape Pattern Evolution at the Type Level

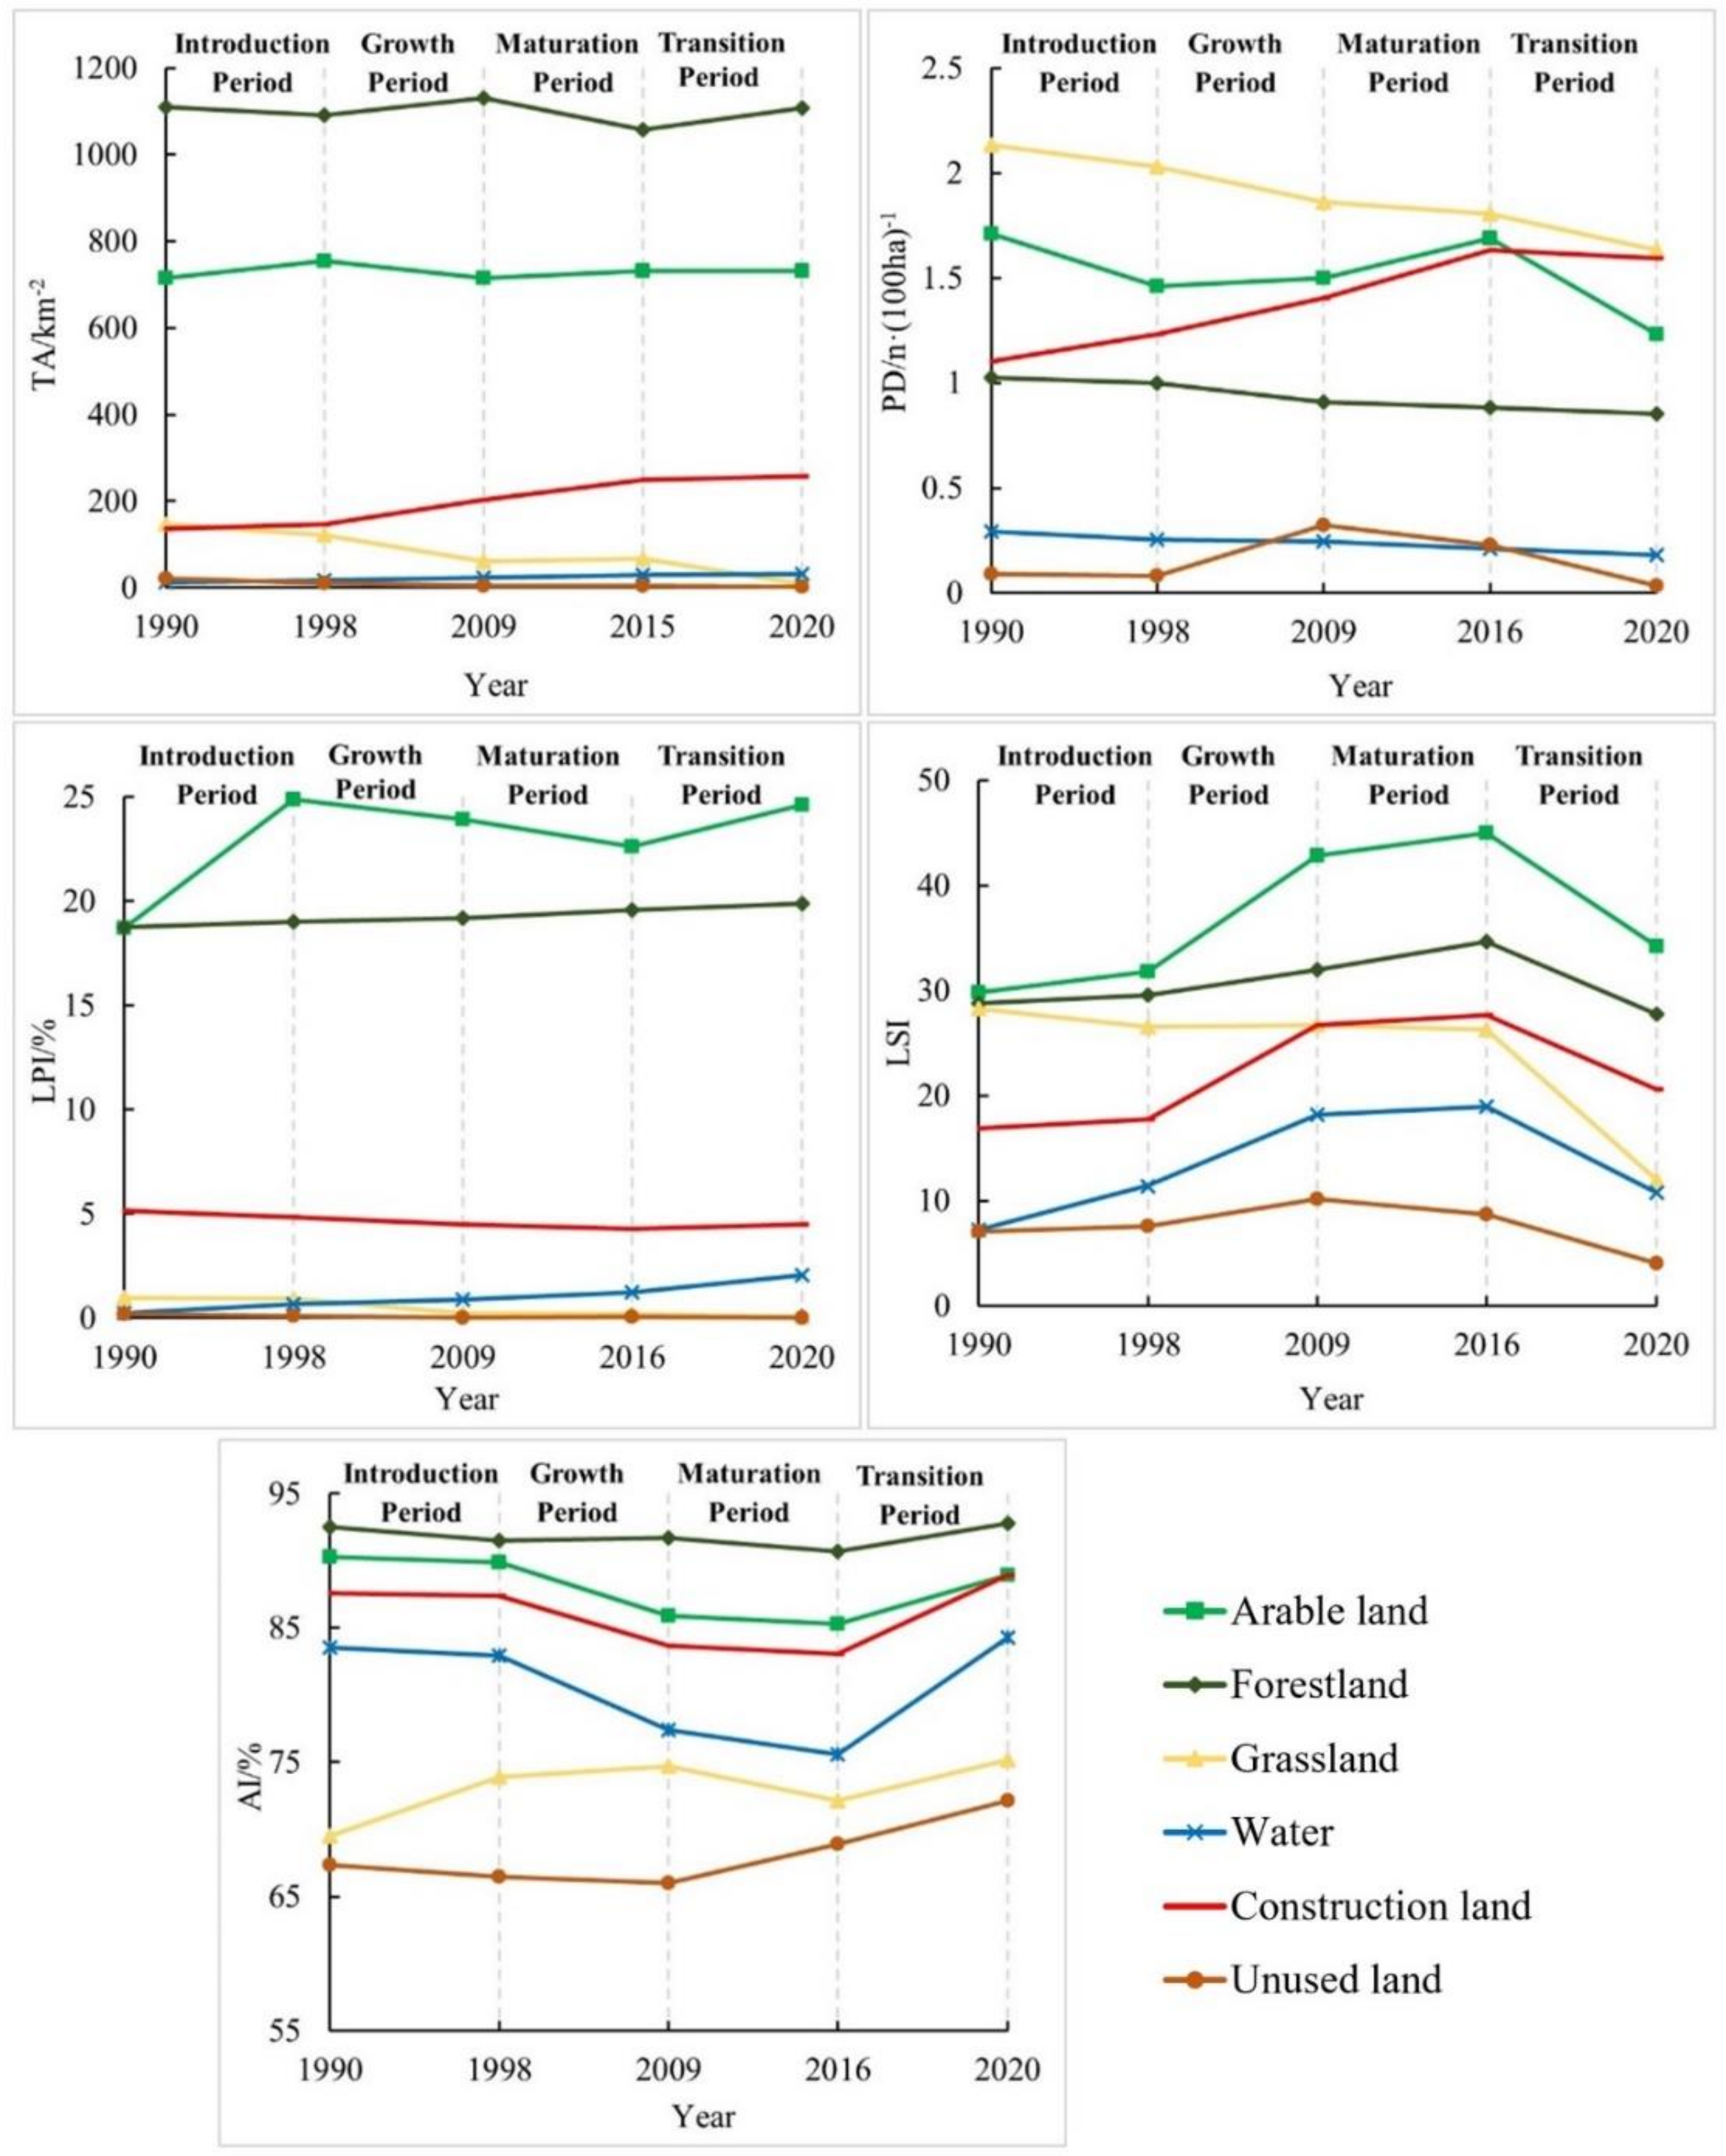
The landscape pattern index results in the study zone at various levels are shown in Figure 10. As a whole, the index of TA, LPI, LSI, and AI for arable land and forests are clearly higher than that of other landscape types in the past 30 years. This indicates that arable land and forests are the most widespread landscape type in the study zone; their distribution is concentrated and continuous, and the aggregation degree and complexity of the patch shapes are relatively high. The urban landscape area keeps increasing and it is the third most prominent landscape type in the study zone. The continuous rise of PD shows that the degree of urban fragmentation gradually intensifies. Meadows, forests, and bodies of water have shown a continuous clustering tendency. Furthermore, the LSI of all landscape types shows a similar tendency to the urban development cycle, indicating that urban development is positively related with the complexity of landscape forms. AI shows the opposite tendency of the urban development life cycle, indicating that urban development is passively related with landscape aggregation level. In the following, we present analyses of various landscape evolution features according to the different stages of urban development.
In the lead-in stage of urban development, arable land area clearly increases, the PD index declines significantly, and the LPI index increases significantly, indicating that human activities have a stronger influence on agriculture. The urban landscape area grows slightly but the rising PD index reflects increased urban fragmentation. Since meadows and forests are the main land source that can be transformed to enlarge the urban area and arable land, their area decreases slightly at this stage. Additionally, the rising PD index and falling AI index both illustrate the gradual concentration of meadow landscape. In summary, in the lead-in stage of mining cities, mining industry development drives population growth and increases the need for agricultural land. Accordingly, Jixi City increased its arable land by implementing a “requisition-compensation balance” policy. Meanwhile, since urban land in mining cities tends to be constructed around the mining area and urban development in this stage is slow, the randomness of mining area distribution hinders the concentration of urban spatial development.
In the growth stage of urban development, declining arable areas and increasing forested areas decrease the arable landscape’s LPI and AI index and raise its PD and LSI index. This reflects that the fragmentation of arable landscape is rising and its spatial distribution is becoming more complex. The urban landscape area keeps expanding, but its LSI and PD indexes rise and AI index declines. Generally, expanded landscape area raises landscape concentration; the unusual increased fragmentation of urban landscape in this stage illustrates that urban land expansion is usually in the form of exclaves. Meadow landscape area decreases greatly; this is the main landscape type being encroached on. The rising PD and LSI indexes and falling AI index of bodies of water reflect that bodies of water are becoming discrete and irregular. The rising PD and LSI index and falling area of unutilized land illustrate the original contiguous unutilized land area has been replaced by other types of landscape and small areas of new unutilized land appear. In summary, in the growth stage of a mining city’s development, rapid urban development and greatly increased demand for land raise the land utilization rate but wasteland resulting from mining begins to appear. Furthermore, mining land encroaches on arable land, and, affected by Grain for Green policies, arable landscape is destroyed or transformed. Large areas of land subsidence caused by mining lead to sporadic pool zones. That sustained increase of mineral deposits leads to the decentralized growth in urban landscape, causing urban land to be uncentralized.
In the mature stage of urban development, though the fragmentation degree of arable land increases further, the rise of its LSI index slows down, reflecting that the destruction of farmland has been controlled at this stage. Though urban landscape fragmentation increases, the basically steady LSI index reflects that urban expansion is showing a gradual regularization trend. The large decline in forest landscape area and deepening fragmentation and complexity reflect that forests are being encroached on irregularly by other types of landscape. The PD of bodies of water and unutilized land decrease, while LSI tends to be stable, reflecting the regular development of the landscape pattern. In summary, in the stage of mature development in mining cities, the mining industry has formed its optimal scale and socioeconomic growth is fast and stable; however, various landscape types still tend toward fragmentation and irregularity. Nonetheless, with the gradual completion of urban facilities, urban and mining areas tend to remain stable in size. Under the influence of policies aiming at land reclamation and economic and intensive land use, urban spatial pattern variations are relatively stable.
In the stage of urban transition, the forest landscape area gradually recovers and the urban landscape area and bodies of water increase slowly. The rising LPI index of arable land and bodies of water shows that these two landscape types receive more attention. Furthermore, the falling PD and LSI indexes and rising AI index of all landscape types indicate that all landscapes patches gradually begin to integrate and aggregation rises. In summary, urban economic decay stimulates attention on intensive and economic land utilization, industrial agglomeration, and scientific reallocation of land. The industrial transition aims to transform extensive resource exploration into scientifically driven, green mining, thus reducing the destruction of the ecosystem, increasing the areas of forest and bodies of water, and substantially integrating arable patches. Instead of blindly expanding, the urban spatial pattern will significantly improve the contiguity of urban land through filling development.

3.2. Features of Landscape Pattern Evolution at the Landscape Level

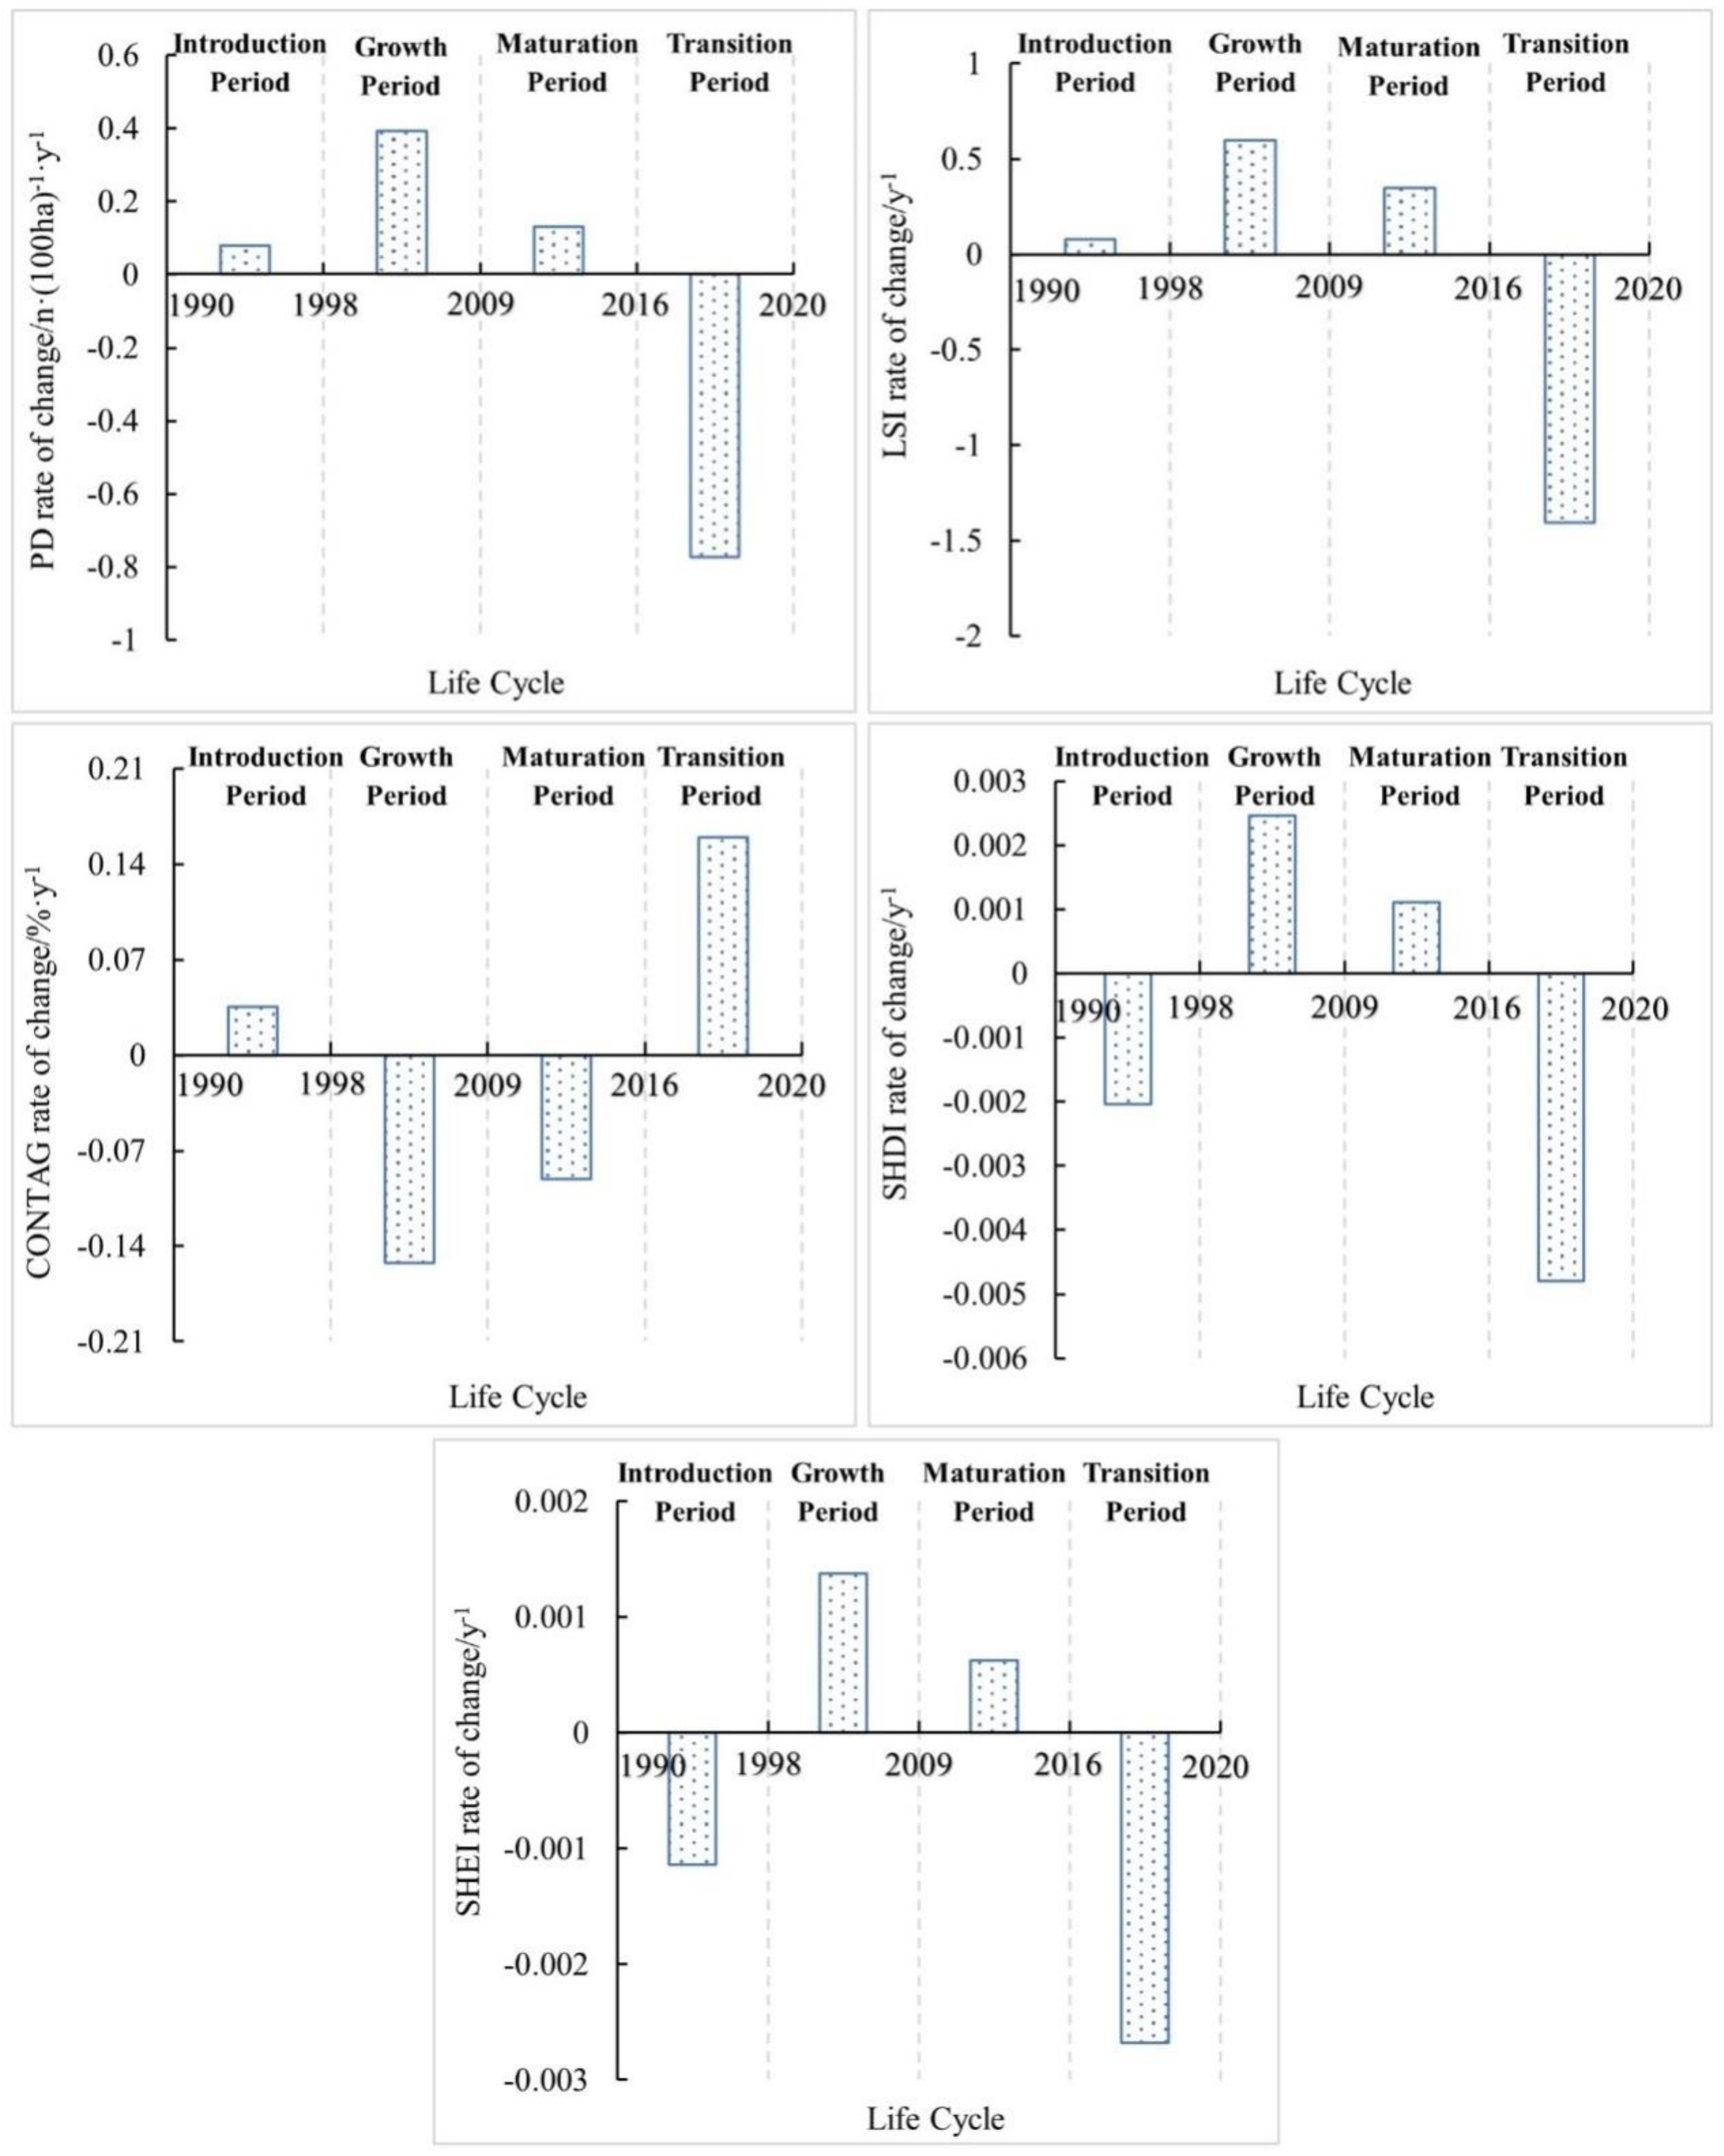
This paper uses PD index to represent the fragmentation degree, LSI index to represent regularity degree of landscape shapes, CONTAG to represent landscape extension and aggregation extent, and SHDI and SHEI indexes to represent landscape diversity. The calculations of landscape pattern index at the landscape level are shown in Table 4; the annual change rate of landscape indexes in various urban development stages is shown in Figure 11. In the following, we analyze landscape pattern evolution features in different stages of the urban lifecycle.
In the lead-in stage of a mining city’s development, the change rate of PD, LSI, and CONTAG indexes all rise slightly while the SHDI and SHEI indexes both fall. Cities develop slowly in this stage. Despite the appearance of coal-dependent urban land, it only expands slightly, and human activities have less influence on the overall landscape, and there is no obvious landscape fragmentation trend. Meanwhile, people focus more on agricultural activities such that the large area of contiguous arable land is utilized. Increased arable landscape aggregation contributes to good connectivity of dominant landscapes and reduces landscape diversity.
In the growth stage of a mining city’s development, the change rates of PD, LSI, SHDI, and SHEI indexes all increase greatly while the CONTAG index falls greatly. Evidently, cities develop faster in this stage. Increasing demand for coal leads to more intense mining activities. Urban land expands extensively, and human activities cause obvious damage to forests, meadows, and bodies of water, thus itensifying urban landscape fragmentation and increasing its diversity.
In the mature stage of a mining city’s development, the trend direction of all landscape indexes remains the same as that of growth stage, but the trend decelerates. In this stage, urban development enters a stable development period. Urban facilities are gradually completed, the urban landscape scale has been thoroughly developed, and the influence of human activity on the landscape gradually weakens. Meanwhile, government environmental protection and urban planning policies also improve the overall landscape pattern to some extent.
In the transition stage of a mining city’s development, the change rates of PD, LSI, SHDI, and SHEI indexes all fall drastically while the CONTAG index rises significantly. Urban development in this stage focuses on industrial transition, and the damage caused by mining activity on the landscape gradually declines. Since much attention is placed on intensive and economic land use, urban patches agglomerate and arable patches are extensively integrated. The effects of governmental macro regulations become more evident. Land reclamation policies and the recovery of large arable land and forest areas strengthens the dominant landscape types.

4. Discussion

4.1. Problems in Different Stages of a Mining City’s Development

Overall, the landscape pattern of mining cities is characterized by high fragmentation, high complexity, and low connectivity [23,50,51]. However, the existing research adopts a subjective method to divide the analysis period of landscape pattern, which makes it difficult to summarize the evolution law of the landscape pattern of mining cities.
Our analysis reveals the significant changes in Jixi’s landscape pattern within the study period; the types of change at different stages can be clearly distinguished. This conclusion is consistent with that of another study [3]. The study analyzes the problems faced by mining cities at various development stages from the perspective of urban lifecycles. Related contents may contribute to developing more effective targeted urban planning schemes.
(1) In the lead-in stage, mineral resource exploration is still at an early stage and abundant ore resources are the main impetus for urban economic development. Driven by economic benefits, mineral resource exploration and mining expand fast, resulting in the emergence of many scattered parcels of mining and urban land. However, in this stage the sustainability of mineral mining and long-term urban development planning tend to be neglected. New urban facilities are constructed mainly to meet the needs of mining production, and the basic facilities of urban development often do not satisfy people’s needs; moreover, the processing and service industries that rely on coal industry develop slowly [52]. Furthermore, the increasing population intesifies attention on agriculture, but irrational land development causes soil erosion and densification problems.
(2) In the growth stage, the coordination between economic development and ecosystem protection is one of the main problems. Generally, increased mining activities damage the environment while also bringing economic development. This indicates the contradictory nature of economic growth and ecological protection [51]. Over a long period of coal mining and mineral exploration expansion, the ecosystem is damaged and geological problems become increasingly prominent. Meanwhile, the economic aggregation of the mining industry keeps rising and other forms of industry are passive. Less emphasis is placed on the tertiary industry, and the industrial structure is unbalanced. Furthermore, in this stage, scientifically informed urban planning is not given enough attention. The increasingly scattered urban landscape pattern continually reduces the efficiency of urban functionality, transportation capacity, and energy utilization.
(3) In the mature stage of a mining city’s development, where problems in every sector become prominent, government departments begin to implement policies to adjust the direction of urban development and confront specific problems, such as ecosystem damage, and the imbalanced industrial structure and spatial pattern are controlled to some extent. However, stable urban economic development discourages governments’ problem-solving initiatives. Due to a lack of future planning, passive implementation of regulatory measures fails to produce significant results. Therefore, the ecological environment in this stage has further deteriorated and the ineffective urban landscape pattern worsens.
(4) In the transition stage of a mining city’s development, with the decay of the mining industry, urban transition becomes an extremely urgent issue. First, the unitary economic structure leads to continual economical decline, an ever-increasing unemployment rate, and a lack of reemployment opportunities. Second, abandoned coal mines, land subsidence, and environmental pollution place intense pressure on urban ecological governance and restoration. This can lead to continuous population loss, difficuties in attracting talent, and an inability to attract foreign capital.

4.2. Proposals for Mining City Development

Due to the temporary nature of resource-based mining cities’ development, it is necessary to scientifically plan in advance such cities’ future development from the perspective of industrial transformation, aiming at urban ecological health and sustainable development. In what follows, we make some proposals for mining cities relating to each development stage.
(1) In the lead-in stage, mining cities should adopt economic development as their primary goal based on market demand. They should rationally plan exploitation intensity and investigate the service life of resources, and formulate a long-term mineral development strategy. Subsequently, they should vigorously develop urban infrastructure and construction, improve urban functions and facilities, and promote the intensive use of urban land. Furthermore, it is necessary to rationally plan mining blocks and set up ecological protection areas in order to avoid irrational development of cultivated land.
(2) Mining cities in the growth and maturity stages should formulate urban transformation strategies in advance. First, they should accelerate transformation and upgrading of traditional mining industry and improve the efficiency of exploitation and utilization to ensure stable production and reduce environmental damage. Second, they should adjust the mining-based industrial structure in advance and cultivate alternative industries. In a nutshell, mining cities in this stage should avoid short-sighted development guided by the pure exploitation of coal resources.
(3) In the transition stage, mining cities are burdened with serious socioeconomic issues. First, mining cities in the transition stage should strive to develop new industry, especially high-tech and tertiary industries, and reduce reliance on mining [53]. Second, they should support self-employment, encourage the development of small and medium-sized enterprises, and find ways to increase employment. Third, although the depletion of coal resources will indirectly promote the improvement of land environment [8], it is still necessary to reinforce land reclamation, as well as explore and reuse mining wasteland based on evaluations and optimized layout design. Last, they should strengthen ecological and environmental governance and improve living space to help control population loss and attract external investment.

5. Conclusions

Based on the theories of lifecycle and landscape ecology, the study takes Jixi, a typical mining city located in north-eastern China, as a case study, in order to analyze the features of landscape pattern changes in different stages of a mining city’s development. With that analysis in mind, we discuss problems relating to the development process and put forward some solutions.
The significant features of landscape pattern changes during mining cities’ development reflect three overall periods: (1) pell-mell development, (2) passive control, and (3) scientific planning. This study indicates that mining cities should carry out sustainable development planning from the perspective of industrial transformation, as soon as possible, to avoid urban decline caused by resource exhaustion. Meanwhile, given that variations in the main problems faced by mining cities in different periods, policies should have different orientations for each development stage in order to achieve evidence-based management and planning for mining cities.
In terms of limitations, there are many factors affecting the development of mining cities, and the index system constructed in this study has certain limitations such as urban population, fiscal revenue, population density, and so forth. Instead, we focus on existing problems, and analyze the synergic relationship among these indicators, aiming to clarify the function of each index on urban development. In this way, we aim to increase the reliability of defining each stage of mining cities’ lifecycles.

Author Contributions

Conceptualization, Y.S. and X.Y.; methodology, X.Y. and L.D.; software, L.D.; validation, X.Y., L.D. and S.L.; formal analysis, Y.S.; investigation, X.Y.; resources, Y.S.; data curation, L.D.; writing—original draft preparation, Y.S. and X.Y.; writing—review and editing, Y.S.; visualization, X.Y and T.D.; supervision, L.D. and G.W.; project administration, X.Y.; funding acquisition, Y.S. All authors have read and agreed to the published version of the manuscript.

Funding

This research was funded by the University Nursing Program for Young Scholars with Creative Talents in Heilongjiang Province, grant number UNPYSCT-2020032; the Compilation of Jixi mineral resources planning (2021–2025), grant number JXC(2020)0202/QSZB2020-040; the Compilation of Shuangyashan mineral resources planning (2021–2025), grant number SZCG20200146; and the Compilation of Qitaihe mineral resources planning (2021–2025), grant number YDZC-20097/QTHC(2020)0173.

Institutional Review Board Statement

Not applicable.

Informed Consent Statement

Not applicable.

Data Availability Statement

Not applicable.

Acknowledgments

We would like to thank the editors and anonymous reviewers for their valuable suggestions.

Conflicts of Interest

The authors declare no conflict of interest.

References

  1. Jing, G.; Peng, Y. Does Coal Mining Have Effects on Land Use Changes in a Coal Resource-Based City? Evidence from Huaibei City on the North China Plain. Int. J. Environ. Res. Public Health 2021, 18, 11616. [Google Scholar]
  2. Min, Z.; Jinman, W.; Feng, Y. Temporal and Spatial Change of Land Use in a Large-Scale Opencast Coal Mine Area: A Complex Network Approach. Land Use Policy 2019, 86, 375–386. [Google Scholar]
  3. Cao, Y.; Bai, Z.; Wei, Z.; Zhang, X. Analyses of traits and driving forces on urban land expansion in a typical coal-resource-based city in a loess area. Environ. Earth Sci. 2016, 75. [Google Scholar] [CrossRef]
  4. Haibin, L.; Zhenling, L. Recycling Utilization Patterns of Coal Mining Waste in China. Resour. Conserv. Recy. 2010, 54, 1331–1340. [Google Scholar] [CrossRef]
  5. Zhenhua, W.; Shaogang, L.; Qingwu, Y.; Zhengfu, B.; Qinging, L. Landscape Ecological Network Construction Controlling Surface Coal Mining Effect on Landscape Ecology: A Case Study of a Mining City in Semi-arid Steppe. Ecol. Indic. 2021, 133, 108403. [Google Scholar]
  6. Nguyen, T.A.; Le, P.M.T.; Pham, T.M.; Hoang, H.T.T.; Nguyen, M.Q.; Ta, H.Q.; Phung, H.T.M.; Le, H.T.T.; Hens, L. Toward a Sustainable City of Tomorrow: A Hybrid Markov–Cellular Automata Modeling for Urban Landscape Evolution in the Hanoi City (Vietnam) During 1990–2030. Environ. Dev. Sustain. 2019, 21, 429–446. [Google Scholar] [CrossRef]
  7. Dongmei, J.; Xiaoshun, L.; Yuexiang, W.; Zhengfu, B.; Jian, Z.; Fan, H. Coordinating Urban Construction and Coal Resource Mining Based on Equilibrium Value between Coal Reserve and Land Resource in Coal Cities. Geom. Nat. Hazards Risk. 2021, 12, 2865–2879. [Google Scholar]
  8. Wen, B.; Pan, Y.; Zhang, Y.; Liu, J.; Xia, M. Does the Exhaustion of Resources Drive Land Use Changes? Evidence from the Influence of Coal Resources-Exhaustion on Coal Resources–Based Industry Land Use Changes. Sustainability 2018, 10, 2698. [Google Scholar] [CrossRef] [Green Version]
  9. Dorner, B.; Lertzman, K.; Fall, J. Landscape Pattern in Topographically Complex Landscapes: Issues and Techniques for Analysis. Landsc. Ecol. 2002, 17, 729–743. [Google Scholar] [CrossRef]
  10. Cuiping, Z.; Jiaguo, G.; Qinghui, Z.; Miao, Y.; Ying, W. Landscape Pattern Evolution Processes and the Driving Forces in the Wetlands of Lake Baiyangdian. Sustainability 2021, 13, 9747. [Google Scholar]
  11. Migoń, P.; Latocha, A. Human Interactions with the Sandstone Landscape of Central Sudetes. Appl. Geogr. 2013, 42, 206–216. [Google Scholar] [CrossRef]
  12. Ramachandra, T.V.; Aithal, B.H.; Sanna, D.D. Insights to Urban Dynamics through Landscape Spatial Pattern Analysis. Int. J. Appl. Earth Obs. Geoinf. 2012, 18, 329–343. [Google Scholar]
  13. Aguilera, F.; Valenzuela, L.M.; Botequilha-Leitão, A. Landscape Metrics in the Analysis of Urban Land Use Patterns: A Case Study in a Spanish Metropolitan Area. Landsc. Urban Plan. 2011, 99, 226–238. [Google Scholar] [CrossRef]
  14. Qindong, F.; Liuke, L.; Hu, L.I. Gradient Analysis of Landscape Pattern in the Core Area of the “Zhengzhou and Kaifeng Integration” at the Landscape Level. An. Acad. Bras. Cienc. 2021, 93, e20181159. [Google Scholar] [CrossRef]
  15. Zhang, Z.; Bai, Z.; Fan, X.; Lu, Y.; Cao, Y.; Zhao, Z.; Sun, Q.; Pan, J. Urban Expansion Process, Pattern, and Land Use Response in an Urban Mining Composited Zone from 1986 to 2013. J. Urban Plan. Dev. 2016, 142, 04016014. [Google Scholar] [CrossRef]
  16. Zhou, L.; Zhang, D.; Wang, J.; Huang, Z.; Pan, D. Mapping Land Subsidence Related to Underground Coal Fires in the Wuda Coalfield (Northern China) Using a Small Stack of ALOS PALSAR Differential Interferograms. Remote Sens. 2013, 5, 1152–1176. [Google Scholar] [CrossRef] [Green Version]
  17. Ye, X.; Dong, L.; Lv, L.; Shang, Y. Spatiotemporal Evolution Law and Driving Force of Mining City Patterns. Environ. Sci. Pollut. Res. 2022, 29, 10291–10307. [Google Scholar] [CrossRef]
  18. Liu, X.Q.; Pei, T.; Zhou, C.H.; Du, Y.Y.; Ma, T.; Xie, C.J.; Xu, J. A Systems Dynamic Model of a Coal-Based City with Multiple Adaptive Scenarios: A Case Study of Ordos, China. Sci. China (Earth Sci.) 2018, 61, 15. [Google Scholar] [CrossRef]
  19. Sikuzani, Y.U.; Boisson, S.; Kaleba, S.C.; Khonde, C.N.; Malaisse, F.; Halleux, J.M.; Bogaert, J.; Kankumbi, F.M. Land Cover Dynamics around Mining Sites along Urban-Rural Gradient of Lubumbashi City (DR Congo) Description of the Subject. Biotechnol. Agron. Soc. Environ. 2020, 24, 14–27. [Google Scholar]
  20. Wu, Z.; Lei, S.; Lu, Q.; Bian, Z. Impacts of Large-Scale Open-Pit Coal Base on the Landscape Ecological Health of Semi-arid Grasslands. Remote Sens. 2019, 11, 1820. [Google Scholar] [CrossRef] [Green Version]
  21. Li, Y.; Liu, M.; Liu, X.; Yang, W.; Wang, W. Characterising Three Decades of Evolution of Forest Spatial Pattern in a Major Coal-Energy Province in Northern China Using Annual Landsat Time Series. Int. J. Appl. Earth Obs. Geoinf. 2021, 95, 102254. [Google Scholar] [CrossRef]
  22. Zhang, M.; Wang, J.; Li, S.; Feng, D.; Cao, E. Dynamic Changes in Landscape Pattern in a Large-Scale Opencast Coal Mine Area from 1986 to 2015: A Complex Network Approach. CATENA 2020, 194, 104677. [Google Scholar] [CrossRef]
  23. Zhengyu, D.; Jiashuo, C.; Yuandong, H. Spatial and Temporal Evolution of Landscape Pattern in Downtown Area of Jixi City, China. Eur. J. Remote Sens. 2020, 53 (Suppl. S1), 104–113. [Google Scholar]
  24. Balanay, R.M.; Halog, A. Promoting Life Cycle Thinking for Sustainability in the Mining Sector of the Philippines. Int. J. Life Cycle Assess 2017, 22, 1864–1874. [Google Scholar] [CrossRef]
  25. Ristimäki, M.; Junnila, S. Sustainable Urban Development Calls for Responsibility through Life Cycle Management. Sustainability 2015, 7, 12539–12563. [Google Scholar] [CrossRef] [Green Version]
  26. Vernon, R. International Investment and International Trade in the Product Cycle. Q. J. Econ. 1966, 80, 190–207. [Google Scholar] [CrossRef]
  27. Champion, A.G. Growth-Centers in the European Urban System; Hall, P., Hay, D., Eds.; Newcastle University: Newcastle upon Tyne, UK, 1981. [Google Scholar]
  28. Boix, A.P.; Llorach-Massana, P.; Sanjuan-Delmás, D.; Sierra-Pérez, J.; Vinyes, E.; Gabarrell, X.; Rieradevall, J.; Sanyé-Mengual, E. Application of Life Cycle Thinking Towards Sustainable Cities: A Review. J. Clean. Prod. 2017, 166, 939–951. [Google Scholar] [CrossRef] [Green Version]
  29. Czamanski, D.; Broitman, D. The Life Cycle of Cities. Habitat Int. 2018, 72, 100–108. [Google Scholar] [CrossRef]
  30. Cady Steven, H.; Wheeler Jane, V.; Schlechter Anton, F.; Goodman, S. A Proposed Theory Life Cycle Model: Standing on the Shoulders of Giants. J. Appl. Behav. Sci. 2019, 55, 418–452. [Google Scholar]
  31. Ebrahimi, S.M.; Koh, L. Manufacturing Sustainability: Institutional Theory and Life Cycle Thinking. J. Clean. Prod. 2021, 298, 126787. [Google Scholar] [CrossRef]
  32. Wiesel, I. Can Ageing Improve Neighbourhoods? Revisiting Neighbourhood Life-Cycle Theory. Hous. Theor. Soc. 2012, 29, 145–156. [Google Scholar] [CrossRef]
  33. Feng, Y.; Li, Z. Study on Mining City Development Based on Life Cycle Theory. In Proceedings of the International Conference on Engineering and Business Management, Chengdu, China, 24–26 March 2010. [Google Scholar]
  34. Suarez-Villa, L. Urban Growth and Manufacturing Change in the United States-Mexico Borderlands: A Conceptual Framework and an Empirical Analysis. Ann. Reg. Sci. 1985, 19, 54–108. [Google Scholar] [CrossRef]
  35. Song, Y.; Wang, S.; Wang, X.; Pang, R. Study on the Life Cycle and Evolution Law of Spatial Structure of Mining City. Hum. Geogr. 2012, 27, 54–61. [Google Scholar]
  36. Frondel, M.; Kambeck, R.; Schmidt, C.M. Hard Coal Subsidies: A Never-Ending Story? Energy Policy 2007, 35, 3807–3814. [Google Scholar] [CrossRef] [Green Version]
  37. Shahbaz, M.; Tiwari, A.K.; Jam, F.A.; Ozturk, I. Are Fluctuations in Coal Consumption Per Capita Temporary? Evidence from Developed and Developing Economies. Renew. Sustain. Energy Rev. 2014, 33, 96–101. [Google Scholar] [CrossRef]
  38. Zafrilla, J.E. The Mining Industry under the Thumb of Politicians: The Environmental Consequences of the Spanish Coal Decree. J. Clean. Prod. 2014, 84, 715–722. [Google Scholar] [CrossRef]
  39. Burchart-Korol, D.; Fugiel, A.; Czaplicka-Kolarz, K.; Turek, M. Model of Environmental Life Cycle Assessment for Coal Mining Operations. Sci. Total Environ. 2016, 562, 61–72. [Google Scholar] [CrossRef]
  40. Ming, T.; Wenqing, C.; Kemi, N.; Xu, Z.; Wenzhuo, C. Life Cycle Assessment of Underground Coal Mining in China. Sci. Total Environ. 2022, 805, 150231. [Google Scholar]
  41. Qian, Y.; Ralescu, D.A.; Zhang, B. The Analysis of Factors Affecting Global Gold Price. Resour. Policy 2019, 64, 101478. [Google Scholar] [CrossRef]
  42. Qiangyi, L.; Fu, Z.; Shanghui, L.; Mian, Y.; Fei, X. The effects of China’s sustainable development policy for resource-based cities on local industrial transformation. Resour. Policy 2021, 71, 101940. [Google Scholar]
  43. Xingcheng, G.; Jun, X.; Yong, X.; Xin, G.; Deyan, Y. Evaluation and Dynamic Evolution of Eco-efficiency of Resource-Based Cities—A Case Study of Typical Resource-Based Cities in China. Sustainability 2021, 13, 6802. [Google Scholar]
  44. Zeng, L.; Wang, B.; Fan, L.; Wu, J. Analyzing Sustainability of Chinese Mining Cities Using an Association Rule Mining Approach. Resour. Policy 2016, 49, 394–404. [Google Scholar] [CrossRef]
  45. Zhao, J. The Study of the Urban Spatial Development of the Resource-Based City in China. Urban Stud. 2006, 3, 86–106. [Google Scholar]
  46. Teng, M.; Zeng, L.; Zhou, Z.; Wang, P.; Xiao, W.; Dian, Y. Responses of Landscape Metrics to Altering Grain Size in the Three Gorges Reservoir Landscape in China. Environ. Earth Sci. 2016, 75, 1055. [Google Scholar] [CrossRef]
  47. Zhang, J.; Rao, Y.; Xu, Y.; Fu, M. Effects of Grain Size on Landscape Patterns in Mineral Resource Zones: A Case Study of Wu’an, China. Int. J. Coal Sci. Technol. 2014, 1, 227–234. [Google Scholar] [CrossRef] [Green Version]
  48. Zhaobi, L.; Dongjie, G.; Lidan, C. Study on the Gradient Change of the Landscape Pattern in the Three Gorges Reservoir Area by Coupling the Optimal Grain Size Method and Multidirectional Gradient Transect Method. Environ. Sci. Pollut. Res. Int. 2020, 27, 44585–44603. [Google Scholar]
  49. Xu, Z.; Hu, Y.; Liu, Y.; Yan, Y. A Review on the Accuracy Analysis of Spatial Scaling Data. Prog. Geogr. 2012, 31, 1574–1582. [Google Scholar]
  50. Wu, Q.; Pang, J.; Qi, S.; Li, Y.; Han, C.; Liu, T.; Huang, L. Impacts of coal mining subsidence on the surface landscape in Longkou city, Shandong Province of China. Environ. Earth Sci. 2009, 59, 783–791. [Google Scholar] [CrossRef]
  51. Liu, L.; Zhou, J. Analyzing Ecological Functions in Coal Mining Cities Based on RS and GIS. Pol. J. Environ. Stud. 2018, 27, 1165–1174. [Google Scholar] [CrossRef]
  52. Wan, L.; Ye, X.; Lee, J.; Lu, X.; Zheng, L.; Wu, K. Effects of urbanization on ecosystem service values in a mineral resource-based city. Habitat Int. 2015, 46, 54–63. [Google Scholar] [CrossRef]
  53. Liu, L.; Liu, Z.; Liu, Z.; Xu, X.; Wang, B. Analysis on the spatio-temporal characteristics of urban expansion and the complex driving mechanism: Taking the Pearl River Delta urban agglomeration as a case. Complexity 2020, 2020, 8157143. [Google Scholar] [CrossRef]
Figure 1. Analysis procedure.
Sustainability 14 08492 g001
Figure 2. Study area.
Sustainability 14 08492 g002
Figure 3. Development cycle of Jixi City (note: 1990 marked the beginning of Jixi City’s new development cycle stage).
Sustainability 14 08492 g003
Figure 4. Mining city development lifecycle.
Sustainability 14 08492 g004
Figure 5. Changes in Jixi’s economic indicators driven by the mining industry from 1990–2020. (a) The change of raw coal outpute; (b) The changes of industrial outpute value in GDP.
Sustainability 14 08492 g005
Figure 6. Changes in GDP and the output value of primary, secondary, and tertiary industries from 1990−2020. (a) The changes of GDP; (b) The changes of GDP growth rate; (c) The changes in the output value of industries.
Sustainability 14 08492 g006
Figure 7. Changes in employment level from 1990−2020. (a) The changes in the proportion of employees in the extractive industry; (b) The change of number of mining employees.
Sustainability 14 08492 g007
Figure 8. Variation of each landscape index value with grain size in Jixi City (note: LPI, PAFRAC, IJI, DIVISION, SPLIT, SHDI, SHEI, and TA all show obvious turning points).
Sustainability 14 08492 g008
Figure 9. Variations in information loss index under different grain sizes: (a) variations in area information loss index under different grain sizes; (b) variations in perimeter information loss index under different grain sizes; (c) variations in patch information loss index under different grain sizes.
Sustainability 14 08492 g009
Figure 10. Landscape pattern index changes at in terms of landscape type based on urban lifecycle stages from 1990–2020.
Sustainability 14 08492 g010
Figure 11. Landscape index changes at in terms of landscape level based on urban lifecycle stages.
Sustainability 14 08492 g011
Table 1. Defining indicators of the lifecycle of Jixi City.
ClassificationIndicators
Mining scaleRaw coal production
Industrial output in GDP
Economic capacityGDP
Growth rate of GDP
Output in primary, secondary, and tertiary industries
Employment levelProportion of mining employees
Number of employees
Table 2. Variations in indicators for defining the lifecycle of mining cities.
IndicatorLead-In Growth Maturity Decay Transition
Mining scaleRising unsteadilyRising steadilyBasically steadyDeclining unsteadilyDeclining
Economic capacityRising slowlyDeveloping rapidlyBasically steadyDeveloping slowlyRelatively stable
Employment levelRelatively unsteadyRising steadilyBasically steadyDecliningSteady
Table 3. “Inflection point” intervals of urban development in Jixi City.
Standard Inflection Point Interval
Mining scale1998, 2009, 2016
Economic growth capacity1998–2002, 2009–2012, 2016
Employment level2000, 2008, 2016
Table 4. Calculation of landscape pattern index at landscape level.
YearPD/n·(100 ha)−1LSI/%CONTAG/%SHDISHEI
19903.1426.1856.301.200.67
19983.9426.9557.661.180.66
20097.4732.3356.591.200.67
20168.2734.4055.741.210.67
20204.4125.3960.241.180.66
Publisher’s Note: MDPI stays neutral with regard to jurisdictional claims in published maps and institutional affiliations.