Article

Distinguishing the Impacts of Human Activities and Climate Change on the Livelihood Environment of Pastoralists in the Qinghai Lake Basin

1
School of Geographical Science, Qinghai Normal University, Xining 810008, China
2
Academy of Plateau Science and Sustainability, People’s Government of Qinghai Province and Beijing Normal University, Xining 810016, China
3
Key Laboratory of Tibetan Plateau Land Surface Processes and Ecological Conservation (Ministry of Education), Qinghai Normal University, Xining 810008, China
4
Qinghai Province Key Laboratory of Physical Geography and Environmental Process, Xining 810008, China
5
College of Tourism, Qinghai Nationalities University, Xining 810007, China
6
Faculty of Geographical Science, Beijing Normal University, Beijing 100875, China
*
Author to whom correspondence should be addressed.
Sustainability 2022, 14(14), 8402; https://doi.org/10.3390/su14148402
Submission received: 29 May 2022 / Revised: 5 July 2022 / Accepted: 6 July 2022 / Published: 8 July 2022

Abstract

:
Grassland vegetation is the largest terrestrial ecosystem in the Qinghai Lake Basin (QLB), and it is also the most important means of production for herders’ livelihoods. Quantifying the impact of climate change and human activities on grassland vegetation changes is an essential task for ensuring the sustainable livelihood of pastoralists. To this end, we investigated vegetation cover changes in the QLB from 2000 to 2020 using the normalized difference vegetation index (NDVI), meteorological raster data, and digital elevation and used residual analysis of multiple linear regression to evaluate the residuals of human activities. The residual analysis of partial derivatives was used to quantify the contribution of climate change and human activities to changes in vegetation cover. The results showed that: (1) The vegetation coverage of the QLB increased significantly (0.002/a, p < 0.01), with 91.38% of the area showing a greening trend, and 8.62% of the area suffering a degrading trend. The NDVI decreased substantially along the altitude gradient (−0.02/a, p < 0.01), with the highest vegetation coverage at 3600–3700 m (0.37/a). The vegetation degraded from 3200–3300 m, vegetation greening accelerated from 3300–3500 m, and vegetation greening slowed above 3500 m. (2) The contribution of climate change, temperature (T), and precipitation (P) to vegetation cover change were 1.62/a, 0.005/a, and 1.615/a, respectively. Below 3500 m, the vegetation greening was more limited by P. Above 3500 m, the vegetation greening was mainly limited by T. (3) Residual analysis showed that the contribution of human activities to vegetation cover was −1.618/a. Regarding the altitude gradient, at 3300–3500 m, human activities had the highest negative contribution to vegetation coverage (−2.389/a), and at 3200–3300 m, they had the highest positive contribution (0.389/a). In the past 21 years, the impact of human activities on vegetation coverage changed from negative to positive. Before 2009, the annual average NDVIres value was negative; after 2010, the average yearly NDVIres value turned positive. In general, the vegetation greening of the QLB depends on climate warming and humidification. The positive impact of human activities over the past decade was also essential for vegetation greening. These findings deepen our understanding of the QLB vegetation changes under climate change and human activities.

1. Introduction

As a significant component of the land-atmosphere system [1,2], vegetation fundamentally regulates the material cycle and energy flow on the earth’s surface [3,4]—its changes may also affect climate through surface hydrothermal regulation and biological evolution [5,6,7,8]. In addition, vegetation is also the basis of economic and social development in some regions [9], especially in the Qinghai-Tibet Plateau, where animal husbandry is the primary livelihood [10]. Therefore, studying the relationship between vegetation cover changes, climate, and human factors is of great significance in evaluating the ecological security and sustainable livelihood of farmers and herders in the Qinghai-Tibet Plateau.
As the primary vegetation coverage monitoring method used in the past (sampling method [11], instrument method [12]), field measurement can hardly meet the needs of obtaining vegetation cover monitoring data covering an extensive range. With the development of satellite remote sensing technology, RVI (rainfall variability index) [13], DVI (difference vegetation index) [14], PVI (perpendicular vegetation index) [15], NDVI (normalized difference vegetation index) [16], SAVI (soil-adjusted vegetation index) [17], and other vegetation indices obtained from vegetation reflectance spectral characteristics are widely used for large-scale vegetation monitoring. Among these, NDVI takes into account the interference of the terrain and the vegetation canopy, eliminating the error caused by radiation, and can well reflect the biomass and greenness of vegetation. It has been proved to have high application value in response to environmental changes [18]. Therefore, NDVI has become a standard indicator for monitoring vegetation growth and coverage density [19].
Vegetation change and its attribution to the Qinghai-Tibet Plateau have always been hot topics for scholarly research. In the last 30 years, the NDVI of the Qinghai-Tibet Plateau has increased significantly at a rate of 0.001–0.002/a [20,21]. The alpine grassland and alpine meadow have been improved [22]. Climate change was considered one of the reasons for vegetation cover changes [23]. Wu et al. found that temperature (T), precipitation (P), and radiation energy explained 66.2% of the changes in the alpine grasslands on the Qinghai-Tibet Plateau [24]. Liu et al. believed that P and active photosynthetic radiation were the main factors affecting the NDVI variation of different grassland types on the Tibetan Plateau [25]. In other regions within the Qinghai-Tibet Plateau, the impact of climatic factors on NDVI exhibits noticeable spatial and temporal differences. In the semi-arid and cold areas of the upper reaches of the Yarlung Zangbo River, herbs and shrubs were susceptible to changes in P and T [26], while NDVI in the lower reaches was significantly and positively correlated with surface T [27]. Chen et al. found that the difference in climate change in the Qinghai-Tibet Plateau determined the spatial difference in vegetation response. The correlation between the northern and southern parts of the plateau was opposite to P and T, respectively. In the south part of the plateau, the greening trend slowed down due to increased cooling and humidification, and some areas even deteriorated [28]. The IPCC Sixth Assessment Report pointed out that at the current rate of carbon dioxide and other greenhouse gases emissions, the global T increase would reach or exceed 1.5 °C over the next 20 years [29]. The response of vegetation change to climate change in the Qinghai-Tibet Plateau would also persist. Fan et al. predicted that the future climate change intensity would directly affect the rate of vegetation change on the Qinghai-Tibet Plateau, especially regarding the altitude gradient, where the change of vegetation types in low altitude and high cold areas could reach 7.54%/10 a–11.32%/10 a, respectively [30].
In addition, human activities are also an essential factor in the vegetation change of the Qinghai-Tibet Plateau. On the one hand, the impact of human activities on vegetation in the Qinghai-Tibet Plateau was smaller than that of climate factors [31], and the effect on vegetation also changed from limiting to promoting. On the other hand, in the southern, eastern [32], and northeastern [28] regions of the Qinghai-Tibet Plateau, human activities, such as grazing, engineering construction, and the influx of tourists, have caused significant disturbance to vegetation [32,33,34], resulting in a decline in NDVI values, alpine vegetation degradation, and other issues. In summary, the NDVI and climatic factors of the Qinghai-Tibet Plateau show spatial non-stationarity and scale dependence [35], which requires us to pay attention to the dynamics of vegetation changes in different regions within the plateau.
The human–land relationship is the focus of regional sustainability research [36]. Grasslands are not only the primary carrier of the human–land relationship on the Qinghai-Tibet Plateau, but are also the most vulnerable to disturbance by human activities. Therefore, a comprehensive multi-perspective study on the evolution of the grassland resources environment and its interaction with climate and humans is important to maintain the coordinated development of the human–nature–economic system. The Qinghai Lake Basin (QLB) is located in the northeastern part of the Qinghai-Tibet Plateau, and it is a transitional zone between the alpine region of the Qinghai-Tibet Plateau, the arid and semi-arid region of the northwest, and the arid region of the Loess Plateau area. However, the specific changes that have occurred in the vegetation of the QLB, especially the degree to which climate change and human activities have affected the changes in vegetation cover, and the main factors affecting the changes in the vegetation cover of the QLB have not been studied quantitatively. To this end, based on the MODIS NDVI dataset, this research evaluates the distribution and trend of vegetation cover in the QLB from 2000 to 2020, reveals the residual trend of changes in vegetation cover caused by human activities over the past 21 years, and quantifies the contribution of climate change and human activities to vegetation cover dynamics from the two dimensions of space and altitude. The research results will promote our understanding of the dynamic changes of the alpine steppe in the northeastern Qinghai-Tibet Plateau and are significant for the targeted implementation of regional ecological conservation.

2. Materials and Methods

2.1. The Study Area

The QLB is a closed inland basin (Figure 1), which is located in the northeastern Qinghai-Tibet Plateau (36°15′–38°20′ N, 97°50′–101°20′ E), with an area of about 2.96 × 10⁴ km2. China’s largest saltwater lake—Qinghai Lake—is located here. The topographical altitude of the QLB decreases from northwest to southeast [37], and the average elevation is above 3000 m. The QLB is distinguished by a typical continental plateau climate, with intense solar radiation. In most areas, the average annual T is below 0 °C, and the average annual P is below 400 mm [38].
The vegetation types in the QLB show the coexistence of temperate vegetation and alpine vegetation. The main vegetation types are alpine grassland, alpine meadow, sandy vegetation, halophytic meadow, marsh meadow, etc.. Among these, the alpine meadow is the most widely distributed area, mainly at the altitude of 3000–4000 m, accounting for 70.26% of the size of the QLB. In addition, the vertical zonal distribution of vegetation in the QLB is apparent. At lower altitudes, the lake basin and river valley are dominated by grassland vegetation such as Achnatherum splendens L., Stipa capillata L., and Agropyron cristatum L. In contrast, alpine steppe, alpine shrub, and alpine meadow are the primary vegetation types in the surrounding mountains and areas at higher altitudes [39].
Relying on the abundant grassland resources, the QLB has become an important pastoral area on the Qinghai-Tibet Plateau, and grazing is the main livelihood of residents. By the end of 2019, the total population of the QLB was 108,639, and the animal husbandry population was 73,937, accounting for 12.03% of the total regional population [40].

2.2. Data Sources and Processing

We used NDVI to indicate the vegetation cover of QLB, which is derived from the MOD13Q1 data product released by NASA (National Aeronautics and Space Administration) (https://search.earthdata.nasa.gov, accessed on 15 November 2021), with a temporal resolution of 16 days and a spatial resolution of 250 m. Due to its higher resolution and lower uncertainty, the MOD13Q1 data product has been widely used to study vegetation change on the Qinghai-Tibet Plateau [41]. The digital elevation (DEM) data was sourced from the China Geospatial Data Cloud Platform (http://www.gscloud.cn/, accessed on 12 January 2022), with a spatial resolution of 90 m. T and P were selected as climatic elements affecting NDVI, which were obtained from the China’s National Earth System Science Data Center (http://www.geodata.cn, accessed on 23 December 2021), with a spatial resolution of 1 km. The population and GDP spatial distribution kilometer grid dataset were obtained from the Resource and Environmental Science and Data Center of the Institute of Geographical Sciences and Natural Resources Research, Chinese Academy of Sciences (https://www.resdc.cn/, accessed on 8 February 2022), with a resolution of 1 km. The livestock data per unit area are derived from the statistical data of the towns in Haibei, Hainan, and Haixi.
The above data were preprocessed using Python 3.5 software (Python Software Foundation, Beaverton, OR, USA), written to complete splicing, cropping, and data format conversion. At the same time, all raster data were resampled to a spatial resolution of 250 m × 250 m. The contributions of climate change and human activities to changes in vegetation cover were calculated by MatLab R2021b (MathWorks, Natick, MA, USA). All visualizations in this research were processed by ArcGIS Pro 2.8.0 (Esri, Berkeley, CA, USA).

2.3. Research Methods

2.3.1. Trend Analysis of Vegetation Coverage and Climate Factors

The linear trend of T, P, and NDVI from 2000 to 2020 was estimated using the least squares regression method. The calculation formula of this method is as follows [42]:
S l o p e = n × i = 1 n i × j i i = 1 n i i = 1 n i n × i = 1 n i 2 ( i = 1 n i ) 2
where slope is the regression equation slope and n is the length of the time series, which is 21 in this study. If slope > 0, vegetation T, P, and NDVI increase; if slope < 0, T, P, and NDVI decrease.

2.3.2. Quantifying the Impact of Climate Change and Human Activities on Vegetation Cover

In this research, the residual analysis method based on multiple linear regression was used to evaluate the influence trend of the QLB human activities on vegetation cover. This method has been widely used in assessing vegetation cover changes since it was first proposed in 2004 [43,44]. The residual analysis first needs to establish a multiple linear regression model of T, P, and NDVI at the pixel scale to predict the predicted value of NDVI (NDVIpre) under the influence of T and P. The difference between the observed values of NDVI (NDVIobs) and NDVIpre is the residual (NDVIres), that is, the degree of influence of human activities on vegetation. The calculation formula is:
N D V I p r e = a × P + b × T
N D V I r e s = N D V I o b s N D V I p r e
Among these, a is the regression coefficient between NDVI and T, and b is the regression coefficient between vegetation cover and P; if NDVIres < 0, it means that human activities have caused vegetation degradation; if NDVIres > 0, it means that human activities have promoted vegetation growth; if NDVIres = 0, the vegetation cover changes are attributed to climate change.
Although residual analysis based on multiple linear regression can distinguish the effects of climate change and human activities on vegetation cover, it cannot be quantitatively assessed. To this end, this research used residual analysis of partial derivatives to quantify the contribution of climate change and human activities to changes in vegetation cover. At the same time, the altitudes of the QLB were reclassified into 17 categories according to the 100 m interval. We then extracted the contribution rates of climate change and human activities on different altitude gradients. The residual analysis method based on partial derivatives was proposed by Roderick et al. in 2007 [45] and has been widely used in many studies [46]. The calculation formula is:
N D V I s l o p e C _ c o n + H _ c o n = T _ c o n + P _ c o n + H _ c o n = N D V I T × d T d t + N D V I P × d P d t + H _ c o n
Among these, NDVIslope is the interannual variation slope of NDVI; C_con, H_con, T_con and P_con represent the contribution of climate change, human activities, T, and P to vegetation covering NDVI, respectively; The sum of T_con and P_con is C_con; the residual of NDVIslope and C_con is approximately equal to H_con; N D V I T and N D V I P represent the partial correlation coefficients of T, P, and NDVI, respectively (excluding the interference of P and T, respectively); d T d t and d P d t are the interannual variation slopes of T and P in the time variable t, respectively. Among these, partial correlation analysis is an effective method to study the linear relationship between two factors, while eliminating the interference of other factors. The calculation formula is [47]:
R x y , z = R x y R x z × R y z ( 1 R x z 2 ) × ( 1 R y z 2 )
where Rxy,z is the partial correlation coefficient between x and y under the condition that when the influence of variable z is excluded, Rxy, Rxz and Ryz are the simple correlations between x and the other two variables y and z, respectively. The significance test of the partial correlation coefficient is completed by the t test, and its calculation formula is [48]:
t = R x y 1 R x y 2 n m 1
Among these, n is the number of samples (the time series is 2000–2020, that is, n = 21), and m is the number of independent variables.

3. Results

3.1. Spatial Distribution Characteristics and Variation Trend of NDVI

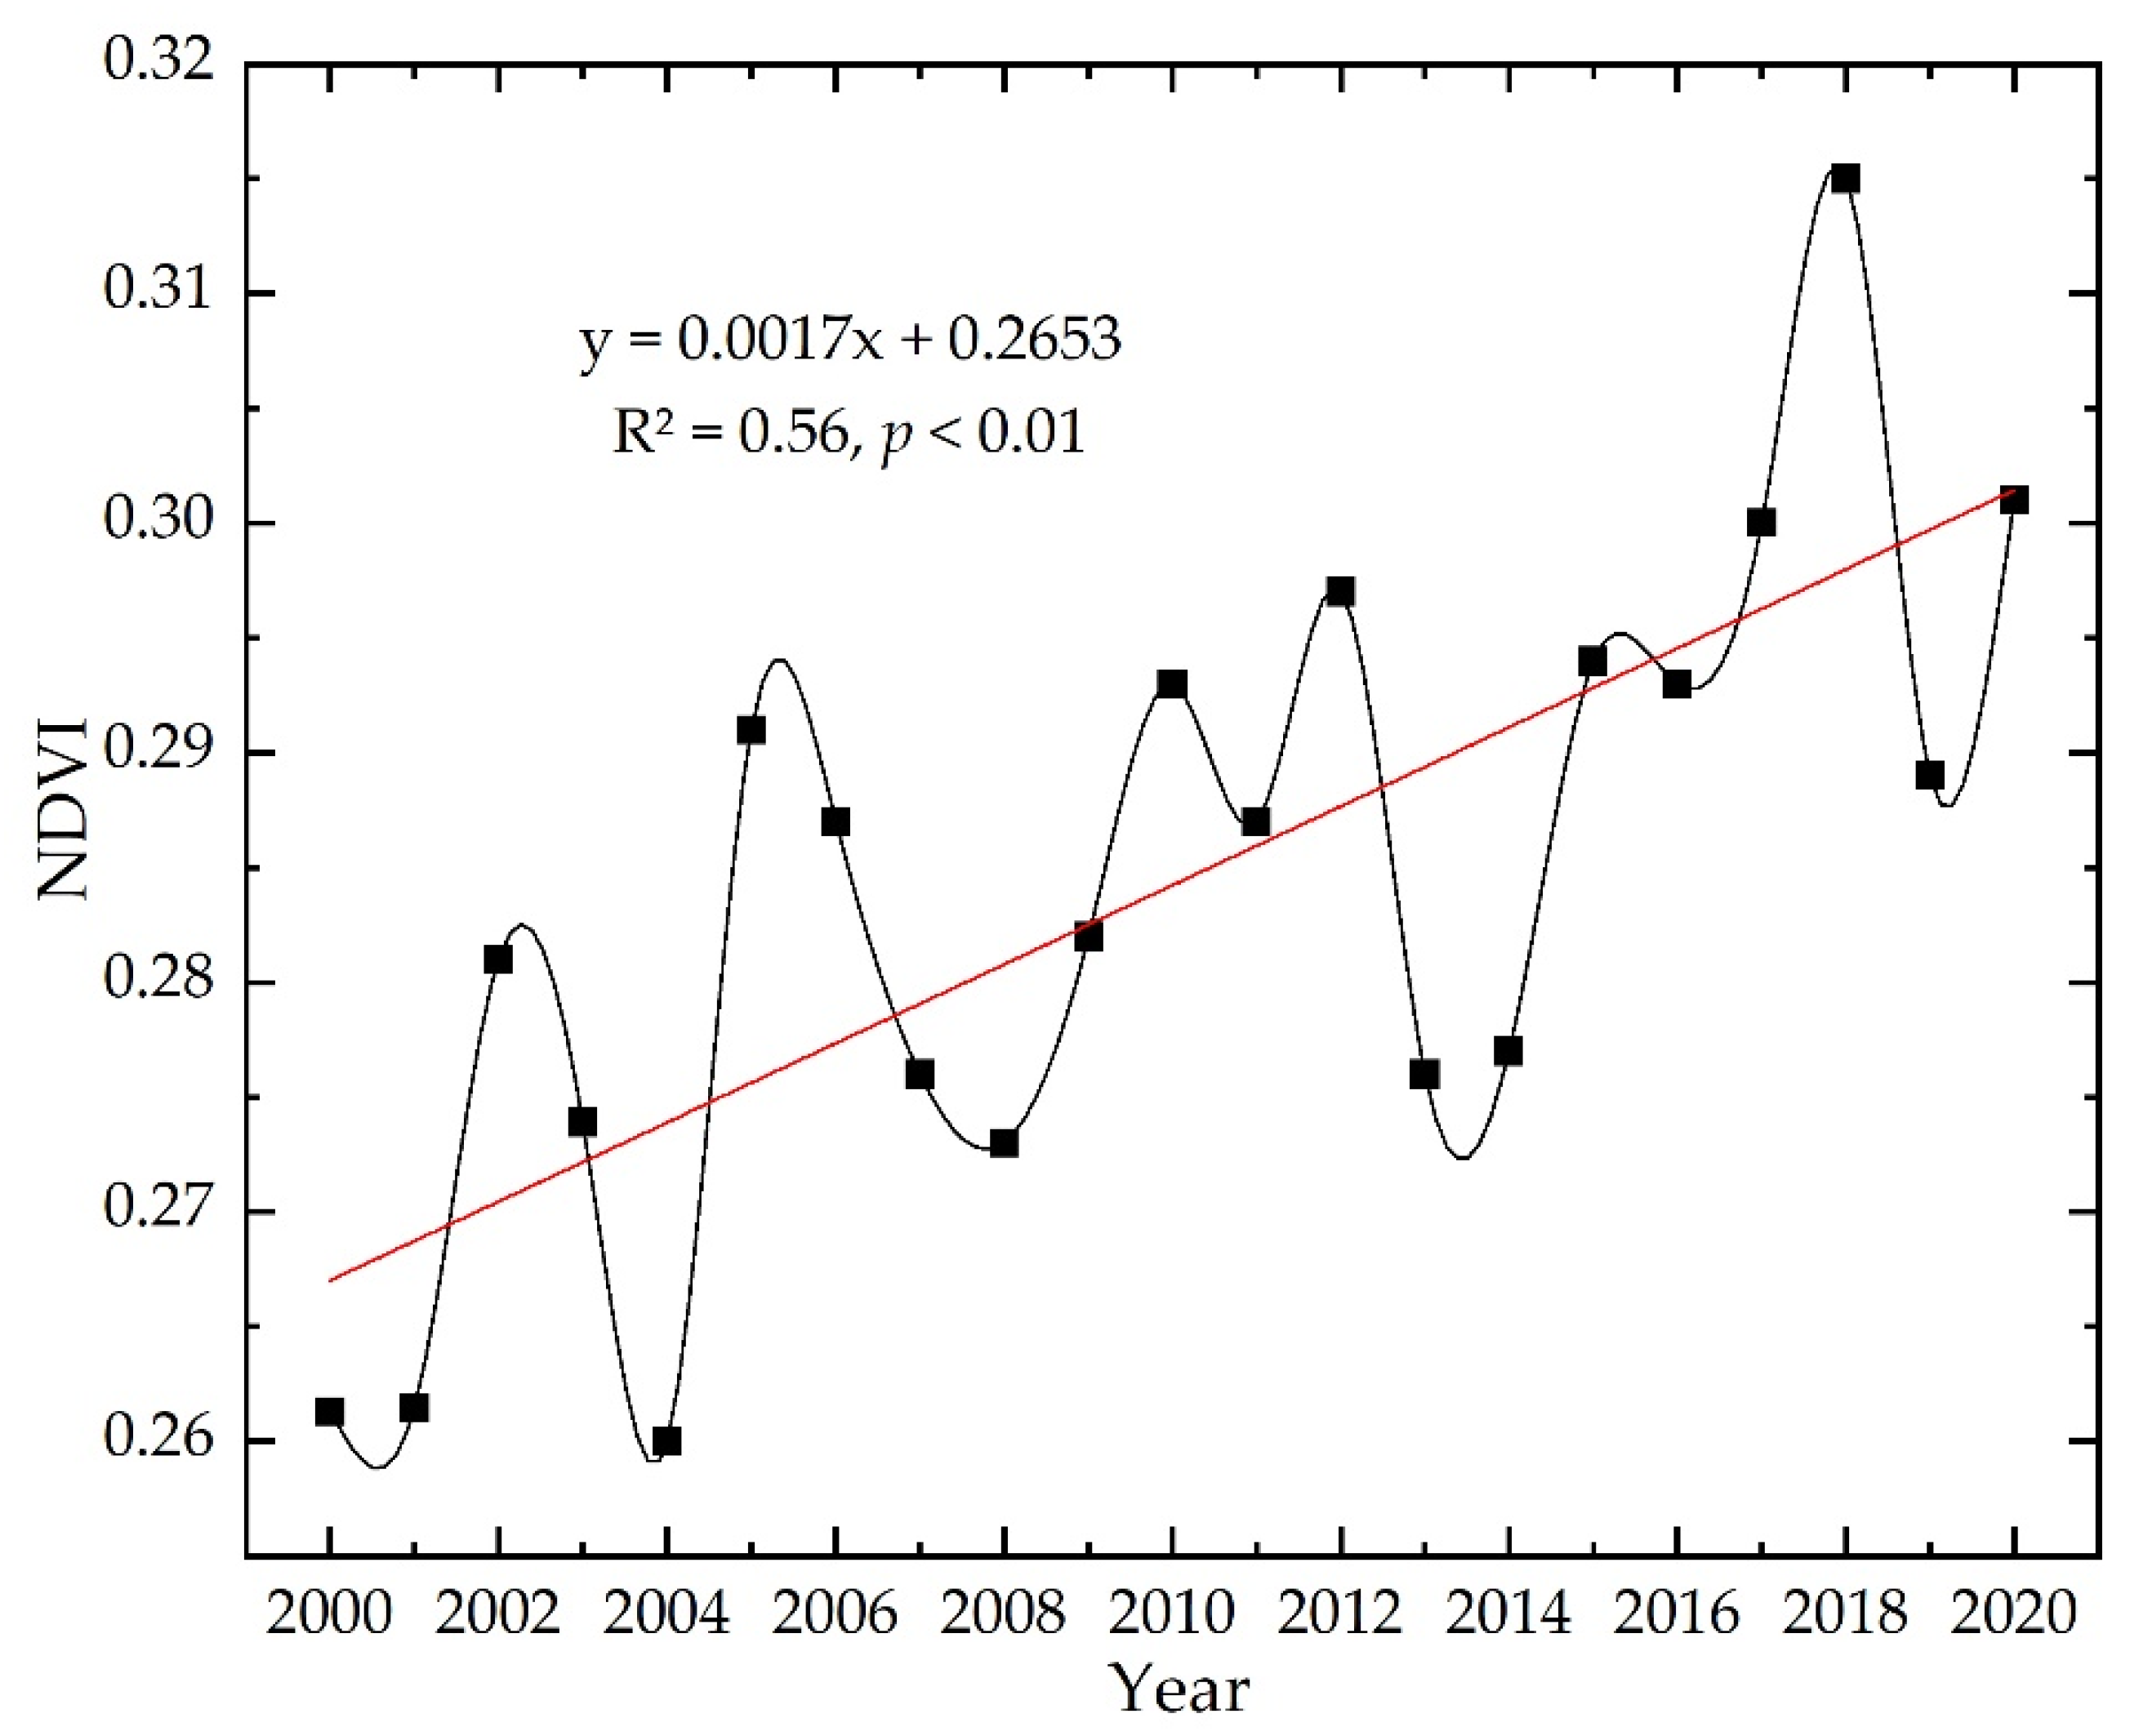
From 2000 to 2020, the annual average NDVI value for the QLB was 0.28, fluctuating and rising between 0.26 and 0.32 (Figure 2), showing a significant increasing trend (0.017/10a, p < 0.01). In 2004, the annual average NDVI value was the minimum (0.26), and in 2018, it was the maximum (0.32).
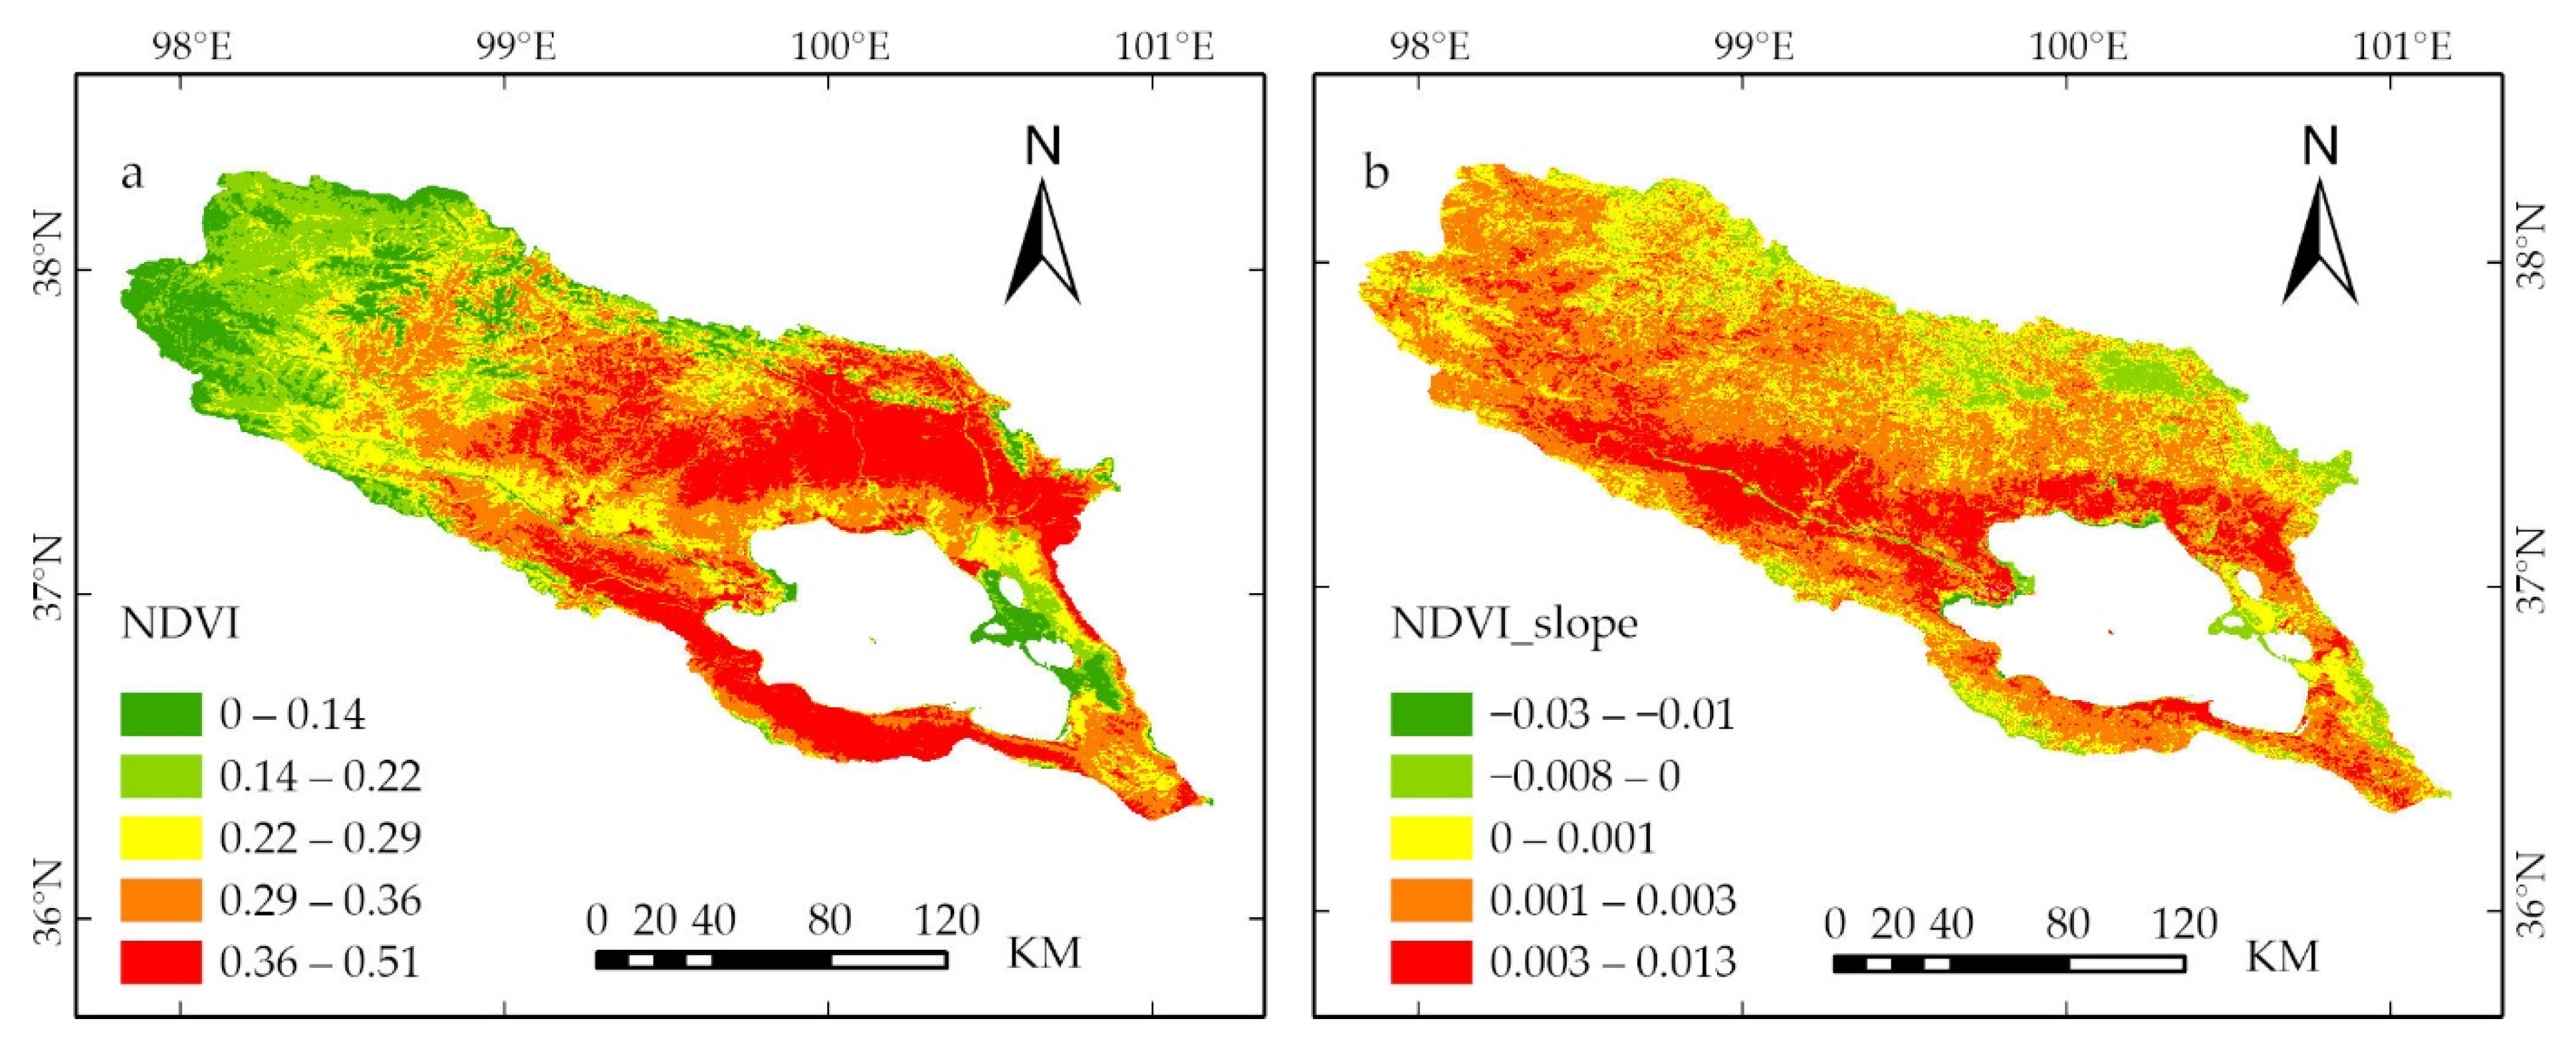
The mean NDVI across the QLB decreased from southeast to northwest (Figure 3a). The areas with the most significant NDVI values were distributed in the northern and southern parts of Qinghai Lake, while the areas with the smallest NDVI values were mainly distributed in the upper Buha River in the northwest and the Shadao area on the east bank of Qinghai Lake. The changing trend of the calculated NDVI can be seen (Figure 3b). Pixels with a positive inter-annual variation slope of NDVI accounted for 91.38% of the entire study area, and pixels with a negative inter-annual variation only accounted for 8.62%, indicating that the overall vegetation coverage of the QLB in the past 21 years was dominated by improvement. More specifically, the trend of NDVI value increasing from the north to the south of the basin was obvious. The areas with the most vegetation improvement were mainly concentrated on both sides of the Buha River Valley and the northern part of Qinghai Lake (0.03–0.13/10a). The areas with the most severe vegetation degradation were mainly distributed around the shores of Qinghai Lake (north bank, east bank, west bank) and the upper reaches of the Shaliu River.

3.2. Spatial Distribution Characteristics and Variation Trends of Climate Factors

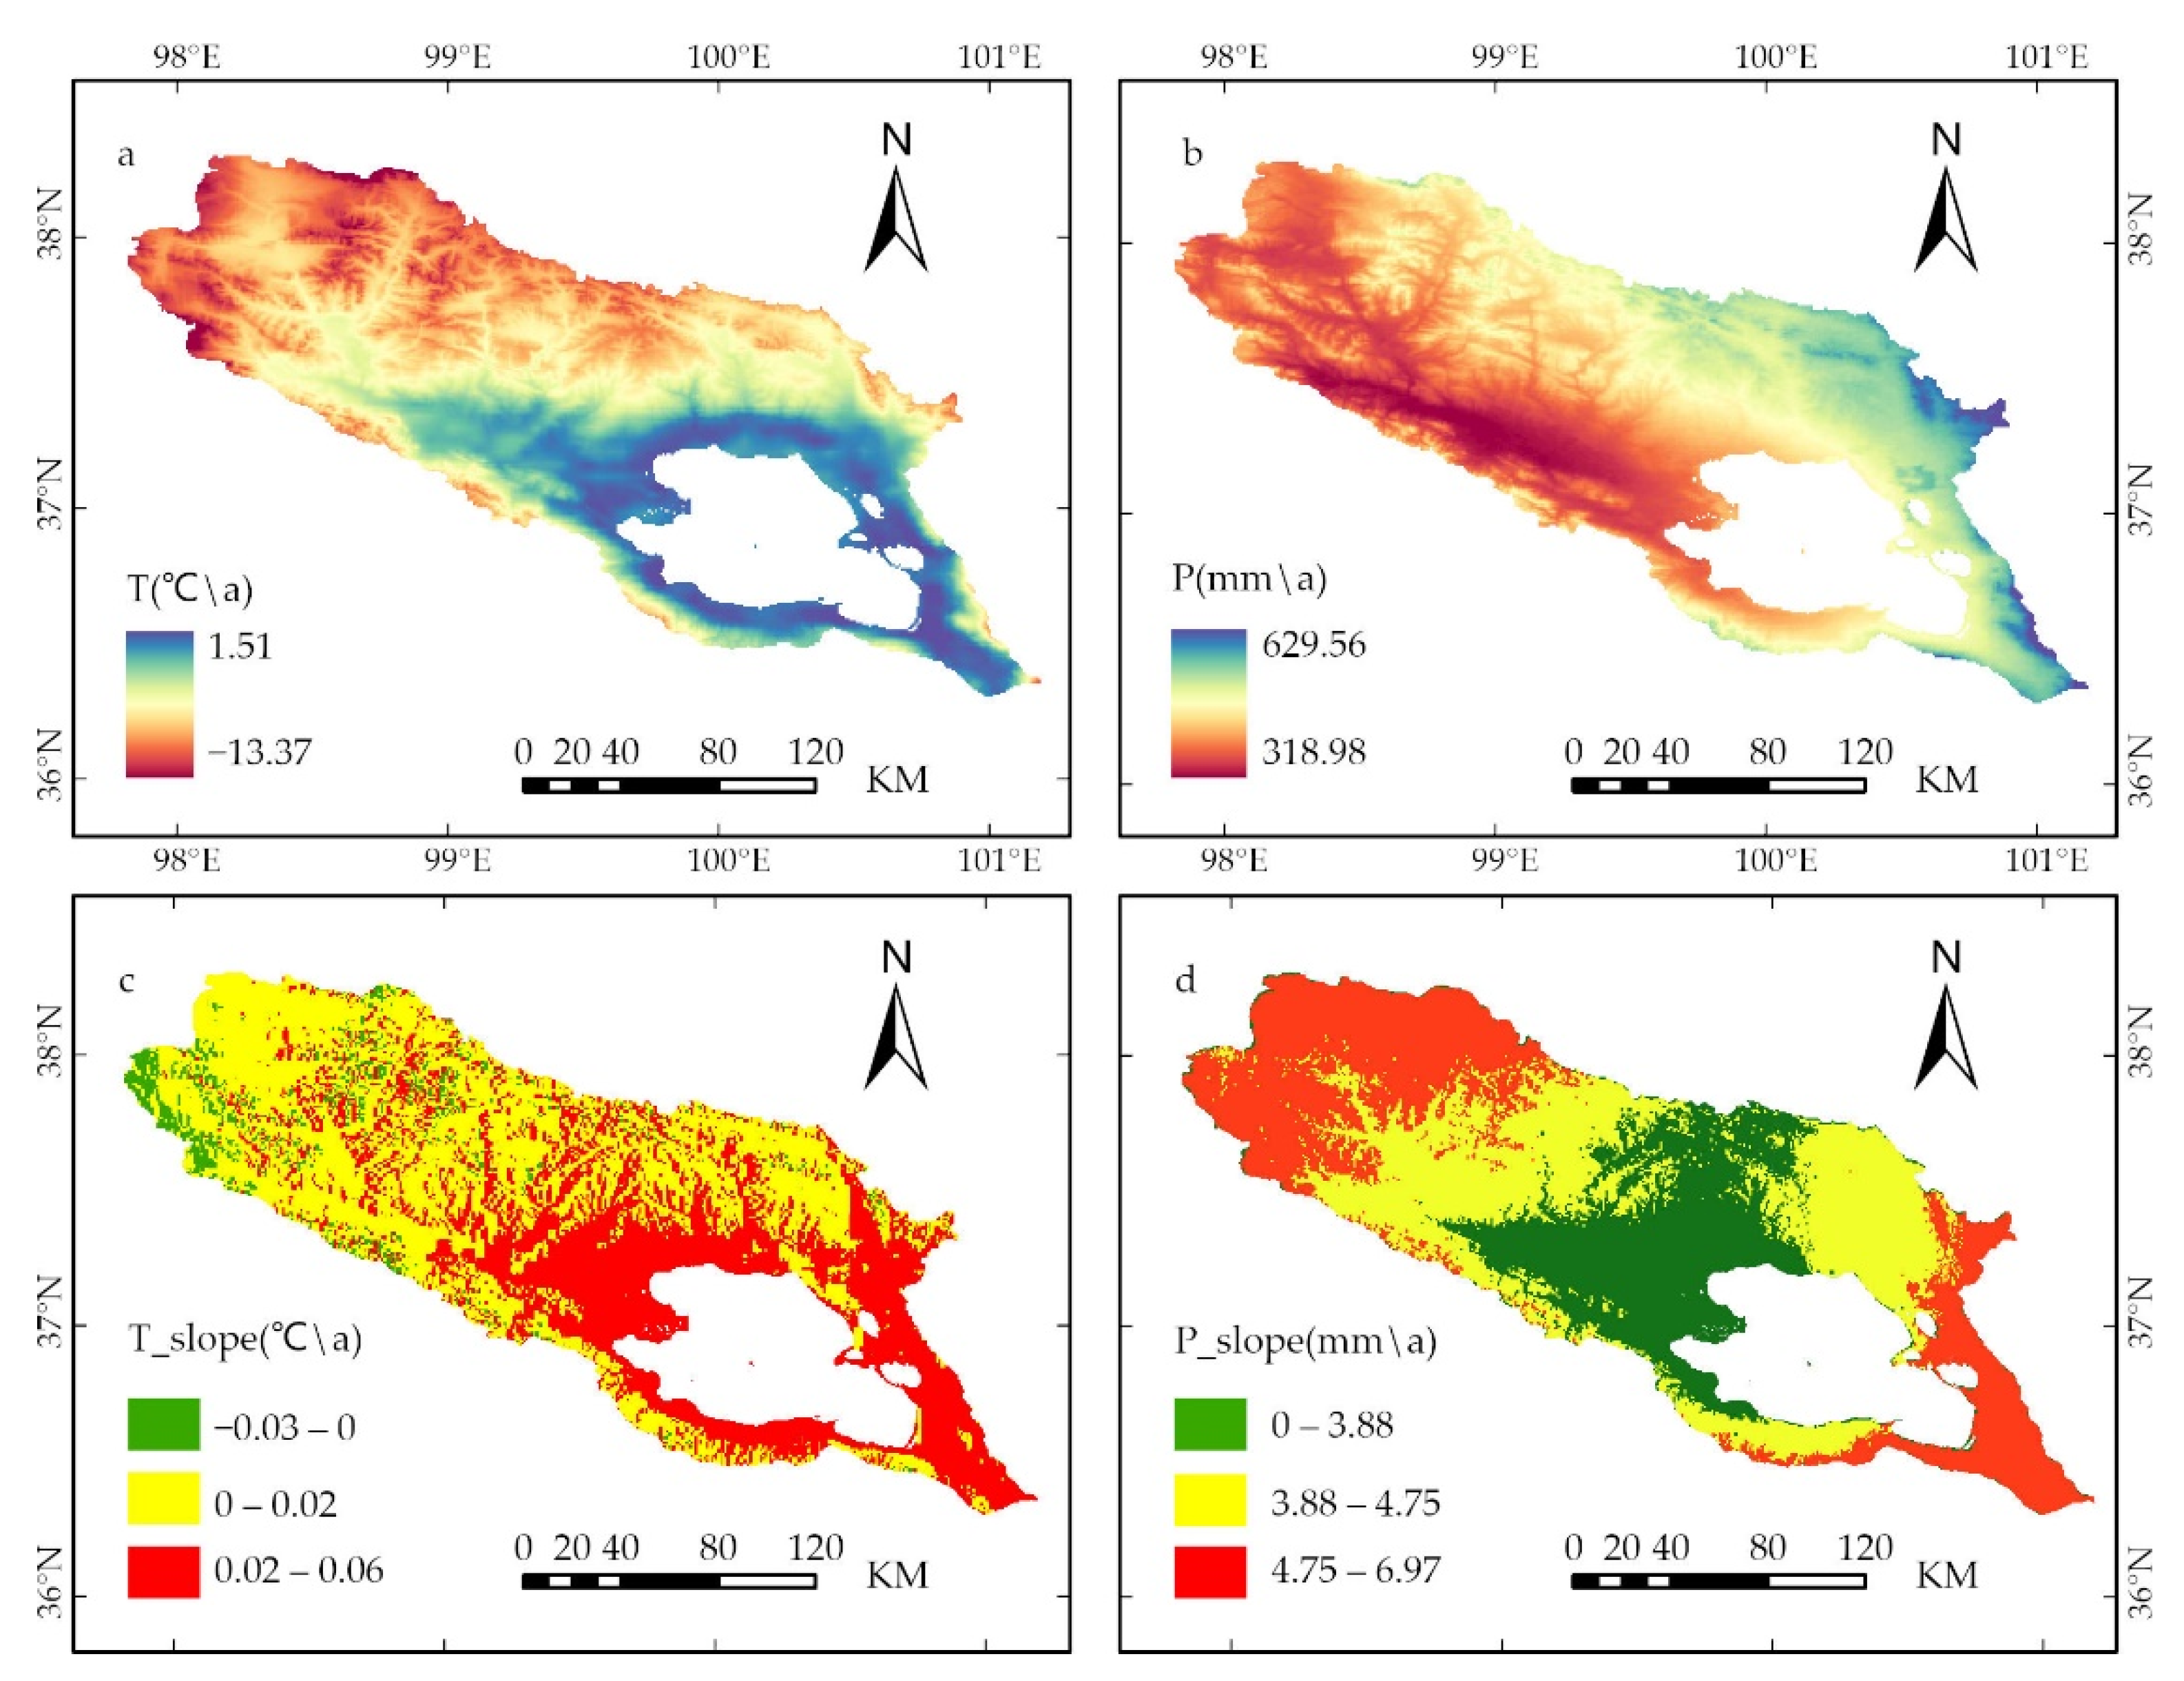
T and P determined the total input of heat and moisture and were the main climatic factors for vegetation growth. The spatial distribution and variation trend of the QLB climate factors are shown in Figure 4. It can be seen that the annual average T of the QLB ranged from −13.37 °C to 1.51 °C (Figure 4a), and the distribution was consistent with the altitude (Figure 1). The average annual T was higher in the areas around Qinghai Lake and the middle and lower reaches of the Buha River in the south, and lower in the high-altitude areas in the north. The annual average P showed an increasing spatial distribution pattern from the west (318.98 mm) to the east (629.56 mm) (Figure 4b). During the 21 years, the pixels with reduced T only accounted for 5.19% of the watershed area (Figure 4c) and were mainly distributed in the northwest of the study area. The pixels with elevated T accounted for 94.81% of the watershed area, and the areas with the fastest warming were mainly around Qinghai Lake (0.02–0.06 °C/a). From 2000 to 2020, the annual average P of the QLB generally increased at a rate of 3.08–7.08 mm/a (Figure 4d) and showed a spatially symmetrical distribution pattern, with the slope of P gradually increasing along the center to the southeast and northwest.

3.3. Residual Trends of Human Activities

Figure 5 shows the changing trend of NDVIres from 2000 to 2020. The annual average NDVIres value of the QLB ranged from −0.02 to 0.03 (Figure 5a), showing a significant upward trend (R2 = 0.48, p < 0.01). From 2000 to 2009, NDVIres was mainly negative, and only in 2006 was NDVIres positive. After 2010, NDVIres was mainly positive, which indicated that the adverse effects of human activities on vegetation coverage had gradually weakened in the past 21 years, and the favorable effects on vegetation coverage have continued to increase. Further analysis of the spatial variation of NDVIres can be seen (Figure 5b). A total of 89.74% of the pixel NDVIres increased, mainly distributed in the Buha River basin and along the periphery of Qinghai Lake. In comparison, 10.22% of the pixel NDVIres decreased, distributed primarily in the northeast of the basin.

3.4. Contribution of Climate Change and Human Activities to Vegetation Cover

To determine the relationship between vegetation cover and climate factors, we analyzed the partial correlation between T, P, and NDVI (Figure 6). Throughout the QLB, the partial correlation coefficients of T, P, and NDVI were 0.21 (p > 0.05) and 0.37 (p > 0.05), respectively. As shown in Figure 6a, 80.68% of the regional annual T in the study area was positively correlated with NDVI. Only 15.65% of the pixels reached the significance level of p < 0.05 (Figure 6b), while the area where P was positively correlated with NDVI reached 91.88% (Figure 6c), and 44.47% of the areas showed p < 0.05 (Figure 6d).
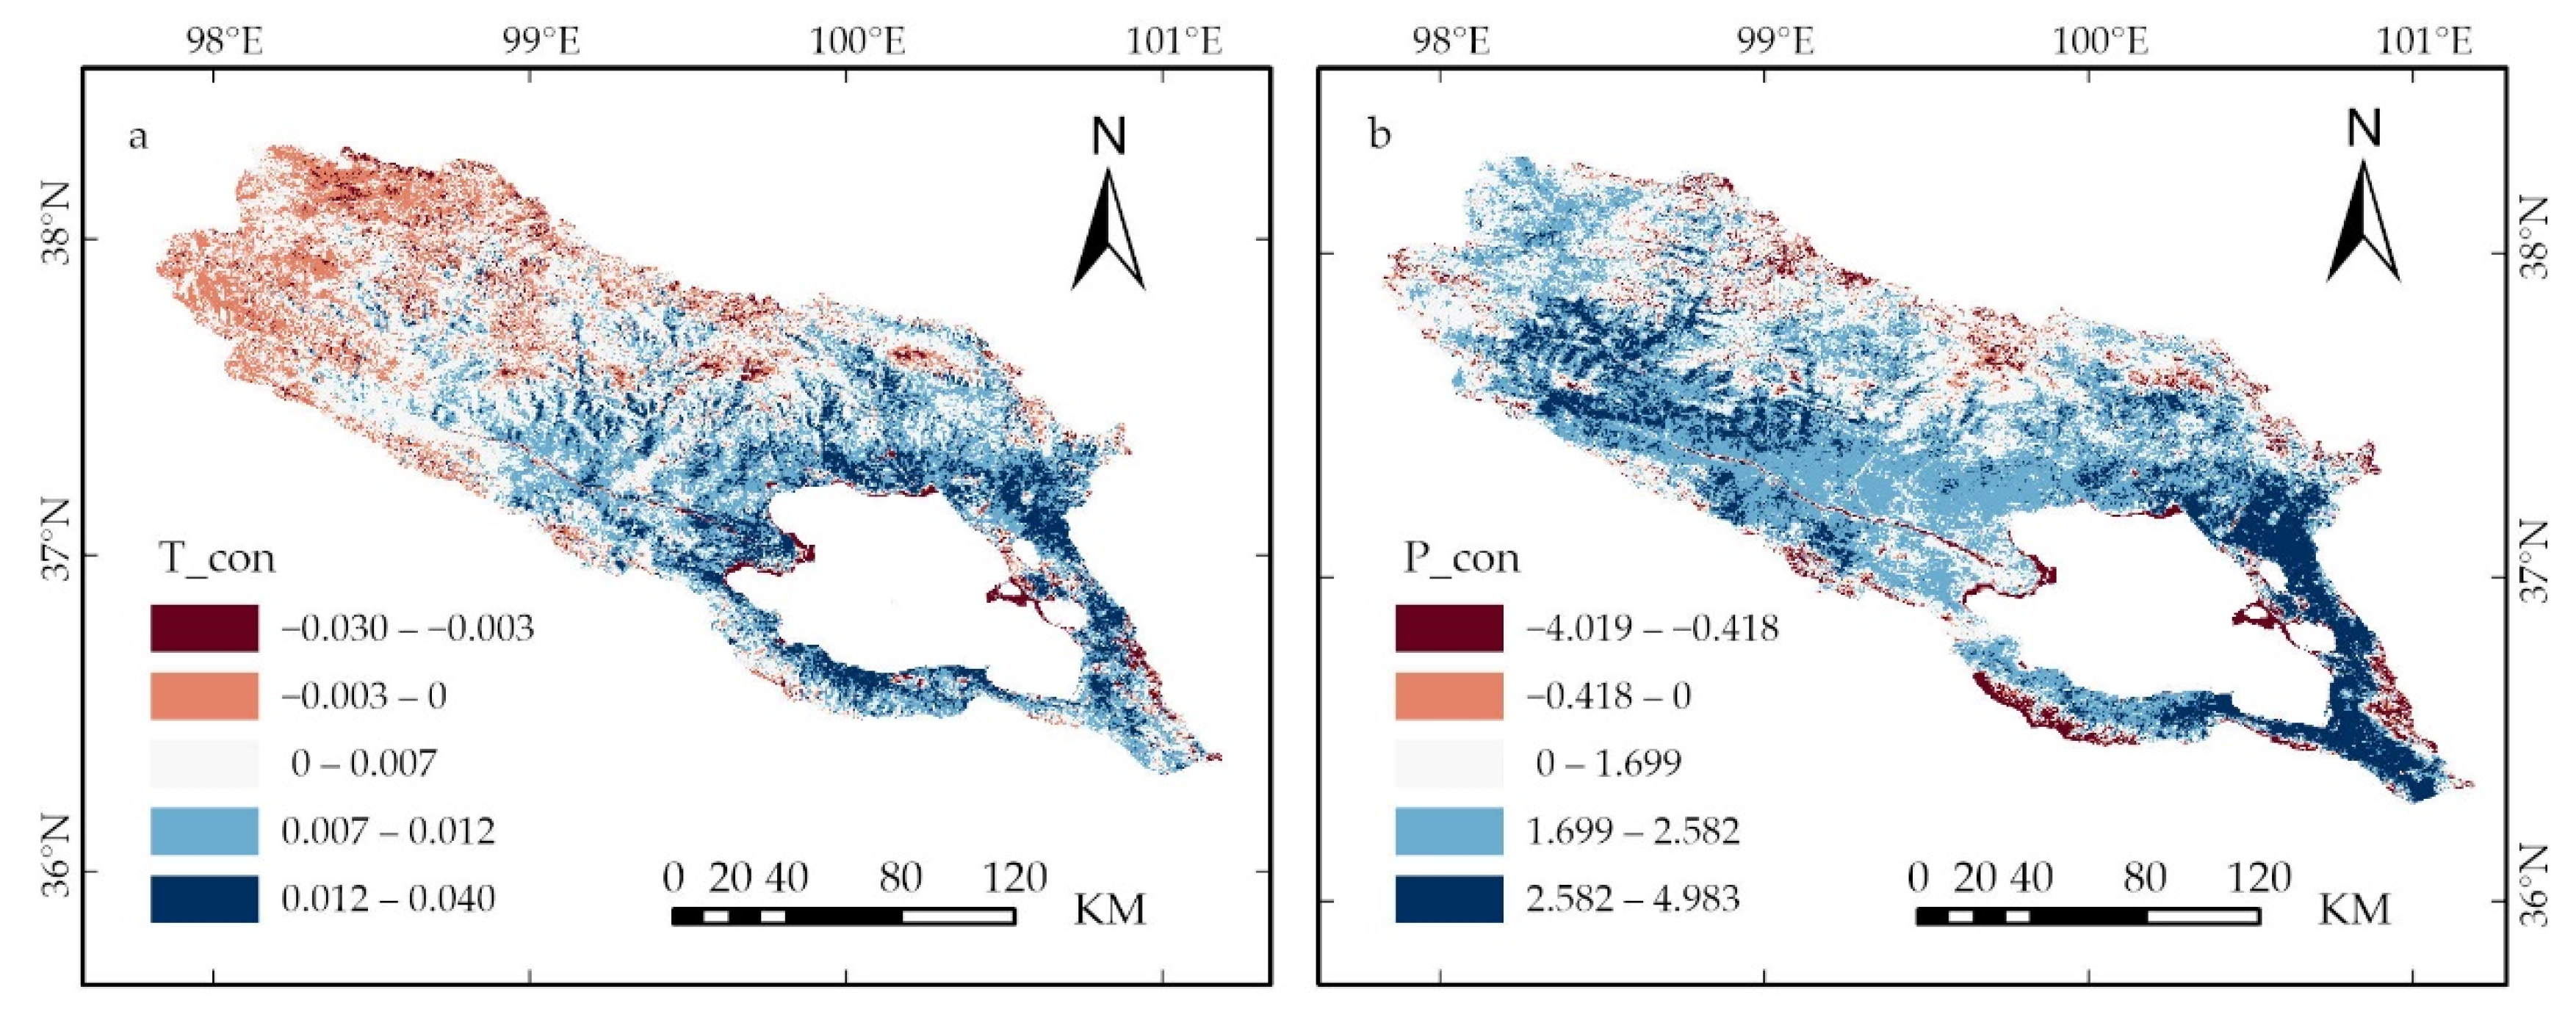
Figure 7 shows the residual analysis based on partial derivatives. The contribution of T (T_con) to the interannual variation of NDVI was 0.005/a, and T_con values ranged from −0.03–0.04/a (Figure 7a). The area with T_con > 0 accounted for 82.78% of the QLB area, mainly distributed around Qinghai Lake and the middle and lower reaches of the Buha River; the area with T_con value < 0 accounted for only 17.72% of the QLB area, mainly in the northwest of the study area. The contribution of P (P_con) to the interannual variation of NDVI was 1.615/a, with P_con values ranging from −4.019–4.983/a (Figure 7b). The area with P_con > 0 accounted for 91.88% of the basin area, and the highest values were mainly distributed in the eastern part of the study area and the middle and upper reaches of the Buha River. The area with P_con value < 0 only accounted for 8.12% of the watershed area, and was mainly distributed on the edge of the study area and the north, east, and west shores of Qinghai Lake.
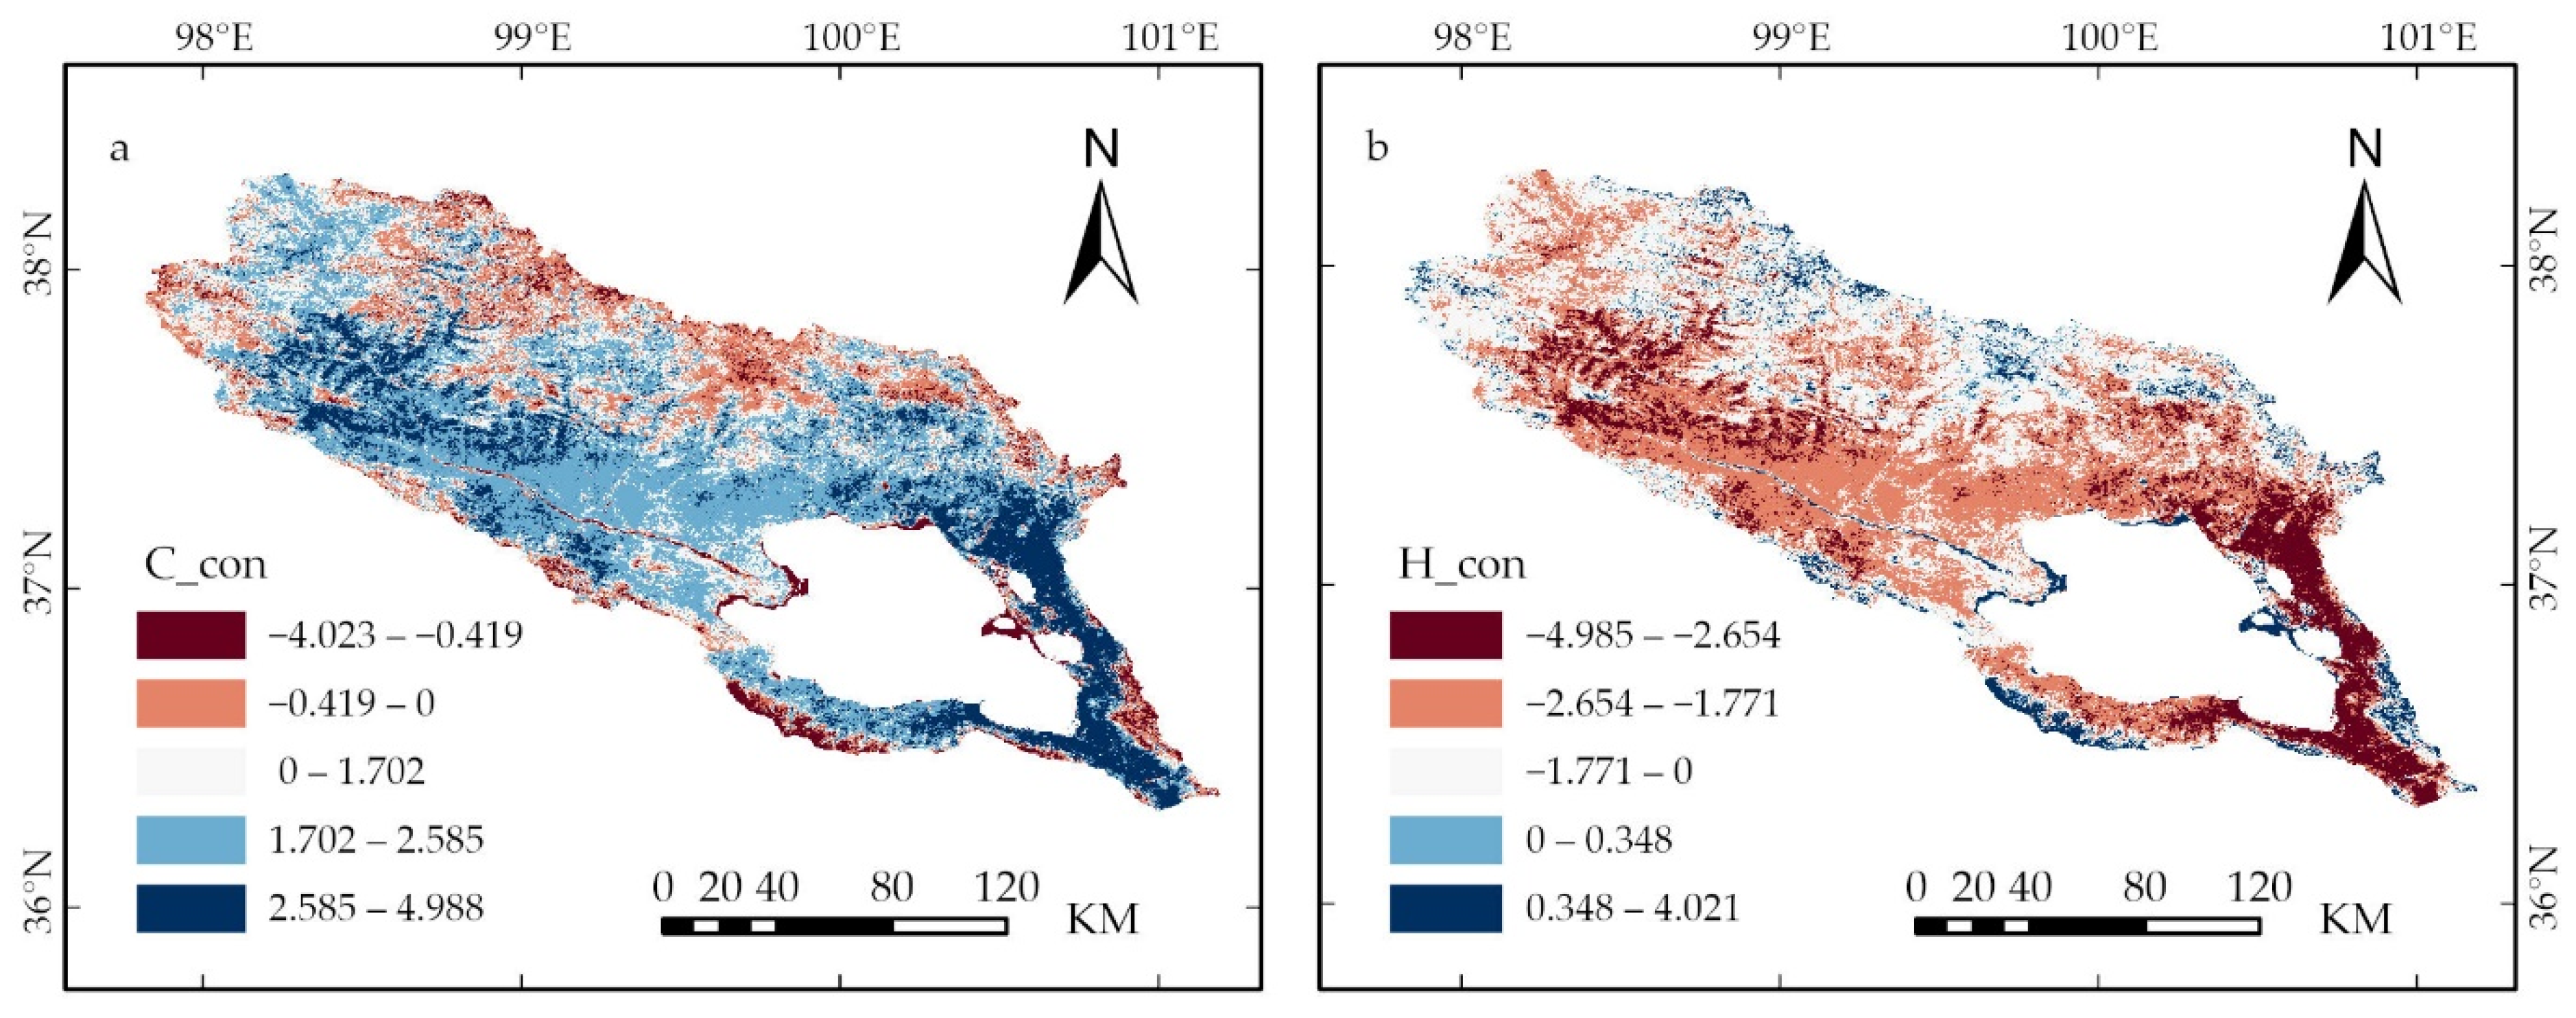
Based on the results of T_con and P_con, the spatial distribution contribution of climate change (C_con) and human activities (H_con) to the interannual variation of NDVI is obtained (Figure 8). From 2000 to 2020, the average annual C_con value was 1.62/a, ranging from −4.023–4.988/a (Figure 8a). The area with C_con > 0 accounted for 91.91% of the watershed area, and the area with C_con < 0 only accounted for 8.09% of the watershed area. Compared with C_con, human activities showed a strong negative impact on NDVI changes (Figure 8b): the area with H_con < 0 accounted for 91.9% of the watershed area, and the area with H_con > 0 accounted for 8.1% of the watershed area. Overall, in 2000–2020, H_con was −1.618/a, ranging from −4.985–4.021/a.

3.5. Distribution and Greening of Vegetation along the Altitude Gradient

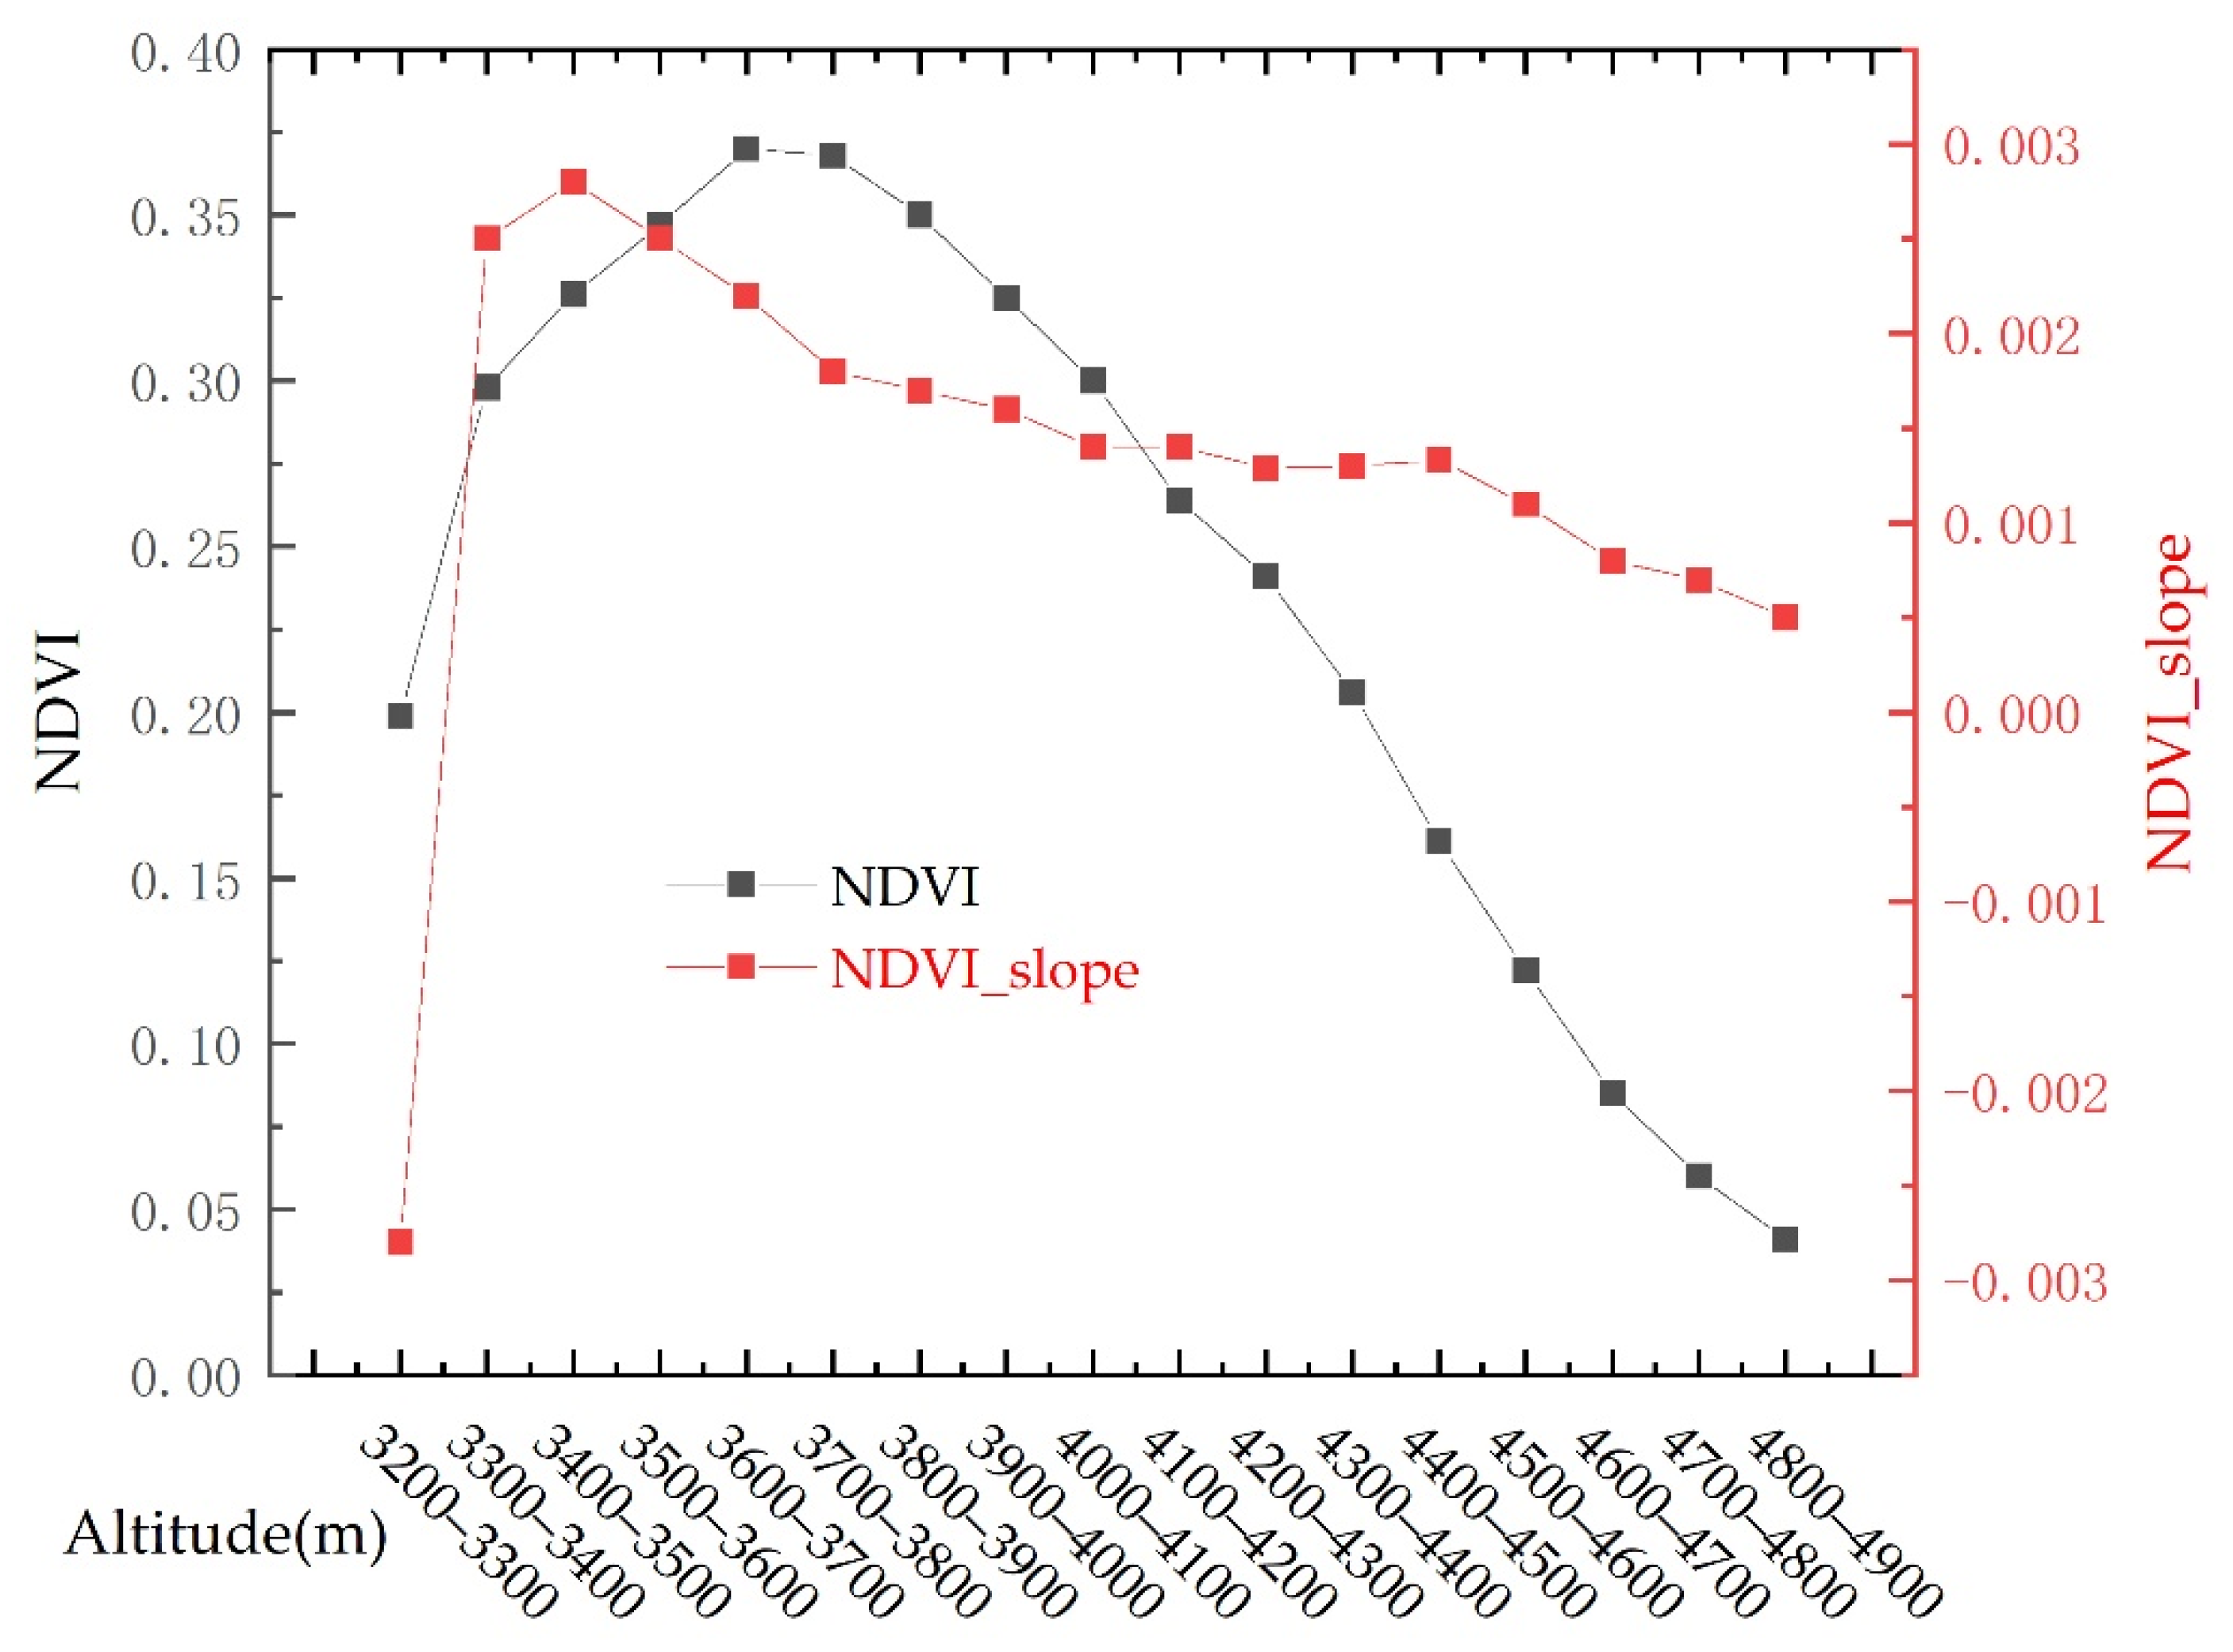
Figure 9 shows the distribution of NDVI along the altitude gradient and the greening trend in the QLB. NDVI decreased significantly along the elevation gradient (R2 = 0.73, p < 0.01), and NDVI decreased by 0.02 for every 100m of increase in altitude. Among these, NDVI rises rapidly below 3600 m, reaches the highest value (0.37/a) at 3600–3700 m, and then decreases continuously. Above 4600 m, NDVI is less than 0.1, and almost no vegetation grows. This can be seen from the trend of vegetation greening according to the altitude gradient. Vegetation at 3200–3300 m shows a trend of degradation, vegetation greening at 3300–3500 m is accelerated, and vegetation greening above 3500 m is slowed down.
Figure 10 shows the change slopes of the climatic factors and the distribution of their contributions to vegetation cover changes along the altitudinal gradient. The mean values of T_con and P_con over the altitude gradient are 0.0032/a and 1.296/a, respectively. For every 100m increase in altitude, T_con and P_con decreased by 0.0792/a (R2 = 0.27, p < 0.01) and 0.0006 (R2 = 0.27, p < 0.05), respectively. In terms of the changing trend, from 3200 to 3300 m, the T rises faster, and the P increases less, and T_con and P_con were −0.006/a and −0.39/a, respectively. Water limitation may be the main reason for vegetation growth. From 3300 to 3400 m, the obvious climate warming and humidification led to a rapid increase in T_con and P_con. From 3400 to 3500 m, T rises slowly, T_con remains at the maximum value (0.009/a), P continues to increase, P_con increases to the maximum value (2.383/a), and the increase in precipitation may be the main reason for vegetation greening. Above 3500 m, P increased rapidly, but temperature decreased rapidly, and T_con and P_con continued to decrease. T was the main reason for the limiting of vegetation greening.
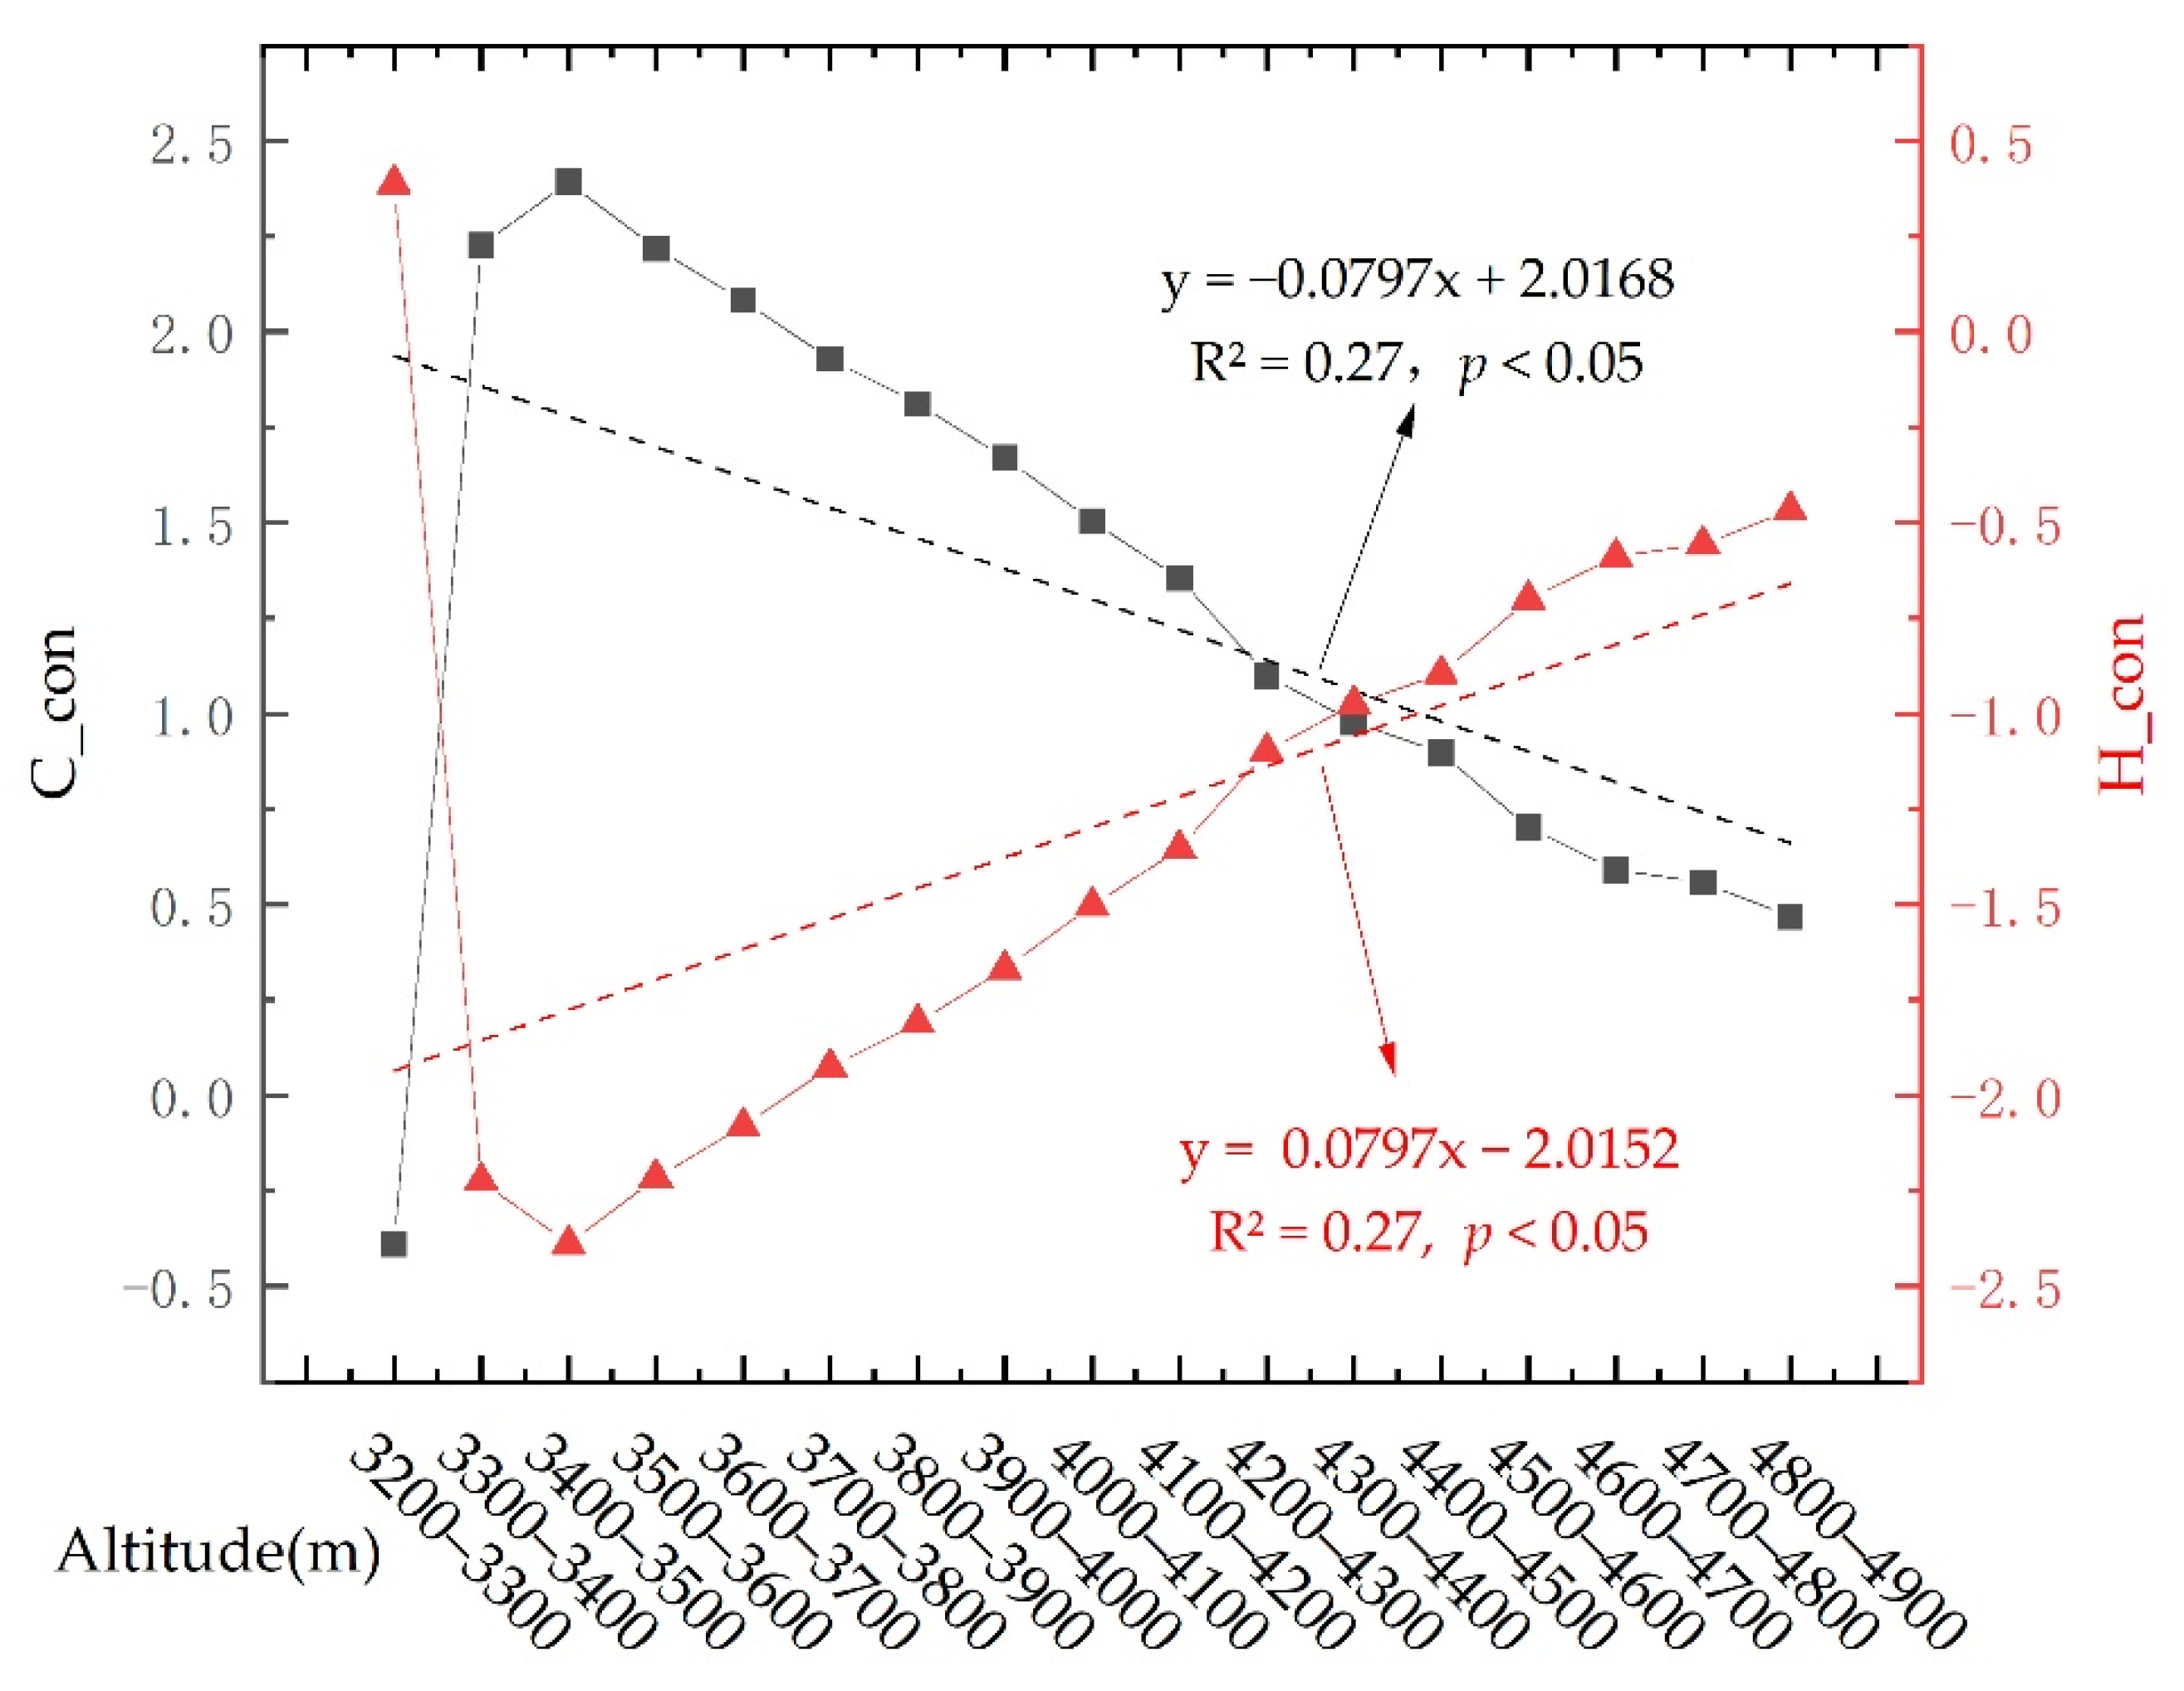
Figure 11 shows the distribution of C_con and H_con over the altitude gradient. At 3200–3300 m, C_con and H_con reached the lowest value (−0.39/a) and the highest value (0.389/a), respectively. From 3300 m to 3500 m, C_con rises rapidly, and H_con falls quickly, reaching the maximum value (2.392/a) and the minimum value (−2.389/a), respectively. Above 3500 m, the importance of C_con > 0 and H_con < 0 continued to decrease, and the absolute value of the former was greater than that of the latter, indicating that vegetation greening was mainly affected by climate change. Overall, the favorable impact of climate change on vegetation cover (C_con = 1.299/a) along the altitude gradient was higher than the unfavorable impact of human activities (H_con = −1.298/a).

4. Discussion

4.1. Three-Dimensional Distribution Pattern of Vegetation Cover

A multi-dimensional assessment of vegetation cover changes in the Qinghai-Tibet Plateau is essential for understanding the sustainability of the livelihoods of the pastoralists. This study explored the changes in vegetation cover in the QLB from the three dimensions of temporal, spatial, and altitudinal aspects and obtained many interesting results. From the temporal dimension, the vegetation coverage of the QLB increased significantly, consistent with the research results of Xiong and Han et al. [21,49], further confirming the greening trend of the QLB vegetation. From the spatial dimension, the vegetation has only been degraded in the northern part of the QLB and a small part of the lakeshore over the past 21 years. Compared with the areas with degraded vegetation, the area of greenery is much larger. Interestingly, the areas with low vegetation coverage in the QLB did not degrade significantly, but showed a greening trend, and the spatial heterogeneity of different vegetation coverage degradation levels also existed in other areas of the Qinghai-Tibet Plateau [50]. The QLB is the same as the Qinghai-Tibet Plateau from the altitudinal dimension. The altitude determines the vegetation distribution pattern [51], which is also the main reason for the heterogeneity of vegetation greening along the altitude gradient [52]. Therefore, analyzing the influence of altitudinal factors on vegetation changes is of great significance to better understand the interaction mechanism of vegetation–climate–human on the Qinghai-Tibet Plateau.

4.2. Methods to Quantitatively Assess Changes in Vegetation Caused by Climate Change and Human Activities

Quantitatively assessing the relative contributions of climate change and human activities from complex long-term changes in vegetation is challenging. Hence, this study selected NDVI as the evaluation index of vegetation coverage. It used multiple regression and partial derivative residual analysis to determine the main factors of vegetation change in alpine regions. We found that using one of the residual methods alone to determine the factors contributing to changes in vegetation cover is insufficient, and the resulting data may “lie”. The vegetation coverage of the QLB showed extensive and significant growth from 2000 to 2020. From the partial derivative residual analysis results (Figure 8), human activities did not seem to contribute positively to the greening of the QLB. The residual analysis based on multiple regression shows that the time difference of the intensity of human activities on vegetation coverage is the main reason for this “wrong” result. Yin et al. [53] also confirmed that unreasonable human activities were the main reason for the decline in vegetation cover in the QLB in the first decade of the 21st century. Still, on the whole, the positive impact of human activities on vegetation cover is increasing [28]. Therefore, the combined use of multiple regression and partial derivative residual analysis is superior to the results obtained by using a single method because it can quantify the contribution of influencing factors and monitor the impact of influencing factors on vegetation changes, but also avoid neglecting the impact of human activities on vegetation cover change in temporal and spatial dimensions in research. The effect of human activities on vegetation cover changes over time and space provides a new attempt to guide the sustainable development of the human–land relationship in grassland ecosystems.

4.3. The Impact of Climate Change on Changes in Vegetation Cover

As the “magnifying glass” of global climate change, the effects of T and P changes on vegetation coverage in the Qinghai-Tibet Plateau have been confirmed in many studies [54,55]. Previous studies have shown that climate warming may alter vegetation phenology, leading to an earlier vegetation growth season and promoting vegetation growth in high-latitude cold and wet areas [56]. However, we found that the increase in T of the QLB is limited, and the T_con to the growth in vegetation cover is not significant. T_con was positive only in regions where T was higher and became warmer (Figure 4a,c). On the contrary, due to the cold and rainy climate characteristics of the QLB [57], C_con humidification contribution to the increase in vegetation cover is higher, with P_con more than 300 times that of T_con. Previous studies also came to the same conclusion that the alpine steppe in the northeastern Qinghai-Tibet Plateau showed a strong response to P changes [58,59]; water availability was the main factor limiting vegetation growth of the QLB [44], and P increase was the main climatic factor of greening in the QLB [38].
The vegetation coverage in the QLB shows a degradation trend in the area with the lowest altitude (3200–3300 m), and the negative contribution of P (−0.389/a) is much higher than that of T (−0.006/a), which may be due to the high water consumption of vegetation. While precipitation increases but still cannot meet the water demand of vegetation, an increase in temperature instead leads to a decrease in available water for vegetation. Wang et al. [37] showed that the water consumption of the QLB vegetation decreases significantly along the altitude gradient and is higher at 3200–3300 m (more than 300 mm). In addition, it is generally believed that the coastal gradient greening of vegetation will be subject to more low-temperature restrictions, and the hydrothermal conditions required for its growth will also change significantly [60]. However, we found that climate warming caused the limitation of vegetation greening along the altitude gradient of T in the QLB to be narrowed, with vegetation greening displayed above 3300 m above sea level (NDVIslope > 0). This phenomenon also exists in other areas of the Qinghai-Tibet Plateau [52,61], mainly due to the increase in T rise in the alpine region, which increases the melting of permafrost, ice, and snow [62].

4.4. The Impact of Human Activities on Changes in Vegetation Cover

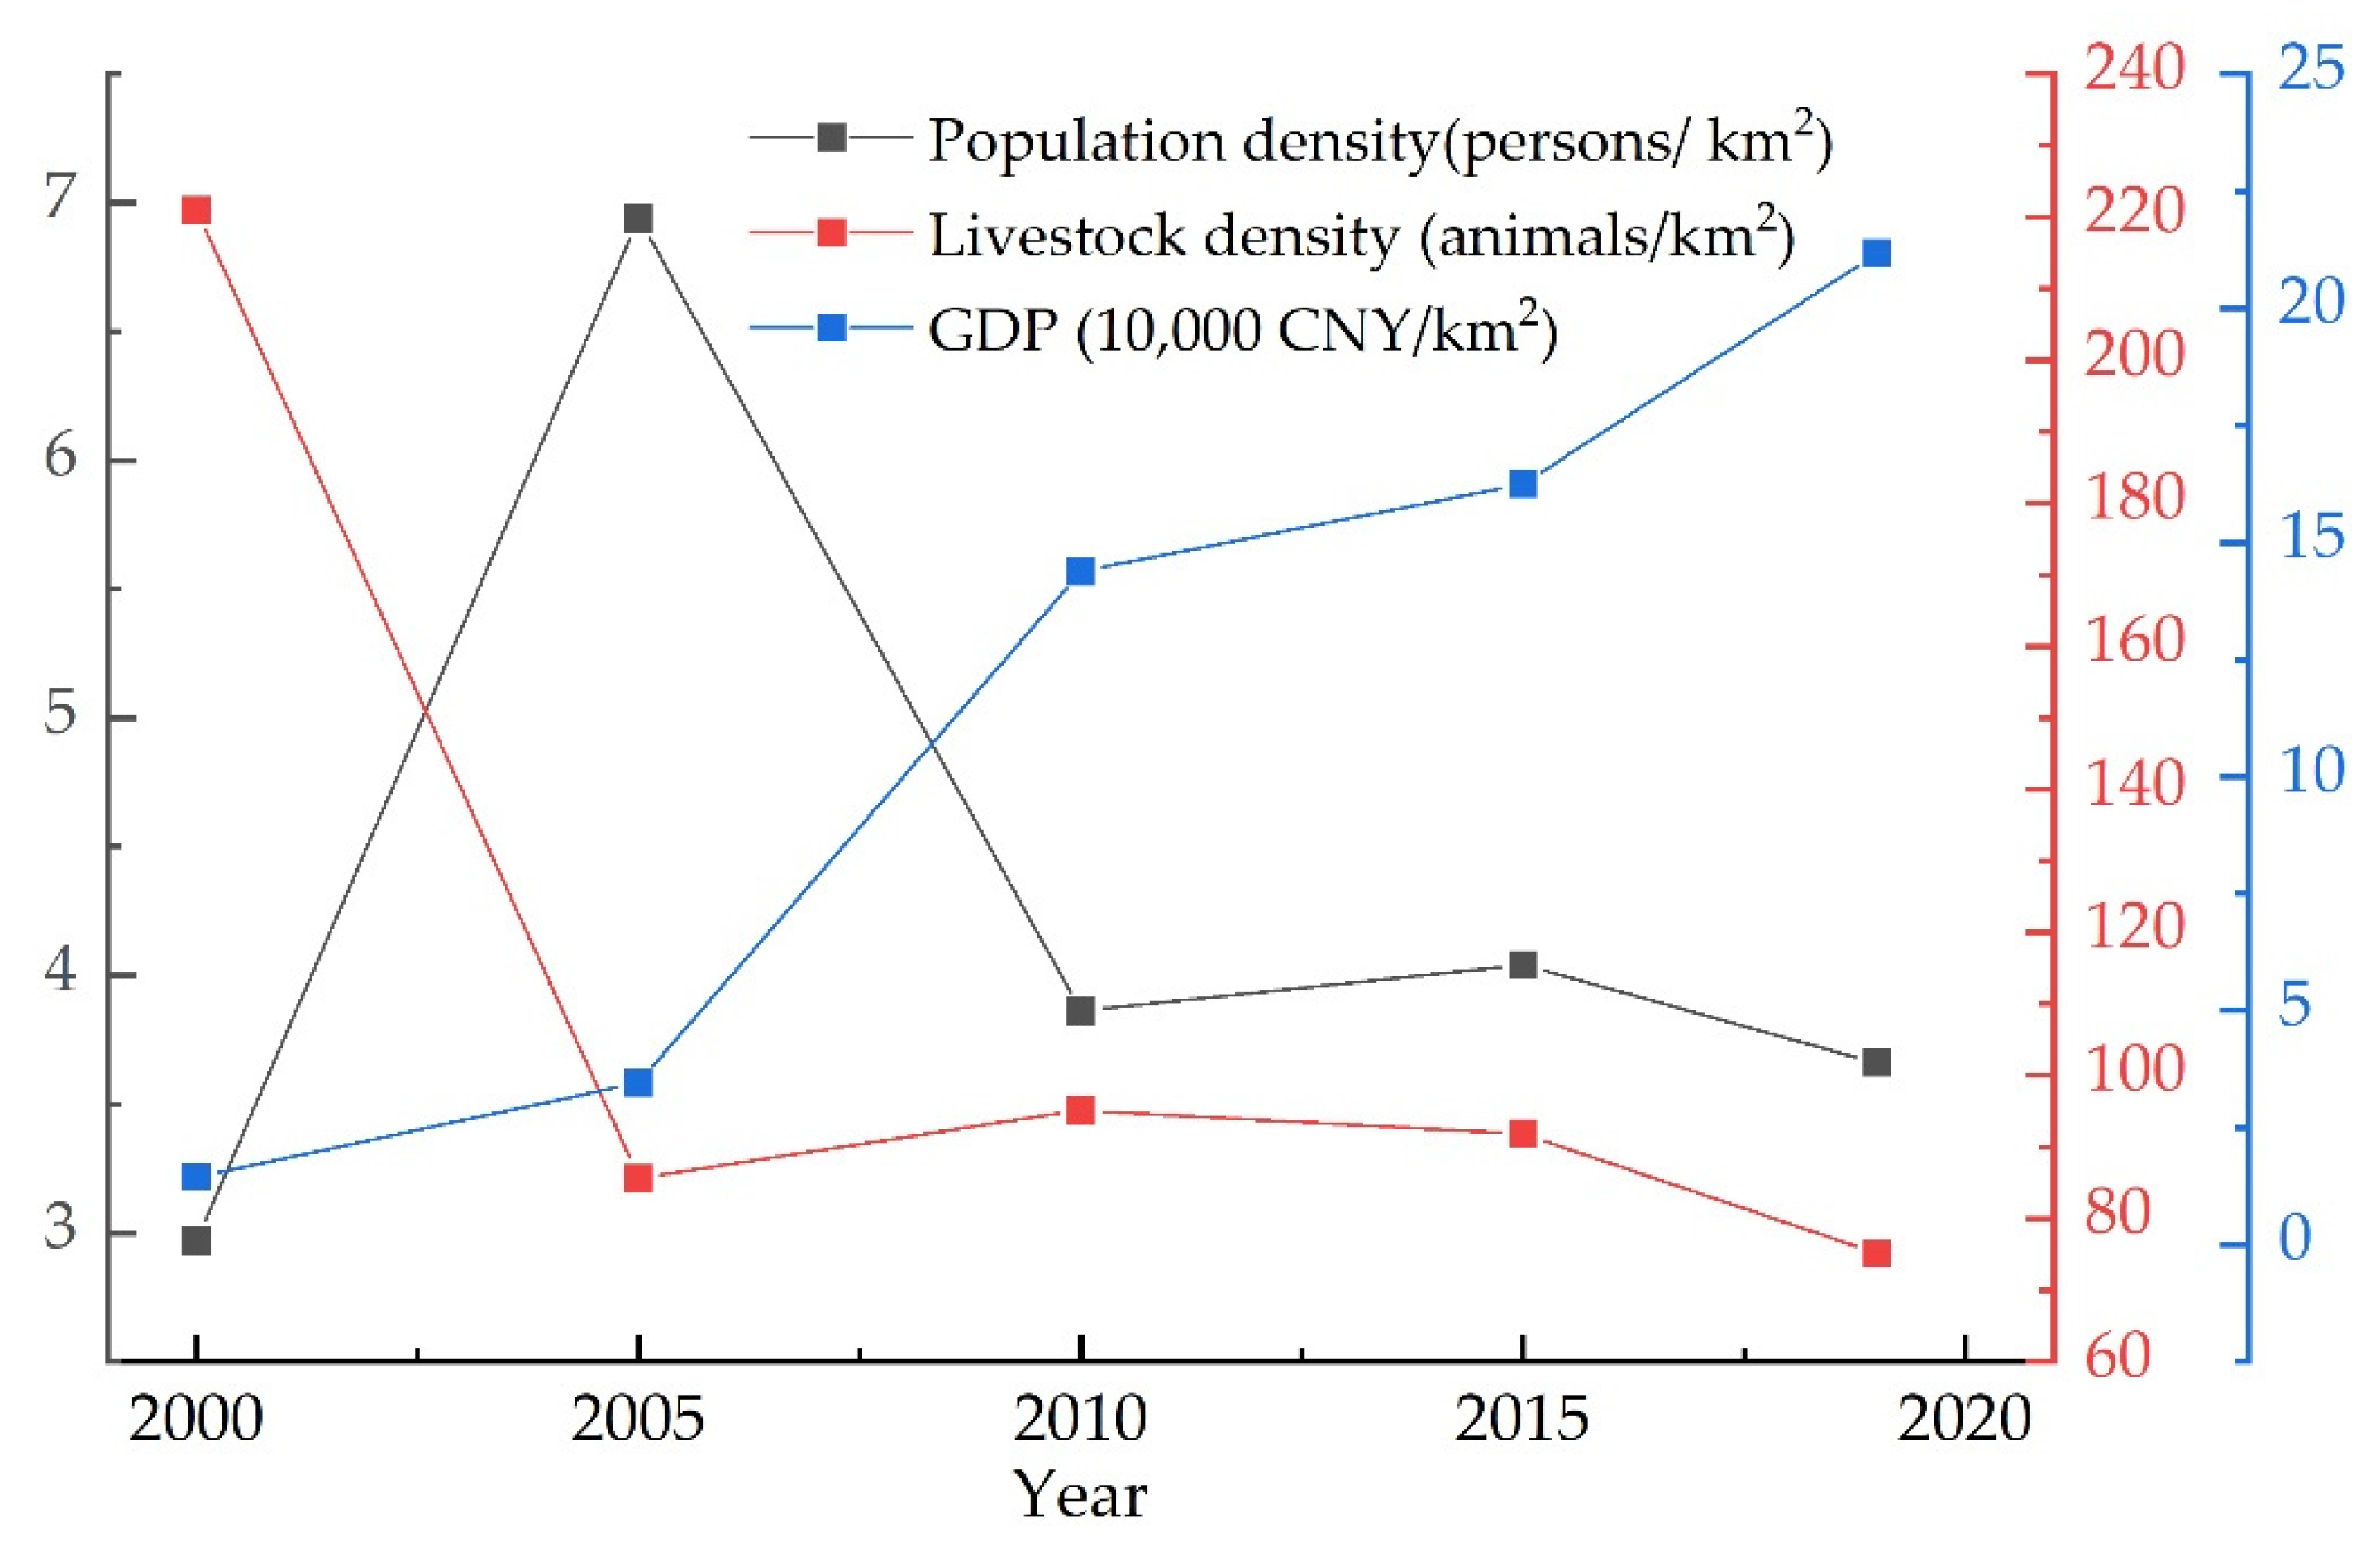
As the external driving force for the change in the QLB grassland ecosystem, human activities showed a change process of “continuous-deterioration long-term fluctuation-benign maintenance” over the 21 years (Figure 5a). From 2000 to 2004, the population density of QLB increased rapidly, from 2.97 persons/km2 to 6.94 persons/km2 (Figure 12). Herders had to raise more livestock to ensure their livelihoods, resulting in the highest number of animals per unit area in the past 21 years (Figure 12). All these may be the reasons for the continuous deterioration of vegetation cover. Wang et al. showed that the population of the QLB increased rapidly before 2005, resulting in unreasonable land use, increased grazing intensity, desertification, environmental pollution, and other serious problems becoming more prominent, which caused the vegetation cover to deteriorate continuously [63]. From 2005 to 2014, the Chinese government successively implemented ecological, environmental protection, and comprehensive management projects, such as the return of grazing land to grassland, wetland protection, degraded grassland management, and seasonal grazing prohibition. The population also declined rapidly (Figure 12), and vegetation degradation began to decrease. However, due to factors such as industrial structure, livelihood habits, and ecological engineering periodicity, the H_con was < 0 most of the time. From 2015 to 2020, the continuous decline in population and livestock numbers reduced direct pressure on vegetation. On the other hand, with the income from grassland subsidies, grazing prohibition subsidies, tourism development, etc., the livelihood structure of QLB herders is gradually diversifying, which is also conducive to the continuous greening of vegetation. By 2021, the proportion of the primary industry in the QLB had dropped to 24.62%, while the proportion of the tertiary industry, dominated by eco-tourism, had reached 51.27%, completing the structural transformation of livelihoods in the QLB. In general, once human activities adversely affect vegetation cover, the speed of recovery will be prolonged. This has important implications for further understanding the fragility of the QLB ecosystem.
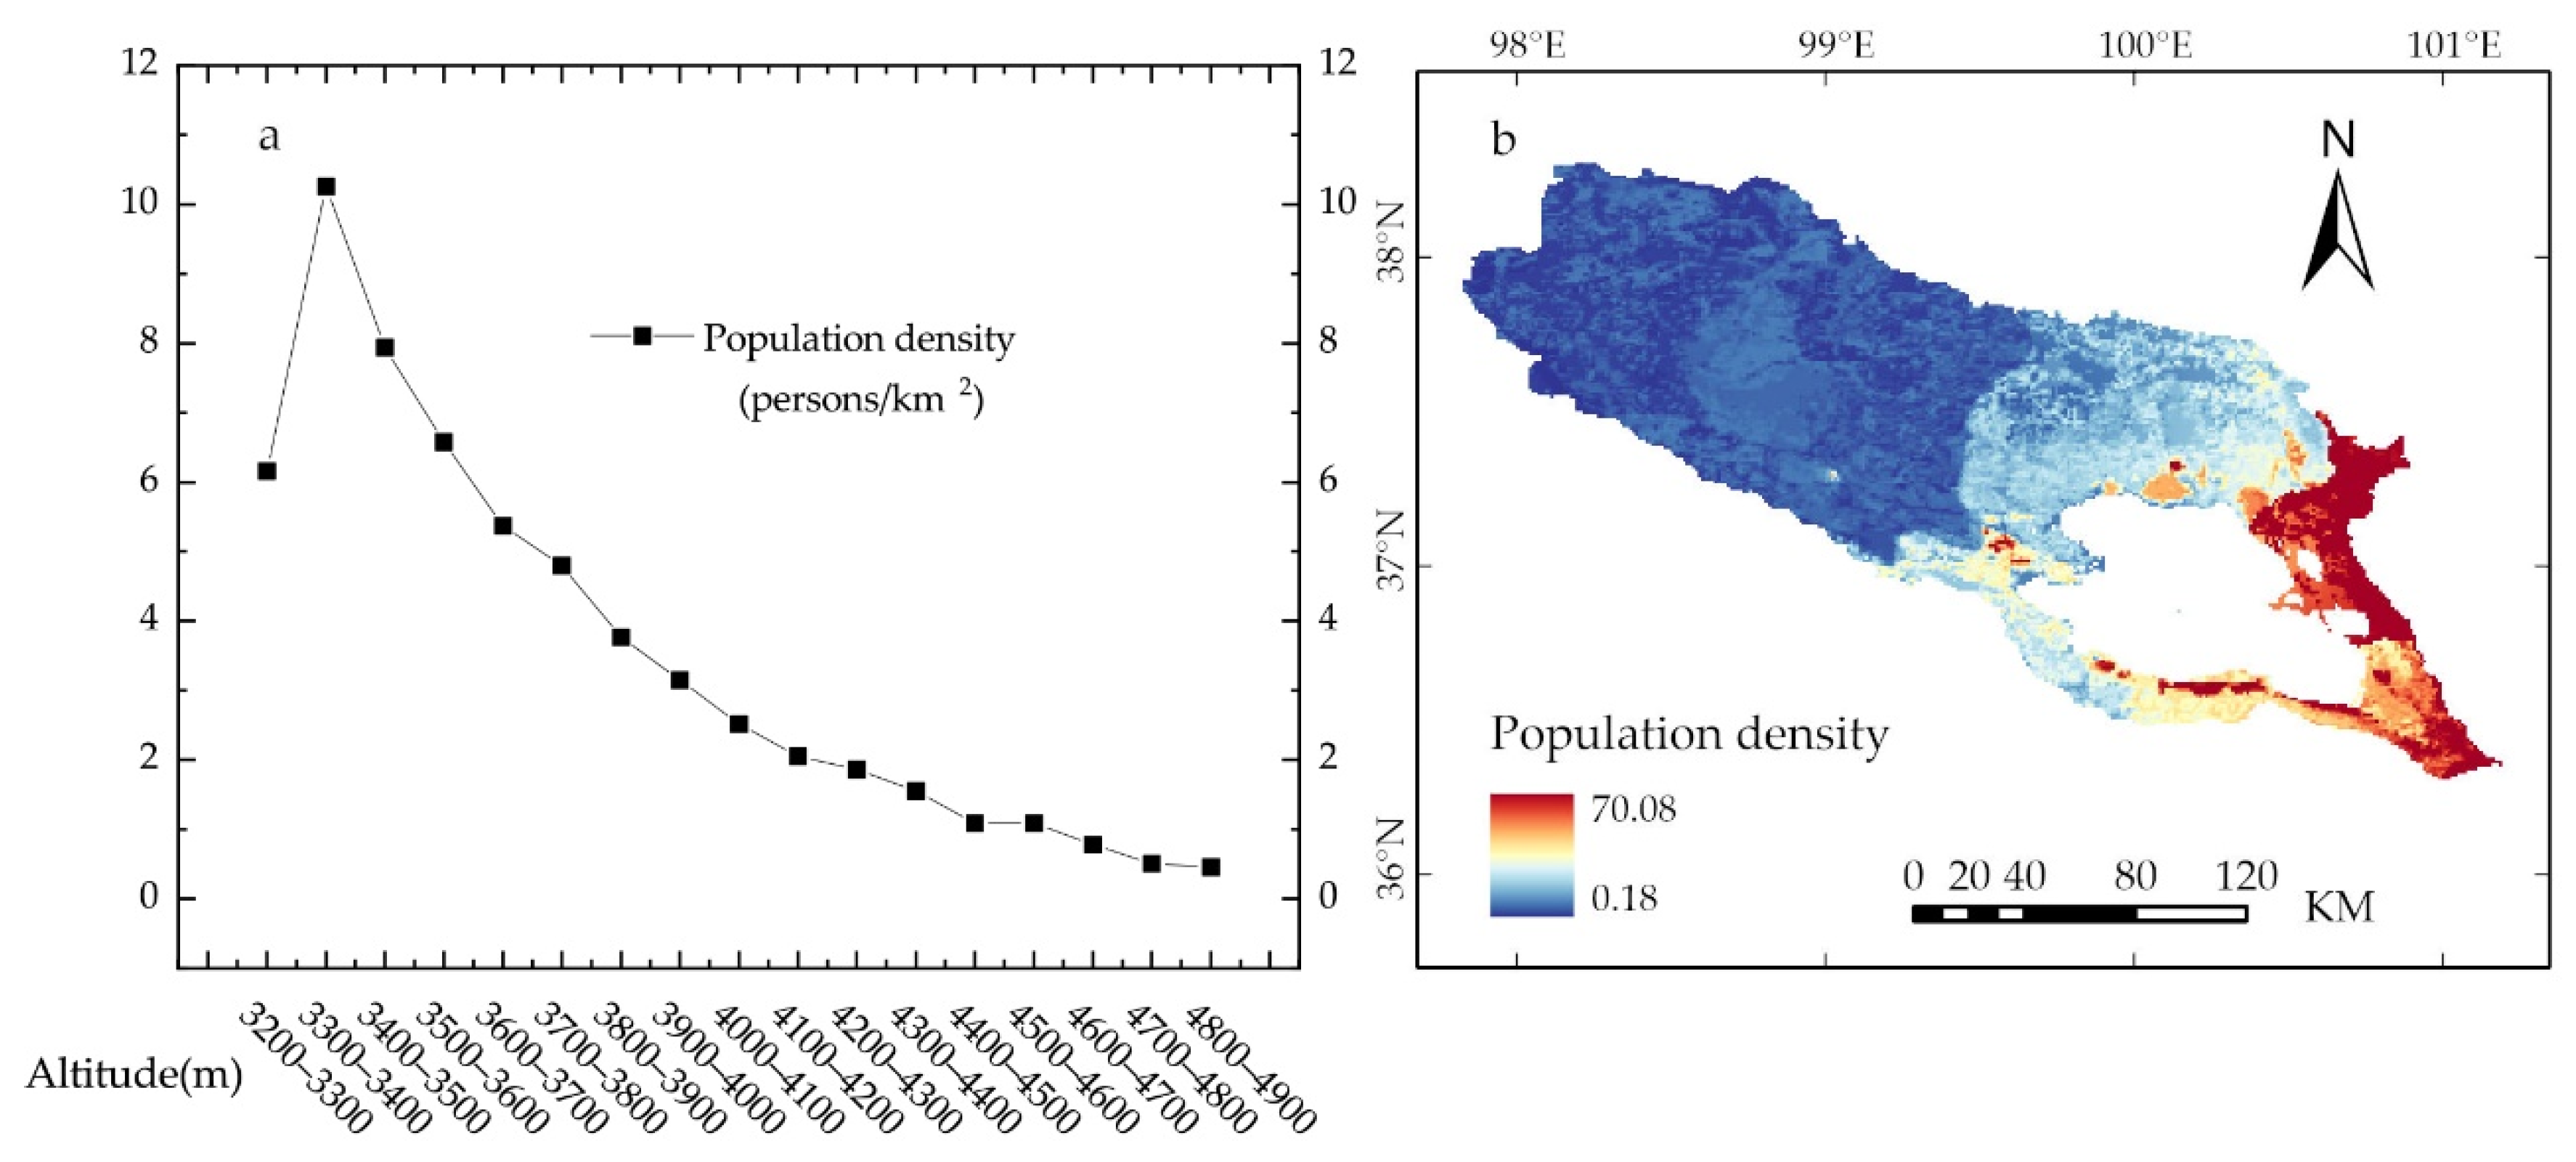
Spatially and altitudinally, the vegetation greening of the QLB under the influence of human activities seems to be fragile. The favorable impact of climate warming and wetting on vegetation greening is almost equivalent to the adverse effects of human activities (C_con and H_con are 1.62/a and −1.618/a, respectively). In other words, if the intensity of climate warming and wetting is weakened, the vegetation cover of the QLB may deteriorate rapidly, even if the intensity of human activities remains unchanged, which will affect regional ecological security and herders’ livelihoods. Furthermore, our study found that H_con reached the highest value (0.389/a) at 3200–3300 m, while these areas are located around the shore of Qinghai Lake and belong to the core protected areas of the QLB, where ecological engineering and grazing prohibition may be the main reasons for increased vegetation cover. From 3300–3500 m, H_con drops rapidly to reach the minimum (−2.389/a). There are four towns in these areas (Figure 1), two of which are county towns (Gangcha County and Tianjun County), and the population is nearly three times that of low-altitude areas (below 3300 m, Figure 13a). Studies have shown that the rapid development of cities and towns, and the population increase over the past 21 years, are the main reasons for the lowest H_con value [64]. Above 3500 m, the altitude increase in the QLB neither restricts human activities, nor reduces their intensity. For example, in the middle and upper reaches of the Buha River, where population density is low (Figure 13b), the negative contribution of human activities remains high, which is mainly determined by the livelihood patterns of local pastoralists, where pasture and water distribution are the main factors in the choice of grazing location.
As in other parts of the world, the vegetation of the QLB is facing dual pressures from climate change and human activities [54,65]. However, the factors affecting vegetation cover are multifaceted. This research selected only T and P as the variable climate factors, ignoring other natural factors, such as solar radiation [46], snow-covered areas [66], and the impact of human activities on vegetation cover. Additionally, the impact of the rising lake level of Qinghai Lake on vegetation coverage cannot be ignored. Recent studies have shown that the lake area of Qinghai Lake increased by 156.31 km2 from 2000 to 2014, the total length of the shoreline increased by 8.01 km, and the maximum advancing distance of the shoreline reached 2.5 km [67], especially in the east, north, and west areas of the lakeshore, which is essential for the vegetation degradation around Qinghai Lake over the past 21 years (Figure 3b). All of the above need to be further quantified in future research.

5. Conclusions

From 2000 to 2020, the NDVI of the QLB increased significantly (0.002/a, p < 0.01), with 91.38% of the area showing a greening trend, and only 8.62% of the area showing a degrading trend. T_con and P_con were positive to vegetation greening, and P_con was more than 300 times that of T_con. C_con and H_con were 1.62/a and −1.618/a, respectively. There are obvious differences in the distribution and change of vegetation cover along the altitude gradient. Vegetation coverage decreased significantly along the altitude gradient (−0.02/a, p < 0.01), with the highest vegetation coverage at 3600–3700 m (0.37/a). C_con, H_con, T_con, and P_con were 1.299/a, −1.29/a, 0.003/a, and 1.296/a, respectively. From 3200 to 3300 m, the negative contribution of climate change was the highest (−0.39/a), and the positive contribution of human activities was the highest (0.389/a). At 3400–3500 m, the positive contribution of climate change and the negative contribution of human activities were the highest, 2.392/a and −2.389/a, respectively.
In general, the temporal difference in the intensity of human activities was the main reason for the lower H_con value over the past 21 years. The greening of vegetation in the QLB depends not only on warming and humidification caused by climate change, but also on the increase in the positive impact of human activities after 2010.

Author Contributions

Conceptualization, methodology, software, writing—original draft preparation, and visualization: Z.S.; validation, formal analysis, and data curation: Z.G.; writing—review and editing: X.Y.; supervision, project administration, and funding acquisition, Y.G. All authors have read and agreed to the published version of the manuscript.

Funding

This study was funded by the Second Qinghai-Tibet Plateau Scientific Expedition and Research Program (grant number: 2019QZKK0608), the Natural Science Foundation of Qinghai Province (grant number: 2021-ZJ-909), the Second Qinghai-Tibet Plateau Scientific Expedition and Research Program (grant number: SQ2019QZKK2905), and the Key Laboratory of Tibetan Plateau Land Surface Processes and Ecological Conservation (Ministry of Education) Free Exploratory Research Project (grant number: TGEZT-2021-04).

Institutional Review Board Statement

Not applicable.

Informed Consent Statement

Not applicable.

Data Availability Statement

Publicly available datasets were analyzed in this study. This data can be found here: https://search.earthdata.nasa.gov/ (accessed on 15 November 2021), http://www.gscloud.cn/ (accessed on 12 January 2022), http://www.geodata.cn (accessed on 23 December 2021), and https://www.resdc.cn/ (accessed on 8 February 2022).

Acknowledgments

We acknowledge the data support from the National Earth System Science Data Center, National Science and Technology Infrastructure of China. (http://www.geodata.cn, accessed on 23 December 2021). The authors would like to thank three anonymous reviewers for their valuable comments that improved the quality of this manuscript.

Conflicts of Interest

The authors declare no conflict of interest.

References

  1. Piao, S.; Yin, G.; Tan, J.; Cheng, L.; Huang, M.; Li, Y.; Liu, R.; Mao, J.; Myneni, R.B.; Peng, S. Detection and attribution of vegetation greening trend in China over the last 30 years. Global Chang. Biol. 2015, 21, 1601–1609. [Google Scholar] [CrossRef] [PubMed]
  2. Fu, B.; Wang, S.; Liu, Y.; Liu, J.; Liang, W.; Miao, C. Hydrogeomorphic ecosystem responses to natural and anthropogenic changes in the Loess Plateau of China. Annu Rev. Earth Planet. Sci. 2017, 45, 223–243. [Google Scholar] [CrossRef]
  3. Yang, K.; Ye, B.; Zhou, D.; Wu, B.; Foken, T.; Qin, J.; Zhou, Z. Response of hydrological cycle to recent climate changes in the Tibetan Plateau. Clim. Chang. 2011, 109, 517–534. [Google Scholar] [CrossRef]
  4. Jin, L.; Ganopolski, A.; Chen, F.; Claussen, M.; Wang, H. Impacts of snow and glaciers over Tibetan Plateau on Holocene climate change: Sensitivity experiments with a coupled model of intermediate complexity. Geophys. Res. Lett. 2005, 32, L17709. [Google Scholar] [CrossRef] [Green Version]
  5. Zeng, Z.; Piao, S.; Li, L.Z.; Zhou, L.; Ciais, P.; Wang, T.; Li, Y.; Lian, X.; Wood, E.F.; Friedlingstein, P. Climate mitigation from vegetation biophysical feedbacks during the past three decades. Nat. Clim. Chang. 2017, 7, 432–436. [Google Scholar] [CrossRef]
  6. Fu, B.; Li, S.; Yu, X.; Yang, P.; Yu, G.; Feng, R.; Zhuang, X. Chinese ecosystem research network: Progress and perspectives. Ecol. Complex. 2010, 7, 225–233. [Google Scholar] [CrossRef]
  7. Wen, Z.; Wu, S.; Chen, J.; Lü, M. NDVI indicated long-term interannual changes in vegetation activities and their responses to climatic and anthropogenic factors in the Three Gorges Reservoir Region, China. Sci. Total Environ. 2017, 574, 947–959. [Google Scholar] [CrossRef]
  8. Zhong, L.; Ma, Y.; Xue, Y.; Piao, S. Climate change trends and impacts on vegetation greening over the Tibetan Plateau. J. Geophys. Res. Atmos. 2019, 124, 7540–7552. [Google Scholar] [CrossRef]
  9. Du, Z.; Zhang, X.; Xu, X.; Zhang, H.; Wu, Z.; Pang, J. Quantifying influences of physiographic factors on temperate dryland vegetation, Northwest China. Sci. Rep. 2017, 7, 40092. [Google Scholar] [CrossRef]
  10. Li, Y.-Y.; Dong, S.-K.; Wen, L.; Wang, X.-X.; Wu, Y. Soil carbon and nitrogen pools and their relationship to plant and soil dynamics of degraded and artificially restored grasslands of the Qinghai–Tibetan Plateau. Geoderma 2014, 213, 178–184. [Google Scholar] [CrossRef]
  11. Elvidge, C.D.; Chen, Z. Comparison of broad-band and narrow-band red and near-infrared vegetation indices. Remote Sens. Environ. 1995, 54, 38–48. [Google Scholar] [CrossRef]
  12. Yue, Y.; Zhang, B.; Wang, K.; Liu, B.; Li, R.; Jiao, Q.; Yang, Q.; Zhang, M. Spectral indices for estimating ecological indicators of karst rocky desertification. Int. J. Remote Sens. 2010, 31, 2115–2122. [Google Scholar] [CrossRef]
  13. Gocic, M.; Trajkovic, S. Analysis of precipitation and drought data in Serbia over the period 1980–2010. J. Hydrol. 2013, 494, 32–42. [Google Scholar] [CrossRef]
  14. Hadjimitsis, D.G.; Papadavid, G.; Agapiou, A.; Themistocleous, K.; Hadjimitsis, M.; Retalis, A.; Michaelides, S.; Chrysoulakis, N.; Toulios, L.; Clayton, C. Atmospheric correction for satellite remotely sensed data intended for agricultural applications: Impact on vegetation indices. Nat. Hazards Earth Syst. Sci. 2010, 10, 89–95. [Google Scholar] [CrossRef] [Green Version]
  15. Wiegand, C.; Richardson, A.; Escobar, D.; Gerbermann, A. Vegetation indices in crop assessments. Remote Sens. Environ. 1991, 35, 105–119. [Google Scholar] [CrossRef]
  16. Piao, S.; Fang, J.; Zhou, L.; Guo, Q.; Henderson, M.; Ji, W.; Li, Y.; Tao, S. Interannual variations of monthly and seasonal normalized difference vegetation index (NDVI) in China from 1982 to 1999. J. Geophys Res. Atmos. 2003, 108, 4401. [Google Scholar] [CrossRef]
  17. Huete, A.R. A soil-adjusted vegetation index (SAVI). Remote Sens. Environ. 1988, 25, 295–309. [Google Scholar] [CrossRef]
  18. Höpfner, C.; Scherer, D. Analysis of vegetation and land cover dynamics in north-western Morocco during the last decade using MODIS NDVI time series data. Biogeosciences 2011, 8, 3359–3373. [Google Scholar] [CrossRef] [Green Version]
  19. Zhang, Y.; Ye, A. Spatial and temporal variations in vegetation coverage observed using AVHRR GIMMS and Terra MODIS data in the mainland of China. Int. J. Remote Sens. 2020, 41, 4238–4268. [Google Scholar] [CrossRef]
  20. Pang, G.; Wang, X.; Yang, M. Using the NDVI to identify variations in, and responses of, vegetation to climate change on the Tibetan Plateau from 1982 to 2012. Quatern. Int. 2017, 444, 87–96. [Google Scholar] [CrossRef]
  21. Xiong, Q.; Xiao, Y.; Halmy, M.W.A.; Dakhil, M.A.; Liang, P.; Liu, C.; Zhang, L.; Pandey, B.; Pan, K.; El Kafraway, S.B. Monitoring the impact of climate change and human activities on grassland vegetation dynamics in the northeastern Qinghai-Tibet Plateau of China during 2000–2015. J. Arid. Land 2019, 11, 637–651. [Google Scholar] [CrossRef] [Green Version]
  22. Duan, H.; Xue, X.; Wang, T.; Kang, W.; Liao, J.; Liu, S. Spatial and temporal differences in alpine meadow, alpine steppe and all vegetation of the Qinghai-Tibetan Plateau and their responses to climate change. Remote Sens. 2021, 13, 669. [Google Scholar] [CrossRef]
  23. Zhang, Z.; Chang, J.; Xu, C.-Y.; Zhou, Y.; Wu, Y.; Chen, X.; Jiang, S.; Duan, Z. The response of lake area and vegetation cover variations to climate change over the Qinghai-Tibetan Plateau during the past 30 years. Sci. Total Environ. 2018, 635, 443–451. [Google Scholar] [CrossRef] [PubMed]
  24. Wu, J.; Li, M.; Zhang, X.; Fiedler, S.; Gao, Q.; Zhou, Y.; Cao, W.; Hassan, W.; Mărgărint, M.C.; Tarolli, P. Disentangling climatic and anthropogenic contributions to nonlinear dynamics of alpine grassland productivity on the Qinghai-Tibetan Plateau. J. Environ. Manage. 2021, 281, 111875. [Google Scholar] [CrossRef] [PubMed]
  25. Liu, Y.; Liu, S.; Sun, Y.; Li, M.; An, Y.; Shi, F. Spatial differentiation of the NPP and NDVI and its influencing factors vary with grassland type on the Qinghai-Tibet Plateau. Environ. Monit. Assess. 2021, 193, 48. [Google Scholar] [CrossRef] [PubMed]
  26. Guo, B.; Zhou, Y.; Wang, S.-X.; Tao, H.-P. The relationship between normalized difference vegetation index (NDVI) and climate factors in the semiarid region: A case study in Yalu Tsangpo River basin of Qinghai-Tibet Plateau. J. Mt. Sci. 2014, 11, 926–940. [Google Scholar] [CrossRef]
  27. Li, H.; Liu, L.; Liu, X.; Li, X.; Xu, Z. Greening implication inferred from vegetation dynamics interacted with climate change and human activities over the Southeast Qinghai–Tibet Plateau. Remote Sens. 2019, 11, 2421. [Google Scholar] [CrossRef] [Green Version]
  28. Chen, J.; Yan, F.; Lu, Q. Spatiotemporal variation of vegetation on the Qinghai–Tibet Plateau and the influence of climatic factors and human activities on vegetation trend (2000–2019). Remote Sens. 2020, 12, 3150. [Google Scholar] [CrossRef]
  29. Masson-Delmotte, V.; Zhai, P.; Pirani, A.; Conners, S.L.; Péan, C.; Berger, S.; Caud, N.; Chen, Y.; Goldfarb, L.; Gomis, M.I.; et al. Climate change 2021: The physical science basis. Contribution of working group I to the sixth assessment report of the intergovernmental panel on climate change. In Proceedings of the Intergovernmental Panel on Climate Change AR6, Remote, 26 July–7 August 2021; Volume 2. Available online: https://www.ipcc.ch/report/ar6/wg1/ (accessed on 28 May 2022).
  30. Fan, Z.; Bai, X. Scenarios of potential vegetation distribution in the different gradient zones of Qinghai-Tibet Plateau under future climate change. Sci. Total Environ. 2021, 796, 148918. [Google Scholar] [CrossRef] [PubMed]
  31. Huang, K.; Zhang, Y.; Zhu, J.; Liu, Y.; Zu, J.; Zhang, J. The influences of climate change and human activities on vegetation dynamics in the Qinghai-Tibet Plateau. Remote Sens. 2016, 8, 876. [Google Scholar] [CrossRef] [Green Version]
  32. Zhao, H.; Liu, S.; Dong, S.; Su, X.; Wang, X.; Wu, X.; Wu, L.; Zhang, X. Analysis of vegetation change associated with human disturbance using MODIS data on the rangelands of the Qinghai-Tibet Plateau. Rangel. J. 2015, 37, 77–87. [Google Scholar] [CrossRef]
  33. Luo, L.; Ma, W.; Zhuang, Y.; Zhang, Y.; Yi, S.; Xu, J.; Long, Y.; Ma, D.; Zhang, Z. The impacts of climate change and human activities on alpine vegetation and permafrost in the Qinghai-Tibet Engineering Corridor. Ecol. Indic. 2018, 93, 24–35. [Google Scholar] [CrossRef]
  34. Ma, Q.; Chai, L.; Hou, F.; Chang, S.; Ma, Y.; Tsunekawa, A.; Cheng, Y. Quantifying grazing intensity using remote sensing in Alpine Meadows on Qinghai-Tibetan plateau. Sustainability 2019, 11, 417. [Google Scholar] [CrossRef] [Green Version]
  35. Gao, Y.; Huang, J.; Li, S.; Li, S. Spatial pattern of non-stationarity and scale-dependent relationships between NDVI and climatic factors—A case study in Qinghai-Tibet Plateau, China. Ecol. Indic. 2012, 20, 170–176. [Google Scholar] [CrossRef]
  36. Li, X.; Yang, Y.; Liu, Y. Research progress in man-land relationship evolution and its resource-environment base in China. J. Geogr. Sci. 2017, 27, 899–924. [Google Scholar] [CrossRef] [Green Version]
  37. Wang, Z.; Cao, S.; Cao, G. The Effect of Vegetative Coverage and Altitude on the Vegetation Water Consumption in the Alpine Inland River Basin of the Northeastern Qinghai–Tibet Plateau. Water 2022, 14, 1113. [Google Scholar] [CrossRef]
  38. Guo, W.; Ni, X.; Jing, D.; Li, S. Spatial-temporal patterns of vegetation dynamics and their relationships to climate variations in Qinghai Lake Basin using MODIS time-series data. J. Geog. Sci. 2014, 24, 1009–1021. [Google Scholar] [CrossRef]
  39. Yunlong, C.; Smit, B. Sustainable agriculture: Its status quo and trend in China. J. Chin. Geogr. 1996, 6, 1–12. [Google Scholar]
  40. China International Engineering Consulting Corporation. The Qinghai Lake Ecological Protection Plan (2021–2035); Qinghai Lake Scenic Area Protection and Utilization Administration: Xining, China, 2021; Volume 21. [Google Scholar]
  41. Wang, C.; Wang, J.; Naudiyal, N.; Wu, N.; Cui, X.; Wei, Y.; Chen, Q. Multiple Effects of Topographic Factors on Spatio-Temporal Variations of Vegetation Patterns in the Three Parallel Rivers Region, Southeast Qinghai-Tibet Plateau. Remote Sens. 2021, 14, 151. [Google Scholar] [CrossRef]
  42. Han, H.; Bai, J.; Ma, G.; Yan, J. Vegetation phenological changes in multiple landforms and responses to climate change. ISPRS Int. J. Geo Inf. 2020, 9, 111. [Google Scholar] [CrossRef] [Green Version]
  43. Evans, J.; Geerken, R. Discrimination between climate and human-induced dryland degradation. J. Arid. Environ. 2004, 57, 535–554. [Google Scholar] [CrossRef]
  44. Shi, S.; Yu, J.; Wang, F.; Wang, P.; Zhang, Y.; Jin, K. Quantitative contributions of climate change and human activities to vegetation changes over multiple time scales on the Loess Plateau. Sci. Total Environ. 2021, 755, 142419. [Google Scholar] [CrossRef]
  45. Roderick, M.L.; Rotstayn, L.D.; Farquhar, G.D.; Hobbins, M.T. On the attribution of changing pan evaporation. Geophys. Res. Lett. 2007, 34, L17403. [Google Scholar] [CrossRef] [Green Version]
  46. Yan, Y.; Liu, X.; Wen, Y.; Ou, J. Quantitative analysis of the contributions of climatic and human factors to grassland productivity in northern China. Ecol. Indic. 2019, 103, 542–553. [Google Scholar] [CrossRef]
  47. Peng, S.; Piao, S.; Ciais, P.; Myneni, R.B.; Chen, A.; Chevallier, F.; Dolman, A.J.; Janssens, I.A.; Penuelas, J.; Zhang, G. Asymmetric effects of daytime and night-time warming on Northern Hemisphere vegetation. Nature 2013, 501, 88–92. [Google Scholar] [CrossRef]
  48. Liang, L.; Li, L.; Liu, Q. Temporal variation of reference evapotranspiration during 1961–2005 in the Taoer River basin of Northeast China. Agric. For. Meteorol. 2010, 150, 298–306. [Google Scholar] [CrossRef]
  49. Han, Y.; Yu, D.; Chen, K. Evolution and Prediction of Landscape Patterns in the Qinghai Lake Basin. Land 2021, 10, 921. [Google Scholar] [CrossRef]
  50. Li, C.; de Jong, R.; Schmid, B.; Wulf, H.; Schaepman, M.E. Changes in grassland cover and in its spatial heterogeneity indicate degradation on the Qinghai-Tibetan Plateau. Ecol. Indic. 2020, 119, 106641. [Google Scholar] [CrossRef]
  51. Xu, M.; Li, X.; Liu, M.; Shi, Y.; Zhou, H.; Zhang, B.; Yan, J. Spatial variation patterns of plant herbaceous community response to warming along latitudinal and altitudinal gradients in mountainous forests of the Loess Plateau, China. Environ. Exp. Bot. 2020, 172, 103983. [Google Scholar] [CrossRef]
  52. Jin, X.; Wan, L.; Zhang, Y.-K.; Hu, G.; Schaepman, M.E.; Clevers, J.G.P.W.; Su, Z.B. Quantification of spatial distribution of vegetation in the Qilian Mountain area with MODIS NDVI. Int. J. Remote Sens. 2009, 30, 5751–5766. [Google Scholar] [CrossRef]
  53. Yin, F.; Deng, X.; Jin, Q.; Yuan, Y.; Zhao, C. The impacts of climate change and human activities on grassland productivity in Qinghai Province, China. Front. Earth Sci. Chin. 2014, 8, 93–103. [Google Scholar] [CrossRef]
  54. Zuo, D.; Han, Y.; Xu, Z.; Li, P.; Ban, C.; Sun, W.; Pang, B.; Peng, D.; Kan, G.; Zhang, R. Time-lag effects of climatic change and drought on vegetation dynamics in an alpine river basin of the Tibet Plateau, China. J. Hydrol. 2021, 600, 126532. [Google Scholar] [CrossRef]
  55. Pei, H.; Liu, M.; Jia, Y.; Zhang, H.; Li, Y.; Xiao, Y. The trend of vegetation greening and its drivers in the Agro-pastoral ecotone of northern China, 2000–2020. Ecol. Indic. 2021, 129, 108004. [Google Scholar] [CrossRef]
  56. Gao, S.; Liang, E.; Liu, R.; Babst, F.; Camarero, J.J.; Fu, Y.H.; Piao, S.; Rossi, S.; Shen, M.; Wang, T. An earlier start of the thermal growing season enhances tree growth in cold humid areas but not in dry areas. Nat. Ecol. Evol. 2022, 6, 397–404. [Google Scholar] [CrossRef]
  57. Xu, W.; Gu, S.; Zhao, X.; Xiao, J.; Tang, Y.; Fang, J.; Zhang, J.; Jiang, S. High positive correlation between soil temperature and NDVI from 1982 to 2006 in alpine meadow of the Three-River Source Region on the Qinghai-Tibetan Plateau. Int. J. Appl. Earth Obs. Geoinf. 2011, 13, 528–535. [Google Scholar] [CrossRef]
  58. Li, L.; Zhang, Y.; Wu, J.; Li, S.; Zhang, B.; Zu, J.; Zhang, H.; Ding, M.; Paudel, B. Increasing sensitivity of alpine grasslands to climate variability along an elevational gradient on the Qinghai-Tibet Plateau. Sci. Total Environ. 2019, 678, 21–29. [Google Scholar] [CrossRef]
  59. Chen, J.; Jönsson, P.; Tamura, M.; Gu, Z.; Matsushita, B.; Eklundh, L. A simple method for reconstructing a high-quality NDVI time-series data set based on the Savitzky–Golay filter. Remote Sens. Environ. 2004, 91, 332–344. [Google Scholar] [CrossRef]
  60. Körner, C. The use of ‘altitude’in ecological research. Trends Ecol. Evol. 2007, 22, 569–574. [Google Scholar] [CrossRef]
  61. Wang, Z.; Cui, G.; Liu, X.; Zheng, K.; Lu, Z.; Li, H.; Wang, G.; An, Z. Greening of the Qinghai–Tibet Plateau and Its Response to Climate Variations along Elevation Gradients. Remote Sens. 2021, 13, 3712. [Google Scholar] [CrossRef]
  62. Wang, Z.; Chang, J.; Peng, S.; Piao, S.; Ciais, P.; Betts, R. Changes in productivity and carbon storage of grasslands in China under future global warming scenarios of 1.5 °C and 2 °C. J. Plant Ecol. 2019, 12, 804–814. [Google Scholar] [CrossRef]
  63. Wang, H.; Long, H.; Li, X.; Yu, F. Evaluation of changes in ecological security in China’s Qinghai Lake Basin from 2000 to 2013 and the relationship to land use and climate change. Env. Earth Sci. 2014, 72, 341–354. [Google Scholar] [CrossRef]
  64. Li, X.-Y.; Ma, Y.-J.; Xu, H.-Y.; Wang, J.-H.; Zhang, D.-S. Impact of land use and land cover change on environmental degradation in lake Qinghai watershed, Northeast Qinghai-Tibet Plateau. Land Degrad. Develop. 2009, 20, 69–83. [Google Scholar] [CrossRef]
  65. Diao, C.; Liu, Y.; Zhao, L.; Zhuo, G.; Zhang, Y. Regional-scale vegetation-climate interactions on the Qinghai-Tibet Plateau. Ecol. Inf. 2021, 65, 101413. [Google Scholar] [CrossRef]
  66. Wang, X.; Liang, T.; Xie, H.; Huang, X.; Lin, H. Climate-driven changes in grassland vegetation, snow cover, and lake water of the Qinghai Lake basin. J. Appl. Remote Sens. 2016, 10, 036017. [Google Scholar] [CrossRef]
  67. Yang, X.; Zhang, G.; Jia, Z.; Song, X.; Wang, X. Study on the Shoreline Evolution of Qinghai Lake and its Socio-economic Impact under the Background of Global Climate Change. Plateau Sci. Res. 2021, 5, 1–9, 15. [Google Scholar] [CrossRef]
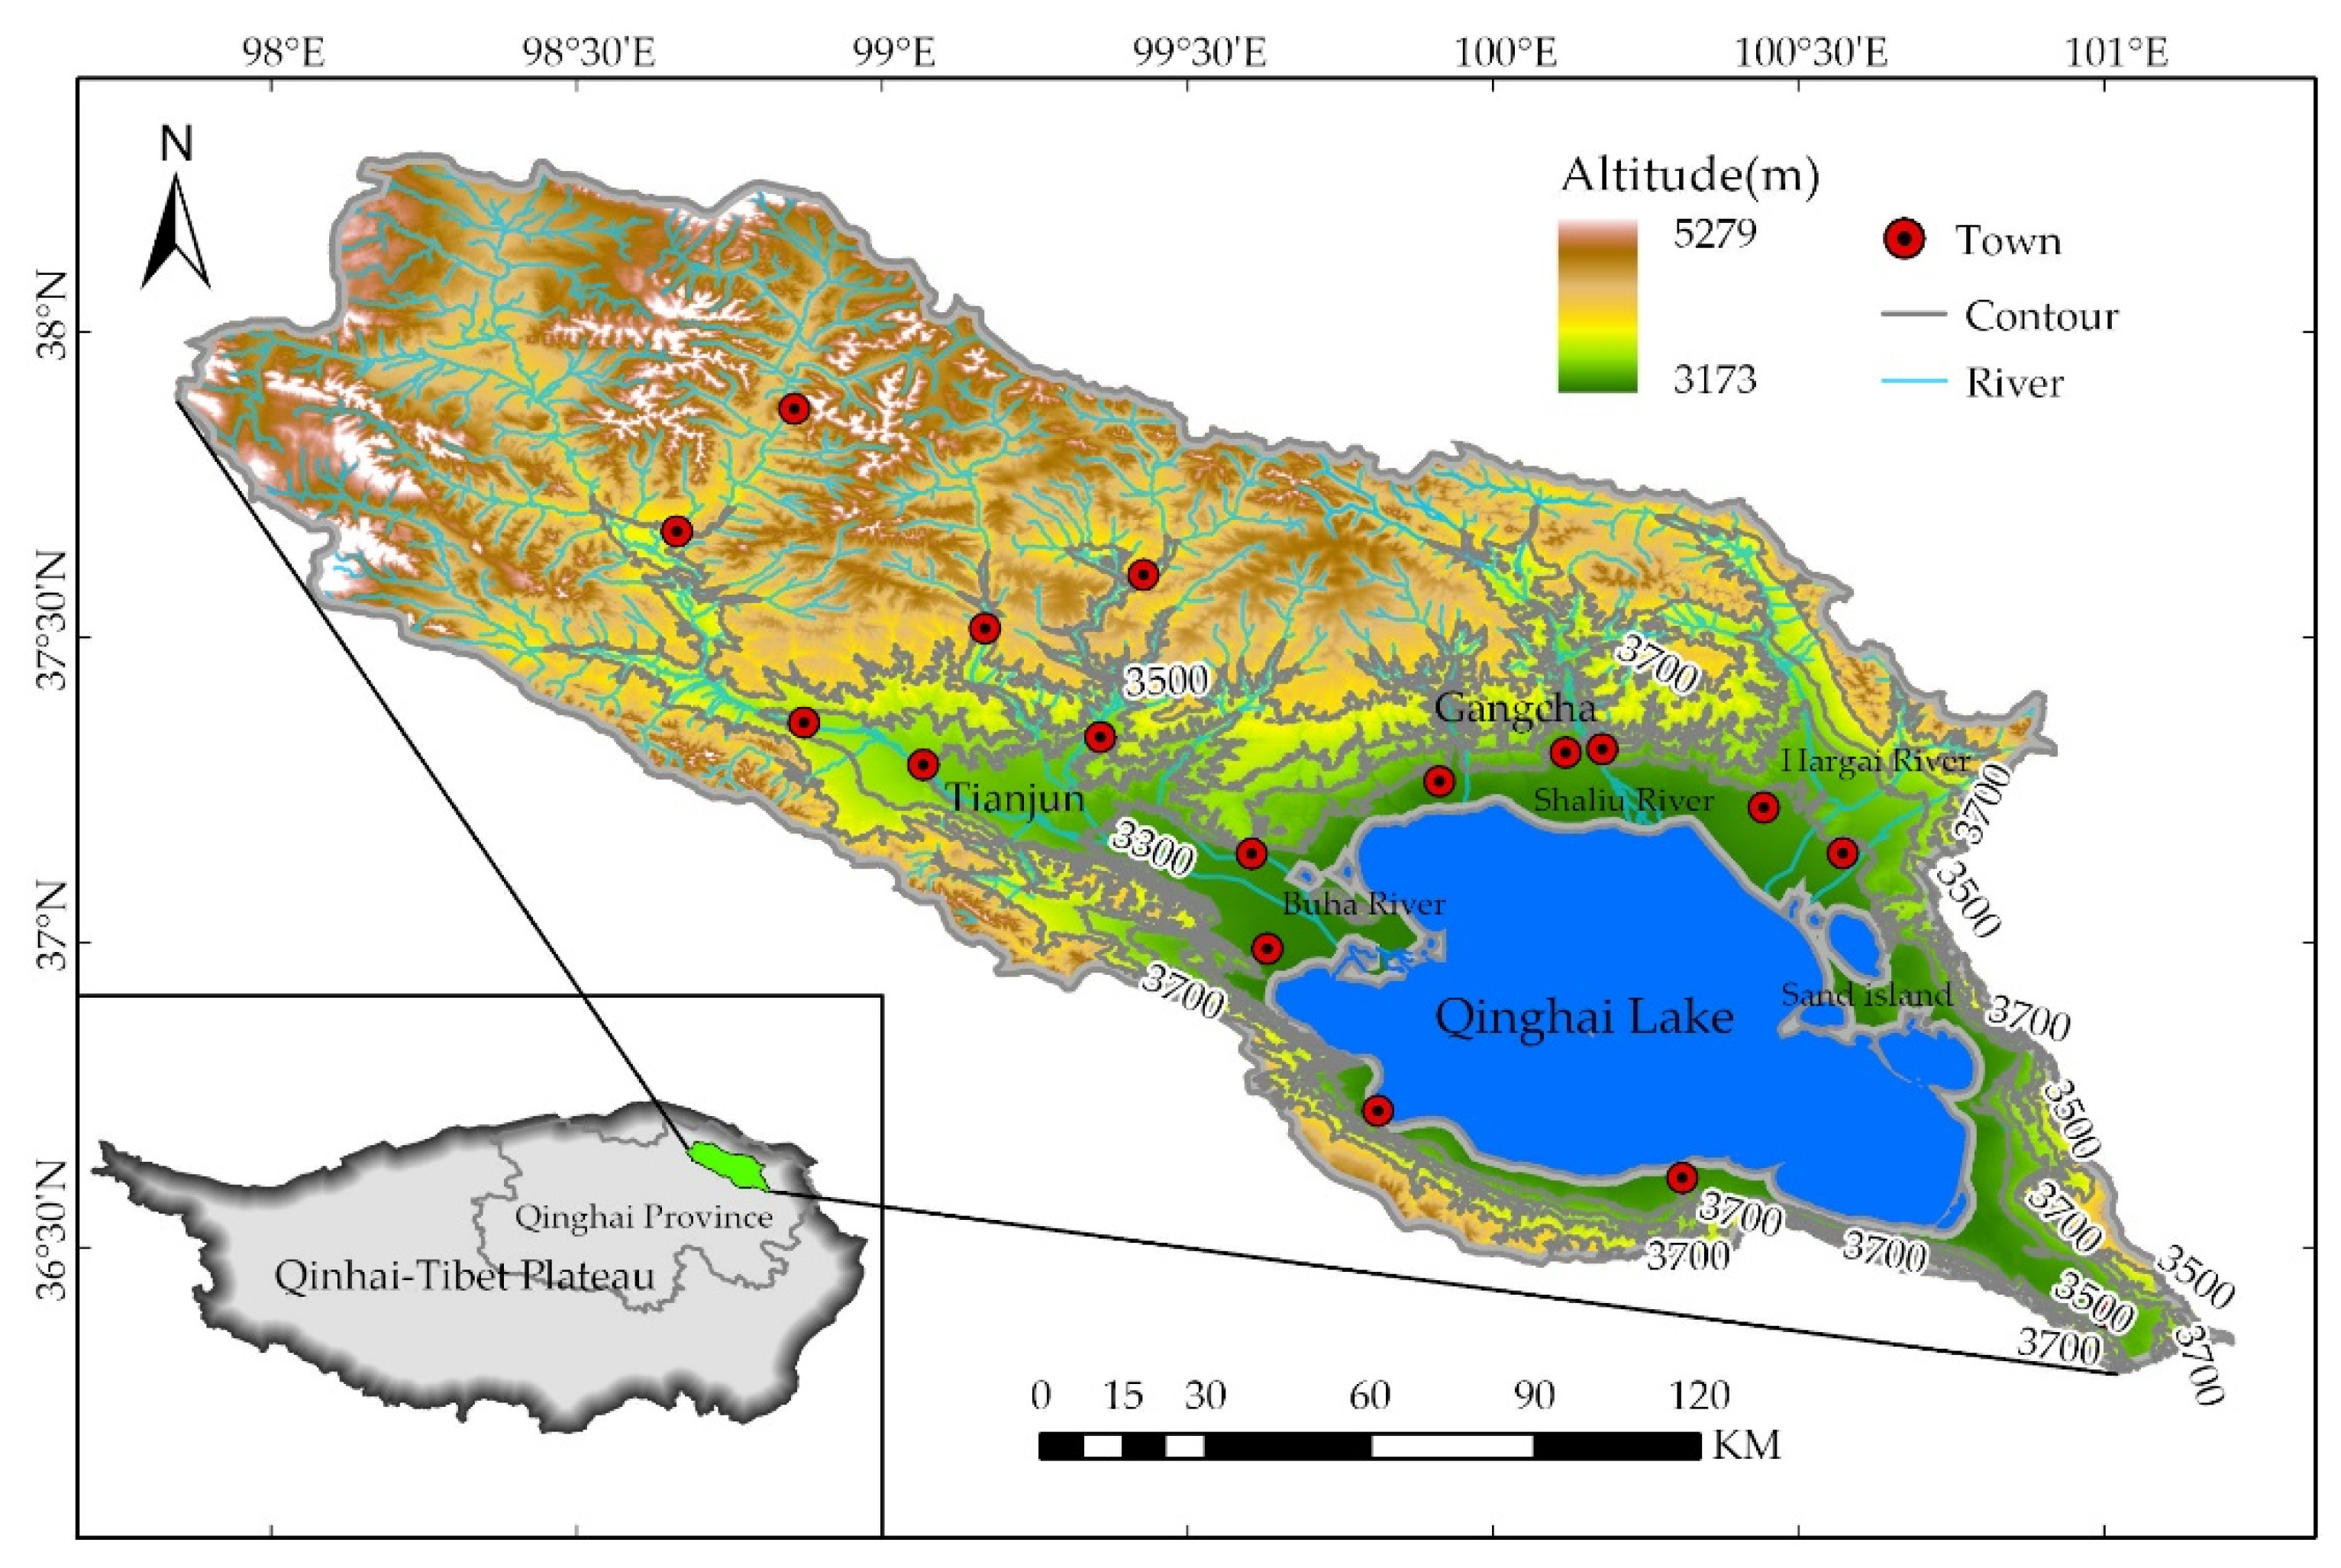
Figure 1. Location of the QLB.
Sustainability 14 08402 g001
Figure 2. Variation of NDVI in the QLB from 2000 to 2020.
Sustainability 14 08402 g002
Figure 3. Spatial distribution (a) and variation trend (b) of NDVI in the QLB from 2000 to 2020.
Sustainability 14 08402 g003
Figure 4. Spatial distribution (a,b) and variation trend (c,d) of T and P in the QLB from 2000 to 2020.
Sustainability 14 08402 g004
Figure 5. Interannual variation (a) and trend (b) of NDVIres in the QLB from 2000 to 2020.
Sustainability 14 08402 g005
Figure 6. Spatial distribution and significance (p-value) of partial correlation coefficients between climatic factors and NDVI in the QLB from 2000 to 2020. (a,b) is the partial correlation coefficient and significance of T and NDVI(p-value), respectively; (c,d) is the partial correlation coefficient and significance of P and NDVI (p-value), respectively.
Sustainability 14 08402 g006
Figure 7. Spatial distribution of T_con (a) and P_con (b) in the QLB from 2000 to 2020.
Sustainability 14 08402 g007
Figure 8. Spatial distribution of C_con (a) and H_con (b) in the QLB from 2000 to 2020.
Sustainability 14 08402 g008
Figure 9. The distribution of NDVI along the altitude gradient and the greening trend in the QLB.
Sustainability 14 08402 g009
Figure 10. The change slope of T and P and the distribution of T_con and P_con along the altitude gradient of the QLB.
Sustainability 14 08402 g010
Figure 11. Distribution of C_con and H_con along the altitude gradient of the QLB.
Sustainability 14 08402 g011
Figure 12. Variation of population density, livestock density, and GDP in the QLB from 2000 to 2020.
Sustainability 14 08402 g012
Figure 13. Population density over the spatial (a) and altitudinal gradients (b) of the QLB from 2000 to 2020.
Sustainability 14 08402 g013
Publisher’s Note: MDPI stays neutral with regard to jurisdictional claims in published maps and institutional affiliations.