Article

Environmental Impact Evaluation of University Integrated Waste Management System in India Using Life Cycle Analysis

by
Amit Kumar Jaglan
1,
Venkata Ravi Sankar Cheela
2,*,
Mansi Vinaik
3 and
Brajesh Dubey
4
1
Amity School of Architecture & Planning, Amity University, Noida 201313, India
2
Department of Civil Engineering, MVGR College of Engineering (A), Vizianagaram 535005, India
3
School of Management and Liberal Studies, The NorthCap University, Gurugram 122017, India
4
Department of Civil Engineering, Indian Institute of Technology Kharagpur, Kharagpur 721302, India
*
Author to whom correspondence should be addressed.
Sustainability 2022, 14(14), 8361; https://doi.org/10.3390/su14148361
Submission received: 30 April 2022 / Revised: 1 July 2022 / Accepted: 4 July 2022 / Published: 8 July 2022

Abstract

:
Decarbonization of university campuses by integrating scientific waste approaches and circular economy principles is the need-of-the-hour. Universities, the maximum energetic corporations and places for clinical studies and social activities, have a duty to assemble low-carbon campuses and play a vital function in lowering CO2 emissions. An environmental life cycle assessment was conducted to compare proposed municipal solid waste (MSW) treatment systems with the existing system in the residential university campus (RUC) in Kharagpur, West Bengal (India). The results show the existing MSW disposal practice in RUC (baseline scenario has the highest GWP (1388 kg CO2 eq), which can potentially be reduced by adopting integrated waste management system with source segregation as represented in futuristic scenarios (S2—50% sorting) and (S3—90% sorting)). Compared to S1, GHG emission was reduced by 50.9% in S2 and by 86.5% in S3. Adopting anaerobic digestion and engineered landfill without energy recovery offsets the environmental emissions and contributes to significant environmental benefits in terms of ecological footprints. Capital goods play a pivotal role in mitigation the environmental emissions. The shift towards S2 and S3 requires infrastructure for waste collection and sorting will contribute to reduction of associated environmental costs in the long-term.

1. Introduction

With high population density and the varied nature of domestic and scientific activities, universities could be considered as “small cities” [1,2,3]. These activities generate large quantities of waste, which have similar characteristics of that generated by different urban spaces such as towns and cities [4,5]. This makes them apt testing grounds for plans that can be replicated at city/town levels [6]. Therefore, it becomes imperative for universities to incorporate practices of sustainability, representing environments for practical learning, research, and operating as living labs [7,8,9]. Building a pervasive and holistic waste management system should be a major component of university planning and expansion [10,11]. This can create a synergetic effect and assist in spreading this practice to different urban spaces. By applying suitable technologies, an integrated solid waste management plan can reduce waste generation and propel recycling [12]. The stepping-stone of this plan is understanding the quantity, nature, and characteristics of the solid waste being generated on campus, allowing for the adoption of effective waste management strategies, carried out most efficiently by direct waste audit [13]. Cornell University, Brown University, Colorado State University, Universidad Autonoma Metropolitan, Barcelona, Asian Institute of Technology, and University of Northern British Columbia are leading examples [14].
The active role played by university campuses in reducing greenhouse gas emission, waste management, and creating awareness has been highlighted [15]. Different studies on various institutions of higher education have brought out insights into waste management. A few examples include a study on the University of Gavle, which brought out the importance of training for efficient implementation of the waste management system [16]; a study on the University of Maribor (Engineering Campus), which proposed a waste management plan with comprehensive options to manage plastic and paper waste [17,18]. Similarly, a study carried out at UK University provided a deep understanding of the classification of the WRI/WBCSD Greenhouse Gas Protocol Corporate Standard [19,20]. Universities across the world have been working on greening their campuses, establishing standards such as ISO 14001, creating an ecological campus based on an ecological technique style, ecological education, and a management style, establishing an indicator system to evaluate the performance of one green university project [21]. Life cycle assessment (LCA) is a tool to quantify or compare the environmental impacts of product(s) or service(s) throughout its life cycle, i.e., from raw material extraction to disposal. International Standard Organization (ISO) standardized the methodological framework for life cycle assessment (LCA) to evaluate impacts from an environmental perspective (ISO, 2006). The ISO 14040 (2006) and 14044 (2006) guidelines include instructions on how to perform and report LCA studies. Application of LCA in MSW provides a holistic perspective in identifying acceptable and environmentally sound solutions. Waste LCA tools have been developed since the early 1990s with an aim to evaluate the environmental performance by modelling waste management systems. Compared to product LCA tools, waste LCA evaluate environmental performance of interconnected waste treatment systems based on physico-chemical characteristics of waste from generation to final disposal. The waste LCA model has an ability to model variations in fractional waste content, operation specific emissions, substitution of energy systems, include country-specific energy mix, manufacturing of primary resources, and assessment of interconnected systems ranging from collection to final disposal. However, the models suffer lack of harmonization due to complexity in waste systems modelling and application of country-specific datasets [22,23,24,25].
Recently, the majority of higher educational institutions (HEIs) have carried out ‘green’ drives [26]. At present, more than 400 institutional organizations have marked a Presidents’ Climate Leadership Commitment. Numerous HEIs are revealing their GHG emissions stock using the Sustainability Indicator Management and Analysis Platform (SIMAP), which was already the Clean Air-Cool Planet Campus Carbon Calculator, while others are utilizing their own custom devices and/or contracting external firms to compile their carbon footprint [27]. The current investigation aims to evaluate the environmental profiles of the use of the life cycle approach for an Indian residential university campus (RUC). This research is the maiden work in an Indian context, which can be a base model for other higher education institutes in emerging economies.

2. Materials and Methods

2.1. Study Area

The unlined landfill facility in the study area is located in the northeast corner of the university campus in Kharagpur, West Bengal state (India). The landfill is located amid a campus within a proximity of 130 km radius from the Bay of Bengal, at an elevation of 33.5 m from the mean sea level. The operations in the dumpsite began in late 2005, spreading over nine acres of land. The height of the waste heaps varies between 10 and 12 m. The average amount of MSW reaching landfills is 12.6 ± 2 tons per day. The public health and sanitation department in the Indian Institute of Technology Kharagpur is the council authority administrating the solid waste management activities. The geographic location of the study area is shown in Figure 1.
This study aims to use the life cycle analysis (LCA) approach to compare the environmental impacts of different waste management alternatives and identify the most viable management scenario with minimal environmental impacts. The scenarios include various MSWM options, such as MRF, composting, AD, incineration, and landfilling. The impact categories, such as global warming potential (GWP), terrestrial acidification (TA), freshwater eutrophication (FEW), marine water eutrophication (ME), human toxicity (HTP), terrestrial ecotoxicity (TE), freshwater ecotoxicity (FWT), and marine ecotoxicity (MET) impacts were determined for each option.

2.2. Physical Characterization of Municipal Solid Waste

The physical characterization of MSW was performed as per ASTM 5231D: 2016 protocol. The waste sampling campaign was performed at the unlined landfill facility in the University campus. Stratified random sampling was used for the collection of waste samples. The quartering method was implemented to prepare representative samples for the determination of physicochemical characteristics. The code of practices used for the determination of moisture content was ASTM E1756-08, percentage of volatile matter [28], ash content [29], elemental analysis [30], and energy content was [31].

2.3. Waste Management Scenarios

A waste treatment strategy was developed based on the waste characteristics determined in the aforementioned section. The systems boundaries of existing and proposed waste treatment strategies are shown in Figure 2.

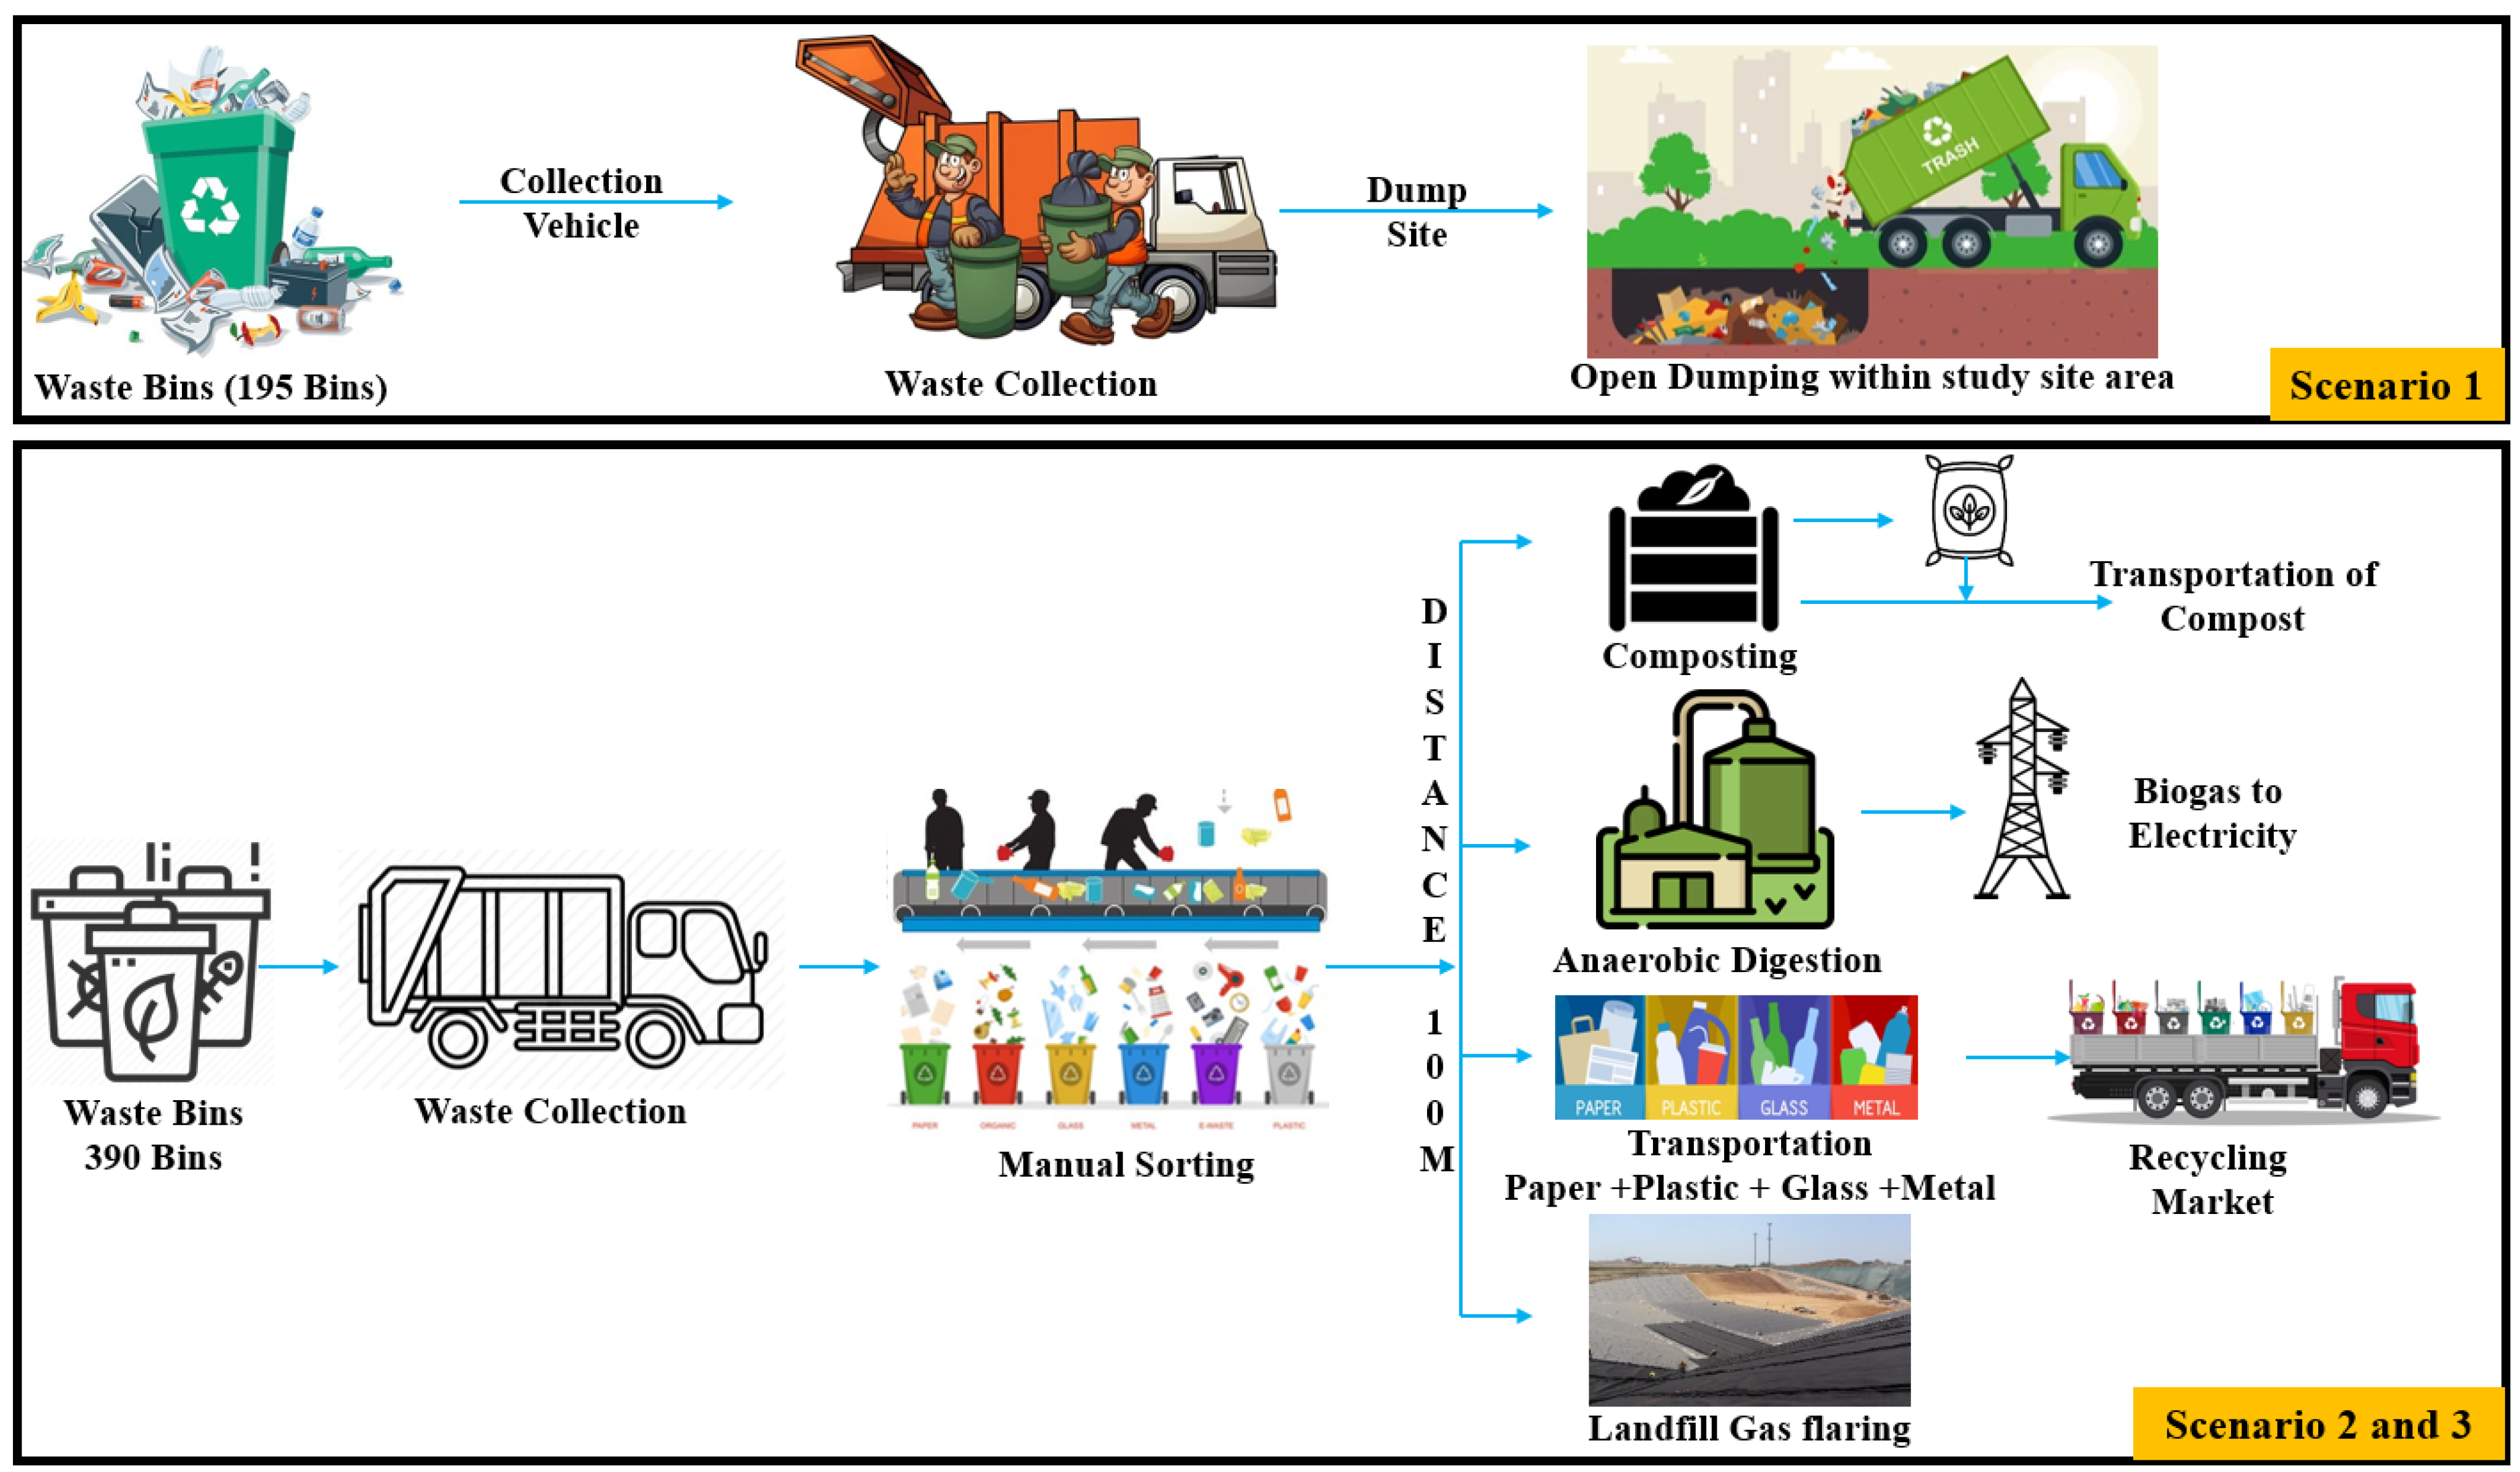
2.3.1. Scenario (S1)—Business-As-Usual (BAU): Open Dumping

This scenario represents the current MSW disposal method in the RUC of Kharagpur. The waste complied by the departmental workers of sanitation is further disposed within the campus in the unlined landfill. There is a huge discharge of greenhouse gas due to the decomposition of the waste. The greenhouse gas is produced due to the emission of methane gas during the process of anaerobic decomposition of the waste. Methane (CH4) has a global impact and methane emission is approximately 5% due to the anaerobic decomposition. The fusion of the waste with the rainwater and the moisture leads to the production of toxic liquid leachate.

2.3.2. Scenario (S2 & S3)—Integrated Waste Treatment Facility with 50 & 90% Waste Sorting

Integrated waste treatment is a systematic method used for the sustainable management of waste. In this process, waste is disposed into the landfill along with the leachate process and the gas collection system. Gas produced is further collected and flared before discharging into the environment. As suggested by the IPSS, the total landfill gas (LFG) is calculated using a first-order degradation model. The collection efficiency is estimated to be approximately 60% [32] and the surface oxidation efficiency of CH4 from the fugitive emission to be approximately 15% to 20% [33]. The overall power consumed for the leachate treatment is about 25 to 30 kWh/ton. In this process, the organic fraction of waste is separated and transported to the anaerobic digestion unit. The leftover waste is disposed of in the engineered landfill, with no energy recovered. In this process, the leachate treatment and the gas collection processes are also considered. Before releasing the gas into the environment, it is flared. During the course of the anaerobic decomposition, about 30% of the biogas is released, which is used for the generation of electricity [34]. The collection efficiency, in this case, is found to be approximately 95%. The same process is used for the treatment of biogas slurry, which was used for the treatment of leachate. The digestive residue is applied to land as a replacement for mineral fertilizer.

2.4. Life Cycle Assessment

The LCA methodology outlined in ISO 14040-44:2006 standards was implemented for the evaluation of environmental impacts. The methodology includes four steps: (1) goal and scope, (2) life cycle inventory (LCI), (3) life cycle impact assessment (LCIA), and (4) life cycle interpretation.

2.4.1. Goal and Scope Definition

The main objective of this study is to compare various MSW management techniques using a life cycle perspective. As the study area, the RUC Kharagpur, India, was considered. The amount of MSW generated into the campus was integrated for the study. This area was considered in order to compare and analyze the various alternative processes. For the study of this scenario, an integrated waste management plan (IWMP) was implemented at the landfill site. In this process, anaerobic digestion, incineration, and engineered landfilling (with or without the energy recovery) were considered. The effect of a collection of waste and transportation of waste was presumed to be identical in all the scenarios during the process. This is due to the same process location. Emission related to the energy produced while the manufacturing of the massive types of equipment and goods that were not included in the LCA modeling process was used widely in the study [35,36]. A first-order decay model calculated the production estimate of methane and carbon dioxide on the material fraction elemental composition of waste and associated decay rates. The volume of leachate produced was calculated by the infiltration rate, waste layer height, and bulk density [37]. In the current study, an environmental assessment was performed to handle and manage 1 ton of MSW in the study area. The waste was collected at the waste facility. The complete waste was treated using a combination of treatment technologies presented in the scenarios provided. All the environmental acknowledgments corresponding to these scenarios are contemplated according to their corresponding abilities to generate the appropriate products such as slurry with the fertilizer and energy from incineration with the grid electricity. The system confines all the waste treatments and processes compiled. It helps in monitoring the performance. Thus, the allocation was not investigated.

2.4.2. Life Cycle Inventory Data

An environmental impact assessment requires the completion of a life cycle inventory (LCI). During the life cycle stages of waste management systems, LCI measures the number of inputs in terms of material and energy, as well as outputs in terms of emissions and wastes. The inventory information is used to create the flow of inputs and outputs through the various stages of the life cycle. In this study, the dataset considered is from the EASETECH database (developed by the Technical University of Denmark). This database was used for the engineered landfills. It consists of the gas flaring and energy recovery system. It was treated using EASETECH v3.7-LCA-model for the assessment of the environmental technology. There is a significant lack of Indian-specific landfill datasets for various geographical areas. Gas collection and utilization were projected to occur over 55 years, with no collection assumed for the next 45 years; however, gas oxidation was expected to occur in the top layer [38]. The dataset supplied [39] was used to examine leachate collection and treatment. Table 1 shows the input data that were utilized to simulate this system.
  • Anaerobic Digestion
Anaerobic digestion (AD) is utmost the convenient method to be used for waste. Plants using a biphasic wet digester-based method produce AD as organic waste. In India, this method is in use [34]. The modelling approach makes extensive use of AD techniques found in the EASETECH databases, with inputs adjusted for Indian conditions. The volatile solid, which is food waste degradation/deterioration of around 70%, is the plant criterion utilized in the modelling process. Furthermore, the quantity of methane in biogas is approximately 63%, methane leakage from the digester is about 2%, and biogas conversion efficiency is about 35% [33].
  • Windrow composting
Food waste degradation (75%), loss of volatile solids (75%), carbon (77%), and nitrogen (8%) were all used to simulate windrow composting (biological treatment technique for creating compost by stacking organic waste in long rows) [34]. Table 2 shows the input data that were utilized to simulate this system.

2.4.3. Life Cycle Impact Assessment

Process modeling is achieved by integrating physio-chemical characteristics of the waste fractions. Using a software tool, the EASETECH v3.7-LCA-model, various scenarios of environment aspects were analyzed. For analyzing the impact study, the ReCipe 2016 midpoint world method/technique was considered. ReCipe technique is the consolidation of the CML method and Eco-indicator 99 presenting the wider view of impact categories. The LCIA impact categories were used for analyzing global warming potential, terrestrial acidification, marine eutrophication, human toxicity, terrestrial ecotoxicity, freshwater ecotoxicity, terrestrial ecotoxicity, and marine ecotoxicity. The time horizon taken for the reference was 100 years for global warming potential. This time is taken into consideration for the climate change policy [43]. Moreover, for the impact of acidification, toxicity impact levels have had a huge impact on future generations for more than 100 years. In this study, 100 years are considered as the period to find the inventory. The ReCiPE Midpoint (Heuristic) World model was used for determining the characteristics of the environmental frame/profiles of the alternatives. Impact assessment methodologies give a hierarchical view of about 100 years’ time period and also include large numbers of midpoint indicators on a global scale. The impact category is subdivided into two categories, namely toxic and non-toxic. In this study, land and water use were not included due to their dependency on geographical locations [38]. The impact category was determined by analyzing LCA studies accomplished in Indian scenarios (Table 1), as indexed in Table 2.

3. Results

3.1. Physicochemical Characteristics of MSW

The physico-chemical characteristic of MSW collected by the first author was determined as a part of this research. The MSW is majorly composed of organic matter, which is food waste 59%, yard waste 17%, plastic 5%, cardboard 4%, polythene bags 4%, paper 2.6, glass 2.5%, inert 1.8%, leather 0.85%, other 0.80%, metal 0.60%, and e-waste 0.43%. In Figure 3, the physical characteristics of MSW are presented/demonstrated. Organic waste is mostly composed of food and yard waste. The inert and other components consist of sand, silt, dust, grit, ash, inseparable paper, and food residues, street sweeping waste, drain cleaning waste, and construction debris. As per the chemical classification of MSW, study shows that the moisture amount is about 7% to 52%, volatile solid is about 38% to 43%, carbon amount is about 33% to 47%, the oxygen content is about 36% to 65%, the hydrogen content is about 3.75% to 9.1%, sulphur and nitrogen content is about 2%, and calorific is about 4300 kcal/g to 4730 kcal/g (on dry basis).

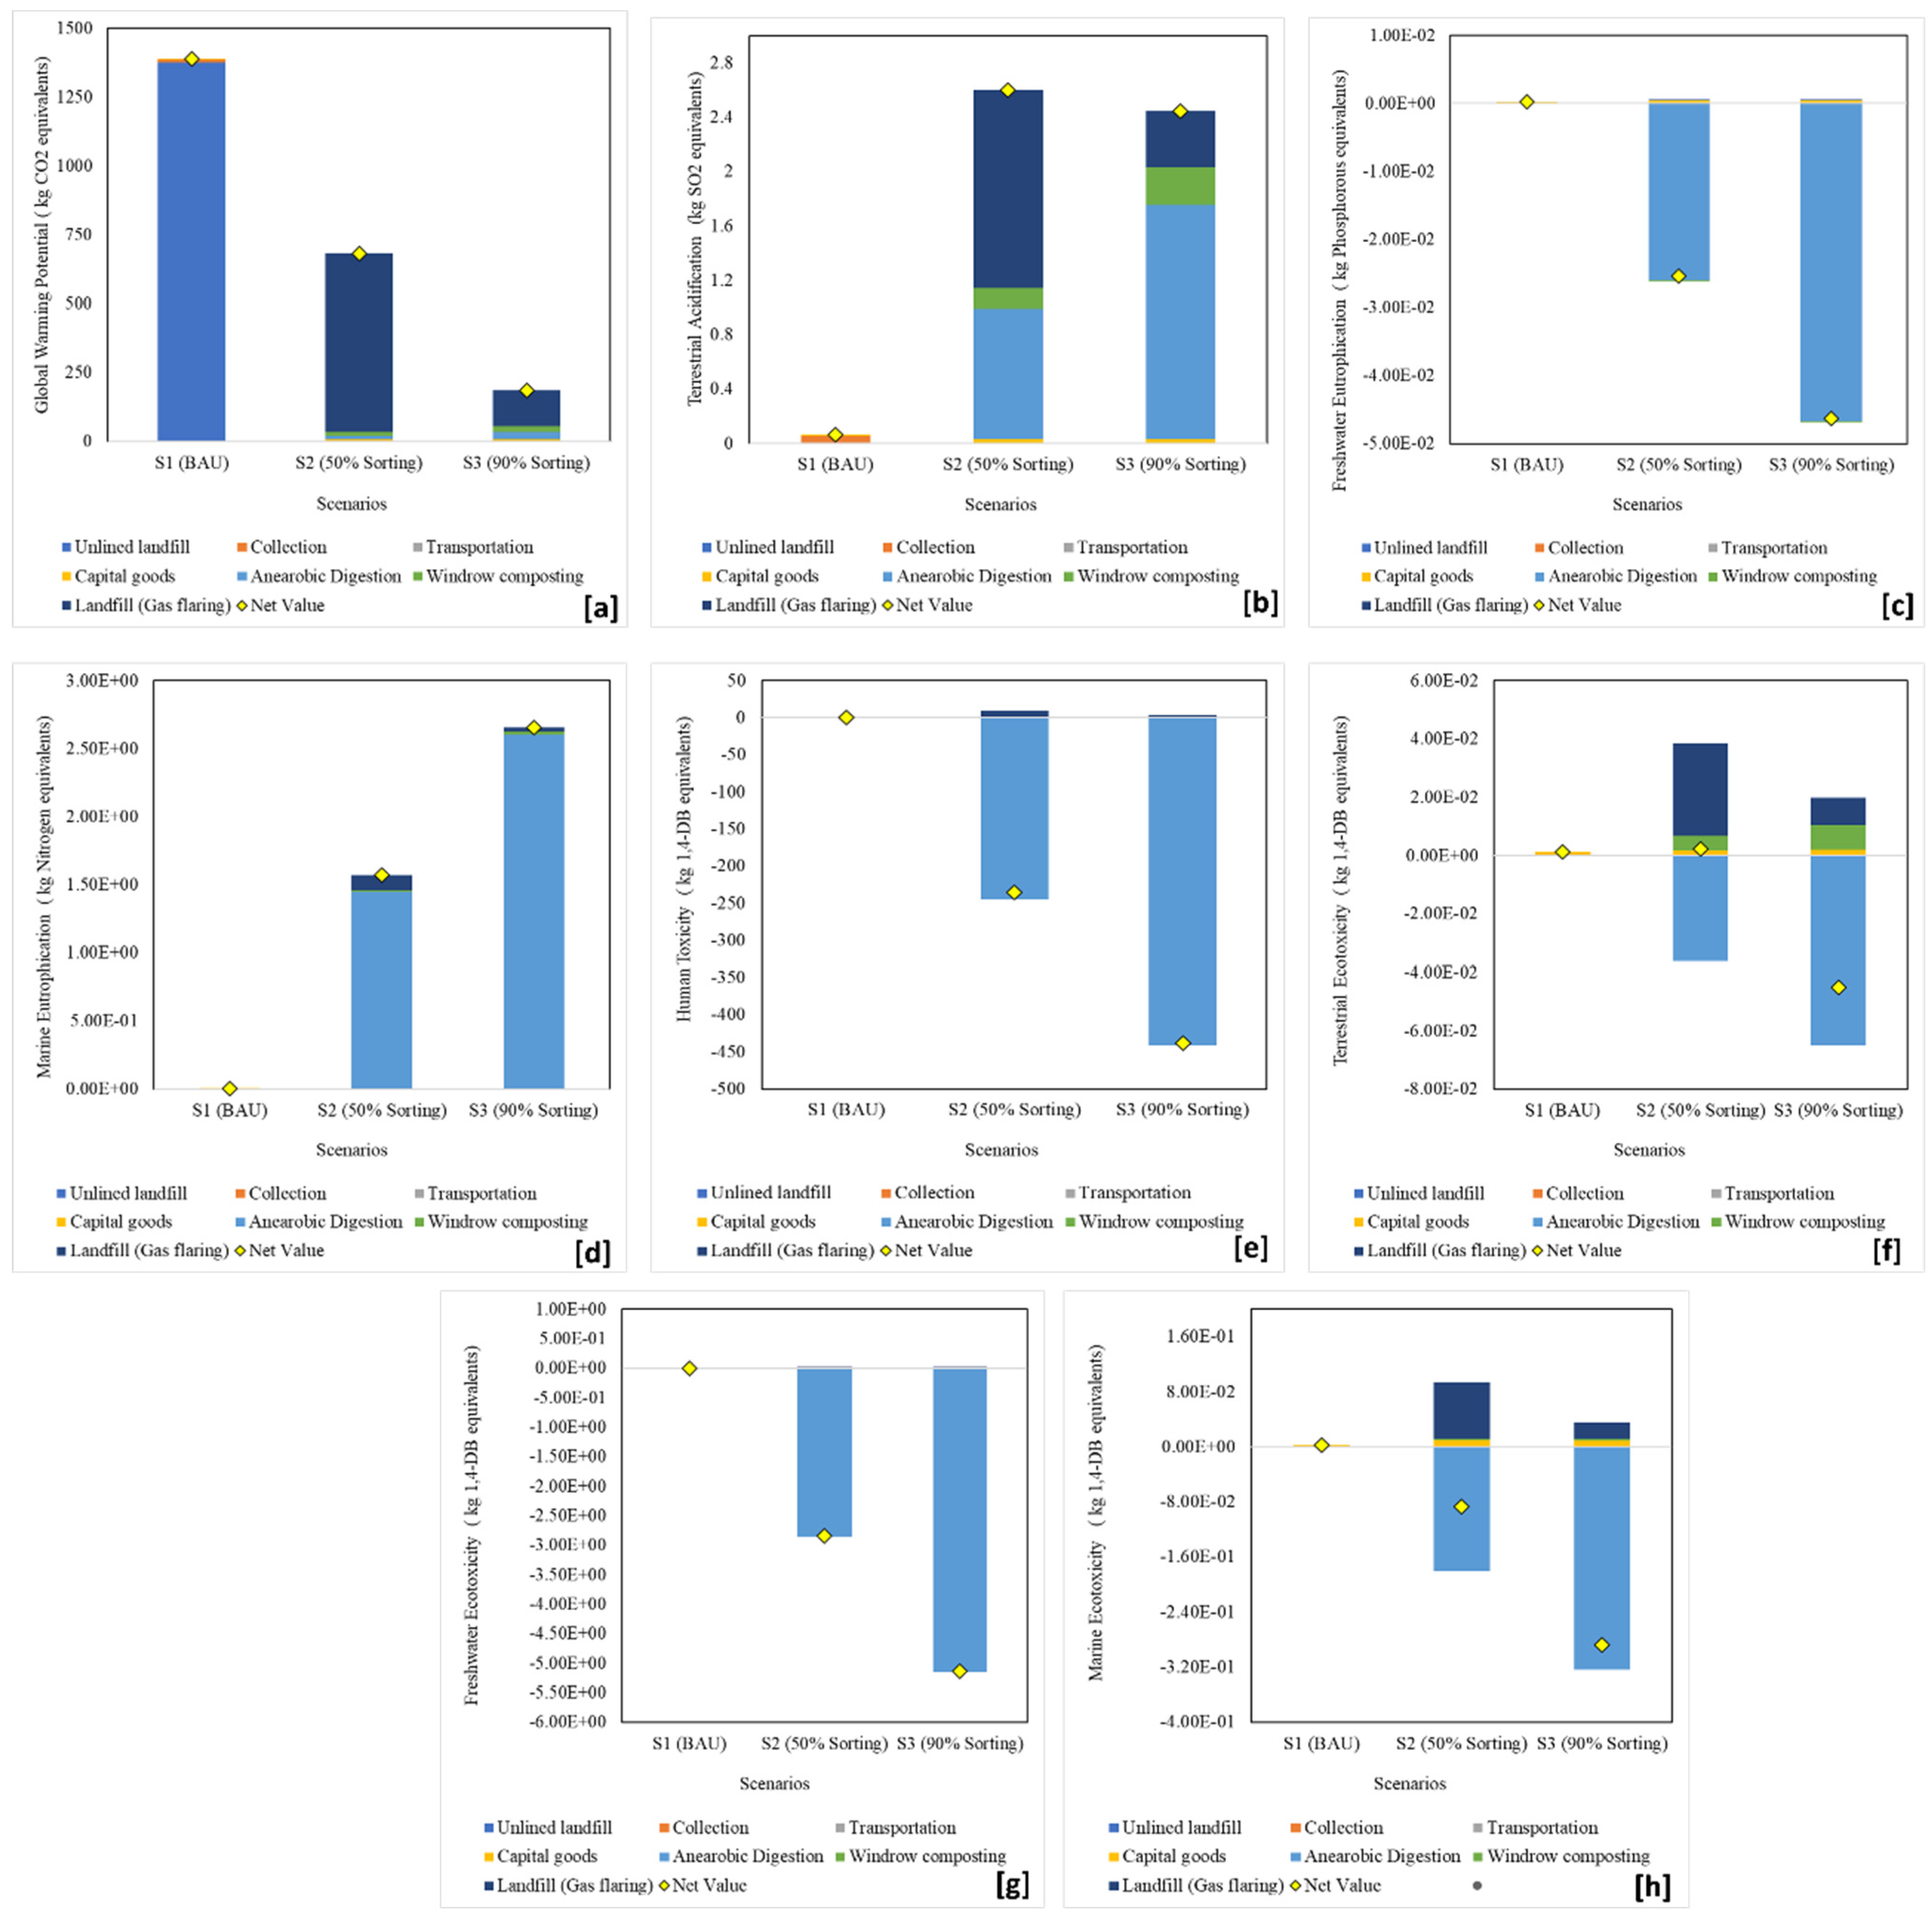
3.2. Life Cycle Impact Assessment Results

3.2.1. Global Warming Potential

Global warming potential (GWP) has a huge impact on the environment, which is estimated in the terms of kg CO2 equivalent, as demonstrated in Figure 3a. Scenario (S1) has the maximum GWP with an absolute value equivalent to the amount of 1388 kg CO2. Fugitive emission causes approximately 99% of the total emission. The remaining 1% of the emissions is caused by the waste leveling process, compaction process, and transportation process. In comparison to scenario (S1), analysis shows that in scenario (S2), the GHG emission is reduced by 50.9%, and in scenario (S3) it is reduced by 86.5%. Landfill construction and operation, leachate collection, and management process contribute to 80% of emissions. The collection process and transportation process of MSW to the unified waste facility contribute up to 9.393 k CO2 eq.
In scenario S2, the development of integrated waste management (IWM) systems with 50% sorting (S2) contributes to 681.8 kg CO2 eq of GWP emissions. The LFG is the major emissions (648.6 kg CO2 eq) contributing process. The waste technique that contributes to emission in the impact category/sector is the oxidation of gas in landfills, which is about 68.7%. The landfill construction process is about 23.8% and the gas flaring process is about 7.4%. The gases that are contributing the most in these scenarios are methane with about 76.3%, carbon dioxide with about 23.5%, and nitrous oxide with about 0.2%. In scenario S3, with 90% sorting of waste, the LFG is the major emissions (178 kg CO2 eq) contributing process followed by AD (26.8 kg CO2 eq) and WC (20.7 kg CO2 eq).
The waste technique contributing to emissions in the impact category is gas oxidation in landfills, which is about 74.3%, and the landfill construction process is about 25.7%. The gases that are contributing the most in these scenarios are methane with about 74.6%, carbon dioxide with about 25.3%, and nitrous oxide with about 0.1%. The process of disposing of treated leachate into the land leads to a reduction in emissions by 82.6%, while substituting the grid electricity to the LFG electricity reduces the emissions by 177.4%. Moreover, the usage of landfill gas (i.e., methane, which causes 28 times more global warming in comparison to CO2) for energy substitution reduces the GHG emissions in comparison with scenario S2, which explodes the methane gas. Anaerobic digestion and landfill without energy recovery are analyzed as the best GHG reduction methods.
At the University of Leeds, UK, an Extended Environmental Input-Output Analysis (EEIO) was used to estimate the carbon emissions of purchases, documents production, waste, energy, rental properties, transportation, purchased goods, and services. Repeated semi-structured interviews were conducted with the university’s procurement staff to obtain the required data. Emissions in scope 3 account for about 51% of total emissions, while scope 1 and range 2 account for 18% and 31%, respectively [44]. The University of Illinois, Chicago (UIC), in its estimate of greenhouse gas emissions from 2004 to 2008, found that in 2008, the most impactful emissions were from buildings (83%), tracked moves (16%), and waste (1%). Power plants, with cogeneration facilities, generate 63% of total GHG emissions, followed by purchased electricity (17%). UIC also used the GHG protocol defined by the World Resources Institute (WRI)/World Business Council for Sustainable Development (WBCSD) [45].
At the University of Cape Town (UCT) in South Africa, this evaluation is split into three parts: campus power emissions, shipping emissions, and goods and offerings emissions. In this study, if the facts precise to South Africa became unavailable, then Intergovernmental Panel on Climate Change (IPCC) emissions elements and applicable literature were used to estimate the carbon emissions. Electricity utilized in entire college bills for 81% of the whole carbon emissions. From the University of Montfort, UK, this study is based on the World Resources Institute (WRI)/World Business Council for Sustainable Development (WBCSD) GHG protocol. Direct and indirect emissions from fossil fuels are considered in scopes 1 and 2, and indirect emissions from shopping, tourism, commuting, and other sources are considered in scope 3 of the resolution letter designation. Scope 3 contributes 79% of the total FC, with the main contribution being supplied (48%), contributing 38% of the total emissions. The scope definition used in this study is similar to that of ISO 14064I (ISO, 2006), to quantify, report, and eliminate GHG emissions at the organizational level [46].

3.2.2. Terrestrial Acidification

Environment impacts related to terrestrial acidification are evaluated in the terms of kg SO2 equivalent, as demonstrated in Figure 3b. In scenario (S1), the net value is 0.004 kg SO2 eq. Techniques used for water handling (compacting, leveling, and internal transportation) at the dumping area generate environmental emissions. In scenario (S2), the net value for the terrestrial acidification category is 2.65 kg SO2 eq. The maximum emission is produced due to the waste treatments and the construction process, and the operation of landfills is about 89.1%, leachate process is about 6.8%, and the gas-flaring process is about 4.1%. It is analyzed that in this scenario, three main gases contribute to TA, i.e., nitrogen oxide gas is about 60%, sulphur dioxide gas is about 39.8%, and ammonia gas is about 0.2%. In scenario (S3), it is analyzed that the TA impact categories net value is 0.017 PE (0.610 kg SO2 eq.). The waste processes that contribute to the TA are the construction process and the operation of the landfill process, which is about 85.7%, energy conversation techniques are about 7.7%, and the leachate technique is about 6.6%. The most prominent gases that contribute to TA are sulphur dioxide with about 67.6% and nitrogen oxide with about 32.4%.

3.2.3. Freshwater Eutrophication

The FEW’s environmental consequences are measured in kilograms of phosphorus equivalent, as shown in the Figure 3c. In scenario (S1), the effect category’s net value is insignificant. In the impact category, the net value for scenario (S2) is around 2.8 × 10⁻⁴ kg-P eq. The greatest emissions created by waste treatments include leachate treatment, which accounts for about 99.5% of total emissions, and landfill and construction operations, which account for around 0.5%. The net value in scenario (S3) is 4.8 × 10⁻⁴ kg-P eq. Leachate treatment accounts for 91.8% of the FEW, whereas leachate disposal accounts for 7.7%, construction accounts for 0.5%, and landfill operation account for 0.5%. The emission offsetting unit process in this case is electricity substitution. Composting is the most effective technique for reducing emissions, whereas electricity replacement has a minor impact. In this scenario, power substitution is the primary emission-reducing unit process. The best impact categories are AD and landfills without energy recovery, and 8.1 × 10⁻⁶ units are contributed by MSW collection and transportation to the integrated waste facility.

3.2.4. Marine Eutrophication

Environment impacts related to the ME are evaluated in the terms of kg-nitrogen equivalent, as demonstrated in Figure 3d. In scenario (S2), the net value is 1.50 × 10⁻⁴ kg-N eq. in the impact category. The maximum emissions produced due to the waste treatments are leachate treatment with about 91% and the operation of landfills and construction with about 8.3%, also gas flaring with about 0.7%. In scenario (S3), the net value is 3.1 × 10⁻⁴ kg-P eq. The waste processes that contribute to the FEW are leachate treatment, which is 91.8%, leachate disposal that is 7.7%, and the construction process and the operation of landfill process, which is about 0.5%. In scenario (S3), the net value is 0.167 kg-P eq. The waste processes that contribute to the FEW are leachate treatment, which is 85.3%, the construction process and the operation of landfill process, which is about 7.8%, leachate disposal, which is about 3.8%, and electricity substitution which is about 3.0%. Landfills without energy recovery is analyzed as the best impact category. The collection and transportation of MSW to the integrated waste facility contribute 0.0036 units.

3.2.5. Human Toxicity Potential

As shown in Figure 3e, the environmental consequences of the HTP, TE, FWT, and MET are measured in kilograms of 1,4-dichlorobenzene equivalent, 5 a.m. to 5 p.m. In scenario (S2), the net value in all effect categories is zero. The net value of 3.026 kg 1,4-dichlorobenzene equivalent is found in scenario S2, HTP impact category. The greatest emissions produced by waste treatments are 44.8%from landfill operations and construction, 31.4% from leachate treatment, 12.7% from gas flaring, and 11.1% from the oxidation process of gas in landfills. The net value in scenario (S3) is 2.409 kg 1,4-dichlorobenzene equivalent. Construction and operation of the landfill process, which accounts for roughly 50.5%, and leachate treatment, which accounts for 35.5%, are the waste processes that contribute. In this case, the emission-reducing unit process is grid electricity replacement. In this scenario, the emission-reducing unit process is the land replacement, which reduces emissions by 99%. In this case, the emission-reducing unit process is electricity substitution, and 0.0182 units are contributed by MSW collection and transportation to the integrated waste facility.

3.2.6. Terrestrial Ecotoxicity Potential

The emissions associated with the TEP impact category are shown in Figure 3f. In scenario (S2), the net value is 0.051 kg 1,4 DB eq in the TEP impact category. The maximum emissions produced due to the waste treatments are leachate treatment with about 97.2% and the operation of landfills and construction with about 2.8%. In scenario (S3), the net value is 0.052 kg 1,4 DB eq. Leachate treatment, which accounts for 92.6%of the TEP, is one of the waste processes that contribute to it. In this case, the emission offsetting unit method is grid electricity replacement, and 1.5 × 10⁻⁴ units are contributed by MSW collection and transportation to the integrated waste facility.

3.2.7. Freshwater Ecotoxicity

The emissions associated with FWE impact category are shown in Figure 3g. In the FWT impact category, the net value in scenario (S2) is 0.025 kg 1,4 DB eq. The highest emission produced by waste treatments is around 98.2%by leachate treatment. The net value in scenario (S3) is 0.024 kg 1,4 DB eq. Leachate treatment, which accounts for 91.1% of the FWT, is one of the waste processes that contribute to it. In this case, the emission-reducing unit process is electricity substitution. In this case, the emission offsetting unit method is electricity substitution, and 4.1 × 10⁻⁴ units are contributed by MSW collection and transportation to the integrated waste facility.

3.2.8. Marine Ecotoxicity

The emissions associated with ME impact category is shown in Figure 3g. In scenario (S2), the net value is 0.039 kg 1,4 DB eq. in the ME impact category. The maximum emissions produced due to the waste treatments are leachate treatment with about 52.3% and the operation of landfills and construction with about 47.1%. In scenario (S3), the net value is 0. 0.029 kg 1,4 DB eq. The waste processes that contribute to the TEP are leachate treatment, which is 50.2%, and the operation of landfills and construction, which is about 45.2%. In this case, the emission-reducing unit process is grid electricity replacement. The primary emission offsetting unit process in this scenario is electricity substitution, and 1.1 × 10⁻³ units were provided by the collection and transportation of MSW to the integrated waste facility.

4. Discussion

4.1. Bioeconomy Fertilizers

The idea of a circular economy depends on reuse, valorization, recycling, and misuse of environmental cycles. Although this idea is broadly examined experimentally and strategically, it has just been disjointly applied practically. In the elaboration of bio-based compost innovations, the following perspectives are significant: the ecological effect that needs to be limited, resources ought to be utilized in a regenerative manner with the thought of resource shortage issue, and advancements must guarantee productivity and monetary advantages to modern attempts. Limitations of normal resources and natural security ought to be a need, however, with supporting business prerequisites for financial advantages. The commitment to discard waste is the duty of agri-food makers, for example, cultivating plants that produce organic waste. Enormous agri-food cultivating plants send business staple items to the beneficiaries, without waste, for example, chickens as carcass. Slaughter waste remains should be used sustainably. In this way, facilities delivering composts from organic waste need to be established close, so that transport is not needed. There is additionally an issue of disinfection. Organic waste in landfills causes rotting, which further causes emissions. Another obstruction to the implementation of inexhaustible raw materials in the creation of fertilizers is the changeability of the raw material. Emerging technologies should consider all of the above.
Another quite significant method is composting. Composting is an old and customary technique that works with the change of biogenic organics under controlled conditions into excrement for farming reasons. Composting measures redirect wastes from the conventional landfills and recover esteem by changing them into organic-rich manures, which consequently affects the quality and yield of farming products. At the same time, this could expand the monetary worth of waste and societal health scenarios by tending to the waste administration issues [47]. The Government of India has stated that composting is anything but a recognized type of horticultural compost and has formulated a strategy to mix it alongside inorganic manure. The use of these composts will outdate and gradually eliminate the usage of fossil-based manures [48]. A great initiative undertaken by the Government is the promotion of fertilizing the soil with Government subsidized fertilizers to encourage clean and organic farming practices. Simultaneously, the Government is setting up farming instructional hubs for giving specialized data, fundamental resources, and preparation kits. As a feature of sustainable agricultural practice, organic farming exercises are effectively increasing all over the country and the world. Organic farming uses natural fertilizers and works in agreement with nature without hurting the ecological equilibrium and at the same time accomplishes great harvest yields. Regarding developing interest in organic products, treating the soil has potential business openings in India. Because of its maintainability, compositing can likewise be stretched out to a mechanical scale using unspoiled organic MSW (municipal solid waste) as feedstock. Treating the soil can be involved with the creation of biogas as a by-product and these advances can increase the financial worth of the waste produced and set out independent job opportunities.

4.2. Bio-Methanation

Biomethanation is a technique by which organic substances are microbiologically converted into biogas under anaerobic conditions, where those microbes break down the organic substances into methane and carbon dioxide, respectively. Biogas production is presumably one of the oldest and abused biological innovations in India. The first biogas plant, otherwise called the KVIC digester, which was established in 1951, was the consequence of introductory trials led by S.V. Desai, the pioneer of anaerobic absorption [49]. The digester configuration was normalized in 1962. In the middle of 1978 and 1984, different models viz., Janata Biogas Plant and the Deenbandhu Digester were well known. Around 45 lakhs of locally designed homegrown biogas plants with 36.85% of the assessed potential were introduced with the help of the Government of India until 2013. The MNRE (Ministry of New and Renewable Energy) has financed three showing projects at Vijayawada (6 MW), Hyderabad (6.6 MW), and Lucknow (5 MW). Colossal amounts of waste produced from different areas viz. agricultural, municipal, food processing, and so on make bio-methanation measure as a first alternative [50]. Some of the most recent projects like Naturally Induced Mixing Arrangement (BIMA) Digester, the ARTI Compact Biogas Plant, Confederation of Real Estate Developers’ Associations of India (CREDAI), Trash Guard, and so on, are being introduced in India. Anaerobic assimilation with a 2 MW limit was introduced by M/S Kanoria Chemicals Ltd., Kolkata, India. At present, India and China offer the anaerobic assimilation innovation similarly at a lower cost.
Now, the majority of rich organic waste that can be harnessed for utilizing in the biomethanation procedures comes from the kitchens of India. Hence, FW (food waste) management is progressively being focused upon energy and nutrient recuperation, instead of landfill, primarily because the latter includes various negative natural effects on both small and large scopes. Hence, the recuperation of energy in the form of biogases is now being conducted. In such a manner, waste management arrangements should not just depend upon a particularly traditional disposal situation, but it should be founded on coordinated procedures giving, improvement and optimization of separate municipal collection frameworks, and all the more environmentally economic disposal situations [51] to deliver new fuel sources and materials. Biogas creation from AD (anaerobic digesters) has developed quickly through the years, primarily because of the exceeding significance of environmentally friendly power organization concerning structured mitigation of GHG discharges and the requirement for practical management of organic waste. Advertisement is a grounded innovation to treat organically rich biomass, additionally as deposits and wastes that are progressively being conveyed as an environmentally friendly power generation source [52]. It is anything but a perplexing four-stage measure that includes a different array of microorganisms and methanogenic archaea that is contrasted with numerous other bioenergy innovations. AD is recognized as obliging and is a lot more extensive on the scope of substrates, even those with high moisture substance and impurities, and can be led in both enormous and limited scope digesters at all geological areas. Biogas creation yield is strictly reliant upon the nature of the input biomass, which, as a result, is greatly influenced by how biomass is gathered and overseen. Furthermore, biomass assortment and the management systems may impact the natural effects related to the later portions of the treatment chain, including biogas creation in the AD plant and energy-conversion inside the cogeneration chamber, and digestate management. The accessibility of a biogas outlet of AD plants clears the way to various opportunities for the recuperation of its energy content, beginning from the direct power creation to more refined usage arrangements, such as diverting it into the natural gas network or utilizing it to deliver biomethane for transport.

4.3. Bioethanol

Bioethanol is the derived alcohol from the fermentation of main carbohydrates that are produced in sugar or starch-bearing plants such as corn, sugarcane, sorghum, etc. The fermentation procedure requires less energy and uses a much cheaper production system than biodiesel. Around 2.2 million liters of bioethanol are created utilizing 9 MT of molasses in India ((International Standards Organization)14040, 2006). DBT-ICT Center for Energy Biosciences created bioethanol innovation and exhibited the cellulosic ethanol plant at Indian Glycol Limited, Kashipur, with the undertaking cost of $5.28 million on 22 April 2016. It was running at a pilot-scale (1 T/day) with a 750,000-L yearly liquor creation limit and was equipped for changing over to different biomasses like wheat straw, rice straw, bagasse, cottontail, bamboo, and so on, as feedstock for the liquor extraction. CSIR-NIIST, Thiruvananthapuram has introduced a pilot plant office for the lignocellulos’s bioethanol program [53]. Praj Industries Ltd. (Pune, India), Pune, and Techno Sys Systems, Jaipur, have created technologies with plans of action for bioethanol creation as well. To summarize, we can say that India will have numerous bioethanol plants setting up soon because of the governmental guidelines on mixing bioethanol with gas as an obligatory necessity.

4.4. Biohydrogen

Biomass derived from plant crops, agricultural residues, woody biomass, waste inferred biomass, organic portions of MSW, and industrial wastewater (IWW) can be utilized as feedstock for the creation of biohydrogen (Bio-H2) [54]. The dark fermentation (fermentative conversion of organic substrate into biohydrogen, which is acidogenic) procedure is broadly utilized for the Bio-H2 creation as it is generally less energy consuming, operational, and financially achievable. Bio-H2 creation utilizing waste is a maintainable innovation for future energy requests and at the same time, it also adds to the development of a bio-based economy. MNRE (Ministry of New and Renewable Energy) under the mission mode category is supporting CSIR-IICT, Hyderabad, and IIT Kharagpur, for setting up a pilot plant office of 10 m3 ability to depict the Bio-H2 creation utilizing biogenic waste as feedstock. CSIR-IICT has planned and fostered an exceptional Bio-H2 pilot plant with an amazing facility to use different sorts of biogenic wastes and assistants to specifically improve acidogenic biocatalysts and also pretreat feedstock. Aside from Bio-H2 creation, the cycle in biorefinery mode can likewise deliver side-effects, for example, biomethane and unsaturated fat-rich corrosive intermediates like acetic acid derivation, butyrate, propionate, and so on, which have direct business significance [55]. These acids have critical applications as platform compounds utilized in plastics, drugs, materials, and food additives, and are the intermediates for some major chemicals and fuels. A recycling plant or sorting plant sorts and pre-processes recyclable items. This facility only receives waste separated by source. The selected sorting process consists of a magnetic separator, a vortex separator, and a semi-automatic process with manual sorting. A selection efficiency of 95% was assumed for all materials in the sorting plant. After sorting, the collected materials are sent to a recycling facility. The latter was thought to be 95% efficient in converting the resulting material into new products [55]
The integration of biochemical wastewater treatment (especially by anaerobic digestion) and pyrolysis of sewage sludge is sustainable for urban wastewater with useful biofilter products containing pyrolytic syngas and bio, if well established. It appears as an interesting suggestion to support the basics of processing. This is a preliminary study on the recovery of Brazilian sludge from aerobic and anaerobic processes aimed at bioenergy. Further pilot-scale testing to collect evidence has not yet been conducted, but early results already indicate the possibility of using this sludge for biofuel production. Finally, the bioenergy utilization of pyrolyzed ash-rich sludge is part of the zero-landfill approach and seems to be an interesting alternative to further increasing the reading of this type of biowaste [56].

4.5. Implementation of Waste Systems across the University Campus

A zero-waste program was set up on a university campus because of grassroots students’ worry over ecological administration issues. The execution technique comprised of starting conversations with the academics and neighborhood authority staff at a university environmental forum, the development of a functioning forum, the readiness of a funding proposal, and the foundation of an externally funded research system, an instructive yet limited-time program led by an academic staff member. Support from senior administration existed as a written environmental policy and a signed obligation to ecological duty in tertiary training and university financing support followed the achievement of the initial funding application. Tasks were commonly led by paid examination partners, helped by student volunteers, and administered by a program chief from the academic staff. Co-activity and support from the management office staff were acquired informally. A campus environmental forum was set up to work with correspondence on the ecological issue between the School for the Environment, senior university management, management office staff, academic staff, and students. To empower a full program advancement nonetheless, a requirement for linkages between all areas associated with the program and the presentation of a formal environmental management system was identified.
The amount of food waste creation in the Chinese catering industry is roughly 17–18 Mt each year. This area represents about 20% of the absolute food losses in China. China’s National Development and Reform Commission has confirmed that 100 pilot urban areas in five bunches will be executing food waste treatment projects. Practically 80% of these ventures depend upon anaerobic processing. In this way, it is vital to see what the ecological effect of this new bioenergy or waste-to-energy chains (particularly at a limited scale) is. Therefore, a life cycle assessment contextual investigation was introduced in this work, because of an anaerobic processing plant, taken care of with the non-consumable food waste created by 29 containers, which work inside the grounds of the Huazhong University of Science and Technology (HUST). The speculated effects are climate change, acidification, eutrophication, and photochemical oxidation. The notable unit is addressed by 1 kWh of created power. This work shows that limited-scale biogas plants can be permitted to work seamlessly inside large Chinese university grounds and can efficiently diminish the ecological effect of food waste management, particularly if the pyrolysis procedure is devised to dispose of the digestate [56].
Comparing the normalized CO2 balances of different universities, we found a clear difference. The main reason for this is that there is no unified international standardization method for calculating the carbon footprint of educational institutions with specific characteristics compared to organizations, especially those in other disciplines. It is desirable not to extrapolate the data for a specific period. Emission factors are revised and published annually, so it makes more sense to use the fiscal year (rather than the academic year) as the time base for calculating carbon footprint in educational institutions. Therefore, it is advisable to implement a mechanism for keeping historical records.

4.6. Recommendations for Future Studies

As mentioned in each section, the lack of data was a major obstacle to this study. Future studies will proactively choose between an input and output approach, process analysis, or mixed life cycle assessment to identify suitable GHG sources and recommend a more comprehensive registration page at the university. Due to the variety of activities, future carbon footprint studies are encouraged to consider all greenhouse gas emissions, discuss data assumptions, and include lifecycle stages in the assessment. This allows for more detailed comparisons and benchmarking of carbon emissions from higher education institutions. Other greenhouse gas emission sources that can be evaluated are compost production, agriculture, food, beverages, furniture, laboratory supplies, agricultural products, machinery and infrastructure, and construction activities. The GHG emission source evaluated in this study can be expanded to include additional life cycle stages upstream of scope 1 GHG emissions. Downstream impacts such as greenhouse gas emissions associated with landfill and recycling, construction, and disposal of demolition materials can also help further improve campus carbon dioxide emissions. This includes CO2 compensation such as purchases and forest management credits. To get a complete picture of the effects of MSWM, social factors (respiratory diseases, etc.), economic factors (diesel costs, etc.), and psychological factors (abnormal noise, etc.) must be considered.

5. Conclusions

This research focuses on waste characterization and emphasizes the importance of several factors, including waste diagnosis and the need for regulatory standards on open dumping, the conversion of open dumps to sanitary landfills, and the establishment of waste treatment, material, and energy recovery units. According to the characterization research, organic waste is the most common component of MSW, accounting for 76% of the total trash. As a result of this finding, anaerobic digestion was discovered as a viable therapeutic option. It was also shown that separating MSW at the source improves the effectiveness of anaerobic digestion plants. It is also critical that residents are made aware of the necessity of trash sorting and recycling through mass awareness campaigns and education, in which universities play a key role. Universities must invest in trash collection infrastructure that allows source-segregated waste to be collected separately and transported to waste treatment facilities. For a smooth transition to structural and sustainable waste management systems, LCA is being used to analyze the present MSW management of the RUC of India. For the RUC waste management, this study evaluated a base scenario of open dumping as well as three alternative scenarios that included a combination of anaerobic digestion, composting, and landfilling. Material and energy recovery were evaluated, as well as their influence on the environment, including global warming, acidification, eutrophication, human toxicity, terrestrial and aquatic toxicity, and so on. For the GWP, FEW, HT, TE, FWT, and MET impact categories, scenario S3 (AD + LFWR) had the lowest impact. According to the study, treating MSW RUC with an integrated waste management facility that combines anaerobic digestion in small-scale units, composting, and landfill without gas recovery alternatives is the best approach for maximizing material and energy recovery while minimizing environmental impacts. The findings support the use of LCA as a valuable tool for developing integrated waste management systems because it allows council officials to compare the environmental consequences of several alternative waste treatment technologies. Furthermore, research into normalization factors and weights for mid-point and end-point effect categories relevant to the Indian context must be conducted. The goal of this study was to give a comprehensive assessment of the environmental consequences associated with existing waste management treatment options, as well as possible prospects for successful impact offsetting.
To get a complete picture of the effects of MSWM, social (respiratory diseases, etc.), economic (diesel costs, etc.), and psychological (abnormal noise, etc.) factors need to be considered for further assessment and the final decision. The foremost hassle within the evaluation is to locate the supply of facts and gather the facts to decide the greenhouse fuel line emissions. However, this looks at how the extent of consciousness amongst college and college students for feasible discount ability of GHG emissions has been raised. This can serve for example Indian universities in lessening their effects because of intake and they can also increase their carbon control plans. Therefore, following this review, there is no standardized standard for reporting university GHG emissions, primarily related to the organizational boundary aspects of indirect emissions and emission factors. The lack of common criteria, apart from the issue of comparability, results in inventories that do not clearly indicate potential opportunities for mitigation action. For this reason, and as a future research proposal, it is necessary to develop methods and simplified computational tools for the university’s carbon footprint. The goal is to achieve comparable results to other universities and to be able to identify and take into account all opportunities to reduce emissions.

Author Contributions

Conceptualization, A.K.J., V.R.S.C. and B.D.; methodology, A.K.J., V.R.S.C. and B.D.; software, A.K.J. and V.R.S.C.; validation, A.K.J. and V.R.S.C.; formal analysis, A.K.J. and V.R.S.C.; investigation, A.K.J. and V.R.S.C.; resources, B.D.; data curation, M.V.; writing—original draft preparation, A.K.J.; writing—review and editing, V.R.S.C., M.V. and B.D.; supervision, B.D.; project administration, B.D. All authors have read and agreed to the published version of the manuscript.

Funding

This research received no external funding.

Institutional Review Board Statement

Not applicable.

Informed Consent Statement

Not applicable.

Data Availability Statement

Not applicable.

Acknowledgments

The first author is thankful to Ministry of Human Resources and Development, Government of India for providing scholarship. Acknowledgements to Rajesh Kola, Technical Assistant Prasad for supporting all throughout the laboratory testing and analysis.

Conflicts of Interest

The authors declare no conflict of interest.

References

  1. Abdul-Azeez, I.A.; Ho, C.S. Realizing Low Carbon Emission in the University Campus towards Energy Sustainability. Open J. Energy Effic. 2015, 4, 15–27. [Google Scholar] [CrossRef] [Green Version]
  2. Adeniran, A.E.; Nubi, A.T.; Adelopo, A.O. Solid waste generation and characterization in the University of Lagos for a sustainable waste management. Waste Manag. 2017, 67, 3–10. [Google Scholar] [CrossRef]
  3. AICTE. Government of India, All India Council for Technical Education. 2016. Available online: https://facilities.aicte-india.org/dashboard/pages/dashboardaicte.php (accessed on 28 August 2021).
  4. Andrianisa, H.A.; Brou, Y.O. Role and importance of informal collectors in the municipal waste pre-collection system in Abidjan, Côte d’Ivoire. Habitat Int. 2016, 53, 265–273. [Google Scholar] [CrossRef]
  5. Angelo, A.C.M.; Saraiva, A.B.; Clímaco, J.C.N.; Infante, C.E.; Valle, R. Life Cycle Assessment and Multi-criteria Decision Analysis: Selection of a strategy for domestic food waste management in Rio de Janeiro. J. Clean. Prod. 2017, 143, 744–756. [Google Scholar] [CrossRef]
  6. Armijo de Vega, C.; Ojeda-Benítez, S.; Ramírez-Barreto, M.E. Mexican educational institutions and waste management programmes: A University case study. Resour. Conserv. Recycl. 2003, 39, 283–296. [Google Scholar] [CrossRef]
  7. Bahçelioğlu, E.; Buğdaycı, E.S.; Doğan, N.B.; Şimşek, N.; Kaya, S.; Alp, E. Integrated solid waste management strategy of a large campus: A comprehensive study on METU campus, Turkey. J. Clean. Prod. 2020, 265, 121715. [Google Scholar] [CrossRef]
  8. Zen, I.S.; Subramaniam, D.; Sulaiman, H.; Saleh, A.L.; Omar, W.; Salim, M.R. Institutionalize waste minimization governance towards campus sustainability: A case study of Green Office initiatives in Universiti Teknologi Malaysia. J. Clean. Prod. 2016, 135, 1407–1422. [Google Scholar] [CrossRef]
  9. Armijo de Vega, C.; Ojeda Benítez, S.; Ramírez Barreto, M.E. Solid waste characterization and recycling potential for a university campus. Waste Manag. 2008, 28 (Supp. 1), S21–S26. [Google Scholar] [CrossRef]
  10. Fagnani, E.; Guimarães, J.R. Waste management plan for higher education institutions in developing countries: The Continuous Improvement Cycle model. J. Clean. Prod. 2017, 147, 108–118. [Google Scholar] [CrossRef]
  11. Smyth, D.P.; Fredeen, A.L.; Booth, A.L. Reducing solid waste in higher education: The first step towards ‘greening’ a university campus. Resour. Conserv. Recycl. 2010, 54, 1007–1016. [Google Scholar] [CrossRef]
  12. Malakahmad, A.; Kutty, S.; Hasnain Isa, M. Solid Waste Characterization and Recycling Potential for University Technology PETRONAS Academic Buildings USM-MOSTI Project View project Detection Methods of Carcinogens in Estuaries View project. Am. J. Environ. Sci. 2014, 6, 422–427. [Google Scholar] [CrossRef]
  13. Berchin, I.I.; Grando, V.D.S.; Marcon, G.A.; Corseuil, L.; Guerra, J.B.S.O.D.A. Strategies to promote sustainability in higher education institutions: A case study of a federal institute of higher education in Brazil. Int. J. Sustain. High. Educ. 2017, 18, 1018–1038. [Google Scholar] [CrossRef]
  14. Tangwanichagapong, S.; Nitivattananon, V.; Mohanty, B.; Visvanathan, C. Greening of a campus through waste management initiatives: Experience from a higher education institution in Thailand. Int. J. Sustain. High. Educ. 2017, 18, 203–217. [Google Scholar] [CrossRef]
  15. Clabeaux, R.; Carbajales-Dale, M.; Ladner, D.; Walker, T. Assessing the carbon footprint of a university campus using a life cycle assessment approach. J. Clean. Prod. 2020, 273, 122600. [Google Scholar] [CrossRef]
  16. Sammalisto, K.; Brorson, T. Training and communication in the implementation of environmental management systems (ISO 14001): A case study at the University of Gävle, Sweden. J. Clean. Prod. 2008, 16, 299–309. [Google Scholar] [CrossRef]
  17. Lukman, R.; Tiwary, A.; Azapagic, A. Towards greening a university campus: The case of the University of Maribor, Slovenia. Resour. Conserv. Recycl. 2009, 53, 639–644. [Google Scholar] [CrossRef]
  18. Geng, Y.; Liu, K.; Xue, B.; Fujita, T. Creating a “green university” in China: A case of Shenyang University. J. Clean. Prod. 2013, 61, 13–19. [Google Scholar] [CrossRef]
  19. Ozawa-Meida, L.; Brockway, P.; Letten, K.; Davies, J.; Fleming, P. Measuring carbon performance in a UK University through a consumption-based carbon footprint: De Montfort University case study. J. Clean. Prod. 2013, 56, 185–198. [Google Scholar] [CrossRef]
  20. Dong, J.; Ni, M.; Chi, Y.; Zou, D.; Fu, C. Life cycle and economic assessment of source-separated MSW collection with regard to greenhouse gas emissions: A case study in China. Environ. Sci. Pollut. Res. 2013, 20, 5512–5524. [Google Scholar] [CrossRef]
  21. Wang, M.Q.; Han, J.; Haq, Z.; Tyner, W.E.; Wu, M.; Elgowainy, A. Energy and greenhouse gas emission effects of corn and cellulosic ethanol with technology improvements and land use changes. Biomass Bioenergy 2011, 35, 1885–1896. [Google Scholar] [CrossRef] [Green Version]
  22. Mandpe, A.; Bhattacharya, A.; Paliya, S.; Pratap, V.; Hussain, A.; Kumar, S. Life-cycle assessment approach for municipal solid waste management system of Delhi city. Environ. Res. 2022, 212, 113424. [Google Scholar] [CrossRef] [PubMed]
  23. Cheela, V.R.S.; Dubey, B. Review of Application of Systems Engineering Approaches in Development of Integrated Solid Waste Management for a Smart City. In Water Resources and Environmental Engineering II; Rathinasamy, M., Chandramouli, S., Phanindra, K., Mahesh, U., Eds.; Springer: Berlin/Heidelberg, Germany, 2019; pp. 159–177. [Google Scholar]
  24. Liikanen, M.; Havukainen, J.; Viana, E.; Horttanainen, M. Steps towards more environmentally sustainable municipal solid waste management—A life cycle assessment study of São Paulo, Brazil. J. Clean. Prod. 2018, 196, 150–162. [Google Scholar] [CrossRef]
  25. Oliveira, L.S.; Oliveira, D.S.; Bezerra, B.S.; Pereira, B.S.; Battistelle, R.A.G. Environmental analysis of organic waste treatment focusing on composting scenarios. J. Clean. Prod. 2017, 155, 229–237. [Google Scholar] [CrossRef] [Green Version]
  26. Sharp, L. Green campuses: The road from little victories to systemic transformation. Int. J. Sustain. High. Educ. 2002, 3, 128–145. [Google Scholar] [CrossRef]
  27. Institute, U.S. Climate & Emissions Sustainability. 2018. Available online: https://www.unh.edu/sustainability/operations/air-climate (accessed on 28 August 2021).
  28. ASTM E1756-08; Standard Test Method for Determination of Total Solids in Biomass. American Society for Testing and Materials: West Conshohocken, PA, USA, 2008. Available online: https://www.astm.org/Database.cart/historical/e1756-08.htm (accessed on 24 August 2021).
  29. ASTM E711-87; Standard Test Method for Gross Calorific Value of Refuse-Derived Fuel by the Bomb Calorimeter (Withdrawn 2004). American Society for Testing and Materials: West Conshohocken, PA, USA, 2004. Available online: https://www.astm.org/Standards/E711.htm (accessed on 24 August 2021).
  30. ASTM E777-87; Standard Test Method for Carbon and Hydrogen in the Analysis Sample of Refuse-Derived Fuel. American Society for Testing and Materials: West Conshohocken, PA, USA, 2004. Available online: https://www.astm.org/DATABASE.CART/HISTORICAL/E777-87R04.htm (accessed on 24 August 2021).
  31. ASTM E872-82; Standard Test Method for Volatile Matter in the Analysis of Particulate Wood Fuels. American Society for Testing and Materials: West Conshohocken, PA, USA, 2019. Available online: https://www.astm.org/Standards/E872.htm (accessed on 24 August 2021).
  32. Barlaz, M.A.; Chanton, J.P.; Green, R.B. Controls on landfill gas collection efficiency: Instantaneous and lifetime performance. J. Air Waste Manag. Assoc. 2009, 59, 1399–1404. [Google Scholar] [CrossRef] [PubMed] [Green Version]
  33. Liu, Y.; Sun, W.; Liu, J. Greenhouse gas emissions from different municipal solid waste management scenarios in China: Based on carbon and energy flow analysis. Waste Manag. 2017, 68, 653–661. [Google Scholar] [CrossRef]
  34. Bhupednra Kumar, S.; Munish, K. Life cycle assessment of potential municipal solid waste management strategies for Mumbai, India. Waste Manag. Res. J. Sustain. Circ. Econ. 2017, 35, 79–91. [Google Scholar] [CrossRef]
  35. Biswas, W.K. Life cycle assessment of seawater desalinization in Western Australia. World Acad. Sci. Eng. Technol. 2009, 56, 369–375. [Google Scholar] [CrossRef]
  36. Silva, F.B.; Yoshida, O.S.; Diestelkamp, E.D.; De Oliveira, L.A. Relevance of including capital goods in the life cycle assessment of construction products. LALCA Rev. Lat.-Am. Em Avaliação Do Ciclo De Vida 2018, 2, 7–22. [Google Scholar] [CrossRef]
  37. CPHEEO. CPHEEO:Central Public Health & Environmental Engineering Organisation (CPHEEO), Govt of India. 2020. Available online: http://cpheeo.gov.in/cms/about-cpheeo.php (accessed on 28 August 2021).
  38. Environmental Protection Agency (EPA). Report on “LFG Energy Project Development Handbook”. 2020. Available online: https://www.epa.gov/sites/production/files/2016-11/documents/pdh_full.pdf (accessed on 15 April 2021).
  39. Bassi, A.; Højlund, T. Environmental performance of household waste management in Europe—An example of 7 countries. Waste Manag. 2021, 69, 545–557. [Google Scholar] [CrossRef] [Green Version]
  40. Babu, G.L.S.; Lakshmikanthan, P.; Santhosh, L.G. Life Cycle Analysis of Municipal Solid Waste (MSW) Land Disposal Options in Bangalore City. In ICSI 2014: Creating Infrastructure for a Sustainable World—Proceedings of the 2014 International Conference on Sustainable Infrastructure; American Society for Civil Engineers: Pomona, CA, USA, 2014; pp. 795–806. [Google Scholar] [CrossRef]
  41. Bogner, J.E.; Chanton, J.P.; Blake, D.; Abichou, T.; Powelson, D. Effectiveness of a Florida Landfill Biocover for Reduction of CH4 and NMHC Emissions. Environ. Sci. Technol. 2010, 44, 1197–1203. [Google Scholar] [CrossRef] [PubMed]
  42. Turner, D.A.; Williams, I.D.; Kemp, S. Combined material flow analysis and life cycle assessment as a support tool for solid waste management decision making. J. Clean. Prod. 2016, 129, 234–248. [Google Scholar] [CrossRef] [Green Version]
  43. Mistri, A.; Dhami, N.; Bhattacharyya, S.K.; Barai, S.V.; Mukherjee, A.; Biswas, W.K. Environmental implications of the use of bio-cement treated recycled aggregate in concrete. Resour. Conserv. Recycl. 2021, 167, 105436. [Google Scholar] [CrossRef]
  44. European Commission. Committee and the Committee of the Regions a European Agenda on Migration 2. 2015. Available online: http://www.europarl.europa.eu/oeil/popups/ficheprocedure.do?lang=en&reference=2015/2660 (accessed on 25 August 2021).
  45. Pooja, Y.; Sukha, R. Environmental impact assessment of municipal solid waste management options using life cycle assessment: A case study. Environ. Sci. Pollut. Res. 2018, 25, 838–854. [Google Scholar] [CrossRef]
  46. Chatterjee, B.; Mazumder, D. Role of stage-separation in the ubiquitous development of Anaerobic Digestion of Organic Fraction of Municipal Solid Waste: A critical review. Renew. Sustain. Energy Rev. 2019, 104, 439–469. [Google Scholar] [CrossRef]
  47. CPHEEO. Manual on Municipal Solid Waste Management—2016:Central Public Health & Environmental Engineering Organisation (CPHEEO), Govt of India. 2016. Available online: http://cpheeo.gov.in/cms/manual-on-municipal-solid-waste-management-2016.php (accessed on 28 August 2021).
  48. Seruga, P.; Krzywonos, M.; Seruga, A.; Niedźwiecki, Ł.; Pawlak-Kruczek, H.; Urbanowska, A. Anaerobic Digestion Performance: Separate Collected vs. Mechanical Segregated Organic Fractions of Municipal Solid Waste as Feedstock. Energies 2020, 13, 3768. [Google Scholar] [CrossRef]
  49. Goedkoop, M.; Oele, M.; Leijting, J.; Ponsioen, T.; Meijer, E. Introduction to LCA with SimaPro Title: Introduction to LCA with SimaPro. 2016. Available online: www.pre-sustainability.com (accessed on 25 August 2021).
  50. El Hanandeh, A.; El-Zein, A. Life-cycle assessment of municipal solid waste management alternatives with consideration of uncertainty: SIWMS development and application. Waste Manag. 2010, 30, 902–911. [Google Scholar] [CrossRef] [Green Version]
  51. Ingrao, C.; Faccilongo, N.; Di Gioia, L.; Messineo, A. Food waste recovery into energy in a circular economy perspective: A comprehensive review of aspects related to plant operation and environmental assessment. J. Clean. Prod. 2018, 184, 869–892. [Google Scholar] [CrossRef]
  52. Styles, D.; Dominguez, E.M.; Chadwick, D. Environmental balance of the UK biogas sector: An evaluation by consequential life cycle assessment. Sci. Total Environ. 2016, 560–561, 241–253. [Google Scholar] [CrossRef] [Green Version]
  53. National Research Council. Waste Incineration and Public Health; National Academies Press: Washington, DC, USA, 2000. [Google Scholar]
  54. Kanhar, A.H.; Chen, S.; Wang, F. Incineration Fly Ash and Its Treatment to Possible Utilization: A Review. Energies 2020, 13, 6681. [Google Scholar] [CrossRef]
  55. Cheela, V.R.S.; John, M.; Biswas, W.; Dubey, B. Environmental Impact Evaluation of Current Municipal Solid Waste Treatments in India Using Life Cycle Assessment. Energies 2021, 14, 3133. [Google Scholar] [CrossRef]
  56. Zhou, H.; Yang, Q.; Gul, E.; Shi, M.; Li, J.; Yang, M.; Yang, H.; Chen, B.; Zhao, H.; Yan, Y.; et al. Decarbonizing university campuses through the production of biogas from food waste: An LCA analysis. Renew. Energy 2021, 176, 565–578. [Google Scholar] [CrossRef]
Figure 1. The geographic location of the study area.
Sustainability 14 08361 g001
Figure 2. Scenarios for the management of municipal solid waste S1: Unlined landfill (business-as-usual); S2 and S3: Integrated waste treatment facility (waste sorting percentage is the variable parameters S2 (50%) and S3 (90%)).
Sustainability 14 08361 g002
Figure 3. Characterized impact results for (a) global warming potential; (b) terrestrial acidification; (c) fresh water eutrophication; (d) marine eutrophication; (e) human toxicity potential; (f) terrestrial ecotoxicity; (g) fresh water ecotoxicity; and (h) marine ecotoxicity.
Sustainability 14 08361 g003
Table 1. Life cycle inventory data for 1 ton of MSW.
ParameterValueUnitReference
Landfill
Diesel consumption2L·t−1[40]
Methane generation55% [38]
LFG Collection efficiency90%[38]
LFG collected (Years 0–55)95% [39]
LFG collected (Years 55–100) % [39]
LFG Top cover oxidation36% CH4[41]
Anaerobic digestion
Electricity (pre-treatment)12.6kWh[5]
Electricity (Reactor)14kWh[39]
Methane emissions 0.5%% of CH4[39]
Transport of compost3L·t−1[40]
Electricityrecovery (biogas)35%[40]
Land application
N2O-N emissions (direct)1.25% of N-tot[5]
NH3-N emissions15% of N-tot[5]
NO3-N emissions20% of N-tot[5]
Incoming N content4.85kg N-tot[5]
Incoming P content0.65kg P-tot[5]
Incoming K content1.48kg K-tot[5]
Application of digestate20MJ/t digestate[5]
Application of mineral fertilizers0.36MJ/kg N-tot[5]
Incineration
Sodium hydroxide0.24kg[42]
Hydrated lime 10kg[42]
Activated carbon0.25kg[42]
Ammonia (NH3)0.5kg[42]
Electricity consumption0.27MWh[5]
LFG: landfill gas.
Table 2. Environmental impact categories evaluated in this study.
Impact CategoryUnit
Global warming potentialkg CO2 equivalent
Terrestrial acidificationkg SO2 equivalent
Freshwater eutrophicationkg-phosphorus equivalent
Marine water eutrophicationkg-nitrogen equivalent
Human toxicitykg 1,4-dichlorobenzene equivalent
Terrestrial ecotoxicitykg 1,4-dichlorobenzene equivalent
Freshwater ecotoxicitykg 1,4-dichlorobenzene equivalent
Marine ecotoxicitykg 1,4-dichlorobenzene equivalent
Publisher’s Note: MDPI stays neutral with regard to jurisdictional claims in published maps and institutional affiliations.

