Article

The Sustainability and Development Strategy of a Cattle Feed Bank: A Case Study

1
Faculty of Veterinary Medicine, Universitas Pendidikan Mandalika, Mataram 83126, Indonesia
2
Faculty of Integrated Technologies, Universiti Brunei Darussalam, Gadong BE1410, Brunei
3
Faculty of Food Science and Nutrition, Universiti Malaysia Sabah, Kota Kinabalu 88400, Sabah, Malaysia
*
Authors to whom correspondence should be addressed.
Sustainability 2022, 14(13), 7989; https://doi.org/10.3390/su14137989
Submission received: 5 May 2022 / Revised: 30 May 2022 / Accepted: 30 May 2022 / Published: 30 June 2022
(This article belongs to the Special Issue Sustainability of Agricultural and Food Systems)

Abstract

:
One of the Indonesian government’s policies to achieve national beef self-sufficiency is the 1000 beef village program. The program was piloted in many cattle-farming centers involving the operation of a feed bank to supply animal feed to tackle the challenge of feed limitation during the dry season. This study evaluates the sustainability status of an ongoing feed bank program and its development strategy based on the current progress of a feed bank used to serve five groups of farmers. Ninety sustainability attributes were derived based on six dimensions. The attributes were compiled from the primary data collected using a questionnaire. Expert opinions from practitioners were also considered in evaluating the attributes. The feed bank’s sustainability status and development strategy were determined using the multi-dimensional scaling method with the rapid appraisal approach. It was found that the overall sustainability status of the feed bank was less sustainable, with an overall score of 49.55. The individual dimensions of (A) policy and government support, (B) raw material, (C) facilities and infrastructure, (D) feed bank management, (D) human resource management, (E) price, production, and (F) distribution systems posed sustainability scores of 48.48, 60.33, 48.57, 47.89, 48.76, and 44.64, respectively. Among the 90 predefined attributes, 21 were identified as highly sensitive through both the root mean square and expert opinion. Those attributes led to five main recommended development strategies: (1) strengthening the institution, (2) intensifying training, (3) increasing human resources (4) partnership developments, and (5) increasing the role of multi-stakeholders.

1. Introduction

Indonesia has exhibited recent strong growth in the demand for beef [1], mainly consumed in Java Island (70%) [2]. It has been fueled by the increase of the middle-class and population growth [3]. Most (90%) of Indonesian beef producers are smallholders that cater to about 70% of the national beef production [4]. Smallholders’ cows supplied almost all of the calves, mostly in integrated crop and livestock farming systems [5,6]. Hence, the government’s approach to fulfill the demand mainly addresses the smallholders.
The Indonesian smallholder cattle system faces constraints in responding to the increasing domestic demand for beef. Indonesia still imports up to 280,000 tons of beef, an equivalent of 1.2 million cattle per year [6]. The government aims to reduce imports by increasing domestic beef production as a result of empowering the smallholder [5]. One of the government’s policies is to achieve national beef self-sufficiency through developing farmers for beef cultivation under the umbrella of the 1000 village program. It was initiated by a pilot project in West Nusa Tenggara Province, one of the five major provinces of beef cattle production. There were five villages designated as pilot villages to implement the program in 2020. They were chosen due to their proximity to each other, making it easier to execute, monitor, assist, and supervise the farmers and their livestock in terms of providing insemination services, veterinarians, and other field officers. The pilot project was designated as a locomotive to independently support more widespread activities in increasing the national beef supply [6].
One of the main important factors to support the program on top of providing cattle seeds and good management is the provision of adequate animal feed, both in quantity and quality, throughout the year [5]. A feed bank is expected to be a solution to overcome this problem. One of the five pilot villages was thus selected as a feed bank to support the provision of animal feed to the other four groups. It was expected to overcome difficulties in providing animal feed, especially during the dry season. Otherwise, the farmers would face a significant feed shortage [7].The feed bank was equipped with a chopper with a 6 ton/day production capacity and a trailer for a preserved feed gasket (silage) with standardized baled silage. Under optimal conditions, it could supply the feed requirement for 1000 cows in five pilot villages. The initial production target was 85 tons distributed to farmers in groups, with the condition that each group had 40 ha of forage land. Forage production from the farmer groups was sent to the feed production center to be processed into silage bales, then stored as feed reserves during the dry season. Since the program was by community-based farmers the quality of the produced feed was not regulated. Feed products sold by private companies in Indonesia must follow The Ministry of Agriculture Law No. 22/permentan/pk.110/2017 regarding the standard feed quality and feed product registration number. It is worth noting that the basic requirement for the national feed standard is still far below the international FSSC 22,000 standard. FSSC 2200 certifies the food, feed, and packaging safety systems. It provides a certification scheme that incorporates an in-depth hazard analysis in a robust food safety management system and complies with international standards such as ISO 22,000 for food safety management and ISO/TS 22,002-6 for food manufacturing. Those standards ensure consistent, high-quality audits monitored by an integrity program to measure and maintain performance for safe animal feed globally.
Based on the monitoring result, the implementation of the first five months of the pilot program was poor. Several key issues were identified: (1) the supply of raw material was highly limited; (2) the initial product was not taken by the farmers, and some have started to rot; (3) failure in management; (4) minimum mentoring in management and technical; (5) poorly trained personnel in terms of management, technology, product distribution, and the transportation systems for feed raw materials; and (6) the final price of baled silage was also considered too expensive (at IDR 1200/kg or USD 0.08/kg) and unaffordable by most of the farmers. These initial findings suggested a properly organized management system was needed to empower the feed bank to operate effectively. Poor management led to sub-optimal operation and inflated operational costs to the point of dysfunction. To improve the situation, a sustainability assessment of the program is required. It could provide objective assessment and lead to future improvements.
One of the methods to assess the efficacy of the feed bank program is by looking into its sustainability, as has been done in many aspects of agricultural development programs. An earlier study demonstrated that the level (and the types of crop-livestock integration in the dryland systems improved efficiency of these agro-ecosystems [8]. Farm sustainability depends on the integration of livestock into the system. By employing the data envelope analysis method, it was reported that differences in agro-ecological conditions and region-specific factors were also significant determinants of relative farm sustainability [9]. Sustainability analysis of mixed farms using Orfee bioeconomic farm model showed that fewer work peaks, lower global warming potentials and nitrogen balances, lower total production costs, higher and more stable net incomes could be achieved [10]. Applying an integrated sustainability score method that included an in-depth analysis of the social dimension of sustainability and integrating an assessment procedure to formulate improved management practices could assist farmers in finding win–win solutions that decrease the contrast between environmental and economic sustainability [11]. The importance of sustainability analysis with adequate indicators has been emphasized for current and future policy evaluation [12]. In our earlier work [13], sustainability analysis was also performed to evaluate and develop cattle farm development strategy based on collective cages. Those reports highly emphasized the importance of assessing sustainability status as a basis for formulating strategies in agricultural developments.
The objective of this study was to investigate the sustainability status based on an ongoing feed bank program and formulate policy toward its improved future sustainability. It was done by analyzing and assessing the sustainability status of the program execution and developing strategies to support the program. The sustainability status of many essential factors was first mapped by implementing the multi-dimensional system (MDS) analysis. MDS could provide each factor’s sustainability status, which was later used as a basis for setting a feed bank development strategy.

2. Methodology

2.1. Sustainability Dimension and Attributes

The research was conducted at the Bumbang Wetan Feed Bank in Batu Guling, Indonesia. It involved five groups of farmers: Mekar Jati, Tunas Karya, Mele Maju, Dui Urip, and Tandur Desi. The data collection was carried out from June to August 2021. The geographical location of the case study is shown in Figure 1. In 2015, Pujut sub-district had 102,659 population (with 49.228 males) with a population density of 440 per km2. It had a very high dependency ratio of 56. The district had a farming area of 6.875 ha, with the majority of the population being farmers mainly in agriculture and cattle breeding (33,394 cows) [14].
The methodology consisted of seven stages, namely: (1) determination of sustainability dimension, (2) identification and collection of attributes from each dimension, (2) attributes scoring using a sustainability scale, (3) review of the scoring, (4) ordination, (5) leverage analysis, (6) Monte Carlo analysis, and finally (7) formulation of a feed bank development strategy.
The sustainability status of the cattle feed bank was assessed using Rapid Appraisal Technique adapted from earlier work [15]. This method provides an objective, transparent and multi-disciplinary evaluation. The detailed methodology of the analysis is available elsewhere [16]. The sustainability dimensions of the feed banks were firstly identified as follows: (A) raw material; (B) facilities and infrastructure; (C) production system, price, and product distribution system; (D) human resource management and breeders; (E) government support; and (F) feed bank management.
Next, the attribute for each dimension was developed. The attributes were selected based on a few criteria: easy and objective scoring, and the ability to assign extreme scoring of 0% and 100% with respect to the sustainability status. Those attributes were compiled based on primary data collection carried out using a questionnaire. Expert opinions from practitioners and academics were considered in preparing those attributes. Subsequently, attribute scoring was conducted via peer review (an interview with farmers) and experts in the field, as well as a literature review. The assessment and scoring of the attributes were based on field observations and secondary data. Each attribute was assigned a score that reflects its sustainability. The score ranged from 1 to 5 based on the Likert Scale [17,18], depending on the individual circumstances. A lousy score reflects the most unfavorable conditions for developing a beef cattle feed bank. In contrast, a good score reflects the most favorable conditions. The scale of the sustainability index for feed bank development had an interval of 0–100. The scores of >50 were categorized as sustainable and conversely unsustainable if the scores were <50. The categorization was grouped into four: bad (<25), poor (25–50), sufficient (51–75), and good (>75).
Subsequently, the scores of those attributes were processed using non-parametric multidimensional scaling (MDS). This stage resulted in unbiased distance “maps” of relative locations. A squared Euclidean distance matrix with attribute scores normalized using Z-values was employed in an MDS for ratio data [19]. Goodness-of-fit was evaluated using stress values, in which values below 0.25 were considered acceptable. To provide the ordination with fixed reference points, the status was assessed relative to the best and worst possible scores from the set of attributes in each dimension. The hypothetical extreme scores of ‘good’ and ‘bad’ were thus assigned. Additional fixed reference points, expressing two half-way scores were also included to ensure the new evaluations did not flip vertically to their mirror image, a tendency with MDS ordinations. To provide a measure against which to compare variation in the data, random sets of attribute scores were simulated for each dimension. They were used as additional anchors to minimize shifts when overlaying points from different analyses. They were displayed as the mean and its 95% confidence limits, represented as crossed lines on the final ordination plot.
The position of the multiple points would be hard to imagine, as such requiring MDS for simple visualization [20]. After ordination, the whole MDS plot was rotated to a least-squares criterion) so that ‘good’ and ‘bad’ appears at the far right and left of a horizontal axis, respectively. At the same time, ordination scores (which were in standard deviations) were rescaled to run from 0% (at the ‘bad’ locus) to 100% (at the ‘good’ locus) to provide the convenience of the sustainability scaling. Similarly, the rotated MDS scores falling on the new y-axis are scaled to run from −50 (at the bottom) to 50 (at the top). [19].
Leverage analysis was conducted to identify the most sensitive sustainability attribute. The contributions of each attribute were measured using the root mean square (RMS). Higher RMS values indicate a more sensitive attribute to feed bank development sustainability. To examine the weightage of the attributes in influencing the ordination, the sustainability axis was taken as the dependent variable in a multiple regression with the normalized attributes as the independent variables. Regression coefficients that were significant showed relationships of the original attributes to the sustainability axis. A series of ordinations were done by successively dropping each attribute in turn out of the analysis. Then, the sum of squares of the differences of each attribute was compared to the one obtained with the full set of attributes. This stepwise analysis provides a standard error expressing the leverage of each attribute. Cluster analysis of the ordinated points was used to group the sustainability dimension in a mathematically objective fashion. It was done by using the complete Euclidean distance rule, which creates groups by identifying each member’s farthest neighbor. Finally, a convenient way to represent scores on the different axes of sustainability is a polygonal kite diagram. For each of the axes, a score of zero (0%) lies at the center and a score of 100% lies on the rim of the polygon.
The Monte Carlo analysis was used to evaluate the ordination errors according to a method reported earlier [15]. The results were presented in a scatter plot with 25 replications. It was further used to analyze (1) the effect of attribute scoring errors caused by lack of information, misunderstood attributes, or the method of attribute scoring; (2) the effect of variations in scoring due to disagreement between experts; (3) the stability of the MDS analysis process; (4) data entry errors or missing data; and (5) the high value of “stress” analysis results.
The formulation of a feed bank development strategy was based on the sensitive attributes from the leverage analysis. Each attribute was conducted using Rapid Appraisal Beef Cattle Feed Bank Smallholder (RAP-BCFBS method) detailed elsewhere [21]. The most sensitive attributes were reformulated without undermining the rest. The compiled strategies included the stages and efforts to develop a feed bank. It was done according to the following protocol. The order of sustainability attributes was first determined by prioritizing the most dominant attribute. Finally, strategic improvements in the form of operational policies were composed. The final recommendations considered rationality, costs, human resources, and feasibility.

2.2. Research Design

Both qualitative and quantitative methods were employed. The sustainability status and development strategy were determined using the MDS method with the RAP-BCFBS approach. It was a slight modification of methods used for sustainability analysis in fisheries [15], cattle farming [22,23], seaweed-based coastal area development [24], and cattle farming based on collective cages [13]. The attribute scores were analyzed multidimensionally to rank them (within the good and the bad points).
Through the MDS method, the position of the sustainability point could be visualized relative to the horizontal and vertical axes. With the rotation process, the position of the point could be visualized on the horizontal axis with the sustainability index value assigned a score of 0% (worst) and 100% (best), in which scores < 50% and >50% represented unsustainable and sustainable, respectively. The sustainability index values of all attributes were visualized in a kite diagram. The formulation of a feed bank development strategy was based on the sensitive attributes from the results of the leverage analysis.

2.3. Data Collection and Attributes

The primary data on the six pre-identified attributes were obtained from interviews with selected respondents, experts, and stakeholders, and from direct observations. The respondents were selected based on a purposive random sampling technique. They constituted seven managers, five group leaders, five workers, one veterinarian, and government officers (the head of animal husbandry regency, the head of livestock service office, and the head of a regional animal husbandry and animal health service). Five expert respondents were also included and selected based on competence, experience, credibility, neutrality, and willingness to participate in the survey. The total number of respondents was 26 people taken from five districts/cities. The sum of the analyzed attributes was 90. They included 15 on the sources of feed raw materials; 15 on the available facilities and infrastructure; 15 on the production systems, prices, and product distribution systems; 15 on the human resource managers and breeders; 15 on the government support; and 15 on the feed bank management attributes.

3. Results and Discussion

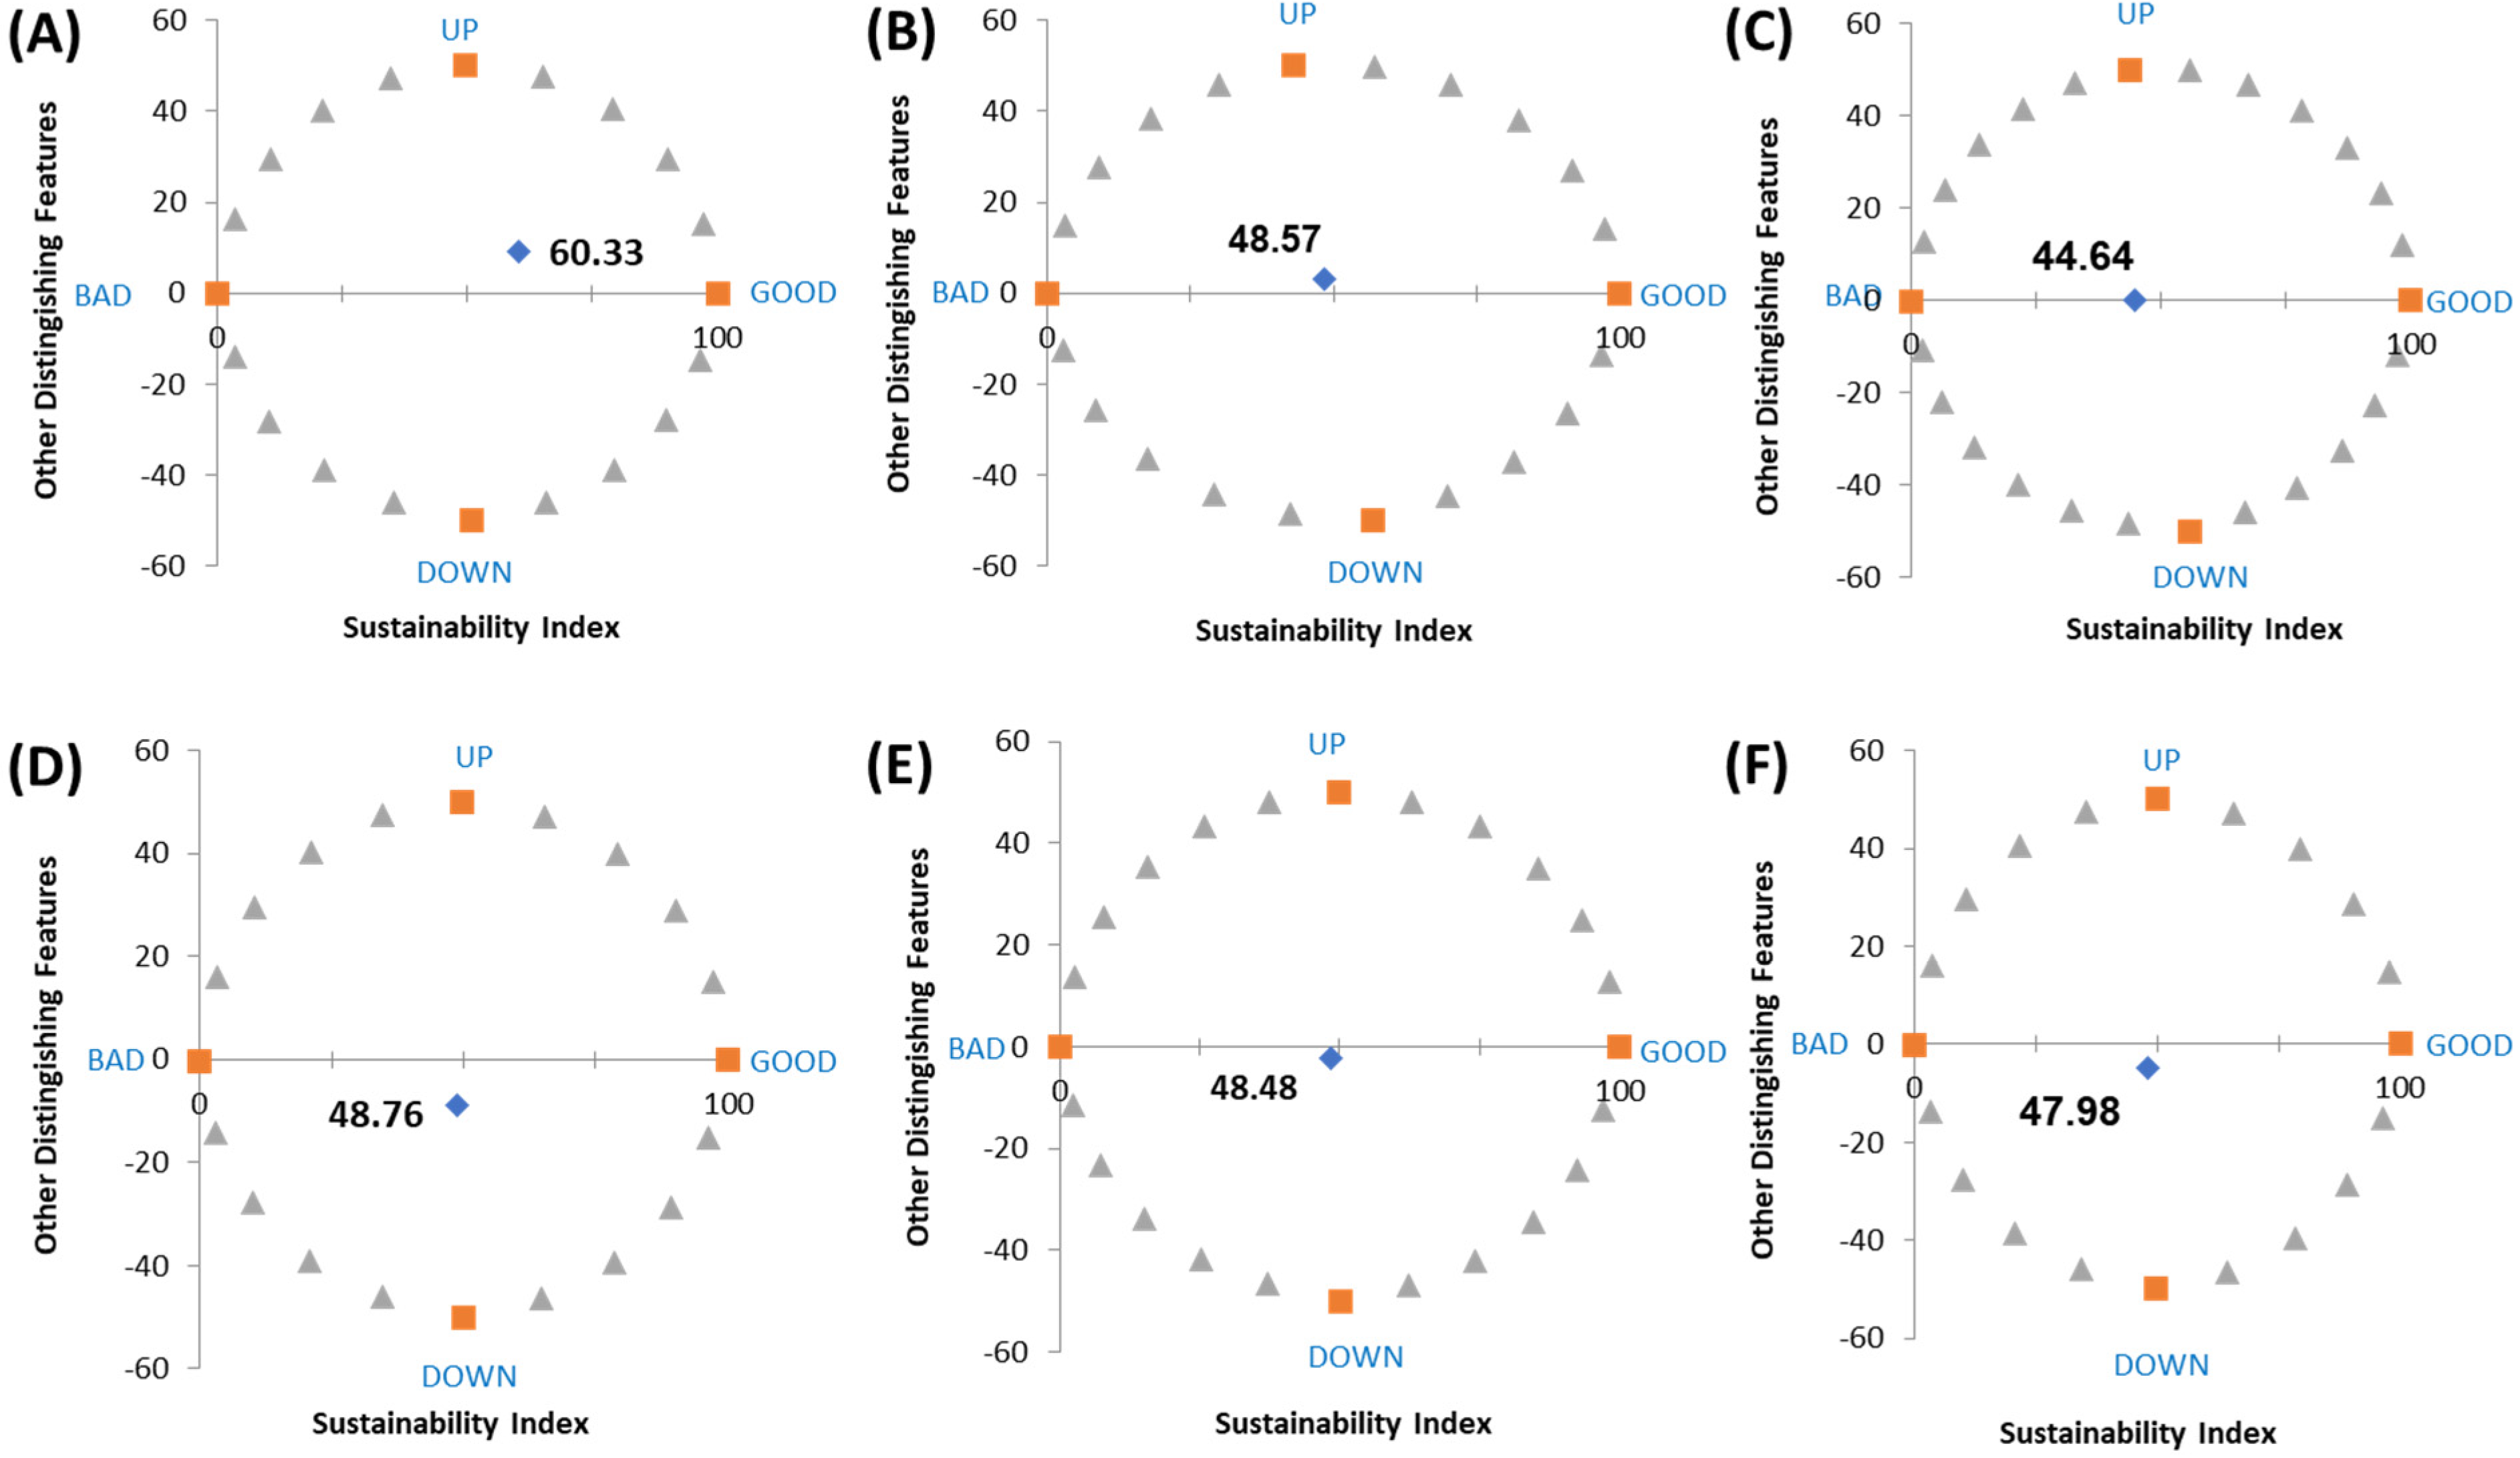
3.1. Sustainability Index

Figure 2 shows the sustainability indexes obtained from the ordination process on the six dimensions evaluated in this study. The sustainability score for dimensions of raw material; facilities and infrastructure; price, production, and distribution system; human resource management; government support, and feed bank management were 60.33, 48.57, 44.64, 48.76, 48.48, and 47.98, respectively. Only the first attribute (raw material) qualified as sustainable (>50).
A Monte Carlo analysis was carried out to evaluate the errors during the ordination process on the sustainability dimension. The scatterplots based on Monte Carlo analysis are shown in Figure 3. The ordination errors are indicated by points spread out or separated from other sets of points. The error might be caused by (1) the lack of information, misunderstanding of the attributes and the scoring methods; (2) the variations in scoring due to differences in opinions or judgments of the respondents; (3) the unstable anchor position in the MDS analysis; (4) missing data; and (5) the high value of “stress” analysis results, as listed elsewhere [15]. The results of the Monte Carlo analysis on all studied dimensions, as shown in Figure 3, are gathered around the center, indicating that the ordination results were stable and the errors could be managed.
There were 90 attributes evaluated in this study, in which 15 attributes were associated with each dimension listed in Table 1. The summary of the RMS values for each attribute is provided in Table 1. Most sensitives were selected based on their RMS value among those attributes. They were attributes of A1–A5, B1–B5, C1–C7, D1–D6, E1–E5, and F1–F6, totaling of 34 attributes. The experts further assessed the most sensitive attributes obtained from RMS values, resulting in the ultimately most sensitive attributes identified by both the RMS value and the expert opinion. They were A1–A3, B1–B3, C1–C5, D2–D4, D6, E2, E5, E6, F1, F3, and F4 (totaling of 21 attributes), denoted by “*” in Table 1.
It is worth noting that the sustainability related to the release of greenhouse gas (GHG) was excluded in this study because of limited knowledge of the respondents on this matter and beyond the scope of this work. The release of GHG issue is indeed critical since the agri-food industry consumes around 30% of global energy demand [25]. The agro-industry also emits a significant part of GHG released into the environment. To quantify the cattle farming impact, the environmental footprints could be estimated using the life cycle assessment method.

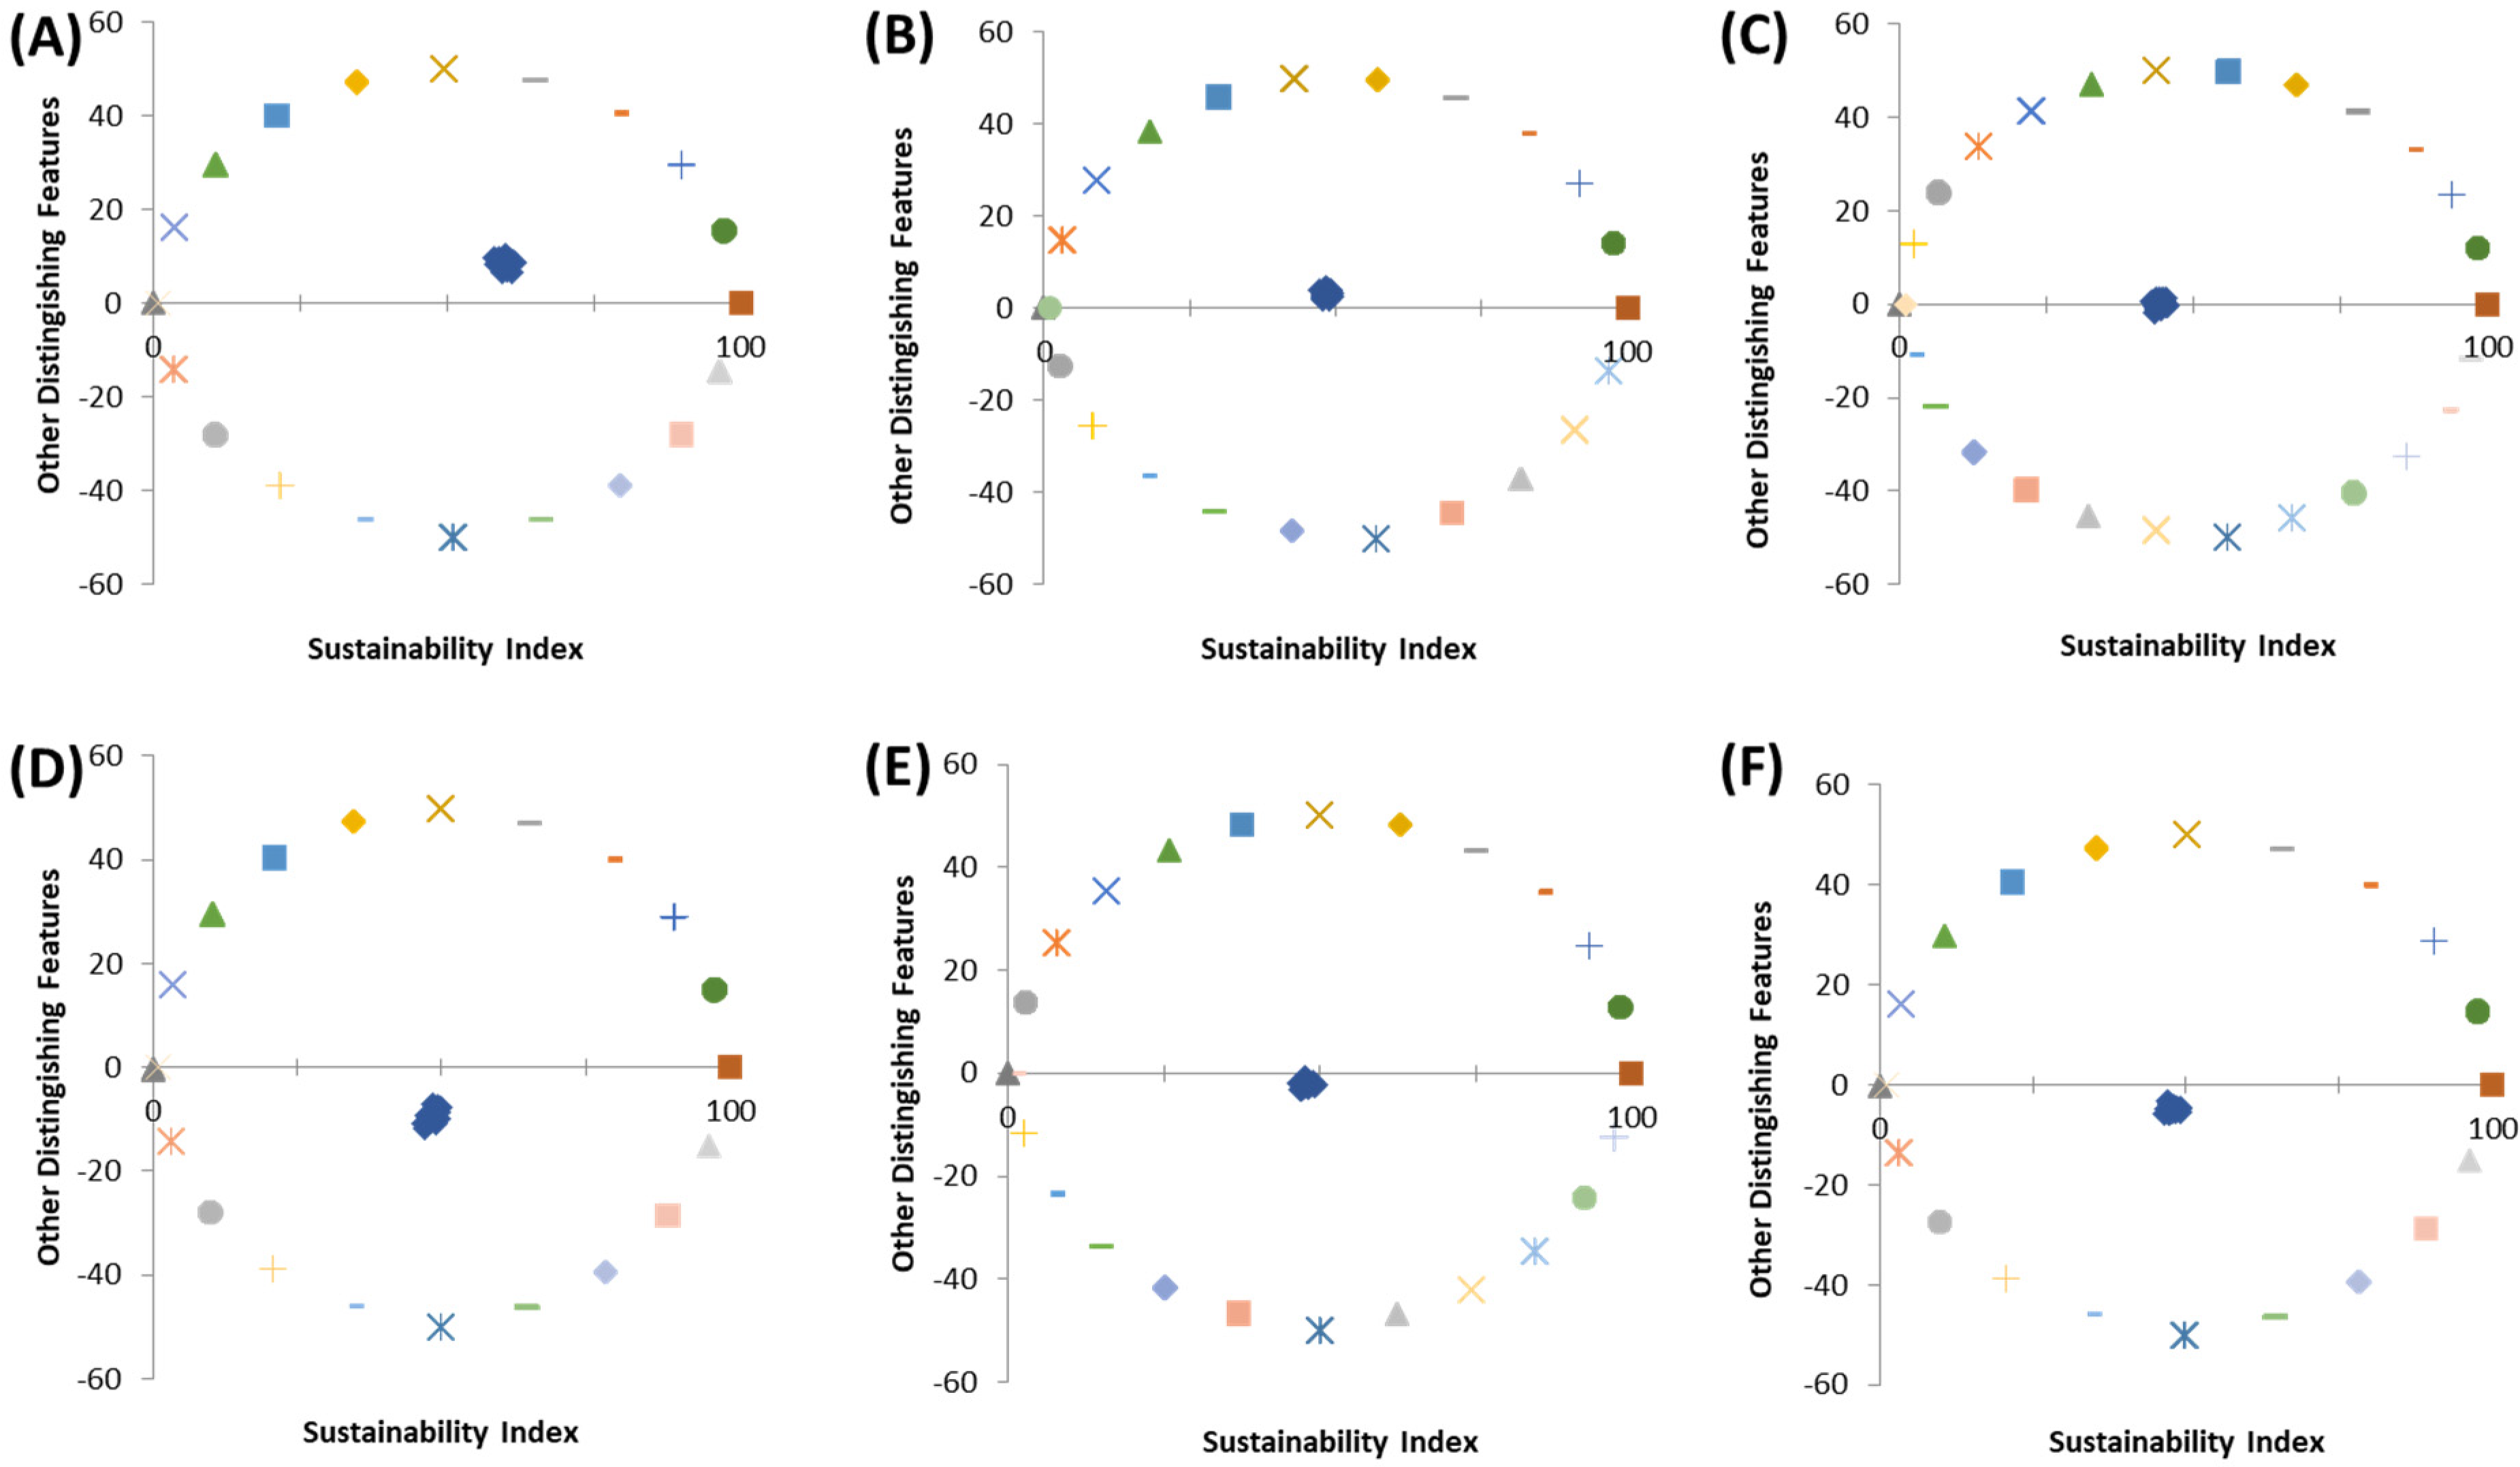
3.2. Multi-Dimensional Stress Value and Coefficient of Determination (R2)

The stress value and coefficient of all sustainability dimensions were 0.15 (except for A and E, both were 0.14). In addition, the coefficient of determinations (R2) for all dimensions were 0.95. Both parameters were used to evaluate and justify the accuracy of the results in indexing the sustainability. The stress value measured the accuracy of the obtained results to the original data (goodness of fit). The stress value approaches zero represented more reliable data, and vice versa. The findings on both stress value and R2 suggest that all sustainability dimensions for evaluating the feed bank were accurate, leading to a reliable conclusion. This deduction is in line with earlier research on evaluating the sustainability of fishery [26] and smallholder cattle farming [13] which defined high accuracy for stress values of <0.25 (25%) and R2 of ≥80% [15].

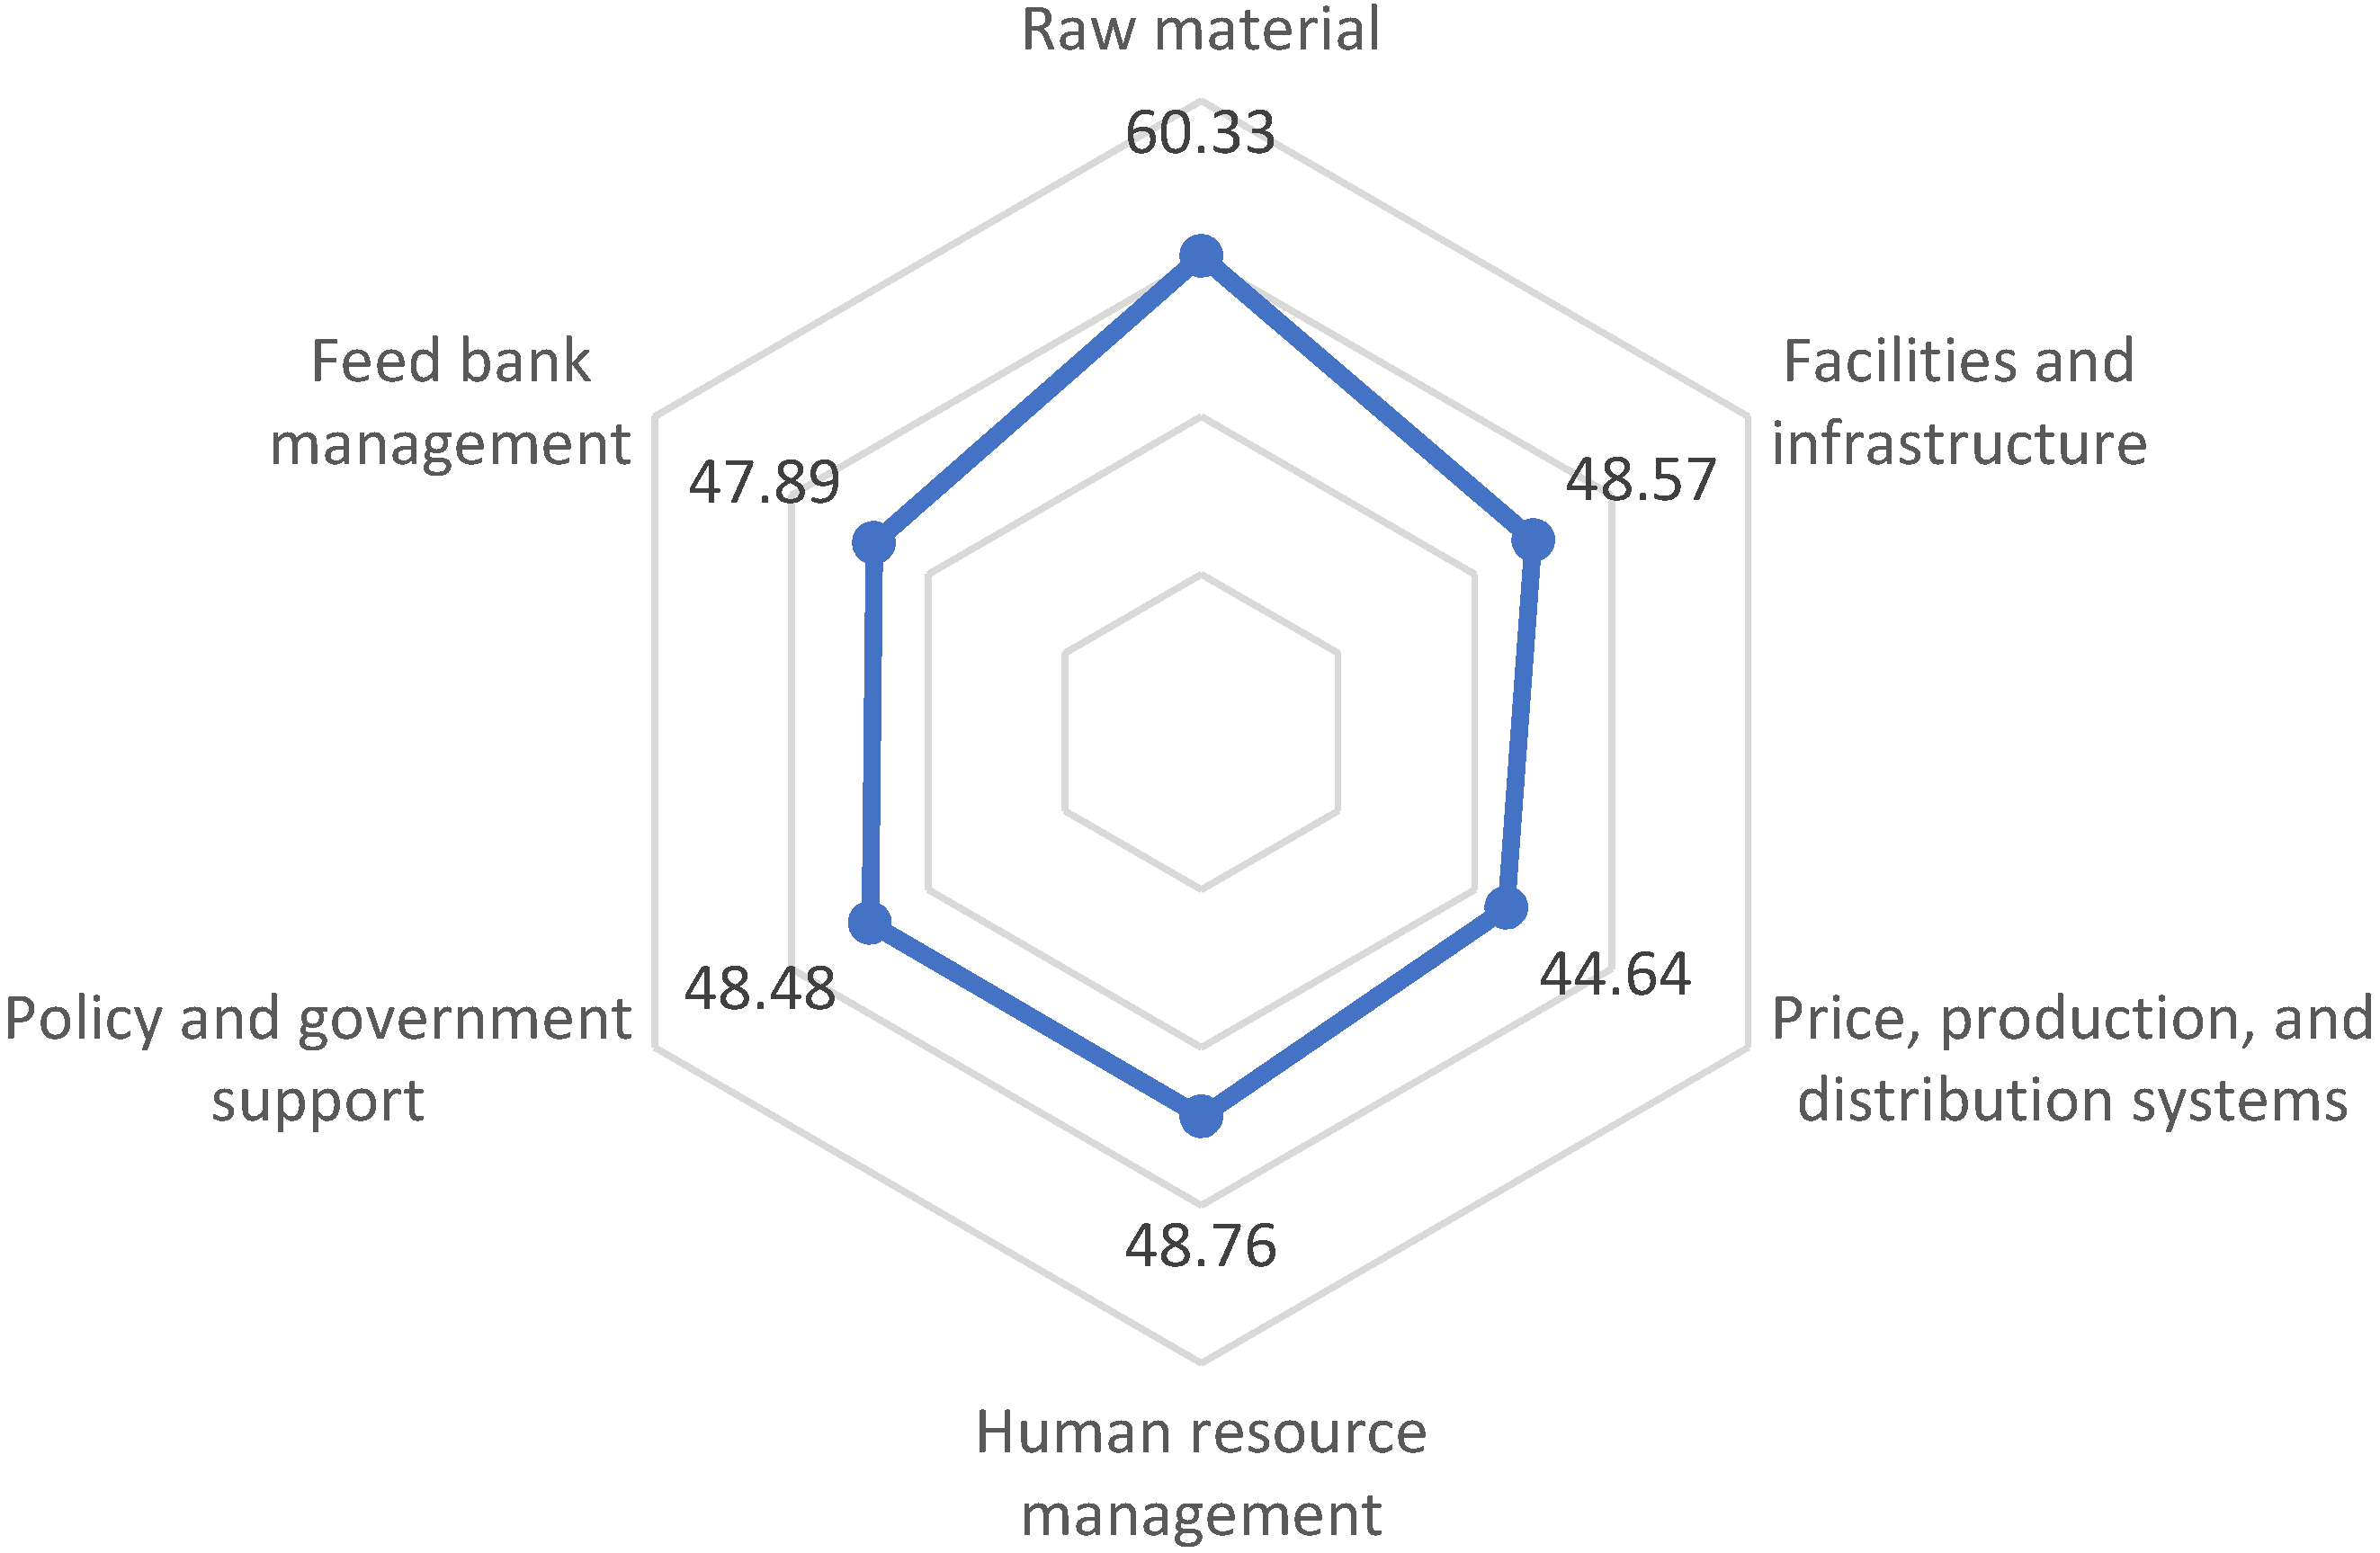
3.3. Multi-Dimensional Index of a Feed Bank Sustainability

Figure 2 shows that all sustainability dimensions were under the poor category (index score of 25–50, except for the raw material dimension (A) with the sustainability index score of 60.33, which fell under the sufficient category (51 < Score < 75). It means that the feedstock availability was pretty abundant in the rainy season or during the harvest season but reduced in the dry season, as also reported by others [5]. If the five dimensions under the poor category were not improved, a feed bank would be dysfunctional. Therefore, various coaching strategies and capacity building are needed to enhance the program’s sustainability.
The combined sustainability index values for the six dimensions of the feed bank are shown in Figure 4. Determination of the sustainability index in a multi-dimensional manner is essential to capture the comprehensive view or the big picture of the feed bank sustainability. Multi-dimensional values were obtained by multiplying the sustainability index score with the weightage of the corresponding dimension based on expert opinion. According to an earlier report [13], the multi-dimensional value of sustainability cannot be achieved through simple averaging. It must be done with a pair-wise comparison test obtained from expert assessments, as shown in Table 2. It shows that the combined value of the six dimensions is 49.55. The magnitude of this figure indicates a less sustainable category.

3.4. Strategy for Feed Bank Development

The development strategies of a feed bank were composed by looking at the most sensitive attributes listed in Table 1. They were considered as the main priority. Next, expert opinions for improvement or refinement resulted in 21 critical attributes, namely, A1–A3, B1–B3, C1–C5, D2–D4, D6, E2, E5, E6, F1, F3, and F4, as detailed in Table 1. Based on the order of priority of the most dominant/sensitive attributes, feed bank development strategies for smallholder beef cattle farms based on collective cages were developed. They included (1) strengthening of feed bank institutions, (2) improving coaching and mentoring, (3) training for the feed bank managers, (4) developing partnerships, and (5) enhancing multi-stakeholder roles.

3.4.1. Strengthening of Feed Bank Institutions

The limited supply of raw materials, especially during the dry season, could be one of the reasons why the prices of feed products produced by feed banks are still perceived as expensive by farmers [5]. Grazed animals are increasingly sought due to perceived animal welfare advantages. Yet, grazing systems provide the farmer and the animal with unique challenges because of its sensitivity to the climate for feed supply, with off-farm feed and associated labor and mechanization costs [27]. It is thus necessary to carry out several programs to strengthen the institution and increase the feed bank capacity. It is essential to optimize the utilization of various types of abundant raw materials during the rainy season. They can be obtained through cultivation of grasses such as elephant grass, king grass, odot grass, and various types of legumes (legumes, Turi plant, Lamtoro plant) or obtained from nature (i.e., field grass) or various agricultural wastes (i.e., rice straw, corn straw, and legume crop waste), or from agricultural waste such as hazelnut skin [28] or sugar beet pulp [29]. This strategy is essential in order to anticipate the limited supply in the dry season, as discussed earlier [30]. As practiced in this case study, each farmer group should have a feed bank so it does not depend wholly on the centralized feed bank.
The implementation of a feed bank does not strictly depend on the infrastructure. A feed bank prepares sufficient and sustainable raw feed (both in quantity and quality) throughout the year. The expensive product cost of IDR 1500/kg resulted in low demand and poor utilization of the feed products. Farmers expected a maximum price of feed products of IDR 1000/kg, far below the one offered by the current feed bank. Alternatively, farmers would purchase the feed bank products even though they are expensive (>IDR 1500/kg) if proven to increase the cattle’s body weight, i.e., through proven laboratory testing. The low demand for feed products produced by feed banks was also because some farmers could obtain the feed from other sources. The high operational costs also inflated the processing costs of the feed production by the feed bank. The production must run continuously at the full capacity to lower the operation and overhead costs. The results of the field survey showed that the operation was sub-optimal (i.e., poor planning and limited capacity). Moreover, sales expansion beyond the designated farmer group might allow the facilities to run under optimum production capacity.

3.4.2. Improved Coaching and Mentoring

Increasing the training frequency by the sub-district officers is very important. As found from the field survey, no special officer fully assisted the feed bank. They coached while having many other parallel tasks, leading to sub-optimal performance and throughput. Therefore, special officers fully designated for fostering, guiding, and facilitating the farmer groups are highly recommended.

3.4.3. Training for the Feed Bank Managers

Even though the recruitment of a feed bank manager underwent a strict selection process, their low readiness levels led to a poor understanding of their main tasks and functions. It was partly caused by the top-down nature of the program, accompanied by poor managerial coordination. The situation would differ if the program were bottom-up, based on community/farmer needs. It is thus, necessary to increase the administration and the financial capacity of the feed bank managers to improve their performance. The managers’ paradigm needs to shift from dependency on government assistance to agribusiness that benefits the farmers. A work orientation that only relies on constant subsidy would hinder the feed bank development and threaten for unsustainability.

3.4.4. Developing the Feed Bank Partnership

Several policies can be carried out to increase the feed bank partnerships. Beyond smallholder producers and value chain participants, the stakeholders include government, academic and research organizations, businesses, and the broader community [31]. One of the strategic steps is to prepare a robust production plan. It includes estimating the target product capacity, the need for raw feed materials, identification of potential partners, production time, labor requirements, production cost, product prices, and the feed distribution system. The current feed bank has not yet secured a potential permanent partner for product sales and is vulnerable to product spoilage. The five farmer groups were expected to be the main customers and could be used as the basis for the planning. To allow higher production capacity, feed bank products also need to be promoted to other livestock farmer groups. The price of feed products would become cheaper when produced in larger capacities. Promotion of feed bank products can be done by introducing the quality and quantity of the product and the price offered. The value offering, and the targeting of customers (the farmers), is the primary strategy to achieve competitive advantage [31]. Value creation and delivery, or value architecture, refers to delivering value to these customers. Farmers and breeders would be interested in buying feed bank products if the feed produced has been proven and tested for its superiority in increasing livestock productivity.

3.4.5. Enhancing Multi-Stakeholder Roles

The success feed bank is highly associated with support for cooperation with the business sector. Several strategies can be carried out to increase stakeholders’ roles. The development of beef cattle agribusiness, especially in providing the feed, must be built from the top to the downstream [31]. The role of the market becomes increasingly important because the feed is the most significant component of the overall production cost [32].
The relevant research organizations are the Indonesian Agency for Agricultural Research and Development, within the Ministry of Agriculture. It hosts two related research centres: The Indonesian Centre for Animal Research and Development and the Indonesian Centre for Agricultural Socio-Economic and Policy Studies. They formulate and help implement technical aspects of policies, including disseminating results of research.
The local government provides extension services through the Agency for the Assessment and Application of Technology (also locally called BPTP) that facilitate the adoption of appropriate technology and training of field trainers. They promote awareness and knowledge of innovations and identify and support ‘early adopters’ to facilitate the adoption of innovations. Furthermore, they can link the smallholders with other shareholders to target inclusive and sustainable business models.
Universities’ roles are threefold: teaching, research, and community services. They provide education and training, assistance and support for field studies, and the creation of new knowledge. Universities’ role in community services would encourage smallholders’ market participation and link with other value chain actors. Cooperation with research institutions and universities are required, which have been very limited. The latter can provide access to state-of-the-art technology. One of the successful cooperation involved the ACIAR program (https://www.aciar.gov.au/ (accessed on 5 March 2022)). It provided Lamtoro plant seeds that could be grown to support the feed during the dry season [5]. Through multi-stakeholder cooperation, recent innovations in the field of cattle farming can also be introduces, such as the importance of feeding nutritional strategies to minimize risk of animal disease (i.e., bovine respiratory disease) [33]. The nutritional status and the impact of the produced feed on productivity, efficiency, environmental sustainability, and profitability of the dairy industry also need to be regularly assessed [34].

4. Conclusions

The feed bank’s overall sustainability status was classified under the less sustainable category (with an overall sustainability score of 49.55). The dimensions (A) policy and government support, (B) raw material, (C) facilities and infrastructure, (D) feed bank management, (D) human resource management, (E) price, production, and (F) distribution systems posed sustainability scores of 48.48, 60.33, 48.57, 47.89, 48.76, and 44.64, respectively. Among the 90 predefined attributes, 34 were identified as sensitive based on the RMS, from which the expert confirmed 21. From those sensitive attributes, five main strategies for developing a feed bank have been formulated: strengthening feed bank institutions, increasing feed bank guidance and assistance, increasing human resource capacity for feed bank managers, and partnership developments and increasing the role of multi-stakeholders. Based on the findings, it can be recommended to improve the 21 key success factors based on sensitive attributes and expert opinions to strengthen the sustainability of the feed bank program.

Author Contributions

Conceptualization, M.M. (Mashur Mashur); methodology, M.M. (Mashur Mashur); validation, M.R.B. and K.K.; formal analysis, K.K. and M.M. (Muhammad Munawaroh); investigation, M.M. (Mashur Mashur); resources, M.M. (Mashur Mashur); data curation, M.M. (Mashur Mashur), M.R.B. and N.H.; writing—original draft preparation, M.M. (Muhammad Munawaroh); writing—review and editing, M.R.B., N.H., Q.C. and R.K.; visualization, M.M. (Mashur Mashur) and M.R.B.; funding acquisition, M.M. (Mashur Mashur) and N.H. All authors have read and agreed to the published version of the manuscript.

Funding

This research was funded by seed grant of Universitas Pendidikan Mandalika.

Institutional Review Board Statement

Not applicable.

Informed Consent Statement

Not applicable.

Data Availability Statement

Not applicable.

Conflicts of Interest

The authors declare no conflict of interest.

References

  1. Hati, S.R.H.; Zulianti, I.; Achyar, A.; Safira, A. Perceptions of Nutritional Value, Sensory Appeal, and Price Influencing Customer Intention to Purchase Frozen Beef: Evidence from Indonesia. Meat Sci. 2021, 172, 108306. [Google Scholar] [CrossRef] [PubMed]
  2. Available online: https://www.mla.com.au/globalassets/mla-corporate/prices--markets/documents/os-markets/red-meat-market-snapshots/2020/2020-indonesia-market-snapshot.pdf (accessed on 1 April 2022).
  3. Permani, R. Determinants of Relative Demand for Imported Beef and a Review of Livestock Self-Sufficiency in Indonesia. J. Southeast Asian Econ. 2013, 30, 294–308. [Google Scholar] [CrossRef]
  4. Priyanti, A.; Hanifah, V.W.; Mahendri, I.G.A.P.; Cahyadi, F.; Cramb, R.A.; Priyanti, A.; Hanifah, V.W.; Mahendri, I.G.A.P.; Cahyadi, F.; Cramb, R.A. Small-Scale Beef Cattle Production in East Java, Indonesia. In Proceedings of the Australian Agricultural and Resource Economics Society (AARES), Fremantle, Australia, 7–10 February 2012. [Google Scholar] [CrossRef]
  5. Dahlanuddin; Henderson, B.; Dizyee, K.; Hermansyah; Ash, A. Assessing the Sustainable Development and Intensification Potential of Beef Cattle Production in Sumbawa, Indonesia, Using a System Dynamics Approach. PLoS ONE 2017, 12, e0183365. [Google Scholar] [CrossRef]
  6. Agus, A.; Mastuti Widi, T.S. Current Situation and Future Prospects for Beef Cattle Production in Indonesia—A Review. Asian-Australas. J. Anim. Sci. 2018, 31, 976–983. [Google Scholar] [CrossRef] [Green Version]
  7. Burrow, H. Strategies for Increasing Beef Cattle Production under Dryland Farming Systems. Indones. Bull. Anim. Vet. Sci. 2019, 29, 161. [Google Scholar] [CrossRef] [Green Version]
  8. Alary, V.; Messad, S.; Aboul-Naga, A.; Osman, M.A.; Abdelsabour, T.H.; Salah, A.-A.E.; Juanes, X. Multi-Criteria Assessment of the Sustainability of Farming Systems in the Reclaimed Desert Lands of Egypt. Agric. Syst. 2020, 183, 102863. [Google Scholar] [CrossRef]
  9. Mutyasira, V.; Hoag, D.; Pendell, D.; Manning, D.T.; Berhe, M. Assessing the Relative Sustainability of Smallholder Farming Systems in Ethiopian Highlands. Agric. Syst. 2018, 167, 83–91. [Google Scholar] [CrossRef]
  10. Mosnier, C.; Benoit, M.; Minviel, J.J.; Veysset, P. Does Mixing Livestock Farming Enterprises Improve Farm and Product Sustainability? Int. J. Agric. Sustain. 2022, 20, 312–326. [Google Scholar] [CrossRef]
  11. Migliorini, P.; Galioto, F.; Chiorri, M.; Vazzana, C. An Integrated Sustainability Score Based on Agro-Ecological and Socioeconomic Indicators. A Case Study of Stockless Organic Farming in Italy. Agroecol. Sustain. Food Syst. 2018, 42, 859–884. [Google Scholar] [CrossRef]
  12. Lynch, J.; Donnellan, T.; Finn, J.A.; Dillon, E.; Ryan, M. Potential Development of Irish Agricultural Sustainability Indicators for Current and Future Policy Evaluation Needs. J. Environ. Manag. 2019, 230, 434–445. [Google Scholar] [CrossRef]
  13. Mashur, M.; Kholik, K.; Munawaroh, M.; Sriasih, M.; Oktaviana, D.; Sadiyah, S.N. Sustainability Analysis of Beef Cattle and Development Strategy Based on Collective Cages in Lombok Island. In International Virtual Seminar on Livestock Production and Veterinary Technology; IAARD Press: Jakarta, Indonesia, 2021; Volume 1, pp. 383–393. [Google Scholar]
  14. BPS Pujut Sub-District in Figures. Available online: https://lomboktengahkab.bps.go.id/publication/2016/07/29/7184e74680f0f82fdea84013/kecamatan-pujut-dalam-angka-2016.html (accessed on 30 May 2022).
  15. Kavanagh, P.; Pitcher, T.J. Implementing Microsoft Excel Software for Rapfish: A Technique for the Rapid Appraisal of Fisheries Status; University of British Columbia: Vancouver, BC, Canada, 2004. [Google Scholar] [CrossRef]
  16. Pitcher, T.J.; Preikshot, D. Rapfish: A Rapid Appraisal Technique to Evaluate the Sustainability Status of Fisheries. Fish. Res. 2001, 49, 255–270. [Google Scholar] [CrossRef]
  17. Jebb, A.T.; Ng, V.; Tay, L. A Review of Key Likert Scale Development Advances: 1995–2019. Front. Psychol. 2021, 12, 637547. [Google Scholar] [CrossRef] [PubMed]
  18. Ponsiglione, A.M.; Amato, F.; Cozzolino, S.; Russo, G.; Romano, M.; Improta, G. A Hybrid Analytic Hierarchy Process and Likert Scale Approach for the Quality Assessment of Medical Education Programs. Mathematics 2022, 10, 1426. [Google Scholar] [CrossRef]
  19. Trendafilov, N.; Gallo, M. Metric Multidimensional Scaling (MDS) and Related Methods. In Multivariate Data Analysis on Matrix Manifolds; Springer Series in the Data Sciences; Springer International Publishing: Cham, Switzerland, 2021; pp. 325–371. ISBN 978-3-030-76973-4. [Google Scholar]
  20. Grünhage, G. Teil I: Visualisierung Der Auswirkungen Einer Sich Ändernden Distanzmetrik Auf Die Daten Mittels Kontinuierlichem MDS (CMDS); Teil II: Ableitung Des Latent Space Modells Für Netzwerkdaten Mittels Expectation-PropagationLow Dimensional Visualization and Modelling of Data Using Distance-Based Models: Part I: Visualization of the Effects of a Changing Distance on Data Using Continuous MDS (CMDS); Part II: Inference of the Latent Space Model for Network Data Using Expectation Propagation. Ph.D. Thesis, Technische Universität Berlin, Berlin, Germany, 2018. [Google Scholar] [CrossRef]
  21. Mashur, M.; Subagio, S.; Usman, K.; Hunaepi, H. Analysis of the Sustainability Status of Feed Banks in the 1000 Village Cow Program in Pujut District, Central Lombok: (Dimension of Availability, HR Management, and Production System, Price, Feed Distribution). Prism. Sains J. Pengkaj. Ilmu Dan Pembelajaran Mat. Dan IPA IKIP Mataram 2021, 9, 365. [Google Scholar] [CrossRef]
  22. Ramadhan, D.R.; Nindyantoro, N.; Suyitman, S. Status Keberlanjutan Wilayah Peternakan Sapi Potong Untuk Pengembangan Kawasan Agropolitan Di Kabupaten Bondowoso. J. Peternak. Indones. Indones. J. Anim. Sci. 2014, 16, 78. [Google Scholar] [CrossRef] [Green Version]
  23. Suyitman, S.; Sutjahjo, S.H.; Djulardi, A. Status Keberlanjutan Wilayah Berbasis Peternakan Sapi Potong Terpadu Di Kabupaten Lima Puluh Kota–Sumatera Barat. J. Peternak. Indones. Indones. J. Anim. Sci. 2012, 14, 318. [Google Scholar] [CrossRef] [Green Version]
  24. Nuryadin, R. Analisis Keberlanjutan Pengembangan Kawasan Pesisir Berbasis Rumput Laut Di Kabupaten Sumbawa Barat. Master’s Thesis, Bogor Agricultural University (IPB), Bogor, Indonesia, 2015. [Google Scholar]
  25. Karwacka, M.; Ciurzyńska, A.; Lenart, A.; Janowicz, M. Sustainable Development in the Agri-Food Sector in Terms of the Carbon Footprint: A Review. Sustainability 2020, 12, 6463. [Google Scholar] [CrossRef]
  26. Fauzi, A. Pemodelan Sumber Daya Perikanan; Gramedia Pustaka Utama: Jakarta, Indonesia, 2005; ISBN 978-979-22-1233-4. [Google Scholar]
  27. Roche, J.R.; Berry, D.P.; Delaby, L.; Dillon, P.G.; Horan, B.; Macdonald, K.A.; Neal, M. Review: New Considerations to Refine Breeding Objectives of Dairy Cows for Increasing Robustness and Sustainability of Grass-Based Milk Production Systems. Animal 2018, 12, s350–s362. [Google Scholar] [CrossRef] [Green Version]
  28. Renna, M.; Lussiana, C.; Malfatto, V.; Gerbelle, M.; Turille, G.; Medana, C.; Ghirardello, D.; Mimosi, A.; Cornale, P. Evaluating the Suitability of Hazelnut Skin as a Feed Ingredient in the Diet of Dairy Cows. Animals 2020, 10, 1653. [Google Scholar] [CrossRef]
  29. Münnich, M.; Khiaosa-ard, R.; Klevenhusen, F.; Hilpold, A.; Khol-Parisini, A.; Zebeli, Q. A Meta-Analysis of Feeding Sugar Beet Pulp in Dairy Cows: Effects on Feed Intake, Ruminal Fermentation, Performance, and Net Food Production. Anim. Feed Sci. Technol. 2017, 224, 78–89. [Google Scholar] [CrossRef]
  30. Mashur; Oktaviana, D.; Kholik; Unsunidhal. Implementation of Health Management of a Beef Cattle Feed on the Collective Cage Based Smallholder Farming in Lombok Island. AIP Conf. Proc. 2019, 2199, 050007. [Google Scholar]
  31. Asikin, Z.; Baker, D.; Villano, R.; Daryanto, A. Business Models and Innovation in the Indonesian Smallholder Beef Value Chain. Sustainability 2020, 12, 7020. [Google Scholar] [CrossRef]
  32. Opportunities and Challenges of Smallholders and Smallholding; Agriculture Issues and Policies; Horváth, D. (Ed.) Nova Science Publishers: Hauppauge, NY, USA, 2021; ISBN 978-1-5361-9203-2. [Google Scholar]
  33. Devant, M.; Marti, S. Strategies for Feeding Unweaned Dairy Beef Cattle to Improve Their Health. Animals 2020, 10, 1908. [Google Scholar] [CrossRef] [PubMed]
  34. VandeHaar, M.J.; St-Pierre, N. Major Advances in Nutrition: Relevance to the Sustainability of the Dairy Industry. J. Dairy Sci. 2006, 89, 1280–1291. [Google Scholar] [CrossRef]
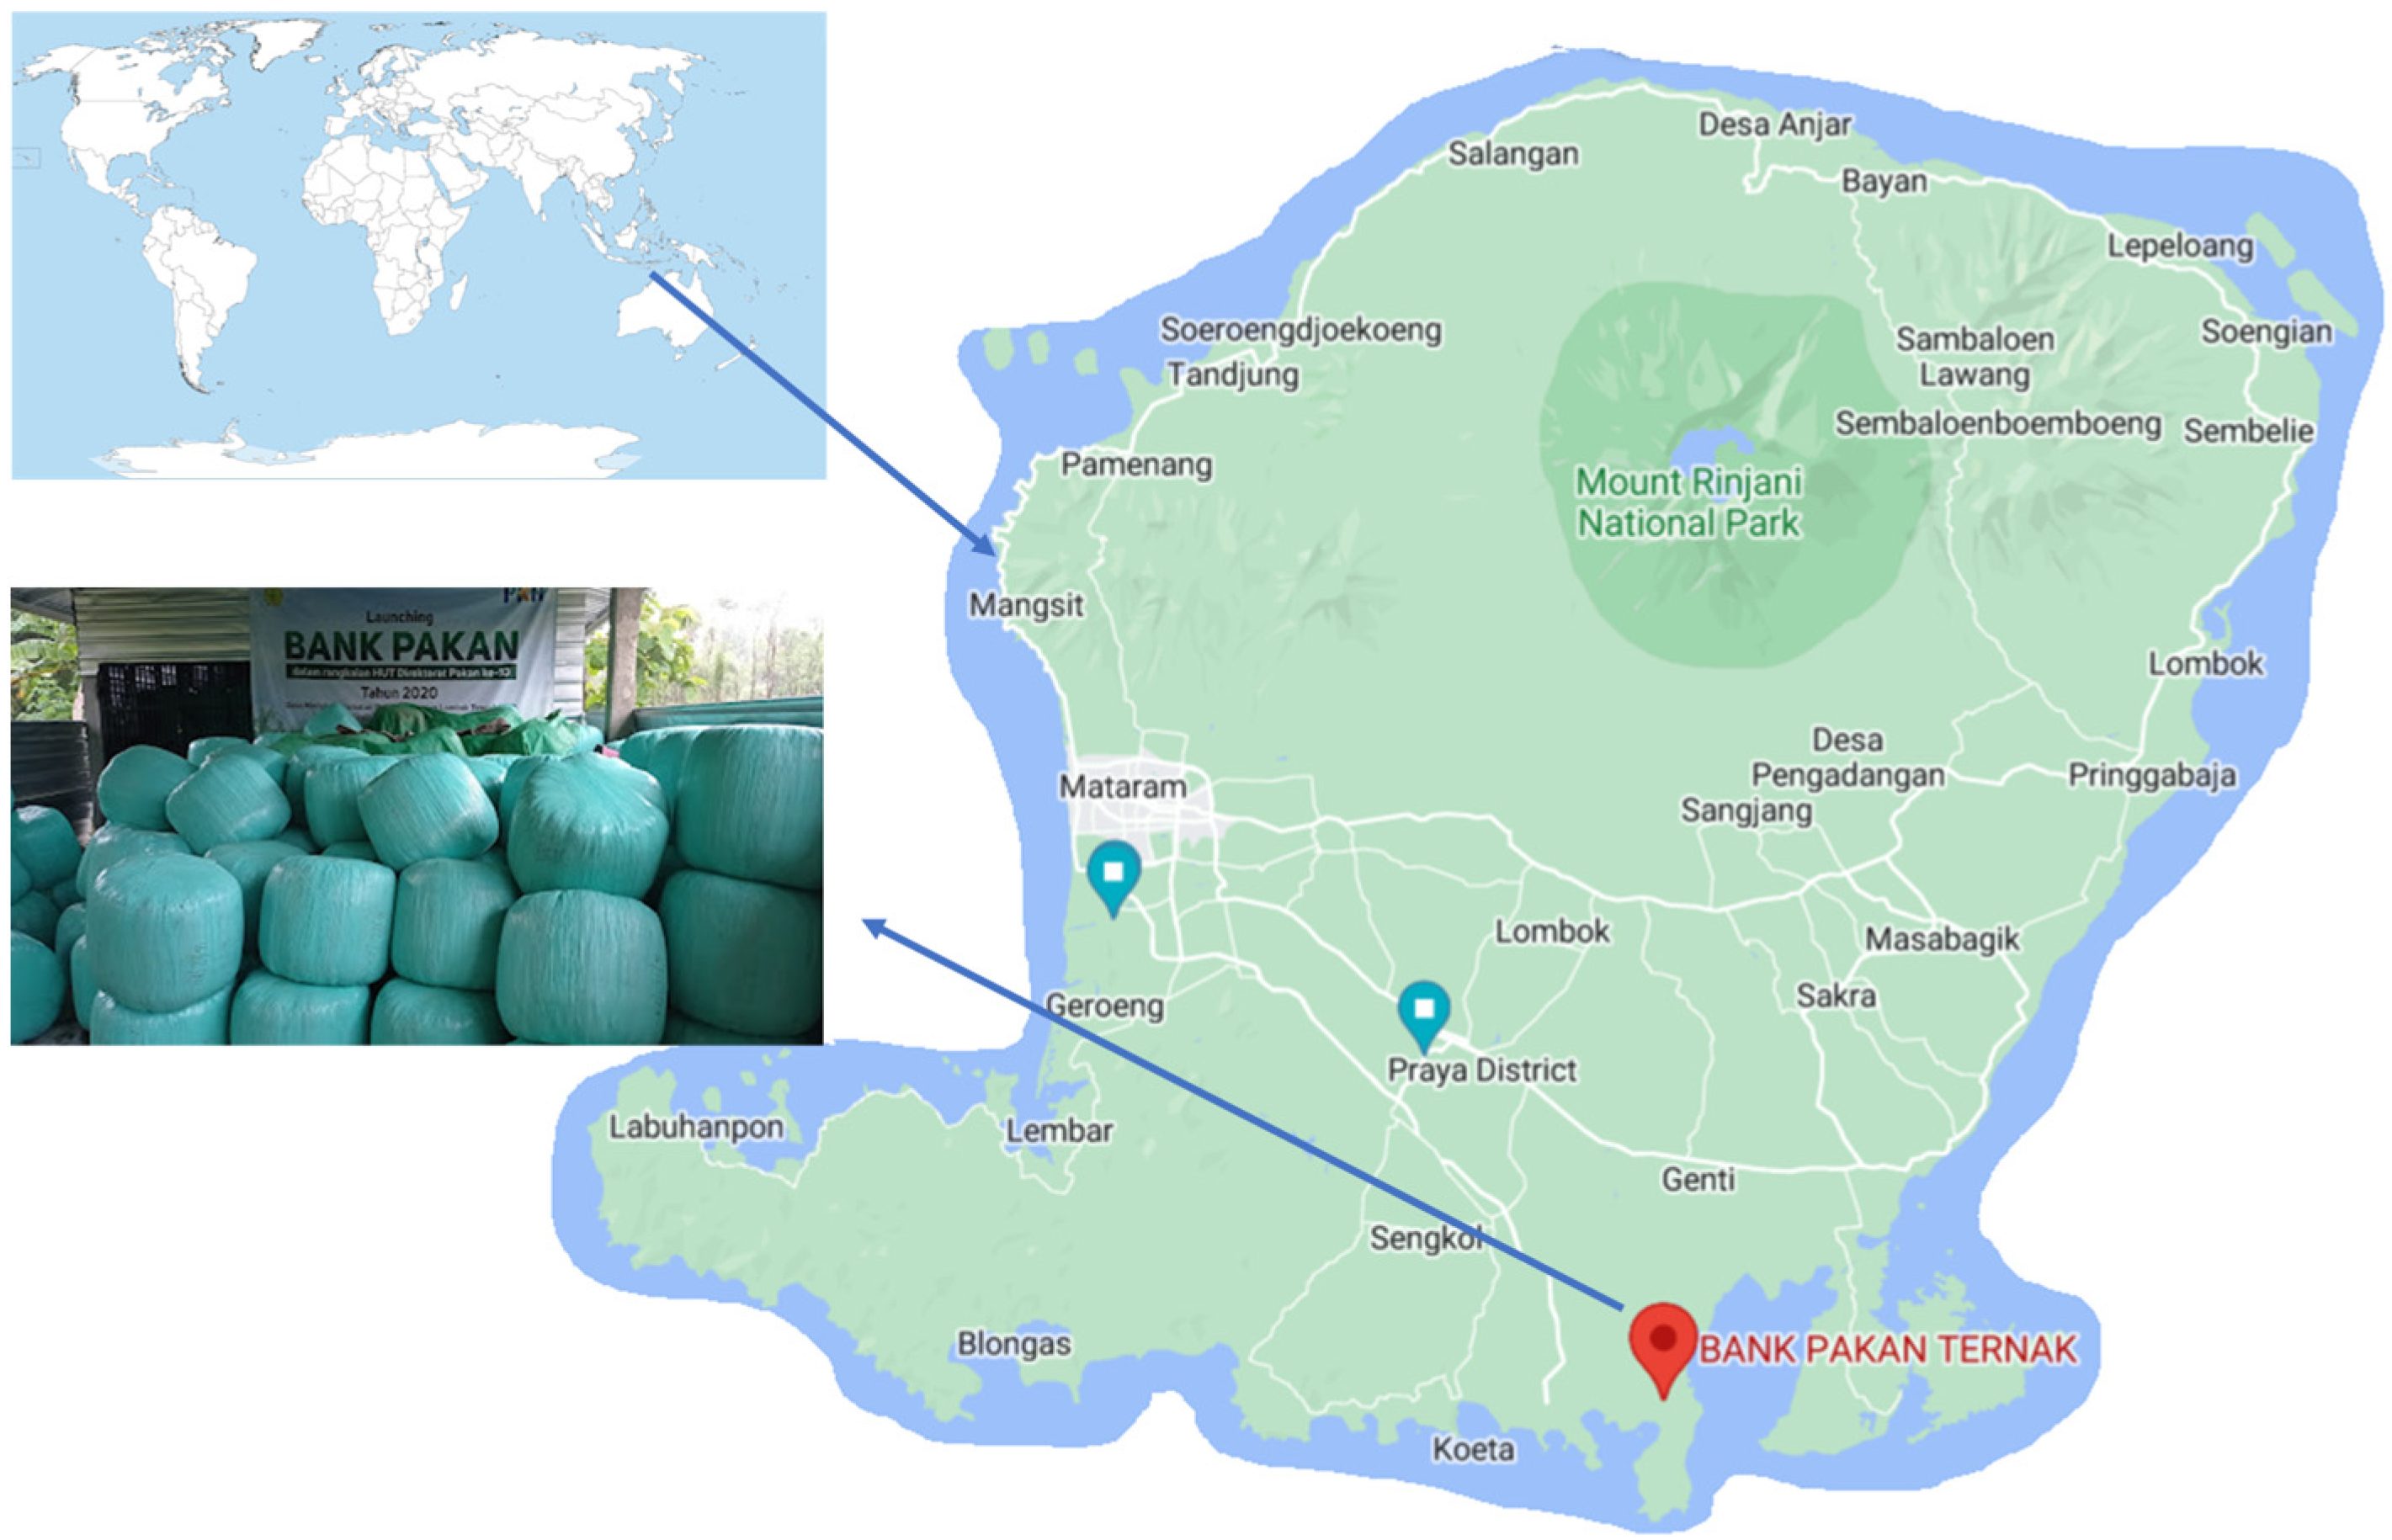
Figure 1. The location of the cattle feed bank (GPS location: −8.889084390990547, 116.38100725658296). The farmers groups were located nearby the cattle feed bank location.
Sustainability 14 07989 g001
Figure 2. Sustainability index of (A) the raw material; (B) the facilities and infrastructure; (C) the production system, price and product distribution system; (D) the human resource management; (E) the government support; and (F) the feed bank management.
Sustainability 14 07989 g002
Figure 3. Sustainability index for dimensions of (A) raw material; (B) facilities and infrastructure; (C) price, production and distribution systems; (D) human resource management; (E) policy and government support and (F) feed bank management.
Sustainability 14 07989 g003
Figure 4. The multi-dimensional kite diagram of the feed bank sustainability dimensions.
Sustainability 14 07989 g004
Table 1. The sensitivity of each studied attribute ranked based on the RMS value and expert evaluation.
DimensionCode and the AttributesRMSExpert Evaluation
Raw material (A)(A1) Planted/cultivated raw feed* 3.69* 4
(A2) Variability during the rainy season* 3.05* 6
(A3) Reduced volume during the dry season* 2.8* 5
(A4) Spoiled raw feed in the dry season* 2.643
(A5) Knowledge of feed concentrate* 2.552
(A6) Willingness to use feed concentrate2.29
(A7) Availability during the rainy season2.15
(A8) Self-support for concentrate feed use1.73
(A9) Difficulty in feeding in the rainy season0.88
(A10) Awareness of the benefits of concentrate feed0.06
Facilities and infrastructure (B)(B1) Machine operating costs* 1.37* 6
(B2) Rope availability for the next program* 0.511
(B3) Availability of chopper and baller machines* 0.49* 6
(B4) Cattle weighing scale* 0.47* 4
(B4) Availability of wrapping sacks for the next program* 0.41
(B5) Warehouse for equipment and machinery0.28
(B6) Warehouse utilization0.24
(B7) Warehouse for storing raw feed materials0.18
(B8) Warehouse for the silage storage0.12
(B9) Functional mechanical equipment0.06
(B10) Access road to the feed bank0.05
Price, production, and distribution systems (C)(C1) Production planning* 0.90* 4
(C2) Production cost* 0.89* 5
(C3) Product demand* 0.78* 5
(C4) Product customer* 0.68* 5
(C5) Raw material reserve* 0.66* 4
(C6) Cost of raw material* 0.572
(C7) Sales* 0.552
(C8) Production interval0.47
(C9) Working capital0.41
(C10) Deficit of raw feed in the dry season0.23
(C11) Purchase contract0.2
(C12) Feed formulation0.19
(C13) Concerns about lack of feed in the dry season0.14
Human resource management (D)(D1) Number of personal* 2.252
(D2) Skill in teamwork* 1.93* 5
(D3) Skill in administration and finance* 1.88* 5
(D4) Readiness to be the manager* 1.88* 5
(D5) Business knowledge* 1.733
(D6) Product trial* 1.51* 5
(D7) Knowledge of feed technicality1.45
(D8) Permanent mentor/assistant0.83
(D9) Knowledge of the tasks0.48
(D10) Knowledge of machinery0.16
Policy and government support (E)(E1) The role of the sub-district government* 1.520
(E2) Cooperation support for research institutes/universities* 1.47* 7
(E3) Coaching frequency by the district officers* 1.24
(E4) Support from the business sector* 1.203
(E5) Coaching frequency by the sub-district officers* 0.85
(E6) Coaching frequency by the village officers0.39* 4
(E8) Coaching frequency by the province officers0.37* 4
(E9) Financial support from the provincial government0.32
(E10) Financial support from the central government0.23
(E11) Roles of community leaders0.22
(E12) Financial and support from the district government0.03
(E13) Role of a village officer0.02
Feed bank management (F)(F1) Continues purchase of the product* 1.71* 7
(F2) Annual production plan* 1.133
(F3) Decentralize feed bank* 0.88* 4
(F4) Knowledge of tasks by managers* 0.69* 5
(F5) Production capacity* 0.652
(F6) Program on saving raw feed* 0.611
(F7) Supply of raw feed from all farmer groups0.42
(F8) Independent supply of raw feed0.28
(F9) Awareness on the benefit of feed bank0.17
(F10) Cooperation between farmer groups0.06
RMS denotes root mean square in ordination when the selected attribute was removed. * identified as the most sensitive attributes.
Table 2. Multi-dimensional index of a feed bank sustainability.
DimensionsWeightage (%)Weightage Index
Policy and government support14.066.82
Raw material15.639.43
Facilities and infrastructure14.066.83
Feed bank management17.198.23
Human resource management19.539.52
Price, production, and distribution systems19.538.72
Total10049.55
Publisher’s Note: MDPI stays neutral with regard to jurisdictional claims in published maps and institutional affiliations.

