Article

A Cluster Analysis on the Energy Use Indicators and Carbon Footprint of Irrigated Wheat Cropping Systems

by
Hamed Rafiee
1,*,
Milad Aminizadeh
2,
Elham Mehrparvar Hosseini
1,
Hanane Aghasafari
2 and
Ali Mohammadi
3
1
Department of Agricultural Economics, University of Tehran, Tehran 3158777871, Iran
2
Department of Agricultural Economics, Ferdowsi University of Mashhad, Mashhad 9177948974, Iran
3
Department of Engineering and Chemical Sciences, Karlstad University, 65188 Karlstad, Sweden
*
Author to whom correspondence should be addressed.
Sustainability 2022, 14(7), 4014; https://doi.org/10.3390/su14074014
Submission received: 3 February 2022 / Revised: 4 March 2022 / Accepted: 28 March 2022 / Published: 29 March 2022
(This article belongs to the Special Issue Sustainability of Agricultural and Food Systems)

Abstract

:
The objective of this study is to analyze the energy use efficiency and carbon footprint of irrigated wheat systems in different Iranian provinces. The authors resort to the k-means clustering technique to fulfil the said objective. The empirical results reveal that the average total input energy (59.5 GJ ha−1) is higher than the average energy output (45.82 GJ ha−1) from wheat production, resulting in an average energy efficiency of 0.77, thus rendering the production of irrigated wheat in Iran energy-inefficient on average. Among the thirty wheat-producing Iranian provinces considered in this analysis, only six—East Azerbaijan, Golestan, Ardabil, Kohgiluyeh and Boyer-Ahmad, Alborz, and West Azerbaijan—register an energy use efficiency greater than unity. The average total of greenhouse gas (GHG) emissions from irrigated wheat is 2243.54 kg CO2-eq ha−1 (with electricity and diesel fuel contributing 52.4% and 29.4%, respectively). The authors categorize the clusters into five groups ranging from sustainable to unsustainable. Five of the six provinces referred to earlier fall into the ‘sustainable’ category, with Bushehr being the sixth. The wheat production units in the ‘sustainable’ category can serve as a benchmark for the clusters in the other categories, which can move up the ladder of sustainability. The authors also recommend measures that policymakers can undertake to ensure the sustainable development of wheat production in Iran, fulfilling the social imperative of food self-sufficiency while truncating the environmental footprint and ensuring economic feasibility.

1. Introduction

1.1. Background

There exists an undeniable nexus between the agricultural (food or otherwise) and energy sectors, because while the former is an energy-user, it also doubles as a provider of bio-energy [1]. Over the years, owing to a multiplicity of causative factors—a limited supply of arable agricultural land, technological changes, population growth, and thereby a rise in the demand for agricultural outputs—the energy usage of the agricultural sector globally has tended to increase [2,3]. To ensure the sustainable development of the agricultural sector, it is thereby indispensable to reduce the reliance on fossil fuels (directly or indirectly), decrease the pollution of the environmental media (air, water, and soil), and achieve economic feasibility. Currently, agriculture is responsible for 10–12% of all anthropogenic GHG emissions and is attracting the attention of policymakers and planners worldwide [4,5].
Wheat is a very important cereal crop; it is a source of calories and proteins for millions of inhabitants of developing countries [6] and in the developed world too. Globally, the output of wheat increased from 585 to over 734 million tons over the 19-year period from 2000–2018 [7]. Iran is a key wheat producer in the MENA region (Middle East and North Africa), and there is a history of knowledge and technology transfer between Iran and its neighboring countries: Iraq, Afghanistan, Turkmenistan, Pakistan, and Turkey.
Wheat is a strategically vital cereal crop for Iran, as wheat bread is a staple food for most of the people in the country. Between 2000 and 2018, wheat production dramatically increased from 8.1 to 14.5 million tons in Iran [7]. This increase was facilitated by a state-guaranteed purchase price for the crop, in order to achieve food self-sufficiency for the country [8]. Wheat, therefore, is now cultivated in all the Iranian provinces, in both irrigated (38% of cultivated area and 72% of production) and dryland (62% of cultivated area and 28% of production) fields.
While an increase in wheat cultivation in the country is vital to ensure self-sufficiency as far as feeding the population is concerned, it comes at a price: a rise in energy usage and thereby adverse environmental impacts. Sizable government subsidies provided to farmers result in the indiscriminate use of energy. This calls for a benchmark model for efficient energy usage by wheat farmers in order to curtail GHG emissions.
Various methods have been used by researchers to analyze the sustainability of agricultural and food systems, such as (environmental) life cycle assessment (LCA) [9,10], data envelopment analysis (DEA) [11], and artificial neural network analysis (ANN) [12,13]. The multivariate cluster method is also a common approach to evaluating the sustainability of agricultural production systems in terms of energy efficiency and GHG emissions [14,15]. A cluster analysis of agricultural systems enables the analysts to categorize (and group) producers on the basis of their energy usage. By doing so, a benchmark cluster—comprising the most energy-efficient systems—can be identified. This cluster can then be the basis for policymakers keen on setting targets that the other clusters (the not-so-sustainable ones) can try to reach in stipulated periods of time. This is of paramount importance in light of the fact that, in most developing countries, the management practices adopted are not standardized, and knowledge-sharing and learning from best practices are not well-entrenched, with systems often operating in ‘silos’, unaware of and unconcerned about the performance of others around them.
The motivating factor behind this analysis is thereby the need for economic and environmental sustainability of wheat production systems that are different from each other and that fulfil a social imperative: ensuring food self-sufficiency for the citizens of the country. The threefold objectives are as follows:
  • Analysis of the level of energy efficiency;
  • Assessment of the carbon footprint;
  • Clustering wheat production systems to support benchmarking as a tool for policymakers in the agricultural sector of Iran.

1.2. Literature Review

Many researchers have studied the energy efficiency and the carbon footprints for the cultivation of different types of cereal crops [16,17] and fruits [18,19,20]. The focus of this study, and thereby this literature review section, is only on wheat cultivation. Ghasemi-Mobtaker et al. [21] performed an enviro-economic analysis from an energy perspective on the wheat production systems in the Hamedan province of Iran and concluded that the said systems were using energy efficiently, though the GHG emissions could be curtailed. The conservation tillage approach for wheat cultivation, as per Nasseri [22], ensures higher productivity, a net return on investment, and a favorable benefit-cost ratio; this approach also, according to independent case studies conducted by Moradi et al. [23] and Houshyar and Grundmann [24] in the Fars province of Iran, results in a higher energy efficiency and lower environmental impacts, vis-à-vis conventional cultivation methods. Gravel mulching (Wang et al. [25]) has been shown to contribute to the improvement of the energy efficiency of wheat cultivation in China. On irrigated wheat farms, water management is crucial, and it must not be forgotten that there is a nexus between water and energy use. In Yuan et al. [26], the authors studied a case in the Huang-Huai-Hai Plain of China and concluded that optimized management based on soil water content at depths of 0–40 cm leads to a conspicuous improvement in energy efficiency.
Quite intuitively, the water-energy nexus explains what Ansari et al. [27] and Mondani et al. [28] determined for wheat production in Pakistan and the Kermanshah county of Iran under different schedules based on climate and thereby the arable soil’s moisture content. They found that in semi-arid and arid regions, irrigation practices are decisive when it comes to optimizing energy usage and GHG emissions. While Nabavi-Pelesaraei, Rafiee, Hosseinzadeh-Bandbafha, and Shamshirband [12] demonstrated that 41% of wheat farms in the Ahvaz county of Iran are efficient, Taghavifar and Mardani [10] found, with the aid of the ANN optimization method, that wheat farms in West Azerbaijan (Iran) had a net positive energy output. On the contrary, Khoshnevisan, Rafiee, Omid, Yousefi, and Movahedi [2] arrived at the opposite conclusion for wheat production in the Isfahan province of Iran. While Unakıtan and Aydın [29] concluded that wheat production is more profitable (based on an econo-energetic approach) than sunflower production in Turkey, Ziaei et al. [30] arrived at the conclusion that barley production in the Sistan and Baluchestan provinces of Iran is more energy-efficient than that of wheat. Ghorbani et al. [31] investigated the efficiency analysis of dryland and irrigated wheat production systems in Iran. They found that the total energy requirements for dryland and irrigated wheat systems were 93.54 GJ ha−1 and 45.36 GJ ha−1, respectively. A summary of the literature review is shown in Table 1.
The geographical scope of previous studies (as discussed heretofore in the literature review) has been limited. Bojacá et al. [14] have clustered greenhouse tomato production units in Colombia based on energy efficiency and carbon footprint analyses, while Khanali et al. [15] have considered farmyard manure, output energy, and GHG emissions for saffron production. This study duly plugs the gaps by clustering wheat-production systems in Iranian provinces on the bases of energy efficiency (energy output/energy input) and GHG emissions.

2. Materials and Methods

2.1. Data Collection

The analysis focuses on evaluating the inputs to and the outputs from irrigated Iranian wheat production systems as well as the GHG emissions caused by the inputs. The data for the 30 wheat-cultivating provinces of Iran were obtained from the Ministry of Agriculture-Jahad of Iran [8]. This study has also availed of data from previous empirical studies on wheat production.

2.2. Energy Indices

The input energy in agricultural production can be classified into direct energy use and embodied (indirect) energy use. The direct energy uses include irrigation water, electricity, diesel fuel, and human labor, while indirect energy uses include the embodied or equivalent (upstream) energy in seeds, pesticides, chemical fertilizers, farmyard manure, and machinery [2]. One may also categorize inputs as renewable and non-renewable. Renewable energy covers seed, farmyard manure, human labor, and irrigation water, whereas non-renewable energy includes chemical fertilizers, pesticides, electricity, machinery, and diesel fuel [1]. The mass of the output—wheat—can also be expressed in equivalent energy units (Refer to Table 2).
To evaluate the energy consumption in wheat production, various energy indices such as energy use efficiency, net energy, energy productivity, non-renewable energy ratio, and specific energy for wheat production are used. The standard formulae for the calculation of these indices are presented in Table 3. The energy use efficiency (EUE) indicator, defined as the ratio of energy output (equivalent to the wheat produced) to the energy inputs needed for the production of wheat, is a useful tool to determine the level of the sustainability of wheat production. The net energy (NE) is the difference between the energy output and energy input, and a net positive energy output is desired. The non-renewable energy ratio (NER) is defined as the ratio of output energy to non-renewable input energy [1], and the higher this ratio the better. The amount of wheat produced divided by the total energy input is the energy productivity (EP), and quite obviously, one would seek a higher value for this ratio. Finally, specific energy (SE) is the energy input for producing 1 kg of wheat [22].

2.3. GHG Emissions

While inputs can be perceived in terms of embodied energy, they can also be perceived in terms of embodied GHG emissions. To calculate the GHG emissions from wheat production, the GHG-emission coefficients (CO2-equivalents, in other words) of the agricultural inputs are used (refer to Table 2). The management of wheat straw is excluded from the assessment due to a paucity of data.

2.4. Multivariate K-Means Clustering Method

The well-known multivariate k-means clustering algorithm is a suitable means for classifying provinces in terms of energy use efficiency and GHG emissions. It is used to segregate 30 wheat-producing provinces into k groups by minimizing the intra-cluster sum of the squared distance from each observation to its nearest cluster center. Thus, the sustainable energy use profile for each province is calculated according to the energy use efficiency and GHG emissions. Thus, a 30 (provinces) × 2 (EUE and GHG indices) matrix is configured to represent the multivariate dataset. Regarding the high variances among the variables, normalization of the dataset is necessary before applying the k-means clustering technique [14]. The Min—Max algorithm for normalization to the 0 to 1 scale is used to normalize the energy use efficiency and GHG emissions variables [41]:
E U E n = E U E min ( E U E ) max ( E U E ) min ( E U E )
where, EUE and EUEn represent the original and normalized values of energy use efficiency, respectively. The next step in the k-means procedure is the definition of the number of clusters, prior to the grouping of the provinces. In this study, the Calinski–Harabasz pseudo-F statistics value is applied to determine the optimal number of clusters [42]:
p s e u d o   F = S S E B / C 1 S S E W / N C
where SSEB and SSEW denote the inter- and intra-cluster sum of squares errors, respectively. C represents the number of clusters, and N denotes the number of observations (provinces). A high pseudo-F value implies that clusters are well-formed.
The Excel 2016 software package is utilized to calculate the input-output energy use and GHG emissions. Additionally, the STATA statistical software package is utilized to cluster the wheat-producing provinces.

3. Results and Discussion

3.1. Energy Indices for Wheat Production

The energy indices for irrigated wheat production are presented in Table 4. The analysis of these indices at the national level shows that the average energy equivalent to the inputs is about 59.54 GJ ha−1, which is higher than the energy output (equivalent to the wheat produced) (45.82 GJ ha−1). Thus, the EUE and NE are estimated to be 0.77 and −13.71 GJ ha−1, respectively. This means that the production of irrigated wheat in Iran is not an energy-efficient process. It is more energy-intensive than wheat cultivation in Bangladesh and China, for instance [38,43]. The NER is 0.95 for the production of irrigated wheat, indicating that the non-renewable energy used in wheat production is greater than the energy output produced. In other words, the sum of diesel fuel and electricity, along with the energy embodied in the chemical fertilizers, pesticides, and machinery, is greater than the energy equivalence of the wheat produced. The EP index is estimated to be 0.06 kg MJ−1. Specific energy, or SE, is the inverse of energy productivity and is thereby about 16.89 MJ kg−1, meaning that 1 kg of wheat produced in Iran uses a lot of energy: more than thrice what Unakıtan and Aydın [29] calculated for Turkish wheat production.
Analysis of the indices in wheat-producing provinces indicates that the input energy (direct + indirect) ranges from 31.985 GJ ha−1 in Bushehr to 101.28 GJ ha−1 in Yazd. Isfahan, Kerman, and Tehran follow Yazd with values of 85.29 (in line with what has been reported in [2]), 84.95, and 83.32 GJ ha−1, respectively. The energy output produced from wheat production in different provinces varies from 27.25 (in Sistan and Baluchestan, in line with what has been reported in [30]) to 71 GJ ha−1 (in the province of Alborz). Alborz is followed by Tehran, Kermanshah, and Mazandaran with values of 62.87, 54.86, and 54.74 GJ ha−1, respectively. The predominant reason for the variation in the output is the climate. The climatic conditions in some provinces of Iran—in the northern parts, for instance—are more conducive to wheat production. Sistan and Baluchestan in the south, for instance, have higher temperatures and greater soil salinity, and they also experience strong winds and drought.
The EUE value ranges between 0.39 (in Yazd) and 1.16 (in East Azerbaijan), with the value exceeding unity only in 6 of the 30 provinces, all of which lie in the northern and northwestern parts of the country. The five provinces, in addition to East Azerbaijan, are Golestan, Ardabil, Kohgiluyeh and Boyer-Ahmad, Alborz, and West Azerbaijan. The variation in NE among the provinces is considerable, ranging from −62.04 GJ ha−1 in Yazd to 6.55 GJ ha−1 in East Azerbaijan. In addition to East Azerbaijan, the Iranian provinces of Golestan, Ardabil, Kohgiluyeh and Boyer-Ahmad, Alborz, and West Azerbaijan also have a positive energy balance.
The NER ratio varies from 0.48 in Yazd to 1.52 in East Azerbaijan. In 50% of the provinces of Iran, mostly located in the north, the index value is greater than one. This means that the energy output of the wheat production systems is greater than the amount of non-renewable energy used. This finding is in line with the results of Nasseri [22] in the northwest of Iran. The energy productivity indicates that the quantity of wheat produced per unit of energy input is low in all provinces of Iran—with the highest being 0.09 kg/MJ (in Ardabil, East Azerbaijan, and Golestan) and the lowest in Yazd at 0.03 kg MJ−1. In other words, the quantity of wheat produced in the northern parts of Iran is thrice as much as what is produced in provinces such as Yazd, which combat aridity [43]. It follows that the specific energy (SE), which is the inverse of energy productivity (EP), is the highest in Yazd and the lowest in Ardabil, East Azerbaijan, and Golestan.
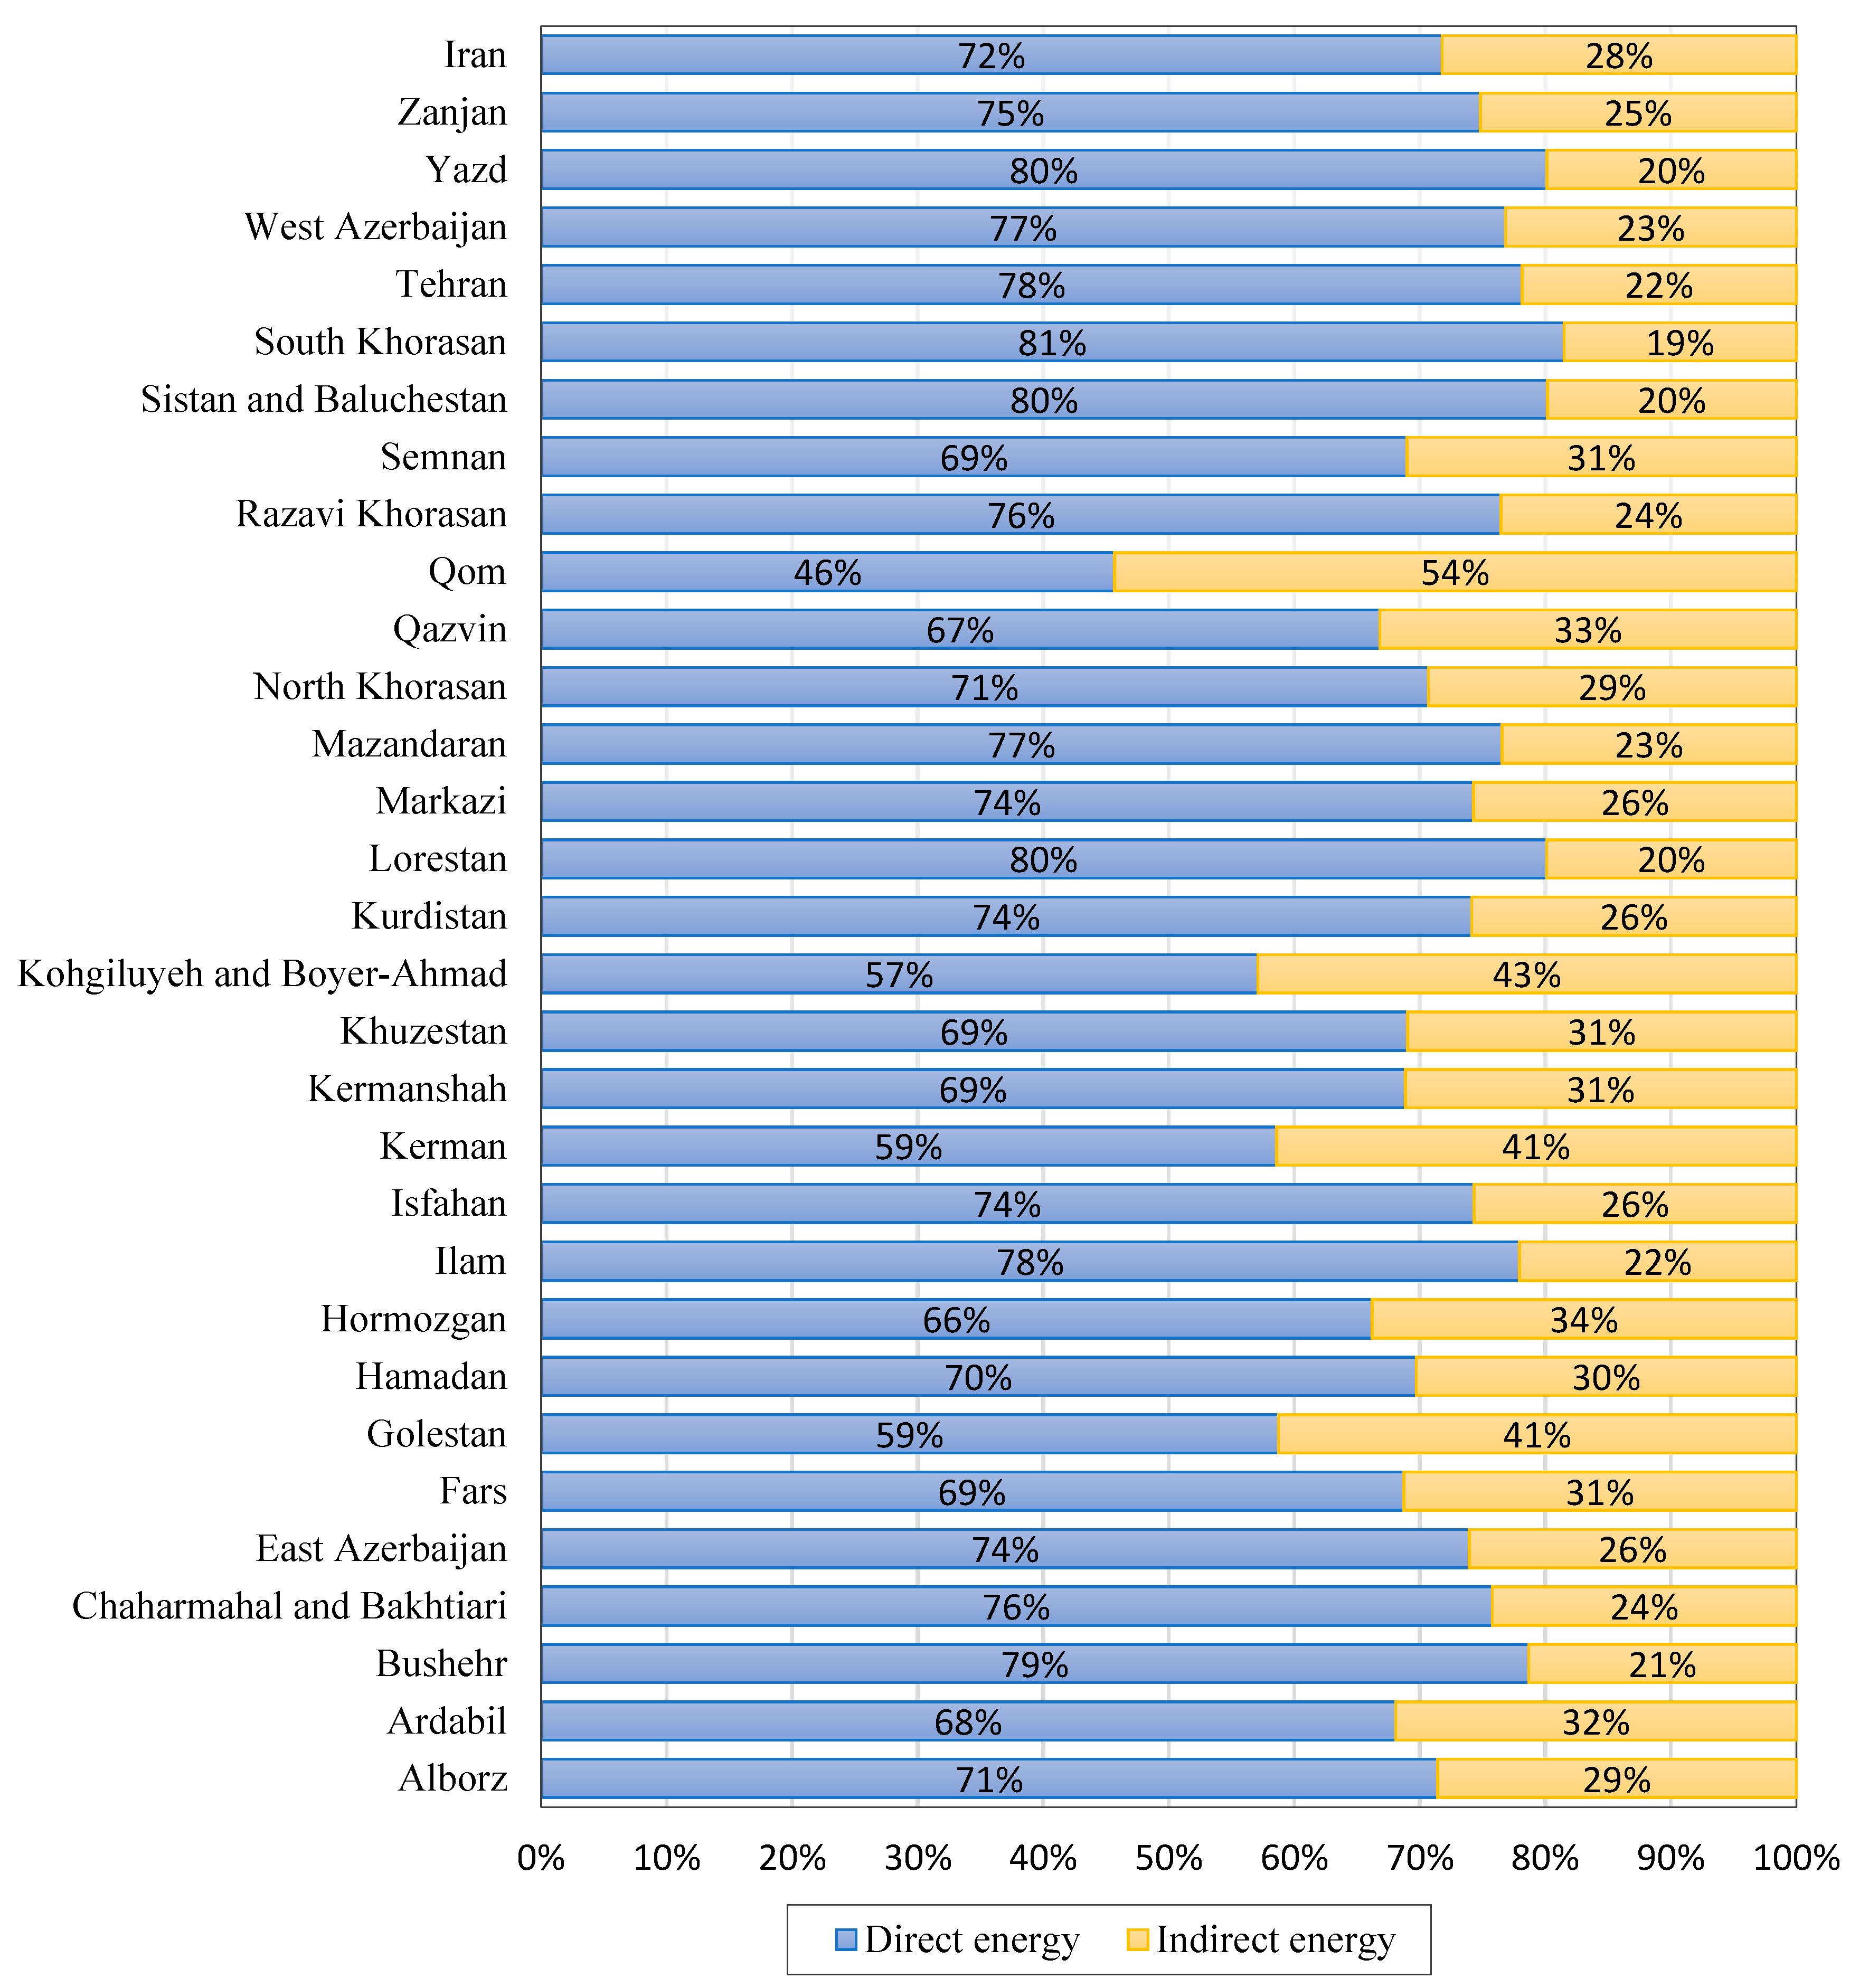
The distribution of direct and indirect energy use in irrigated wheat production is shown in Figure 1. At the national level, the average direct energy (irrigation water, electricity, diesel fuel, and human labor) is approximately 42.73 GJ ha−1 (72%), while indirect energy (seed, pesticides, chemical fertilizers, farmyard manure, and machinery) is 16.81 GJ ha−1 (the remaining 28%). Direct energy and indirect energy for Iran are higher and lower, respectively, than the values reported for China in Yuan et al. [26] and Wang et al. [44]. Among the provinces, the direct energy contribution ranges from 46% to 81%. The highest direct energy shares are noticed in South Khorasan (81%), Yazd (80%), Sistan and Baluchestan (80%), and Lorestan (80%). This indicates that wheat production in these provinces is based largely on the ‘direct energy’ inputs: irrigation water, electricity, human labor, and diesel fuel.
On the other hand, the indirect energy contribution varies from 19% (South Khorasan) to 54% (Qom). Qom is followed by Kohgiluyeh and Boyer-Ahmad (43%), Kerman (41%), and Golestan (41%). It can be concluded on the basis of these findings that wheat production in most Iranian provinces is dependent on the ‘direct energy’ inputs (in agreement with [2,29,36]).
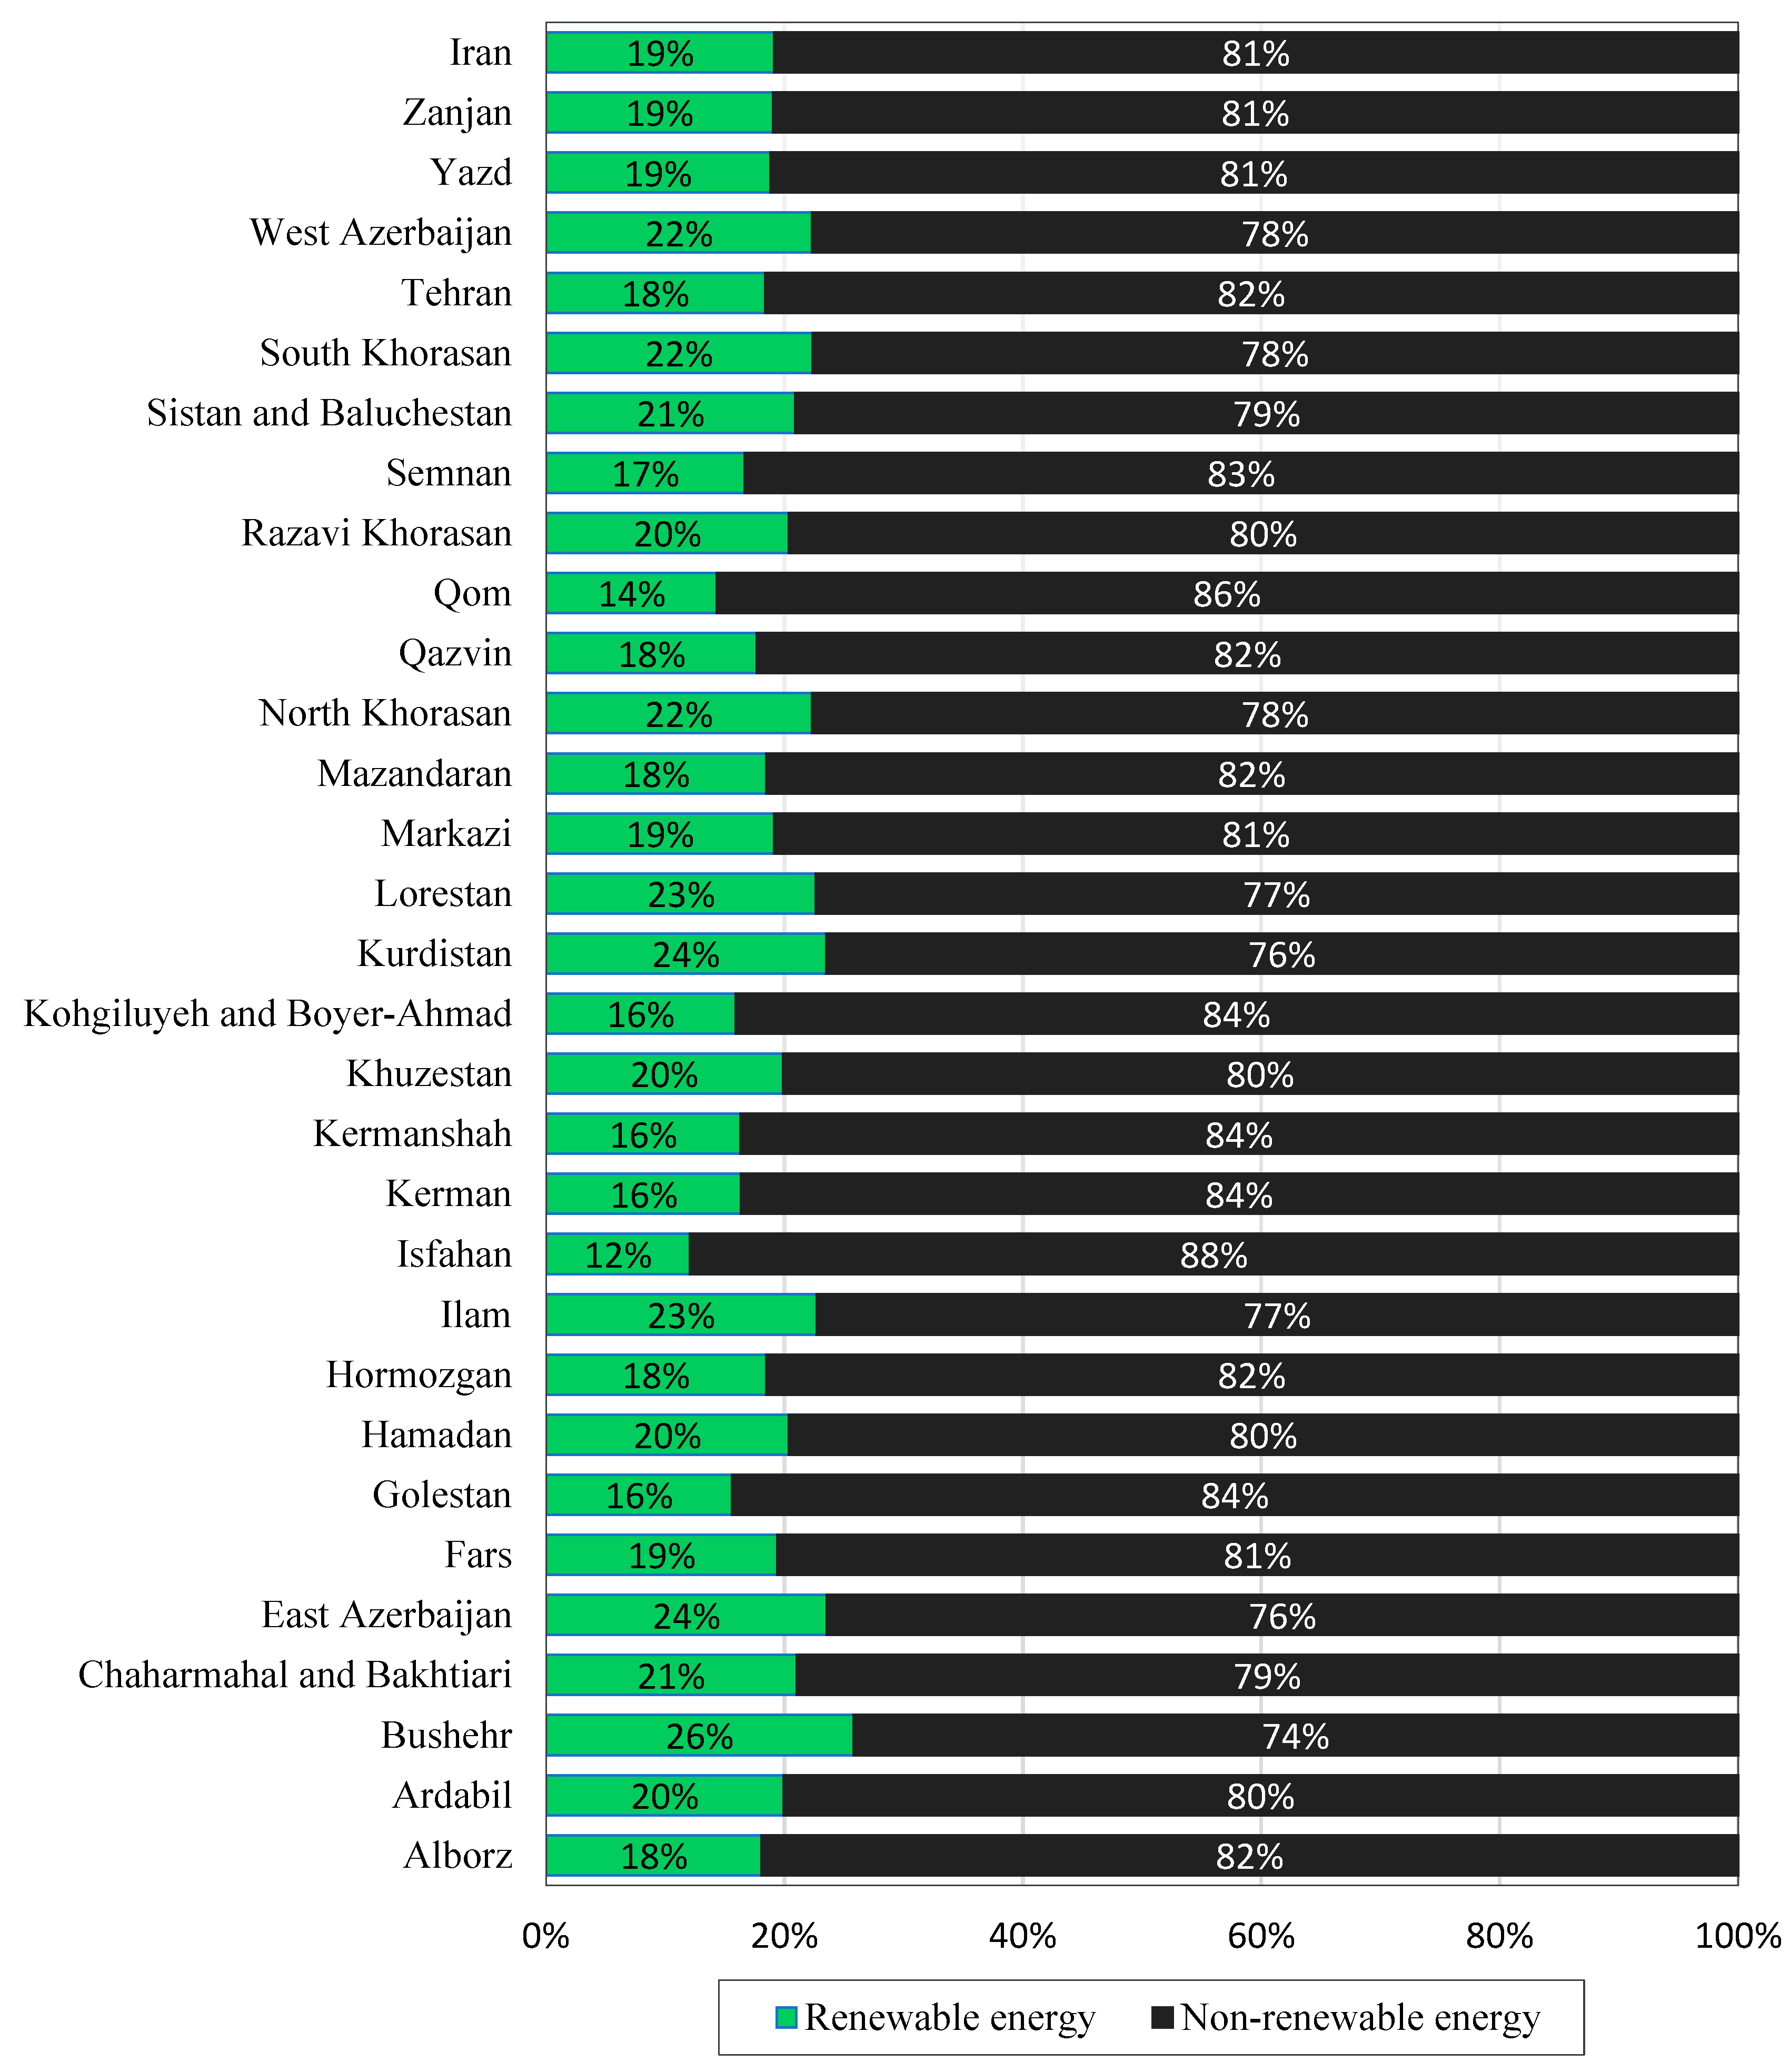
The shares of renewable and non-renewable energy are displayed in Figure 2. At the national level, the average renewable and non-renewable energy usages are estimated as 11.39 GJ ha−1 (19% of total energy) and 48.14 GJ ha−1 (81%), respectively. This suggests that wheat production heavily relies on non-renewable energy in Iran, which is similar to the report by Yuan et al. [26] and Sun et al. [43] in China. In other words, chemical fertilizers, pesticides, electricity, machinery, and diesel fuel are used too much for wheat production. Provincial analysis reveals that the contribution of renewable energy to the total energy input is in the range of 12% to 26%, with Bushehr (26%), Kurdistan (24%), and East Azerbaijan (24%) emerging as the top three in this regard. On the other hand, non-renewable energy accounts for more than 70% of the total energy input, on average seven times more than the renewable energy input (in agreement with Houshyar and Grundmann [24] and Khoshnevisan et al. [2]). Isfahan (88%), Qom (86%), Kohgiluyeh and Boyer-Ahmad (84%), Golestan (84%), Kermanshah (84%), and Kerman (84%) topped the NER list. The high use of non-renewable energy not only reduces the access of future generations to these resources [45], but also has adverse environmental effects [46].
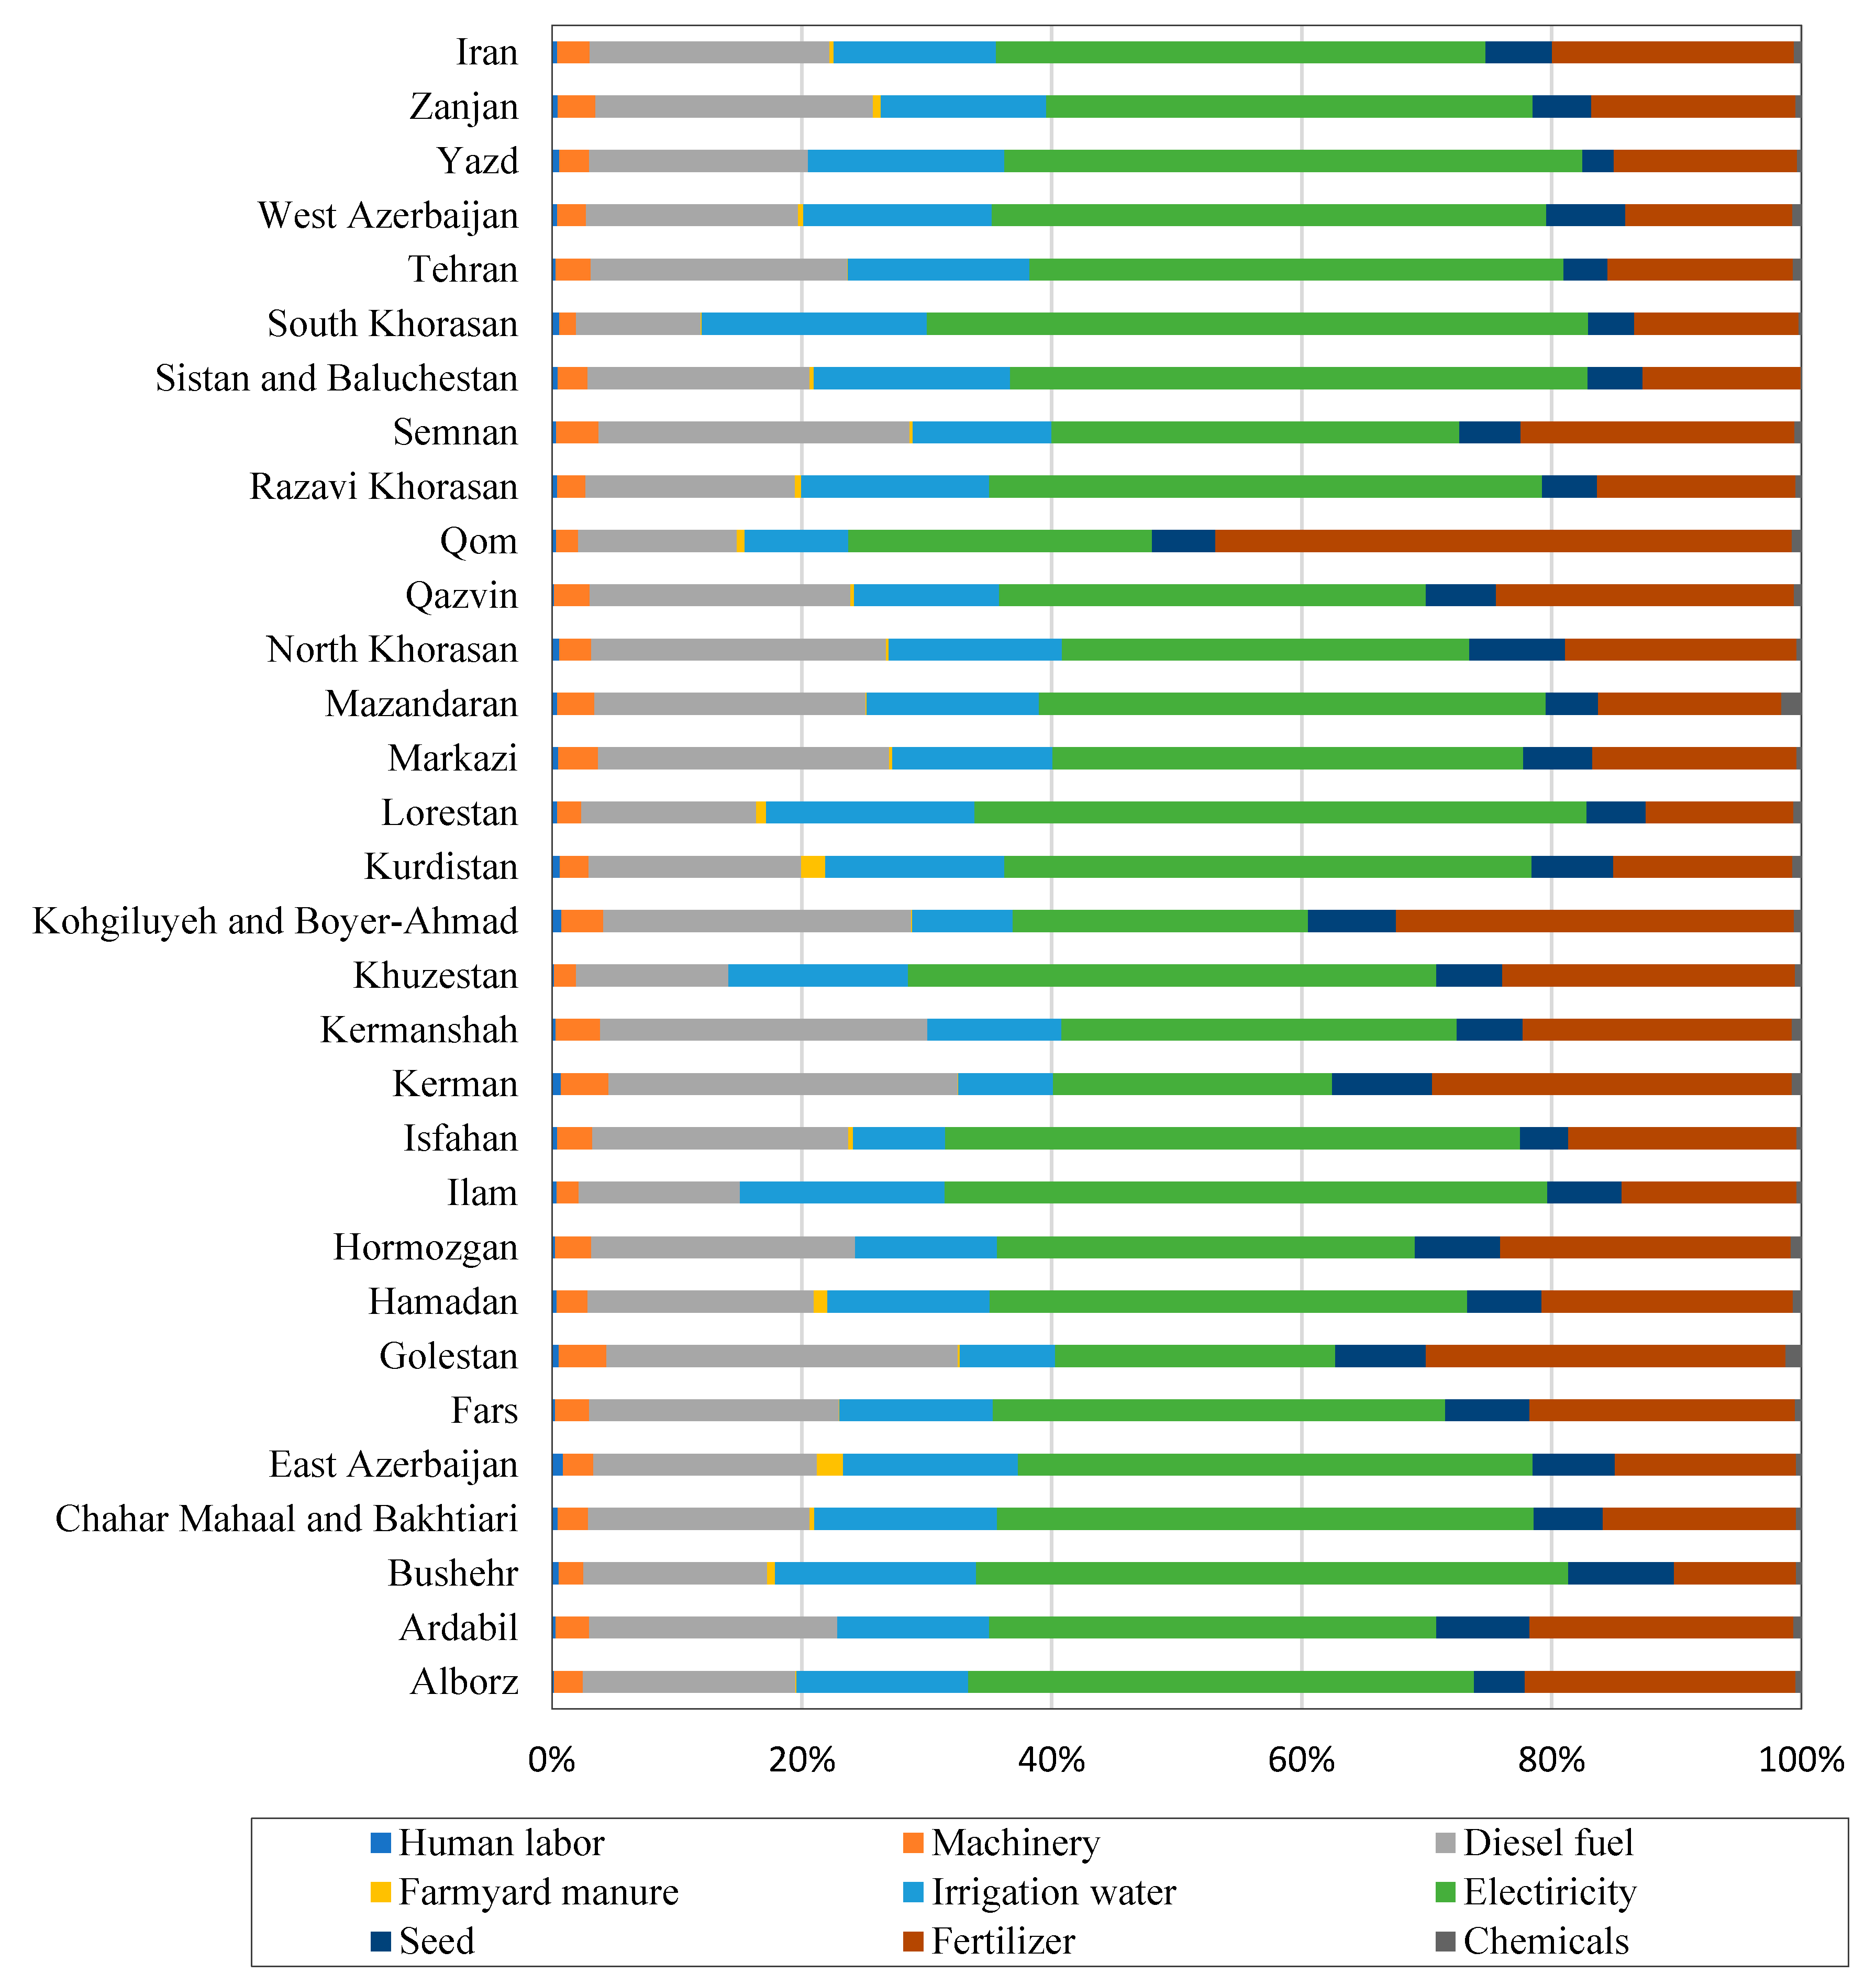
Various inputs including human labor, machinery, diesel fuels, farmyard manure, irrigation water, electricity, seeds, fertilizer, and chemicals are used in wheat production. Figure 3 reveals the share of energy from each of these inputs to the total energy input. Electricity emerges as the main energy input, accounting for between 22% and 53% of the total energy input for all provinces except Qom. South Khorasan, Lorestan, and Ilam provinces are the main users of electricity for wheat production with 53%, 49%, and 48% of the total energy input, respectively. This suggests that electricity is the main energy input in wheat production; this may be due to the use of water pumps for irrigated wheat production, which requires more electricity [29]. Fertilizer energy ranked second among the energy inputs, ranging from 10% to 46% of the total energy input, with Qom leading this list. One may infer from this finding that irrigated wheat production is also fertilizer-intensive in the country. Diesel fuel energy constitutes 10%-28% of the total input energy, with an average of 19% among Iran’s provinces (as shown in Figure 3). The highest diesel fuel energy contributions are in Golestan (28%), Kerman (28%), and Kermanshah (26%). Several studies such as Unakıtan and Aydın [29], Yuan et al. [26], Soltani et al. [47], as well as Safa and Samarasinghe [48] have confirmed the importance of diesel fuel energy in wheat production. Irrigation water is an essential input for irrigated wheat. On average, the share of the equivalent energy in irrigation water is about 13%, with South Khorasan (18%), Lorestan (17%), Ilam (16%), and Bushehr (16%) being the top quartet in the list, and Golestan (7%), Kerman (7%), and Isfahan (7%) being the bottom three. The value of 13%, incidentally, is lower than that reported in the study done by Kardoni, Ahmadi, and Bakhshi [36].
Seeds, machinery, chemicals, farmyard manure, and human labor are the other inputs used in wheat production. Seeds are the inputs for wheat cultivation; machinery are used in the processes of sowing, ploughing, and harvesting: these include combines, tractors, moldboard plows, disk plows, levelers, centrifugal broad casters, grain drills, and sprayers. These inputs—on an energy-equivalence basis—contribute less than 10% of the total energy input.

3.2. Carbon Footprint of Wheat Production

Table 5 summarizes the GHG emission values for the production of irrigated wheat in the provinces of Iran. The carbon footprint amounts to 24,304.24 kg CO2-eq. ha−1, where electricity (55.36%), fossil fuels (29.35%), and nitrogen fertilizer (11.86%) are the major contributors. In contrast, according to Wang et al. [44] and Sun et al. [43], fertilizers account for the largest share of greenhouse gas emissions from wheat production in China.
The calculated GHG emissions in wheat-producing provinces vary between 1162.8 and 3953 kg CO2-eq. ha−1. Among the provinces, Yazd (3953), Isfahan (3564), and Tehran (3287) have the highest emissions and thereby the highest shares of electricity and diesel fuel in the input mix. The GHG values reported in other publications are 2711.6 kg CO2-eq. ha−1 for Isfahan (Khoshnevisan et al. [2]), and 2281.5 kg CO2-eq. ha−1 (Khoshnevisan et al. [2]) and 4184 kg CO2-eq. ha−1 (Mondani et al. [28]) for Kermanshah [2]. The results of these two studies and the present study show that a substantial share of the GHG emissions is caused by the use of electricity and diesel fuel. Improvement is possible if standard electric pumps for irrigation are recommended to farmers, and diesel fuel is replaced gradually by renewable bio-fuel. From Table 5, it is clear that the GHG index has the lowest values in Bushehr, Kohgiluyeh and Boyer-Ahmad, and Golestan provinces with 1162.8, 1304.7, and 1349.57 kg CO2-eq. ha−1, respectively. Diesel fuel makes up a larger share of the carbon footprint than electricity only in the provinces of Kerman, Golestan, and Kohgiluyeh and Boyer-Ahmad. The shares of electricity and diesel fuel in the GHG emissions are the second smallest for Golestan, with 29.9% and 42.5%, respectively. Mohammadi et al. [37] calculated the carbon footprint for wheat cultivation as 1171.1 kg-CO2-eq per hectare, with diesel fuel and electricity accounting for more than 62%. Golestan being one of the major wheat production centers in the country, the carbon footprint for the province can serve as a benchmark that other provinces can target.
Machinery accounts for less than 8% of the GHG emissions in all provinces of Iran, with 7.19% (Kerman) being the highest. In fact, in a study by Mondani et al. [28], the share of machinery was reported to be as low as 4.6%. The relatively smaller contribution can be explained by the fact that Iranian agriculture is not sufficiently mechanized vis-à-vis many other parts of the world.
Several researchers have found that nitrogen fertilizers account for the largest share in GHG emissions among chemical fertilizers [2,29,37]. In this study, they account for an average of 11.86% of the total carbon footprint, with the share going up to 31.73% for Qom province. The efficient consumption of chemical fertilizers (especially nitrogen) plays an important role in reducing water and soil pollution. The use of farmyard manure helps minimize the requirement for synthetic fertilizers and thereby GHG emissions. Subsidies are provided by the government to farmers for the purchase of chemical fertilizers.
Herbicides, with 0.27% of the carbon footprint, dominate as the family of pesticides with the highest contribution, while fungicides bring up the rear with 0.02%. Biological control is an appropriate solution for reducing pesticide usage.

3.3. Evaluation of Energy Indices and GHG Emissions across Provincial Segments

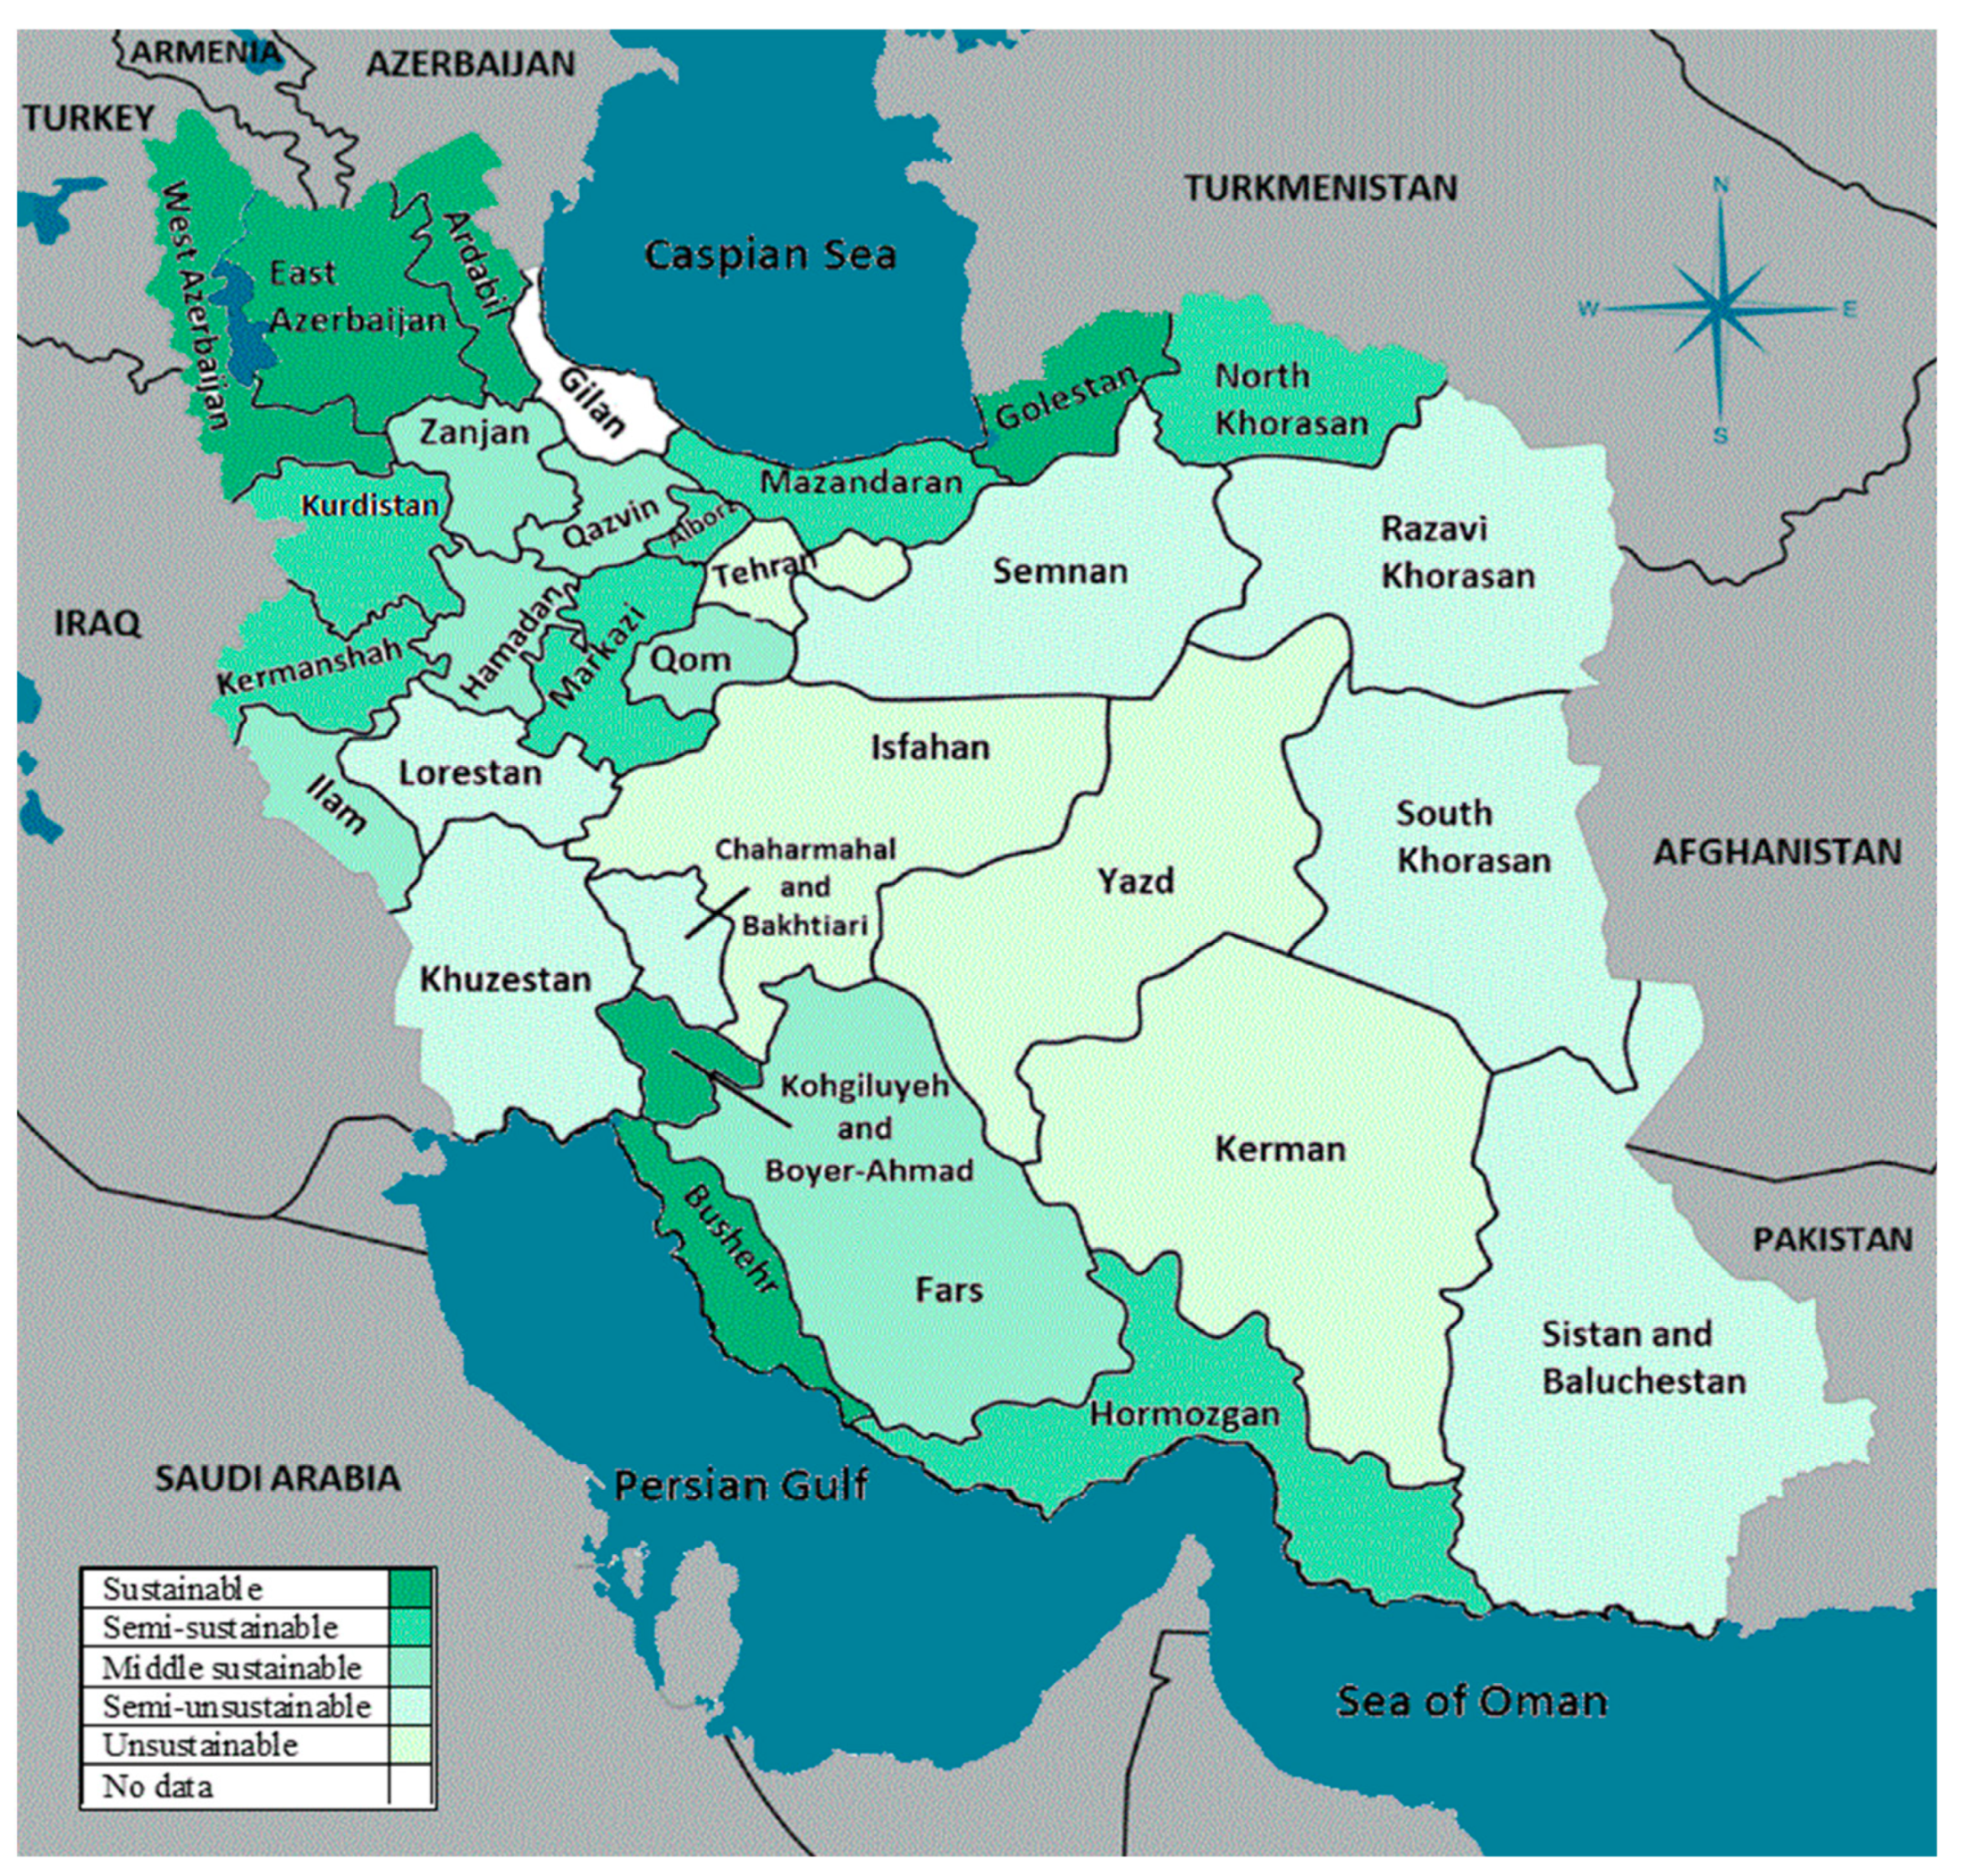
The clustering results of the wheat-producing provinces based on the energy use efficiency and GHG emissions indices are shown in Table 6 and Figure 4. According to the Calinskie-Harabasz criterion index, the most appropriate number of clusters is five—called sustainable, semi-sustainable, middle sustainable, semi-unsustainable, and unsustainable.
The provinces of Ardabil, Bushehr, East Azerbaijan, Golestan, Kohgiluyeh and Boyer Ahmad, and West Azerbaijan belong to the sustainable cluster with the highest average EUE (1.05) and the lowest GHG emissions (1421.77 kg CO2-eq. ha−1). The NE, NER, EP, and SE values are 2.32 GJ ha−1, 1.33, 0.08 kg MJ−1, and 12.46 MJ kg−1, respectively. This cluster accounts for 19.38% of the total national wheat production and 20.86% of the irrigated area from which wheat is harvested. The high energy efficiency in this cluster can be attributed to the climatic conditions of the provinces included in the cluster. For example, Golestan province, which lies in the Caspian coastal zone, is endowed with wet and humid conditions and blessed with fertile soil.
The provinces of Alborz, Hormozgan, Kermanshah, Kurdistan, Markazi, Mazandaran, and North Khorasan were classified in the semi-sustainable cluster with a value of 0.95 for EUE and 2123.37 kg CO2-eq. ha−1 for GHG emissions. They account for 13.69% of the area harvested. The NE, NER, EP, and SE indices for this cluster are −2.77 GJ ha−1, 1.18, 0.07 kg MJ−1, and 13.79 MJ kg−1, respectively. There is a great deal of ecological diversification in the semi-sustainable cluster, as the provinces are not in close proximity to each other. However, the lowest standard deviation, which indicates the highest homogeneity within the cluster, is observed in this cluster for most indicators; this indicates a similarity of input and production management in these provinces. This reduces the risk of energy management policies not being effective enough, though the diversity in the wheat production units in the cluster does add to some uncertainty (Figure 4).
The provinces of Fars, Hamadan, Ilam, Qazvin, Qom, and Zanjan are in the middle sustainable cluster with a production share of 24.13% and a 3690.58 kg ha−1 average yield. The EUE and GHG emissions are 0.79 and 2228.62 kg CO2-eq. ha−1, respectively. In the middle sustainable cluster, the values of NE, NER, EP, and SE are −12.72 GJ ha−1, 0.97, 0.06 kg MJ−1, and 16.55 MJ kg−1, respectively. The input and output energy values in this cluster have the lowest standard deviation.
Further, Chaharmahal and Bakhtiari, Khuzestan, Lorestan, Razavi Khorasan, Semnan, Sistan and Baluchestan, and South Khorasan belong to the semi-unsustainable cluster with an average and standard deviation of EUE equal to 0.62 and 0.09, respectively; the average and standard deviation of GHG emissions equal 2401.11 and 158.78 kg CO2-eq. ha−1, respectively. NE, NER, EP, and SE values are −24.39 GJ ha−1, 0.78, 0.05 kg MJ−1, and 21.56 MJ kg−1, respectively. This cluster has the largest share of wheat production in the country (31.72%) as well as the largest percentage of the harvested area (34.03%). Due to the regional and climatic conditions, the input use patterns in the sustainable and semi-sustainable clusters are a good benchmark for the provinces in the semi-unsustainable cluster to adopt and strive to attain.
Only four provinces, including Isfahan, Kerman, Tehran, and Yazd find themselves in the unsustainable cluster with the lowest average EUE (0.56) and the highest GHG emissions (3499.13 kg of CO2 ha−1). The provinces in the unsustainable cluster represent less than 10% of the harvested area and the production of wheat from irrigated farms. NE, NRE, EP, and SE for this last-place cluster are −39.71 GJ ha−1, 0.67, 0.04 kg MJ−1, and 24.53 MJ kg−1, respectively. A point to be emphasized, for this cluster, is the greater standard deviation vis-à-vis the other clusters for all the indicators measured. This is a challenge for policymakers, as the uniform effectiveness of energy management and GHG-footprint truncation policies ‘across the provinces’ is questionable. Therefore, despite the homogeneity of the members of all clusters according to the Calinskie-Harabasz criterion, the authors would like to suggest that policies need to be tailormade for different provinces as far as the unsustainable cluster is concerned.
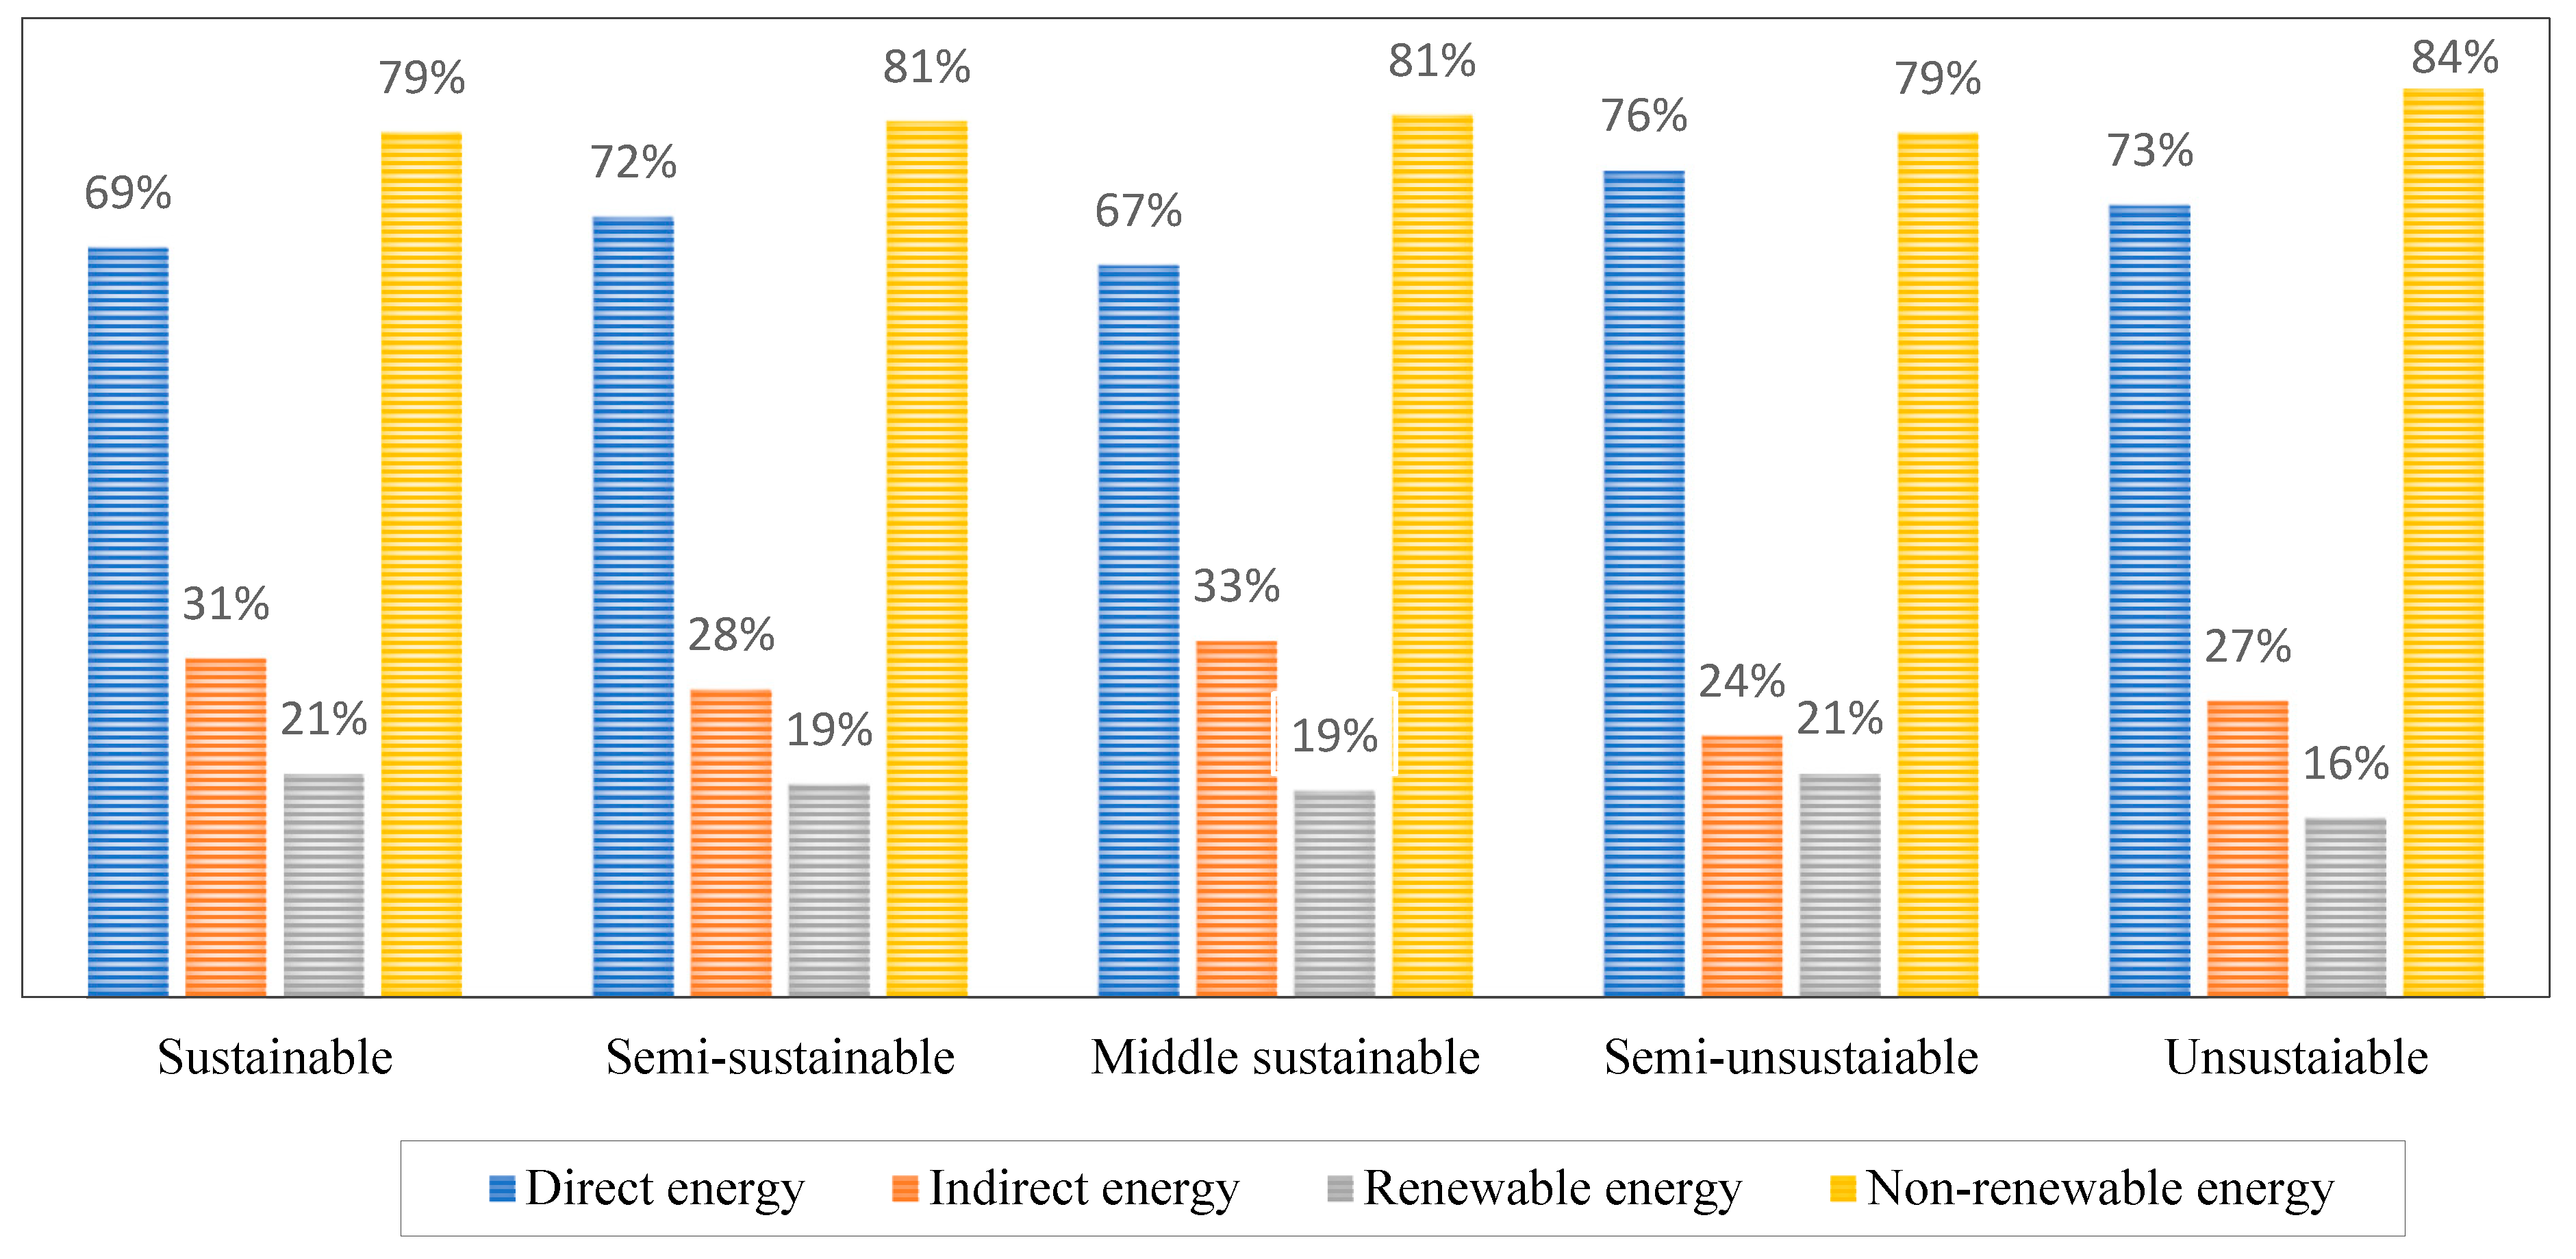
Figure 5 displays the shares of direct and indirect energy, and also of renewable and non-renewable energy, in all the five clusters. The results show that the share of direct energy is greater than that of indirect energy in all clusters, ranging from 67% (middle sustainable cluster) to 76% (semi-unsustainable cluster). This implies that irrigation water, electricity, diesel fuel, and human labor account for more of the energy-equivalent inputs in all the clusters and thereby in the country as a whole.
The share of non-renewable energy is higher than that of renewable energy in all the clusters, ranging from 79% (sustainable cluster) to 84% (unsustainable cluster). The unsustainable cluster—the provinces of Isfahan, Kerman, Tehran, Yazd—used more of these energy-equivalent (or energy) inputs. This finding was also reported by other studies in Turkey [49] and Serbia [50], where non-renewable energy represented a greater proportion compared to renewable energy for wheat production.
Using organic fertilizers or soil amendments such as biochar in cropping systems has been advocated as a potential approach to the reduction of the demand for synthetic fertilizers [51]. Soil application of biochar can reduce losses of nutrients through leaching and/or volatilization. This is particularly important for nitrogen-based fertilizers, the production of which is an energy- and GHG-intensive process. Biochar addition in agricultural systems can deliver a range of other co-benefits, such as the mitigation of GHG emissions from soils, the enhancement of the carbon stocks in the soil [52,53], as well as an improvement in the soil function and crop yield that may provide farmers with greater financial benefits [54,55]. However, further study is recommended to determine the effect of soil amendments on wheat productivity in the region to see if they have the potential to replace synthetic chemical fertilizers.

4. Conclusions

The three main objectives of this study were: (i) An analysis of the energy use efficiency (and other energy indices) in provinces with irrigated wheat production; (ii) An evaluation of the GHG emissions from wheat production; and (iii) The clustering of provinces based on EUE and GHG emissions to set a benchmark for the poorer performers in the country.
Some of the key findings can be summarized as follows:
The average energy use efficiency and net energy are 0.77 and −13.71 GJ ha−1, respectively, suggesting that irrigated wheat production in Iran is an energy-inefficient process. Direct energy inputs constitute 72% of the total energy inputs, and renewable energy accounts for 19% of the total energy inputs. GHG emissions are to the tune of 2243.54 kg CO2-eq. ha−1; the shares of electricity and diesel fuel were 52.36% and 29.35%, respectively. The proper management of the use of electricity and diesel fuel inputs is one of the suitable solutions for reducing GHG emissions. The results demonstrate that the five provincial clusters—from sustainable to unsustainable—had EUE values of 1.05, 0.95, 0.79, 0.62, and 0.56, respectively, and GHG emissions of 1412.77, 2123.37, 2228.62, 2401.11, and 3499.13 kg CO2-eq. ha−1, respectively. Unsustainability is thus detected in the border provinces of Iran, rather than in the central provinces, as seen in Figure 4.
The recommendations for improvement that the authors of this paper can offer policymakers in Iran can be summarized as follows:
Investments in renewable energy—both electricity and biofuels—are called for in order to improve the sustainability of irrigated wheat production in Iran. The use of farmyard manure and organic fertilizer such as biochar must replace synthetic fertilizers as much as possible. Electricity usage management necessitates the dismantling or at least a reduction in subsidies that are currently provided to farmers. The same applies to subsidies provided for the purchase of chemical fertilizers. The sustainable cluster identified in this analysis must serve as a benchmark that the other clusters can strive to emulate. For the unsustainable cluster, where there is a large standard deviation in the indices, it would be prudent to tailor-make policies for each province to avoid the risk of common and uniform policies being rendered ineffective. Water management practices can be improved to enhance water-use efficiency in the region, and lastly, knowledge-sharing is encouraged among wheat farmers.

Author Contributions

Conceptualization, H.R., A.M., M.A., and E.M.H.; methodology, M.A.; software, E.M.H. and M.A.; validation, H.R. and H.A.; formal analysis, M.A.; investigation, H.R. and A.M.; resources, E.M.H.; data curation, M.A.; writing—original draft preparation, A.M., M.A., E.M.H., and H.A.; writing—review and editing, A.M.; visualization, M.A. and E.M.H.; supervision, H.R.; project administration, H.R. All authors have read and agreed to the published version of the manuscript.

Funding

This research received no external funding.

Institutional Review Board Statement

Not applicable.

Informed Consent Statement

Not applicable.

Data Availability Statement

Data used for estimations in this article were obtained from the Food and Agriculture Organization [7] and Ministry of Agriculture-Jahad of Iran [8] websites that have been referenced in the article text.

Conflicts of Interest

The authors declare no conflict of interest.

Abbreviations

TermAbbreviationUnit (SI)
Energy use efficiencyEUE
Energy productivityEPkg MJ−1
Net energyNEMJ ha−1
Non-renewable energy ratioNER
Specific energySEMJ kg−1
Carbon DioxideCO2
Greenhouse gasGHGkg CO2-eq. ha−1
Artificial neural networkANN
Data envelopment analysisDEA
Life cycle assessmentLCA
Number of observationsC
Number of clustersN
Sum of squares errorSSE

References

  1. Talukder, B.; van Loon, G.W.; Hipel, K.W. Energy efficiency of agricultural systems in the southwest coastal zone of Bangladesh. Ecol. Indic. 2019, 98, 641–648. [Google Scholar] [CrossRef]
  2. Khoshnevisan, B.; Rafiee, S.; Omid, M.; Yousefi, M.; Movahedi, M. Modeling of energy consumption and GHG (greenhouse gas) emissions in wheat production in Esfahan province of Iran using artificial neural networks. Energy 2013, 52, 333–338. [Google Scholar] [CrossRef]
  3. Šarauskis, E.; Romaneckas, K.; Kumhála, F.; Kriaučiūnienė, Z. Energy use and carbon emission of conventional and organic sugar beet farming. J. Clean. Prod. 2018, 201, 428–438. [Google Scholar] [CrossRef]
  4. Nabavi-Pelesaraei, A.; Hosseinzadeh-Bandbafha, H.; Qasemi-Kordkheili, P.; Kouchaki-Penchah, H.; Riahi-Dorcheh, F. Applying optimization techniques to improve of energy efficiency and GHG (greenhouse gas) emissions of wheat production. Energy 2016, 103, 672–678. [Google Scholar] [CrossRef]
  5. Kouchaki-Penchah, H.; Sharifi, M.; Mousazadeh, H.; Zarea-Hosseinabadi, H.; Nabavi-Pelesaraei, A. Gate to gate life cycle assessment of flat pressed particleboard production in Islamic Republic of Iran. J. Clean. Prod. 2016, 112, 343–350. [Google Scholar] [CrossRef]
  6. Mondal, S.; Singh, R.P.; Mason, E.R.; Huerta-Espino, J.; Autrique, E.; Joshi, A.K. Grain yield, adaptation and progress in breeding for early-maturing and heat-tolerant wheat lines in South Asia. Field Crops Res. 2016, 192, 78–85. [Google Scholar] [CrossRef] [Green Version]
  7. Food and Agriculture Organization. FAOSTAT Statistical Database; Food and Agriculture Organization: Rome, Italy, 2022. [Google Scholar]
  8. Ministry of Agriculture-Jahad of Iran. Annual Agricultural Statistics; Ministry of Agriculture-Jahad of Iran: Tehran, Iran, 2022. [Google Scholar]
  9. Mohammadi, A.; Rafiee, S.; Jafari, A.; Dalgaard, T.; Knudsen, M.T.; Keyhani, A.; Mousavi-Avval, S.H.; Hermansen, J.E. Potential greenhouse gas emission reductions in soybean farming: A combined use of Life Cycle Assessment and Data Envelopment Analysis. J. Clean. Prod. 2013, 54, 89–100. [Google Scholar] [CrossRef]
  10. Taghavifar, H.; Mardani, A. Energy consumption analysis of wheat production in West Azarbayjan utilizing life cycle assessment (LCA). Renew. Energy 2015, 74, 208–213. [Google Scholar] [CrossRef]
  11. Mohammadi, A.; Rafiee, S.; Mohtasebi, S.S.; Avval, S.H.M.; Rafiee, H. Energy efficiency improvement and input cost saving in kiwifruit production using Data Envelopment Analysis approach. Renew. Energy 2011, 36, 2573–2579. [Google Scholar] [CrossRef]
  12. Nabavi-Pelesaraei, A.; Rafiee, S.; Hosseinzadeh-Bandbafha, H.; Shamshirband, S. Modeling energy consumption and greenhouse gas emissions for kiwifruit production using artificial neural networks. J. Clean. Prod. 2016, 133, 924–931. [Google Scholar] [CrossRef]
  13. Mohammadi, A.; Rafiee, S.; Mohtasebi, S.; Mousavi Avval, S.H.; Rafiee, H. Developing an artificial neural network model for predicting kiwifruit production in Mazandaran province of Iran. In Proceedings of the International Agricultural Engineering Conference, Shanghai, China, 17–20 September 2010. [Google Scholar]
  14. Bojacá, C.R.; Casilimas, H.A.; Gil, R.; Schrevens, E. Extending the input–output energy balance methodology in agriculture through cluster analysis. Energy 2012, 47, 465–470. [Google Scholar] [CrossRef]
  15. Khanali, M.; Movahedi, M.; Yousefi, M.; Jahangiri, S.; Khoshnevisan, B. Investigating energy balance and carbon footprint in saffron cultivation—A case study in Iran. J. Clean. Prod. 2016, 115, 162–171. [Google Scholar] [CrossRef]
  16. Mousavi-Avval, S.H.; Rafiee, S.; Mohammadi, A. Development and Evaluation of Combined Adaptive Neuro-Fuzzy Inference System and Multi-Objective Genetic Algorithm in Energy, Economic and Environmental Life Cycle Assessments of Oilseed Production. Sustainability 2021, 13, 290. [Google Scholar] [CrossRef]
  17. Mohammadi, A.; Rafiee, S.; Jafari, A.; Keyhani, A.; Dalgaard, T.; Knudsen, M.T.; Nguyen, T.L.T.; Borek, R.; Hermansen, J.E. Joint Life Cycle Assessment and Data Envelopment Analysis for the benchmarking of environmental impacts in rice paddy production. J. Clean. Prod. 2015, 106, 521–532. [Google Scholar] [CrossRef]
  18. Rafiee, S.; Avval, S.H.M.; Mohammadi, A. Modeling and sensitivity analysis of energy inputs for apple production in Iran. Energy 2010, 35, 3301–3306. [Google Scholar] [CrossRef]
  19. Mohammadi, A.; Rafiee, S.; Mohtasebi, S.S.; Rafiee, H. Energy inputs—Yield relationship and cost analysis of kiwifruit production in Iran. Renew. Energy 2010, 35, 1071–1075. [Google Scholar] [CrossRef]
  20. Namdari, M.; Mohammadi, A.; Ghasemi Mobtaker, H. Assessment of Energy Requirements and Sensitivity Analysis of Inputs for Watermelon Production in Iran. Int. J. Plant Anim. Environ. Sci. 2011, 1, 102–110. [Google Scholar]
  21. Ghasemi-Mobtaker, H.; Kaab, A.; Rafiee, S. Application of life cycle analysis to assess environmental sustainability of wheat cultivation in the west of Iran. Energy 2020, 193, 116768. [Google Scholar] [CrossRef]
  22. Nasseri, A. Energy use and economic analysis for wheat production by conservation tillage along with sprinkler irrigation. Sci. Total Environ. 2019, 648, 450–459. [Google Scholar] [CrossRef]
  23. Moradi, M.; Nematollahi, M.A.; Khaneghah, A.M.; Pishgar-Komleh, S.H.; Rajabi, M.R. Comparison of energy consumption of wheat production in conservation and conventional agriculture using DEA. Environ. Sci. Pollut. Res. 2018, 25, 35200–35209. [Google Scholar] [CrossRef]
  24. Houshyar, E.; Grundmann, P. Environmental impacts of energy use in wheat tillage systems: A comparative life cycle assessment (LCA) study in Iran. Energy 2017, 122, 11–24. [Google Scholar] [CrossRef]
  25. Wang, D.; Feng, H.; Li, Y.; Zhang, T.; Dyck, M.; Wu, F. Energy input-output, water use efficiency and economics of winter wheat under gravel mulching in Northwest China. Agric. Water Manag. 2019, 222, 354–366. [Google Scholar] [CrossRef]
  26. Yuan, S.; Peng, S.; Wang, D.; Man, J. Evaluation of the energy budget and energy use efficiency in wheat production under various crop management practices in China. Energy 2018, 160, 184–191. [Google Scholar] [CrossRef]
  27. Ansari, R.; Liaqat, M.U.; Khan, H.I.; Mushtaq, S. Energy Efficiency Analysis of Wheat Crop under Different Climate- and Soil-Based Irrigation Schedules. Multidiscip. Digit. Publ. Inst. Proc. 2018, 2, 184. [Google Scholar] [CrossRef] [Green Version]
  28. Mondani, F.; Aleagha, S.; Khoramivafa, M.; Ghobadi, R. Evaluation of greenhouse gases emission based on energy consumption in wheat Agroecosystems. Energy Rep. 2017, 3, 37–45. [Google Scholar] [CrossRef]
  29. Unakıtan, G.; Aydın, B. A comparison of energy use efficiency and economic analysis of wheat and sunflower production in Turkey: A case study in Thrace Region. Energy 2018, 149, 279–285. [Google Scholar] [CrossRef]
  30. Ziaei, S.M.; Mazloumzadeh, S.M.; Jabbary, M. A comparison of energy use and productivity of wheat and barley (case study). J. Saudi Soc. Agric. Sci. 2015, 14, 19–25. [Google Scholar] [CrossRef] [Green Version]
  31. Ghorbani, R.; Mondani, F.; Amirmoradi, S.; Feizi, H.; Khorramdel, S.; Teimouri, M.; Sanjani, S.; Anvarkhah, S.; Aghel, H. A case study of energy use and economical analysis of irrigated and dryland wheat production systems. Appl. Energy 2011, 88, 283–288. [Google Scholar] [CrossRef]
  32. Patel, B.; Patel, A.; Gami, B.; Patel, P. Energy balance, GHG emission and economy for cultivation of high biomass verities of bamboo, sorghum and pearl millet as energy crops at marginal ecologies of Gujarat state in India. Renew. Energy 2020, 148, 816–823. [Google Scholar] [CrossRef]
  33. Taki, M.; Soheili-Fard, F.; Rohani, A.; Chen, G.; Yildizhan, H. Life cycle assessment to compare the environmental impacts of different wheat production systems. J. Clean. Prod. 2018, 197, 195–207. [Google Scholar] [CrossRef] [Green Version]
  34. Tahmasebi, M.; Feike, T.; Soltani, A.; Ramroudi, M.; Ha, N. Trade-off between productivity and environmental sustainability in irrigated vs. rainfed wheat production in Iran. J. Clean. Prod. 2018, 174, 367–379. [Google Scholar] [CrossRef]
  35. Alimagham, S.M.; Soltani, A.; Zeinali, E.; Kazemi, H. Energy flow analysis and estimation of greenhouse gases (GHG) emissions in different scenarios of soybean production (Case study: Gorgan region, Iran). J. Clean. Prod. 2017, 149, 621–628. [Google Scholar] [CrossRef]
  36. Kardoni, F.; Ahmadi, M.J.-A.; Bakhshi, M.R. Energy Efficiency Analysis and Modeling the Relationship between Energy Inputs and Wheat Yield in Iran. Int. J. Agric. Manag. Dev. 2015, 5, 321–330. [Google Scholar]
  37. Mohammadi, A.; Rafiee, S.; Jafari, A.; Keyhani, A.; Mousavi-Avval, S.H.; Nonhebel, S. Energy use efficiency and greenhouse gas emissions of farming systems in north Iran. Renew. Sustain. Energy Rev. 2014, 30, 724–733. [Google Scholar] [CrossRef]
  38. Rahman, S.; Hasan, M.K. Energy productivity and efficiency of wheat farming in Bangladesh. Energy 2014, 66, 107–114. [Google Scholar] [CrossRef] [Green Version]
  39. Asgharipour, M.R.; Mondani, F.; Riahinia, S. Energy use efficiency and economic analysis of sugar beet production system in Iran: A case study in Khorasan Razavi province. Energy 2012, 44, 1078–1084. [Google Scholar] [CrossRef]
  40. Raei Jadidi, M.; Homayounifar, M.; Sabouhi, M.; Mohammadi, A. Energy analysis and optimization of inputs for wheat production in Marand region. Indian J. Agric. Sci. 2012, 82, 21–24. [Google Scholar]
  41. Yahyaoui, H.; Own, H.S. Unsupervised clustering of service performance behaviors. Inf. Sci. 2018, 422, 558–571. [Google Scholar] [CrossRef]
  42. Caliński, T.; Harabasz, J. A dendrite method for cluster analysis. Commun. Stat. 1974, 3, 1–27. [Google Scholar] [CrossRef]
  43. Sun, J.; Wang, Z.; Du, Y.; Zhang, E.; Gan, H.; Sun, D.; Niu, W. Optimized tillage improves yield and energy efficiency while reducing carbon footprint in winter wheat-summer maize rotation systems. Sci. Total Environ. 2022, 820, 153278. [Google Scholar] [CrossRef]
  44. Wang, F.; Yue, Z.; Zhao, D.; Liu, B. Improving energy and GHG performance of the rice-wheat rotation system: A life-cycle analysis based on a large-scale behavior investigation. J. Clean. Prod. 2020, 256, 120319. [Google Scholar] [CrossRef]
  45. Martins, F.; Felgueiras, C.; Smitkova, M.; Caetano, N. Analysis of Fossil Fuel Energy Consumption and Environmental Impacts in European Countries. Energies 2019, 12, 964. [Google Scholar] [CrossRef] [Green Version]
  46. Liu, X.; Zhang, S.; Bae, J. The impact of renewable energy and agriculture on carbon dioxide emissions: Investigating the environmental Kuznets curve in four selected ASEAN countries. J. Clean. Prod. 2017, 164, 1239–1247. [Google Scholar] [CrossRef]
  47. Soltani, A.; Rajabi, M.H.; Zeinali, E.; Soltani, E. Energy inputs and greenhouse gases emissions in wheat production in Gorgan, Iran. Energy 2013, 50, 54–61. [Google Scholar] [CrossRef]
  48. Safa, M.; Samarasinghe, S. Determination and modelling of energy consumption in wheat production using neural networks: “A case study in Canterbury province, New Zealand”. Energy 2011, 36, 5140–5147. [Google Scholar] [CrossRef] [Green Version]
  49. Imran, M.; Ozcatalbas, O. Optimization of energy consumption and its effect on the energy use efficiency and greenhouse gas emissions of wheat production in Turkey. Discov. Sustain. 2021, 2, 28. [Google Scholar] [CrossRef]
  50. Dimitrijevic, A.; Gavrilovic, M.; Ivanovic, S.; Mileusnic, Z.; Miodragovic, R.; Todorovic, S. Energy Use and Economic Analysis of Fertilizer Use in Wheat and Sugar Beet Production in Serbia. Energies 2020, 13, 2361. [Google Scholar] [CrossRef]
  51. Sadaf, J.; Shah, G.A.; Shahzad, K.; Ali, N.; Shahid, M.; Ali, S.; Hussain, R.A.; Ahmed, Z.I.; Traore, B.; Ismail, I.M. Improvements in wheat productivity and soil quality can accomplish by co-application of biochars and chemical fertilizers. Sci. Total Environ. 2017, 607–608, 715–724. [Google Scholar] [CrossRef]
  52. Mohammadi, A.; Cowie, A.L.; Mai, T.L.A.; Brandao, M.; de la Rosa, R.A.; Kristiansen, P.; Joseph, S. Climate-change and health effects of using rice husk for biochar-compost: Comparing three pyrolysis systems. J. Clean. Prod. 2017, 162, 260–272. [Google Scholar] [CrossRef]
  53. Mohammadi, A.; Khoshnevisan, B.; Venkatesh, G.; Eskandari, S. A critical review on advancement and challenges of biochar application in Paddy fields: Environmental and life cycle cost analysis. Processes 2020, 8, 1275. [Google Scholar] [CrossRef]
  54. Khan, Z.; Haider, G.; Amir, R.; Ikram, R.M.; Ahmad, S.; Schofield, H.K.; Riaz, B.; Iqbal, R.; Fahad, S.; Datta, R. Chemical and biological enhancement effects of biochar on wheat growth and yield under arid field conditions. Sustainability 2021, 13, 5890. [Google Scholar] [CrossRef]
  55. Mohammadi, A.; Cowie, A.L.; Cacho, O.; Kristiansen, P.; Mai, T.L.A.; Joseph, S. Biochar addition in rice farming systems: Economic and energy benefits. Energy 2017, 140, 415–425. [Google Scholar] [CrossRef]
Figure 1. Direct and indirect energy input ratio of wheat production in Iran’s provinces.
Sustainability 14 04014 g001
Figure 2. Renewable and non-renewable energy input ratio of wheat production in Iran’s provinces.
Sustainability 14 04014 g002
Figure 3. Energy input contribution in Iran’s provinces.
Sustainability 14 04014 g003
Figure 4. Clustering map of irrigated wheat producing provinces (developed by the authors).
Sustainability 14 04014 g004
Figure 5. Direct, indirect, renewable, and non-renewable energy in each segment.
Sustainability 14 04014 g005
Table 1. Summary of the findings from the literature review.
Surveyed StudyStudied AreaCropEnergy AnalysisGHG AnalysisClustering Analysis
Ghasemi-Mobtaker et al. [21]IranWheatYesYesNo
Patel et al. [32]IndiaBamboo, sorghum, and pearl milletYesYesNo
Nasseri [22]IranWheatYesNoNo
Talukder et al. [1]BangladeshRice, shrimp, and vegetablesYesYesNo
Wang et al. [25]ChinaWheatYesNoNo
Yuan et al. [26]ChinaWheatYesNoNo
Ansari et al. [27]PakistanWheatYesNoNo
Moradi et al. [23]IranWheatYesNoNo
Unakıtan and Aydın [29]TurkeyWheat and SunflowerYesNoNo
Taki et al. [33]IranWheatYesYesNo
Šarauskis et al. [3]LithuaniaOrganic sugar beetYesYesNo
Tahmasebi et al. [34]IranWheatNoYesNo
Houshyar and Grundmann [24]IranWheatYesNoNo
Mondani et al. [28]IranWheatYesYesNo
Alimagham et al. [35]IranSoybeanYesYesNo
Nabavi-Pelesaraei et al. [4]IranWheatYesYesNo
Khanali et al. [15]IranSaffronYesYesYes
Taghavifar and Mardani [10]IranWheatYesNoNo
Ziaei et al. [30]IranWheat and barleyYesNoNo
Kardoni et al. [36]IranWheatYesNoNo
Mohammadi et al. [37]IranWheat, barley, canola, soybean, paddy, and corn silageYesYesNo
Rahman and Hasan [38]BangladeshWheatYesNoNo
Khoshnevisan et al. [2]IranWheatYesYesNo
Bojacá et al. [14]ColombiaGreenhouse tomatoYesNoYes
Asgharipour et al. [39]IranSugar beetYesNoNo
Raei Jadidi et al. [40]IranWheatYesNoNo
Ghorbani et al. [31]IranWheatYesNoNo
Current study IranWheatYesYesYes
Table 2. Energy equivalents (MJ unit−1) and GHG emission coefficients (kg CO2-eq. unit−1) in wheat production.
Input-Output EnergyGHG EmissionsReference
UnitEnergy EquivalentUnitGHG Coefficient (kg CO2-eq/unit)
A. Output
1. Wheatkg13.00 Khoshnevisan et al. [2], Nabavi-Pelesaraei et al. [4]
B. Inputs
1. Seedkg13.00 Khoshnevisan et al. [2], Nabavi-Pelesaraei et al. [4]
2. Human laborh1.96 Khoshnevisan et al. [2], Taki et al. [33]
3. Water for irrigationm31.02 Khoshnevisan et al. [2], Nabavi-Pelesaraei et al. [4]
4. ElectricitykWh12.00kWh0.608Khoshnevisan et al. [2], Nasseri [22], Nabavi-Pelesaraei et al. [4]
5. Machineryh62.70MJ0.071Khoshnevisan et al. [2], Nabavi-Pelesaraei et al. [4]
6. Diesel FuelL47.80L2.78Khoshnevisan et al. [2], Taki et al. [33], Nabavi-Pelesaraei et al. [4]
7. Pesticideskg kg
7.1. Herbicides 238.00 6.30Taki et al. [33], Khoshnevisan et al. [2]
7.2. Insecticides 199.00 5.10Nabavi-Pelesaraei et al. [4], Khoshnevisan et al. [2]
7.3. Fungicides 92.00 3.90Khoshnevisan et al. [2], Nabavi-Pelesaraei et al. [4]
8. Chemical fertilizerskg kg
8.1. Nitrogen 47.10 1.30Taki et al. [33], Khoshnevisan et al. [2], Nabavi-Pelesaraei et al. [4]
8.2. Phosphate 15.80 0.20Taki et al. [33], Khoshnevisan et al. [2], Nabavi-Pelesaraei et al. [4]
8.3. Potassium 9.28 0.20Taki et al. [33], Khoshnevisan et al. [2], Nabavi-Pelesaraei et al. [4]
9. Farmyard manurekg0.30 Khoshnevisan et al. [2], Nabavi-Pelesaraei et al. [4]
Table 3. Standard formulae used for calculation of energy indices.
IndicatorAbbreviationUnitFormulaRef.
Energy use efficiencyEUE Output energy/Input energyTalukder et al. [1], Khoshnevisan et al. [2]
Net energyNEMJ ha−1Output energy−Input energyTalukder et al. [1], Khoshnevisan et al. [2]
Non’-renewable energy ratioNER Output energy/Non-renewable input energyTalukder et al. [1]
Energy productivityEPkg MJ−1Output yield/Input energyTalukder et al. [1], Khoshnevisan et al. [2]
Specific energySEMJ kg−1Input energy/Output yieldKhoshnevisan et al. [2]
Table 4. Energy indices of wheat production in Iran’s provinces.
Province *InputOutputEUENENEREPSE
GJ ha−1GJ ha−1GJ ha−1kg MJ−1MJ kg−1
East Azerbaijan41.1747.731.166.561.520.0911.21
Golestan35.4239.861.134.441.330.0911.55
Ardabil44.0348.681.114.651.380.0911.76
Kohgiluyeh and Boyer-Ahmad35.5137.211.051.71.250.0812.41
Alborz68.73711.032.281.260.0812.58
West Azerbaijan40.9442.221.031.281.330.0812.6
Kurdistan52.2951.170.98−1.111.280.0813.28
Mazandaran56.3954.750.97−1.641.190.0713.39
Kermanshah58.1154.870.94−3.251.130.0713.77
Markazi54.7551.320.94−3.431.160.0713.87
Hormozgan56.7550.120.88−6.621.080.0714.72
North Khorasan44.1538.490.87−5.661.120.0714.91
Zanjan60.13520.86−8.131.070.0715.03
Bushehr31.9927.30.85−4.681.150.0715.23
Qom61.9751.640.83−10.330.970.0615.6
Fars63.751.910.81−11.791.010.0615.95
Qazvin6348.660.77−14.350.940.0616.83
Tehran83.3262.870.75−20.450.920.0617.23
Ilam55.1940.030.73−15.160.940.0617.92
Hamadan60.2143.630.72−16.580.910.0617.94
Khuzestan64.845.210.7−19.590.870.0518.63
Lorestan62.4542.980.69−19.470.890.0518.89
Semnan59.340.370.68−18.930.820.0519.1
Razavi Khorasan69.8346.980.67−22.850.850.0519.32
Chaharmahal and Bakhtiari66.5140.420.61−26.090.770.0521.39
Isfahan85.350.040.59−35.260.670.0522.16
Kerman84.9643.840.52−41.120.620.0425.19
South Khorasan67.8733.030.49−34.840.630.0426.71
Sistan and Baluchestan56.2727.250.48−29.020.610.0426.84
Yazd101.2939.240.39−62.050.480.0333.56
Iran (average)59.5445.830.77−13.720.950.0616.89
* The provinces are ranked based on the energy use efficiency index (EUE).
Table 5. GHG emissions (kg CO2-eq. ha−1) from wheat production and the contribution of the inputs (%).
Province *GHG EmissionsMachineryDiesel FuelFertilizersPesticidesElectricity
NitrogenPhosphorusPotassiumHerbicidesInsecticidesFungicides
Bushehr1162.83.923.275.730.740.060.290066.01
Kohgiluyeh and Boyer-Ahmad1304.76.4838.6819.871.780.140.370.06032.62
Golestan1349.577.1342.5518.211.090.220.640.090.2229.85
East Azerbaijan1508.774.7228.178.960.900.260.030.0156.95
West Azerbaijan1531.094.3826.118.070.8200.40.090.0160.11
Ardabil1619.715.2231.1212.311.6300.420.010.0349.27
North Khorasan1619.854.9537.1411.331.080.180.250.02045.04
Kurdistan1913.624.4926.789.010.810.010.360.160.0158.38
Ilam2034.963.3920.219.280.5500.280.01066.29
Qom2038.113.7422.331.731.932.160.380.150.1437.48
Hormozgan2118.255.4732.6514.741.070.090.380.210.0145.39
Markazi2131.565.7834.529.350.980.070.140.110.0249.03
Sistan and Baluchestan2172.114.4526.537.650.640.010.0100.0160.71
Hamadan2217.534.7528.3512.691.070.050.330.130.0152.61
Mazandaran2223.515.3331.798.720.450.440.280.670.1752.15
Kermanshah2281.536.4438.4612.441.130.20.380.12040.83
Semnan2304.316.1936.9612.461.340.140.250.12042.55
Khuzestan2331.943.4419.5416.390.70.040.330.02059.53
Lorestan2339.843.6121.577.60.50.020.350.080.0266.26
Zanjan2343.125.5132.869.880.710.120.240.070.0150.6
Qazvin2362.355.3832.0814.591.3600.290.13046.17
Fars2375.635.1830.8913.31.10.030.280.07049.16
South Khorasan2508.312.6115.68.430.630.010.020.13072.57
Chahar Mahaal and Bakhtiari2510.434.5427.089.660.7500.270.010.0257.67
Alborz2575.34.3826.1313.011.280.120.210.12054.74
Razavi Khorasan2640.844.2825.549.630.850.080.260.06059.28
Kerman3193.417.1942.917.541.550.190.320.180.0330.11
Tehran3286.515.0430.058.790.70.060.310.15054.92
Isfahan3563.574.7428.299.940.9800.140.080.0255.8
Yazd3953.014.3425.888.660.730.10.080.13060.08
Iran2243.544.8929.3511.860.980.150.270.110.0252.36
* The provinces are listed based on the GHG emission values.
Table 6. Energy indices and GHG emissions across province segments (values in parentheses indicate standard deviations) *.
Cluster(1) Sustainable(2) Semi-Sustainable(3) Middle Sustainable(4) Semi-Unsustainable(5) Unsustainable
Input in GJ ha−138.1855.8860.7063.8688.72
(4.56) (7.33)(3.06)(4.83)(8.42)
Output in GJ ha−140.5053.1047.9839.4649.00
(7.84)(9.62)(5.05)(7.00)(10.25)
EUE1.050.950.790.620.56
(0.11)(0.06)(0.06)(0.09)(0.15)
NE in GJ ha−12.33−2.78−12.72−24.40−39.72
(3.96)(2.98)(3.20)(5.96)(17.24)
EP in kg MJ−10.080.070.060.050.04
(0.01)(0.00)(0.00)(0.01)(0.01)
SE in MJ kg−112.4613.7916.5521.5624.53
(1.45)(0.82)(1.22)(3.68)(6.85)
NER1.331.180.970.780.67
(0.12)(0.07)(0.06)(0.11)(0.19)
Direct energy in GJ ha−126.3540.0640.6948.5564.85
(5.00)(5.44)(6.17)(5.16)(12.84)
Indirect energy in GJ ha−111.8315.8220.0115.3123.86
(3.35)(3.01)(7.42)(3.35)(7.69)
Renewable energy in GJ ha−17.8410.7811.4513.1514.66
(1.81)(1.14)(1.37)(1.81)(3.64)
Non-renewable energy in GJ ha−130.3345.1049.2550.7174.06
(3.78)(6.87)(3.78)(3.62)(6.14)
GHG in kg CO2-eq. ha−11412.772123.372228.622401.113499.13
(169.82)(299.14)(159.08)(158.78)(340.99)
Area harvested share (%)20.8613.6922.6134.038.81
Production share (%)19.3815.2924.1331.729.47
Average yield in kg3115.474084.943690.583035.533769.10
(1) SustainableArdabil, Bushehr, East Azerbaijan, Golestan, Kohgiluyeh and Boyer-Ahmad, West Azerbaijan
(2) Semi-sustainableAlborz, Hormozgan, Kermanshah, Kurdistan, Markazi, Mazandaran, North Khorasan
(3) Middle sustainableFars, Hamadan, Ilam, Qazvin, Qom, Zanjan
(4) Semi-unsustainableChaharmahal and Bakhtiari, Khuzestan, Lorestan, Razavi Khorasan, Semnan, Sistan and Baluchestan, South Khorasan
(5) UnsustainableIsfahan, Kerman, Tehran, Yazd
* Resource: The findings from the current study.
Publisher’s Note: MDPI stays neutral with regard to jurisdictional claims in published maps and institutional affiliations.

