Abstract
Experience and evaluation research on sustainable products’ design is increasingly supported by eye-tracking tools. In particular, many studies have investigated the effect of gazing at or fixating on Areas of Interest on products’ evaluations, and in a number of cases, they have inferred the critical graphical elements leading to the preference of sustainable products. This paper is motivated by the lack of generalizability of the results of these studies, which have predominantly targeted specific products and Areas of Interest. In addition, it has also been overlooked that the observation of some Areas of Interest, despite not specifically targeting sustainable aspects, can lead consumers to prefer or appreciate sustainable products in any case. Furthermore, it has to be noted that sustainable products can be recognized based on their design (shape, material, lack of waste generated) and/or, more diffusedly, information clearly delivered on packaging and in advertising. With reference to the latter, this paper collected and classified Areas of Interest dealt with in past studies, markedly in eco-design and green consumption, and characterized by their potential generalizability. Specifically, the identified classes of Areas of Interest are not peculiar to specific products or economic sectors. These classes were further distinguished into “Content”, i.e., the quality aspect they intend to highlight, and “Form”, i.e., the graphical element used as a form of communication. This framework of Areas of Interest is the major contribution of the paper. Such a framework is needed to study regularities across multiple product categories in terms of how the observation of Areas of Interest leads to product appreciation and value perception. In addition, the potential significant differences between sustainable and commonplace products can be better investigated.
1. Introduction
The environmental and climate challenges humanity faces are well known. Product design and engineering design have implemented a number of methods, principles and criteria to diminish products’ footprint; for a reference to eco-design and sustainable design, see, e.g., [1]. However, the development of more sustainable or, as commonly known, green products does not represent a sufficient guarantee for significantly reducing consumption’s footprint. In recent publications, some aspects have proven to be extremely impactful when it comes to yielding the benefits of sustainable design. These include:
- People’s capability of distinguishing product alternatives that are more sustainable than ordinary products [2], also in light of the greenwashing phenomenon that negatively affects green development and green marketing, e.g., [3];
- The implementation of means to favor the success of eco-designed products, which is ensured by the compliance with eco-design principles [4], e.g., the transition to Product–Service Systems and the reduction in packaging.
Still, it is useful to highlight how several green initiatives and green symbols that are commonly present in product representations have failed to attain the intended purposes. This applies, for instance, to eco-labels (for a definition, please refer to [5]), which have proven to be poorly effective in steering consumers’ choices [6], or to sustainability indicators in the choice of hotels to be booked [7]. On the other hand, the representation of natural sceneries has been recently studied; preliminary results have suggested that nature is capable of luring people and favoring sustainable choices [8].
It follows that the design of more sustainable products does not guarantee benefits for the environment [4,7,9], and it is imperative to capture the mechanisms that lead to the choice of green products, whether the reasons concern people’s intention to safeguard the environment or are ascribable to different phenomena. An increasing number of studies have addressed the role of elements present in product representations, whose observation is typically studied with eye-tracking (ET) instruments. The following section presents the background of the topic, which leads to the motivation of the present research study, which is elicited in Section 3.
2. Eye-Tracking in Studies of Green Consumption: Background
2.1. Approaches and Challenges
The higher effectiveness of nature displays compared to objective sustainable information put forward by Dong et al. [8] reveals how emotional and unconscious aspects affect consumer choices beyond cognitive dimensions. Therefore, it is of no surprise that neuroscience, along with the use of neurophysiological and biometric instruments, has made inroads into the field of sustainability (see [10], for a recent review). The advantage of these kind of tools is their capability of extracting objective information about people’s unconscious behavior and intentions.
Here, the visual dimension is clearly relevant to determine choices and preferences, given that bottom-up stimulation may activate needs and trigger desires, which may lead to the purchase of a product. Consequently, it may be understood why the use of ET instruments in consumer decisions has gained increasing attention. In brief, ET technologies allow one to capture participants’ visual behavior, which may provide access to intimate thoughts. ET software and hardware provide important measures of eye behavior, including points gazed at in different moments, fixations (proxies for attention), saccades (proxies for lack of interest or exploration in search for something relevant) and pupil diameter (as an index of concentration and elaboration of captured information). The field of green consumption is no exception, and ET studies targeting the determinants of sustainable purchase choices have been published in recent years.
The main challenge for the studies in this field consists in simulating real purchase conditions to maximize their reliability. ET glasses, representing a mobile ET system worn by subjects participating in experiments, can be employed in field studies, thus allowing higher ecological validity to be obtained. Despite this circumstance, much research conducted with ET glasses in the domain of green consumption is concerned with the simulation of shopping environments. Exceptions are [11,12]. In [11], customers of a supermarket were asked to choose among variants of a new organic fruit juice. The findings of the study included a clear relation among participants’ positive attitude towards sustainable food, the fixation time spent on elements of product displays that recall sustainable aspects and people’s capability of remembering those elements. In [12], participants were recruited at the entrance of a real food store, which they visited while wearing ET glasses. Then, post-shopping interviews and survey were used to clarify aspects of consumer choices. The research study focused on the role of eco-labels and showed that these signs poorly captured attention. Especially if compared with other products’ features, eco-labels were diffusedly misinterpreted, and even if people looked at them, this was not significantly related to the purchase of green products.
The focus on labels characterizes other mobile-ET-supported studies of sustainable consumption. In a lab experiment, Smith [13] recreated the packaging of invented cereals and submitted them to participants, who overall maintained that the recycling of the packaging was a major concern. While the recycling logos were glanced at less frequently than other Areas of Interest (AOIs), the attention on them depended on their position on the packaging. Guyader et al. [14] set up a supermarket mock-up and asked participants to choose variants of four categories of food products; the results showed that people’s attention was directed to specific features, e.g., labels, when they were specifically asked to value products’ sustainability in their choice. A lab simulation of a shopping environment was also proposed in the methodological proposal developed by Lewandowska et al. [15] to study the effectiveness of different eco-labels. With different objectives, while still using a mock-up of a retail shop, Guyader et al. [16] studied green consumer choices, revealing that people who were primed with in-store information about more sustainable products gazed at them with higher intensity. This aspect can be considered as an indication of the relevance of contextual factors in green consumption.
Thus, aspects to which great importance is attributed are, among the others, the manipulation of contexts and the need to reproduce realistic shopping environments or places where consumption choices are made. Those can be supported and studied with tools such as Virtual Reality (VR) and Augmented Reality (AR), as put forward by several scholars, e.g., [17]. The former is integrated with ET systems in a number of devices, but this combination has not made inroads into research on consumer behavior, nor it is found in published studies of green consumption. In fact, the use of VR/AR in the field of sustainable products is often claimed as a future opportunity and a research direction, e.g., [8], but few contributions are hitherto available.
When it comes to using VR in the field of the green consumption, Wölfel and Reinhardt [18] showed that purchase choices in a virtual environment do not differ significantly from those in real environments. Their results also showed how different contexts, including natural landscapes shown thanks to VR equipment, led to different perceptions of products’ sustainability. The newness of employing VR in green consumption studies is evidenced by some recent thesis works in the fields of industrial gas distribution [19] and packaging for beverage articles [20], while older and more acknowledged contributions have not been identified by the authors.
2.2. Eye-Tracking and Areas of Interest in Sustainability-Related Studies of Products
The previous subsection highlights how environmental concerns are among the major reasons for investigating people’s product choices. In this respect, research in product design, consumer behavior and economic psychology has paid particular attention to the effect of specific information present in objects. The scope of using ET in these studies is to identify in an objective way what people look at, gaze at or fixate on, the gaze being considered as an indicator of attention. This calls into question the importance of the aforementioned AOIs, namely, well-defined portions of objects featuring peculiar characteristics, e.g., a graphical element reporting or being an eco-label. The consideration of AOIs in ET studies is often in contrast with a different approach, i.e., point-based visualization techniques (see [21]), where the focus is rather on spatial and temporal information.
In the field of the present study, remote ET systems are the most appropriate systems to gather data of eye behavior in relation to specific AOIs, as stimuli are commonly presented as pictures on a computer screen; their display is, therefore, controlled. This particularly contrasts with mobile ET, where participants wear ET glasses and they freely explore the surrounding environment, giving rise to a majority of point-based studies. Of course, the latter is more representative of a real shopping situation, but the issues in terms of investigating AOIs are considerable since their position is not known a priori in free exploration. In addition, the diffusion of online commerce makes consumer choices based on information and pictures presented on computer screens more and more frequent. It follows that remote ET is overall more suitable for the general scope of studying the effects of the presence of specific elements in a product, and it is focused on in this paper. Likewise, the use of pictures and remote ET is predominant in (green) consumption, as evidenced by the large number of studies analyzed in Section 3.
A further aspect needs to be considered here. As inferable from this background, the identification and observation of specific AOIs is expectedly conducive to the understanding of product characteristics, properties and attributes, thus contributing to perceived value [2]. When it comes to sustainable characteristics, those can be understood by means of design features (materials, shapes, way of functioning that reduces emissions or waste) or explicit indications, e.g., eco-labels or indications of environmental quality on packages. Markedly, She and MacDonald [22] distinguished sustainable triggers, i.e., product features making an observer think that the product is green and stickers that directly communicate a sustainable performance and accordingly persuade observers. It follows that the cognitive processes that follow in the identification of sustainable qualities differ according to the way a product is presented. It is noteworthy that a sustainable trigger requires an abstraction process to identify a positive functional change in environmental terms, e.g., the realization of waste reduction when edible packaging is present. From a design perspective, this is mirrored by the fact that people see structures out of product pictures and require steps to interpret their behavior and function, which potentially leads to diverse interpretations, reactions and evaluations [23]. The required interpretation of a product, if this is presented without additional symbols and texts (such as in e-commerce platforms or as a case in point in [24]), makes ET studies in this area more commonly concerned with the result of this interpretation. Therefore, they typically target affordances and the understanding of functionalities for new, creative and uncommon products [25,26,27]. Accordingly, AOIs that are here leveraged are mostly distinguished in functional terms, e.g., parts of products handled first or performing the main function. As such, these AOIs are poorly related to qualities that contribute to the creation of value for perspective consumers. Consequently, the residual of this paper is concerned primarily with AOIs providing direct information on products’ properties, which is then predominantly found on packages or in promotional pictures that include explicit information.
3. Open Issues and Paper’s Objectives
3.1. Peculiarities of Previous Studies and Challenges to Extend the Scope of Eye-Tracking Studies
It is of anecdotal evidence that the majority of studies dealing with ET and green consumption target specific products. Those studies are expected to provide precise information to product developers or marketing teams. However, these practical implications can be challenged by the peculiar experimental conditions present in each study, which are seldom taken into due account. A comparative study across multiple cases would allow scholars to have more robust results in terms of the effect of design choices and the presence of features (corresponding to AOIs in ET applications) on consumers’ appreciation and evaluation. For instance, Ares et al. [28] observed the effect of the same AOI across three different food products. Similarly, Kuo et al. [29] identified AOIs shared across multiple vehicles based on their functionality. Yet, it has been well established long ago that multiple properties, as well as their combination, of a product’s representation or advertising can modify a person’s perception and attention, e.g., [30].
Therefore, a comprehensive study of the visual elements affecting product choices should involve more products and AOIs to provide information of general validity for designers and marketers. In addition, results of general validity could be of major interest in research, giving the chance to conduct more insightful investigations into psychological determinants in the cognitive processes that lead from AOIs’ observation to the formation of preferences.
The use of multiple products in experimental research with remote ET determines possible problems in terms of the selection of the images to be processed by participants. To ensure the comparability of results across different products, experimenters should minimize differences in terms of the factors potentially affecting eye behaviors and product evaluations. These include the size of the product representation and its salient features, among others [31,32]. These aspects are difficult to control if researchers rely on the available images or advertising of commercial products. On the one hand, a common approach is to create bespoke pictures for experiments or retouch existing ones, which has clear limitations when one needs to investigate the effect of real images. On the other hand, parameters concerning the sizes and positions of AOIs are willingly manipulated or taken into account in many studies.
Nevertheless, the main challenge here is to compare the effect of people gazing at or fixating on AOIs across multiple products. Borgianni and Maccioni [33] documented the large variety of design areas subjected to ET-based design studies, from consumer goods to automotive, from food to architectural artifacts—commonalities across the AOIs in these different domains are relatively hard to identify. In fact, these commonalities have to be found to enable a proper elaboration of the ET data of AOIs. Yet, each AOI can be characterized by different meanings and qualities. For instance, a sustainable brand can give rise to the perception of value in terms of the environmental advantages, identification and general quality of the products offered by the corresponding manufacturer, e.g., [34]. More in general, product features and the corresponding AOIs as a consequence are characterized by at least their form and function, both of which influence consumers’ preferences [35].
In summary, as also illustrated in Figure 1, ET studies targeting product representations can vary in their scope and complexity in terms of the following dimensions:
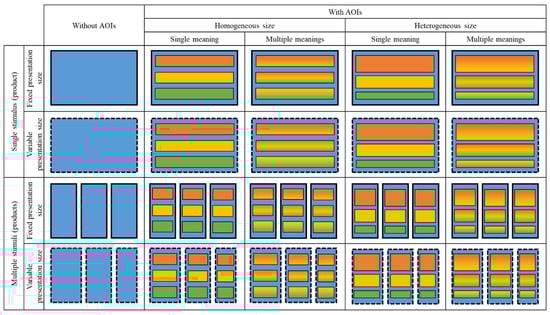
Figure 1.
Generalization of the scenarios for ET studies swiveled on product representations, where the simplest situation is on the top left-hand side and the most complex circumstance is on the bottom right-hand side.
- Number of products—one or more: The first two rows in Figure 1, characterized by a single blue set representing the stimului (product), depict experiments only involving one product. The last two rows in the same figure, characterized by multiple blue sets, are meant to model experiments involving data acquisition on multiple products. More products can be sequentially presented, e.g., [2], or in a multi-product illustration, e.g., [36,37,38]. The variety of the considered products and industrial domains can be also relevant here, e.g., the commonalities possibly found in food products could have already been remarked. For instance, in the references above, Laohakangvalvit and Ohkura [37] presented the same objects (spoons) with some geometric variations; Wan et al. [38] used the same products (chairs) featuring considerable stylistic variations; Helmert et al. [36] leveraged a variety of agricultural and food products;
- The consideration of specific AOIs instead of acquiring overall information about visual behavior with respect to products as a whole: In Figure 1, the first column is related to experiments that do not involve specific AOIs, i.e., visual data are collected on the observation of the product without classifying them based on the observation of specific areas or specific features, e.g., [2]. In the other columns of Figure 1, it is possible to notice colored rectangles within the blue set; they represent different AOIs. Therefore, these columns are meant to model experiments that take into account different AOIs shown simultaneously. In the last column, all experiments that rely on AOIs are present;
- The variation in products and AOIs in terms of size, position and other geometric parameters (featured by the different sizes of boxes in Figure 1): Indeed, it is possible to notice in Figure 1 the distinction between AOIs having homogeneous size (colored rectangles with the same height) and AOIs with heterogeneous size (colored rectangles with different heights). The former represent AOIs with comparable shape and size e.g., chess squares as AOIs [39]. The latter represent AOIs with different shape and/or size, e.g., [22]. Disregarding this aspect could result in a serious methodological shortcoming. It could lead to the conclusion that a specific AOI captures more attention than another one does because it has more interesting content, when in fact, it is simply larger and the probability of gazing at it is higher;
- The meanings attributed to the AOIs (featuring the different colors of boxes in Figure 1): It is possible to classify the AOIs in single (solid-colored boxes) and multiple meanings (gradient-colored boxes). Single meaning features those AOIs that are designed with a single specific characteristic. For example, when the AOIs are differentiated solely based on the color of the product they contain. For instance, in [40], the attention given to green packaging versus the red or orange ones was measured exploiting AOIs. In the same study, it was possible to recognize multiple meanings of AOIs, since in addition to color, it was possible to classify the AOIs based on the taste written in the packaging. In addition, the combination of taste and color gave rise to an additional variable, namely, the expected consistency. Therefore, through these AOI-related features, it was possible to study the attention given to color, taste and consistency;
- The last factor that is relevant for ET experiments is the participant’s exposure time to the stimulus, which can be fixed or variable. In Figure 1, the exposure time is represented by the frame of blue rectangles. Rectangles with a continuous black frame indicate experiments with fixed exposure time. Rectangles with a black dashed frame indicate experiments with variable exposure time. In [41], these were taken into account. Comparing results from different observation times without appropriate statistical processing could result in a serious methodological shortcoming.
3.2. Challenge and Objectives
The above bulleted list and Figure 1 reveal some of the possible aspects to be considered when it is necessary to expand the scope of the most common studies in products’ evaluation with ET. The study of geometric aspects can be tackled through objective measures; furthermore, ET software is supportive in providing detailed data about the sizes and positions of AOIs, as it supports point-based analysis. Here, the challenge is to develop means to allow comparisons across multiple products to be performed by identifying commonalities across AOIs. Analyzed products can potentially come from distant industrial domains and feature remarkable differences in the ways they are conventionally represented, e.g., in advertising, on the Internet, on e-commerce platforms.
These commonalities to be found necessarily represent abstract interpretations of AOIs. To the authors’ best knowledge and from the analysis of the literature, no attempt has been made to analyze AOIs possibly repeated across multiple products and industrial domains in a systematic way. The paper’s objectiveis to contribute to fill this gap by identifying those means that make possible the comparability of different studies.
To this end, the present paper classified AOIs (see next section) with a focus on studies involving sustainability. A framework of AOIs of general significance was created.
An additional aspect emerging in the previous subsection is the multi-dimensional nature of AOIs in terms of attributable meanings, which is considered in the framework by separating the information-related aspect (“content”) and the form of graphical communication (“form”).
4. Methods
4.1. Approach to the Construction of the Framework and Selection of Relevant Sources
The framework was developed with a bottom-up approach. This included:
- The identification of a sample of pertinent scientific sources studying AOIs in the broad field of sustainable products and designs;
- The extraction of the used AOIs for subsequent generalization. Specifically, here, the authors attempted to identify commonalities across these AOIs and the possibility to characterize them through shared terms. These terms were then used as the categories the framework was articulated in;
- The eventual association of each source to the categories of the considered AOIs.
A statistical analysis of the distribution of the categories followed (see Section 4.4).
4.2. Approach to the Construction of the Framework and Selection of Relevant Sources
The sample of collected publications corresponds to the sources in the first column of Table 1 below.

Table 1.
Framework of Areas of Interest in studies of sustainable design and consumption.
The following search terms, along with synonyms and variations in British English, were used and combined in the Scopus and Google Scholar databases to gather a comprehensive sample:
- “Area of Interest” (AOI), “Eye tracking”, “visual behavior”—to identify studies where ET was used;
- Product, Design, Item, Artefact—to identify studies focusing on the evaluation of products;
- Sustainability, Green, Ecology, Environment, Well-being—to restrict the sample to studies having a relation with the field of sustainable choice and consumption.
The following aspects were the eligibility criteria for the sources’ inclusion in the sample:
- Attention was paid to AOIs that are repeatable across multiple products and representations thereof, consistently with the scope of the study;
- Focus on sustainability in a broad sense, thus including safety, wellness, well-being, health, social justice beyond ecology and environmental friendliness;
- Investigation of products’ effects on potential consumers or evaluators. Therefore, the collected research study aimed at quality and sustainability evaluations, preferences, choices, likes and dislikes, attractiveness, aesthetics and engendered emotions. As aforementioned, research targeting only functionality, usability and affordances was not to be considered here.
4.3. Data Extraction and Quality Assessment
AOI-related data extracted from the papers were categorized according to two dimensions: content- and form-related AOIs. In addition, for each of the two dimensions, a series of other qualifiers were attributed to the items.
After the collection and the definition of categories, those were used to classify the same gathered studies in terms of the leveraged or manipulated categories of AOIs. The classification of AOIs was performed by the authors in a consensual way. In some cases, the categories of AOIs, as defined in the framework of Table 1, directly arose from one or more sources, e.g., “price”, “origin”. In other circumstances, the authors identified categories of AOIs potentially non-peculiar to the studies in question, but their definitions could be modified to match other contexts through a more abstract definition, e.g., “captivating or qualifying graphical elements”. All the categories of AOIs were shared by at least two sources to prove their diffusion.
4.4. Statistical Analysis and Verification
After calculating the frequencies of the categories, two multiple correspondence analyses (MCAs) were performed separately on the mentioned two sets, i.e., content- and form-related AOIs. The analysis is considered the homologue of a principal component analysis with categorical variables [42]. The analysis allowed us to detect whether relationships among variables underlay the dataset, so that it was possible to determine associations among variables recurrent in the set of papers. Therefore, the analysis was devised to determine, in the current literature, how the categories were clustered. These clusters denoted which AOIs were frequently considered in conjunction. This approach is common in the literature, where knowledge is built upon new associations based on data extracted from past literature. Examples of this approach can be found in the fields of sustainability [43,44] and consumer research [45], among others.
The interpretation of clusters was then linked with relevant concepts from literature studies focusing on consumer choices, which supports the reasonableness and the relevance of the clusters of categories through their underlying dimensions.
5. Results
5.1. Categories and Framework
This subsection presents the outcomes of the methodologic procedure described in Section 4.1, Section 4.2 and Section 4.3. The achieved framework of AOIs is illustrated in Table 1, where the second row includes the content- and form-related categories of the AOIs. In the table, the parts of the names of categories of the AOIs highlighted in bold types were used as tags for the scopes of the analysis shown in the subsequent subsection. The numbers on the lowest row indicate, for each category, the number of papers that presented that category. Within content and form descriptors, categories were arranged according to decreasing frequency.
5.2. Distribution of Categories through Multiple Correspondence Analyses
MCAs were performed separately for content- and form-related categories.
The two MCAs produced a smooth set of eigenvalues, in which the several dimensions regularly decreased their values. This result indicates that the variables were distributed almost homogeneously across the studies, and a few patterns could be detected. Figure 2 and Figure 3 present the distribution of categories on the two main dimensions obtained by the MCAs for content and form, respectively. For all the four dimensions in the figures, their share of explained variance emerging from the MCAs is indicated.
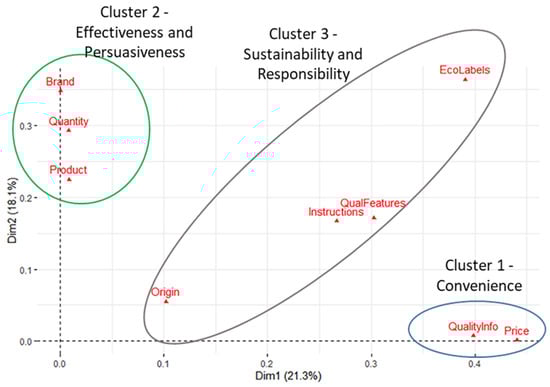
Figure 2.
Results of the Multiple Correspondence Analysis on the frequency of content-related categories of AOIs; the categories are shown on the two axes representing the two main dimensions found in the analysis. Clusters are highlighted.
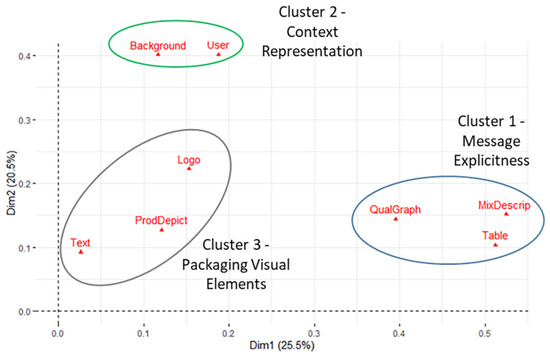
Figure 3.
Results of the Multiple Correspondence Analysis on the frequency of form-related categories of AOIs; the categories are shown on the two axes representing the two main dimensions found in the analysis. Clusters are highlighted.
In the analysis of content-related categories, three main clusters could be detected:
- The group of categories closer to dimension 1, interpretable as “Convenience” (Quality Information and Price); the relevance of this cluster is supported by [81];
- Those closer to dimension 2, interpretable as “Effectiveness and Persuasiveness” (Brand, Quantity and Product Description); the relevance of this cluster is supported by [82];
- Those at the interaction between the two dimensions, interpretable as “Sustainability and Responsibility” (Sustainability-Related Indications, Sustainability-Related Qualifying Features, Additional Information and Origin); the relevance of this cluster is supported by [83].
In the analysis of form-related categories, three clusters could also be identified:
- The first cluster of categories (interpretable as “Message Explicitness”), closer to dimension 1, is described by variables Mixed Descriptors, Captivating or Qualifying Graphical Elements and Table; the relevance of this cluster is supported by [84];
- The second cluster of categories (interpretable as “Context Representation”) is based on two variables, Representation of the User and Background; the relevance of this cluster is supported by [85];
- The third cluster of categories (interpretable as “Packaging Visual Elements”) is based on Product Depiction, Text and Logo; the relevance of this cluster is supported by [86].
6. Discussion
The outcomes presented in Table 1 show that a variety of factors were studied to investigate their capability of attracting consumers’ attention.
The content-related AOIs informed potential buyers of the product characteristics; those were linked to sustainability to different extents. The second column indicates those sources that leveraged an explicit indication of sustainability and environmental performances, e.g., standard eco-labels or the indications of the materials being saved. In other cases, the indication of sustainable advantages was not directly communicated (third column), but the physical and geometric properties of a product could make the observer infer that that product was more sustainable, e.g., by visualizing that a paper package replaced a plastic one. They mirrored the above “sustainability triggers”, but they were not the exclusive source of sustainable information in the collected studies. Some information presented did not necessarily relate to sustainability, but it could represent (additional) sources of value such as what the product was, how much of it there was (e.g., quantity of milk), its quality (e.g., quality labels), its specific features (e.g., usable in certain situations), its price, the brand (typically the symbol of the manufacturer) and its origin. The last category of the listed AOIs could be associated with sustainability in terms of the consumption of local products (but that was clearly context dependent) or by linking a specific territory to high environmental performance.
It was evident that, in a number of cases, sustainability-related direct or indirect information (second and third columns of Table 1) was missing among the considered AOIs, although sustainability was, to some extent, involved in the studies. This suggests that strategies to promote green choices might swivel on the illustration of product features different from the aspects of the products strictly linked to sustainability. Brands resulted as being among the most popular meaning-related categories of AOIs. This outcome supports the consolidated and aforementioned strategy of promoting green products through brands to which a sustainable or equity identity has been attributed, e.g., [62]. Information about the essence, quality and other characteristics of the illustrated products was likewise diffused. In several cases, those AOIs were also taken into account when sustainability-related information was not analyzed. The large diffusion of these AOIs recalls the importance of avoiding compromising quality and sustainability, which is particularly debated in the design field, e.g., [4,87]. Convenience factors, such as price, quantity and origin, are also diffused, but significant emphasis has been given, so far, just to the former.
When it comes to form-related AOIs, diffused fashions of representation were depictions of products (typically on packages), texts (structured information was sometimes presented through tables, as highlighted), logos and mixed graphical–textual descriptors. Other forms that were found in AOI studies were backgrounds (which could be inspirational), the inclusion of people using products and other captivating pictures that did not directly represent the product itself (e.g., a healthy cow on a milk package). Clearly, captivating pictures and backgrounds can trigger a sense of quality, value and sustainability, whatever the real environmental and quality performances of products.
The popularity of the categories of form-related AOIs was strongly uneven; only the first three in Table 1 were considerably diffused. Many studies considered the importance of showing the product through images, photos or directly through transparent packaging. Texts and logos were commonly used to present information and brands, respectively. While these forms of representation for AOIs were expected, other forms might attract interest in future studies, as they have been comparatively overlooked so far. This also partially applies to captivating pictures that do not show the product itself, which seemingly conflicts with consolidated advertising strategies. It is in the authors’ intention to investigate the effect of captivating displays used to enhance the saliency of eco-labels across a number of different products.
The MCAs were meant to determine the underlying relationships among the categories, in order to highlight implicit networks of features that scholars considered relevant in their papers. Three sets of features were identified for the content and three for the form. All the three dimensions related to the content (Convenience, Effectiveness and Persuasiveness, and Sustainability and Responsibility) included at least one widely present category and some rare categories. The three for the form included one dimension (Packaging Visual Elements) based on the three most popular categories and two dimensions (Message Explicitness and Context Representation) that were infrequently used in the papers. This stresses that some triggers were overlooked with regard to the form-based communication of valuable elements to favor sustainable choices.
7. Conclusions
The paper offers insights into the state of research and open issues in the field of the evaluation and perception of sustainable products and services through ET. This area of research has started to be substantial, as demonstrated by the fact that more than 40 published contributions could be analyzed. It is worth noting that the set of examined contributions was limited by the authors’ focus on papers reporting AOIs. Therefore, the extent of this area of research is expectedly considerably larger, beyond the fact that authors’ aim to collect a comprehensive sample of papers could only be partially pursued.
While the application of ET in the field of sustainability is increasingly relevant, it is difficult to understand which strategies are more suitable to improve people’s perception of sustainable products. Research is fragmented, and the results shown in many studies apply to niche domains, if not to very specific products. The peculiarity of much research prevents a generalization of the results, as there is a lack of terms of comparison across multiple studies.
To address this issue, the main objective of this study was the creation of a framework of AOIs to be possibly considered in research on sustainable products and green consumption. By using the framework, it is indeed possible to compare results across multiple studies and possibly generalize some findings. While the scope of the paper was limited to the development of a framework, some of the examples below are possible ways of employing the provided outcomes:
- Understanding the number of cases where attention paid to specific categories of AOIs, e.g., eco-labels, enhances people’s preference towards sustainable products;
- Benefitting from all available studies to observe the effectiveness of gazing at direct and indirect forms of communication of sustainability-related properties of products, in line with [22];
- Studying the relative importance of gazing at “competitive” or “conflicting” features, e.g., cost vs. sustainability, in the formation of people’s preferences across a wide range of industrial sectors;
- Studying the cross influence of contents and forms in the attractiveness of AOIs;
- Introducing means to graphically represent time-dependent phenomena in ET studies across a variety of products, whose exigency is stressed in [88].
Clearly, many of the identified categories can also be used in product evaluation studies that do not directly involve sustainability. However, it has to be underlined that the presented categories of AOIs were extracted from research where sustainable aspects ranged among the objectives of papers.
The results achieved through the MCAs suggest future studies on user experience or green consumption using AOIs to pursue one of the following two strategies:
- If scholars aim to study a single phenomenon in depth, they should consider the determined clusters and include all the categories of AOIs related to that cluster;
- Scholars willing to study a variety of attributes are suggested select (at least) the main categories that emerged from each cluster.
These two strategies are thought to facilitate future comparisons among studies, which are expected to make their methods converge to generalizable results more than what has been conducted so far. It should be considered, however, that the analysis was performed on currently available papers, not on a theoretical basis. This means that the above strategies do not reflect qualitative hierarchies between the categories but rather a summary of the most popular choices defined in the literature.
Author Contributions
Conceptualization, Y.B., A.D. and D.B.; methodology, Y.B.; validation, L.M., D.B. and A.D.; formal analysis, Y.B.; investigation, Y.B. and L.M.; data curation, Y.B. and D.B.; writing—original draft preparation, Y.B. and L.M.; writing—review and editing, D.B. and A.D.; visualization, L.M.; supervision, Y.B. and D.B. All authors have read and agreed to the published version of the manuscript.
Funding
This research study received no external funding.
Data Availability Statement
Not applicable.
Conflicts of Interest
The authors declare no conflict of interest.
References
- Ceschin, F.; Gaziulusoy, I. Evolution of design for sustainability: From product design to design for system innovations and transitions. Des. Stud. 2016, 47, 118–163. [Google Scholar] [CrossRef]
- Maccioni, L.; Borgianni, Y.; Basso, D. Value perception of green products: An exploratory study combining conscious answers and unconscious behavioral aspects. Sustainability 2019, 11, 1226. [Google Scholar] [CrossRef] [Green Version]
- Szabo, S.; Webster, J. Perceived greenwashing: The effects of green marketing on environmental and product perceptions. J. Bus. Ethics 2021, 171, 719–739. [Google Scholar] [CrossRef]
- Maccioni, L.; Borgianni, Y.; Pigosso, D.C. Can the choice of eco-design principles affect products’ success? Des. Sci. 2019, 5, e25. [Google Scholar] [CrossRef] [Green Version]
- ISO 14024:1999; International Standards Organization [ISO]. Environmental Labels and Declarations—Type I Environmental Labelling—Principles and Procedures. ISO Central Secretariat: Genève, Switzerland, 1999.
- Waechter, S.; Sütterlin, B.; Siegrist, M. Desired and Undesired Effects of Energy Labels—An Eye-Tracking Study. PLoS ONE 2015, 10, e0134132. [Google Scholar] [CrossRef]
- Schmücker, D.; Kuhn, F.; Horster, E. Acquiring Sustainability Information in Holiday Travel. In Eye Tracking in Tourism; Springer: Cham, Switzerland, 2020; pp. 155–181. [Google Scholar] [CrossRef]
- Dong, X.; Liu, S.; Li, H.; Yang, Z.; Liang, S.; Deng, N. Love of nature as a mediator between connectedness to nature and sustainable consumption behavior. J. Clean. Prod. 2020, 242, 118451. [Google Scholar] [CrossRef]
- Skerlos, S.J. Promoting effectiveness in sustainable design. Procedia CIRP 2015, 29, 13–18. [Google Scholar] [CrossRef]
- Pagan, N.M.; Pagan, K.M.; Teixeira, A.A.; de Moura Engracia Giraldi, J.; Stefanelli, N.O.; de Oliveira, J.H.C. Application of neuroscience in the area of sustainability: Mapping the territory. Glob. J. Flex. Syst. Manag. 2020, 21, 61–77. [Google Scholar] [CrossRef]
- Lamberz, J.; Litfin, T.; Teckert, Ö.; Meeh-Bunse, G. How Does the Attitude to Sustainable Food Influence the Perception of Customers at the Point of Sale?-an Eye-Tracking Study. ENTRENOVA ENTerprise REsearch InNOVAtion 2019, 5, 402–409. [Google Scholar] [CrossRef] [Green Version]
- Song, L.; Lim, Y.; Chang, P.; Guo, Y.; Zhang, M.; Wang, X.; Yu, X.; Lehto, M.R.; Cai, H. Ecolabel’s role in informing sustainable consumption: A naturalistic decision making study using eye tracking glasses. J. Clean. Prod. 2019, 218, 685–695. [Google Scholar] [CrossRef]
- Smith, V. Eye Tracking Recycle Labels on Packaging: Are Attitudes and Behaviors a Predictor of Viewing Them? Master’s Thesis, Clemson University, Clemson, SC, USA, 2015. [Google Scholar]
- Guyader, H.; Aichagui, V.; Witell, L.; Ottosson, M. Closing the Green Gap: Understanding why Green Consumers Choose Brown Products. In Proceedings of the 4th Nordic Retail and Wholesale Conference, Stockholm, Sweden, 4–6 November 2014; pp. 1–4. [Google Scholar] [CrossRef]
- Lewandowska, A.; Borusiak, B.; Dierks, C.; Giungato, P.; Jerzyk, E.; Kurczewski, P.; Sobierajewicz, J.; Suh, S.; Witczak, J. Neuro-marketing Tools for Assessing the Communication Effectiveness of Life Cycle Based Environmental Labelling—Procedure and Methodology. In Designing Sustainable Technologies, Products and Policies; Springer: Cham, Switzerland, 2018; pp. 163–173. [Google Scholar] [CrossRef]
- Guyader, H.; Ottosson, M.; Witell, L. You can’t buy what you can’t see: Retailer practices to increase the green premium. J. Retail. Consum. Serv. 2017, 34, 319–325. [Google Scholar] [CrossRef]
- Pomarici, E.; Vecchio, R. Will sustainability shape the future wine market? Wine Econ. Policy 2019, 8, 1–4. [Google Scholar] [CrossRef]
- Wölfel, M.; Reinhardt, A. Immersive Shopping Presentation of Goods in Virtual Reality. In Proceedings of the CERC, Darmstadt, Germany, 29–30 March 2019; pp. 119–130. [Google Scholar]
- Pemberton, G. Sustainable Product Development in the Industrial Gas Sector. Master’s Thesis, University of Warwick, Warwick, RI, USA, 2019. [Google Scholar]
- Vreeburg, S. Boosting as an Intervention for Sustainable Consumer Behaviour. Master’s Thesis, Wageningen University and Research, Wageningen: The Nerherlands, 2020. [Google Scholar]
- Blascheck, T.; Kurzhals, K.; Raschke, M.; Burch, M.; Weiskopf, D.; Ertl, T. Visualization of eye tracking data: A taxonomy and survey. Comput. Graph. Forum 2017, 36, 260–284. [Google Scholar] [CrossRef]
- She, J.; MacDonald, E.F. Exploring the effects of a product’s sustainability triggers on pro-environmental decision-making. J. Mech. Des. 2018, 140, 011102. [Google Scholar] [CrossRef]
- Becattini, N.; Borgianni, Y.; Cascini, G.; Rotini, F. Investigating users’ reactions to surprising products. Des. Stud. 2020, 69, 100946. [Google Scholar] [CrossRef]
- Pérez-Belis, V.; Agost, M.J.; Vergara, M. Consumers’ Visual Attention and Emotional Perception of Sustainable Product Information: Case Study of Furniture. In Proceedings of the International Conference on Kansei Engineering & Emotion Research, Kuching, Malaysia, 19–22 March 2018; Springer: Singapore, 2018; pp. 239–248. [Google Scholar] [CrossRef]
- Mussgnug, M.; Waldern, M.F.; Meboldt, M. Mobile Eye Tracking in Usability Testing: Designers Analysing the User-Product Interaction. In Proceedings of the 20th International Conference on Engineering Design (ICED 15), Milan, Italy, 27–30 July 2015; pp. 349–358. [Google Scholar]
- Burlamaqui, L.; Dong, A. Eye Gaze Experiment into the Recognition of Intended Affordances. In Proceedings of the ASME 2017 International Design Engineering Technical Conferences and Computers and Information in Engineering Conference, Cleveland, OH, USA, 6–9 August 2017. [Google Scholar] [CrossRef]
- Berni, A.; Maccioni, L.; Borgianni, Y. Observing pictures and videos of creative products: An eye tracking study. Appl. Sci. 2020, 10, 1480. [Google Scholar] [CrossRef] [Green Version]
- Ares, G.; Giménez, A.N.A.; Bruzzone, F.; Vidal, L.; Antúnez, L.; Maiche, A. Consumer visual processing of food labels: Results from an eye-tracking study. J. Sens. Stud. 2013, 28, 138–153. [Google Scholar] [CrossRef]
- Kuo, J.Y.; Chen, C.H.; Koyama, S.; Chang, D. Investigating the relationship between users’ eye movements and perceived product attributes in design concept evaluation. Appl. Ergon. 2021, 94, 103393. [Google Scholar] [CrossRef]
- Rosbergen, E.; Pieters, R.; Wedel, M. Visual attention to advertising: A segment-level analysis. J. Consum. Res. 1997, 24, 305–314. [Google Scholar] [CrossRef] [Green Version]
- Du, P.; MacDonald, E.F. Eye-tracking data predict importance of product features and saliency of size change. J. Mech. Des. 2014, 136, 081005. [Google Scholar] [CrossRef]
- Rim, N.W.; Choe, K.W.; Scrivner, C.; Berman, M.G. Introducing Point-of-Interest as an alternative to Area-of-Interest for fixation duration analysis. PLoS ONE 2021, 16, e0250170. [Google Scholar] [CrossRef] [PubMed]
- Borgianni, Y.; Maccioni, L. Review of the use of neurophysiological and biometric measures in experimental design research. AI EDAM 2020, 34, 248–285. [Google Scholar] [CrossRef] [Green Version]
- Majerova, J.; Sroka, W.; Krizanova, A.; Gajanova, L.; Lazaroiu, G.; Nadanyiova, M. Sustainable brand management of alimentary goods. Sustainability 2020, 12, 556. [Google Scholar] [CrossRef] [Green Version]
- Sylcott, B.; Cagan, J.; Tabibnia, G. Understanding consumer tradeoffs between form and function through metaconjoint and cognitive neuroscience analyses. J. Mech. Des. 2013, 135, 101002. [Google Scholar] [CrossRef]
- Helmert, J.R.; Symmank, C.; Pannasch, S.; Rohm, H. Have an eye on the buckled cucumber: An eye tracking study on visually suboptimal foods. Food Qual. Prefer. 2017, 60, 40–47. [Google Scholar] [CrossRef]
- Laohakangvalvit, T.; Ohkura, M. Relationship between Physical Attributes of Spoon Designs and Eye Movements Caused by Kawaii Feelings. In Proceedings of the International Conference on Applied Human Factors and Ergonomics, Los Angeles, CA, USA, 17–21 July 2017; Springer: Cham, Switzerland, 2017; pp. 245–257. [Google Scholar] [CrossRef]
- Wan, Q.; Song, S.S.; Li, X.H.; Zhang, Q.; Yang, X.; Zhang, Y.C.; Fei, B.H.; Yao, L.H. The visual perception of the cardboard product using eye-tracking technology. Wood Res. 2018, 63, 165–178. [Google Scholar]
- Charness, N.; Reingold, E.M.; Pomplun, M.; Stampe, D.M. The perceptual aspect of skilled performance in chess: Evidence from eye movements. Mem. Cogn. 2001, 29, 1146–1152. [Google Scholar] [CrossRef]
- Huang, J.; Peng, Y.; Wan, X. The color-flavor incongruency effect in visual search for food labels: An eye-tracking study. Food Qual. Prefer. 2021, 88, 104078. [Google Scholar] [CrossRef]
- Borgianni, Y.; Maccioni, L.; Basso, D. Exploratory study on the perception of additively manufactured end-use products with specific questionnaires and eye-tracking. Int. J. Interact. Des. Manuf. 2019, 13, 743–759. [Google Scholar] [CrossRef]
- Abdi, H.; Williams, L.J. Principal component analysis. Wiley Interdiscip. Rev. Comput. Stat. 2010, 2, 433–459. [Google Scholar] [CrossRef]
- Parchomenko, A.; Nelen, D.; Gillabel, J.; Rechberger, H. Measuring the circular economy-A Multiple Correspondence Analysis of 63 metrics. J. Clean. Prod. 2019, 210, 200–216. [Google Scholar] [CrossRef]
- Satyro, W.C.; de Mesquita Spinola, M.; de Almeida, C.M.; Giannetti, B.F.; Sacomano, J.B.; Contador, J.C.; Contador, J.L. Sustainable industries: Production planning and control as an ally to implement strategy. J. Clean. Prod. 2021, 281, 124781. [Google Scholar] [CrossRef]
- Bazoche, P.; Poret, S. Acceptability of insects in animal feed: A survey of French consumers. J. Consum. Behav. 2021, 20, 251–270. [Google Scholar] [CrossRef]
- Ares, G.; Mawad, F.; Giménez, A.; Maiche, A. Influence of rational and intuitive thinking styles on food choice: Preliminary evidence from an eye-tracking study with yogurt labels. Food Qual. Prefer. 2014, 31, 28–37. [Google Scholar] [CrossRef]
- Behe, B.K.; Campbell, B.L.; Khachatryan, H.; Hall, C.R.; Dennis, J.H.; Huddleston, P.T.; Fernandez, R.T. Incorporating eye tracking technology and conjoint analysis to better understand the green industry consumer. HortScience 2014, 49, 1550–1557. [Google Scholar] [CrossRef]
- Bialkova, S.; van Trijp, H.C. An efficient methodology for assessing attention to and effect of nutrition information displayed front-of-pack. Food Qual. Prefer. 2011, 22, 592–601. [Google Scholar] [CrossRef]
- Brazil, W.; Caulfield, B. What makes an effective energy efficiency label? Assessing the performance of energy labels through eye-tracking experiments in Ireland. Energy Res. Soc. Sci. 2017, 29, 46–52. [Google Scholar] [CrossRef]
- Chae, S.W.; Lee, K.C. Exploring the effect of the human brand on consumers’ decision quality in online shopping: An eye-tracking approach. Online Inf. Rev. 2013, 37, 83–100. [Google Scholar] [CrossRef]
- Cortinas, M.; Cabeza, R.; Chocarro, R.; Villanueva, A. Attention to online channels across the path to purchase: An eye-tracking study. Electron. Commer. Res. Appl. 2019, 36, 100864. [Google Scholar] [CrossRef]
- David, J.V.; Ana, M.R.; Santiago, F.B.; Faustino, A.V. Aspects of industrial design and their implications for society. Case studies on the influence of packaging design and placement at the point of sale. Appl. Sci. 2021, 11, 517. [Google Scholar] [CrossRef]
- Drexler, D.; Fiala, J.; Havlíčková, A.; Potůčková, A.; Souček, M. The effect of organic food labels on consumer attention. J. Food Prod. Mark. 2018, 24, 441–455. [Google Scholar] [CrossRef]
- Du, P.; MacDonald, E.F. Products’ shared visual features do not cancel in consumer decisions. J. Mech. Des. 2015, 137, 071409. [Google Scholar] [CrossRef]
- Du, P.; MacDonald, E.F. A test of the rapid formation of design cues for product body shapes and features. J. Mech. Des. 2018, 140, 071102. [Google Scholar] [CrossRef] [Green Version]
- Fei, M.; Tan, H.; Peng, X.; Wang, Q.; Wang, L. Promoting or attenuating? An eye-tracking study on the role of social cues in e-commerce livestreaming. Decis. Support. Syst. 2021, 142, 113466. [Google Scholar] [CrossRef]
- Fu, H.; Manogaran, G.; Wu, K.; Cao, M.; Jiang, S.; Yang, A. Intelligent decision-making of online shopping behavior based on internet of things. Int. J. Inf. Manag. 2020, 50, 515–525. [Google Scholar] [CrossRef]
- Garcez de Oliveira Padilha, L.; Malek, L.; Umberger, W.J. Sustainable meat: Looking through the eyes of Australian consumers. Sustainability 2021, 13, 5398. [Google Scholar] [CrossRef]
- Georgakarakou, C.; Riskos, K.; Tsourvakas, G.; Yfantidou, I. What features of green products packaging are more eye catching? An eye-tracking exploratory study about organic agricultural products. Int. J. Technol. Mark. 2020, 14, 93–124. [Google Scholar] [CrossRef]
- Kim, M.A.; Yoo, H.J.; Ares, G.; Lee, H.S. Effect of thinking style and consumption purpose on food choice: A case study with yogurt using a discrete choice experiment and eye-tracking. Food Qual. Prefer. 2020, 86, 104025. [Google Scholar] [CrossRef]
- Lewis, K.E.; Grebitus, C.; Nayga Jr, R.M. The impact of brand and attention on consumers’ willingness to pay: Evidence from an eye tracking experiment. Can. J. Agric. Econ. Rev. Can. D’agroeconomie 2016, 64, 753–777. [Google Scholar] [CrossRef]
- Mañas-Viniegra, L.; González-Villa, I.A.; Llorente-Barroso, C. The corporate purpose of Spanish listed companies: Neurocommunication research applied to organizational intangibles. Front. Psychol. 2020, 11, 2108. [Google Scholar] [CrossRef]
- Maslowska, E.; Segijn, C.M.; Vakeel, K.A.; Viswanathan, V. How consumers attend to online reviews: An eye-tracking and network analysis approach. Int. J. Advert. 2020, 39, 282–306. [Google Scholar] [CrossRef] [Green Version]
- Mundel, J.; Huddleston, P.; Behe, B.; Sage, L.; Latona, C. An eye tracking study of minimally branded products: Hedonism and branding as predictors of purchase intentions. J. Prod. Brand Manag. 2018, 27, 146–157. [Google Scholar] [CrossRef]
- Oliveira, D.; Machín, L.; Deliza, R.; Rosenthal, A.; Walter, E.H.; Giménez, A.; Ares, G. Consumers’ attention to functional food labels: Insights from eye-tracking and change detection in a case study with probiotic milk. LWT Food Sci. Technol. 2016, 68, 160–167. [Google Scholar] [CrossRef]
- Orquin, J.L.; Bagger, M.P.; Lahm, E.S.; Grunert, K.G.; Scholderer, J. The visual ecology of product packaging and its effects on consumer attention. J. Bus. Res. 2020, 111, 187–195. [Google Scholar] [CrossRef]
- Piqueras-Fiszman, B.; Velasco, C.; Salgado-Montejo, A.; Spence, C. Using combined eye tracking and word association in order to assess novel packaging solutions: A case study involving jam jars. Food Qual. Prefer. 2013, 28, 328–338. [Google Scholar] [CrossRef]
- Popova, L.; Nonnemaker, J.; Taylor, N.; Bradfield, B.; Kim, A. Warning labels on sugar-sweetened beverages: An eye tracking approach. Am. J. Health Behav. 2019, 43, 406–419. [Google Scholar] [CrossRef]
- Rihn, A.; Khachatryan, H.; Campbell, B.; Hall, C.; Behe, B. Consumer preferences for organic production methods and origin promotions on ornamental plants: Evidence from eye-tracking experiments. Agric. Econ. 2016, 47, 599–608. [Google Scholar] [CrossRef]
- Rojas, J.C.; Contero, M.; Camba, J.D.; Castellanos, M.C.; García-González, E.; Gil-Macián, S. Design Perception: Combining Semantic Priming with Eye Tracking and Event-Related Potential (ERP) Techniques to Identify Salient Product Visual Attributes. In Proceedings of the ASME 2015 International Mechanical Engineering Congress and Exposition, Houston, TX, USA, 13–19 November 2015. V011T14A035. [Google Scholar] [CrossRef]
- Rojas, J.C.; Contero, M.; Bartomeu, N.; Guixeres, J. Using combined bipolar semantic scales and eye-tracking metrics to compare consumer perception of real and virtual bottles. Packag. Technol. Sci. 2015, 28, 1047–1056. [Google Scholar] [CrossRef]
- Samant, S.S.; Seo, H.S. Effects of label understanding level on consumers’ visual attention toward sustainability and process-related label claims found on chicken meat products. Food Qual. Prefer. 2016, 50, 48–56. [Google Scholar] [CrossRef]
- Sari, J.N.; Nugroho, L.E.; Santosa, P.I.; Ferdiana, R. The measurement of consumer interest and prediction of product selection in E-commerce using eye tracking method. Int. J. Intell. Eng. Syst. 2018, 11, 30–40. [Google Scholar] [CrossRef]
- Takahashi, R.; Todo, Y.; Funaki, Y. How can we motivate consumers to purchase certified forest coffee? Evidence from a laboratory randomized experiment using eye-trackers. Ecol. Econ. 2018, 150, 107–121. [Google Scholar] [CrossRef]
- Tórtora, G.; Machín, L.; Ares, G. Influence of nutritional warnings and other label features on consumers’ choice: Results from an eye-tracking study. Food Res. Int. 2019, 119, 605–611. [Google Scholar] [CrossRef] [PubMed]
- Van Loo, E.J.; Caputo, V.; Nayga Jr, R.M.; Seo, H.S.; Zhang, B.; Verbeke, W. Sustainability labels on coffee: Consumer preferences, willingness-to-pay and visual attention to attributes. Ecol. Econ. 2015, 118, 215–225. [Google Scholar] [CrossRef]
- Van Loo, E.J.; Nayga Jr, R.M.; Campbell, D.; Seo, H.S.; Verbeke, W. Using eye tracking to account for attribute non-attendance in choice experiments. Eur. Rev. Agric. Econ. 2018, 45, 333–365. [Google Scholar] [CrossRef]
- Van Loo, E.J.; Grebitus, C.; Verbeke, W. Effects of nutrition and sustainability claims on attention and choice: An eye-tracking study in the context of a choice experiment using granola bar concepts. Food Qual. Prefer. 2021, 90, 104100. [Google Scholar] [CrossRef]
- Wang, Q.; Ma, D.; Chen, H.; Ye, X.; Xu, Q. Effects of background complexity on consumer visual processing: An eye-tracking study. J. Bus. Res. 2020, 111, 270–280. [Google Scholar] [CrossRef]
- Wang, T.C.; Tseng, M.L.; Pan, H.W.; Hsiau, C.C.; Tang, T.W.; Tsai, C.L. The development of a sustainable wellness service marketing strategy in Taiwan based on consumer eye movements and preferences. J. Clean. Prod. 2021, 282, 124382. [Google Scholar] [CrossRef]
- Vigolo, V.; Sallaku, R.; Testa, F. Drivers and barriers to clean cooking: A systematic literature review from a consumer behavior perspective. Sustainability 2018, 10, 4322. [Google Scholar] [CrossRef] [Green Version]
- Sudaryanto, S.; Courvisanos, J.; Rosediana, I. Determinants of Purchase Intention During COVID-19: A Case Study of Skincare Products in East Java. Marketing 2022, 18, 181–194. [Google Scholar] [CrossRef]
- Falcão, D.; Roseira, C. Mapping the socially responsible consumption gap research: Review and future research agenda. Int. J. Consum. Stud. 2022. [Google Scholar] [CrossRef]
- Yan, R.N.; Hyllegard, K.H.; Blaesi, L.F. Marketing eco-fashion: The influence of brand name and message explicitness. J. Mark. Commun. 2012, 18, 151–168. [Google Scholar] [CrossRef]
- Bartels, D.M.; Johnson, E.J. Connecting cognition and consumer choice. Cognition 2015, 135, 47–51. [Google Scholar] [CrossRef] [PubMed]
- Salehi, S.; Sanayei, A.; Sammaknejad, N.; Kazemi, A. Application of eye-tracking in assessing the role of mediator variable (brand awareness) in the relation between packaging elements and customers’ choice. Int. J. Bus. Excell. 2021, 25, 1–20. [Google Scholar] [CrossRef]
- Johansson, G. Success factors for integration of ecodesign in product development: A review of state of the art. Environ. Manag. Health 2002, 13, 98–107. [Google Scholar] [CrossRef] [Green Version]
- Del Fatto, V.; Dignös, A.; Raimato, G.; Maccioni, L.; Borgianni, Y.; Gamper, J. Visual time period analysis: A multimedia analytics application for summarizing and analyzing eye-tracking experiments. Multimed. Tools Appl. 2019, 78, 32779–32804. [Google Scholar] [CrossRef]
Publisher’s Note: MDPI stays neutral with regard to jurisdictional claims in published maps and institutional affiliations. |
© 2022 by the authors. Licensee MDPI, Basel, Switzerland. This article is an open access article distributed under the terms and conditions of the Creative Commons Attribution (CC BY) license (https://creativecommons.org/licenses/by/4.0/).