Abstract
Climate change is currently one of agriculture’s main problems in achieving sustainability. It causes drought, increased rainfall, and increased diseases, causing a decrease in food production. In order to combat these problems, Agricultural Big Data contributes with tools that improve the understanding of complex, multivariate, and unpredictable agricultural ecosystems through the collection, storage, processing, and analysis of vast amounts of data from diverse heterogeneous sources. This research aims to discuss the advancement of technologies used in Agricultural Big Data architectures in the context of climate change. The study aims to highlight the tools used to process, analyze, and visualize the data, to discuss the use of the architectures in crop, water, climate, and soil management, and especially to analyze the context, whether it is in Resilience Mitigation or Adaptation. The PRISMA protocol guided the study, finding 33 relevant papers. However, despite advances in this line of research, few papers were found that mention architecture components, in addition to a lack of standards and the use of reference architectures that allow the proper development of Agricultural Big Data in the context of climate change.
1. Introduction
Climate change is currently harming the agricultural sector, causing sea-level rise that has encroached on the land as well as increased precipitation that has led to the extension of floodplains and the reduction in existing croplands [1]. On the other hand, rising temperatures have harmed crop production and sustainability nationally and globally [2]. According to Nguyen et al., warming trends will likely reduce agricultural production yields in the future unless there is a compelling adaptation [2].
Crop losses will increase due to rainfall variability, extreme heat, and flooding, causing resilience problems in arable areas. Furthermore, even high rainfall can hinder harvesting and reduce crop quality [3]. Therefore, an adaptation to resilience for agricultural systems should be a policy priority [2]. Furthermore, climate change scenarios suggest that warming will generally reduce the sustainability of major staple crops, such as maize and wheat, with higher-yield losses in tropical regions [4].
On the other hand are the growing demand for food and other problems the world faces, such as the ability to appropriate new lands, new waters, or new fishing grounds. Furthermore, in addition to the rapid transformation of the earth’s natural systems, climate change, associated with the increase in more extreme temperatures and precipitation, can alter the relations between crops, plagues, pathogens, and weeds, exacerbating several trends, such as reducing pollinating insects, increasing water shortages and ozone concentrations at ground level, and reducing fishing [4].
The pressures of the growing population and urbanization, which threaten food safety, have a more significant impact in the context of climate change [2]. In light of climate change, guaranteeing food for the global population is no easy task due to its enormous impact on agricultural production [5].
The research program of the Consultative Group on International Agricultural Research (CGIAR) [6] on climate change, agriculture, and food safety has proposed a framework with four interconnected areas of action for the reconfiguration of food systems: redirecting agricultural trajectories; increasing the resilience of all the agents involved in rapid change; minimizing the environmental footprint of food systems from the point of view of climate change; and realigning the facilitators of change [7]. Through this framework, some synergies between food safety, adaptation, and mitigation are feasible, called “climate-smart agriculture”, which is key to this food system transformation [7]. The primary goal is to generate actions in agriculture to sustainably increase productivity, improve resilience and adaptation, reduce or eliminate greenhouse gases, increase mitigation, and improve the achievement of international food safety objectives [4].
Because of these actions, it is necessary to analyze and better understand the complexities of multivariate and unpredictable agricultural ecosystems [8]. The emerging digital technologies mentioned, such as machine learning, the Internet of Things (IoT), and Big Data, contribute to this understanding through the pursuit and continuous measurement of various aspects of the physical surroundings, producing large amounts of data at an unprecedented rate [9]. This involves compiling, storing, processing, modeling, and analyzing enormous amounts of data from various heterogeneous sources [8].
The earth is a complex, dynamic system such as no one has ever studied before. Thus, the progress of Big Data in climate science has been slower than the success of Big Data in other fields, such as biology or advertising [8]. The slow progress has been a stumbling block since climatology has become one of the fields richest in data in terms of volume, speed, and variety [8]. Given that the earth is a vast dynamic system, the learning process is developing, and therefore, the understanding of its systems is not as advanced as in other fields that use Big Data [10]. Although observation methods originally collected climate data, and the readings had to be manually corroborated, now the data are increasingly younger. In most cases, the data are available in real-time [10]. The use of sensors and satellites has revolutionized the process of climate data collection and study, which is a significant contribution.
E. Hassani et al. [11] present some advances using Big Data to solve energy efficiency problems, smart agriculture, smart urban planning, weather forecasting, and natural disaster management. Agricultural Big Data addresses various analysis issues in smart agriculture, such as weather forecasting and monitoring crop plagues and animal diseases. Various algorithms, approaches, and diverse techniques are used [12].
Agricultural Big Data is still an area of development that can improve productivity in farming operations by using precision agriculture, data-based agriculture, smart agriculture, and predictive modeling [13], facilitating intelligent agricultural solutions from a climate point of view in the face of climate change and the effects of natural disasters [14].
One crucial challenge is the design of Big Data architectures, as this is not an easy task [15,16,17]. It will be even more complex to build architectures for Agricultural Big Data in the context of climate change [9,14]. A. del Pozo et al., propose a multidisciplinary approach, where agronomists, physiologists, molecular biologists, sociologists, economists, and other social scientists must contribute with specific tools to understand complex agricultural systems. This approach can be applied in the different regions of the world, where climate change threatens the future of sustainable agriculture in danger [18]. On the other hand, the dynamism and complexity of climate issues that entail an interdisciplinary approach and the interweaving of various disciplines must not be neglected. According to Sebestyen et al., a System of Systems is urgently required, called “climate computation” [19]. According to the authors, to resolve any of the challenges related to climate change, “it is essential to obtain and integrate knowledge in an entire series of systems that serve as the basis for the design of solutions that take the complex and uncertain nature of individual systems and their interrelations into account” [19].
In this sense, Agricultural Big Data in climate change is one of the critical answers to these needs. This research aims to discuss the advancement of technologies used in Agricultural Big Data architectures in the context of climate change. The study aims to highlight the tools used to process, analyze, and visualize the data, to discuss the use of the architectures in crop, water, climate, and soil management, and especially to analyze the context, whether it is in Resilience Mitigation or Adaptation. We provide a schema that summarizes the data, allowing researchers to decide which Big Data solution to use depending on climate change and agriculture issues. In addition, this document allows us to identify research gaps and opportunities in this area.
Consequently, it serves as a comprehensive basis and facilitator for future research. To this end, a Systematic Literature Review (SLR) was conducted, applying the PRISMA protocol [12]. As a result, a set of 33 articles explaining the use of Agricultural Big Data in the context of climate change were selected.
The paper presents the following sections. Section 2 describes the main characteristics of Agricultural Big Data and climate change in general terms. Section 3 details the methodology and results of the paper selection process. Section 4 discusses the main results of the study. Section 5 includes a discussion of the main challenges of Agricultural Big Data in the context of climate change. Section 6 explains the limitations of the study. Finally, Section 7 presents the conclusions, implications, and future research.
2. Background
2.1. Agricultural Big Data
Big Data is defined in four dimensions (four Vs). First, it refers to the enormous volume of generated, stored, and processed data. Second, it also refers to the high velocity of data transmission in interactions and the rates at which data are generated, collected, and exchanged. Third, it relates to the variety of data formats and structures (structured, semi-structured, and unstructured) that result from the heterogeneity of data sources [20]. Finally, the fourth dimension is veracity, which refers to the ability to validate the data quality used in the analyses.
Big Data analysis tools enable data scientists to discover correlations and patterns by analyzing massive quantities of data from different sources. In recent years, the science of Big Data has become an essential modern discipline for data analysis [21]. It is considered an amalgam of classic fields, such as statistics, artificial intelligence, mathematics, and informatics with its sub-disciplines, including database systems, ML, and distributed systems [22].
The Big Data Ecosystem handles the evolution of data and models and supports infrastructure throughout its life cycle; it is a whole set of components, or architecture, storing, processing, and visualizing data and delivering results to guide applications [23,24]. For example, the Framework Architecture of Big Data in Figure 1 includes data storage, information management, data processing, data analysis, and interface and visualization components.
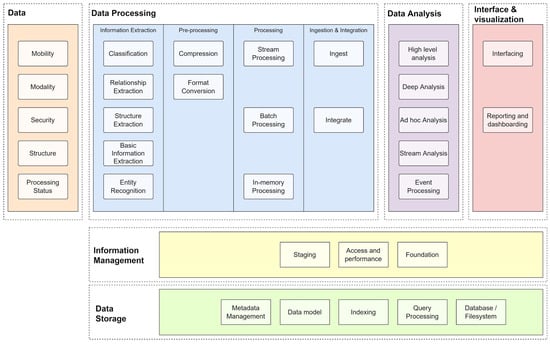
Figure 1.
The general architecture of Big Data.
As shown in Figure 1, the Big Data process starts with identifying the sources from which valuable data are extracted [25]. Next, the data are stored in one of the designed models, depending on whether the data are structured. In the following step, the data are classified and filtered according to the type of analysis required. In the Processing stage, it is defined whether it will be by Bath or Stream, in addition to the memory-based storage [26]. Next, the classified data are analyzed using appropriate tools, for example, DL [27], ad hoc analysis [28], and data science in general [29]. Next, the data obtained must be presented through some visualization tool. Finally, the data are analyzed by the decision-makers [24].
Big Data has been used to improve various aspects of agriculture, such as knowledge about weather and climate change, land, animal research, crops, soil, weeds, food availability and security, biodiversity, farmers’ decision making, farmers’ insurance and finance, and remote sensing [8]. It is also used to create platforms that allow the supply chain actors to access high-quality products and processes, tools to improve yields and predict demand, and advice and guidance for farmers based on the response capacity of their crops to fertilizers, leading to better fertilizer use.
2.2. Climate Change
Climate change is one of the most significant global challenges at present. It is defined as the significant changes in the mean values of weather elements, such as precipitation and temperature, which have been calculated for a long time [28]. Recent decades indicate that significant global climate changes resulted from increased human activities that altered the composition of the global atmosphere [29]. The concentrations of greenhouse gases, such as methane (CH4), carbon dioxide (CO2), and nitrous oxide (N2O), have increased by 150%, 40%, and 20%, respectively, since 1750 [30]. CO2 emissions, representing the maximum proportion of greenhouse gases, increased to 36,140 million metric tons in 2014 from 22,150 million metric tons in 1990. The mean global temperature has increased at an average rate of 0.15–0.20 °C per decade since 1975, and for 2021, between 1.4 and 5.8 °C. Greenhouse gas (GHG) emissions, mainly CO2 from fossil-fuel combustion as well as GHG not related to CO2, such as N2O, CH4, and CFC, contribute to global warming [5].
In the 21st century, climate change will become a severe problem, and both developed and developing countries will face negative externalities [5]. Agriculture is the sector most vulnerable to climate change due to its enormous size and sensitivity to weather parameters, which has an enormous economic impact [5]. The changes in climate phenomena, such as temperature and precipitation, significantly affect crop yields and sustainability. The effect of increasing temperatures, varying precipitation, and CO2 fertilization varies by crop, location, and magnitude of parameter change.
According to the influence of climate variables, crop productivity depends on several variables: crop type and its ability to adapt, the climate scenario, and the effect of fertilization with CO2 [31].
Nguyen et al., studied the effects of climate change perceived by farmers in different countries [2]. The authors report effects such as changes in precipitation patterns and atmospheric temperatures as being most frequently perceived by farmers in Asia. On the other hand, the authors indicate that farmers have noted a trend in increasing temperature and changes in precipitation. Some farmers perceive a decrease, whereas others show an increase in precipitation. In some places, the changes in precipitation have been described as more erratic, unpredictable, and untimely. The authors conclude that farmers’ perceptions of climate change have been consistent with the scientific data observed. In addition, the expected impacts of climate change identified were frequent droughts and floods, cyclones, heat waves, droughts, cold snaps, and soil erosion [2].
According to Malhi, the increased intensity and frequency of precipitation also affects soil erosion and will have more adverse consequences if GHGs increase. Moreover, the precipitation anomalies have detrimental effects on agriculture, mainly in developing countries. In addition to affecting crop yields, they significantly influence crop surfaces [5].
The studies identified by Nguyen et al., showed that farmers had used different technologies to adjust their land-use options and management practices to climate change. The leading adaptation technologies are used for soil management, water management, crop management, and changes in land-use options [2]. Some examples of these technologies include crop residues, such as topsoil, minimization of plowing and reduction in tillage as soil conservation strategies, deep plowing during the rainy season, rainwater collection for use during the dry season, and others.
According to the Intergovernmental Panel on Climate Change [32], adaptation is adjusting to current or projected climate change and its consequences to minimize damage or take advantage of good opportunities. On the other hand, resilience is a process of recovery of the previous condition after facing any adverse effect or the adaptive, absorptive, and transformative capacity of a social unit, such as an individual community or state, to cope with any natural disaster. The resilience perspective is an understanding of the adaptive capacity of a system [33]. Adaptation in agriculture is crucial, as it is highly dependent on climate, and some farmers have already started to employ some strategies [2]. On the other hand, climate change mitigation means avoiding and reducing GHG emissions, which trap heat in the atmosphere, to prevent the planet from becoming extremely hot. The more we mitigate climate change now, the easier it will be to adapt to changes we can no longer avoid.
The potential of Big Data can be a crucial approach to managing the adverse effect of climate change globally, as it enables the development of context-specific adaptation strategies to improve resilience to climate change and appropriate analytics to assist with mitigation [33]. With Big Data, it is possible to display information regarding upcoming problems, current ones, and the stages of recovery from the adverse effect of climate change. On the other hand, it is a tool for policymakers, managers, and stakeholders to take necessary actions during and after a disaster, such as an early warning system, weather forecasting, emergency evacuation, immediate responses, and aid distribution [33].
To maximize the benefit of Big Data applied to climate change, the authors conclude that there are still challenges to solve, such as data collection, architecture design, ethical and political anomalies, poor team coordination, privacy, and accuracy. They recommend implementing adequate infrastructure, technologies, tools, and knowledge to ensure the proper use of Big Data in climate change [33].
3. Methodology
The research method used for this paper was SLR. For selecting articles, the PRISMA (Preferred Reporting Items for Systematic Reviews and Meta-Analysis) method was applied, containing four stages: identification, screening, eligibility, and inclusion [12]. To define the objectives and research questions (RQs), we used the methodology proposed by Kitchenham and Charters [34]. The analysis stems from a series of RQs, such as: (1) What kind of problems are solved using Agricultural Big Data in the context of climate change; (2) which components are used in Agricultural Big Data architectures; (3) what technological tools are used to implement Agricultural Big Data architecture; and (4) what are the challenges and trends to implement Agricultural Big Data?
The search string was constructed as follows: (a) From the RQs, we obtained keywords; and (b) we applied the population–intervention–comparison–results–context criterion to frame the RQs (PICOC [33]) criterion. According to Kitchenham and Charters [33], the population corresponds to an application area: Agricultural Big Data. On the other hand, the intervention deals with climate change in agriculture. In our case, it is not appropriate to apply the comparison. The results are the identified problems, the corresponding solutions, and the technologies used to implement Agricultural Big Data.
Moreover, we accessed Scopus, Springer, ACM, IEEE, MDPI, and Web of Science. The search strings used in all data sources were “Big Data”, “climate change”, OR “climate-change”, AND “agriculture OR farm”. In order to include all relevant studies, a second search string was used, which included the keywords “global-change” OR “Land use change” OR Drought AND “Big Data” AND “farm OR agriculture”. We looked for these strings in the articles’ titles, keywords, and abstracts. In addition, we considered only scientific articles and conferences published in English from 2015 to 2021.
We identified 5108 potential articles in ACM, 1000 in Springer, 357 in the Web of Science database, 38 in IEEE, and 2 in MDPI. In addition, we excluded books, book chapters, working papers, and press articles. This final selection resulted in 33 relevant articles.
In the identification phase, 6505 articles were examined. This examination was followed by a screening where the duplication criterion was applied. This screening resulted in 5842 identified articles. The abstracts of these articles were then reviewed, and we checked whether or not they contained the nexus between agriculture, Big Data, and climate change. After eliminating the non-relevant articles, 356 articles remained for detailed analysis. This analysis reviewed the entire article to ensure that it included a description of the Agricultural Big Data process and climate change. Most of the excluded articles had theoretical, technological, or experimental issues. In addition, some excluded articles poorly discussed the nexus between agriculture, Big Data, and climate change. Finally, the SLR was based on 33 relevant articles. Figure 2 summarizes the steps for relevant article selection, and Figure 3 presents the selected papers by year.
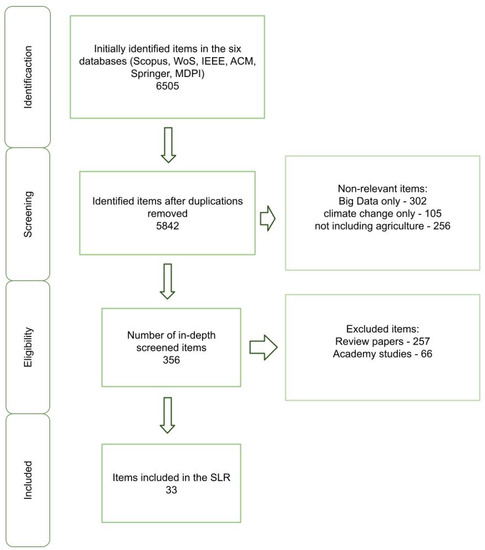
Figure 2.
The Selection process of relevant papers.

Figure 3.
Results by year.
4. Results
4.1. Agricultural Big Data in the Context of Climate Change
This section describes the proposals to solve problems that farmers face in water management, climate management, crop management, and soil management. The issues have been ordered according to the type of action declared by the IPCC. Figure 3 shows the number of papers contributing to Agricultural Big Data systems in the context of climate change for each type of problem identified. Thus, 15 people present a solution for crop management, and adaptation is the action carried out. On the other hand, only one paper presents a Big Data solution for soil management, and the action is resilience.
The following sub-sections present a summary of the proposals.
On the other hand, it is observed that, since 2015, the concern about adaptation has been constant. The same does not occur with mitigation. Therefore, it should be a concern in research topics. In the case of resilience, many adaptation proposals help in this regard.
The following subsections present a summary of the proposals.
4.1.1. Big Data for Water Management
- (a)
- Adaptation: According to Figure 4, five papers selected describe actions for Adaptation in water management. In Coro et al., they use greenhouse effect data flows from a Big Data system that comes from data collections from AquaMaps and NASA. They also use environmental parameters processed through a computation platform in the cloud to generate intermediate scenarios and new informative parameters to show climate change patterns in 10 marine areas. The authors conclude that the Mediterranean Sea may have an independent response to climate change compared to other areas, affecting fishing and other inputs [35]. Senay et al., use Landsat and meteorological Big Data to quantify and understand the relative importance of water management and climate variability on crops. They also use this data to make decisions in water management, hydrological processes, and economic transactions [36].
 Figure 4. Map of selected papers by type of problem vs. IPCC action.
Alencar et al., describe the decision-making support tools the private sector has developed in close collaboration with all levels of government, including hydrographic river basin management authorities that provide environmental data. For example, the cumulative effects on water could be seen as reducing flow rates in a concrete river due to climate change and the irrigation and extraction of municipal and industrial water. Generally, Big Data linked the analytical capabilities to help promote a paradigm change in the modeling, analyzing, and managing of hydrographic river basins. As a result, solutions shift from reactive to proactive [37].
On the other hand, Kandekar et al., conclude that the change in surface water resources is of great importance for climate change and developing agriculture in the semi-arid region. The authors use a cloud-based platform that processes data and geoscience analysis. Google Earth Engine (GEE) supports the processing of remote-sensing images with many excellent algorithms for remote-sensing image processing. From the Big Data system, vector data on the water mass are obtained, which provide a base for the later extraction of hydrological elements [38].
Finally, Reddy and Sureshbabu test an early-prediction Big Data system for precipitation. Farmers who live in regions prone to natural disasters such as floods use the system to make decisions in managing their crops and water, producing high levels of benefits and production for these farmers [39].
4.1.2. Big Data for Climate Management
- (a)
- Mitigation: Seven papers selected describe actions of Adaptation, Mitigation, and Resilience in climate management. For Mitigation, the work by Semlali et al., uses Big Data to analyze harmful gas emissions and monitor air quality using remote-sensing techniques [40]. Ma and Nie develop an innovative weather service model based on Big Data that includes collaborating resources, techniques, and services to optimize weather forecast processes, helping farmers in decision making [41].
- (b)
- Resilience: For the case of Resilience, Mousannif and Zahir look for solutions to quantify the impact of climate change on farmers’ quality of life to reinforce climate resistance and improve farmers’ livelihoods. They applied advanced data analyses to provide a deep understanding of the interrelated climate, environmental, social, cultural, economic, institutional, and political factors that exacerbate the differentiated impacts of climate change. As a result, the system can decide about irrigation, crop types, and actions to improve crop production to make the most vulnerable communities more resistant to climate change [42]. In addition, Li and Liao develop a Big Data platform for early warning of agricultural weather disasters, including floods, droughts, warm and dry winds, low temperatures, typhoons, hail, and continuous rain [43].
- (c)
- Adaptation: For the case of Adaptation, Jain and Jain explore several application domains that could benefit from weather forecasting using Big Data analyses, in addition to the challenges to be faced when taking advantage of the weather forecast in these domains [44]. On the other hand, Gad and Manjunatha develop a climate data storage model for Big Data to identify climate patterns useful for agricultural fields, climate change studies, and contingency plans in extreme climate conditions [45]. Mangal and Rajesh develop a Big Data framework to anticipate the potential effects of many climate scenes, including the social, economic, and geographic diversity of the parties involved and the long-term time horizons and irreversible effects [46].
4.1.3. Big Data for Crop Management
- (a)
- Adaptation: Fifteen papers contribute with actions in Adaptation. First, Gulzar et al., determine the optimal health of crops and analyze the impact of climate change on food safety. The authors use a taxonomy to provide recommendations [47]. Second, Delgado et al., develop a WebGIS framework to connect generators of specific local data from crop sites, called smart farms, to a regional and global view of agriculture. They use artificial intelligence, IoT, drones, robots, and Big Data as the foundation for a global “Digital Twin” that contributes to developing specific conservation and management of crop sites [48]. Third, Lopez et al., propose a strategy of merging multi-domain data to support data analysis tasks in agricultural contexts because many crops will no longer adapt to the conditions of a specific territory [49]. Finally, Manogaran and Lopez offer a climate change detection algorithm based on spatial autocorrelation to control changes in the seasonal climate to prevent diseases.
On the other hand, Fenu and Malloci use Big Data Analytics and Machine Learning to identify potato late blight, considered one of the most devastating diseases anywhere. They use weather parameters provided by ARPAS weather stations [12]. Alex and Kanavalli use Big Data to measure the agricultural field’s harvest growth, which helps predict weather events and is also used to calculate the resources sufficient for the crop in the climate change context [50]. Lockers et al., develop an infrastructure that enables efficient discovery and unified consultation of agriculture and forest resources using data connected through semantic technologies. The Big Data system allows it to process, structure semantically, and consult metadata [51]. Tseng et al., and Lambrinos use IoT and Agricultural Big Data to monitor the environmental factors on a farm [52,53]. In Moon et al., they use Big Data to extract the information from each tiny region, such as the types of crops present, the types of food crops, fruit types, the types of medicinal crops, vegetable types, and the changing trends in the amount of production of each crop, to increase the future benefits of agricultural households by providing information [54].
Several authors use satellite remote sensing. For example, Lu follows the growth rate and characteristics of the crop, collecting customized data on the lands to indicate where and how to plant [55]. Sarvia et al., propose a service based on free remote-sensing data to support the strategies of insurance companies. The service integrates MODIS and Sentinel-2 data to describe the mean trends of crop yields at the regional level [56]. Finally, ye et al., design a Big Data RDCRMG architecture to monitor dryness [57].
4.1.4. Big Data for Soil Management
- (a)
- Adaptation: For the case of the Adaptation, Bestelmeyer et al., develop Big Data to analyze landscapes, using temporal data sets in a grid or at a regional level together with local information on changes in the pastures that grow on the farms. They discover that there are places where the pastures have decreased, leading to livestock problems [58]. Hu et al., use Big Data to include the recent historical changes in land cover and its interrelations with environmental processes to better support the land-use management strategies in climate change [59].
- (b)
- Mitigation: For the case of Mitigation, Fernándes_Getino et al., use Big Data to analyze the connectivity values associated with healthy ecosystems and with high levels of biodiversity, which can ensure better soil protection, favoring sustainability, implying sustainability, and a more significant C sequestration potential in the soil. Furthermore, they use vulnerability and risk maps to identify the areas most prone to habitat degradation and fragmentation [60]. On the other hand, Kamilaris et al., develop the software AgriBigCAT, which uses geophysical information, geospatial analysis, and Big Data analysis to evaluate the impact of the agricultural livestock sector on the environment by examining possible contamination of the land, water, and air due to manure [61].
- (c)
- Resilience: Concerning Resilience, Li et al., examine the land-based ecological and environmental change through analyses of change trends of land cover and the normalized difference vegetation index. The authors indicate that ecological restoration is undergoing ever-greater challenges due to increasing human activities and the fragile environment [62].
4.2. Agricultural Big Data Architectures
Nine selected papers describe the Agricultural Big Data architecture structure, technical characteristics, and tools used.
A summary of these is presented below.
- (a)
- Climate-Smart Agriculture Architecture: The architecture presented by Lopez et al., is based on a previous architecture designed by the authors for smart agriculture, which allows the detection of favorable conditions for planting and crop production in the Cauca River basin. The updated architecture fuses and analyzes data from different dimensions in climate-smart agriculture (CSA) contexts, applying Big Data, Data Mining, and Machine Learning methods. They apply different algorithms for the fusion process [49]. Figure 5 represents the components considered in the four-layer architecture.
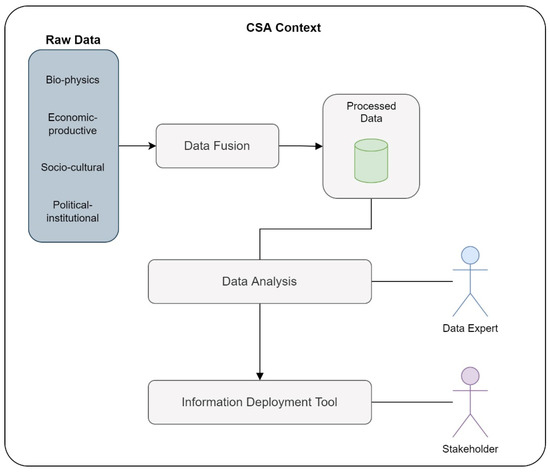 Figure 5. CSA architectural representation.
The architecture of Figure 5 is complemented by the structure of a Data Lake, as presented in Figure 6. The Data Lake enables data ingestion, storage, transformation, processing, and governance processes.
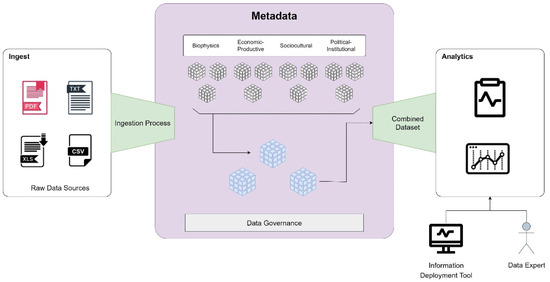
Figure 6.
Data Lake is used by CSA.
- (b)
- Big Data Architecture for Atmospheric Composition Monitoring: Semlali et al., propose a six-layer Big Data architecture: data source layer, ingest layer, Hadoop storage, management, infrastructure, security, and monitoring layer. Big Data enables the processing of pollutant gas emissions data from various sources, such as industry, transportation, and agriculture. In addition, the system continuously monitors atmospheric composition through remote-sensing techniques, providing satellite data on a global scale [40]. Figure 7 represents the proposed architecture.
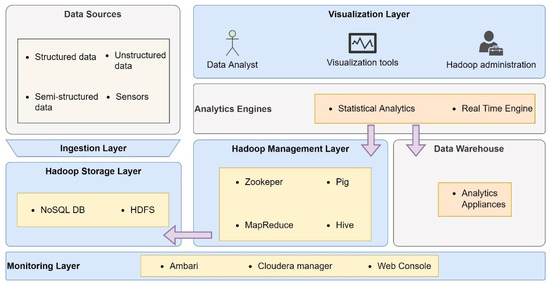 Figure 7. Proposed Big Data Architecture for Atmospheric Composition Monitoring.
In this architecture, a MySQL database stores the processed data from various sources. Then, they use Java, Python, and BASH scripts to read the raw data stored in Hadoop for the ingest process. Figure 8 represents the data flow.

Figure 8.
Ingest process for Big Data atmospheric composition monitoring system.
- (c)
- DSS LANDS Architecture for Forecasting Crop Disease: Fenu and Malloci develop a prototype agricultural DSS in collaboration with Lahore Sardinia Agency [12]. The DSS is designed to help Laore technicians and Sardinian farmers in decision making. The purposes of LANDS are: (1) To optimize resource management by reducing specific inputs, for example, chemical and natural resources, etc.; (2) to predict crop risk situations (for example, diseases, weather alerts, etc.); (3) to increase the quality of decisions for field management; and (4) to reduce environmental impact and production costs. To address the objectives, LANDS is divided into three steps: (1) collects, organizes, and integrates a large amount of data from different sources; (2) analyzes and interprets the information; and (3) uses the analysis to recommend the best action to take. The authors structure the DSS LANDS into three components: (1) an integrated system for monitoring the crop components and storing their data; (2) a data analysis modules system that performs through several mathematical and forecasting models and dynamic analysis of different types of data; (3) a cross-platform application used by farmers to upload crop data collected during the field survey and to visualize the up-to-date information for managing the cultivation. Figure 9 shows the DSS LANDS Architecture for Forecasting Crop Disease.
 Figure 9. DSS LANDS Architecture for Forecasting Crop Disease.
 - (d)
- Big Data Architecture for Crop Yield Prediction: In Alex et al., they use a Big Data architecture to predict crop health risks due to excess fertilizer use based on average rainfall, soil moisture, and soil nutrients, among others [50]. The data they use for this are nitrogen, phosphorus, Calcium, Magnesium, and Sulfur. The Big Data architecture contemplates the following stages: data enrichment, data clustering, data classification, and recommendations. Figure 10 represents the architectural design.
 Figure 10. Big Data Architecture for Crop Yield Prediction and fertilizer management.
 - (e)
- Climate Big Data Architecture: Gad et al., integrate technologies in data warehousing with Big Data to process NCDC weather data. Climate observations are taken daily or hourly, although the collection of temperature and precipitation, wind speed, wind direction, sunshine hours, and dew condensation were initiated in 1901 and are published annually, monthly, daily, and hourly [45]. The architecture used is presented in Figure 11.
 Figure 11. Climate Big Data Architecture.
 - (f)
- Big Data Architecture and IoT: Lambrinos uses a Big Data architecture to integrate climate and water data through IoT technology [53]. The system allows the farmer to adapt to weather conditions and assess new conditions due to climate change (See Figure 12).
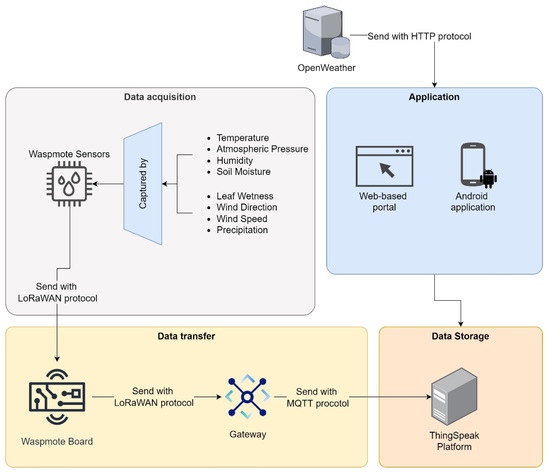 Figure 12. Big Data Architecture and the IoT.
 - (g)
- Big Data Architecture for Climate Change Detection: Manogaran and Lopez present a scalable data processing framework with a novel change detection algorithm [63]. They propose the spatial cumulative sum algorithm to monitor seasonal changes in climate data. The MapReduce algorithm is used to create a table in Apache HBase with the help of Apache Hive. Finally, the authors propose a climate change detection algorithm based on spatial autocorrelation to monitor changes in a seasonal climate. The Big Data architecture used is shown in Figure 13.
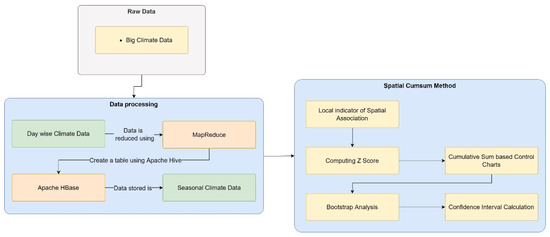 Figure 13. Proposed Big Data Architecture for Climate Change Detection.
 - (h)
- Big Data Architecture for Monitoring Vegetation Dryness: Ye et al., develop an RDCRMG architecture for monitoring remotely sensed dryness. The authors use spectral reflectance to improve monitoring accuracy by comparing R-NDVI and O-NDVI percentage H-information data [57]. The Big Data architecture is shown in Figure 14; it includes the data storage layer, network transport layer, computing service layer, and application layer. A computing cluster with five computers was established for parallel data mining and processing in the computing service layer. In addition, an RSAPTS automatic data pre-processing system is available to support near real-time updating of GF-1 Remote Sensing data. It includes automatic radiometric correction, orthorectification, cloud detection, geometric correction, and projection transformation.
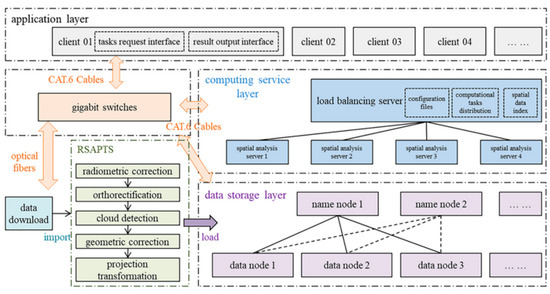 Figure 14. Big Data Architecture to Monitor Dryness [57].
The authors use three nodes with different algorithms to make the data extraction process fast. Figure 15 shows the processes.

Figure 15.
Process of Three Modes for data extraction [57].
- (i)
- Big Data Architecture for Vegetation Monitoring: Sumalatha and Akila propose an architecture to analyze the land data and build a regression-based model that fits the observations [64]. The data is obtained daily from satellite imagery and historical data through the government portal “indiawaterportal.org”. The designed architecture is four-layered, as shown in Figure 16.
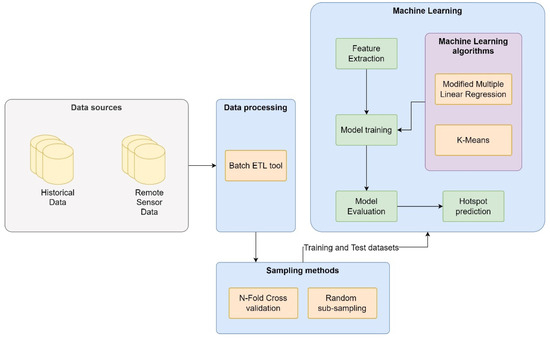 Figure 16. Big Data Architecture for Vegetation Monitoring.
 - (j)
- Architecture for Monitoring the Ocean: In Coro et al., they use a three-layer architecture to analyze data from Aqua-Maps and NASA archives. In the data preparation layer, six-time environmental parameters from AquaMaps are processed to produce a structured and standard representation as NetCDF files by R-based algorithms using a Map-Reduce approach via DataMiner. Next, two additional parameters are used in the processing layer as the differences between the annual average near-surface air temperature and sea surface temperature (SAT-SST). Finally, the data analysis layer represents ocean areas to reflect global average climate change trends [35].
4.2.1. Technologies Used
The technologies used for implementing Agricultural Big Data in climate change are presented in Figure 17. The Figure is a concept cloud where the size of each concept is directly related to the number of times it was used in the analyzed articles. In the 33 articles reviewed, the technology most often identified was MapReduce (six times). Other prominent technologies are Hadoop ecosystem technologies, such as HDFS and Hive, but they also mention FLUME, Storm, Hbase, and Kafka. They mostly use MySQL to store structured data, but Oracle is also mentioned. For unstructured data, they use No-SQL databases.
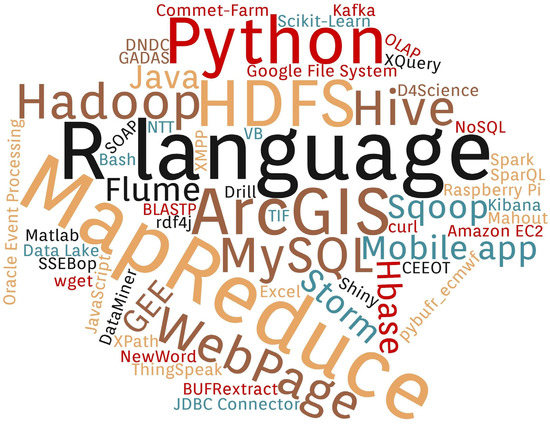
Figure 17.
Technologies used in Agricultural Big Data in the context of climate change.
Python, JAVA, and JavaScript are mentioned in terms of programming languages. Furthermore, of the formats used, XMPP and NetCDF are mentioned. The following subsections describe the technologies used in the Big Data architecture.
4.2.2. Data Sources
We identified several sources of data, which we describe below.
For crop management, data from weather stations, agroforestry resources, sensors, remote-sensing images, GPS positioning, satellite information engines such as Google Earth, and external private/public data providers were used [47,55]. For such action, in some cases, as in Colombia, local data systems such as AVA CDKN, CVC, IDEAM, Agronet MinAgriculture, Open Data Colombia MinTIC, SAC, FAO, DANE, and DNP were used [49]. Each data source provides temperature, humidity, illumination, atmospheric pressure, soil electrical conductivity, soil and vegetation moisture content, and soil salinity [52]. On the other hand, genomic data related to flood tolerance were found [65].
In Moon et al., the data were provided by non-standard technological actors, such as the Agricultural Technology Center, Jeollanamdo Institute of Agricultural Technology, and Jeju Island Institute of Agricultural Technology, mainly linked to the Rural Development Administration [54].
For the case of water management, the most frequently used data sources were satellites, which provide historical information on temperature, humidity, and precipitation levels. On the other hand, annual reports from institutions such as the Water Department were also used over the years [36]. Other data were mainly provided by federal, provincial, and municipal authorities (governments in general) as well as commercial and research organizations [37]. The Google Earth Engine data catalog is also a viable alternative, as well as climate data from Meteorological Departments [39].
In the case of climate management, a fairly widely used option was satellite remote sensing [40] and data from meteorological services. Another natural source of data was provided by government ministries, communities, and farmers [66]. In one of the cases, interviews and surveys were also applied to experts to obtain information for the analysis [41].
Data from soil maps, remote-sensing image data, meteorological centers, and statistical data from various stakeholders were used [43]. Similarly, some data came from geophysical information from various sources and satellite imagery [64]. Some of the attributes used in the data sources were precipitation, temperature (minimum, maximum, and average), cloudiness, vapor pressure, frequency of wet days, and ground frost [64].
4.2.3. Data Storage and Processing
The most used storage tools were Hadoop and MySQL. Hadoop, specifically HDFS, is used when it is required to store unstructured data, such as satellite images, videos, and spatial data, among others. MySQL is a relational database engine that allows the storing of structured data, such as project data, sensor data, data from other databases, etc. It is also noted that the most used processing tools were Map-Reduce, Flume, and Python. Map-Reduce allows mapping and reduces memory space to generate a higher processing speed. Flume is responsible for collecting, aggregating, and moving volumes of data from various sources. Python is a programming language that allows data processing according to specific needs.
Coro et al., used R-based algorithms in conjunction with Map-Reduce to transform textual data into NetCDF files [34]. The authors had to extract metadata from AquaMaps reference files, e.g., size, description, data provider, etc., and then make the metadata conform to NetCDF (Network Common Data Form) conventions. On the other hand, Lopez et al., used Hadoop tools, such as HDFS, Sqoop, Flume, and Kafka, to store and process the data in a Data Lake, which allows the storing of raw, semi-processed, and processed data in different storage areas [49]. A similar case is that of Gad et al., in which they used Hadoop technologies to process and store data from a data warehouse. SQOOP they used to extract data from RDBMS (in this case, Mysql and Oracle) in Hadoop; Hive to create, join, and partition tables and databases in Hadoop, in addition to performing aggregation operations; and they used SQOOP to export the results of data warehouse aggregation [45].
On the other hand, besides Hadoop technology, Bendre et al., used cloud technology, such as Amazon Elastic Computing Cloud (EC2) and Google File System, to achieve parallel and distributed processing. The authors used Map-Reduce to process data that are not stored in memory to be stored in Hadoop [67]. Manogaran et al. [63], Lopez et al. [49], and Reddy and Sureshbabu [39] also used Map-Reduce to process the data and then stored the data in Hadoop. They used Apache Hbase and Apache Hive [39,63].
Somali et al., processed data from ground and satellite sensors to capture data from the sun and repositories such as MDEO, NASA, NOAA, ESA, and some MGS. At this stage, the Big Data technologies used were Raspberry Pi, BUFRextract (Python), pybufr_ecmwf (python), and wget, curl; and as data repositories, the MySQL database engine for structured data, Hadoop HDFS for unstructured data. In addition, processing algorithms developed in Java, Python, and Bash processes were used [40].
4.2.4. Data Analysis
For data analysis, the most used analysis tools were R language, Python, Storm, and ArcGIS. R is a language widely used in statistics and data mining. Python is a general programming language, but it efficiently allows data analysis thanks to its functions and ease of use. Storm offers enormous features for situations requiring real-time analysis, machine learning, and continuous operations monitoring. Finally, ArcGIS is a tool for geospatial data analysis.
Various data analysis tools are described in the papers. For example, Coro et al., used the DataMiner tool to analyze ocean data [35]. Delgado et al., used the DNDC, Comment-Farm, CEEOT, and NTT tools to analyze agricultural data [48]. Li et al., used ArcGIS, MATLAB, and Excel tools to analyze land cover data [43]. Senay et al., used the SSEBop (Operational Simplified Surface Energy Balance) model to calculate total daily evapotranspiration and to analyze meteorological data [36]. Lokers et al., used rdf4j, SOAP, and SPARQL to perform agro-environmental analysis [51]. The authors developed an infrastructure based on available metadata and semantics to process data and integrate them so that they can be downloaded in a format known as a NetCDF formatted file [51]. Finally, Gad et al., used OLAP (Online Analytical Processing) technology to analyze meteorological variables [45].
The R programming analysis tool was used in the works of [35,39,65,68].
On the other hand, the analysis tools that come from the Hadoop ecosystem were used in different papers. For example, Lopez et al., used HIVE, XPath, and XQuery [49]. On the other hand, Semlali et al., usde Map-Reduce with Spark and Storm [40]. Finally, Bendre et al., used Mahaut, Drill, and Storm [67].
Some authors used programming languages for data analysis. For example, this is the case for Fenu et al. [12] and Tseng et al. [52], who used Python. Javascript was used by Kandekar et al. [38].
4.2.5. Data Visualization
The most used tools were the websites developed by the institutions themselves. On the other hand, GEE, GADA, and D4Science platforms were also used.
Few papers mention the data visualization tools they used in the Big Data system. For example, Coro et al., used the D4Science tool, which provides services of a distributed e-Infrastructure that provides spaces for collaborative experimentation and the sharing of experimental parameters [35]. In addition, D4Science adds open-source and free-to-use web services to publish and access the results produced, either openly or tailored to a group of people focused on a domain, e.g., climate change.
Delgado et al., used GADAS, the United States Department of Agriculture’s Global Agriculture and Disaster Assessment System [48]. GADAS represents a first-generation system that could be the basis for a broader public–private partnership to connect agricultural data generators to an interconnected network for sustainability. It brings together various spatial data through a GIS to illustrate the impacts of climate, water, crop conditions, land use, etc., to provide a comprehensive assessment of agriculture. In this regard, the U.S. federal government recognizes the need to govern geospatial data from a global point of view.
Lopez et al., used the Shiny tool, which allows users to interact with the analytical system through an Information Display Tool, accessed from any computer or mobile device. The GUI implementation is independent of the development environment. Furthermore, shiny allows for direct compatibility with R language models and the easy visualization of such information [49].
Semlali et al., used Kibana, which is a customized dashboard that displays, respectively, the Vertical Mixing Ration (VMR) with the unit of Parts per Million or Billion (PPMv-PPBv) of Ozone (O3) and Carbon Monoxide (CO) to perform a pollution analysis [40].
Kandekar et al., used the Google Earth Engine (GEE), an open cloud platform developed by Google for geoscience data processing and analysis. It supports online programming and interactive visualization and can process remote-sensing data online without the need to download imagery. Moreover, its mighty computing power supports PB-level remote-sensing data processing, suitable for large-scale and long-term research series. In addition, the rich API documents of GEE absorb many superior remote-sensing image-processing algorithms, which are very friendly for people who focus on data processing rather than programming [38].
In Kamilaris et al., visualizations of datasets and geospatial analysis were performed using ArcGIS and its API for JavaScript. In ArcGIS, specific geospatial analysis scenarios are run through the platform in the form of maps. Datasets imported into ArcGIS are abstracted as layers, which become part of a large-scale geodatabase for spatiotemporal analysis. The layers can also be combined to gain insights into the locations of livestock farms and nitrate-vulnerable areas [61].
Finally, Alencar et al. [37], Tseng et al. [52], and Lambrinos [53] used a web platform for data visualization.
4.2.6. Artificial Intelligence Algorithms
It is striking that few authors used AI to perform data analysis. Fenu and Malloci [12] and Lu [55] used Neural Networks and SVM. On the other hand, a CNN was used by Alex and Kanavalli [50]. Linear regression and multiple linear regression were used by Bendre et al. [67], Sumalatha and Akila [64], and Reddy and Sureshbabu [39]. Modified random forest and SoyNet algorithms were used by Lai et al. [65]. K-means were also used by Sumalatha and Akila [64].
5. Discussion
5.1. Main Challenges and Trends
According to del Pozo et al., there is a wide range of technological approaches to improve the adaptation of crops and agricultural systems to climate change. However, technological demands and extension and training approaches must be further evaluated to understand technology’s role in adaptation [18]. In this sense, Agricultural Big Data is vital in developing climate change adaptation. Of the 33 papers selected, 26 used Big Data to adapt agriculture to the farmers’ needs, which can be through water, climate, soil, and crop management. Of the papers analyzed, 15 present crop management adaptations to monitor plant growth, disease prediction, quality monitoring, etc.
According to Sebestyen et al., data and systems science tools can be crucial in recognizing climate challenges and mitigation opportunities by integrating heterogeneous data and models and exploring the relationship between environmental and social factors. This integrated thinking lays the foundation for promising future trends in climate informatics [19]. For the case of Agricultural Big Data, few papers applied to mitigation situations. Two papers include architectures for minimizing climate risk situations due to GHGs and two for soil. We believe that using Big Data in this crucial area is still incipient.
Mitigating climate change impacts and successful adaptation require effective strategic climate change planning by countries worldwide, whose decision making requires complex models and information sources [19]. The Big Data toolkit enables the systematization, processing, and evaluation of heterogeneous data and information sources, which are infeasible with traditional analysis tools. Harmonizing the constant scientific knowledge and data sources related to climate change may be one of the most researched areas in the future [19]. Thirty-three papers using Big Data to analyze and adapt agriculture processes due to problems caused by climate change were reviewed. Despite the promising results, researchers still need more collaboration to have open access to data sources. Repositories are required to integrate information (Data Lake) and access for the different levels of researchers: farmer, data scientist, statistician, and the data processing engineer.
According to Lopez et al., intelligent tools for decision making represent an advantage in different fields, especially in agriculture. Although developing mechanisms to merge heterogeneous data sources involves a high degree of complexity, current technological advances make it possible to implement these tasks with more excellent reliability. Data Lakes represent a promising alternative in aspects such as flexibility, reusability, scalability, and access protocols. These aspects allow expert personnel to generate data analysis and update and reuse analytical models that support the information needs of different users [49]. However, only one paper of those analyzed (thirty-three in total) used a Data Lake as a data repository. Although Data Lakes have been successful in other projects, such as banks, retail, etc., in agriculture, it is a developing technology. This tool is crucial to achieving flexible architecture designs in Agricultural Big Data, adapting the data for analysis according to local and global needs in climate change.
Only 9 of the 33 papers were analyzed to describe the Big Data architecture design used. All the designs were created to solve specific problems, such as analysis of climate data or atmospheric composition, soil data such as dryness, and crop data analysis through sensors, among others. Only one architecture was designed to monitor climate change as a general concept. On the other hand, appropriate methodologies for designing Big Data architectures were not observed. According to Salma et al., a Big Data architecture should be designed using three possible cases: (1) Adopt a reference architecture, (2) follow an architectural design methodology, and (3) use a reference model (which is often created from a reference architecture) [69]. In this sense, a reference architecture in Agricultural Big Data could be used as a guide for the work team, with the possibility to analyze different configurations and thus improve the quality of the architectures. Using a reference architecture would make it possible to move forward with appropriate solutions to the problem of mitigating the effects of climate change.
Another important aspect is the opportunity for governments. According to Seles, Big Data can help governments develop intelligent regulations that drive proactive responses to climate change and improve organizational performance [70]. Moreover, farmers can leverage Agricultural Big Data and assess risks based on data to analyze the consequences of climate change on their environment [13]. In this sense, we have found few papers that include projects with government participation. Most used Big Data to solve problems from a market point of view and not from a people’s point of view. Furthermore, there is still a lack of open-access systems for farmers who need them, since the papers analyzed used self-developed visualization platforms. An example of an open-access system is GADAS, used by the public and private sectors.
The problems of climate change will increase, so the proper development of Agricultural Big Data will be essential if we want to move forward with practical solutions. For this technology to deliver what we need, it will be urgent to have open repositories, achieve interoperability between different systems, and design reference architectures, considering all the possibilities of data sources, processing, types of analysis, and visualization types. In this sense, it is necessary to make advances in modeling tools that allow flexibility. An example of this is the Feature Model and Ontologies [69,71,72].
After analyzing the various selected papers, we can identify the following challenges in designing architectures for Agricultural Big Data in the context of climate change:
- The use of various components and technologies shows that there are still no standards.
- Architecture designs are created for particular cases and do not allow scaling for other cases.
- Some architectures only take care of data volume, not variability and processing speed.
- No design in general, and therefore, no reference architectures, are available.
- The proposals do not point out the methodology for designing architectures.
- Finally, the use of reference models is not identified.
With all these challenges, it is difficult to identify the problems that can be solved versus the right components for designing a Big Data architecture for agriculture. Furthermore, none of the proposals use a general basis for their construction, starting from a reference architecture or model.
5.2. General Diagram
Figure 18 summarizes the main layers of the Agricultural Big Data architectures in the context of climate change. The figure shows that the Agricultural Big Data architectures were used for crop, climate, water, and soil management for the adaptation case. In addition, the architectures used components for data capture, processing, analysis, and visualization stages.
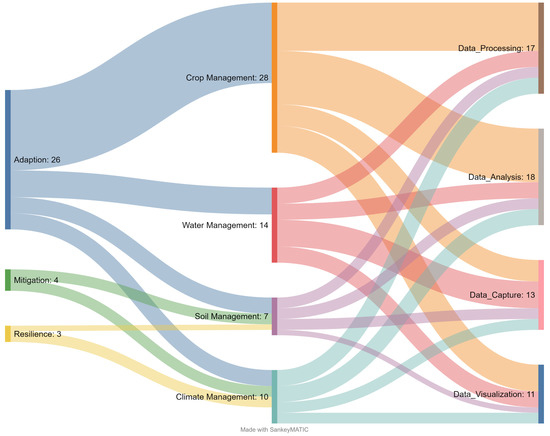
Figure 18.
Main layers of architectures in Agricultural Big Data in the context of climate change.
On the other hand, it is observed that Agricultural Big Data was only used for soil and climate management in the case of mitigation. Despite the incipient development of solutions for this action, papers described the components used in the architectures. Unfortunately, no papers were found describing solutions for energy efficiency or advancements in improving crop processes and improving sustainability.
6. Limitations of the Study
Although we aimed to provide a comprehensive literature review to contribute to the improvement of future proposals for Agricultural Big Data solutions in the context of climate change, some limitations should not be overlooked. The use of search engines to retrieve scientific articles and filtering the available literature through specific keywords have risks and must be treated carefully to draw valid conclusions. Furthermore, our approach reviewed English-language academic articles from 2015 without covering other languages. This approach led us to retrieve articles from various journals and conferences, most of academic origin.
However, filtering studies according to time of publication and English language could lead to chronological and geographical discriminations, respectively [73].
7. Conclusions, Implications and Future Research
A Systematic Literature Review was carried out, applying the PRISMA protocol. Thirty-three relevant articles explaining the use of Agricultural Big Data in the context of climate change were selected. The use of Big Data architectures for climate, water, crop, and soil management and the advancement of technologies used in the different layers of the architectures, which are data capture, processing, analysis, and visualization, were discussed.
In climate management, only five papers described the Big Data architecture used. The papers attempted to solve problems by analyzing pollutant gas emissions, analyzing favorable conditions for planting, and observing climate. The leading technologies used were MapReduce, Python, Machine Learning, Remote Sensing, Data Lake, MySQL, and Hadoop technologies such as Hbase and Hive.
In crop management, only four papers described the components of the Big Data architectures. The papers attempted to solve problems by risk analysis for the crop, plant disease analysis, crop analysis when there is drought, and soil monitoring. The primary technologies used were Sensors, Remote Sensing, Hadoop, Machine Learning, MapReduce, and R.
Many publications used Agricultural Big Data to systematically process heterogeneous information from sensors, satellite images, and climate change repositories, unfeasible with traditional analysis tools. Despite the advances in Agricultural Big Data related to climate change, there are still many challenges. Some of them are:
- Collaboration among researchers with open access to data sources;
- Repositories with access for different researchers (farmer, data scientist, statistician, and data processing engineer);
- Reference architectures that allow collaborative work;
- The analysis of solution alternatives;
- The documentation of experiences.
In future work, we hope to conduct an extensive literature review to identify the components necessary to design a reference architecture for Agricultural Big Data, especially in climate change.
Author Contributions
A.C. contributed to the organization and direction of the SRL and paper writing. A.B. contributed to the planning of the SRL, paper writing, and formatting. M.N. and P.G. contributed to the methodological support, expert judgement, and figures and tables. All authors have read and agreed to the published version of the manuscript.
Funding
Universidad de La Frontera, Project DI21-0020, funded this research.
Institutional Review Board Statement
Not applicable.
Informed Consent Statement
Not applicable.
Acknowledgments
The authors acknowledge the technical support provided by Sebastian Pardo. They also thank the Universidad Americana de Europa and its Doctoral Program in Computer Science.
Conflicts of Interest
The authors declare no conflict of interest.
References
- Zhang, X.; Cai, X. Climate change impacts on global agricultural land availability. Environ. Res. Lett. 2011, 6, 014014. [Google Scholar] [CrossRef]
- Nguyen, T.H.; Sahin, O.; Howes, M. Climate Change Adaptation Influences and Barriers Impacting the Asian Agricultural Industry. Sustainability 2021, 13, 7346. [Google Scholar] [CrossRef]
- Gaál, M.; Quiroga, S.; Fernandez-Haddad, Z. Potential impacts of climate change on agricultural land use suitability of the Hungarian counties. Reg. Environ. Chang. 2013, 14, 597–610. [Google Scholar] [CrossRef]
- Zougmoré, R.B.; Läderach, P.; Campbell, B.M. Transforming Food Systems in Africa under Climate Change Pressure: Role of Climate-Smart Agriculture. Sustainability 2021, 13, 4305. [Google Scholar] [CrossRef]
- Malhi, G.; Kaur, M.; Kaushik, P. Impact of Climate Change on Agriculture and Its Mitigation Strategies: A Review. Sustainability 2021, 13, 1318. [Google Scholar] [CrossRef]
- Byerlee, D.; Lynam, K.L. The Invention of the International Agricultural Research Center Model and the CGIAR System. World Dev. 2020, 135, 105080. [Google Scholar] [CrossRef]
- Steiner, A.; Aguilar, G.; Bomba, K.; Bonilla, J.P.; Campbell, A.; Echeverria, R. Actions to Transform Food Systems under Climate Change. 2020. Available online: https://ageconsearch.umn.edu/record/310920/files/CCAFS%20Actions%20to%20Transform%20Food%20Systems%20Under%20Climate%20Change.pdf (accessed on 22 May 2022).
- Kamilaris, A.; Kartakoullis, A.; Prenafeta-Boldú, F.X. A review on the practice of big data analysis in agriculture. Comput. Electron. Agric. 2017, 143, 23–37. [Google Scholar] [CrossRef]
- Cravero, A.; Pardo, S.; Sepúlveda, S.; Muñoz, L. Challenges to Use Machine Learning in Agricultural Big Data: A Systematic Literature Review. Agron. MDPI. 2022, 12, 748. [Google Scholar] [CrossRef]
- Mangal, P.; Rajesh, A.; Misra, R. Big data in climate change research: Opportunities and challenges. In Proceedings of the 2020 International Conference on Intelligent Engineering and Management (ICIEM), London, UK, 17–19 June 2020; pp. 321–326. [Google Scholar]
- Hassani, E.; Huang, H.; Silva, X. Big data and climate change. Big Data Cogn. Comput. 2019, 3, 12. [Google Scholar] [CrossRef] [Green Version]
- Fenu, G.; Malloci, F.M. An Application of Machine Learning Technique in Forecasting Crop Disease. In Proceedings of the 2019 3rd International Conference on Big Data Research, New Delhi, India, 20–23 December 2014; Volume 143, pp. 23–37. [Google Scholar]
- Sadiku, M.N.O.; Ashaolu, T.J.; Musa, S.M. Big Data in Agriculture. Int. J. Adv. Res. Comput. Sci. Softw. Eng. 2020, 9, 70–72. [Google Scholar] [CrossRef]
- Talari, G.; Cummins, E.; McNamara, C.; O’Brien, J. State of the art review of Big Data and web-based Decision Support Systems (DSS) for food safety risk assessment with respect to climate change. Trends Food Sci. Technol. 2021, in press. [Google Scholar] [CrossRef]
- BenSaid, F.; Alimi, A.M. Online feature selection system for big data classification based on multi-objective automated negotiation. Pattern Recognit. 2020, 110, 107629. [Google Scholar] [CrossRef]
- Guo, Y.; Zhang, B.; Sun, Y.; Jiang, K.; Wu, K. Machine learning based feature selection and knowledge reasoning for CBR system under big data. Pattern Recognit. 2020, 112, 107805. [Google Scholar] [CrossRef]
- Tiwari, S.R.; Rana, K.K. Feature selection in big data: Trends and challenges. In Data Science and Intelligent Applications; Springer: Berlin/Heidelberg, Germany, 2021; pp. 83–98. [Google Scholar]
- del Pozo, A.; Brunel-Saldias, N.; Engler, A.; Ortega-Farias, S.; Acevedo-Opazo, C.; Lobos, G.A.; Molina-Montenegro, M.A. Climate change impacts and adaptation strategies of agriculture in Mediterranean-climate regions (MCRs). Sustainability 2019, 11, 2769. [Google Scholar] [CrossRef] [Green Version]
- Sebestyén, V.; Czvetkó, T.; Abonyi, J. The Applicability of Big Data in Climate Change Research: The Importance of System of Systems Thinking. Front. Environ. Sci. 2021, 9, 70. [Google Scholar] [CrossRef]
- SASSI, I.; OUAFTOUH, S.; ANTER, S. Adaptation of Classical Machine Learning Algorithms to Big Data Context: Problems and Challenges. In Proceedings of the 2019 1st International Conference on Smart Systems and Data Science (ICSSD), Rabat, Morocco, 3–4 October 2019; pp. 1–7. [Google Scholar]
- Elshawi, R.; Sakr, S.; Talia, D.; Trunfio, P. Big Data Systems Meet Machine Learning Challenges: Towards Big Data Science as a Service. Big Data Res. 2018, 14, 1–11. [Google Scholar] [CrossRef] [Green Version]
- Haig, B.D. Big Data Science: A Philosophy of Science Perspective; American Psychological Association: Washington, DC, USA, 2020; pp. 15–33. [Google Scholar] [CrossRef]
- De Mauro, A.; Greco, M.; Grimaldi, M. A formal definition of Big Data based on its essential features. Libr. Rev. 2016, 65, 122–135. [Google Scholar] [CrossRef]
- Demchenko, Y.; de Laat, C.; Membrey, P. Defining architecture components of the Big Data Ecosystem. In Proceedings of the 2014 International Conference on Collaboration Technologies and Systems (CTS), Minneapolis, MN, USA, 19–23 May 2014; pp. 104–112. [Google Scholar] [CrossRef] [Green Version]
- Santos, M.Y.; e Sá, J.O.; Costa, C.; Galvão, J.; Andrade, C.; Martinho, B.; Lima, F.V.; Costa, E. A Big Data Analytics Architecture for Industry 4.0. A World Conference Information Systems and Technologies; Springer: Berlin/Heidelberg, Germany, 2017; pp. 175–184. [Google Scholar] [CrossRef]
- Salma, C.A.; Tekinerdogan, B.; Athanasiadis, I.N. Domain-Driven Design of Big Data Systems Based on a Reference Architecture. In Software Architecture for Big Data and the Cloud; Morgan Kaufmann: Burlington, MA, USA, 2017; pp. 49–68. [Google Scholar] [CrossRef]
- Sowmya, R.; Suneetha, K. Data mining with big data. In Proceedings of the International Conference on Intelligent Systems and Control (ISCO), Coimbatore, India, 5–6 January 2017; IEEE: Piscataway, NJ, USA; pp. 246–250.
- Torky, M.; Hassanein, A.E. Integrating blockchain and the internet of things in precision agriculture: Analysis, opportunities, and challenges. Comput. Electron. Agric. 2020, 178, 105476. [Google Scholar] [CrossRef]
- WMO, G.; OMM, G. International Meteorological Vocabulary; World Meteorological Organization: Geneva, Switzerland, 1966. [Google Scholar]
- Team, X.W. Contribution of Working Groups I, II and III to the Fourth Assessment Report of the Intergovernmental Panel on Climate Change: Working group II contribution. Russian Meteorology and Hydrology; Springer: Berlin/Heidelberg, Germany, 2007; Volume 104. [Google Scholar]
- Karimi, V.; Karami, E.; Keshavarz, M. Climate change and agriculture: Impacts and adaptive responses in Iran. J. Integr. Agric. 2018, 17, 1–15. [Google Scholar] [CrossRef] [Green Version]
- de Cambio Climático, I.P.I. Cambio Climático. Base Física; Suiza IPCC: Geneva, Switzerland, 2013. [Google Scholar]
- Sarker MN, I.; Yang, B.; Yang, L.; Huq, M.E.; Kamruzzaman, M.M. Climate change adaptation and resilience through big data. Int. J. Adv. Comput. Sci. Appl. 2020, 11, 533–539. [Google Scholar] [CrossRef] [Green Version]
- Keele, S. Guidelines for Performi Systematic Literature Reviews in Software Engineering. Version 2.3, Technical Rep. EBSE’ 2007. Available online: https://www.researchgate.net/profile/Barbara-Kitchenham/publication/302924724_Guidelines_for_performing_Systematic_Literature_Reviews_in_Software_Engineering/links/61712932766c4a211c03a6f7/Guidelines-for-performing-Systematic-Literature-Reviews-in-Software-Engineering.pdf (accessed on 22 May 2022).
- Coro, G.; Pagano, P.; Ellenbroek, A. Detecting patterns of climate change in long-term forecasts of marine environmental parameters. Int. J. Digit. Earth 2020, 13, 567–585. [Google Scholar] [CrossRef]
- Senay, G.B.; Schauer, M.; Friedrichs, M.; Velpuri, N.M.; Singh, R.K. Satellite-based Water Use Dynamics Using Historical Landsat Data (1984–2014) in the Southwestern United States. Remote Sens. Environ. 2017, 202, 98–112. [Google Scholar] [CrossRef]
- Alencar, P.; Cowan, D.; McGarry, F.; Palmer, R.M. An Open and Big Data Platform for Cumulative Environmental Analysis and Management. In Proceedings of the 2015 3rd International Conference on Future Internet of Things and Cloud, Rome, Italy, 24–26 August 2015; IEEE: Piscataway, NJ, USA, 2015; pp. 412–417. [Google Scholar] [CrossRef]
- Kandekar, V.U.; Pande, C.B.; Rajesh, J.; Atre, A.A.; Gorantiwar, S.D.; Kadam, S.A.; Gavit, B. Surface water dynamics analysis based on sentinel imagery and Google Earth Engine Platform: A case study of Jayakwadi dam. Sustain. Water Resour. Manag. 2021, 7, 44. [Google Scholar] [CrossRef]
- Reddy, P.C.; Sureshbabu, A. An Adaptive Model for Forecasting Seasonal Rainfall Using Predictive Analytics. Int. J. Intell. Eng. Syst. 2019, 12, 22–32. [Google Scholar] [CrossRef]
- Semlali, B.-E.B.; El Amrani, C.; Ortiz, G. Hadoop Paradigm for Satellite Environmental Big Data Processing. Int. J. Agric. Environ. Inf. Syst. 2020, 11, 23–47. [Google Scholar] [CrossRef]
- Ma, L.; Nie, F. A smart meteorological service model based on big Data: A value creation perspective. In Proceedings of the 2017 International Conference on Grey Systems and Intelligent Services (GSIS), Stockholm, Sweden, 8–10 August 2017; pp. 299–305. [Google Scholar] [CrossRef]
- Sayad, Y.O.; Mousannif, H.; Al Moatassime, H. Predictive modeling of wildfires: A new dataset and machine learning approach. Fire Saf. J. 2019, 104, 130–146. [Google Scholar] [CrossRef]
- Li, J.; Liao, S. Quality Control Framework of Big Data for Early Warning of Agricultural Meteorological Disasters. In Proceedings of the 2019 International Conference on Artificial Intelligence and Computer Science, Wuhan, China, 12–13 July 2019; pp. 74–78. [Google Scholar]
- Jain, H.; Jain, R. Big data in weather forecasting: Applications and challenges. In Proceedings of the 2017 International Conference on Big Data Analytics and Computational Intelligence (ICBDAC), Chirala, Andhra Pradesh, India, 23–25 March 2017; pp. 138–142. [Google Scholar]
- Doreswamy; Gad, I.; Manjunatha, B.R. Hybrid data warehouse model for climate big data analysis. In Proceedings of the International Conference on Circuit, Power and Computing Technologies, Kollam, India, 20–21 April 2017; pp. 1–9. [Google Scholar] [CrossRef]
- Mangal, P.; Rajesh, A. Addressing climate change-making the case for big data-based decision making framework. Int. J. Public Sect. Perform. Manag. 2020, 6, 205–216. [Google Scholar] [CrossRef]
- Gulzar, M.; Abbas, G.; Waqas, M. Climate smart agriculture: A survey and taxonomy. In Proceedings of the 2020 International Conference on Emerging Trends in Smart Technologies (ICETST), Karachi, Pakistan, 26–27 March 2020; pp. 1–6. [Google Scholar]
- Delgado, J.A.; Short, N.M.J.; Roberts, D.P.; Vandenberg, B. Big Data Analysis for Sustainable Agriculture on a Geospatial Cloud Framework. Front. Sustain. Food Syst. 2019, 3, 54. [Google Scholar] [CrossRef] [Green Version]
- López, I.D.; Grass, J.F.; Figueroa, A.; Corrales, J.C. A proposal for a multi-domain data fusion strategy in a cli-mate-smart agriculture context. In International Transactions in Operational Research; Wiley: Hoboken, NJ, USA, 2020. [Google Scholar]
- Alex, S.A.; Kanavalli, A. Intelligent computational techniques for crops yield prediction and fertilizer management over big data environment. Int. J. Innov. Technol. Explor. Eng. 2019, 8, 3521–3526. [Google Scholar]
- Lokers, R.; van Randen, Y.; Knapen, R.; Gaubitzer, S.; Zudin, S.; Janssen, S. Improving Access to Big Data in Agriculture and Forestry Using Semantic Technologies. In Research Conference on Metadata and Semantics Research; Springer: Cham, Switzerland, 2015; pp. 369–380. [Google Scholar] [CrossRef]
- Tseng, F.-H.; Cho, H.-H.; Wu, H.-T. Applying Big Data for Intelligent Agriculture-Based Crop Selection Analysis. IEEE Access 2019, 7, 116965–116974. [Google Scholar] [CrossRef]
- Lambrinos, L. Internet of Things in Agriculture: A Decision Support System for Precision Farming. In Proceedings of the 2019 IEEE Intl Conf on Dependable, Autonomic and Secure Computing, Intl Conf on Pervasive Intelligence and Computing, Intl Conf on Cloud and Big Data Computing, Intl Conf on Cyber Science and Technology Congress (DASC/PiCom/CBDCom/CyberSciTech), Fukuoka, Japan, 5–8 August 2019; pp. 889–892. [Google Scholar] [CrossRef]
- Moon, Y.-J.; Cho, W.W.; Oh, J.; Kim, J.M.; Han, S.Y.; Kim, K.H.; Cho, S. Forecasting Cultivable Region-Specific Crops Based on Future Climate Change Utilizing Public Big Data. Adv. Multimed. Ubiquitous Eng. 2017, 448, 399–404. [Google Scholar] [CrossRef]
- Lu, X. Evaluation of agricultural climate and regional agricultural economic efficiency based on remote sensing analysis. Arab. J. Geosci. 2021, 14, 1–16. [Google Scholar]
- Sarvia, F.; de Petris, S.; Mondino, E.B. Multi-scale remote sensing to support insurance policies in agriculture: From mid-term to instantaneous deductions. GISci. Remote Sens. 2020, 57, 770–784. [Google Scholar]
- Ye, S.; Liu, D.; Yao, X.; Tang, H.; Xiong, Q.; Zhuo, W.; Du, Z.; Huang, J.; Su, W.; Shen, S.; et al. RDCRMG: A Raster Dataset Clean & Reconstitution Multi-Grid Architecture for Remote Sensing Monitoring of Vegetation Dryness. Remote Sens. 2018, 10, 1376. [Google Scholar]
- Bestelmeyer, B.T.; Spiegal, S.; Winkler, R.; James, D.; Levi, M.; Williamson, J. Assessing Sustainability Goals Using Big Data: Collaborative Adaptive Management in the Malpai Borderlands. Rangel. Ecol. Manag. 2021, 77, 17–29. [Google Scholar] [CrossRef]
- Hu, X.; Næss, J.S.; Iordan, C.M.; Huang, B.; Zhao, W.; Cherubini, F. Recent global land cover dynamics and implications for soil erosion and carbon losses from deforestation. Anthropocene 2021, 34, 100291. [Google Scholar] [CrossRef]
- Fernández-Getino, A.; Alonso-Prados, J.; Santín-Montanyá, M. Challenges and prospects in connectivity analysis in agricultural systems: Actions to implement policies on land management and carbon storage at EU level. Land Use Policy 2018, 71, 146–159. [Google Scholar] [CrossRef]
- Kamilaris, A.; Anton, A.; Blasi, A.B.; Prenafeta-Boldú, F.X. Assessing and mitigating the impact of livestock agriculture on the environment through geospatial and big data analysis. Int. J. Sustain. Agric. Manag. Inform. 2018, 4, 98–122. [Google Scholar]
- Li, Y.; Cao, Z.; Long, H.; Liu, Y.; Li, W. Dynamic analysis of ecological environment combined with land cover and NDVI changes and implications for sustainable urban–rural development: The case of Mu Us Sandy Land, China. J. Clean. Prod. 2017, 142, 697–715. [Google Scholar] [CrossRef]
- Manogaran, G.; Lopez, D. Spatial cumulative sum algorithm with big data analytics for climate change detection. Comput. Electr. Eng. 2018, 65, 207–221. [Google Scholar] [CrossRef]
- Sumalatha, M.R.; Akila, M. Real Time Big Data Analytics for Agricultural Land Hotspot Prediction. In Proceedings of the 2019 International Conference on Computational Intelligence and Knowledge Economy (ICCIKE), Dubai, United Arab Emirates, 11–12 December 2019; pp. 411–416. [Google Scholar]
- Lai, M.-C.; Lai, Z.-Y.; Jhan, L.-H.; Lai, Y.-S.; Kao, C.-F. Prioritization and Evaluation of Flooding Tolerance Genes in Soybean [Glycine max (L.) Merr.]. Front. Genet. 2021, 11, 612131. [Google Scholar] [CrossRef] [PubMed]
- Mousannif, H.; Zahir, J. AgriFuture: A new theory of change approach to building climate-resilient agriculture. In Proceedings of the International Conference on Advanced Intelligent Systems for Sustainable Development, Marrakech City, Morocco, 7 February 2019; pp. 88–97. [Google Scholar]
- Bendre, M.R.; Thool, R.C.; Thool, V.R. Big data in precision agriculture: Weather forecasting for future farming. In Proceedings of the 2015 1st International Conference on Next Generation Computing Technologies (NGCT), Dehradun, India, 4–5 September 2015; pp. 744–750. [Google Scholar]
- Moon, T.; Hong, S.; Choi, H.Y.; Jung, D.H.; Chang, S.H.; Son, J.E. Interpolation of greenhouse environment data using multilayer perceptron. Comput. Electron. Agric. 2019, 166, 105023. [Google Scholar] [CrossRef]
- Salma, C.A.; Tekinerdogan, B.; Athanasiadis, I.N. Feature Driven Survey of Big Data Systems. In Proceedings of the International Conference on Internet of Things and Big Data, IoTBD 2016, Rome, Italy, 23–25 April 2016; pp. 348–355. [Google Scholar] [CrossRef] [Green Version]
- Seles BM, R.P.; de Sousa Jabbour AB, L.; Jabbour CJ, C.; de Camargo Fiorini, P.; Mohd-Yusoff, Y.; Thomé, A.M.T. Business opportunities and challenges as the two sides of the climate change: Corporate responses and potential implica-tions for big data management towards a low carbon society. J. Clean. Prod. 2018, 189, 763–774. [Google Scholar] [CrossRef] [Green Version]
- Jyothi, B.S.; Jyothi, S. A study on big data modelling techniques. Int. J. Comput. Netw. Wirel. Mob. Commun. 2015, 5, 19–26. [Google Scholar]
- Padhi, B.K.; Nayak, S.; Biswal, B. Machine Learning for Big Data Processing: A Literature Review. Int. J. Innov. Res. Technol. 2018, 5, 359–368. [Google Scholar]
- Mongeon, P.; Paul-Hus, A. The Journal Coverage of Web of Science and Scopus: A Comparative Analysis. Sci. -Rics. 2016, 106, 213–228. [Google Scholar] [CrossRef]
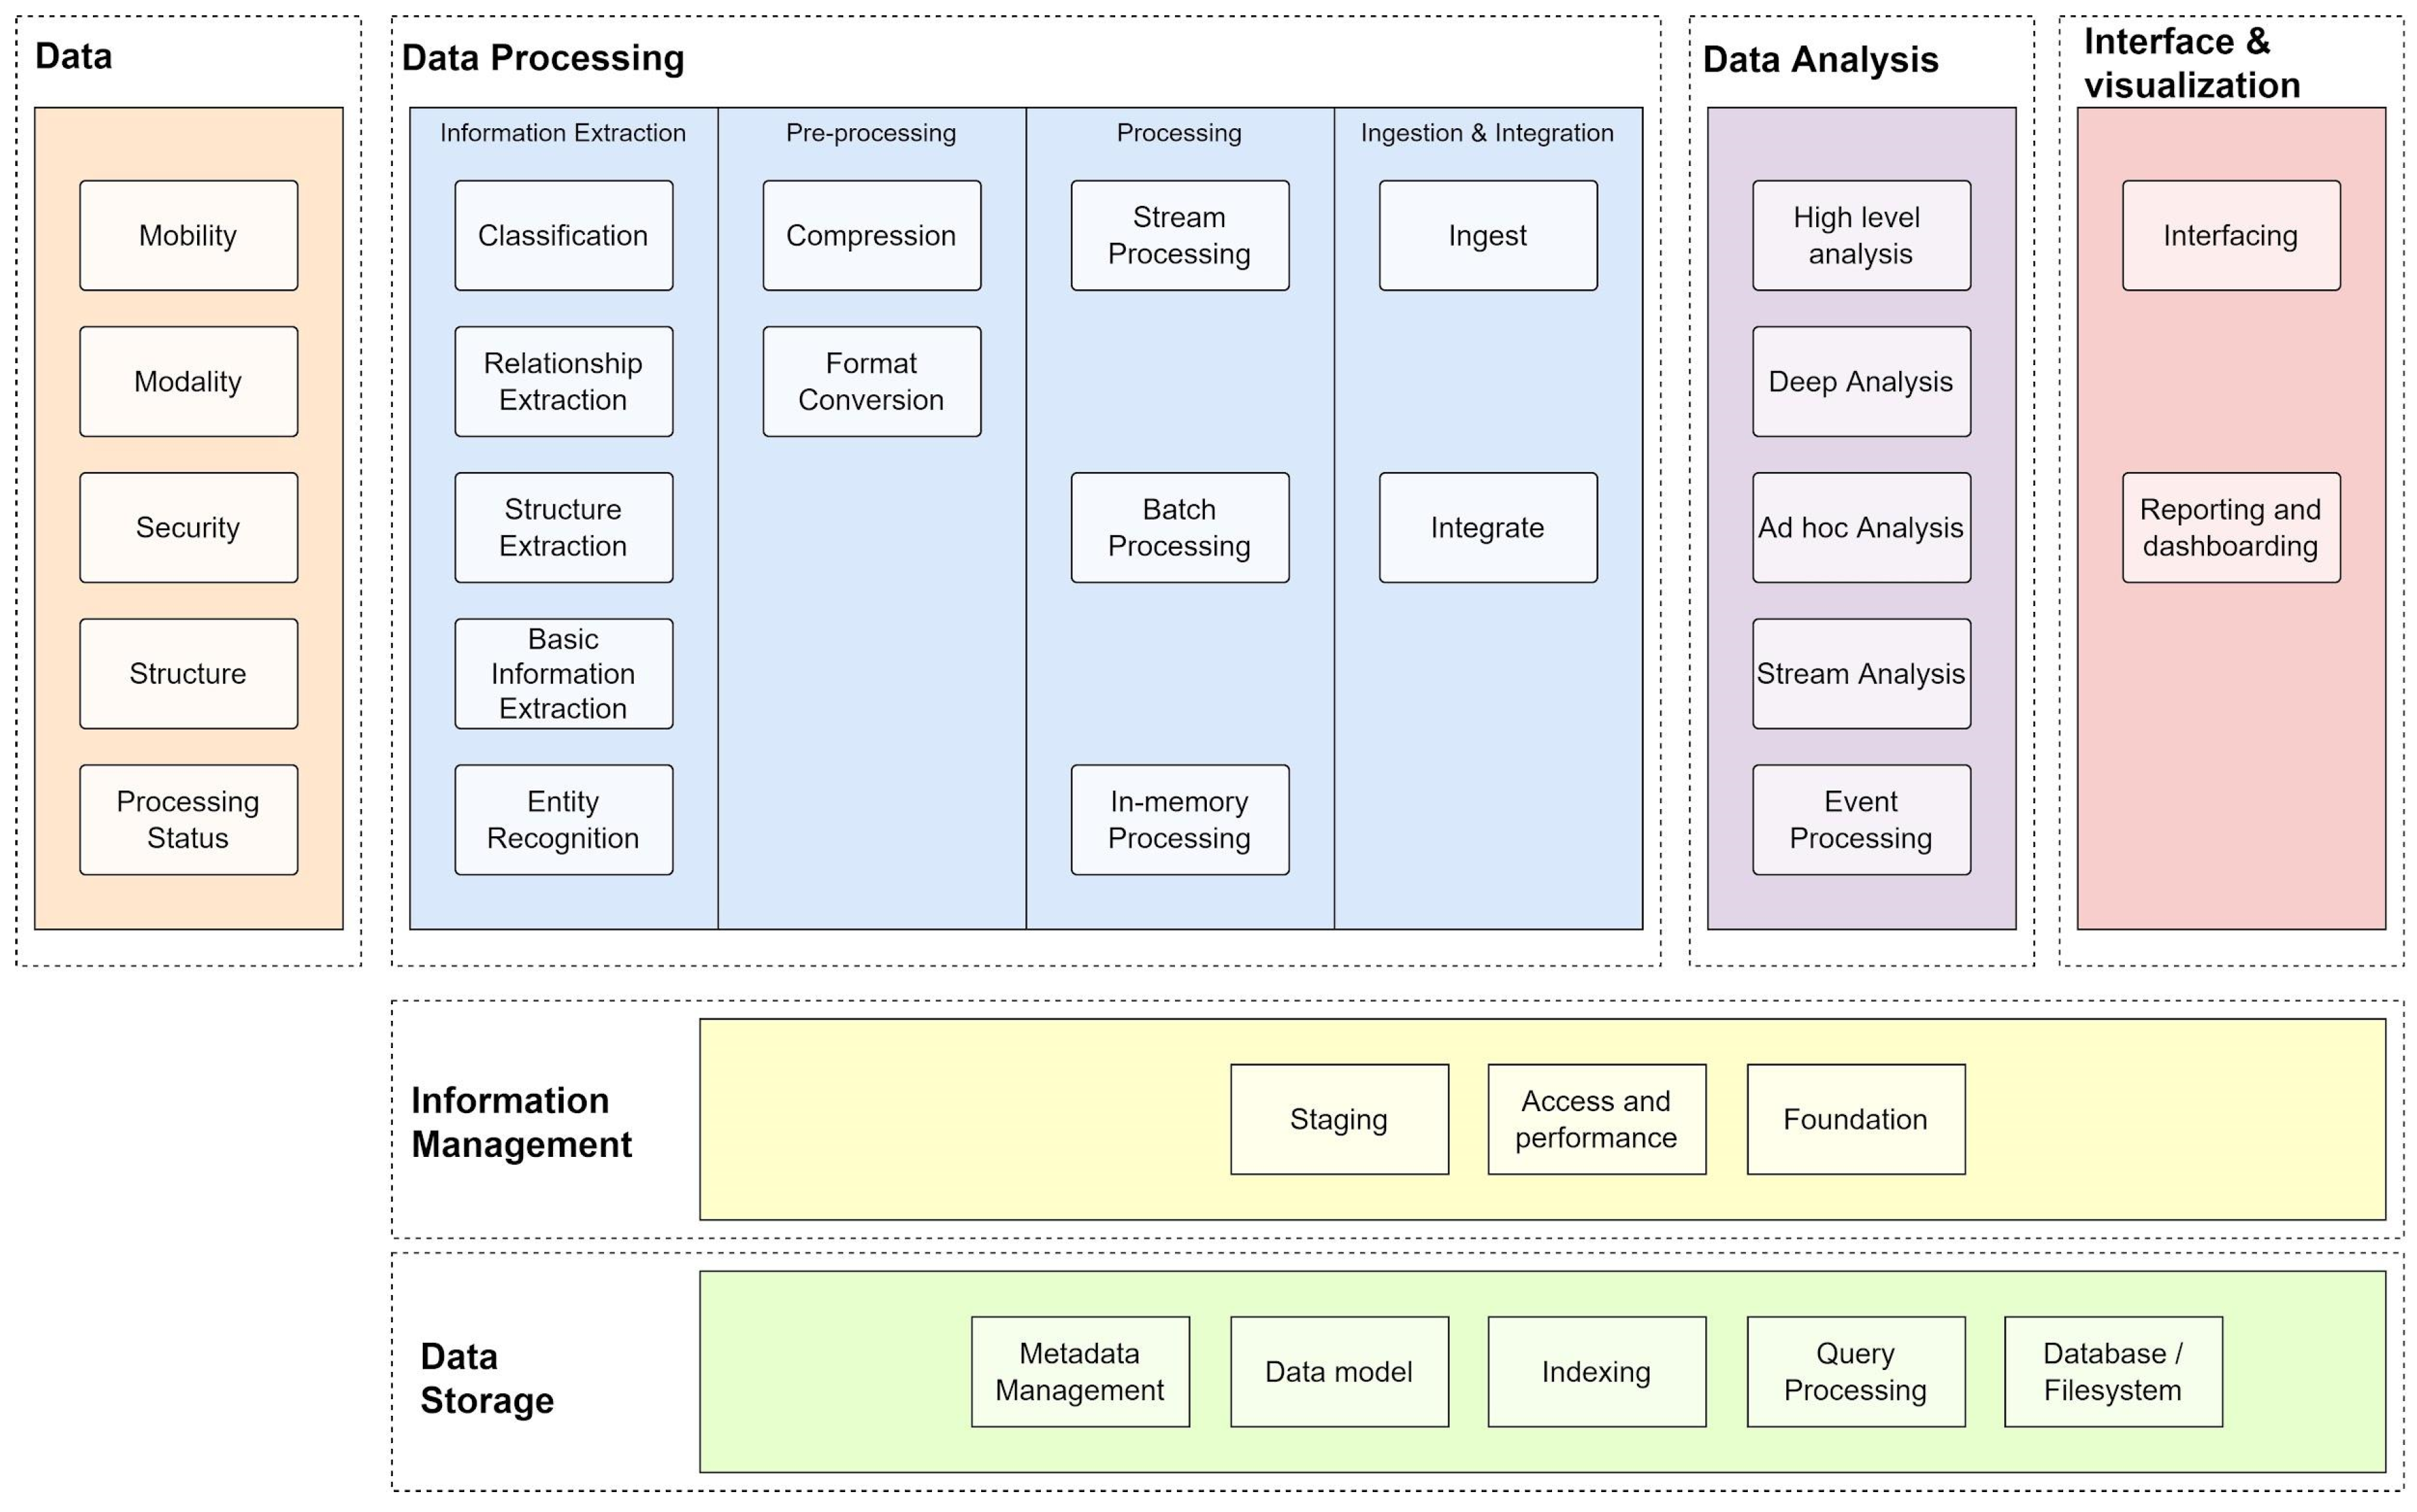
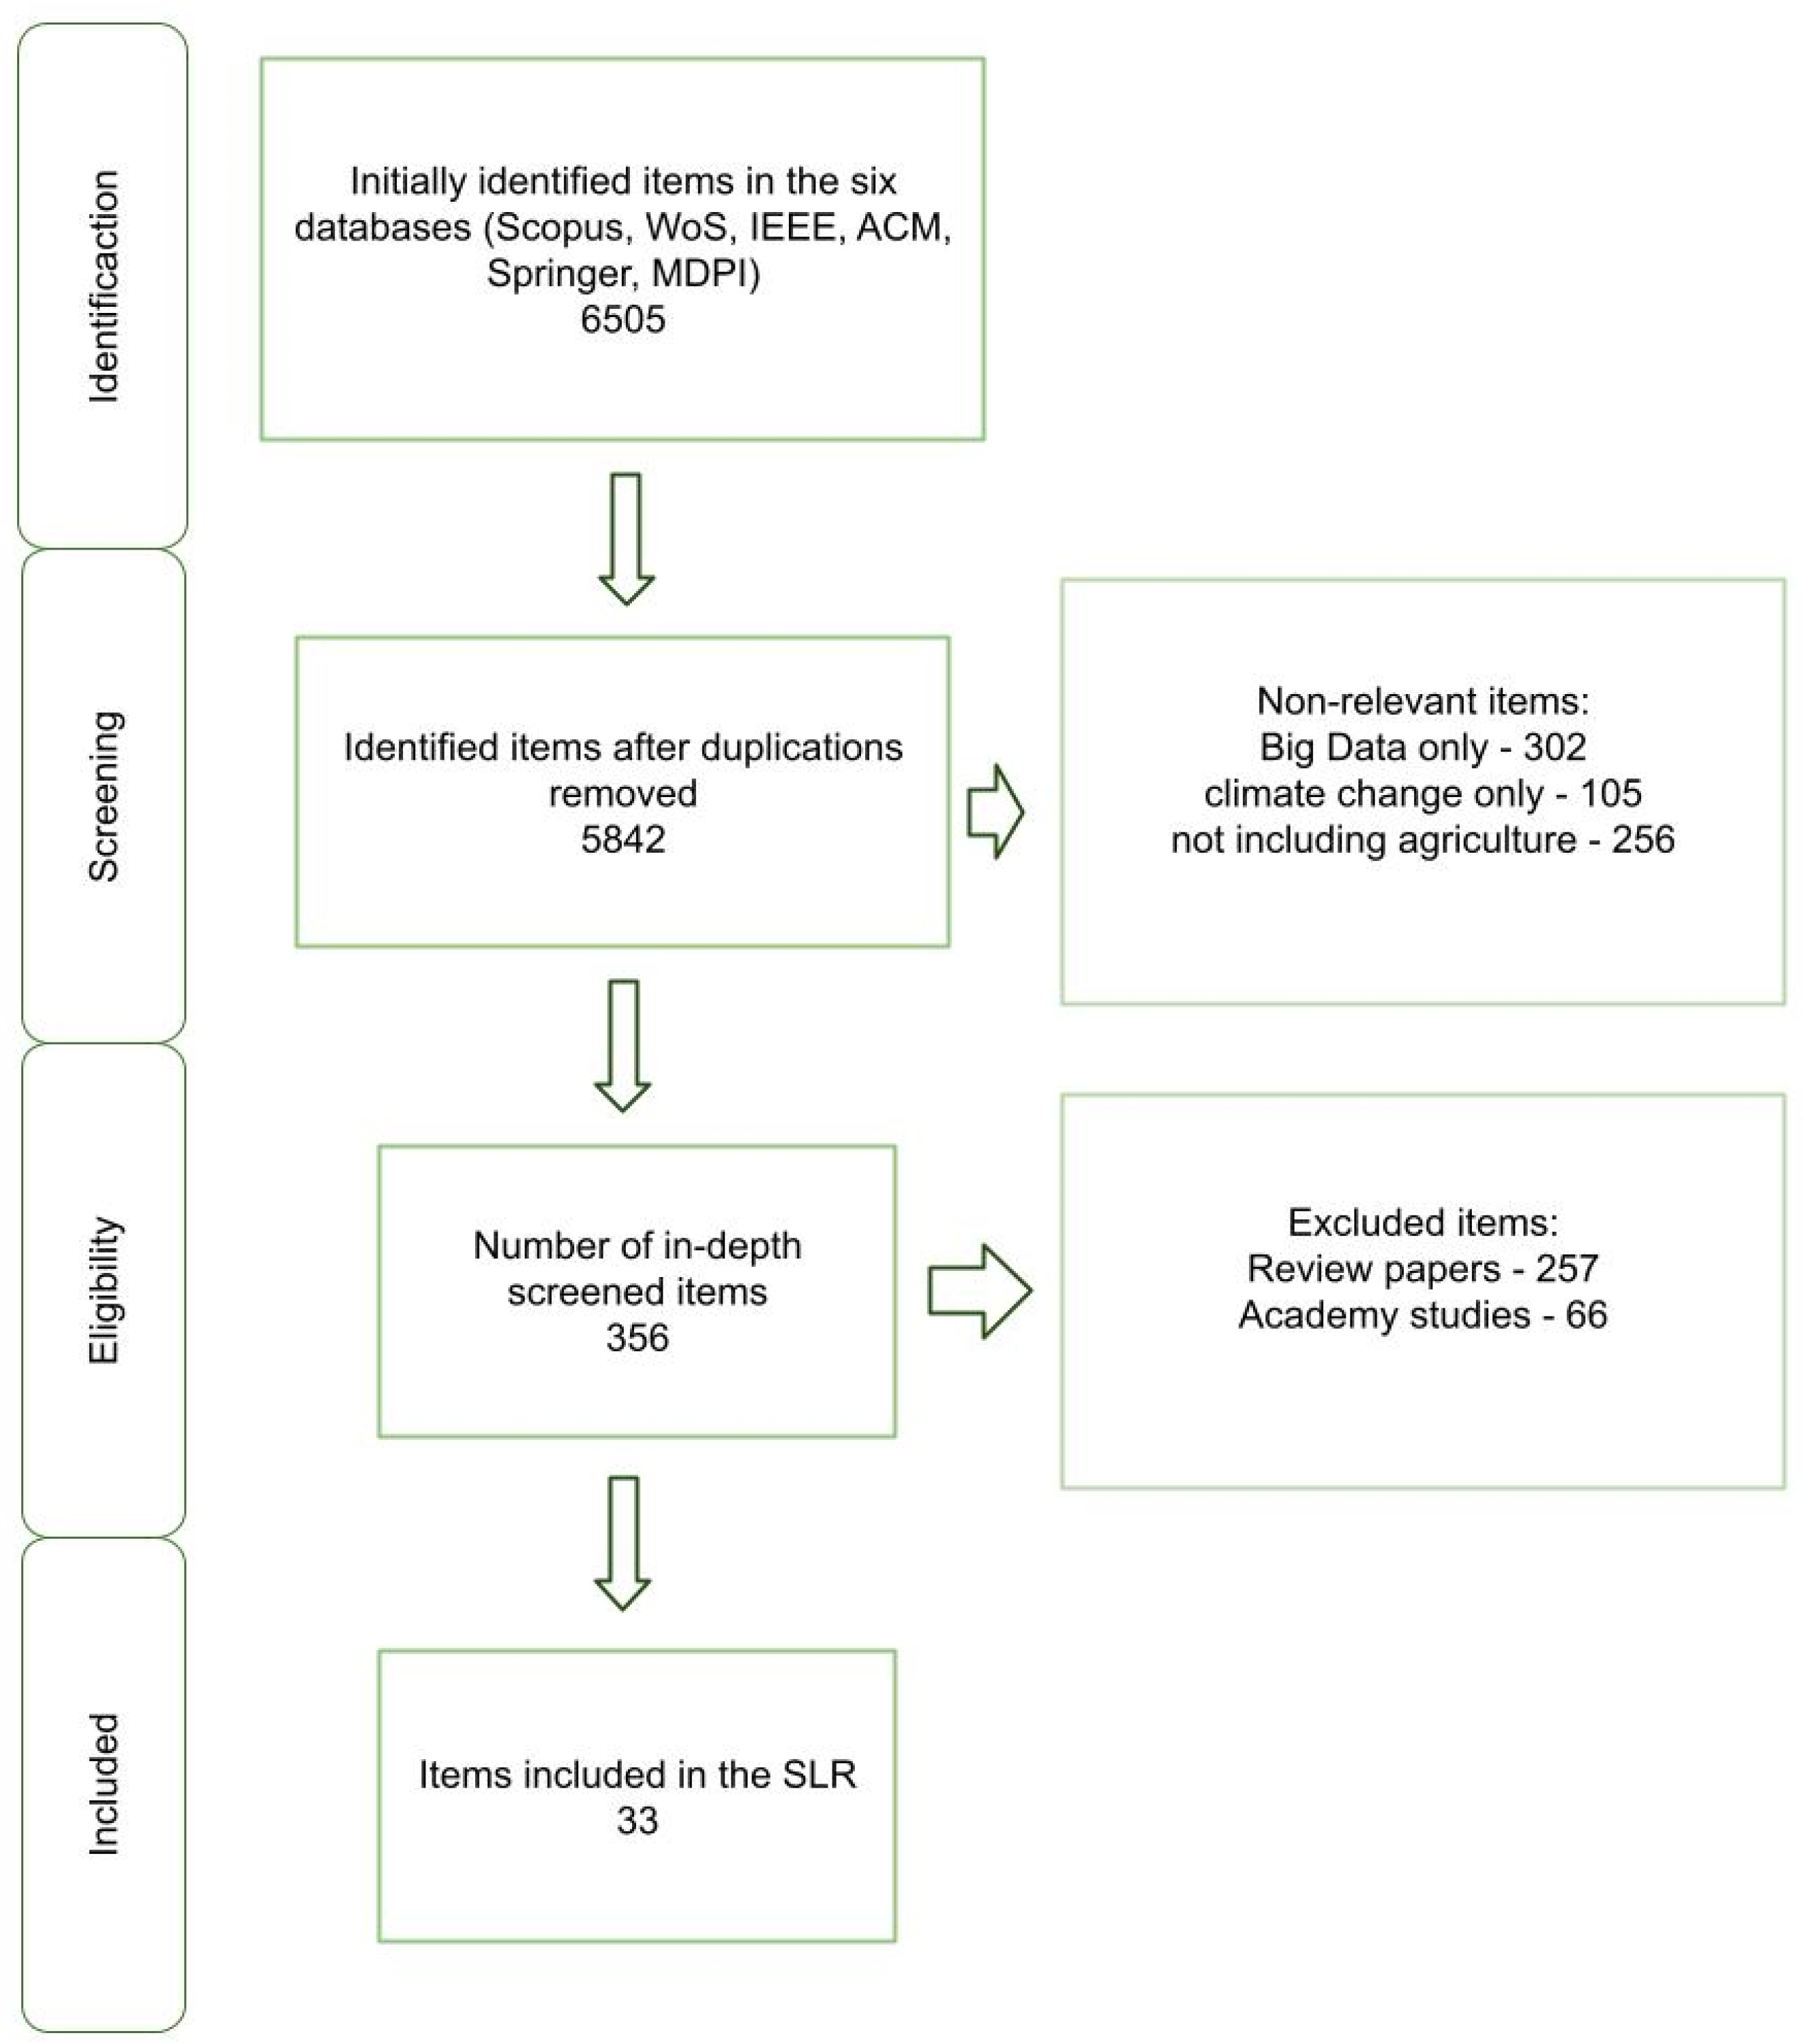
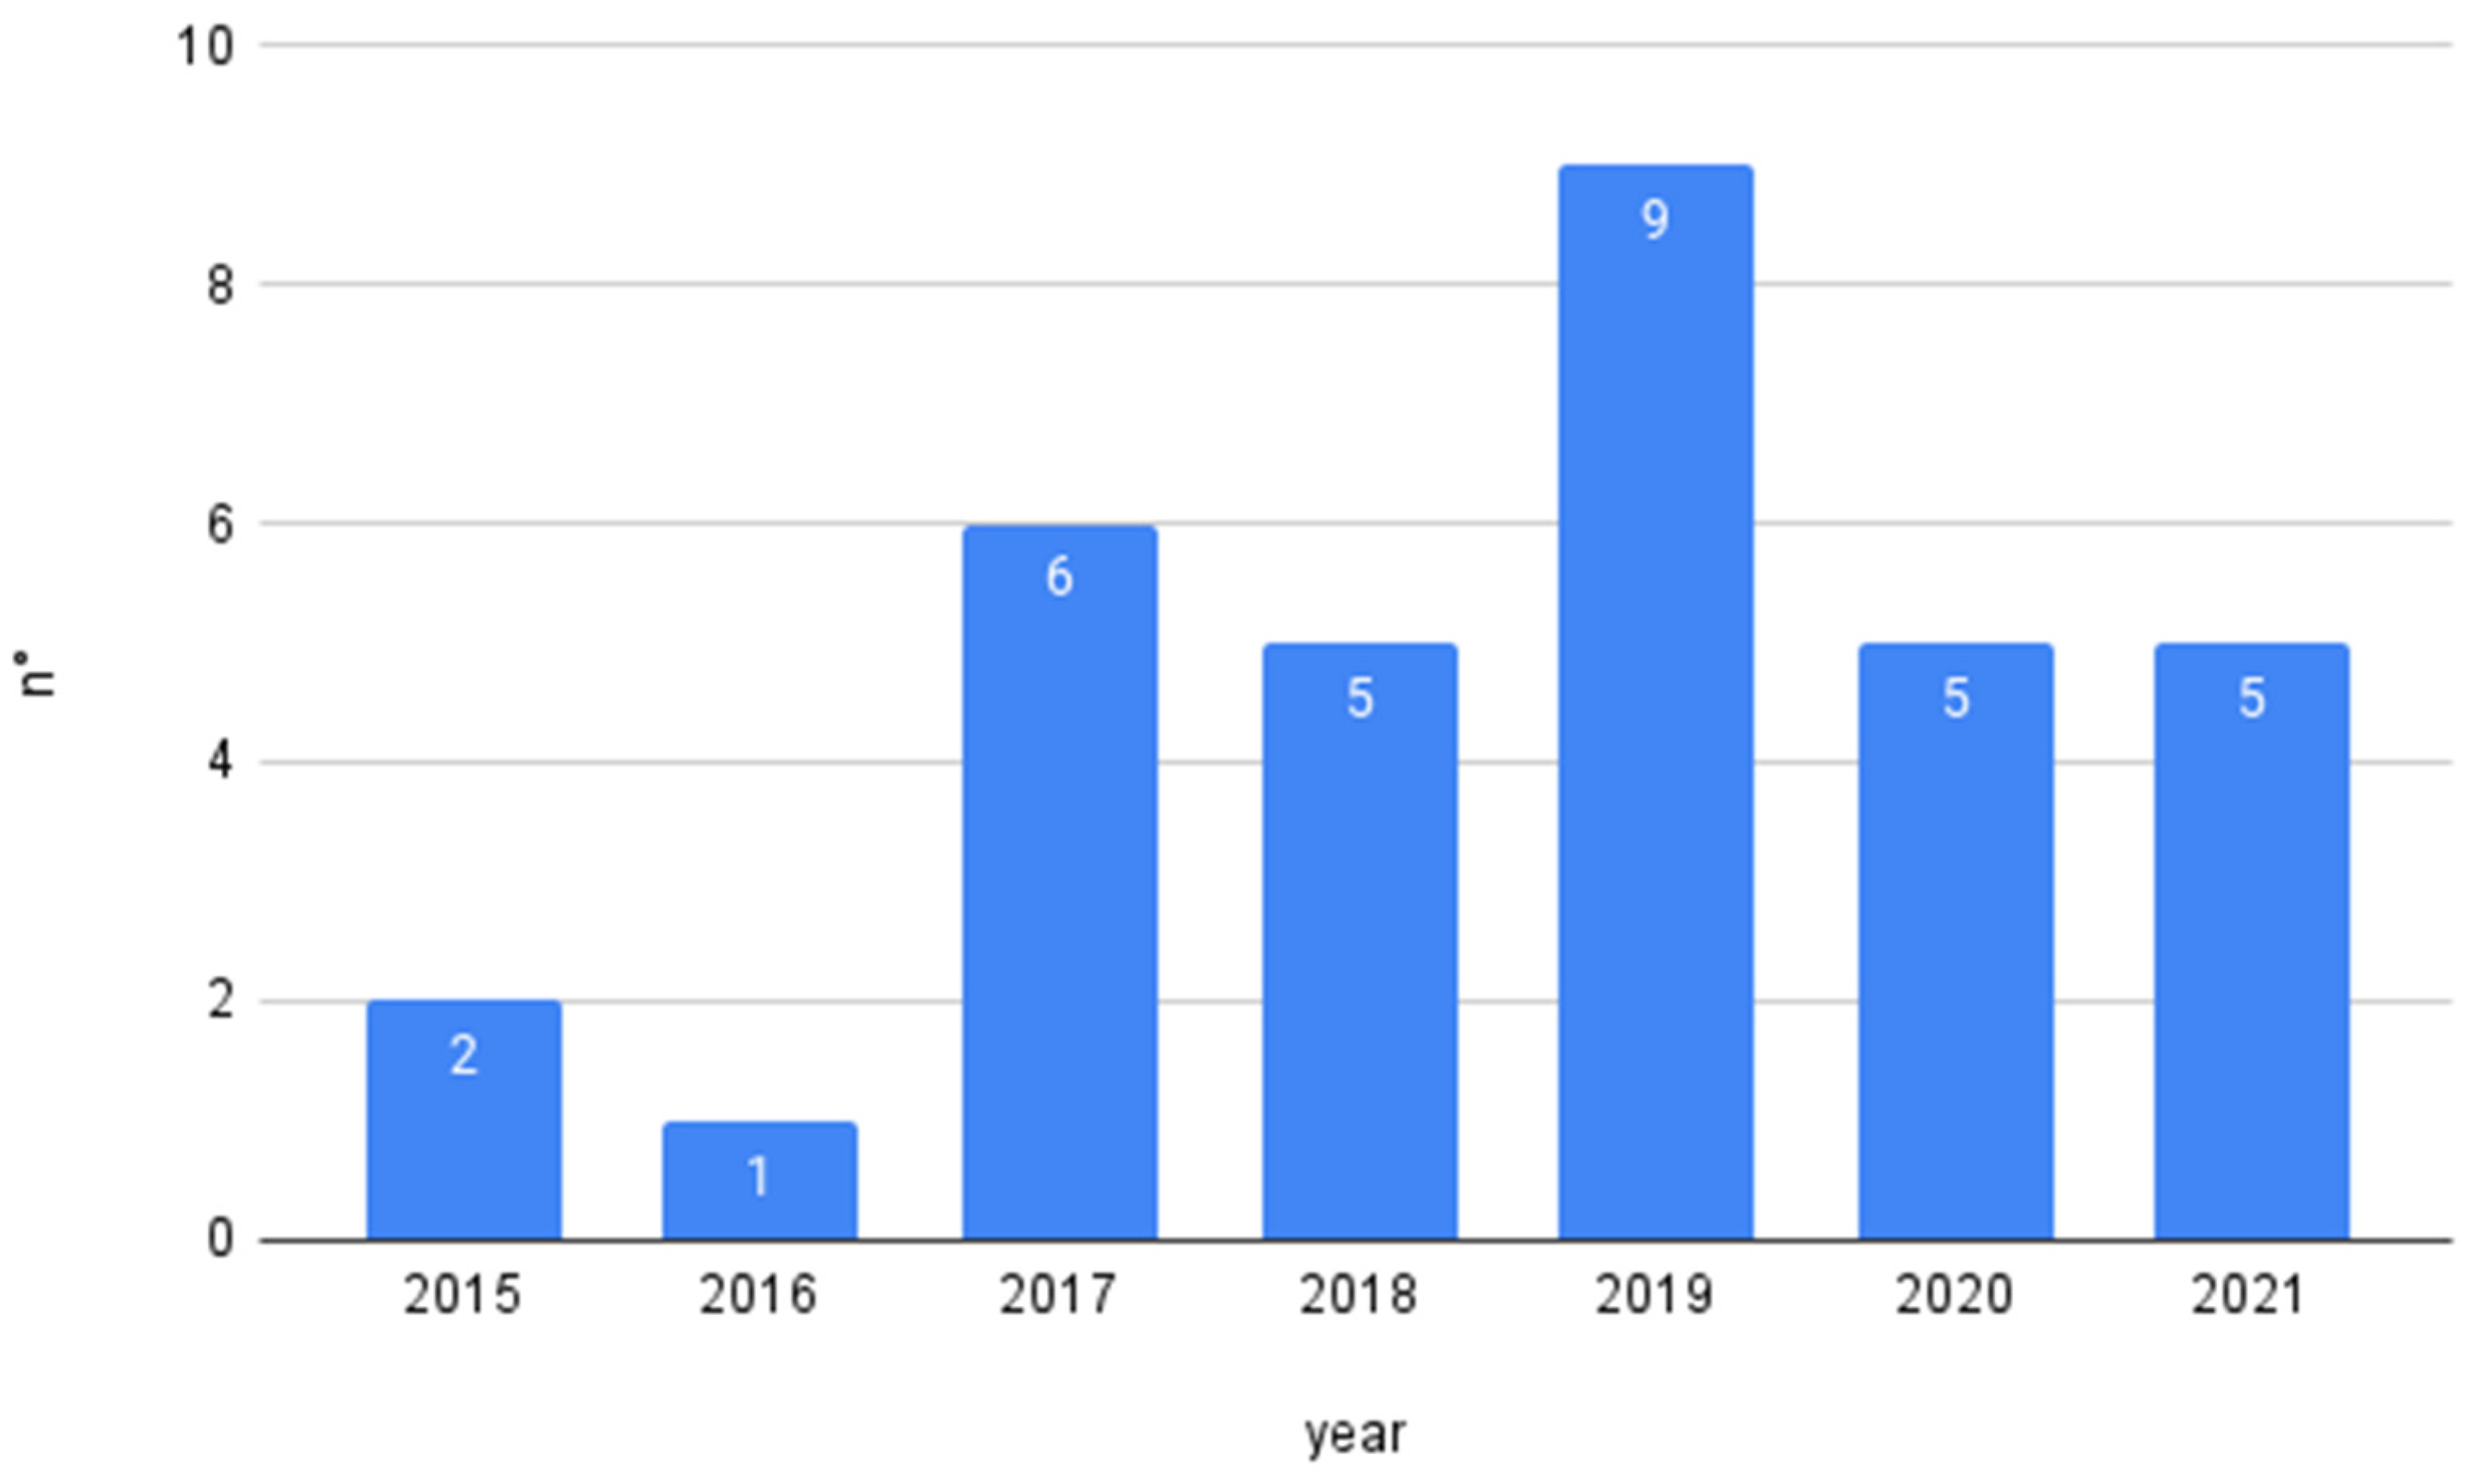
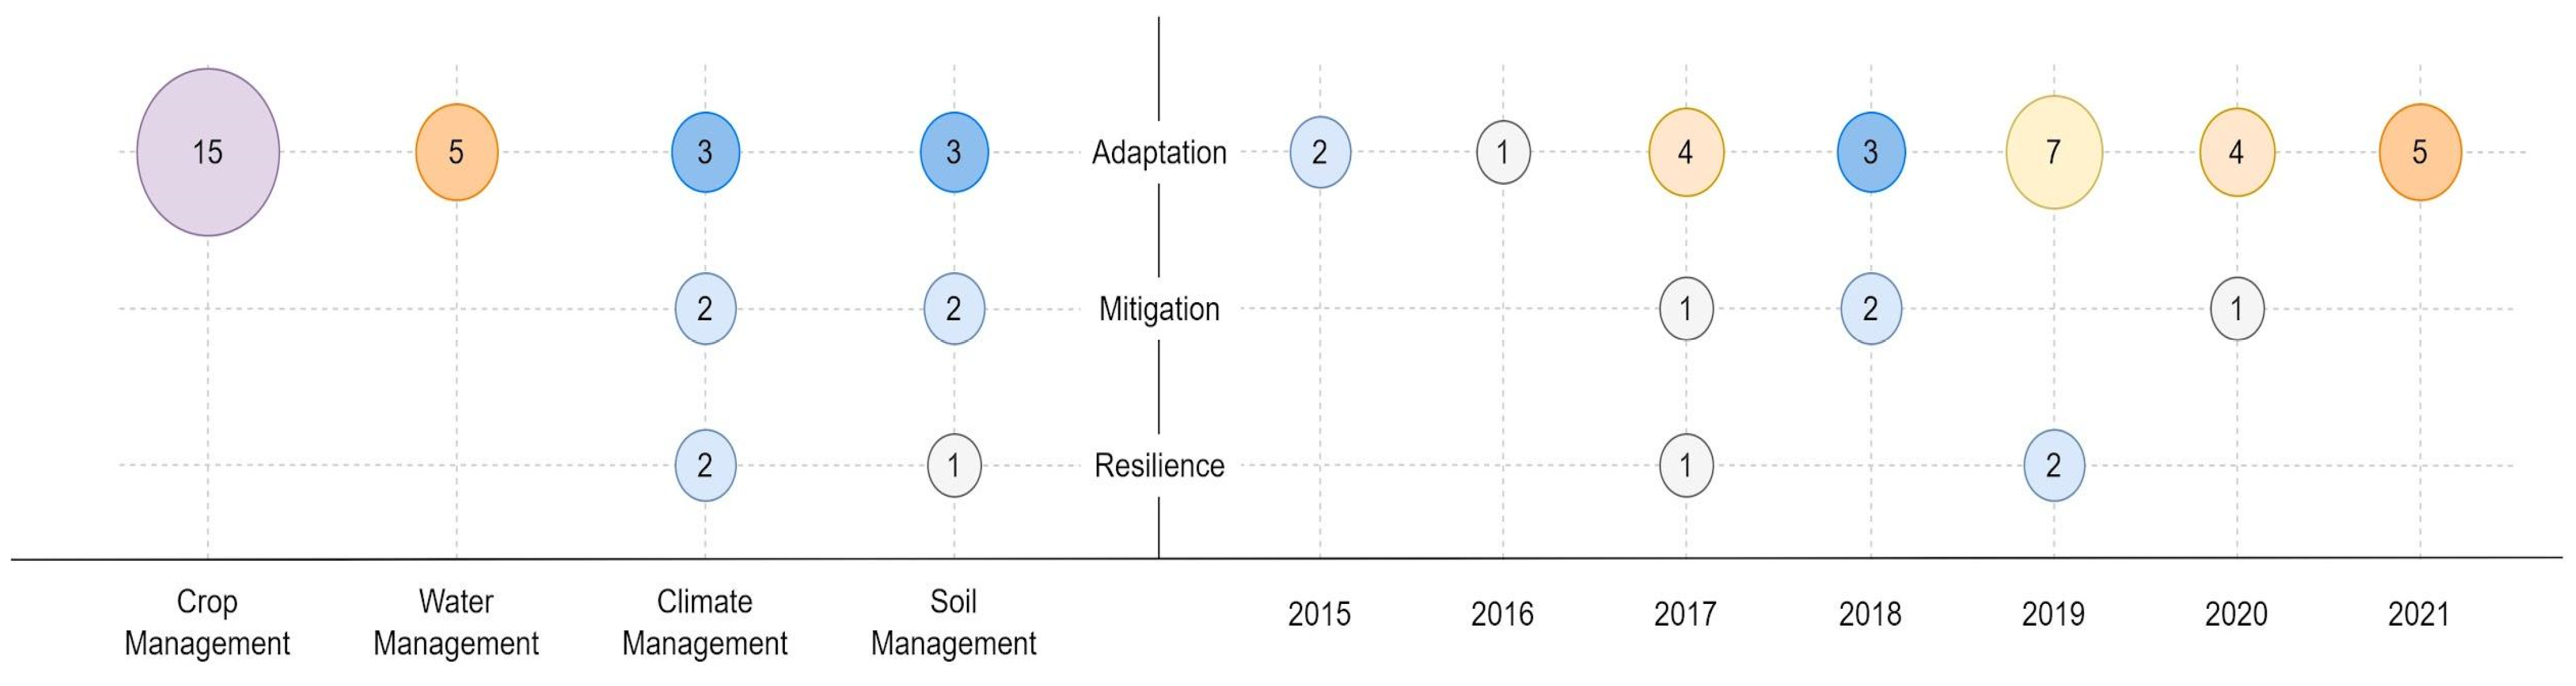

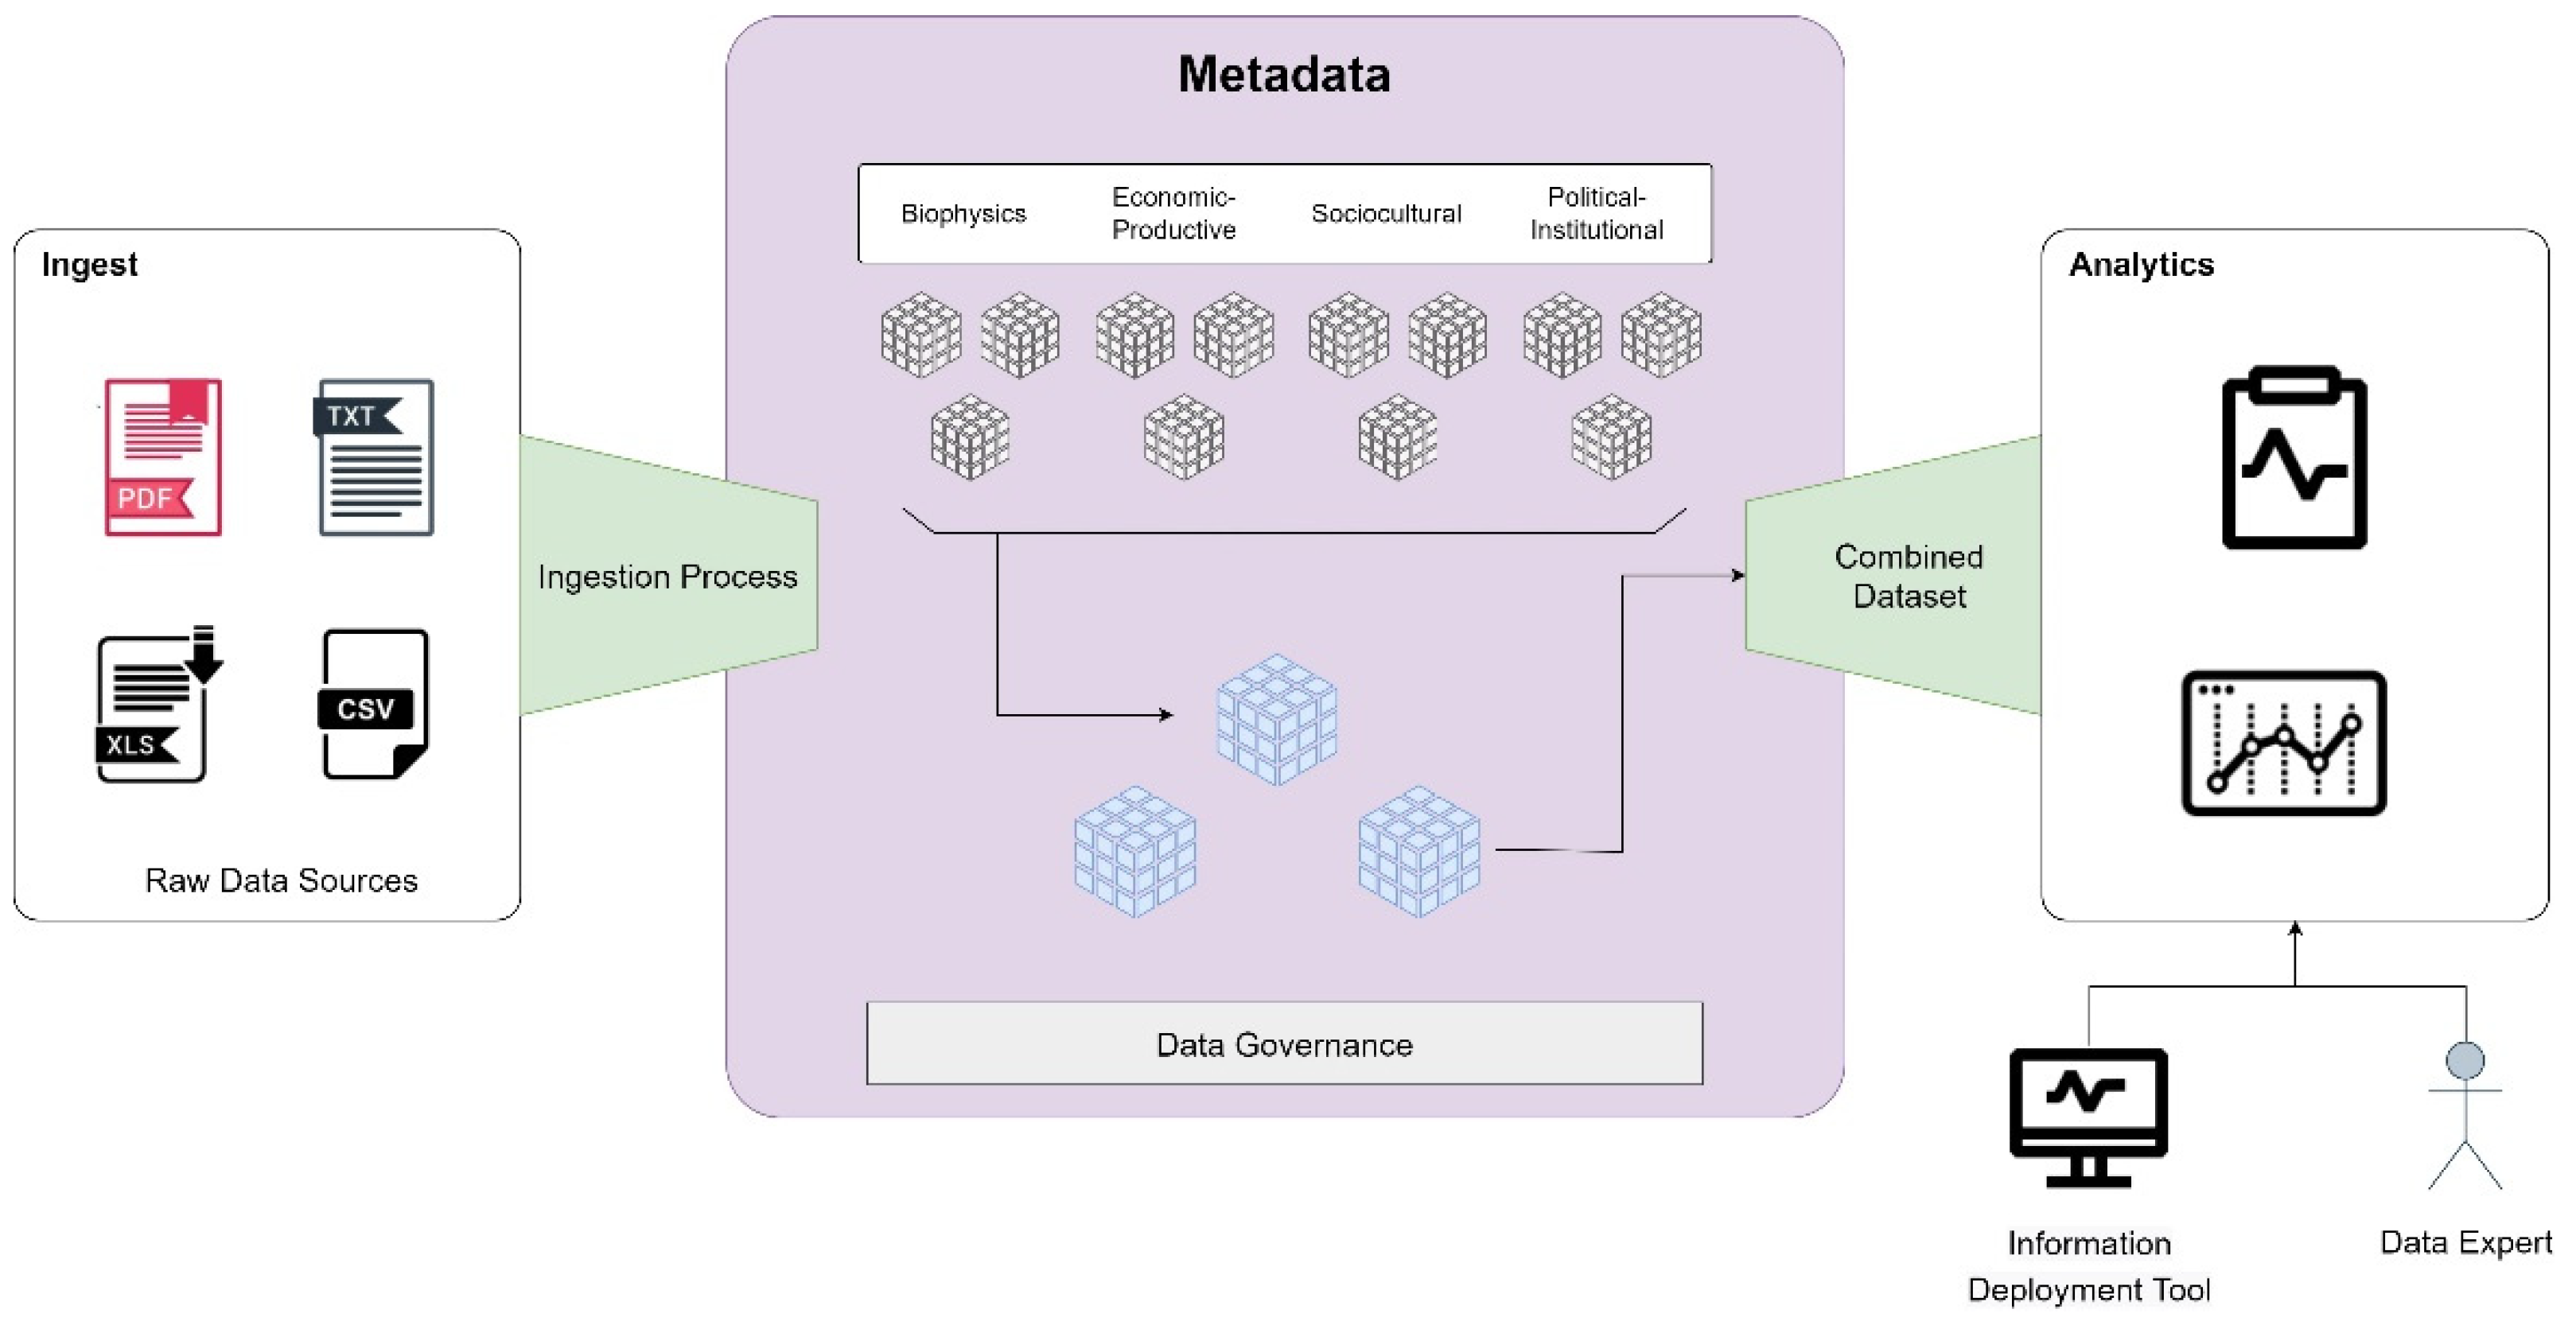
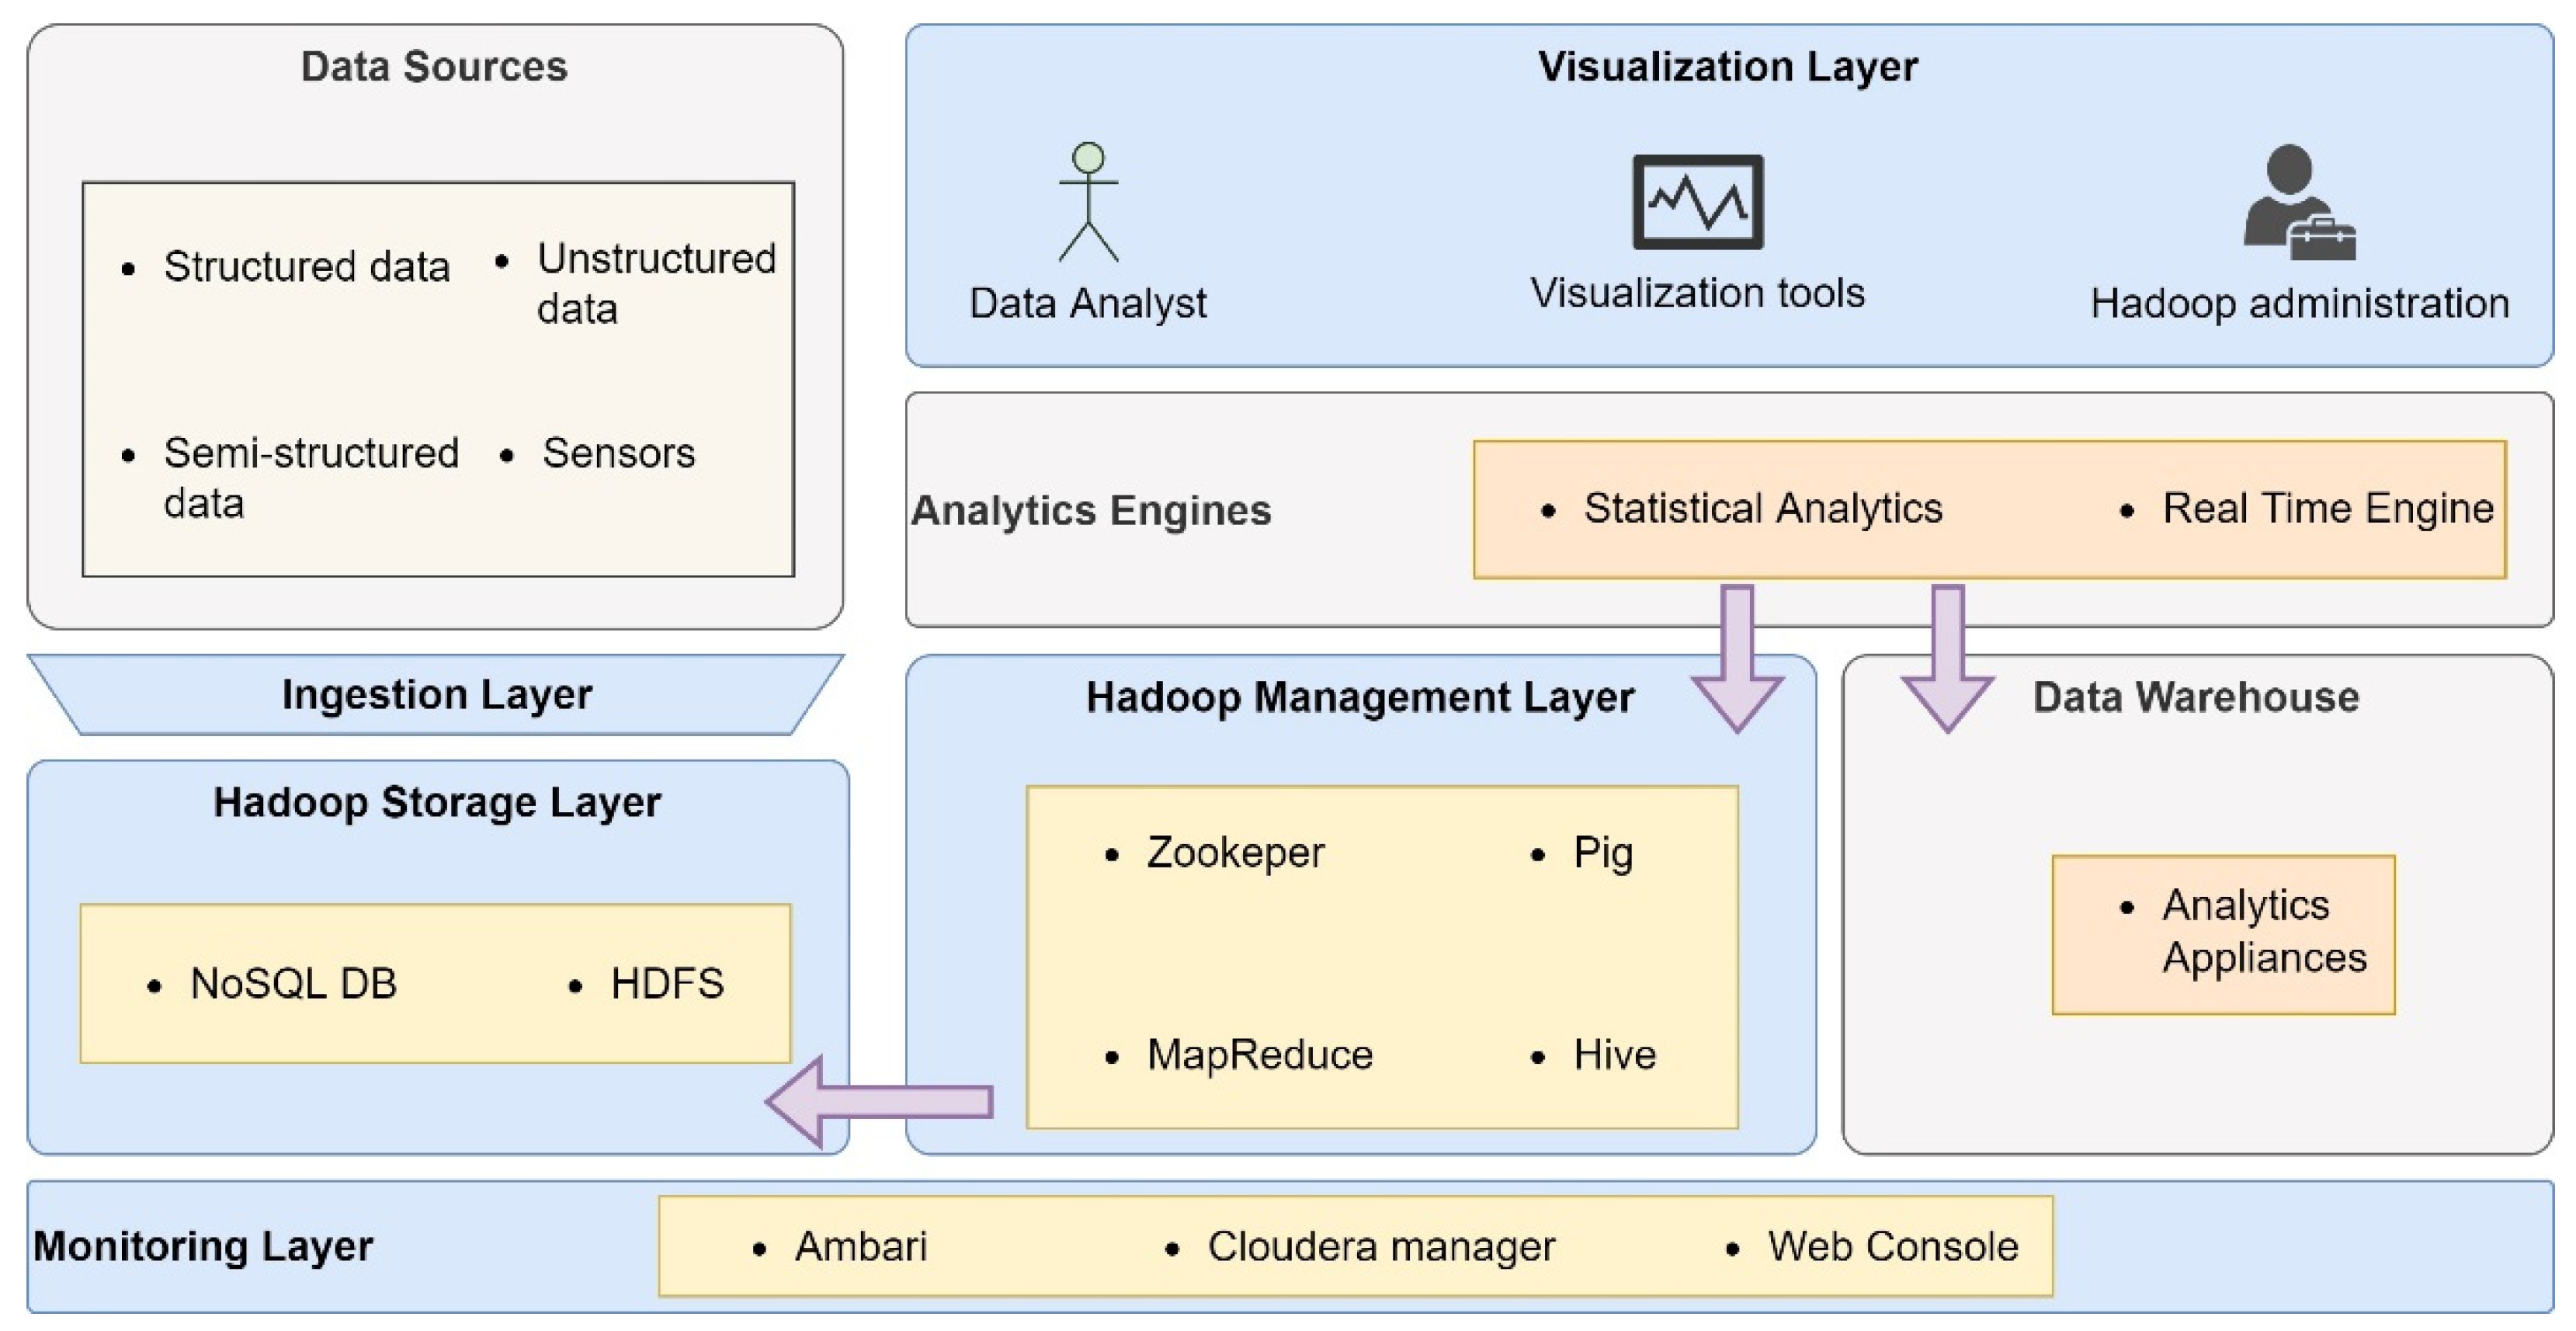
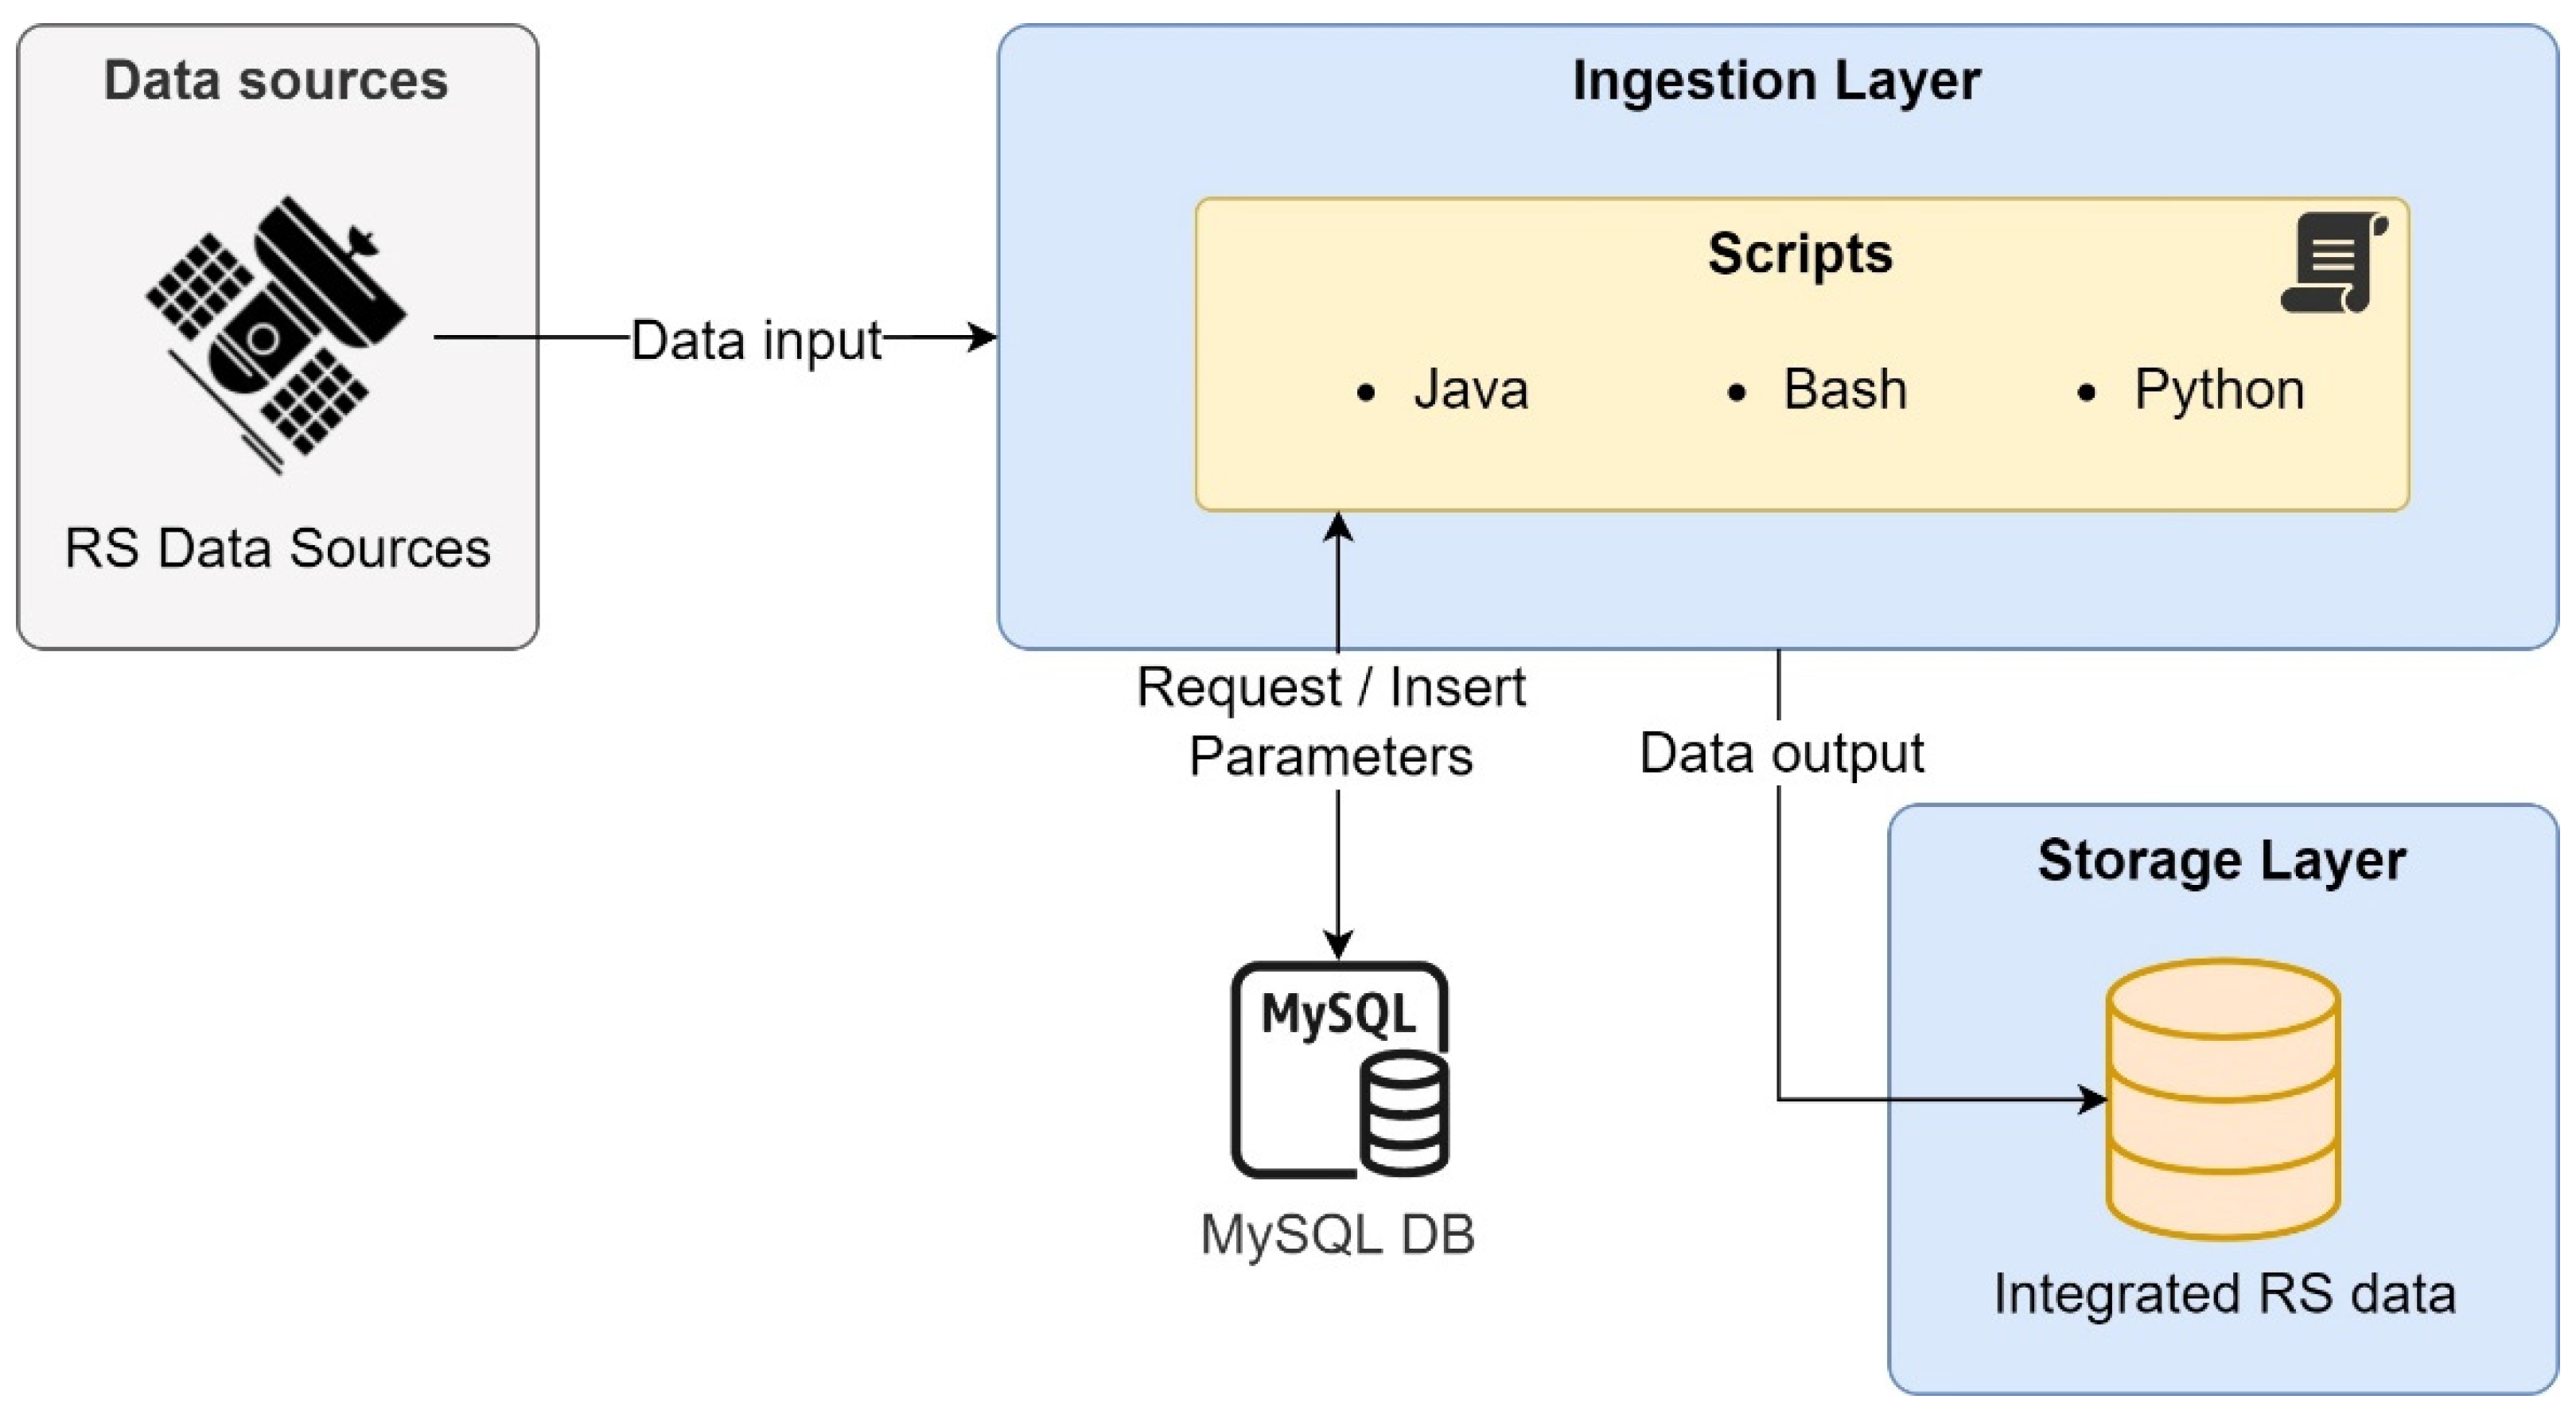
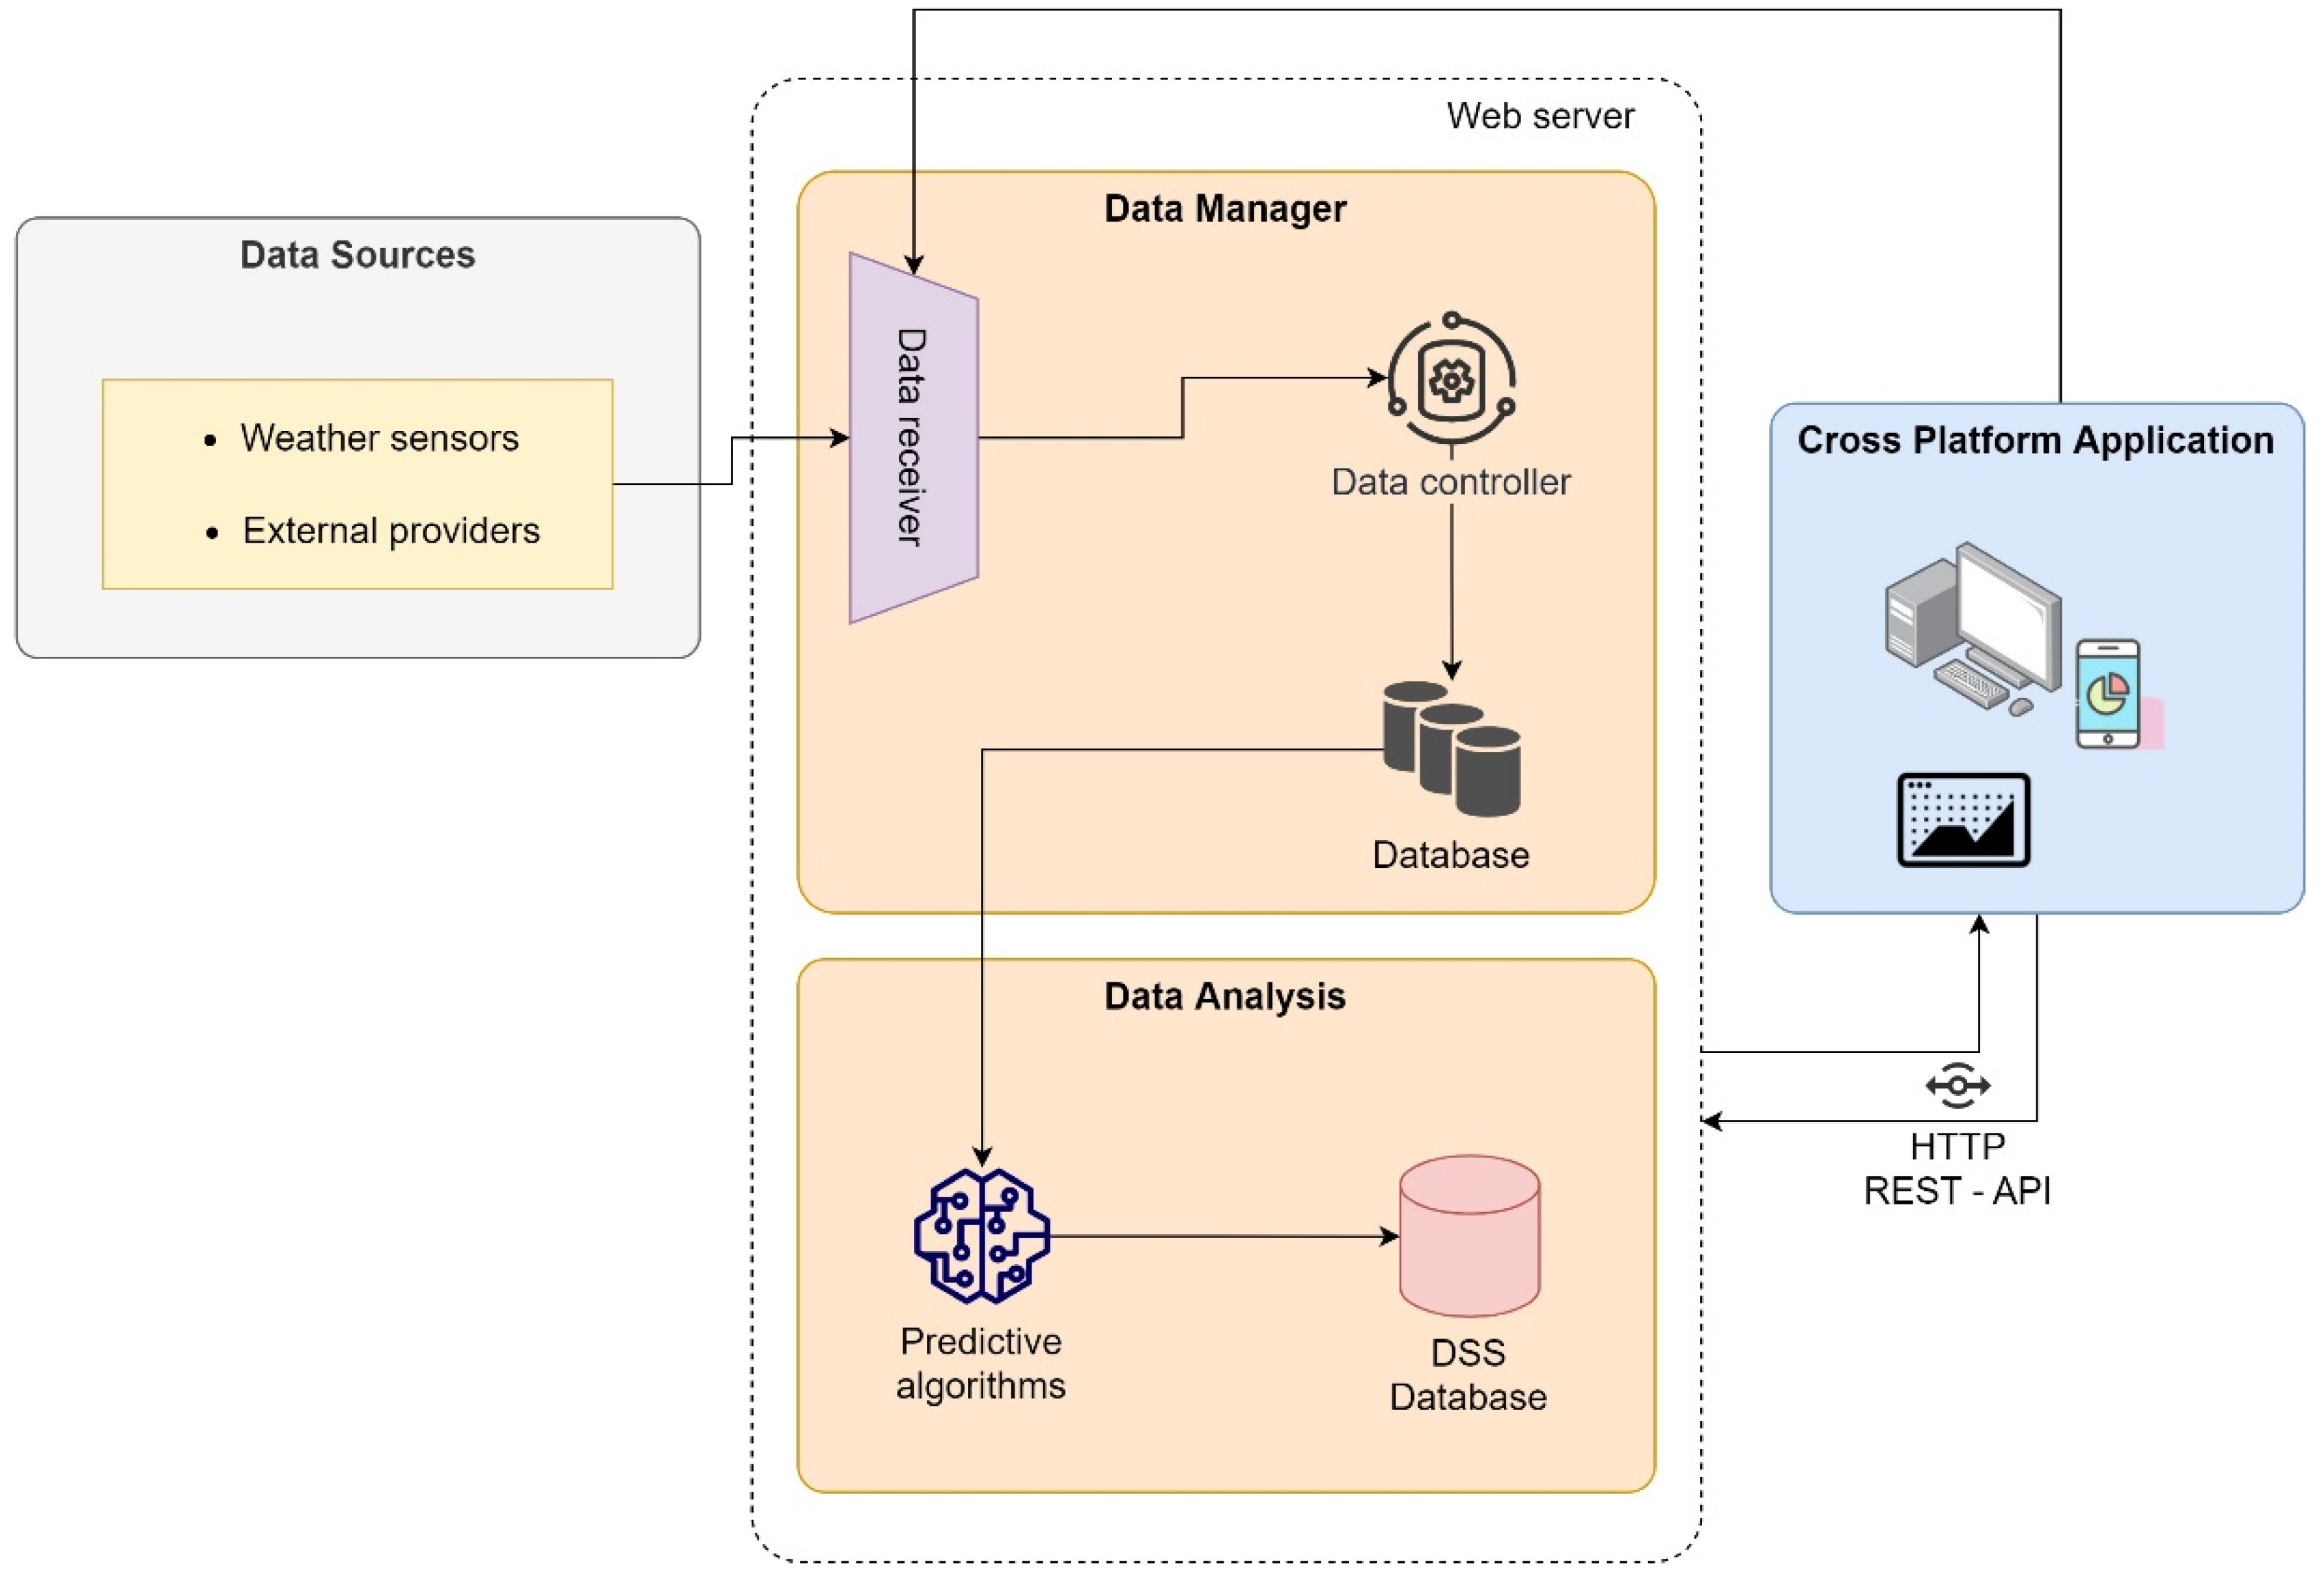
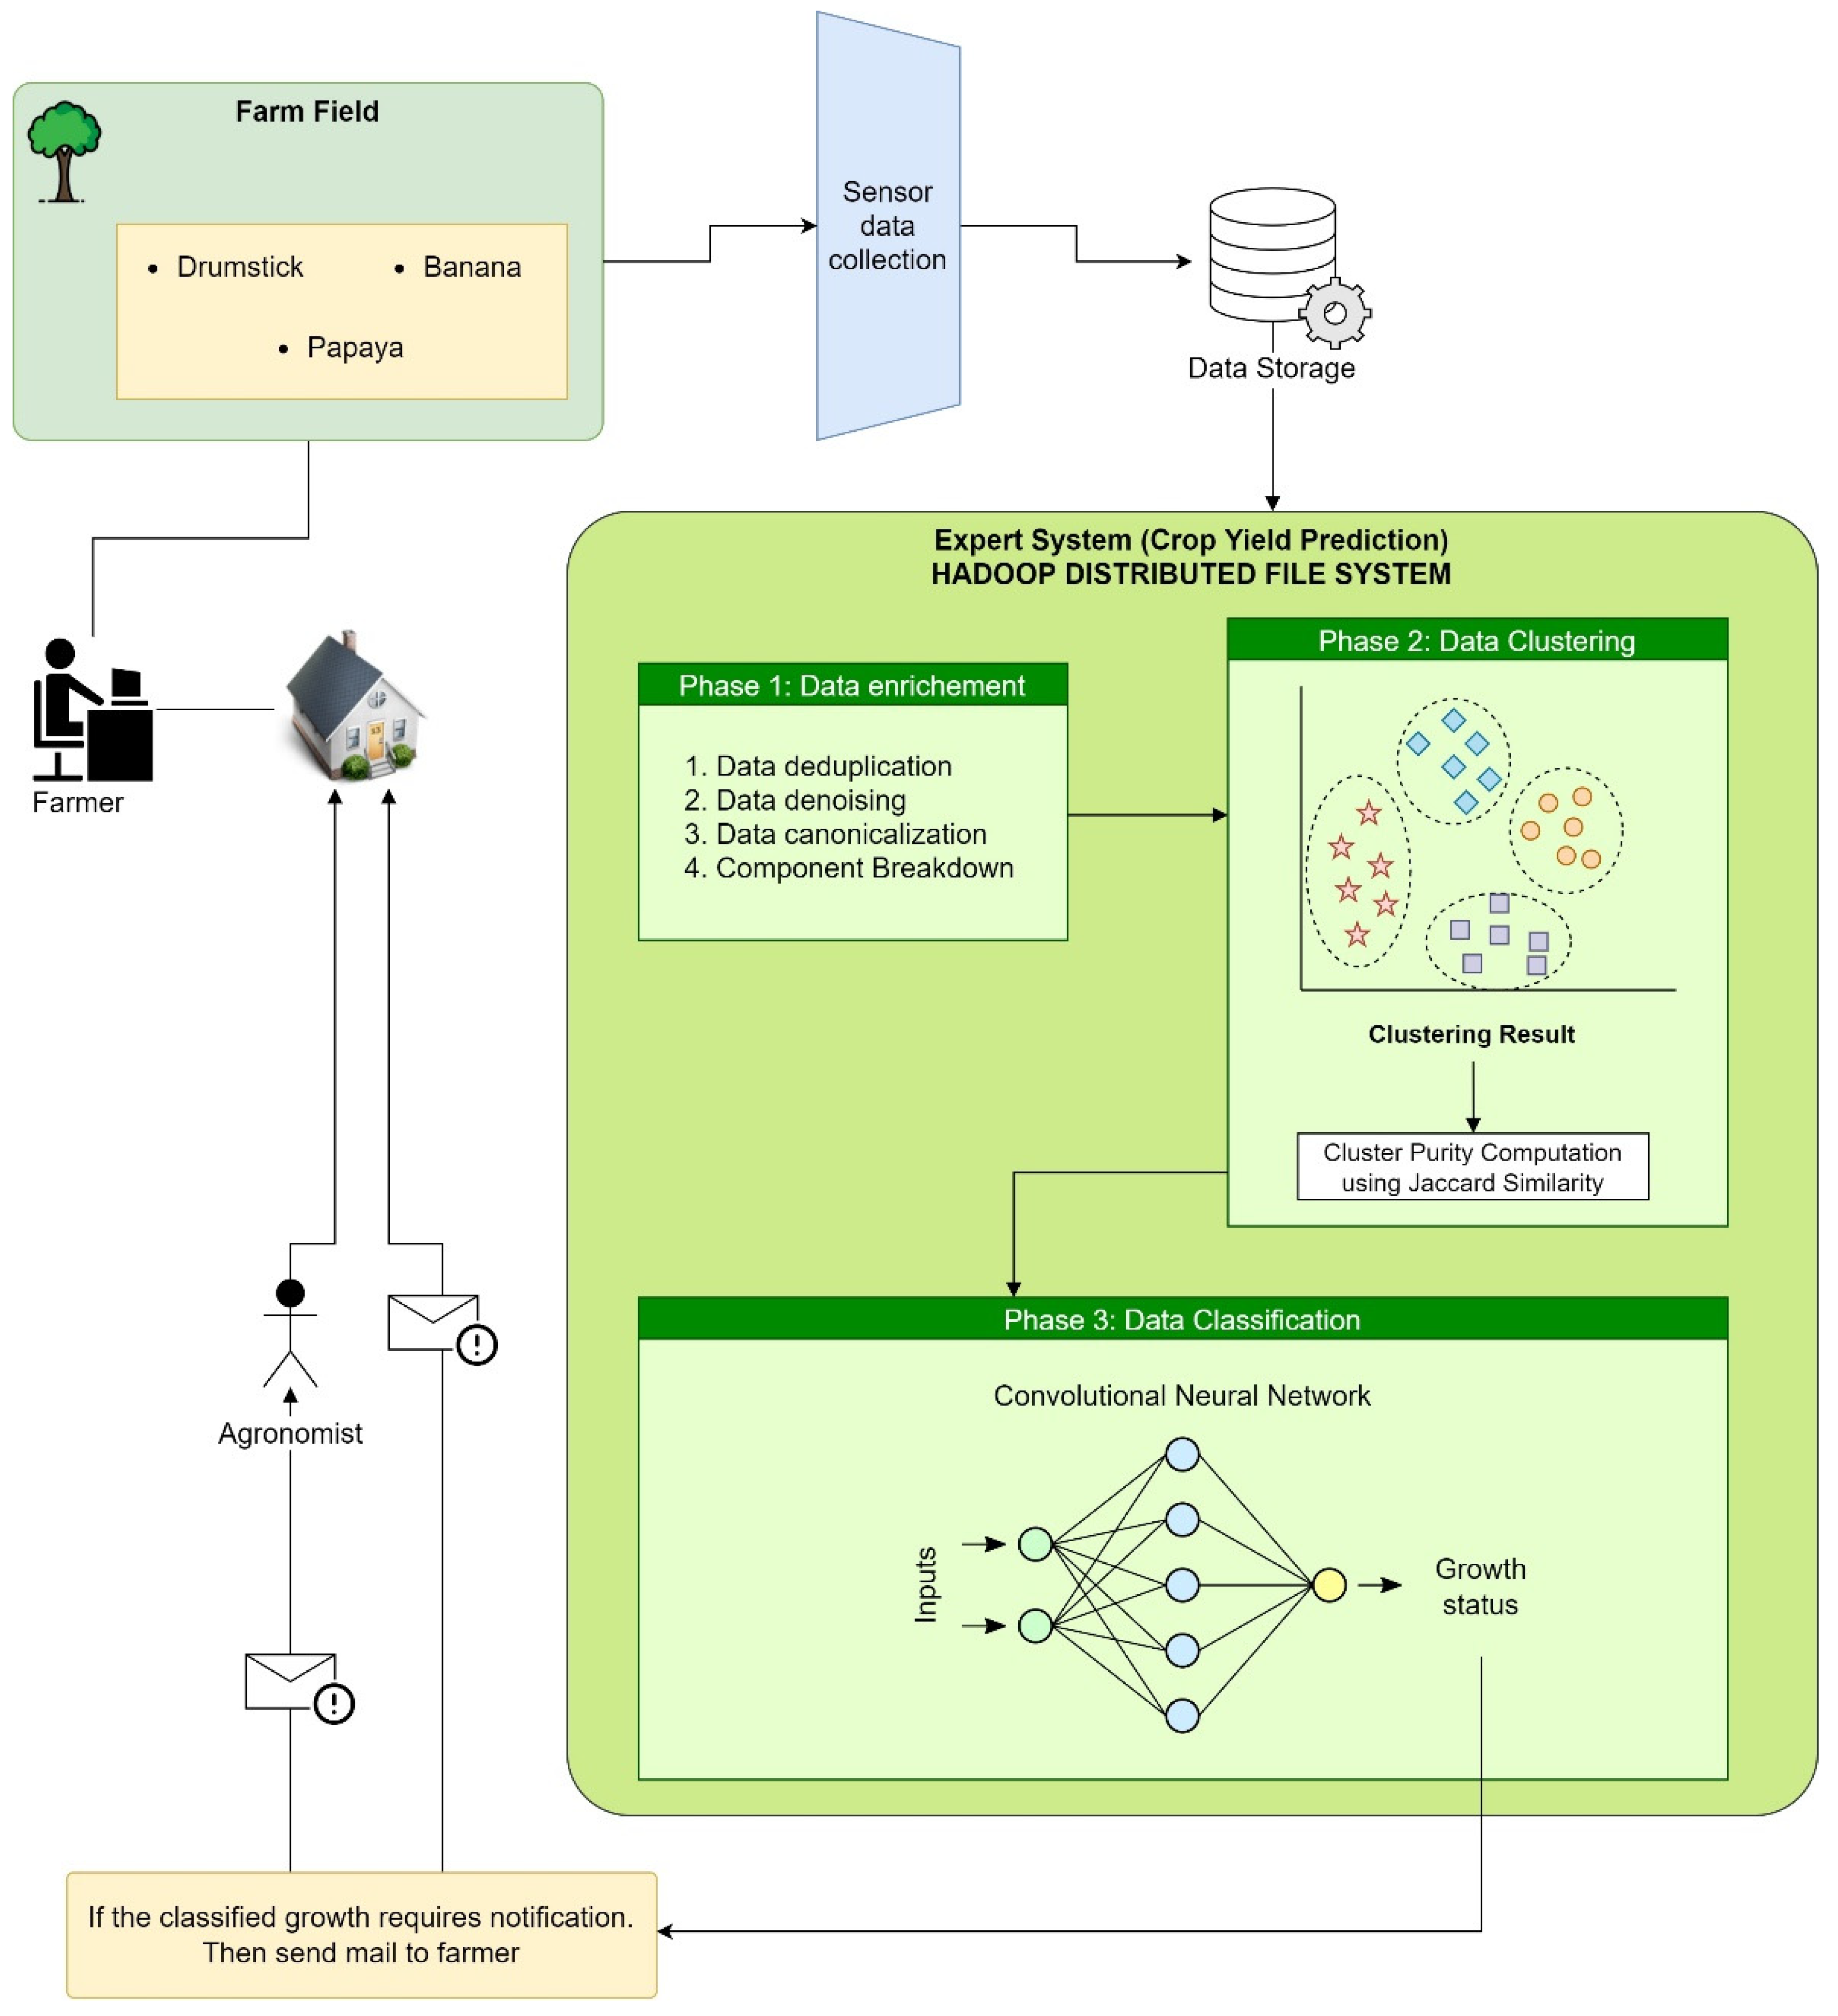
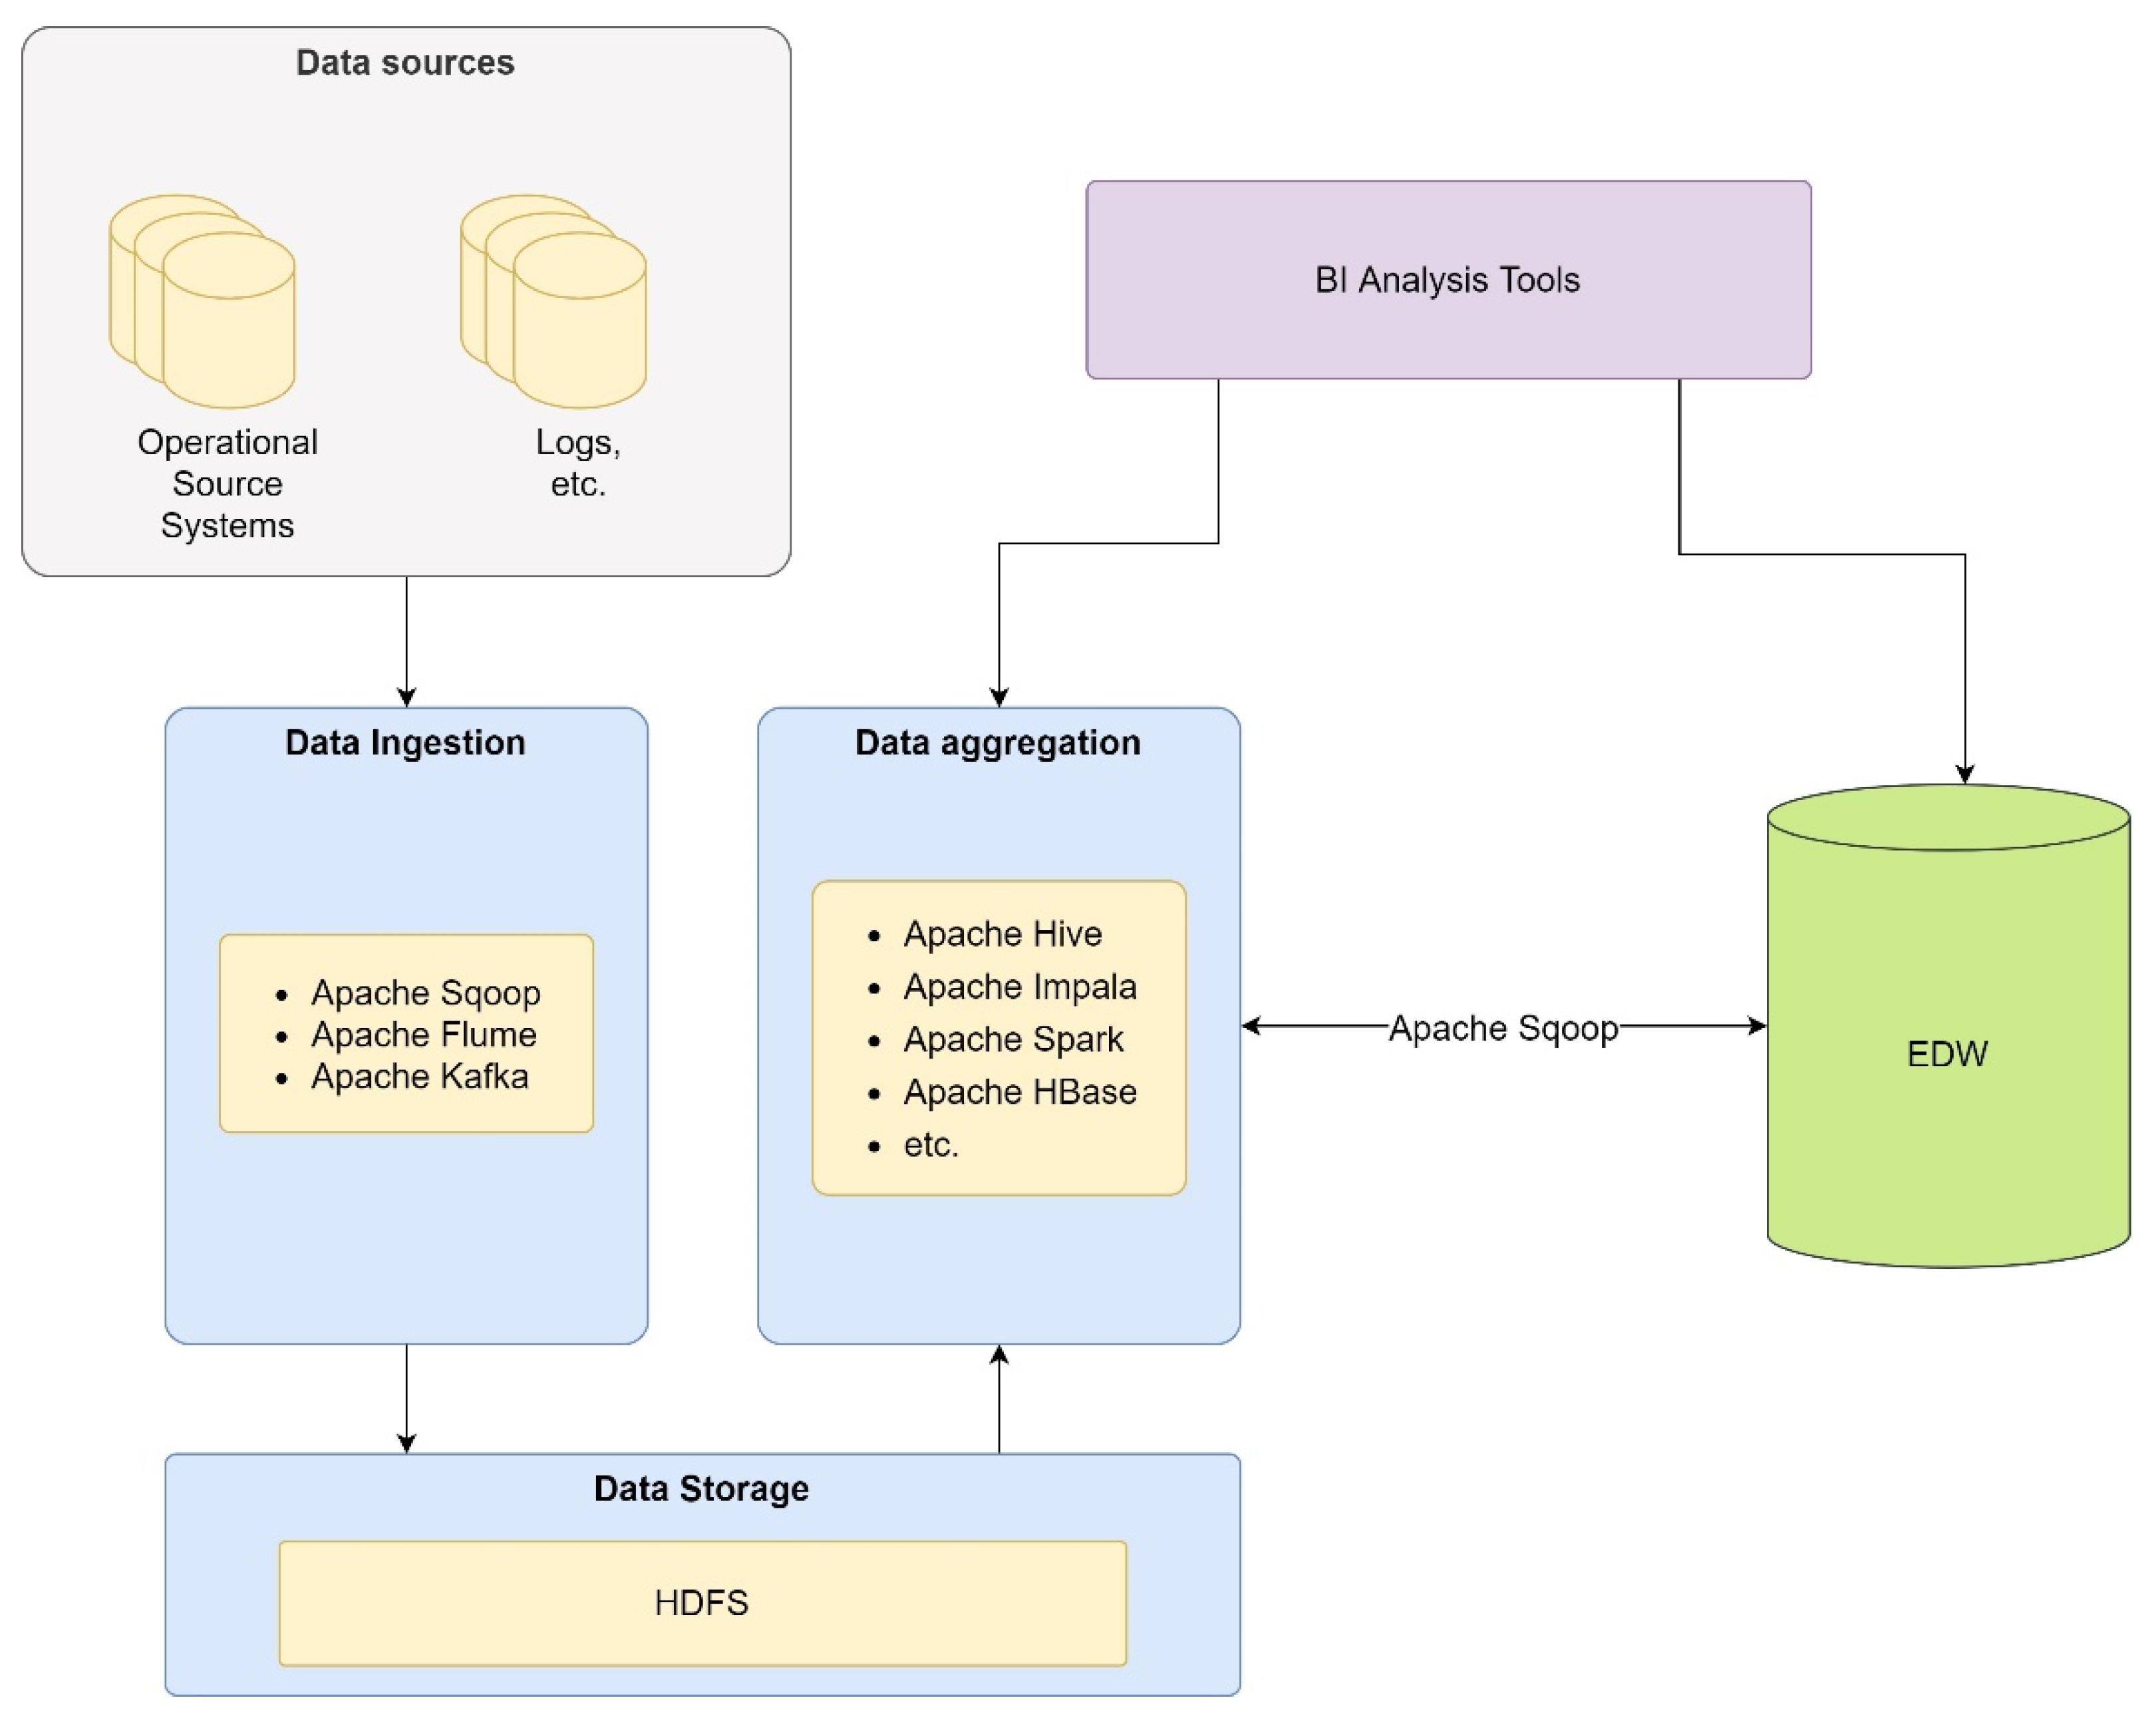
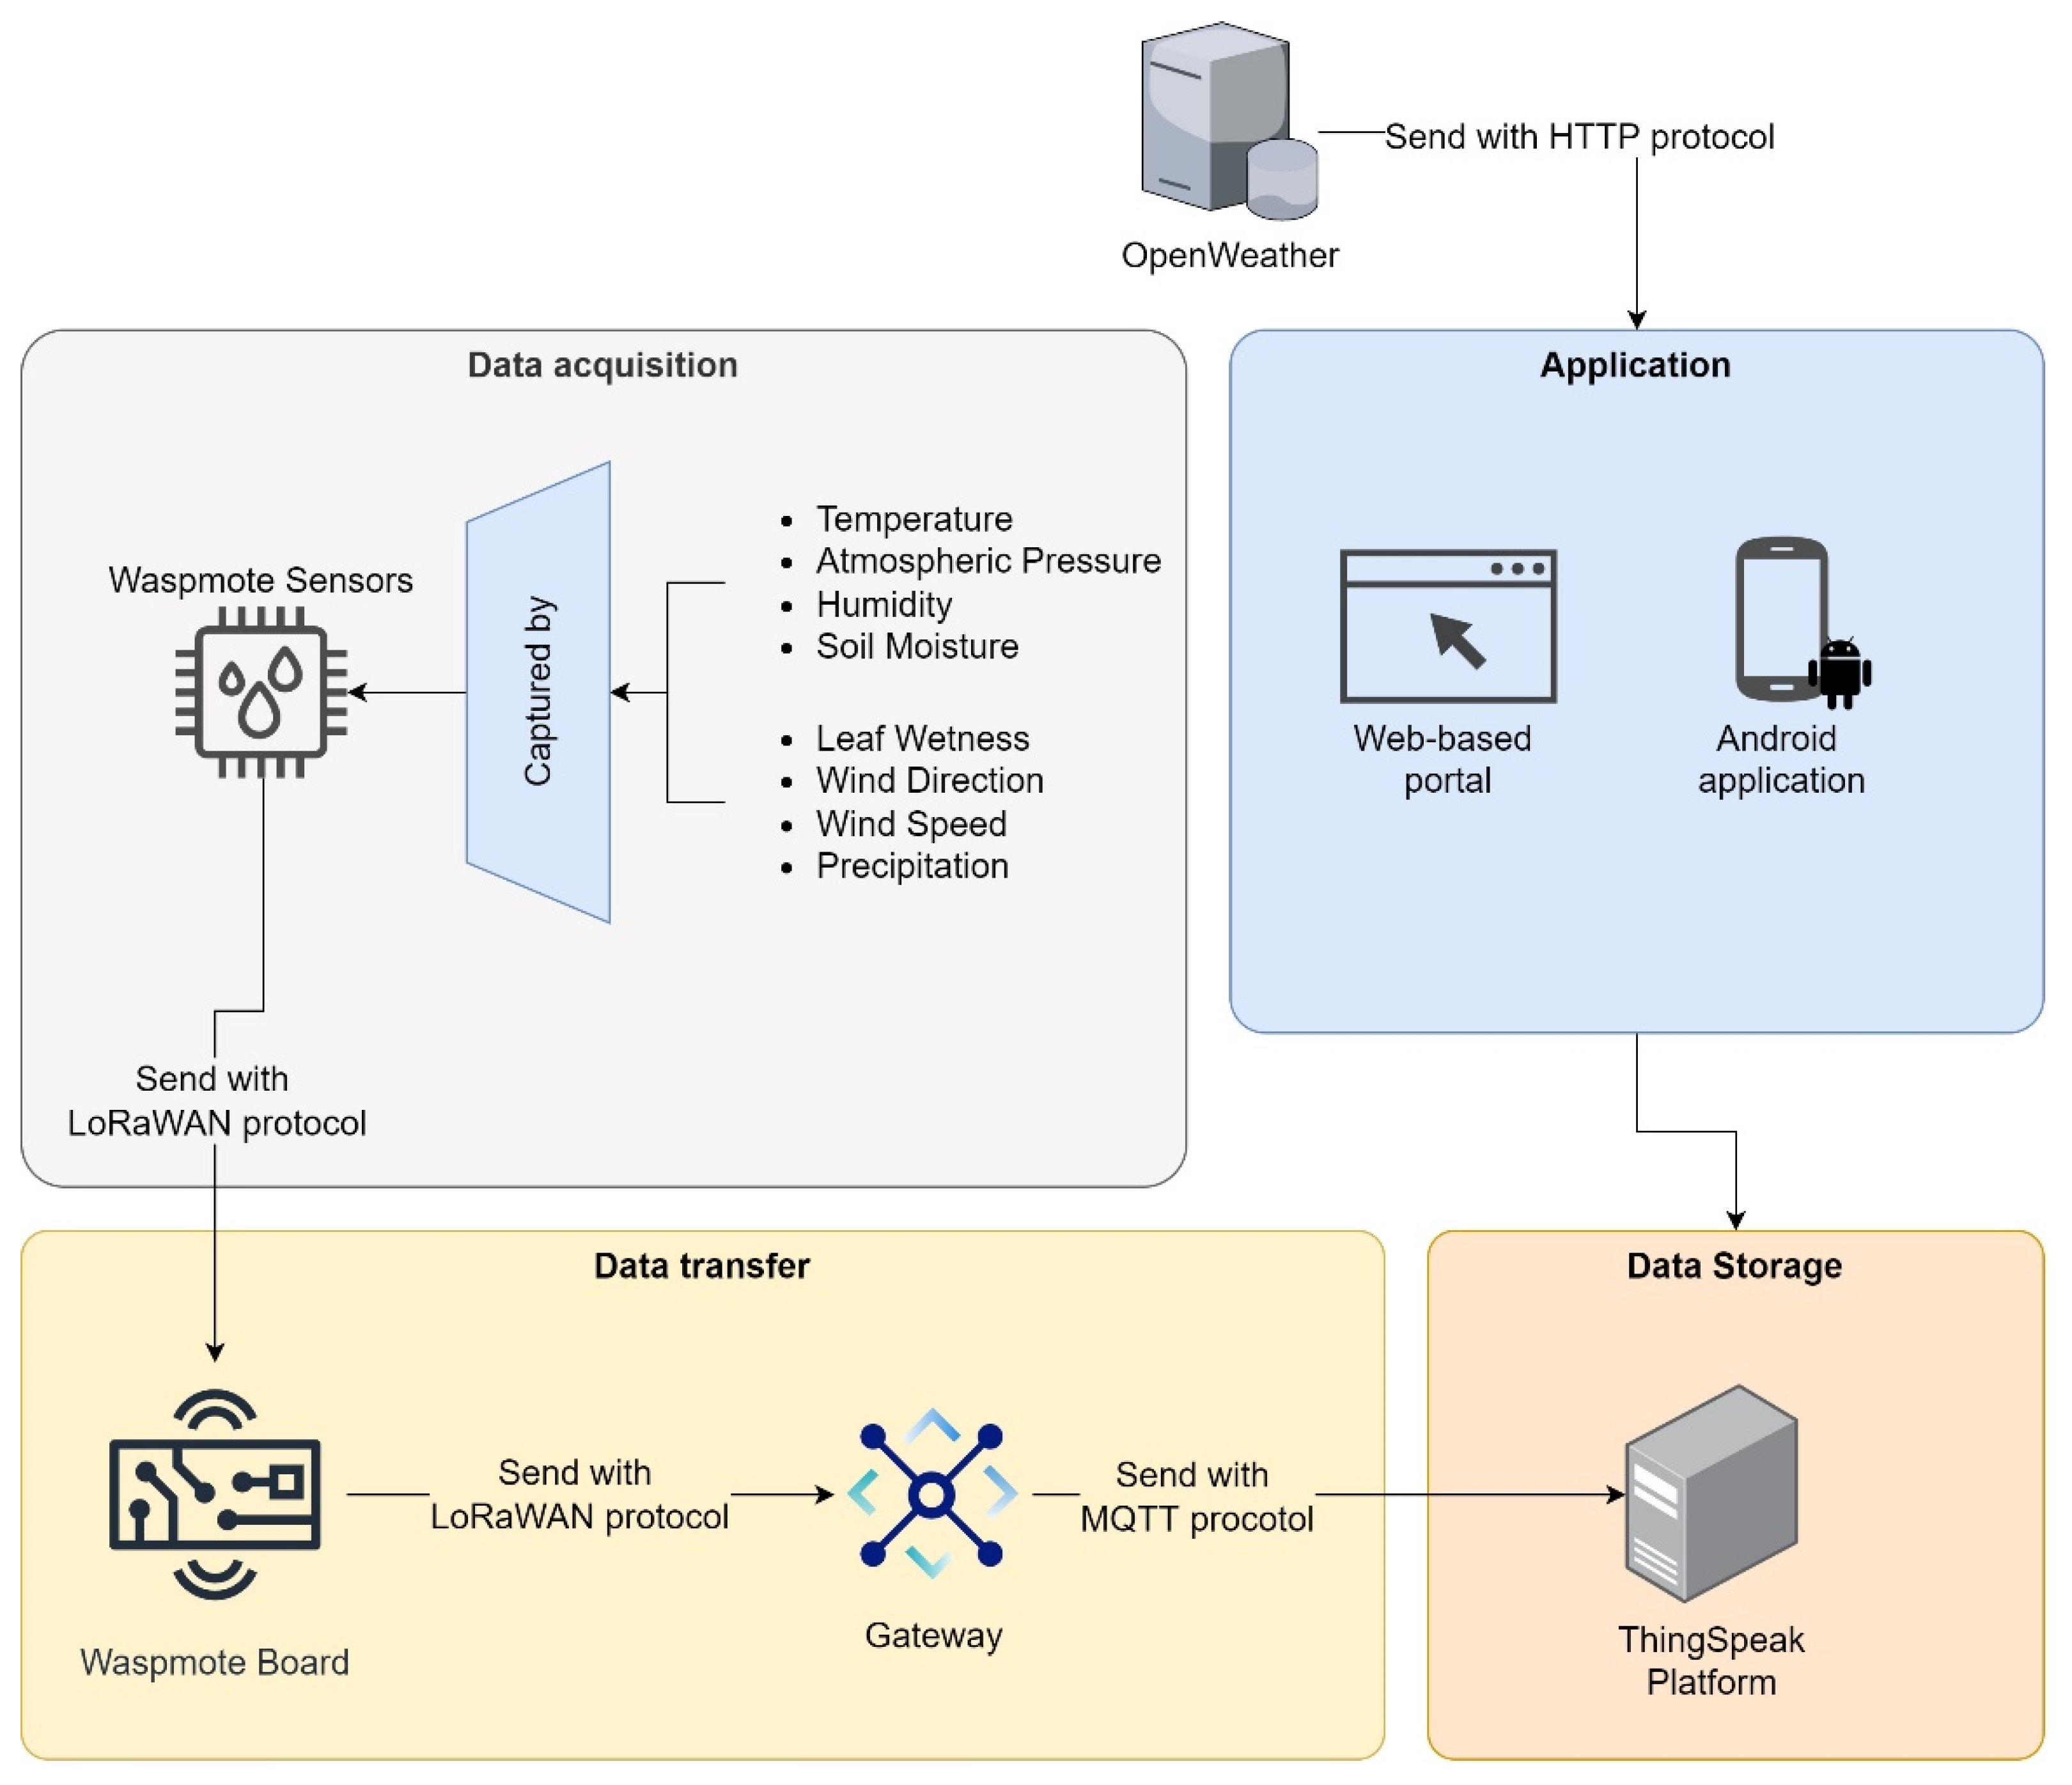

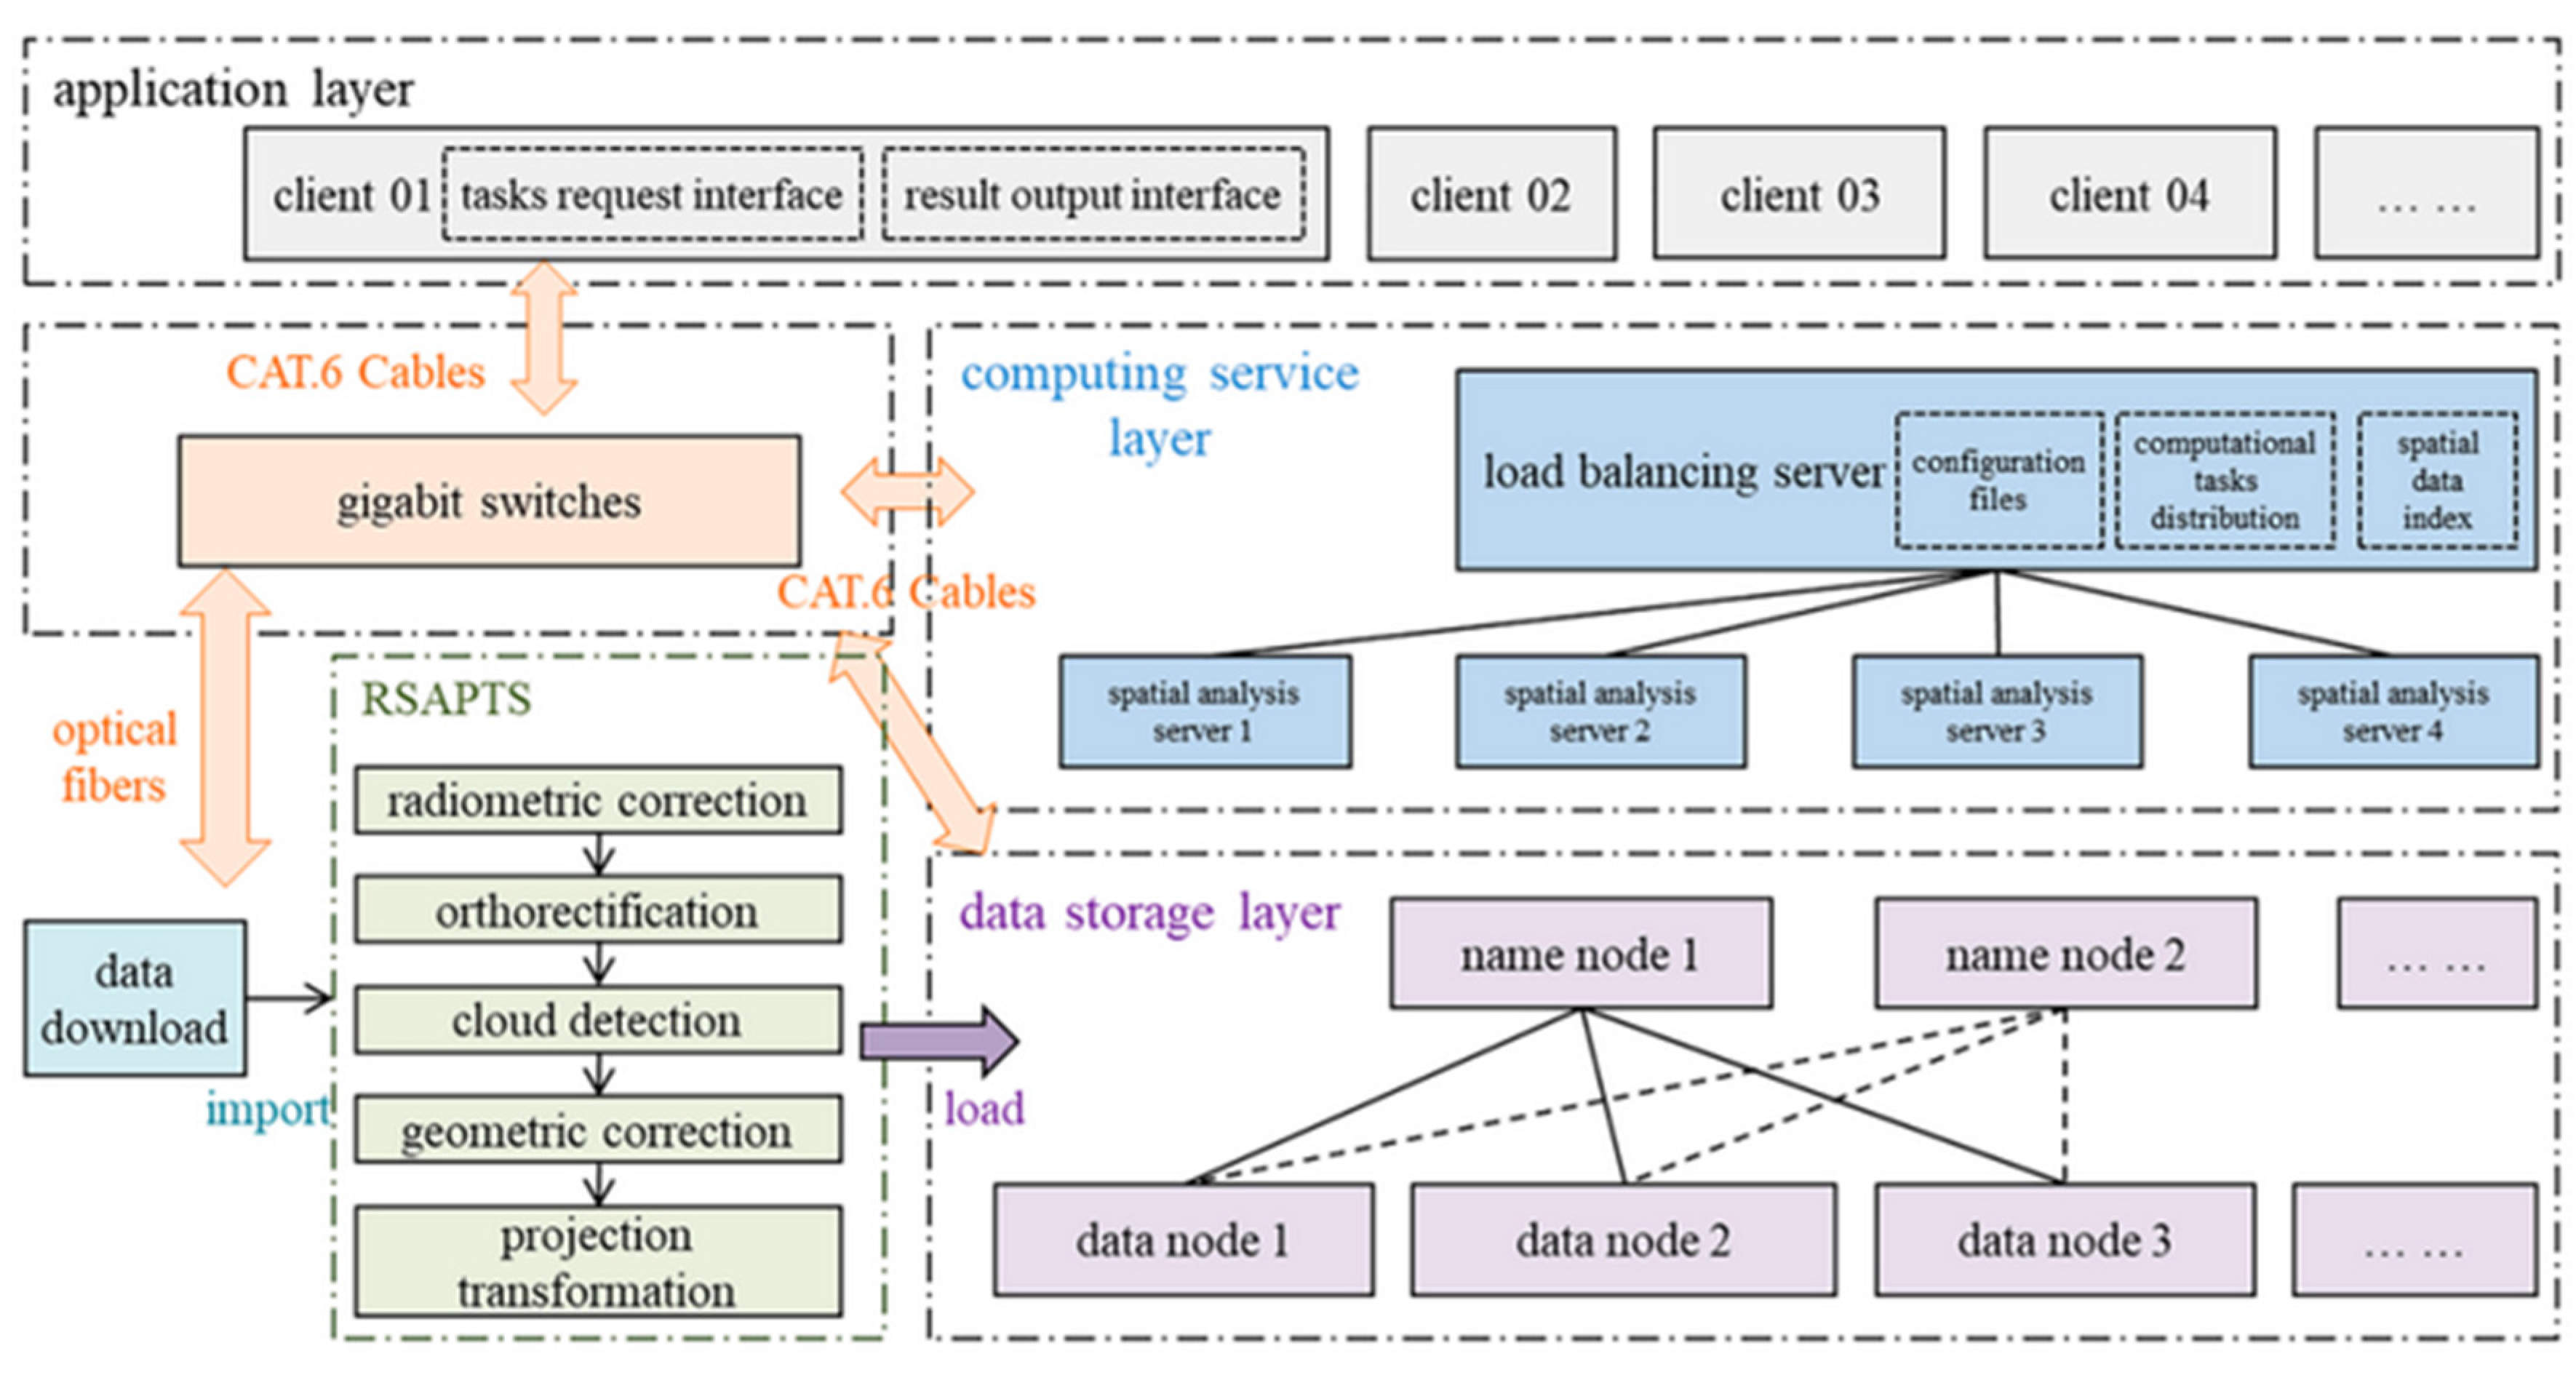
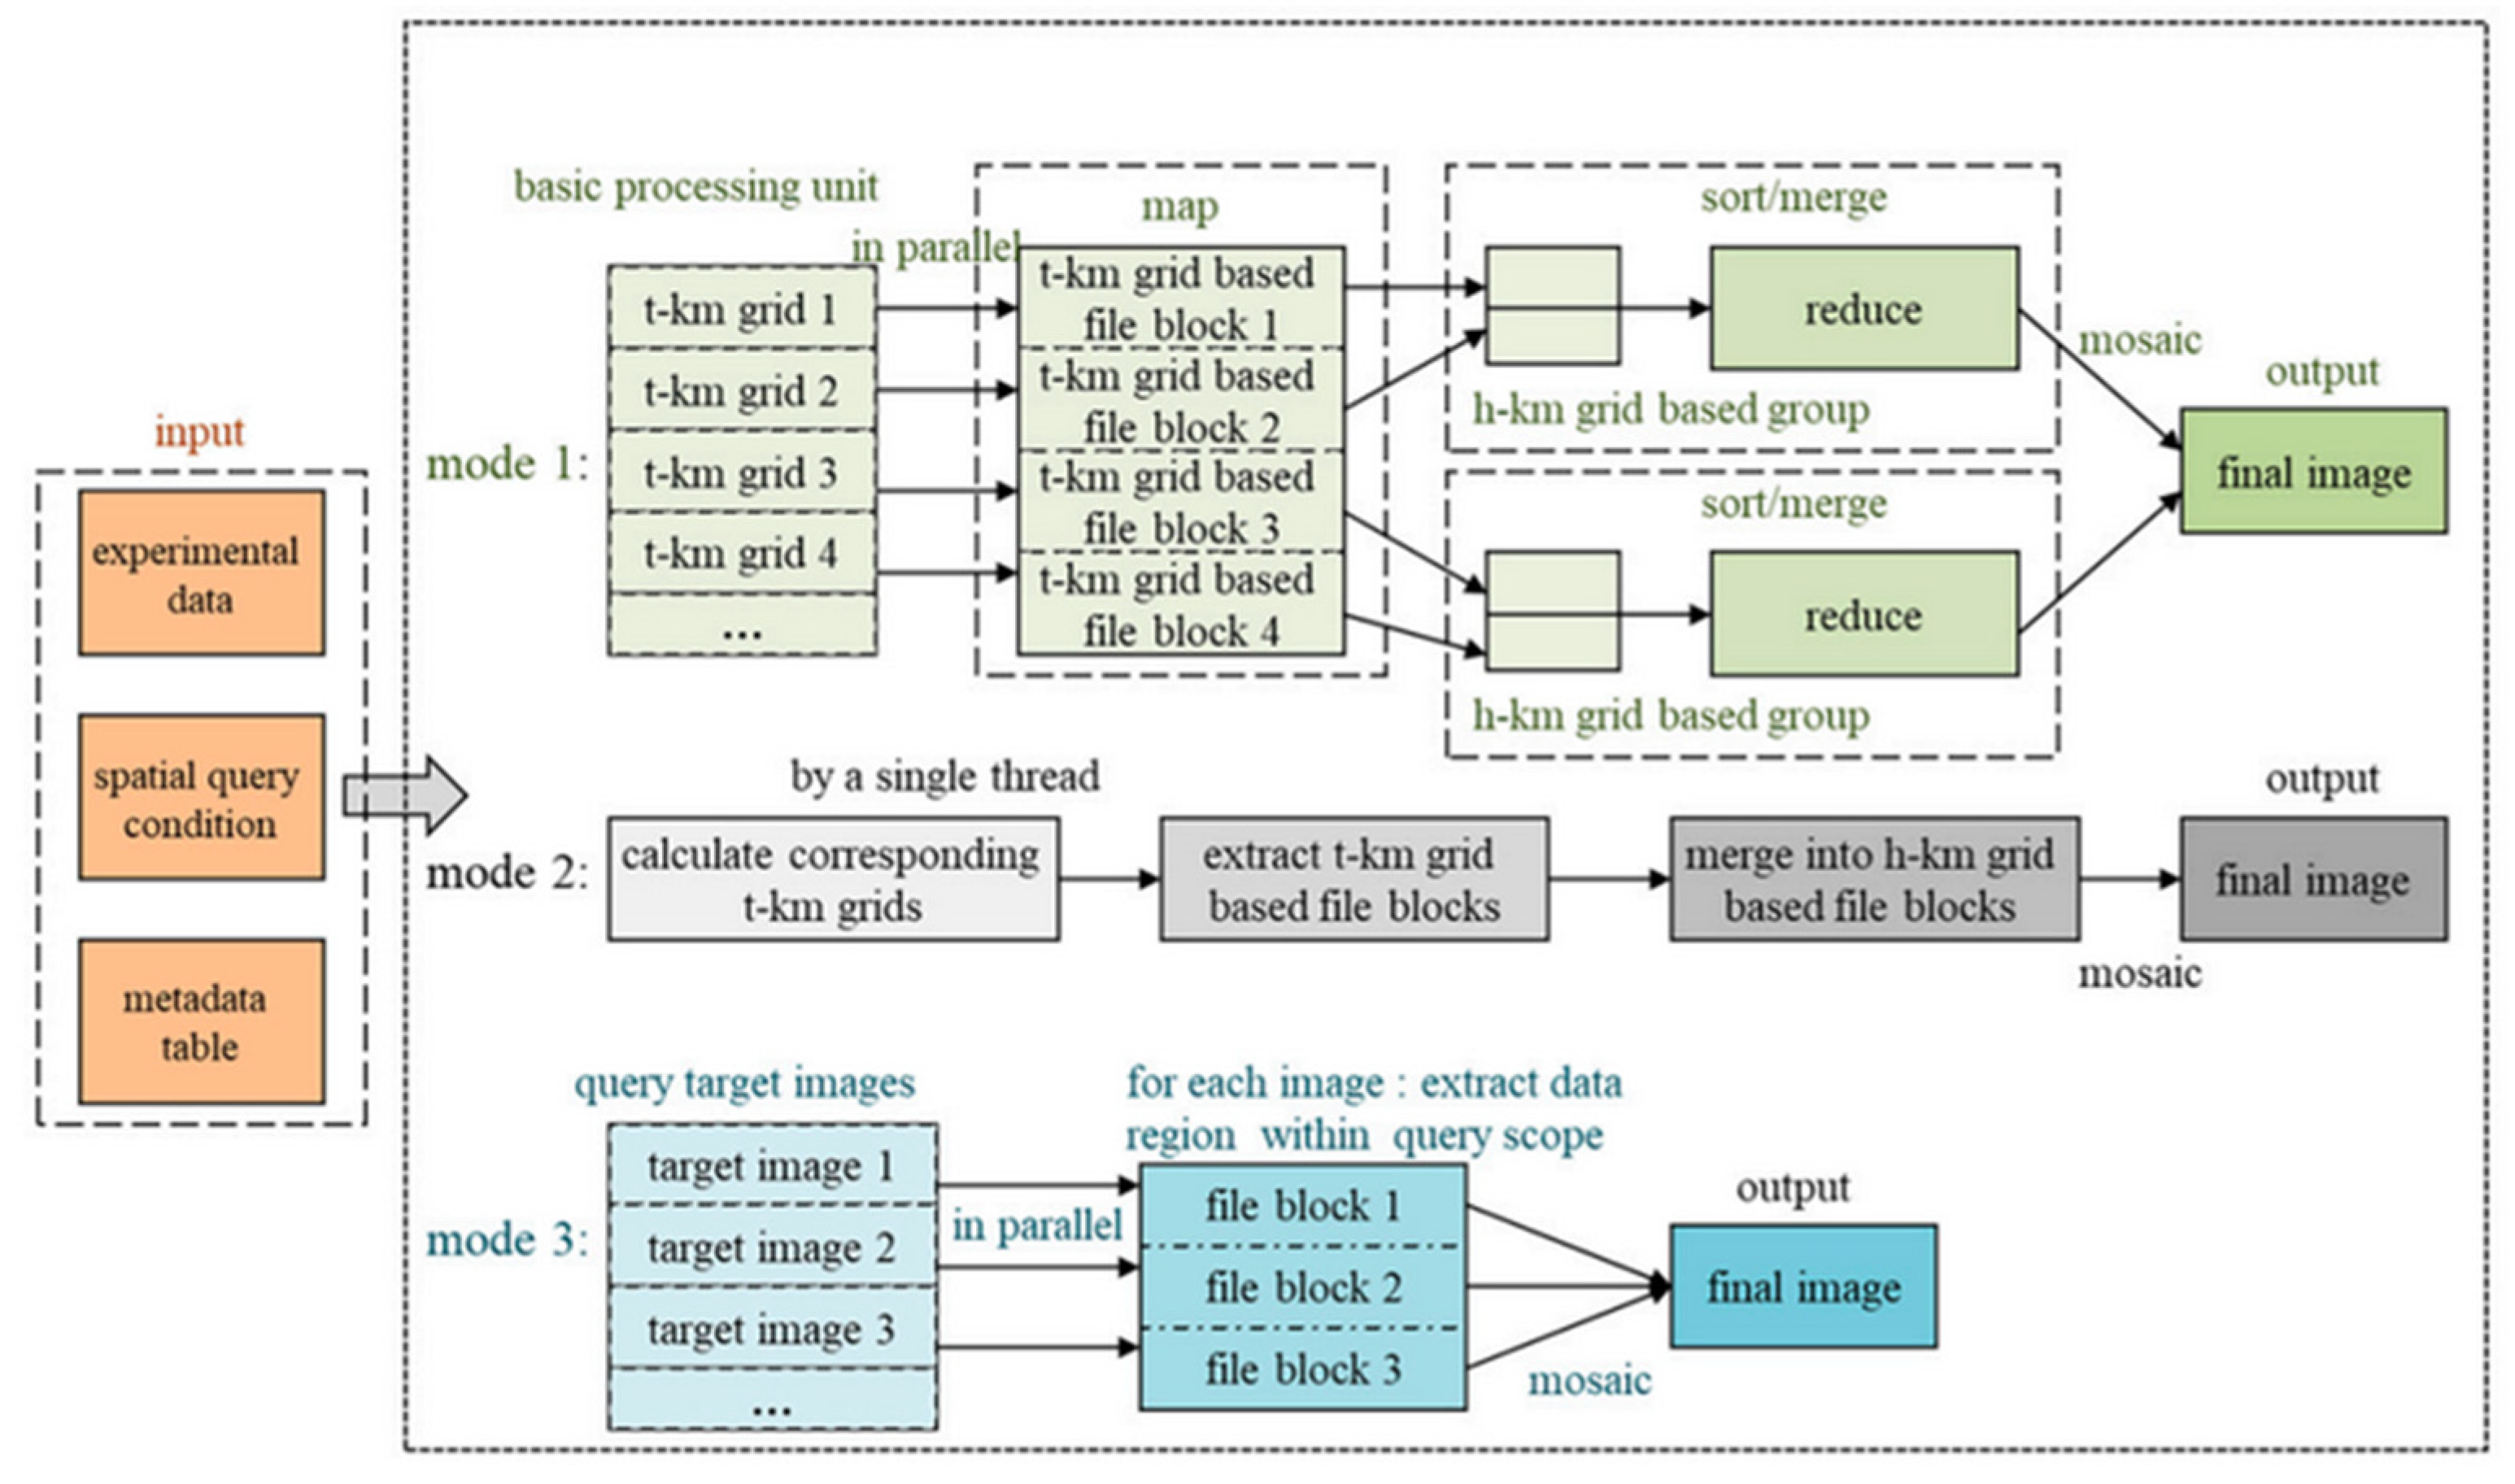
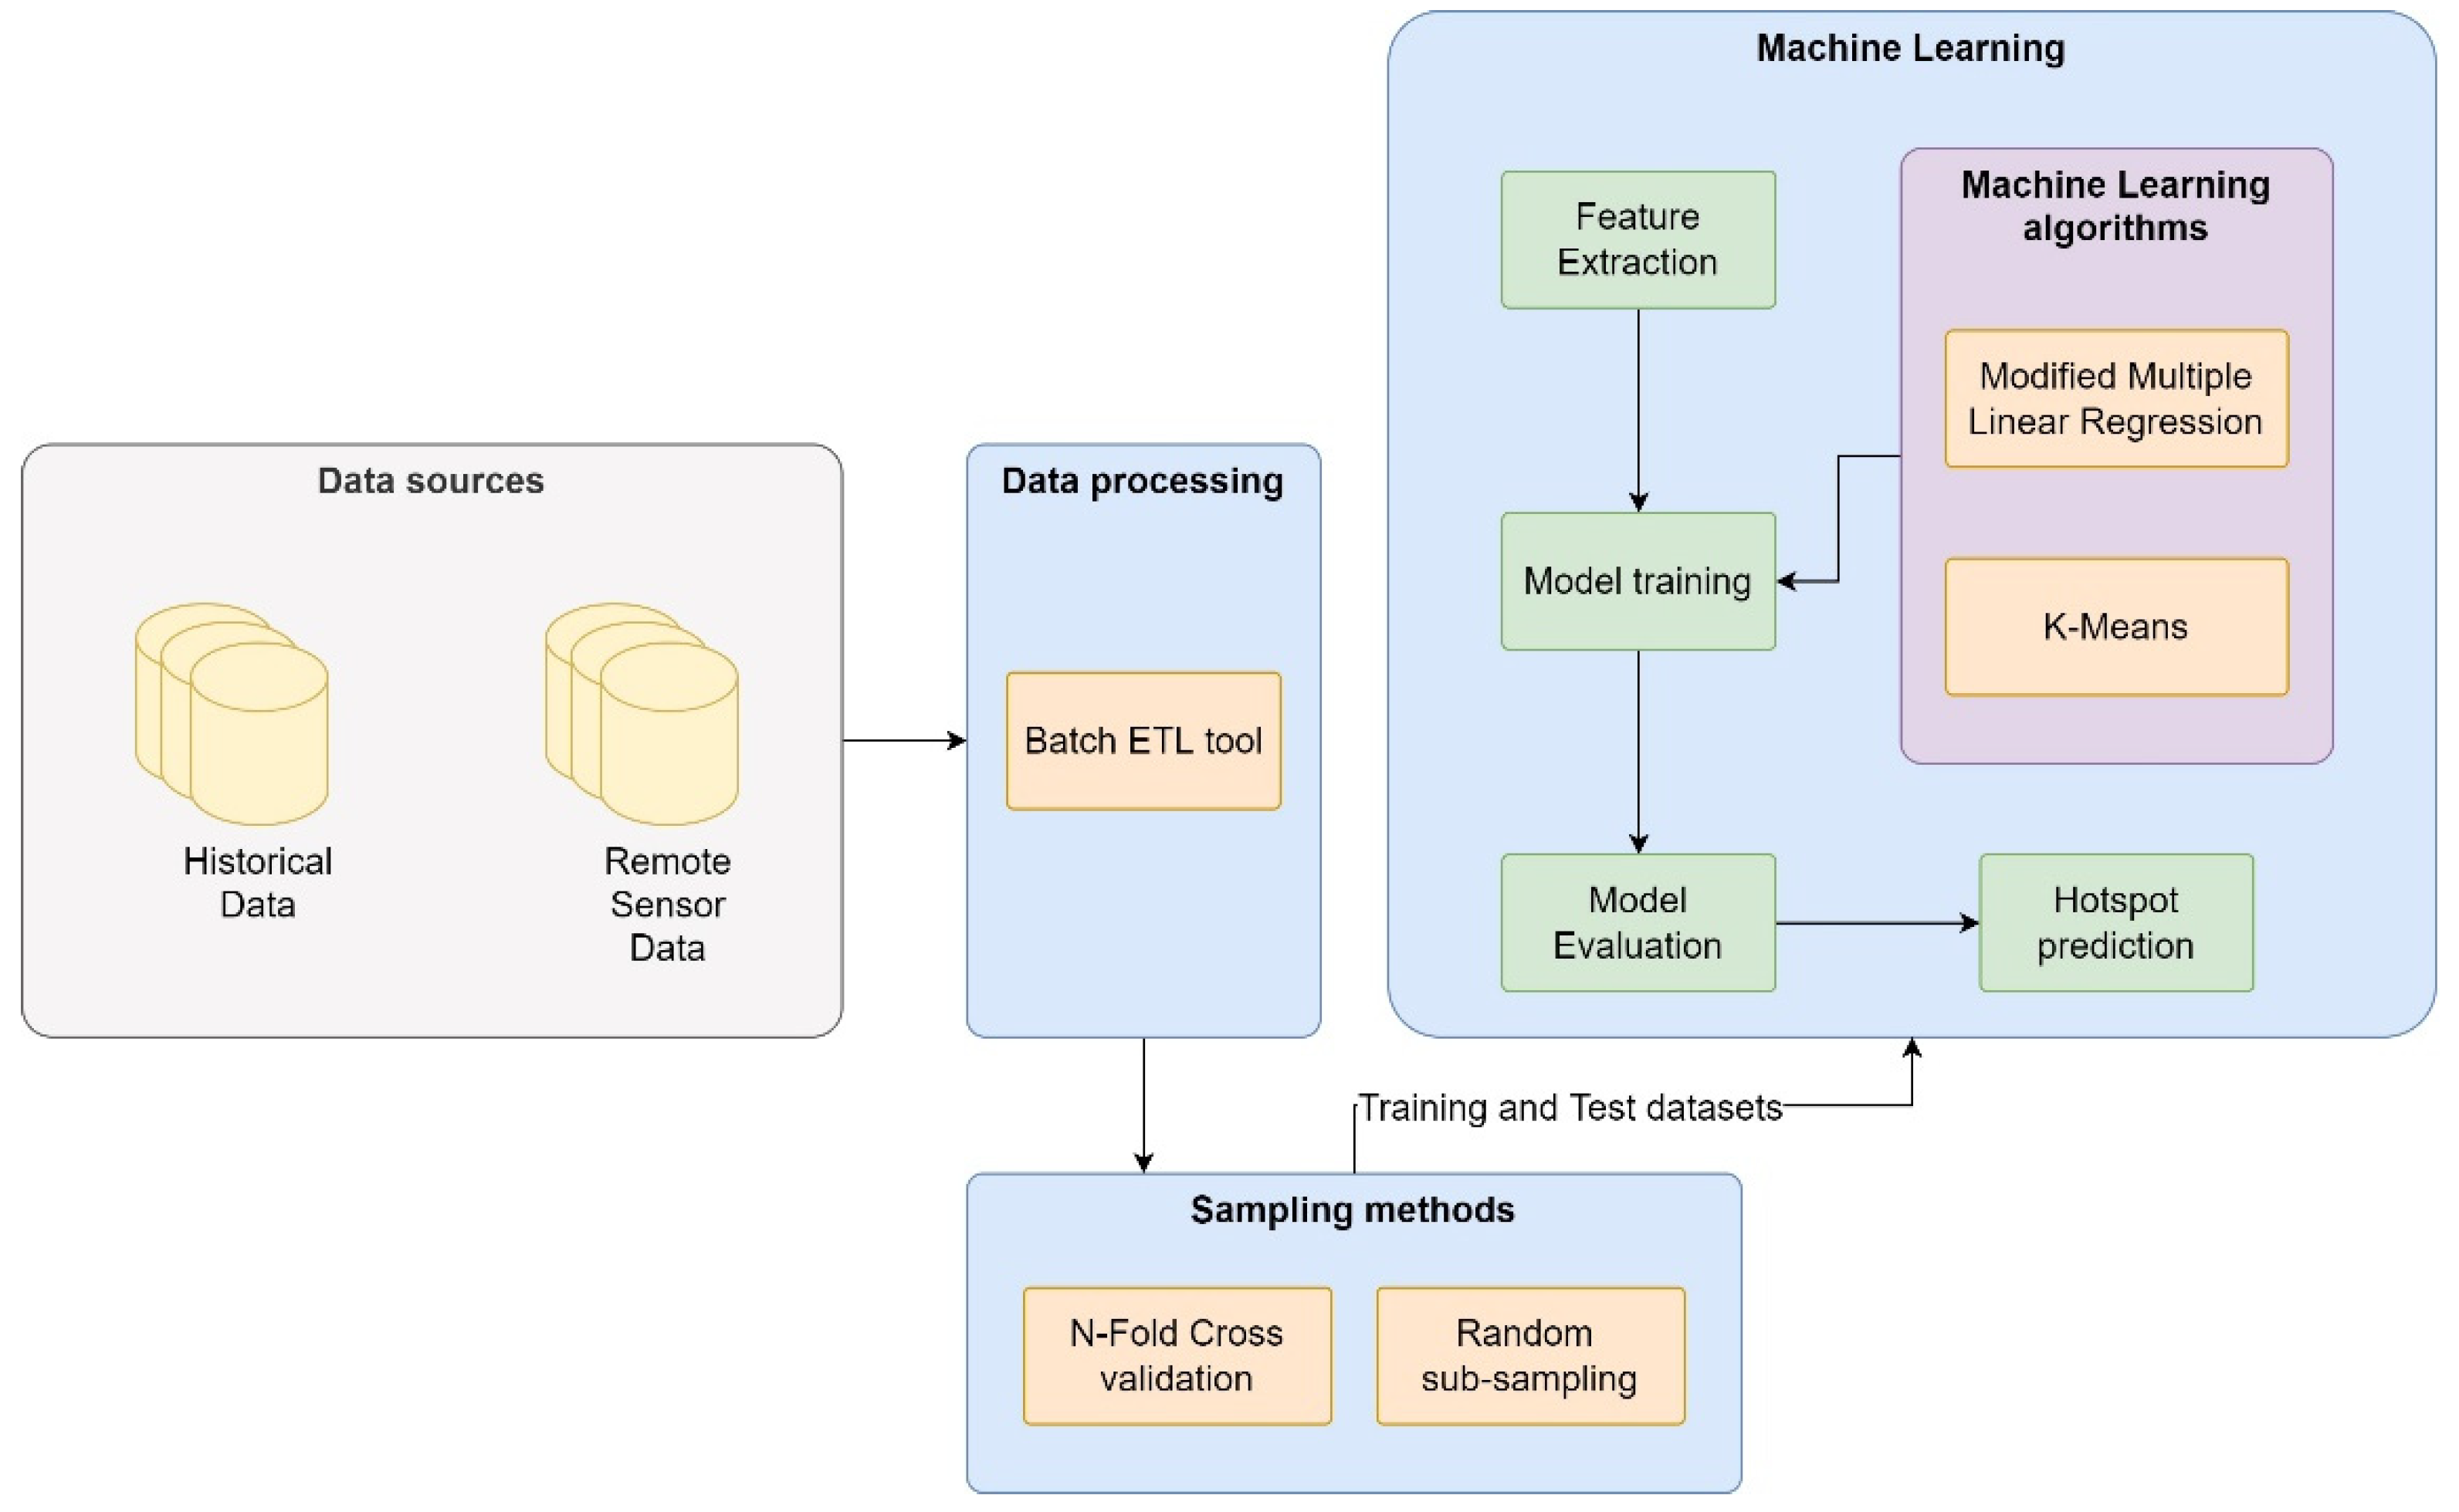
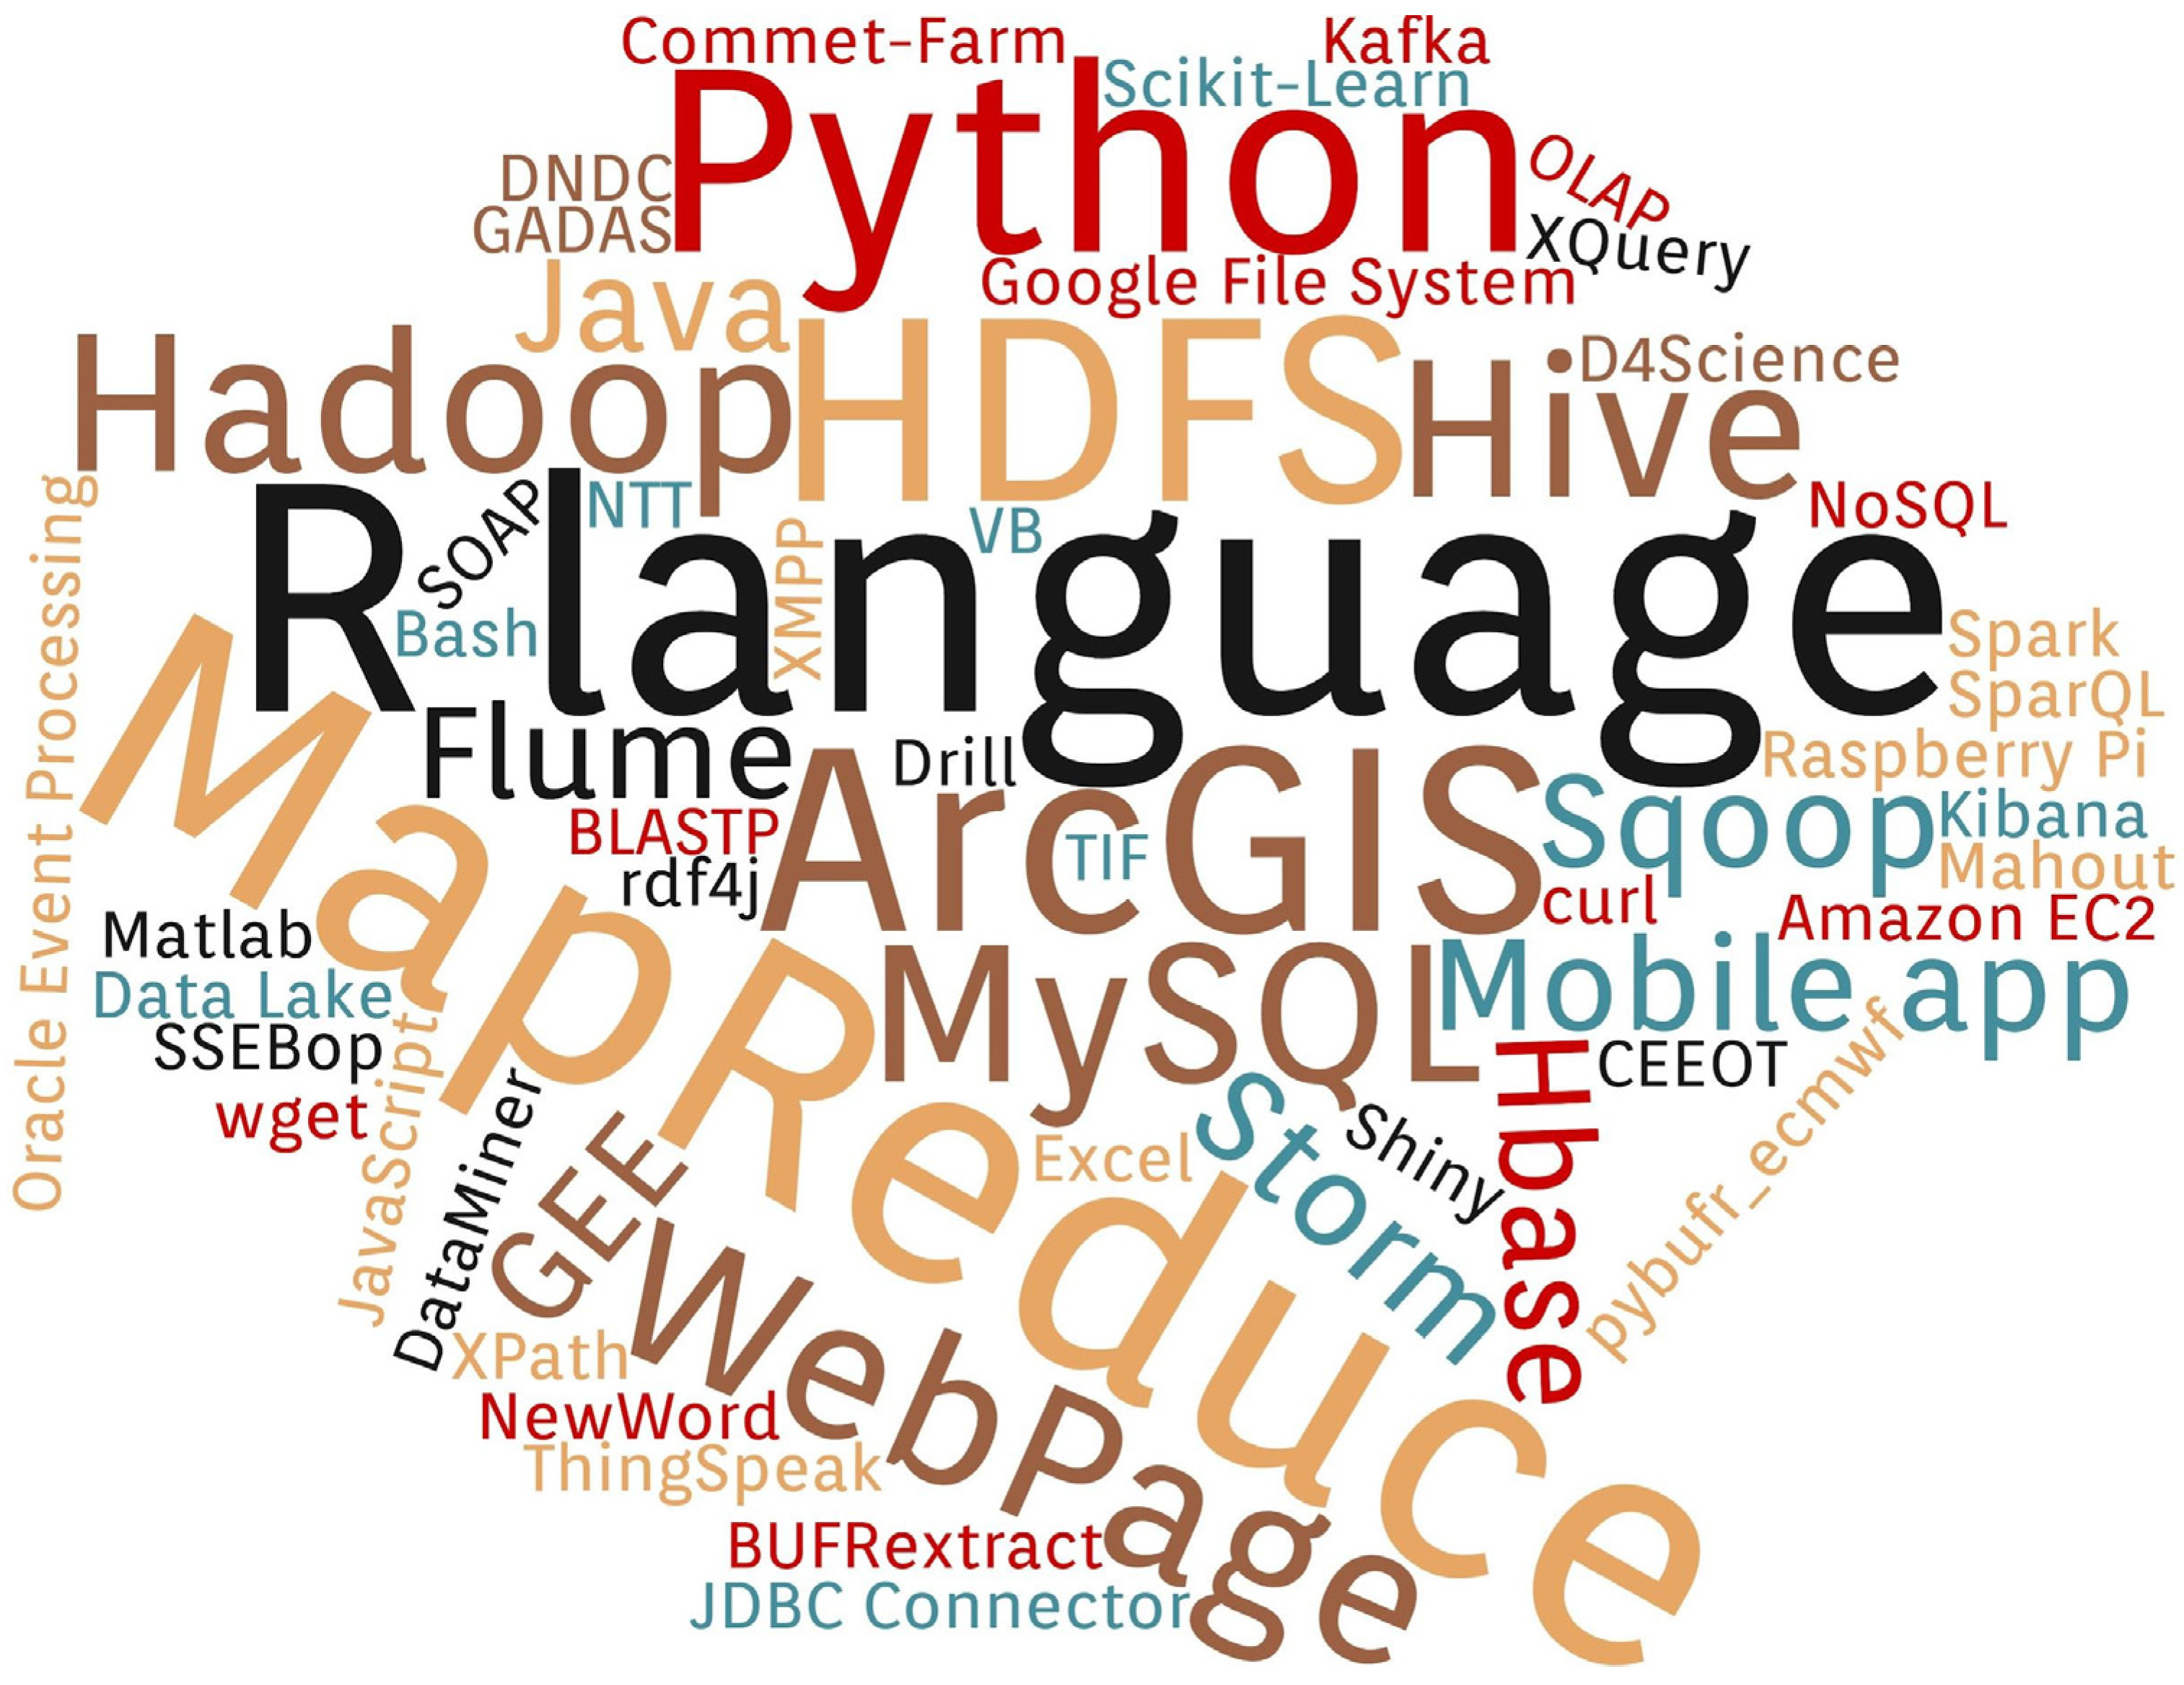

Publisher’s Note: MDPI stays neutral with regard to jurisdictional claims in published maps and institutional affiliations. |
© 2022 by the authors. Licensee MDPI, Basel, Switzerland. This article is an open access article distributed under the terms and conditions of the Creative Commons Attribution (CC BY) license (https://creativecommons.org/licenses/by/4.0/).