Article

Development of a Methodology for Assessing Workload within the Air Traffic Control Environment in the Czech Republic

1
Faculty of Military Technology, University of Defence, Kounicova 65, 662 10 Brno, Czech Republic
2
Czech Air Forces, 22. Helicopter Air Base, Sedlec, 675 71 Vicenice u Nameste nad Oslavou, Czech Republic
*
Author to whom correspondence should be addressed.
Sustainability 2022, 14(13), 7858; https://doi.org/10.3390/su14137858
Submission received: 10 May 2022 / Revised: 22 June 2022 / Accepted: 24 June 2022 / Published: 28 June 2022

Abstract

:
The increase in civil aviation traffic and, in general, in aviation traffic going through airspace or a military terminal control area, and the increase in military operations in temporarily reserved areas bring higher requirements for airspace throughput and for the workload of military air traffic controllers. For an objective assessment of the military air traffic controllers’ workload, it is desirable to set the maximum level of workload that can be required of such personnel. This assessment is also important for planning staffing and training. In the civil air traffic control environment, the workload of air traffic controllers is clearly determined by the complexity and density of air traffic, i.e., the throughput capacity of sectors. However, this method is not suitable for measuring the workload of military air traffic controllers, because the nature of military flight activities requires solving different situations in the airspace and thus generates a different workload. One way of obtaining more objective data on the actual workload of military air traffic controllers is to accurately determine the difficulty of individual air traffic control activities, i.e., the most common activities carried out by military air traffic controllers in the course of their duty. The difficulty of a selected air traffic control activity will be represented by a weight. A method for determining this weight is presented, including the proposal of specific weights for the calculation of the military air traffic controllers’ workload during simulation training, using the functionality “Workload”.

1. Introduction

Air traffic is a rapidly developing, dynamic environment. Military and civil aviation, despite the differences in their purpose, are very closely interconnected and require coordinated development. Military air traffic control (ATC)—unlike civil air traffic control—provides air traffic services for all airspace users, including civilians, within the areas of responsibility of their units. The current approach in the assessment of the workload of civil air traffic controllers focuses on two main load indicators, which are the density and complexity of the air traffic operations [1,2,3].
Workload is a term that has been said to be “notoriously difficult to define” [1]. It is used for defining the requirements for a task or a mission. Mental workload, according to Wickens [2,3], is a multidimensional construct, including the level of attentional engagement and effort that a person must expend to perform a given task [4]. In 2018, Feng et al. published a paper about a comprehensive prediction and evaluation method of pilot workload where the Timeline Analysis and Prediction (TLAP) method and McCrachen–Aldrich (M-A) prediction technology were used as two major prediction methods [5]. From the available literature on load assessment, he also mentioned, for example, the research realized in collaboration with the French Ecole Nationale de l’Aviation Civile (ENAC, Toulouse). Its authors developed and tested a specific task for the en route ATC. The task’s difficulty was altered according to how many aircrafts the participant had to control, the number and type of clearances required over the time and the trajectory of other interfering aircrafts. During the experiments, the Electroencephalogram (EEG), the Electrocardiogram (ECG), the Electrooculogram (EOG), the behavioral data and the perception of the workload were collected. Readers are referred to [6] for more details. Unlike the workload of pilots, where there are many studies and methods for examining and evaluating this workload, e.g., [7,8], for air traffic controllers, this is not the case.
The main difference between military and civil aviation is the nature of air traffic. Military training flights are planned on a daily basis, which means that there is no room for changing air traffic control staff at stations and it is not possible to effectively prepare for peak air traffic control operations on the day these situations occur [9,10]. In the context of standard operations at military air traffic control units, an intervention aircraft must also be used to protect airspace, if necessary [11].
In civil aviation, the ultimate goal, while maintaining safety, is to handle as many flights as possible and to ensure an orderly and efficient flow of air traffic. This is ensured by flight schedules and flight planning on routes in the airspace, controlled by the Network Manager Operation Centre (NMOC) operated by Eurocontrol. An operational capacity in the civilian air sectors is defined so that the air traffic controller is able to safely handle it, taking into account systemic functionality. However, in the Czech Republic, the air traffic flow capacity for military airbases is not defined, so it is necessary [12] to propose an alternative solution that ensures well-organized air traffic control, its safety, and the optimal use of human resources in flight training.
The Institute of Air Navigation Services (IANS) in Luxembourg is the most important European scientific center for examining the workload of air traffic controllers. The IANS provides training for various positions in air traffic flow management and makes recommendations for optimizing work processes in relation to the economy and operational efficiency, as well as maintaining an acceptable level of safety in European airspace. These include, for example, sub-system recommendations with local or international impact that improve either the quality of the flight data exchange between air traffic control units or measures to prevent the obstruction of air corridors. Despite the high functionality and effectiveness of these measures, it can be concluded that they are not fully applicable to the needs of the Army of the Czech Republic, because military domestic VFR training flights do not fall within the resources for calculating the capacity management of air traffic within the NMOC system.
Determining the level of workload of individual ATC (air traffic control) activities is in fact a transformation of a subjective practical experience into an exact value. Our practical questionnaire survey showed that the need for established and consistent rules is crucial, as was also confirmed by the ATC staff. A new approach to tackling workload is key to improving the training environment. The individual activities are represented by the most common work activities performed by air traffic controllers in the course of a daily shift. The workload, in our sense, is a comprehensive summary of all inputs affecting the work of air traffic controllers [13,14].
The exact quantification of subjectively perceived situations can fundamentally change the requirements for individual air traffic controllers and can also precisely define the evaluation system. For research purposes, ten specific activities were selected based on brainstorming by a group of the most qualified experts (ATC inspectors) from the Army of the Czech Republic. These activities were considered by the experts to be the key activities in air traffic control, considering the workload they generate. Research data from three different methods were used to define the weights of ten selected activities—simulation testing, questionnaire surveys and the analysis of continuous ATC training [14].
This paper is a summary of research activities in the environment of civil and military air traffic of the Czech Republic for the creation and experimentation of the proposed methodology for assessing workload within the air traffic control environment, so that it can be further developed in the future for dynamic current workload measurement at air traffic control stations in real operation. The aim of the presented research was to obtain values on the workload of air traffic controllers (weights of specific activities).
This paper is organized as follows: In Section 2, all methods used are described and information about data sources is provided; the research results are presented in Section 3. The correlation of the results of individual data sources and the suggested methodological procedure for determining the weight of the workload of each air traffic control activity is presented in Section 4. Section 5 concludes the paper.

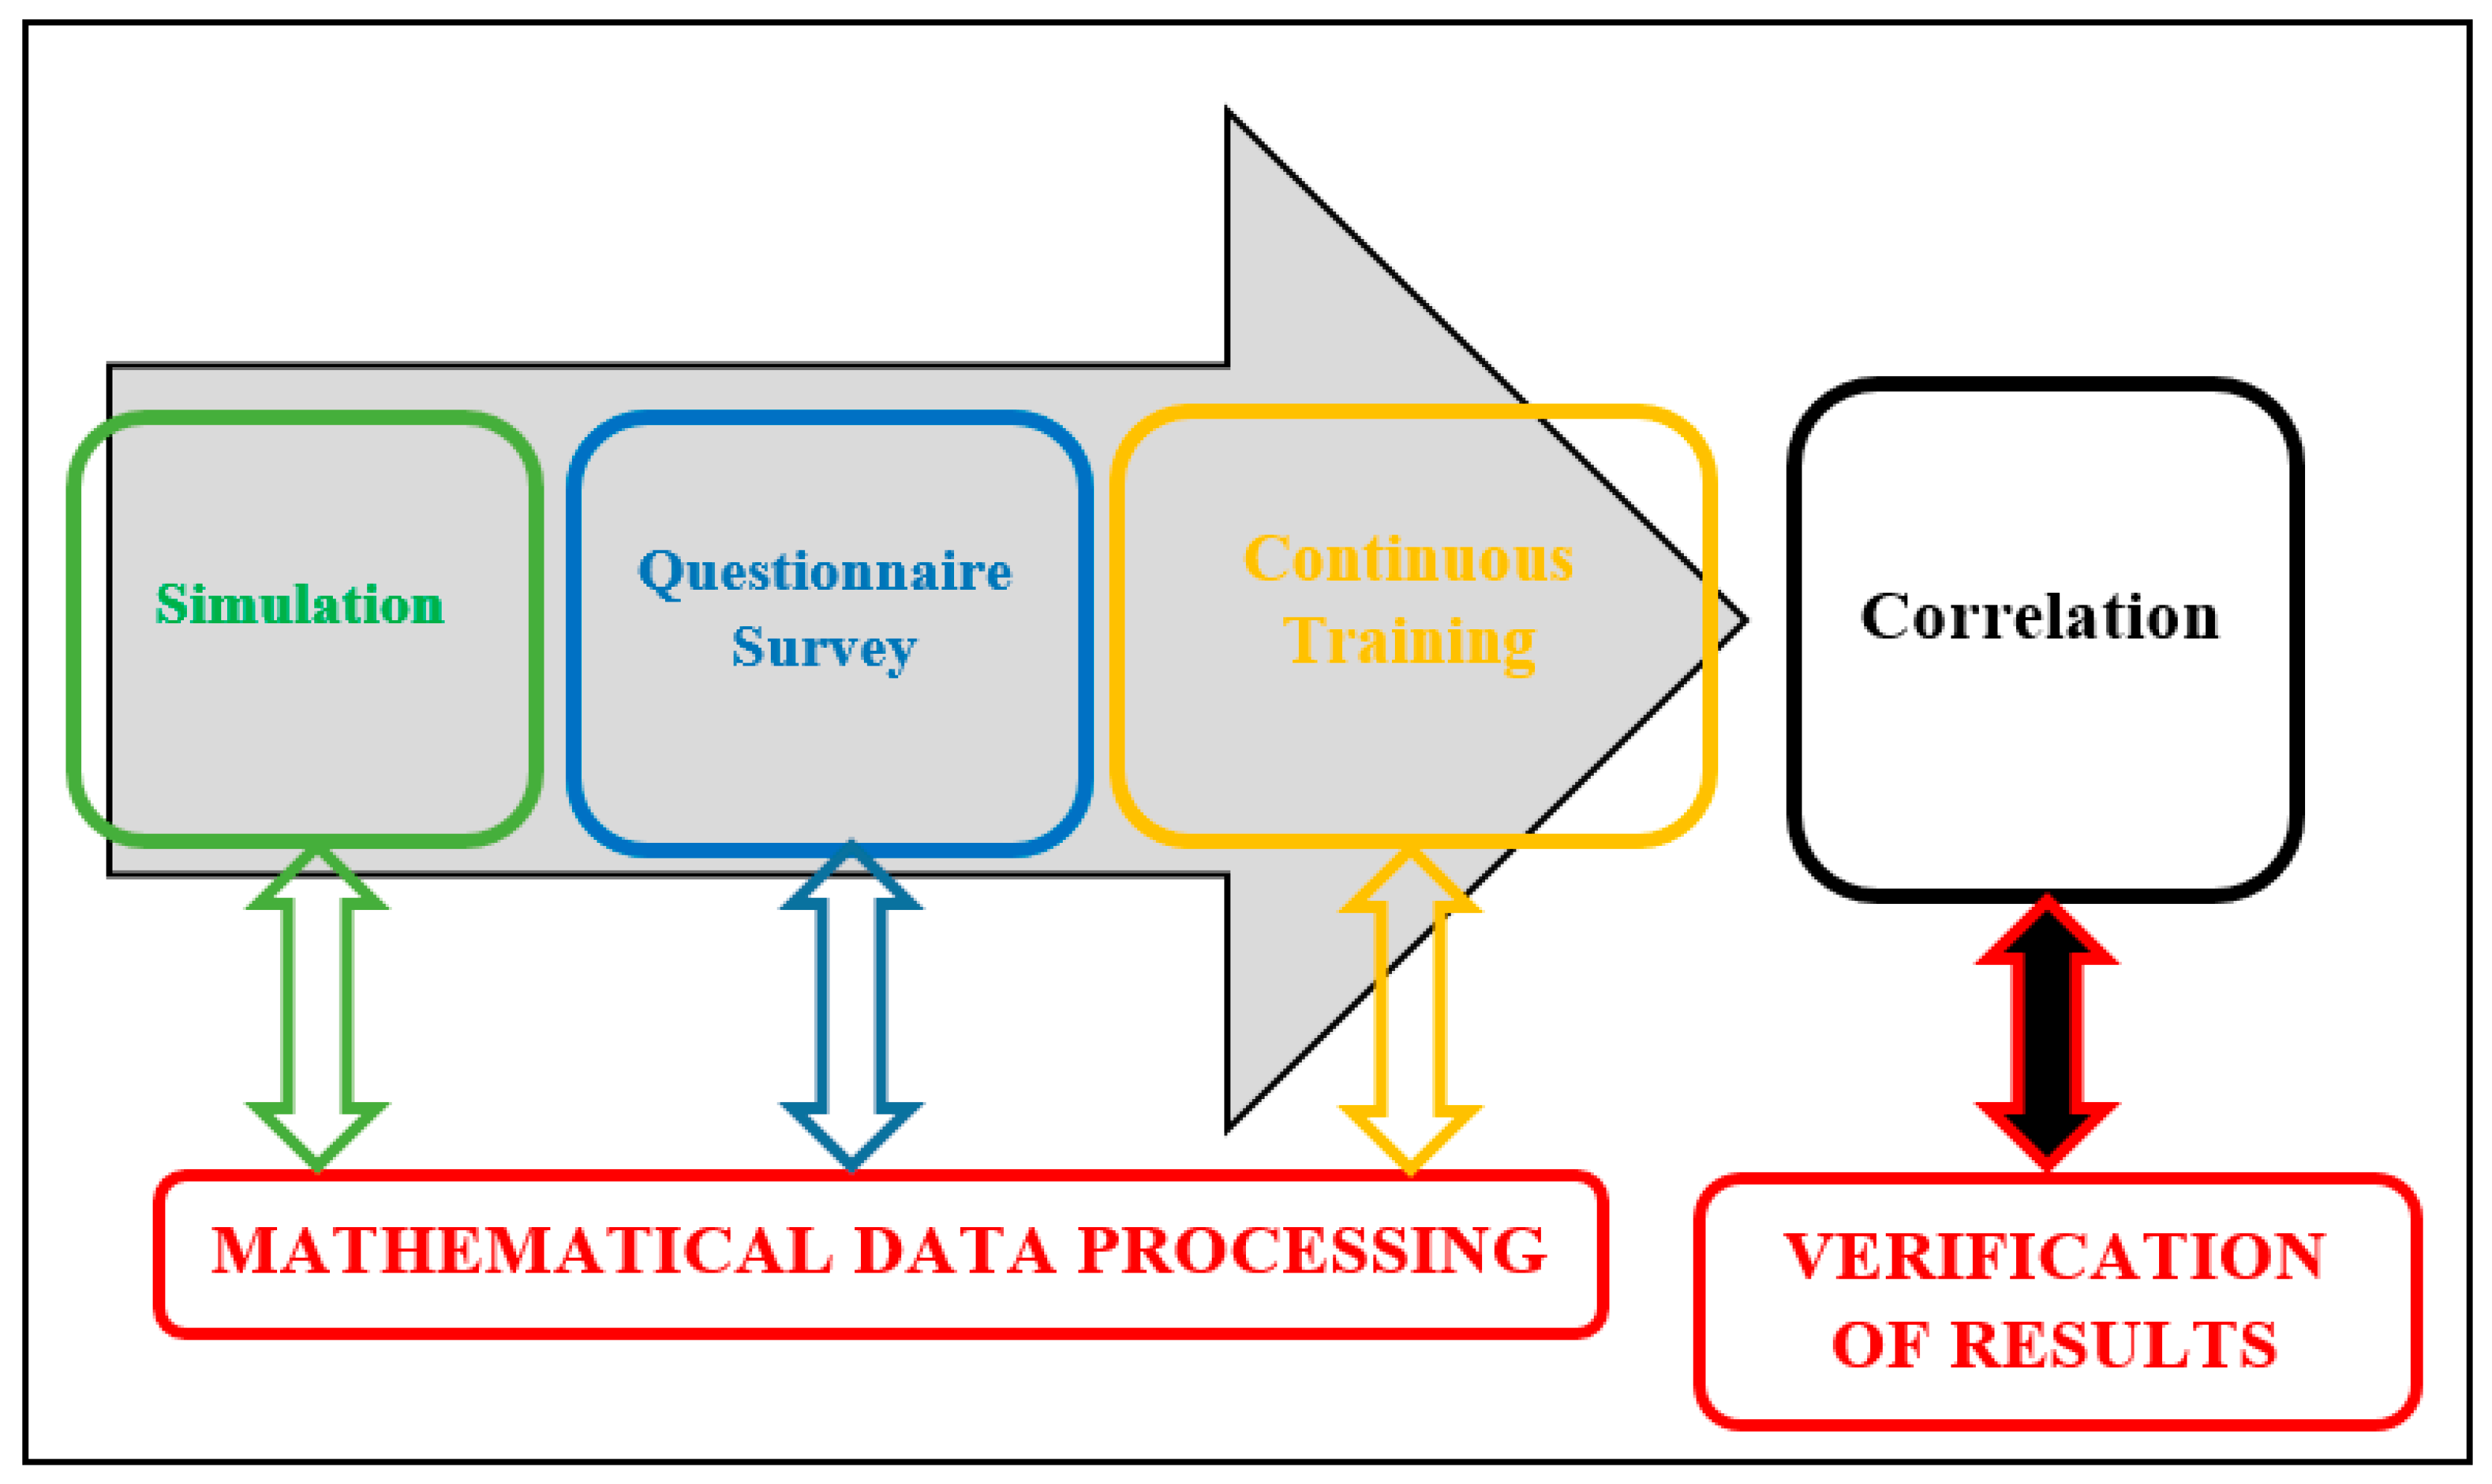
2. Materials and Methods

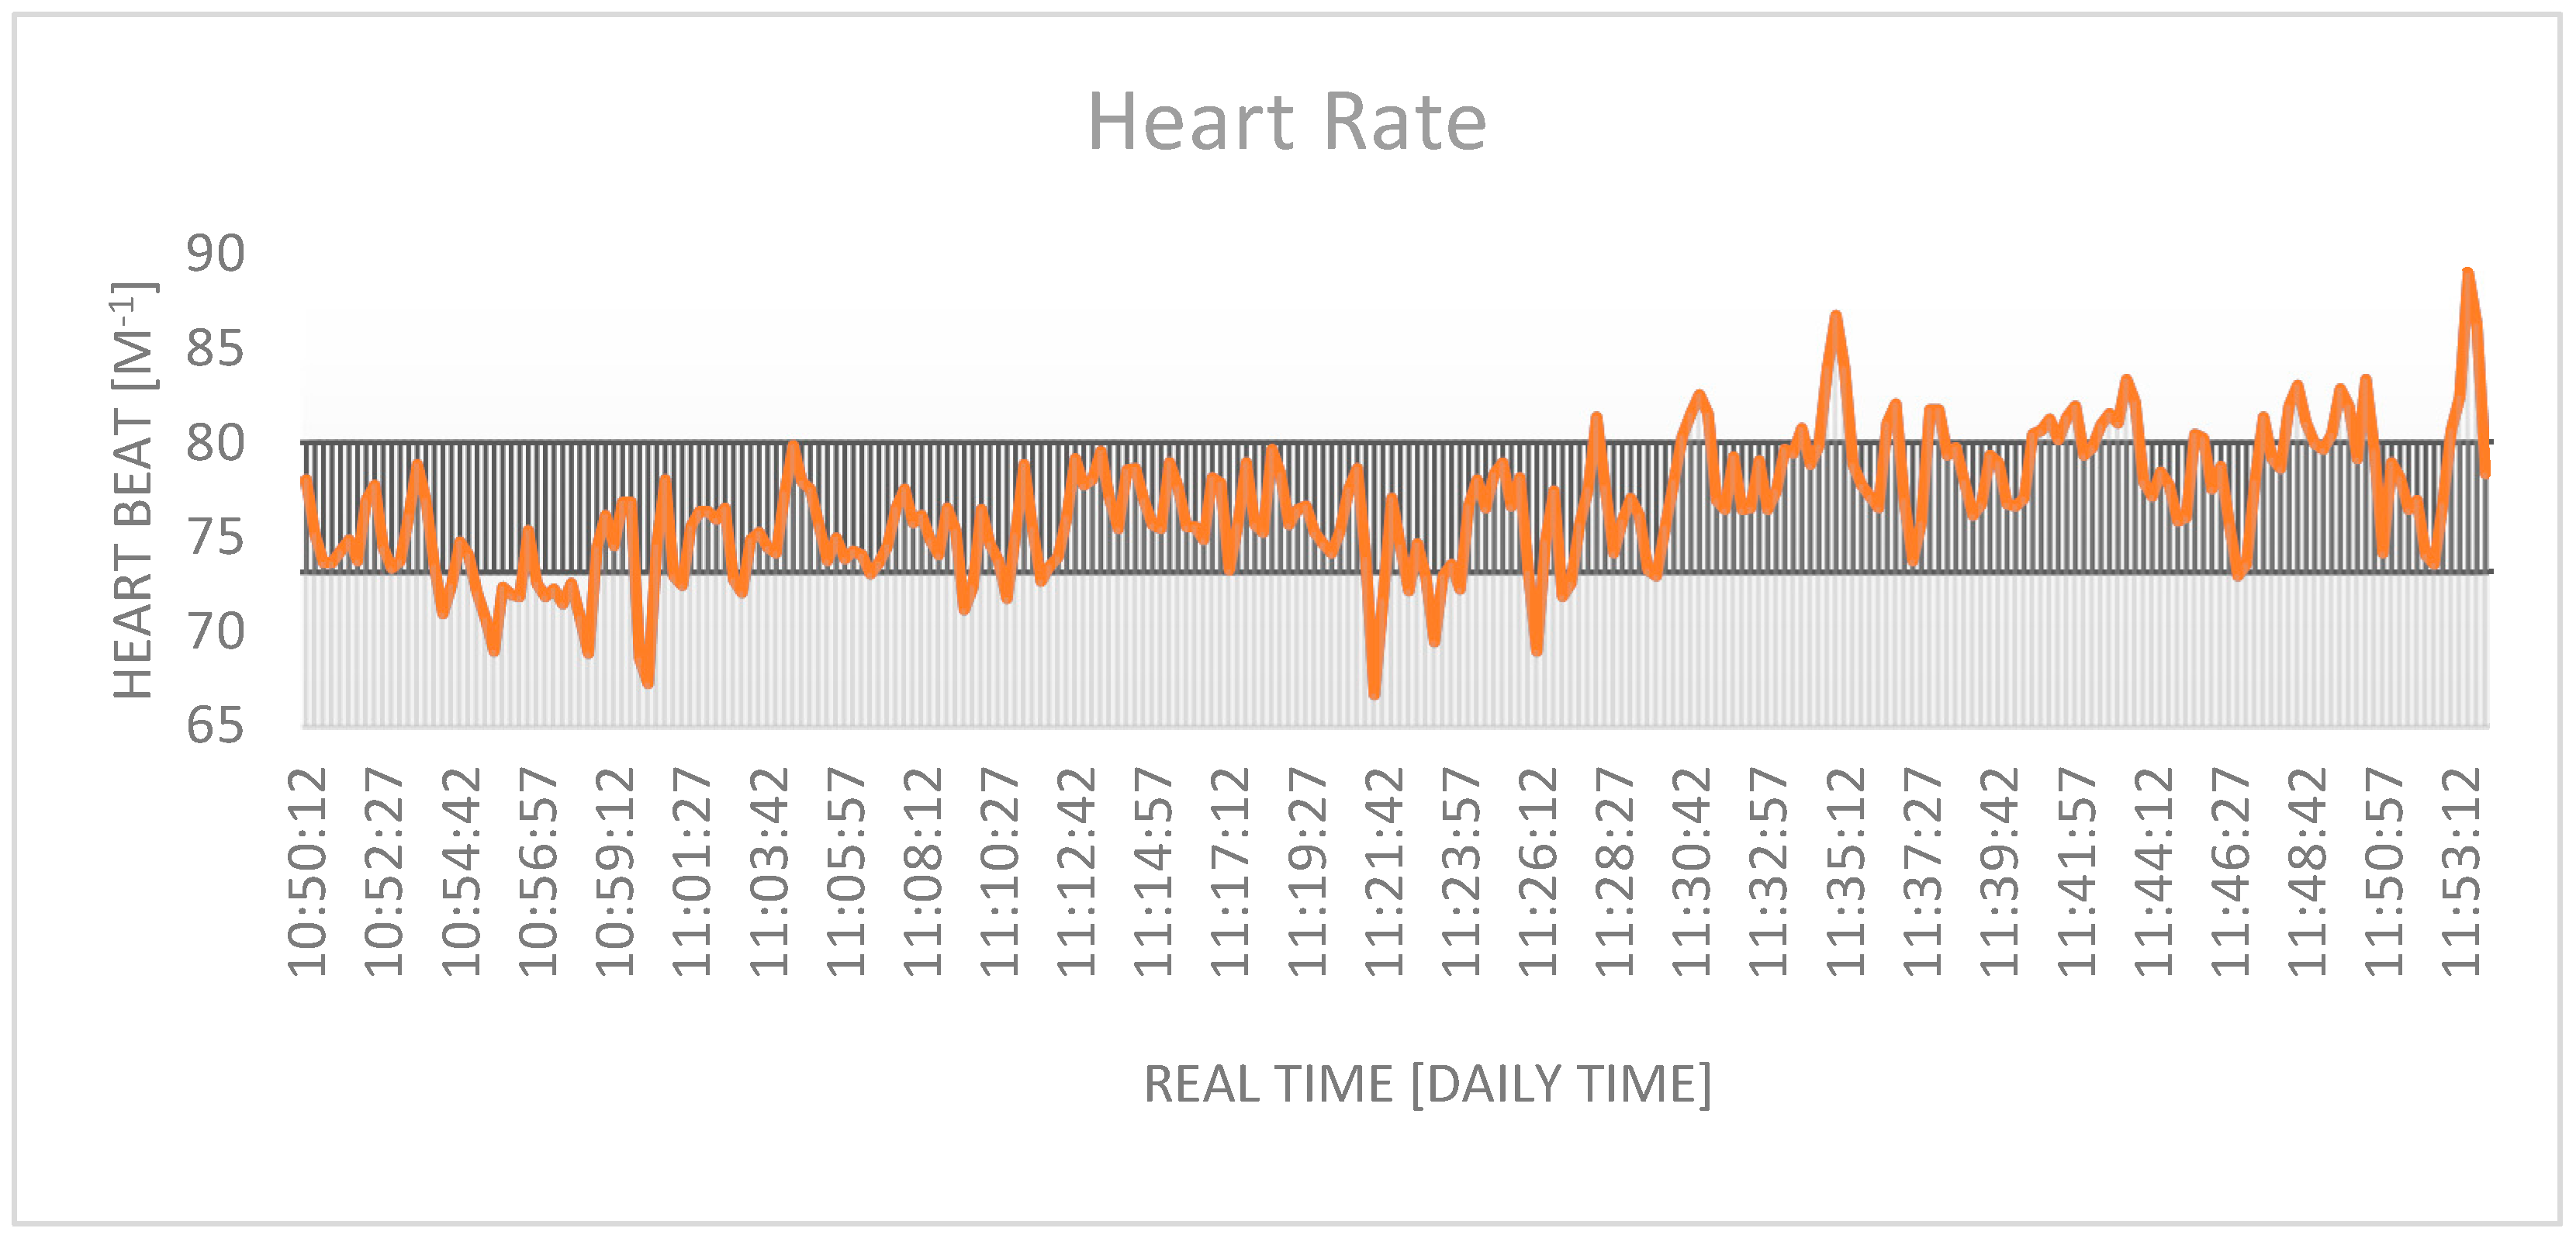
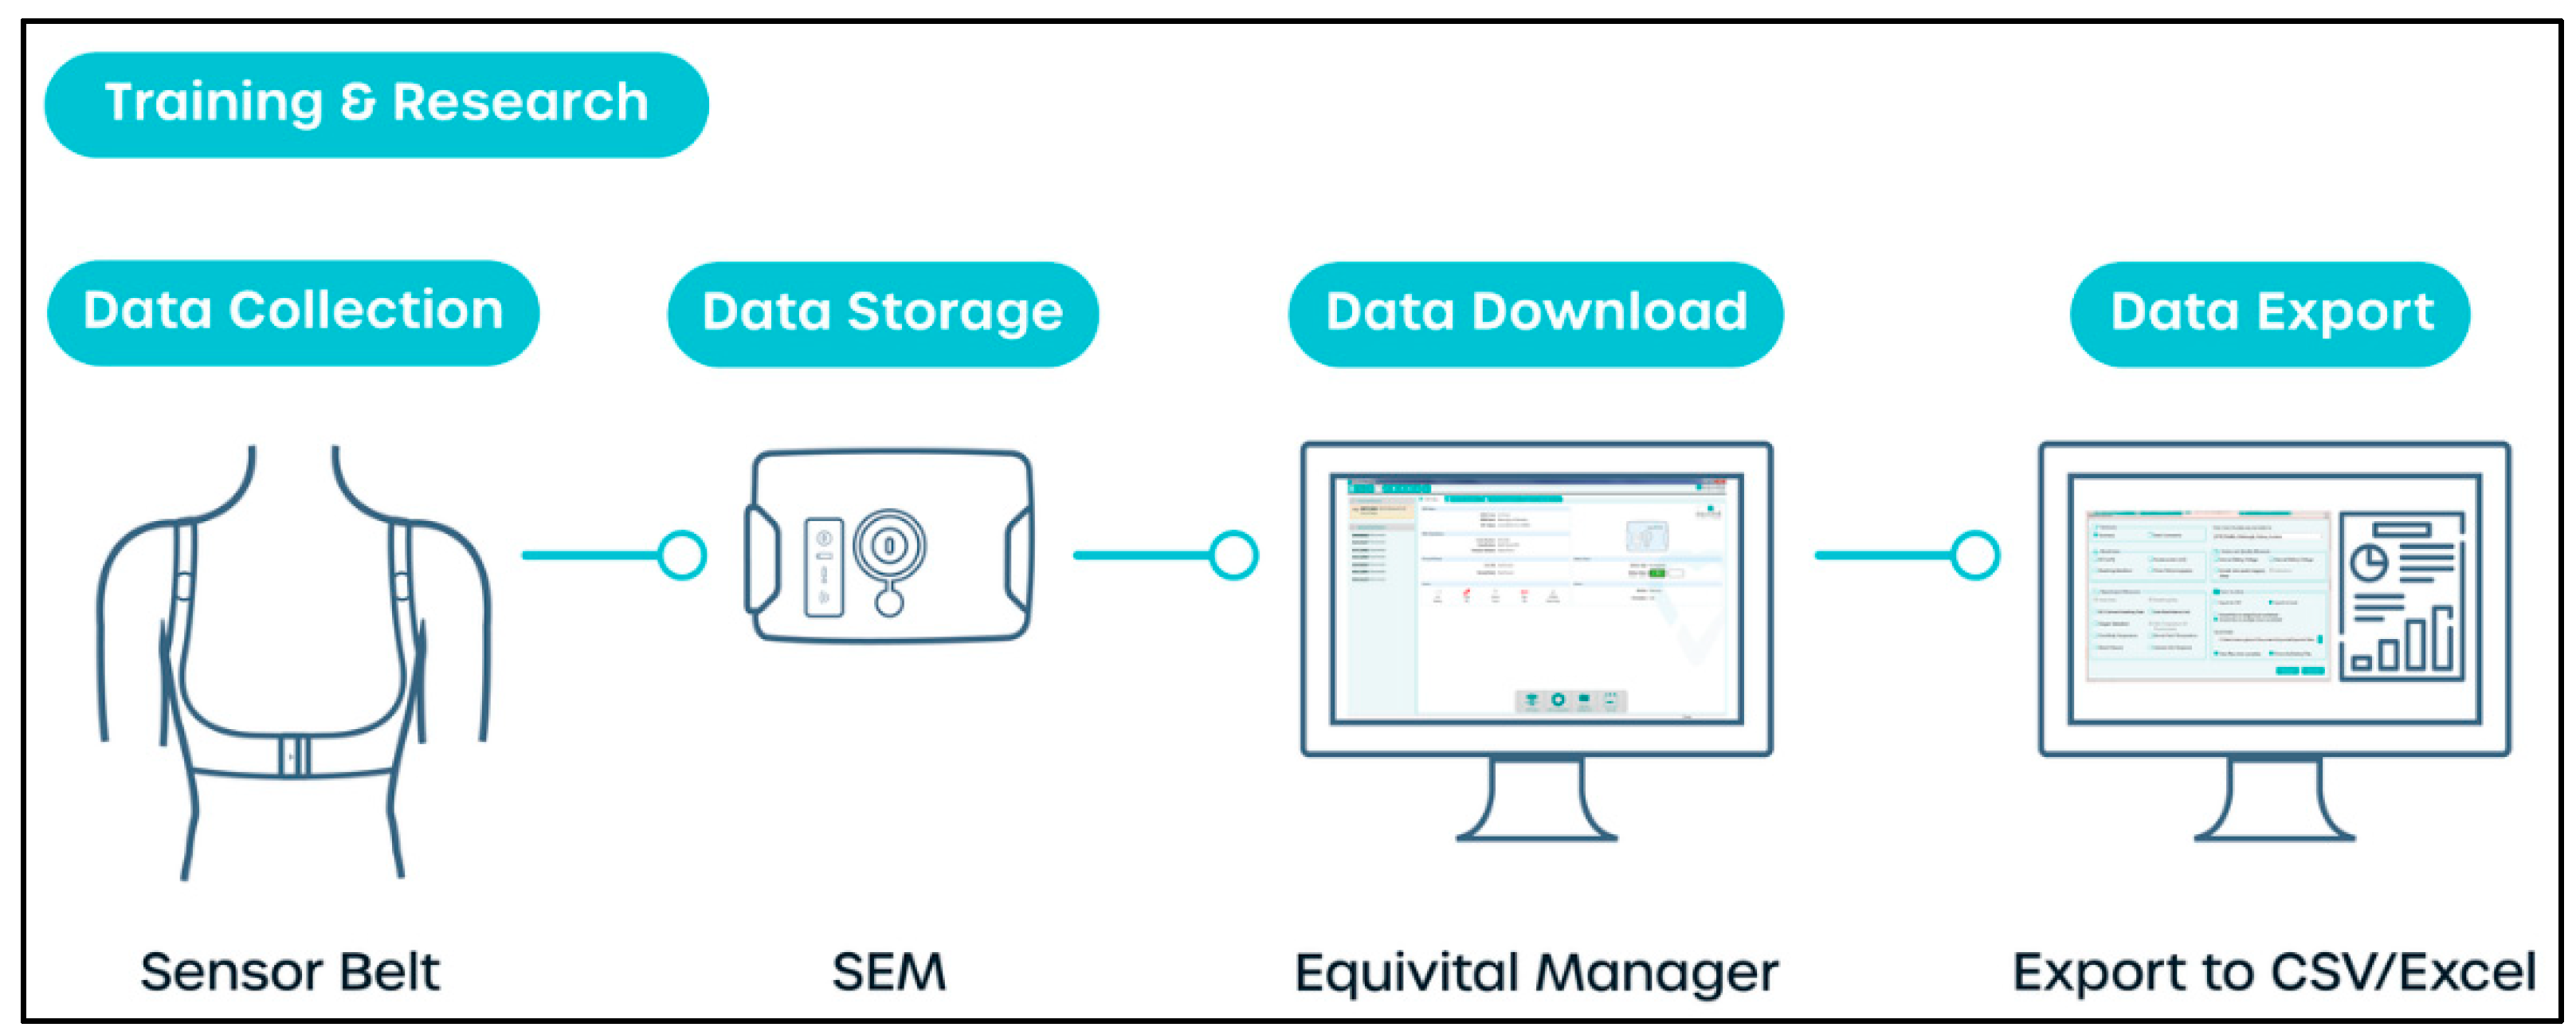
2.1. Simulation Testing

Simulation testing took place at Czech Air Navigation Institute (CANI) in Prague as part of the continuous training of military air traffic controllers. This type of testing offered a real opportunity to compare all ten individual activities identified in the ATC. This would not be possible in real-world traffic, as conditions do not change as quickly as they can be simulated in a training scenario. Air traffic controllers who have undergone simulation testing have carried out this activity on a voluntary basis and are aware of the purpose of this testing. A necessary requirement was a valid qualification in the license. The Equivital Black Ghost system was used during testing, which is designed to monitor current human physiology during sports or work activities that generate a certain level of workload (Figure 1). It is a monitoring training system that provides situational awareness of the vital signs of people during physical and mental stress in real time. It is used in the training of security forces in many European countries and uses data sent from Equivital sensors, which provide real-time information important for critical decision-making during training. The data are transferred to the Black Ghost online system via a mobile phone or other communication medium for further use.
During testing, the levels of the following vital signs were observed: heart rate, respiratory rate, heart rate confidence, respiratory rate confidence and breathing quality during different levels of workload [15]. The curve of each physiological characteristic graph was examined as a separate function. The aim of the simulation experimentation was to find out which of the individual monitored activities generated an extreme workload, i.e., local extrema of the particular physiological graph were sought. Local extrema represent a moment of short-term increase in workload caused by air traffic control activities. Table 1 shows the physiological characteristics tested and how to evaluate the curves of these values with respect to the local extrema of the function found. The last column provides a justification for the method of evaluating human physiology with regard to the indication of key values [12,15,16].
For the heart rate graph (HR), only local maximum was examined. For respiratory rate (RR) and heart rate variability (HRV) graphs, both local maximum and local minimums were examined. For respiratory rate, respiratory rate variability (RRV) and cardiac activity (ECG), only local minimums were examined. A general rule applies for all the graphs—if the local extrema are closer in time than 1 min, only the more significant is taken into account. The reason for this is the schedule specified in the logs for individual exercises, where the time items of the course of the given exercises with the lowest interval of just 1 min are determined.
Firstly, initial data selection was carried out to delete average data intervals that were insignificant in relation to the workload when researching the weights of the individual activities in the ATC. For the first selection of the measured data, the standard deviation s was used, being the statistical variability unit:
s = 1 n 1 i = 1 n ( x i x ¯ ) 2
n—sample size;
xi—measured values, i = 1 , 2 , , n ; n   ϵ   ;
x ¯ —arithmetic mean of the measured data.
During the examination (or the determination) of the source of the workload that produced the extreme in the vital signs graph, all the local extrema were outside the interval   ( x ¯ s , x ¯ + s ) . The above-mentioned activities in air traffic control were considered to be sources of the extrema. The examination of the extrema was based on the events specified in the pilot, instructor and coordination logs and also in personal notes of the controller from individual exercise records. Logs are scenarios of a particular exercise that serve as tasks for so-called pseudo pilots. A pseudo pilot is a qualified person with the knowledge of aviation regulations and terminology and with the ability to control an aircraft in a simulation environment so that the simulation exercise is as close as possible to the reality of air traffic control. The logs contain a timeline of events that the pseudo pilot was asked to perform during the simulation exercise and to which the air traffic controllers had to respond. A pseudo pilot operates according to coordination and pilot logs.

2.2. Questionnaire Survey

The questionnaire survey consisted of three parts. Respondents—air traffic controllers—were asked the same questions in three different ways to assess the difficulty of ten selected types of activities they carry out most frequently during their service. In all cases, the questions were close-ended, and a certain variation of numerical answer was always requested, which could be selected from the provided options.
In the first questionnaire (Questionnaire 1—S.F. Table A1), the respondents were asked to put each individual activity in order based on their difficulty and to assign points in the range of 1-100 so that the total was 100. In the second questionnaire (Questionnaire 2—S.F. Table A2), they compared all possible pairs of the individual activities, and their task was to determine which of the two activities they considered more difficult, using 0 or 1. The last, most detailed questionnaire (Questionnaire 3—S.F. Table A3) was a comparison of the importance of each criterion with all the others. The comparison of different pairs of the selected activities was carried out using the Saaty Method [15,16], i.e., the respondents determined mutual preference of the selected ATC activities, using a range of preferences from 1 to 9. The range of preferences used was according to the following [17,18,19]:
1—equivalent, 3—weak preference, 5—strong preference, 7—very strong preference, 9—absolute preference.
In order to increase the objectivity of the obtained results and to eliminate unconscious errors, a correlation of the order of all three questionnaires was carried out. The respondents may unknowingly fill in the questionnaires inconsistently. An example of inconsistency can be a particular preferred difficulty within one questionnaire and the opposite (or different) determined difficulty weight in the next questionnaire. For this reason, the order of all three questionnaires was correlated for each respondent. A value of 0.60 or higher was chosen as a sufficient correlation rate of each order. Otherwise, the questionnaires were excluded from further processing. Pearson Correlation Coefficient rX,Y [14] was used to verify the data objectivity.
r X , Y = E ( X Y ) E ( X ) E ( Y ) E ( X 2 ) E 2 ( X ) E ( Y 2 ) E 2 ( Y )
X, Y—random variables;
E(X), E(Y)—mean values of random X, Y variables.

2.3. Analysis of Continuous Training

The third way to determine the weights of individual air traffic control activities was to use the results of the so-called continuous training of ATC personnel. Continuous training is a term comprising periodic refresher training, remedial training or conversion training. The main amount of available data came from the refresher training. This type of training takes place in the Army of the Czech Republic at least once a year in a simulated environment. Conversion training is carried out when the place of duty is changed, and the remedial training is carried out when air traffic service qualification has expired.
Under standard conditions, continuous training is carried out on simulation devices [14]. These are identical exercises where simulation testing was carried out with the measurement of vital signs (see Section 2.1), but during normal training, the measurement of vital signs is not carried out. Continuous training is assessed using four levels based on the evaluation of air traffic controller training performed on simulation devices as a part of a particular Training Plan [12,14]. Assessment A indicates the correct mastery of an activity with an impact on the workload that is not significant for the evaluation, all the objectives of the exercise were met and the test subject mastered the exercise without errors. The subject of the investigation is all evaluations of the given specific activities B, C, D, which indicate a certain level of error of the tested individual. An assessment of B means that the exercise was completed without any impact on the economy or operational safety. Minor errors were noted, but their severity and frequency were not so as to give doubt to the fulfillment of the objectives of the exercise. An assessment C indicates that the exercise was completed without any impact on safety, but a significant impact on the economy of operation occurred. The errors recorded greatly compromised the economy of operation and could become a threat to safety, yet the objectives of the exercise were met. An assessment D indicates that the goals of the exercise have not been met. The evaluated person did not demonstrate the knowledge and skills required to successfully complete the exercise; the solutions adopted did not guarantee the safety of the aircraft. For all types of levels, their frequency was monitored, with type C ratings given double weight and type D ratings given triple the weight of the type B ratings. The higher weights for C and D ratings were determined based on the empirical experience of the authors. However, in the final calculation, such determined weights could distort the final results of the individual ATC activities, and therefore, the following calculation algorithm was used:
x i = B + 2 C + 3 D
v i = x i i = 1 n x i
xi—weighted rating;
vi—criteria weight, i = 1 , 2 , , n ; n   ϵ   .

2.4. Data Set

  • Ten exercises were performed as part of the simulation testing. A valid air traffic control qualification was a requirement for persons to perform this simulation testing. Simulation exercises for refresher training were used as they are considered the most comprehensive for dealing with situations in airspace. More simulation testing could not be carried out due to its cost and time requirements.
  • Twenty military air traffic controllers participated in the questionnaire survey. This number of controllers may seem small; however, it is actually a completely representative sample, as it represents approximately 25% of all active military air traffic controllers in the Czech Republic. Due to the small size of the country, four military aerodrome units are sufficient to cover air traffic services. The 20 military air traffic controllers who were selected for the questionnaire survey are a representative sample of all airport air traffic control units in the Army of the Czech Republic. All of them are fully trained, i.e., they hold all air traffic control qualifications, and some of them are even On-the-Job Training Instructors or Assessors. Their level of training, as well as years of experience, proves a high competence to take part in this research.
  • Fifteen people were included in the analysis of the continuous training, all of them from the 22nd Helicopter Air Force Base in Náměšť nad Oslavou, Czech Republic. The analyzed data were a training assessment from 2015 to 2020. The number of assessed persons varied from the questionnaire survey due to personnel turnover. In addition, a different number of assessments were analyzed for each monitored person as some people had fewer questionnaires available during those analyzed years due to fewer years served. A total of 158 assessments were analyzed. Fifteen air traffic controllers from the 22nd Helicopter Air Force Base at Náměšť nad Oslavou is a comprehensive sample of all persons from this unit who are involved in air traffic control. It is a cross-section of all persons holding any type of air traffic control qualification. It is a representative selection respecting the percentage of the most experienced air traffic controllers up to beginners in the field.
  • All military air traffic controllers have the same certified training; in addition, all operational procedures in air traffic control are standardized. Given this fact and the above-mentioned requirements for research participants, we consider this number to be quite sufficient for the first round of the research. The number of 35 air traffic controllers is close to 50% of all military airport air traffic controllers. More people should be involved in next investigations.

3. Results

In this section, a weight calculation of the individual activities for one person will be shown first, based on the simulation testing data, questionnaire survey and continuous training analysis.
Then, the summary of all three available data sources will be presented, and finally, the final proposal of the weight for each individual activity will be presented. These weights can be used in the workload assessment model.
The proposed weights of the selected activities will be further used in the simulation environment at the Department of Air Force of the University of Defence, which is engaged in testing and verifying the real level of the workload of ATC personnel, using the functionality “Workload”—a software tool that evaluates the current workload of the performed activities, using the weight of the individual activities.

3.1. Simulation Testing

We will now provide an example of calculating the weights of each individual activity using simulation testing and the heart rate graph of one tested person (Figure 2). The figure is an illustrative example of local extremes that are important for evaluating workload coefficients and a standard deviation interval, which in turn represents data that are considered biased for evaluation. In the case of this illustrative graph of a curve of heart rate, the local extremes of the curve function shown in the graph are important.
The average heart rate in this particular case is 77 BPM and the standard deviation is s = 3.42 BPM. The local extrema were determined outside the interval (73; 80) BMP.
Table 2 lists three types of data. The column “number of deviations” indicates how many times the observed phenomenon was recorded during one simulation exercise. The values of “unit load” are the sum of the size of the deviations of a given activity and the number of observed deviations during one simulation exercise. This value is further used to calculate the weights of individual air traffic control activities. The unit load is divided by the total value of the load in the exercise, which gives the weight of the load of each air traffic control activity.

3.2. Formatting of Mathematical Components

The unit load is a ratio of the sum of deviations of an activity and the number of observed deviations during a single simulation exercise. This value was further used to calculate the weights of the individual activities in air traffic control operations. The weights thus obtained from each vital sign were further arithmetically averaged. This gave us a numerical workload weight of one person for each monitored activity. See also [20,21,22].
The weights of individual exercises are arithmetically averaged. This created the final weights for the individual air traffic control activities for this data source group. Table 3 shows the partial results of all 10 performed simulation measurements, as well as the final weights of the selected activities of this entire simulation testing data group.

3.3. Results from the Questionnaire Survey

In this section, the results of the questionnaire survey are presented. The first two questionnaires show results as an average weight order. The third questionnaire, evaluated by the Saaty Method, shows the weights of the individual air traffic control activities. The order of these weights is correlated with the order of activities in questionnaires 1 and 2 to ensure the consistency of the results. When the correlation was greater than 0.6 of the weight of the selected activities, the weights were further used for the final arithmetic mean of this questionnaire survey data group. Table 4 shows the average order of the individual air traffic control activities from individual surveys, covering all respondents. It is clear from the order of each activity that the replies of the individual respondents were consistent.
Table 5 shows an example questionnaire completed by one of the respondents. It further explains the process of the Saaty Method.

3.3.1. Mathematical Data Processing

The calculation of the workload weights of the individual ATC activities was carried out using Equation (4). Table 5 shows an example of a questionnaire processed by the Saaty Method.
v i = G i i = 1 n G i
Geometric mean G was defined as the nth root of their products:
G ( x 1 , x 2 , x n ) = ( x 1 . x 2 . x n ) n  
Gi—geometric mean of the ith criterion;
vi—standardized weights of the individual ATC activities of the ith criterion;
n—number of criteria.
The resulting weights of individual activities were obtained by the arithmetic mean of each individual activity in all questionnaires (questionnaire No. 3), provided that the conditions of the correlation of the order were respected for all three questionnaires, see Table 6.

3.3.2. Verification of Results Objectivity for Individual Questionnaires

Table 7 shows the correlation coefficient for comparing the order of the selected air traffic control activities in individual surveys [12]. The calculation was made using the Pearson correlation coefficient based on mathematical Formula (2).

3.4. Results of Continuous Training

Table 8 shows the weights of the individual air traffic control activities as a result of the continuous training assessment [12]. The resulting order of the activities was determined on the basis of the arithmetic mean of the weights of the air traffic control activities for each person.

3.5. Comparison of the Selected Activities Based on Their Difficulty

Table 9 shows the order of each air traffic control activity obtained by each of the above-mentioned calculation methods.
The order of difficulty of the individual air traffic control activities shows that solving non-standard or emergency situations is identified and perceived as the most difficult activity of all. A similarly consistent result is shown for the termination of the connection/electronic transmission activity, which is perceived as the simplest activity of all. On the other hand, a certain difference in order was detected when dealing with a change in meteorological conditions, as well as in ensuring horizontal separation. Both of these activities were perceived as more difficult in the questionnaire surveys and in the follow-up trainings than in the simulation testing. The opposite applied for the radio communication activity, where this activity was generally not considered as difficult; however, the simulation testing showed otherwise when it generated a significant workload. A similar result was found for the coordination of air traffic flow. For the rest of the selected activities, the difference in the order of each activity was not so significant.

4. Correlation and Suggested Methodological Procedure

4.1. Correlation of Individual Parts of Source Data

Correlation generally provides a means of understanding which data are related and which are not. Our goal was to determine a level of dependency between the individual source data. For this, Pearson Correlation Coefficient (2) was used. This statistical indicator of the strength of the linear relation between paired data lies in the interval of <−1;1>. When the variables X and Y are independent, the correlation coefficient is 0. However, a zero correlation coefficient does not mean that the X and Y are independent. Formula (2) was used to calculate the Pearson Correlation Coefficient. With respect to, e.g., [20,21,22], the correlation coefficient levels are:
  • 0.00–0.19 “very weak”;
  • 0.20–0.39 “weak”;
  • 0.40–0.59 “medium”;
  • 0.60–0.79 “strong”;
  • 0.80–1.00 “very strong”.
A correlation level of 0.6 or higher was selected as sufficient. The correlation coefficient is provided in absolute value.
The three data sources presented above were subjected to a correlation of results. Table 10 shows the correlation level that indicates the linear dependence of the two compared data types [12]. It is clear that the level of the correlation coefficient is strong to very strong, which confirms the correctness of the mathematical calculation and objectivity of the acquired data.

4.2. Methodological Procedure for Determining Weights

The methodological procedure for calculating the weight of the workload of each individual air traffic control activity is depicted in Figure 3. The weights of the activities were obtained from three different ways of methodological and mathematical processing. To ensure a certain level of objectivity of the obtained results, the individual results were correlated.
Table 11 shows the main results, the final weights of the individual air traffic control activities, presented in the right-hand column of the table. The results of individual source data (simulation, questionnaire survey and continuous training) are also presented for clarity.

5. Conclusions

The aim of the presented research was to obtain values on the workload of air traffic controllers (the weights of specific activities). The published mathematical expression of the difficulty of individual activities is a way to evaluate the current and planned workload and contributes to the optimization of human resource management.
The secondary goal of the research was to use the application environment of air traffic control to obtain an exact idea of the real workload of air traffic control during the performance of the service. The current conditions take into account general recommendations, not important specifics of military operations. The presented methodology for determining the weights of specific air traffic control activities recognizes both the military and civilian aspects of air traffic control.
The weights of specific air traffic control activities can be considered as a universal tool for different uses in determining the current or planned air traffic controller workload. Their use is expected especially in simulation training, in parallel operation with applications evaluating the level of the current workload in air traffic flow control. The numerical expression of individual weights of specific activities can be perceived as a certain index of the difficulty of the performed activity.
The main use of the calculated weights is software support in the simulation measurement of the workload of air traffic controllers. The numerical value of the weights is crucial with regard to the ability to express the current level of the workload of the air traffic controller. The presented results bring the possibility of conducting simulation training and an exact evaluation of managing a certain degree of workload. Another possibility is extending the use of simulators equipped with the Workload functionality, in which the exact weights are inserted, into the certified training of military air traffic controllers and subsequently into real operation.
The creation of an objective system for assessing the workload in the real operation of air traffic controllers, focused on the conditions of the Army of the Czech Republic, will be the main goal of further research, which will significantly contribute to the increase in air traffic safety.
The air traffic control shift manager will thus obtain online information on the current workload of individual employees and, in the event of their overload, will be able to react immediately in the dynamically changing environment of air traffic. This in turn will contribute to the sustainability of the required level of air traffic safety or air traffic operations management.

Author Contributions

Conceptualization, J.K. and M.B.; methodology, S.H.-M., J.K. and M.B.; software, J.K.; validation and formal analysis, S.H.-M., J.K. and M.B.; investigation and data curation, J.K.; writing—original draft preparation and review and editing, S.H.-M., J.K., P.R. and M.B.; visualization, J.K.; supervision S.H.-M.; project administration and funding acquisition, S.H.-M., P.R. and M.B. All authors have read and agreed to the published version of the manuscript.

Funding

This research was funded by the Ministry of Defence of the Czech Republic, grant numbers AIROPS and VAROPS. The APC was funded by AIROPS.

Institutional Review Board Statement

The study was conducted according to the guidelines of the Declaration of Helsinki and approved by the Institutional Review Board (or Ethics Committee) of the University of Defence (protocol code 3/20/21, date of approval 23 November 2021).

Informed Consent Statement

Informed consent was obtained from all subjects involved in the study.

Data Availability Statement

Data used to support the findings are included within the article.

Conflicts of Interest

The authors declare no conflict of interest.

Appendix A

Example of the questionnaires filled in by one respondent
Table A1. Questionnaire 1; Allocation Method.
ATC Individual ActivitiesPoints Allocated (100)Order
Horizontal Separation125
Vertical Separation48
Radio Communication39
Landing Sequence/Wake Turbulence182
SSR Check/Radar Identification57
Handover/Takeover Procedure210
Unplanned Operation, Conflict Analysis143
Change in Meteorological Conditions66
Coordination134
Non-standard or Emergency Situation231
Table A2. Questionnaire 2; Pair Evaluation Method.
Horizontal SeparationVertical SeparationRadio CommunicationLanding Sequence/Wake TurbulenceSSR Check/Radar IdentificationHandover/Takeover ProcedureUnplanned Operation, Conflict AnalysisChange in Meteorological ConditionsCoordinationNon-standard or Emergency Situation Number of PreferencesOrder
Horizontal Separation 11011001055
Vertical Separation0 1011001046
Radio Communication00 010001028
Landing Sequence/Wake Turbulence111 11101073-4
SSR Check/Radar Identification0000 00000010
Handover/Takeover Procedure00100 000019
Unplanned Operation, Conflict Analysis111011 11073-4
Change in Meteorological Conditions1111111 1082
Coordination00101100 037
Non-standard or Emergency Situation111111111 91
Table A3. Questionnaire 3; Saaty Method [15,16].
Range of preferences:
1—equivalence
3—weak preference
5—strong preference
7—very strong preference
9—absolute preferences
Horizontal SeparationVertical SeparationRadio Communication Landing Sequence/Wake TurbulenceSSR Check/Radar IdentificationHandover/Takeover ProcedureUnplanned Operation, Conflict AnalysisChange in Meteorological ConditionsCoordinationNon-standard or Emergency Situation
Horizontal Separation1571/3991/71/371/71.460.090
Vertical Separation1/5151/5791/71/371/70.950.058
Radio Communication1/71/511/7531/71/71/31/90.370.023
Landing Sequence/Wake Turbulence3571793371/33.270.200
SSR Check/Radar Identification1/91/71/51/7131/71/51/31/90.260.016
Handover/Takeover Procedure1/91/91/31/91/311/51/51/31/90.220.013
Unplanned Operation, Conflict Analysis7771/3751371/32.780.170
Change in Meteorological Conditions3371/3551/3151/31.760.108
Coordination1/71/731/7331/71/511/70.450.027
Non-standard or Emergency Situation77939933714.820.295
16.341.000

Appendix B

Example of evaluation of assessment of one respondent in continuous training.
Table A4. Continuous Training Assessment, example.
ATC Individual ActivitiesBCDƩ (xi)WeightOrder
Horizontal Separation 00.00010
Vertical Separation 130.0973-6
Radio Communication3 30.0973-6
Landing Sequence/Wake Turbulence321100.3231
SSR Check/Radar Identification1 10.0328-9
Handover/Takeover Procedure1 10.0328-9
Unplanned Operation, Conflict Analysis11 30.0973-6
Change in Meteorological Conditions2 20.0657
Coordination11 30.0973-6
Non-standard or Emergency Situation31 50.1612

References

  1. Farmer, E.W. Crew Resource Management. In Ernsting’s Aviation Medicine, 4th ed.; Rainford, D.J., Gradwell, D.P., Eds.; Edward Arnold (Publishers) Ltd.: London, UK, 2006; pp. 323–335. [Google Scholar]
  2. Wickens, C.D. Situation Awareness and Workload in Aviation. Curr. Dir. Psychol. Sci. 2002, 11, 128–133. [Google Scholar] [CrossRef]
  3. Wickens, C.D. Multiple Resources and Mental Workload. Hum. Factors: J. Hum. Factors Ergon. Soc. 2008, 50, 449–455. [Google Scholar] [CrossRef] [PubMed] [Green Version]
  4. Lahtinen, T. Radio Speech Communication and Workload in Military Aviation. University of Oulu. 23 September 2020. Available online: http://jultika.oulu.fi/files/isbn9789526214283.pdf (accessed on 15 October 2021).
  5. Feng, C.; Wanyan, X.; Yang, K.; Zhuang, D.; Wu, X. A comprehensive prediction and evaluation method of pilot workload. Technol. Health Care 2018, 26, 65–78. [Google Scholar] [CrossRef] [PubMed] [Green Version]
  6. Arico, P.; Borghini, G.; Graziani, I.; Imbert, J.P.; Granger, G.; Benhacene, R.; Colosimo, A. Air-traffic-controllers (ATCO): Neurophysiological analysis of training and workload. Ital. J. Apleerosp. Med. 2015, 12, 1–21. Available online: https://www.researchgate.net/publication/281564912_Air-traffic-controllers_ATCO_neurophysiological_analysis_of_training_and_workload. (accessed on 27 April 2020).
  7. Bekesiene, S.; Hoskova-Mayerova, S.; Diliunas, P. Identification of Effective Leadership Indicators in the Lithuania Army Forces. In Mathematical-Statistical Models and Qualitative Theories for Economic and Social Sciences; Hoskova-Mayerova, S., Maturo, F., Kacprzyk, J., Eds.; Studies in Systems, Decision and Control 104; Springer International Publishing AG: Cham, Switzerland, 2017; pp. 107–122. [Google Scholar] [CrossRef]
  8. Bekesiene, S.; Hoskova-Mayerova, S. Decision Tree-Based Classification Model for Identification of Effective Leadership Indicators. J. Math. Fundam. Sci. 2018, 50, 121–141. [Google Scholar] [CrossRef]
  9. Bekesiene, S.; Kleiza, V.; Malovikas, A. Military specialist preparation features in nowadays environment. ITEMS 2009, 2009, 158–163. [Google Scholar]
  10. Zavila, O.; Mach, O.; Bauer, M. Methods for the Identification and Analysis of Human Errors in Current Military Aviation. In Proceedings of the 2021 8th International Conference on Military Technologies, ICMT 2021, Virtual Event, 13–14 October 2021; Kolar, P., Ed.; Institute of Electrical and Electronics Engineers Inc.: Brno, Czech Republic, 2021. [Google Scholar] [CrossRef]
  11. Grega, M.; Bucka, P. Interconnectivity Simulation Tools—Tower Simulator of Air Traffic Controllers. In Distance Learning, Simulation and Communication DLSC 2015: Proceedings (Selected Papers); Hruby, M., Ed.; University of Defence: Brno, Czech Republic, 2015; pp. 42–50. [Google Scholar]
  12. Kalvoda, J. Proposal for the Evaluation of the Workload of Air Traffic Controllers in the Environment of Army of the Czech Republic. Master’s Thesis, University of Defence, Brno, Czech Republic, 2021. [Google Scholar]
  13. Equivital. User Manual. Available online: http://ow.ly/XphJ50H44a2 (accessed on 18 June 2022).
  14. Czech Air Force. Unit Training Plan ATSU LKNA, Version 2.0. In Helicopter Air Base Sedlec, Vícenice u Náměště nad Oslavou; Internal Document, 22; Czech Air Force: Prague, Czech Republic, 2019. [Google Scholar]
  15. Saaty, T.L. Decision Making with the Analytic Network Process: Economic, Political, Social and Technological Applications with Benefits, Opportunities, Costs and Risks; Springer: New York, NY, USA, 2006. [Google Scholar]
  16. Saaty, T.L. Fundamentals of Decision Making and Priority Theory with the Analytic Hierarchy Process; RWS Publications: Pittsburgh, PA, USA, 2006; p. 478. [Google Scholar]
  17. Dussault, C.; Jouanin, J.-C.; Philippe, M.; Guezennec, C.-Y. EEG and ECG changes during simulator operation reflect mental workload and vigilance. Aviat. Space, Environ. Med. 2005, 76, 344–351. [Google Scholar]
  18. Hannula, M.; Huttunen, K.; Koskelo, J.; Laitinen, T.; Leino, T. Comparison between artificial neural network and multilinear regression models in an evaluation of cognitive workload in a flight simulator. Comput. Biol. Med. 2008, 38, 1163–1170. [Google Scholar] [CrossRef] [PubMed]
  19. Honcharenko, Y.; Martyniuk, O.; Radko, O.; Open’Ko, P. The Method of Proactive Risk Assessment for Flight Safety Based on the Rate of Dangerous Events. Adv. Mil. Technol. 2020, 15, 365–377. [Google Scholar] [CrossRef]
  20. Tušer, I.; Navrátil, J. Evaluation criteria of preparedness for emergency events within the emergency medical services. In Qualitative and Quantitative Models in Socio-Economic Systems and Social Work. Studies in Systems; Sarasola Sánchez-Serrano, J., Maturo, F., Hošková-Mayerová, Š., Eds.; Decision and Control; Springer: Cham, Switzerland, 2020; pp. 463–472. [Google Scholar] [CrossRef]
  21. Tušer, I. The development of education in emergency management. In Decision Making in Social Sciences: Between Traditions and Innovations; Flaut, D., Hošková-Mayerová, Š., Ispas, C., Maturo, F., Flaut, C., Eds.; Studies in Systems, Decision and Control 247; Springer: Cham, Switzerland, 2020; pp. 169–175. [Google Scholar]
  22. Tušer, I.; Jánský, J.; Petráš, A. Assessment of military preparedness for naturogenic threat: The COVID-19 pandemic in the Czech Republic. Heliyon 2021, 7, e06817. [Google Scholar] [CrossRef] [PubMed]
Figure 1. Illustrative example of physiological data transfer for the purpose of evaluation [13].
Sustainability 14 07858 g001
Figure 2. Example of heart rate graph for one tested person [14].
Sustainability 14 07858 g002
Figure 3. Methodological procedure for calculating workload weight using source data.
Sustainability 14 07858 g003
Table 1. Vital Signs Curves.
CurveType of Local
Extrema
Indication of Workload
Heart RatemaximumIncreased heart rate is due to workload.
Respiratory Ratemaximum,
minimum
High respiratory frequencies, even low or intermittent respiratory rates, are one of the indicators of workload.
Heart Rate Confidencemaximum,
minimum
The unstable course of respiration frequency values is a source of workload at both lower and higher values than x ± s.
Respiratory Rate ConfidenceminimumThe workload is indicated only by the reduced level of RRC which is based on the standard state of 100% and the subject of the investigation is values lower than xs.
ElectrocardiographminimumThe workload is indicated only by the reduced ECG level, the standard condition is 100% and the subject of the investigation is values lower than xs.
Table 2. Individual activities during ATC based on the HR graph [14].
ATC Individual ActivitiesNumber of DeviationsUnit LoadWeight
Horizontal Separation11.02500.1087
Vertical Separation11.01250.1073
Radio Communication11.02500.1087
Landing Sequence/Wake Turbulence41.03750.1100
SSR Check/Radar Identification11.01250.1073
Handover/Takeover Procedure11.0250.1087
Unplanned Operation, Conflict Analysis21.50000.1590
Change in Meteorological Conditions00.00000.0000
Coordination30.68330.0724
Non-standard or Emergency Situation11.11250.1179
Sum159.43001.0000
Table 3. Resulting weights of individual experiments [14].
Weight
Ex. 1
Weight
Ex. 2
Weight
Ex. 3
Weight
Ex. 4
Weight
Ex. 5
Weight
Ex. 6
Horizontal Separation0.08910.05900.07990.10430.08890.0993
Vertical Separation0.09240.11830.07810.10370.08890.0984
Radio Communication0.10820.12200.11190.11120.11350.1026
Landing Sequence/Wake Turbulence0.13270.12320.11250.11300.12600.0964
SSR Check/Radar Identification0.05690.05780.10990.10050.09460.0966
Handover/Takeover Procedure0.05930.05640.10920.07530.06050.0956
Unplanned Operation, Conflict Analysis0.15100.12200.11040.11090.13330.1039
Change in Meteorological Conditions0.03810.08740.06140.05680.04100.0987
Coordination0.12360.12170.10700.10670.12070.0989
Non-standard or Emergency Situation0.14860.13230.11960.11760.13260.1095
Weight
Ex. 7
Weight
Ex. 8
Weight
Ex. 9
Weight
Ex. 10
Final WeightOrder
Horizontal Separation0.10980.10330.10460.09570.093398
Vertical Separation0.10370.09580.10310.09450.097696
Radio Communication0.10460.10670.10290.10400.108764
Landing Sequence/Wake Turbulence0.11460.10780.10340.09750.112713
SSR Check/Radar Identification0.11060.10230.10110.11090.094127
Handover/Takeover Procedure0.05760.07780.09940.09340.078459
Unplanned Operation, Conflict Analysis0.15540.10070.11250.10280.120292
Change in Meteorological Conditions0.00000.08020.05680.09640.0616810
Coordination0.09860.10240.10230.09490.107685
Non-standard or Emergency Situation0.14510.12290.11380.10990.125191
Table 4. Questionnaire 1; allocation method.
Questionnaire Processing MethodAllocation MethodPaired Rating MethodSaaty Method
Horizontal Separation444
Vertical Separation665
Radio Communication878
Landing Sequence/Wake Turbulence332
SSR Check/Radar Identification899
Handover/Takeover Procedure101010
Unplanned Operation, Conflict Analysis323
Change in Meteorological Conditions656
Coordination567
Non-standard or Emergency Situation111
Table 5. Questionnaire 3—example; Saaty Method [14,15,16].
Range of preferences:
1—equivalent
3—weak preference
5—strong preference
7—very strong preference
9—absolute preferences
Horizontal SeparationVertical SeparationRadio CommunicationLanding Sequence/Wake TurbulenceSSR Check/Radar IdentificationHandover/Takeover ProcedureUnplanned Operation, Conflict AnalysisChange in Meteorological ConditionsCoordinationNon-standard SituationGi—Geometric Meanvi—individual activities weights
Horizontal Separation1571/3991/71/371/71.460.090
Vertical Separation1/5151/5791/71/371/70.950.058
Radio Communication1/71/511/7531/71/71/31/90.370.023
Landing Sequence/Wake Turbulence3571793371/33.270.200
SSR Check/Radar Identification1/91/71/51/7131/71/51/31/90.260.016
Handover/Takeover Procedure1/91/91/31/91/311/51/51/31/90.220.013
Unplanned Operation, Conflict Analysis7771/3751371/32.780.170
Change in Meteorological Conditions3371/3551/3151/31.760.108
Coordination1/71/731/7331/71/511/70.450.027
Non-standard or Emergency Situation77939933714.820.295
16.341.000
Table 6. Resulting weights determined by Saaty Method (Questionnaire 3) [12].
ATC Individual ActivitiesWeightOrder
Horizontal Separation0.1204
Vertical Separation0.0865
Radio Communication0.0388
Landing Sequence/Wake Turbulence0.1632
SSR Check/Radar Identification0.0309
Handover/Takeover Procedure0.01910
Unplanned Operation, Conflict Analysis0.1593
Change in Meteorological Conditions0.0606
Coordination0.0427
Non-standard or Emergency Situation0.2841
Table 7. Correlation of order for individual questionnaires.
Correlation of the Order of Specific ATC Activities for Individual Questionnaires
Questionnaire IDQuestionnaire IDQuestionnaire No.123456789
I.II.Correlation Rate0.690.940.9510.890.900.850.870.82
I.III.0.820.970.770.730.930.930.800.900.74
II.III.0.620.990.690.730.930.960.990.830.87
1011121314151617181920
I.II.0.9210.750.970.92110.970.970.770.97
I.III.0.830.990.890.960.790.920.580.720.960.870.90
II.III.0.920.990.710.980.800.920.580.760.970.970.95
Table 8. Order of the individual ATC activities based on their difficulty; continuous training.
ATC Individual ActivitiesWeightOrder
Horizontal Separation0.0807
Vertical Separation0.0826
Radio Communication0.0895
Landing Sequence/Wake Turbulence0.1902
SSR Check/Radar Identification0.0439
Handover/Takeover Procedure0.03410
Unplanned Operation, Conflict Analysis0.1313
Change in Meteorological Conditions0.0488
Coordination0.1004
Non-standard or Emergency Situation0.2021
Table 9. Order of individual activities based on their difficulty.
ATC Individual ActivitiesSimulation TestingQuestionnaire SurveyContinuous Training
Horizontal Separation847
Vertical Separation656
Radio Communication485
Landing Sequence/Wake Turbulence322
SSR Check/Radar Identification799
Handover/Takeover Procedure91010
Unplanned Operation, Conflict Analysis233
Change in Meteorological Conditions1068
Coordination574
Non-standard or Emergency Situation111
Table 10. Pair Correlation Results.
1. Data Source2. Data SourceCorrelation Level
Simulation DataQuestionnaire Data0.64
Simulation dataContinuous Training0.81
Questionnaire DataContinuous Training0.88
Table 11. Final Weights of ATC Activities.
ATC Individual ActivitiesSimulation TestingQuestionnaire SurveyContinuous TrainingFinal Weight
Horizontal Separation0.0930.1200.0800.098
Vertical Separation0.0980.0860.0820.089
Radio Communication0.1090.0380.0890.079
Landing Sequence/Wake Turbulence0.1130.1630.1900.155
SSR Check/Radar Identification0.0940.0300.0430.056
Handover/Takeover Procedure0.0780.0190.0340.044
Unplanned Operation, Conflict Analysis0.1200.1590.1310.137
Change in Meteorological Conditions0.0620.0600.0480.057
Coordination0.1080.0420.1000.083
Non-standard or Emergency Situation0.1250.2840.2020.204
Publisher’s Note: MDPI stays neutral with regard to jurisdictional claims in published maps and institutional affiliations.

