Abstract
In the heating supply systems in apartment buildings utilizing district heating, the supply water temperature setting is a critical control for providing sufficient heating and effective usage of the heating energy. Conventional water temperature control methods such as fixed temperature (FT) control can result in energy wastage and outdoor air temperature reset (OTR) control cannot reflect the variation in the heating demands of households because it only considers the outdoor air temperature. Therefore, this study proposes an advanced control method called flow-based residential energy demand (f-RED) control, which sets the supply water temperature based on the outdoor air temperature and household heating demands (i.e., the changes in the circulated heating water flow). To determine the performance of the proposed method compared to the conventional one, this study utilizes building energy simulation. The simulation analysis results confirm that the f-RED control method appropriately sets the supply water temperature based on a combination of the two factors, supplies heat according to heating demands, and reduces the energy consumption of the circulation pump by approximately 1.6% and that of the secondary pump by 4.2%. Thus, the f-RED control method is able to utilize heat energy more effectively and efficiently than the conventional control method.
1. Introduction
In South Korea, residential buildings account for the largest proportion of buildings at approximately 63.8% [1]. Thus, energy saving in residential buildings is essential for overall energy saving in the building sector. Among residential buildings, apartment buildings, which are the most common residential form in South Korea, account for approximately 49.2% [2]. Therefore, energy saving in apartment buildings contributes significantly to energy conservation in the building sector. Apartment buildings consume the largest proportion of energy (approximately 67.1% of the total energy) as heat energy [3]. Therefore, to reduce energy consumption in apartment buildings, the reduction of heat energy consumption has been suggested. Accordingly, the proportion of apartment buildings in South Korea employing heating systems that utilize district heating as the heat source in order to reduce heat energy consumption has been increasing [1]. As such heating systems use the heat generated by large-scale heat production facilities, more efficient energy usage is possible compared to individual heating. However, efficient usage of energy in a heating system using district heating as the heat source must be accompanied by the efficient operation of the heating system. Therefore, appropriate control of the heat supply system is necessary.
In apartment buildings, a heating system utilizing district heating comprises a heat-supply facility, a primary loop connected to the heat-supply plant, a secondary loop connected to the end-use side, and an end-use side (see Figure 1). The operation of a heating system utilizing the district heat source is described below.
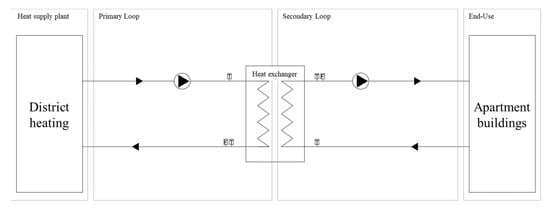
Figure 1.
Schematic of the district heating system for apartment buildings.
(1) High-temperature water produced by a heat supply plant is supplied to the heat exchanger in the mechanical room of the apartment building, using a circulation pump installed in the primary loop.
(2) The high-temperature water supplied to the heat exchanger heats the water flowing in the secondary loop.
(3) The heated water is supplied to the end-use side using the circulation pump in the secondary loop.
As the heat-supply plant of the district heating system supplies high-temperature water to several buildings, it is difficult to control a primary-side loop connected to several buildings. Hence, the high-temperature water of the primary-side loop is typically operated using constant controls. Therefore, for efficient control of the heating system in a target apartment building, the supply water temperature of the heated water (heating supply water temperature) in the secondary loop is controlled.
Among the methods for controlling the heating supply water temperature (HSWT), the commonly used control methods are fixed temperature (FT) control and outdoor air temperature reset (OTR) control. The FT method controls the heating supply water setting temperature by fixing it at a constant value. As most of the temperatures in the FT control method are set based on the experience of the facility user, reflecting the variations in the outdoor thermal environment or the heating demands of households is challenging. The OTR control method linearly controls the HSWT according to the variation in the outdoor air temperature; therefore, it is possible to actively handle the variations in the outdoor thermal environment. However, because OTR control sets the HSWT based only on variations in the outdoor air temperature, it is difficult to reflect the heating demands of households. In view of the above, improvement of the existing methods for controlling the heating system in apartment buildings has been previously explored (see Table 1).

Table 1.
Summary of the previous studies on supply heating system control methods.
Hong et al., analyzed the thermal characteristics and heat energy when OTR control and predictive control were applied to the heating system of a building [4]. It was determined that outdoor air temperature prediction control reduced approximately 4% of the heat energy consumption compared to OTR control.
Kim et al., proposed fuzzy control to improve the on-off control of the secondary-side loop [5]. The resultant fuzzy control has less variation in the indoor air temperature compared to on-off control in reducing unnecessary heating energy and increasing the comfort of the occupants.
Hong and Cho proposed outdoor air temperature prediction control, which is a secondary-loop supply water temperature control method, to conserve energy in the secondary loop [6]. The proposed supply water temperature control method was compared with OTR control, and it was determined that heat loss could be reduced and temperature hunting could be prevented compared to the existing control.
Yeom et al., proposed residential energy demand (RED) control for the HSWT of the secondary loop to improve OTR control [7]. In RED control, the HSWT was set based on the return temperature of the secondary loop and the outdoor air temperature. Thereby, it was possible to reduce the energy consumption of the secondary-side loop compared to OTR control.
Lee et al., proposed artificial-intelligence-based optimal on-off control to improve the on-off control on the end-use side [8]. The artificial-intelligence-based optimal control maintained the indoor air temperature within the control range of the set temperature. In contrast, the existing on-off control overheated from 0.7–1 °C. Thus, the artificial-intelligence-based optimal on-off control could prevent overheating and maintain the indoor air temperature.
Choi et al., analyzed the influence of the household-side HSWT control on the end-use side [9]. They developed an equation to calculate the required supply water temperature according to the HSWT control. Using this equation, HSWT control was possible for better prevention of indoor air temperature overheating compared to the existing control, and the indoor temperature was maintained at the set temperature even though the HSWT was lower than that of the existing control.
Seo et al., developed a gray-box model and compared on-off control and PID control to improve the heating control on the end-use side [10]. PID control was found to lower the return temperature and mass flow compared to on-off control.
Seo et al., proposed a method involving return-water temperature control for each household and variable mass flow rate control using an inverter pump [11]. The proposed control method reduced energy consumption by approximately 50% compared to a constant flow control.
Shin et al., studied the optimal heating start-stop control method for residential buildings using a radiant floor heating system [12]. They proposed an inference algorithm to classify an occupied or unoccupied household using a PIR sensor and CO2 sensor. The proposed algorithm could be applied to residential buildings, with an average estimation accuracy of 95%. In addition, optimal start and stop control with the inference algorithm reduced heat energy consumption by approximately 3.1%.
The various methods proposed involved control of the heating system to meet the heating demands of the building. However, previous studies focused on the reflection of the changes in the external thermal environment among the factors for calculating the building’s heating demands. Although the changes in the external thermal environment are important for this calculation, it is also important to reflect the heating demands of households. Therefore, for efficient control of the heating system, the changes in the external thermal environment and the heating demands of households must be simultaneously reflected.
In general, a heating system utilizing district heating supplies heating water to the end-use side at a mass flow rate according to the set HSWT of the secondary loop to satisfy the heat requirement on the end-use side. The heating mass flow rate of a heating system using district heating represents the heating demands of households. Therefore, this study proposes an advanced control method, named f-RED (flow-based residential energy demand), which considers the varied heating demands of the apartment households. The f-RED control method sets the supply water temperatures based on the outdoor thermal environmental factor (i.e., the changes in the outdoor air temperature) and the heating demand factor (i.e., the changes in the circulated heating water flow).
2. Methodology
2.1. Overall Study Process
The objective of this study is to improve the existing HSWT control method. To achieve this, an apartment building located in Daejeon, South Korea was selected for case-study and a simulation model was developed. EnergyPlus v.8.5 was used for simulation modeling [13]. Weather data from the international weather files for energy calculation 2.0 (IWEC2) for Daejeon, South Korea were used [14]. MATLAB was used for implementing the OTR control and f-RED control algorithms in the building model, and the building control virtual test bed (BCVTB) program was employed for integrating the two programs [15,16]. Figure 2 depicts the annual temperature of Daejeon area as a box plot. The simulation period was set during the winter season, from November to March (five months). In this study, the HSWT, heating energy consumption, and heating supply calorific value were analyzed under each control. Further, the analysis results were compared between the OTR control and f-RED control. Figure 3 illustrates the overall process adopted in this study.
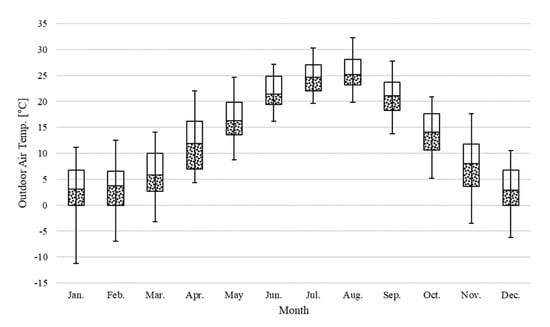
Figure 2.
Monthly outdoor air temperatures in Daejeon, South Korea.
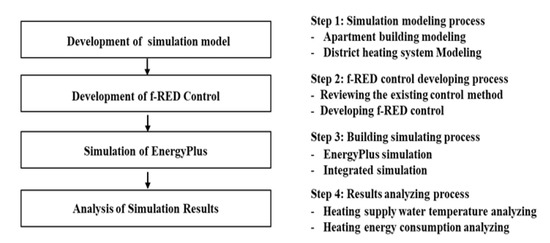
Figure 3.
Overall study process.
2.2. Simulation Modeling of the Case-Study Building
A case-study model reproducing actual thermal behavior was constructed to simulate the heating system of an apartment building that utilizes the district heating source. As previously mentioned, the simulation model was based on an apartment building in Daejeon, South Korea. The zone of the case-study model included six conditioned zones and an unconditioned zone on each floor.
The developed model comprised a ground floor, middle floor, and top floor for reflecting the thermal characteristics of the ground, middle, and top floors of the apartment building by varying the thermal boundary conditions of the floor and roof for each of the three floors. The other simulation parameters are listed in Table 2, where values in Table 2 refer to the material properties of the actual target building. Figure 4 shows the zones and the shape of the case-study model.

Table 2.
Simulation model parameters.
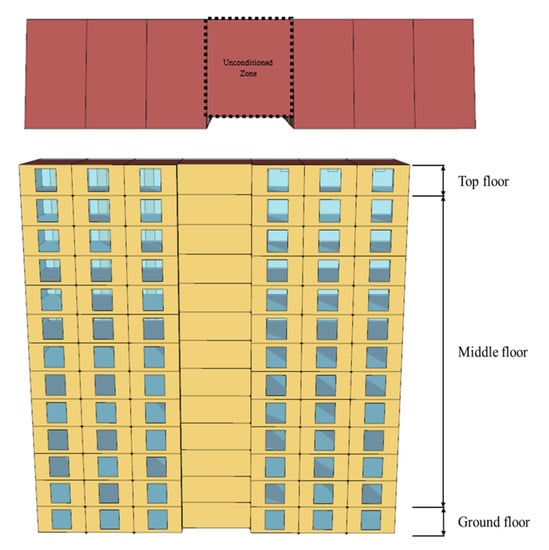
Figure 4.
Overall view of the case-study building.
2.3. EnergyPlus and MATLAB Integration through BCVTB
In this study, the OTR and f-RED controls were applied to the case-study simulation model. The algorithms were implemented using MATLAB. In the overall simulation process, EnergyPlus and MATLAB exchanged the set variables through BCVTB and an integrated simulation was performed. The HSWT was calculated through MATLAB using the variables exchanged with EnergyPlus. The calculated HSWT was applied as the secondary HSWT set of the heat exchanger in EnergyPlus. Table 3 shows the exchange variables between these two programs through BCVTB.

Table 3.
Exchange variables between EnergyPlus and MATLAB.
2.4. OTR Control
OTR control is a control algorithm that sets the HSWT linearly according to the variation in the outdoor air temperature. In this study, among the recommended settings for the HSWT for OTR control suggested by the institutions in South Korea, the HSWT provided by the Korea District Heating Corporation (KDHC) was set as the maximum HSWT (i. e., 60 °C) when the outdoor air temperature was below −10 °C. When the outdoor air temperature was 10 °C or higher, the minimum HSWT was set as 45 °C (See Table 4) [17]. In the section where the outdoor air temperature ranges from −10–10 °C, the algorithm linearly controls the HSWT based on the temperature set according to the changes in the outdoor air temperature. Figure 5 depicts the control sequence with the KDHC recommended setting for the HSWT.

Table 4.
Heating supply water setpoint temperature for OTR control.
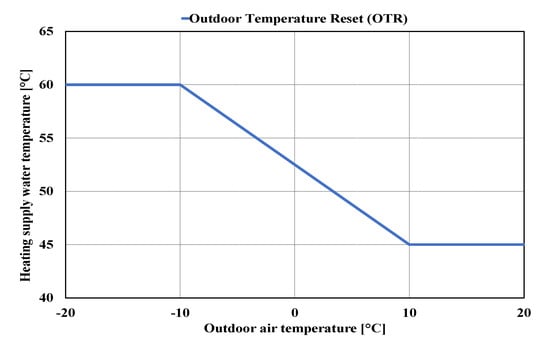
Figure 5.
OTR control method for setting the HSWT.
2.5. f-RED Control
The variation in the heating demands of households can be evaluated and calculated based on the variation of the heating mass flow rate in the secondary loop. Therefore, this study proposes f-RED control, a new heating supply temperature control method that is able to consider both the variation in the heating mass flow rate and the outdoor air temperature. The overall algorithm of the f-RED control includes Equations (1)–(8). Equation (1) is an input variable obtained by accumulating the difference between the current heating mass flow rate () and the previous heating mass flow rate () at each timestep interval to reflect the variation in the heating demands of households.
Using as the activation function, the sum of the difference in the heating mass flow rate is converted from −1–1. Equation (2) expresses the function used in this study. Equation (2) is used to reflect the variations in temperature of the heating flow rate in different units. Here, variable determines the gradient of the function curve. Figure 6 displays the change in according to the change in the value of , where is expressed as for the convenience of graphical representation.
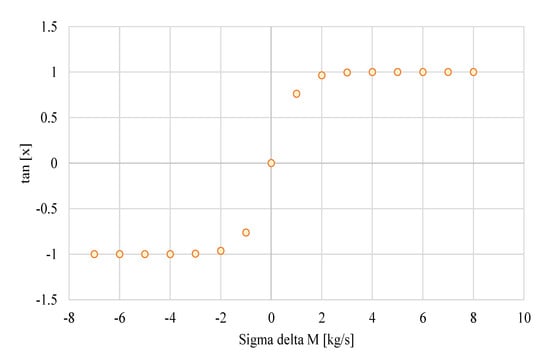
Figure 6.
Comparison of and tanh (x).
is the correction temperature calculated using the above-mentioned values. is the HSWT-weighting coefficient used for adjusting the desired temperature control range such that the activation functions (i. e., ) value output. In Equation (3), is unity, and is given by Equation (4). In this case, ranges from −3~2. Figure 7 is a graph that shows the value of according to the variation in the heating mass flow rate difference calculated as described above, where is expressed as for the convenience of graphical representation. The gradient of increases with the increase in the value of . If the value of is large, is set to the maximum temperature even for a small flow rate change. Therefore, to reflect the heating mass flow rate variation, it is necessary to select an appropriate value of . In this study, is set to two.
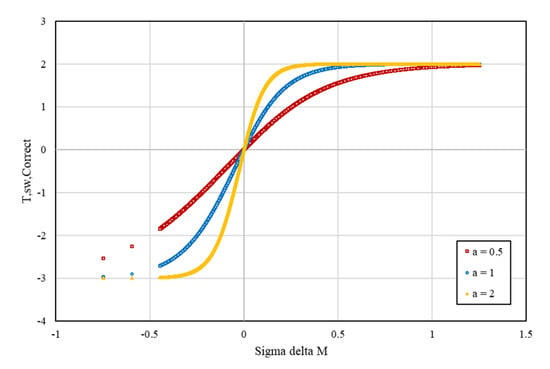
Figure 7.
according to variable .
Equations (5)–(8) apply to the existing OTR control algorithm. Equation (5) is the set HSWT () when the outdoor air temperature () is below −10 °C:
where is the maximum HSWT of OTR control. When the outdoor air temperature is 10 °C or higher, the HSWT is set using Equation (6):
where is the minimum HSWT of OTR control.
When the outdoor air temperature ranges from −10–10 °C, Equation (7) is applied for calculating the current heating supply temperature using the outdoor air temperature and , which reflects the heating demands of households.
where is the current timestep heating supply set temperature, is the outdoor air reset gradient, and is the outdoor air compensation intercept.
Equation (8) sets the HSWT reflecting , which is the previous heating supply set temperature:
where plays a role in preventing hunting of the HSWT.
3. Analysis of the Simulation Results
3.1. Analysis of the HSWT
In this study, the HSWT was analyzed based on the simulation results applying the f-RED and OTR control. Figure 8 shows the variation in the HSWT according to the variation in the outdoor air temperature under each control. OTR control is linear from 45–60 °C of the HSWT for a variation range of −10–10 °C of the outdoor air temperature. The f-RED control is nonlinear in the HSWT range of 42–62 °C according to the variation in the outdoor air temperature. In the f-RED control, the HSWT is in the range of approximately 5 °C on the equal outdoor air temperature. The f-RED method controls the HSWT by reflecting not only the outdoor air temperature but also the heating demands of households. Therefore, it is concluded that f-RED control is more efficient compared to OTR control because f-RED control applies several HSWTs compared to the OTR control for the same outdoor air temperature.
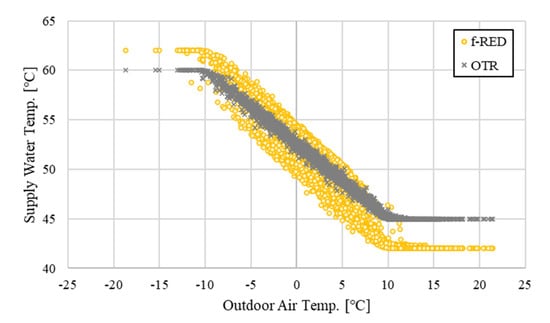
Figure 8.
Supply water temperature according to the outdoor air temperature (f-RED vs. OTR).
3.2. Analysis of the Heating Mass Flow Rate
The heating mass flow rate in the secondary loop is an indicator of the heating demands of households because it is supplied to satisfy the required heating load on the end-use side. Therefore, the greater the influence of the variation in the heating mass flow rate in the secondary loop on the setting of the HSWT, the more the heating demands of households by the set heating supply temperature is reflected. Figure 9 shows the variation in the HSWT according to the variation in the heating mass flow rate in the secondary loop under each control. The heating mass flow rates under both controls range from 0–2.1 kg/s. The overall heating mass flow rate under OTR control is higher than that of f-RED control. The R2 value, which is a measure of how well the linear-model-estimated statistics fit the given data, is 0.7062 for f-RED control and 0.4707 for OTR control. Therefore, f-RED control sets the HSWT, reflecting the heating demands of households better than OTR control.
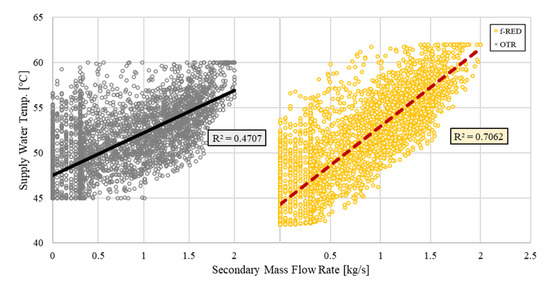
Figure 9.
Supply water temperature according to the secondary mass flow rate.
3.3. Analysis of the Pump-Energy Consumption
Control of the HSWT of the secondary loop affects the energy consumption of the circulation pumps in the primary and secondary loops. Therefore, the energy consumption of the circulation pump under each control was analyzed according to the outdoor air temperature range. Figure 10 shows the distribution of the HSWT and the energy consumption of the circulation pump under each control, for various outdoor air temperature ranges.
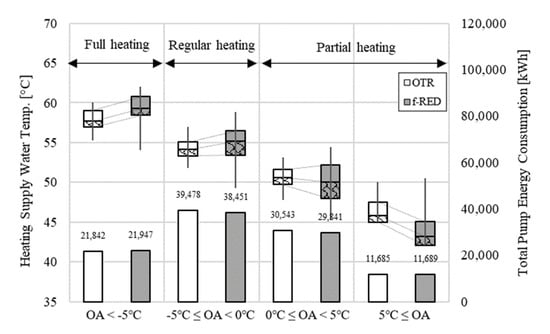
Figure 10.
Comparison of the HSWT and pump energy consumption.
In f-RED control, when the outdoor air temperature is below −5 °C, the average HSWT is approximately 59.3 °C, which is nearly 1.5 °C higher on an average than that of OTR control. Here, the total pump energy consumption under f-RED control is approximately 105 kWh more than that under OTR control.
f-RED controls the HSWT to approximately 58.8 °C on an average when the outdoor air temperature is −5 °C or more and less than 0 °C. This is nearly 4.4 °C higher than that of OTR control (54.2 °C) in the same outdoor air temperature range. Here, the total pump energy consumption is approximately 38,451 kWh and 39,478 kWh under f-RED and OTR control, respectively, with a reduction of nearly 3% in the energy consumption through f-RED control compared to OTR control.
When the outdoor air temperature is 0 °C or more and less than 5 °C, f-RED controls the HSWT in the range of 45.2–54.4 °C, whereas OTR controls the same in the range of 47.8–53.1 °C. In f-RED control, the minimum HSWT is set nearly 2.6 °C lower than the OTR control and the maximum is set nearly 1.3 °C higher. The total pump energy consumption is approximately 702 kWh lesser under f-RED compared to OTR control.
When the outdoor air temperature is 5 °C or higher, f-RED control sets the HSWT from 42–50.5 °C, whereas the set HSWT ranges from 45–50.1 °C under OTR control. The pump energy consumption is approximately 11,687 kWh under f-RED control and 11,485 kWh under OTR control.
The heating pump energy consumption under f-RED control is similar to that under OTR control when the outdoor air temperature is less than −5 °C and more than 5 °C. For an outdoor air temperature above −5 °C and below 5 °C, the pump energy consumption under f-RED control can be reduced by nearly 3% compared to OTR control. Therefore, it is concluded that efficient use of energy is feasible under f-RED control because it sets the HSWT more efficiently.
3.3.1. Analysis during the Full Heating Period (Outdoor Air Temperature (OA) < −5 °C)
The total pump-energy consumption is analyzed with respect to the outdoor air temperature range for the entire heating period. Figure 11 shows the HSWT and the total pump energy consumption under each control for a day when the outdoor air temperature is less than 5 °C. The HSWT is expressed as a line and the total pump energy consumption is expressed as a bar graph. The yellow box section is the period where the outdoor air temperature is below −10 °C. In this section, f-RED control and OTR control set the HSWT at 62 °C and 60 °C, respectively. Here, the total pump energy consumption under f-RED control is more than that under OTR control.
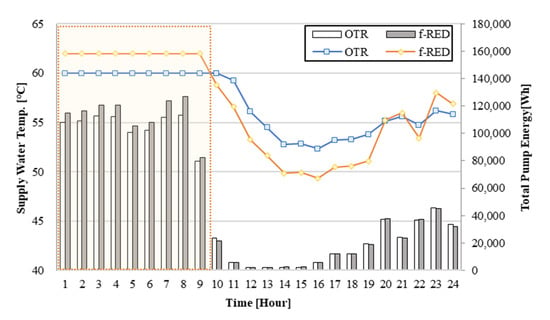
Figure 11.
Resultant total pump energy consumption in a day (entire heating period).
The set HSWT at 10:00 during this period is lower under f-RED control compared to OTR control. The total pump energy consumption is lesser under f-RED control than OTR. Therefore, when f-RED control is applied, it is concluded that efficient total pump energy consumption is possible by setting the HSWT to a lower value compared to OTR control when the heating demand decreases.
The amount of heat supplied under each control during the same period was analyzed. The results are depicted in Figure 12, where the line indicates the HSWT and the bar graph indicates the amount of heat supplied. The heat supplied under f-RED control during the entire heating period is 496 kWh, whereas it is 484 kWh under OTR control. Thus, 2.5% more heat is supplied under f-RED control.
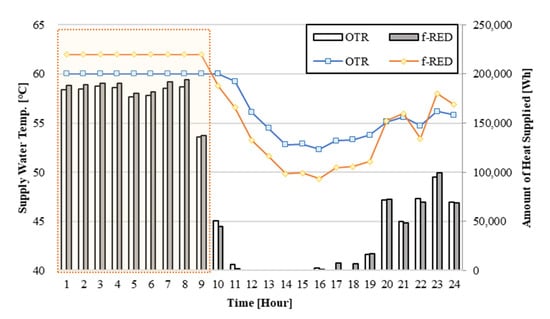
Figure 12.
Resultant heat supply amount for a day (entire heating period).
In the period within the yellow box (1:00 to 9:00) in Figure 12, more heat is supplied under f-RED control than under OTR control when the outdoor air temperature is below −10 °C. In addition, f-RED control sets the HSWT to a lower value than OTR control by reflecting the heating demands of households at 10:00 and supplies a lesser amount of heat. Therefore, f-RED control, which reflects the heating demands of households during the entire heating period, is more efficient than OTR control.
3.3.2. Analysis during Regular Heating Periods (−5 °C ≤ OA < 0 °C)
On one of the days during the regular heating period, the total pump energy consumption was analyzed according to the change in the HSWT, as depicted in Figure 13. The line graph in the figure expresses the HSWT, whereas the bar graph expresses the total pump energy consumption. In the yellow box, the HSWT under f-RED control ranges from 50.8–56.2 °C, whereas that under OTR control ranges from 52.4–54.2 °C. Here, with respect to the total pump energy consumption, OTR control consumes more energy than f-RED control. In addition, under f-RED control, the heating supply water temperature is lower from 9:00. Therefore, it is concluded that the f-RED method controls the HSWT more efficiently than OTR control by reflecting the heating demands of households.
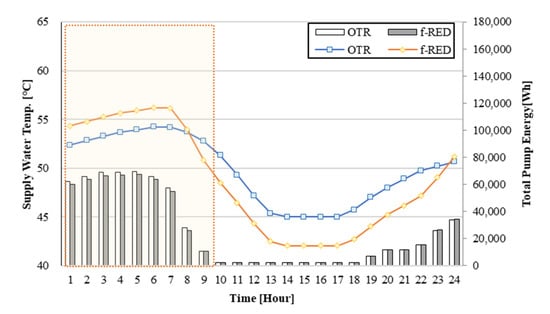
Figure 13.
Resultant total pump energy consumption in a day during regular heating periods.
The amount of heat supplied according to the change in the HSWT under each control during the same period was analyzed and depicted in Figure 14. In this figure, the HSWT is expressed as a line graph and the amount of heat supplied is expressed as a bar graph. Within the yellow box, f-RED control supplies more heat than OTR control. In the same section, f-RED control consumes less total pump energy than OTR control and can supply a large amount of heat. Therefore, it is concluded that f-RED control is efficient in terms of the heat supply and total pump energy consumption.
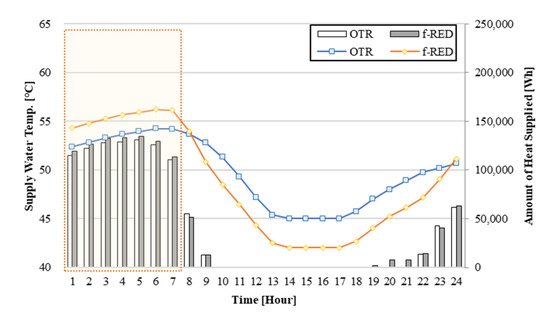
Figure 14.
Resultant heat supply in a day during regular heating periods.
3.3.3. Analysis during Partial Heating Periods (0 °C ≤ OA < 5 °C, 5 °C ≤ OA)
In this study, the total pump energy consumption during partial heating periods was analyzed. Figure 15 shows the change in the total pump energy consumption according to the change in the heating water supply temperature under each control during the partial heating periods. f-RED control consumes less total pump energy than OTR control from 03:00–09:00, 20:00, and 23:00–24:00 h. Here, the heating water temperature under f-RED control shows a minimum difference of nearly 1.2 °C and a maximum of nearly 3 °C compared to OTR control. Therefore, during a partial heating period, f-RED control sets a high-HSWT to operate the pump more efficiently than OTR control.
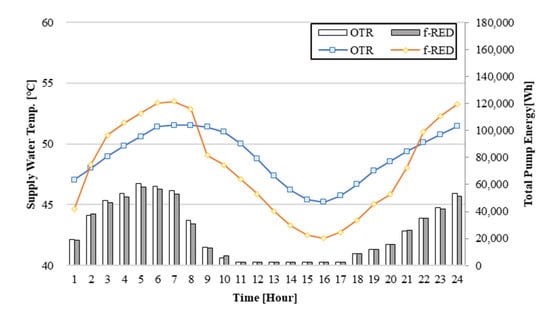
Figure 15.
Resultant total pump energy consumption during partial heating periods in a day.
The change in the HSWT and the amount of heat supplied per hour under each control were analyzed during the same period (Figure 16). f-RED control supplies more heat compared to OTR control from 1:00–07:00, 18:00–20:00, and 22:00–24:00. Moreover, it supplies more heat with less total pump energy consumption compared to OTR control from 03:00–07:00, 20:00, and 23:00–24:00. Therefore, it is concluded that the f-RED method is able to control the heat supply system more efficiently than OTR control.
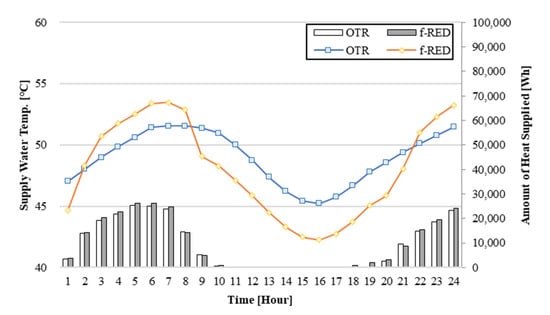
Figure 16.
Resultant heat supply during partial heating periods in a day.
3.3.4. Analysis of the Monthly Pump Energy Consumption
Table 5 depicts the comparison results of the pump energy consumption under each control during the simulation period, where the pump energy consumption is divided into the monthly primary and secondary. During the entire heating period, OTR and f-RED control consume approximately 103,552 kWh and 101,925 kWh, respectively, of the total pump energy. The pump energy consumption under f-RED control is lower by approximately 1627 kWh compared to OTR control. With respect to the primary pump energy consumption, OTR control consumes nearly 6.6% less primary pump energy than f-RED control. With respect to the secondary pump energy consumption, f-RED control consumes approximately 4.2% less secondary pump energy compared to OTR control. Therefore, when the f-RED method is applied, it is possible to reduce the overall heating energy, and the energy reduction is greater compared to OTR control from the perspective of the secondary loop.

Table 5.
Monthly pump energy consumption during the simulation period.
3.4. Analysis of the Supplied Heat
The amount of heat supplied and the heating load under each control were analyzed. The amount of heat supplied under each control is approximately 172,522 kWh under OTR control and 180,258 kWh under f-RED control during the heating period. Under f-RED control, 4.3% more heat is supplied compared to OTR control (Figure 17). The amount of heat supplied meets the required load by −2.7% under OTR control and +1.7% under f-RED control (Table 6). Moreover, the heating load requirement is not met for a total of 3624 h in the heating period (1986 h under OTR control and 1423 h under f-RED control). f-RED control reduces the time during which the heating load is not satisfied by approximately 30% compared to OTR control. Therefore, f-RED control efficiently balances the heating load and heat supply compared to OTR control.
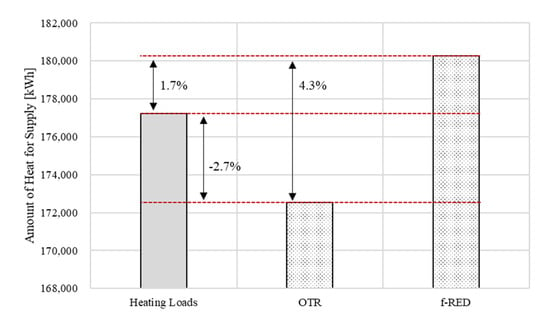
Figure 17.
Comparison of the heating load and heat supply.

Table 6.
Resultant heat supply during the simulation period.
The sum of the monthly heating load and the amount of heat supplied were analyzed. The monthly heating load ranges from 21,473–47,997 kWh. The heating load is at a minimum in November and maximum in January. The amount of heat supplied ranges from 20,396–47,179 kWh and 21,855–48,699 kWh under OTR and f-RED control, respectively. Under f-RED control, the minimum and maximum supply are 3.1% and 6.7% more per month, respectively, than under OTR control. Comparison of the heating load and the amount of heat supplied shows that under OTR control, the heating load is not satisfied by −1.7–(−5.3)%, and f-RED control provides 1.4–1.9% more heat. Under OTR control, the difference between the amount of heat supplied and the heating load in November and March is −5.3% and −4.5%, respectively, which is the maximum difference; the lowest difference is −1.7%, in January. Therefore, the f-RED method controls the heating system more efficiently with respect to the heat supply compared to OTR control.
The above analysis confirms that f-RED control is more efficient than OTR control in supplying heat to satisfy the heating load. Furthermore, the heating pump energy consumption and the amount of heat supplied under each control were analyzed during daytime (09:00–18:00) and nighttime (19:00–08:00). Figure 18a,b shows the accumulated amount of heat supplied under each control and the total pump energy consumption during daytime and nighttime, respectively. In Figure 18a, the amount of heat supplied under f-RED control is approximately 11.8% higher and the total pump energy consumption is approximately 1% lesser than those under OTR control. In Figure 18b, the amount of heat supplied under f-RED control is approximately 3.8% higher and the total pump energy consumption is approximately 2% lesser during nighttime than those under OTR control. f-RED control consumes less total pump energy while supplying heat compared to OTR control. Therefore, it is concluded that the f-RED method can control the heat supply system more efficiently than OTR control.
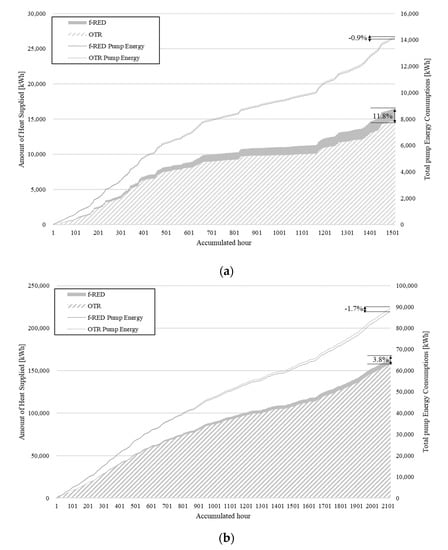
Figure 18.
Comparison of the amount of heat supplied and the total pump energy consumption. (a) Daytime. (b) Nighttime.
4. Conclusions
In this study, as an improvement to the existing OTR control method, f-RED control that can also reflect the heating demands of households was proposed. The proposed f-RED control was compared with the OTR control through simulation-based analysis. The findings of this study are summarized as follows:
- (1)
- The HSWTs of the OTR control and f-RED control were compared with the outdoor air temperature and heating mass flow rate. It was determined that both methods controlled the HSWT by reflecting changes in the outdoor air temperature. However, the change in the heating mass flow rate was only reflected by the f-RED control for controlling the HSWT. Based on this result, it was concluded that the f-RED method could control the HSWT more efficiently in response to changes in heating demands compared to the OTR control.
- (2)
- The total pump energy consumption (primary and secondary pump) under f-RED control was less by nearly 1627 kWh (1.6%) compared to the OTR control. Here, the secondary pump energy consumption under f-RED control was reduced by 3281 kWh (nearly 4.2%) compared to the OTR control. Therefore, the f-RED method could more efficiently control the heating system using district heating compared to the OTR control; however, it was concluded that more efficient control was possible based on the secondary loop.
- (3)
- Analysis of the amount of heat supplied by each control method indicated that f-RED control supplied nearly 4.3% more heat than OTR control. The difference in the amount of heat supplied and the required heating load was approximately 2.7% less under OTR control and approximately 1.7% more under f-RED control. Therefore, it was concluded that f-RED control was more efficient than OTR control with respect to the heat supply.
As the proposed f-RED control is verified through simulation, application and verification in an actual building is recommended in future. In addition, as the proposed control is applied only to the target apartment building, application and verification in various buildings is necessary.
Author Contributions
All authors contributed equally. Conceptualization, C.L., S.J., S.L.D.; methodology, C.L., S.L.D.; formal analysis, C.L., S.J., S.L.D.; data curation, C.L., S.J., S.L.D.; writing—original draft preparation, C.L., S.L.D.; writing—review and editing, S.L.D., D.L.; visualization, C.L., S.J., D.L., S.L.D.; supervision, S.L.D. All authors have read and agreed to the published version of the manuscript.
Funding
This work was supported by the National Research Foundation of Korea (NRF) grant funded by the Korea government (MSIT) (No. 2021R1C1C1010231) and This work was supported by the Korea Institute of Energy Technology Evaluation and Planning (KETEP) and the Ministry of Trade, Industry & Energy (MOTIE) of the Republic of Korea (No. 20204030200080).
Conflicts of Interest
The authors declare no conflict of interest.
References
- MOLIT. Apartment House Living Condition Statistics; Ministry of Land Infrastructure and Transport (MOLIT): Sejong, Korea, 2019.
- MOLIT. Statistics on Buildings; Ministry of Land Infrastructure and Transport (MOLIT): Sejong, Korea, 2022.
- KAB. Residential Building Energy Use; Korea Appraisal Board (KAB): Daegu, Korea, 2019. [Google Scholar]
- Hong, S.S.; Song, J.Y.; Ahn, B.C. Energy Saving Control Strategy for Central Heating System Using Outdoor Air Temperature; The Society of Air-Conditioning and Refrigerating Engineers of Korea: Seoul, Korea, 2010; pp. 505–510. [Google Scholar]
- Kim, H.M.; Kim, J.Y.; Kim, T.Y.; Lee, S.B. Performance of Radiant Floor Heating System Based on Fuzzy Control in Apartment; Korea Institute of Architectural Sustainable Environment and Building Systems: Seoul, Korea, 2012; pp. 197–200. [Google Scholar]
- Hong, S.K.; Cho, S.H. The Comparison Study on Heating Supply Energy and Usage Patterns by Suppling Water Temperature Control; The Society of Air-Conditioning and Refrigerating Engineers of Korea: Seoul, Korea, 2015; pp. 266–274. [Google Scholar]
- Yeom, G.H.; Jung, D.E.; Do, S.L. Improving a heating supply water temperature control for radiant floor heating systems in korean high-rise residential buildings. Sustainability 2019, 11, 3926. [Google Scholar] [CrossRef] [Green Version]
- Lee, J.Y.; Gyu, S.R.; Yeo, M.S.; Kim, K.W. A study on the supply of optimum water flow rate in radiant floor heating system with room thermostat control. Archit. Inst. Korea 2005, 10, 199–202. [Google Scholar]
- Choi, J.M.; Lee, k.N.; Ryu, S.R.; Kim, Y.Y.; Yeo, M.S.; Kim, K.W. A study on the required supply water temperature calculating method for the control of multizone radiant floor heating system. Korean J. Air-Cond. Refrig. Eng. 2007, 19, 77–85. [Google Scholar]
- Seo, J.A.; Shin, Y.; Kim, Y.K.; Lee, T.W. A Study on Improved Heating Performance of an Apartment Housing Unit. Korean J. Air-Cond. Refrig. Eng. 2016, 28, 69–74. [Google Scholar]
- Seo, J.A.; Shin, Y.; Kim, Y.K.; Lee, T.W. A Study on Improved Operation of Apartment Heating System in a Machine Room. Korean J. Air-Cond. Refrig. Eng. 2017, 29, 38–42. [Google Scholar]
- Shin, M.S.; Rhee, K.N.; Jung, G.J. Optimal heating start and stop control based on the inferred occupancy schedule in a household with radiant floor heating system. Energy Build. 2015, 209, 109737. [Google Scholar] [CrossRef]
- DOE. EnergyPlus, version 8.5; The U.S Department of Energy (DOE): Washington, DC, USA, 2016.
- ASHRAE. International Weather for Energy Calculations 2.0 (IWEC2); American Society of Heating, Refrigerating and Air-Conditioning Engineers (ASHRAE): New York, NY, USA, 2017. [Google Scholar]
- MathWorks. MATLAB, version 2012a; MathWorks: Natick, MA, USA, 2018. [Google Scholar]
- LBNL. Building Controls Virtual Test Bed (BCVTB), Lawrence Berkeley National Laboratory (LBNL); The U.S. Department of Energy (DOE): Washington, DC, USA, 2018.
- KDHC. District Heating System Diagram; Korea Distrit Heating Corporation (KDHC): Seongnam si, Korea, 2017. [Google Scholar]
Publisher’s Note: MDPI stays neutral with regard to jurisdictional claims in published maps and institutional affiliations. |
© 2022 by the authors. Licensee MDPI, Basel, Switzerland. This article is an open access article distributed under the terms and conditions of the Creative Commons Attribution (CC BY) license (https://creativecommons.org/licenses/by/4.0/).