
The Influence of Water Quality Change on the Corrosion Process in Galvanized Pipes of Fire Protection Installations

 ,
,  ,
, 
 ,
,
Abstract
:1. Introduction
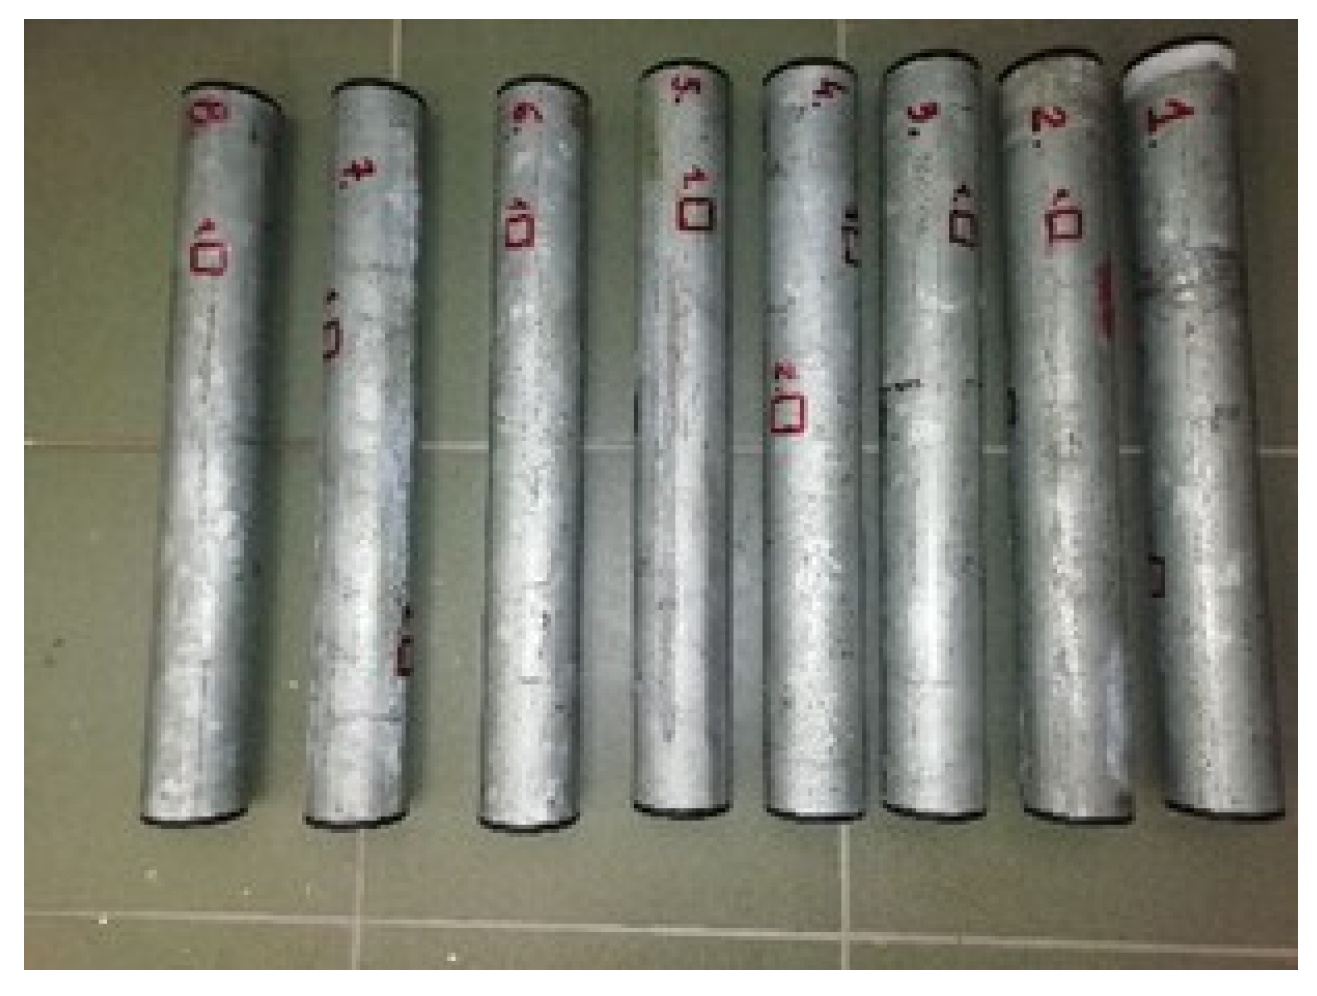
2. Research
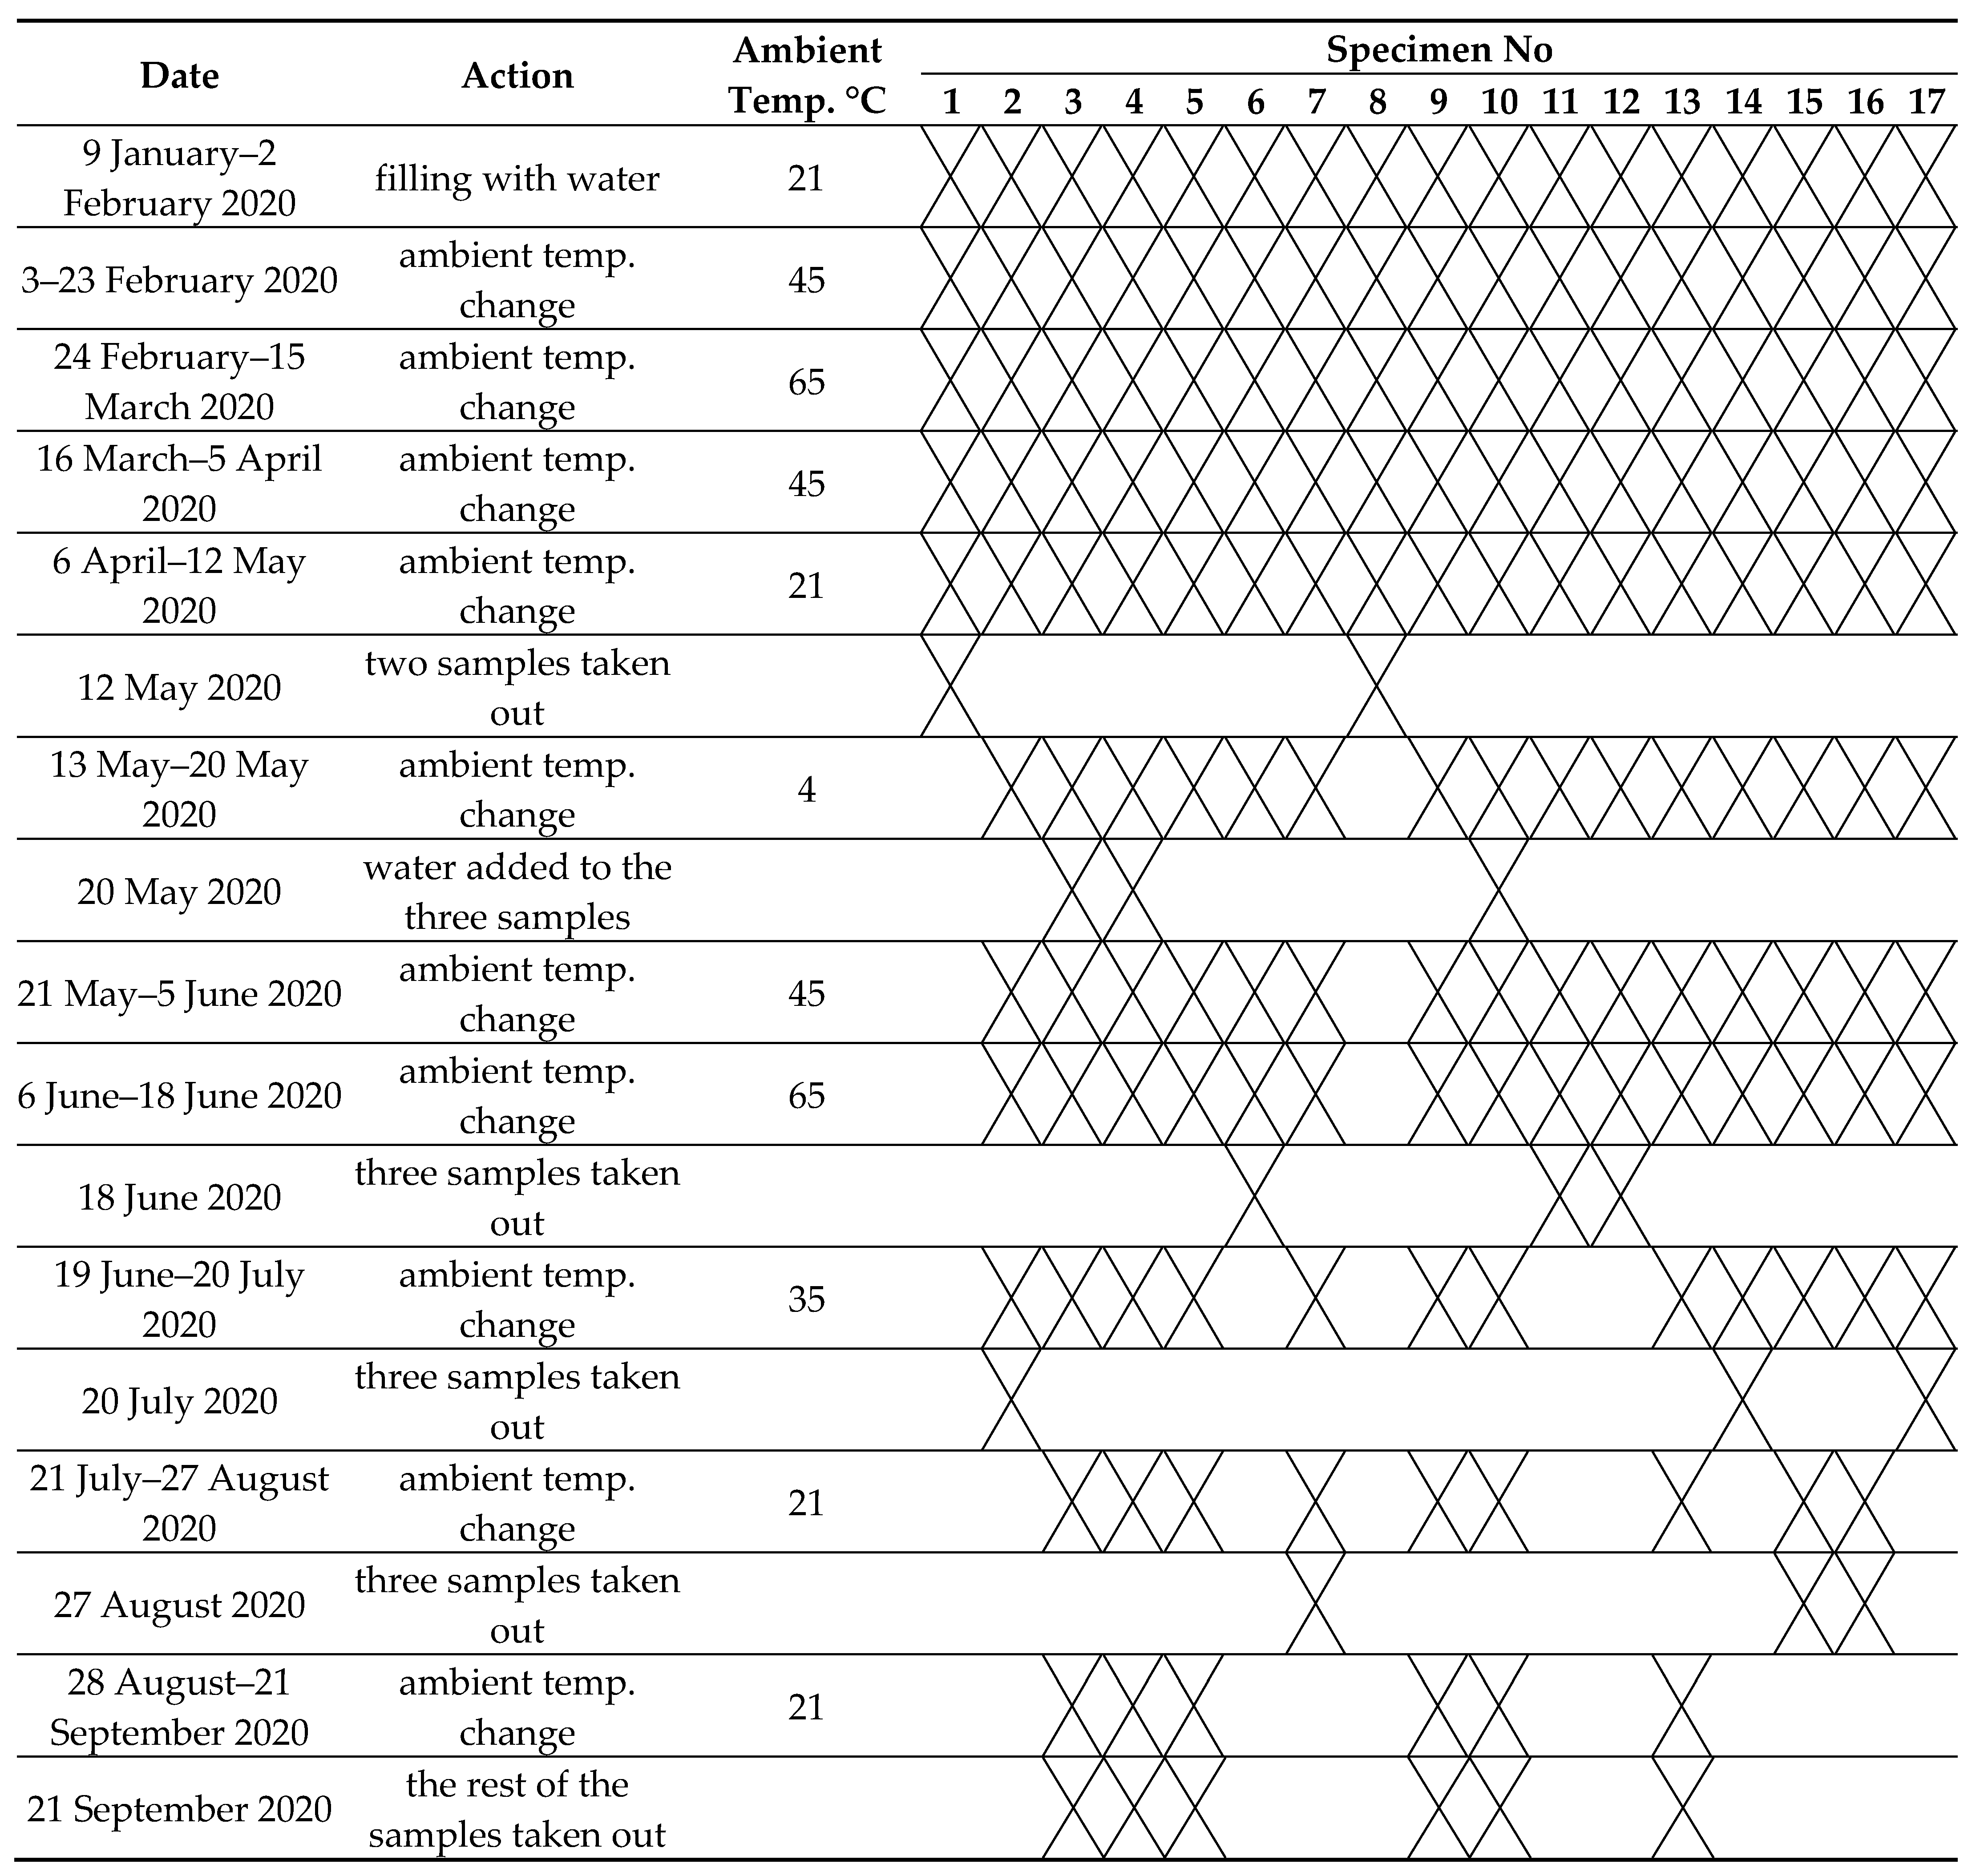
2.1. Assumptions/Scheme of the Experiment
2.2. Wall Thickness Measurements
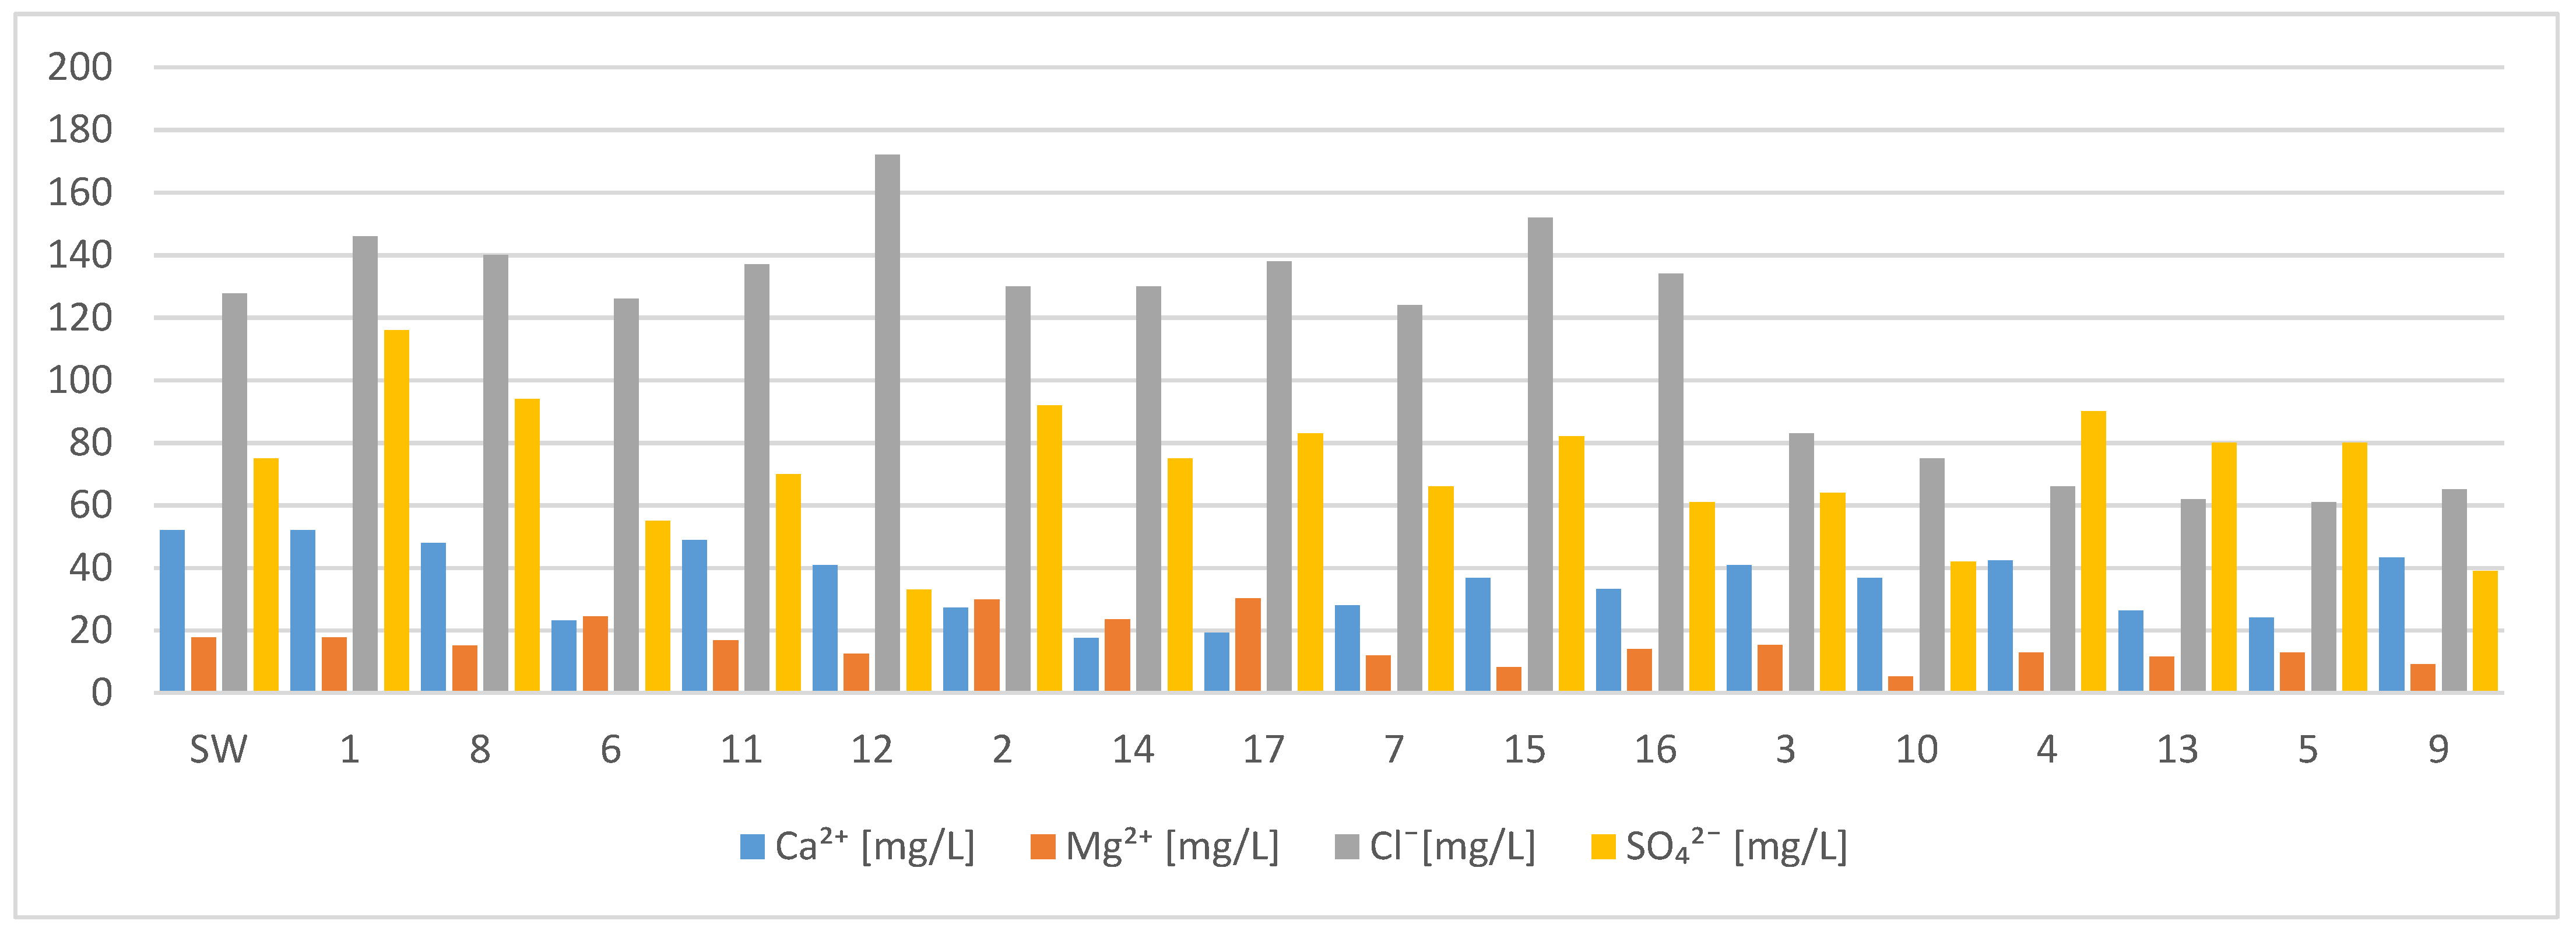
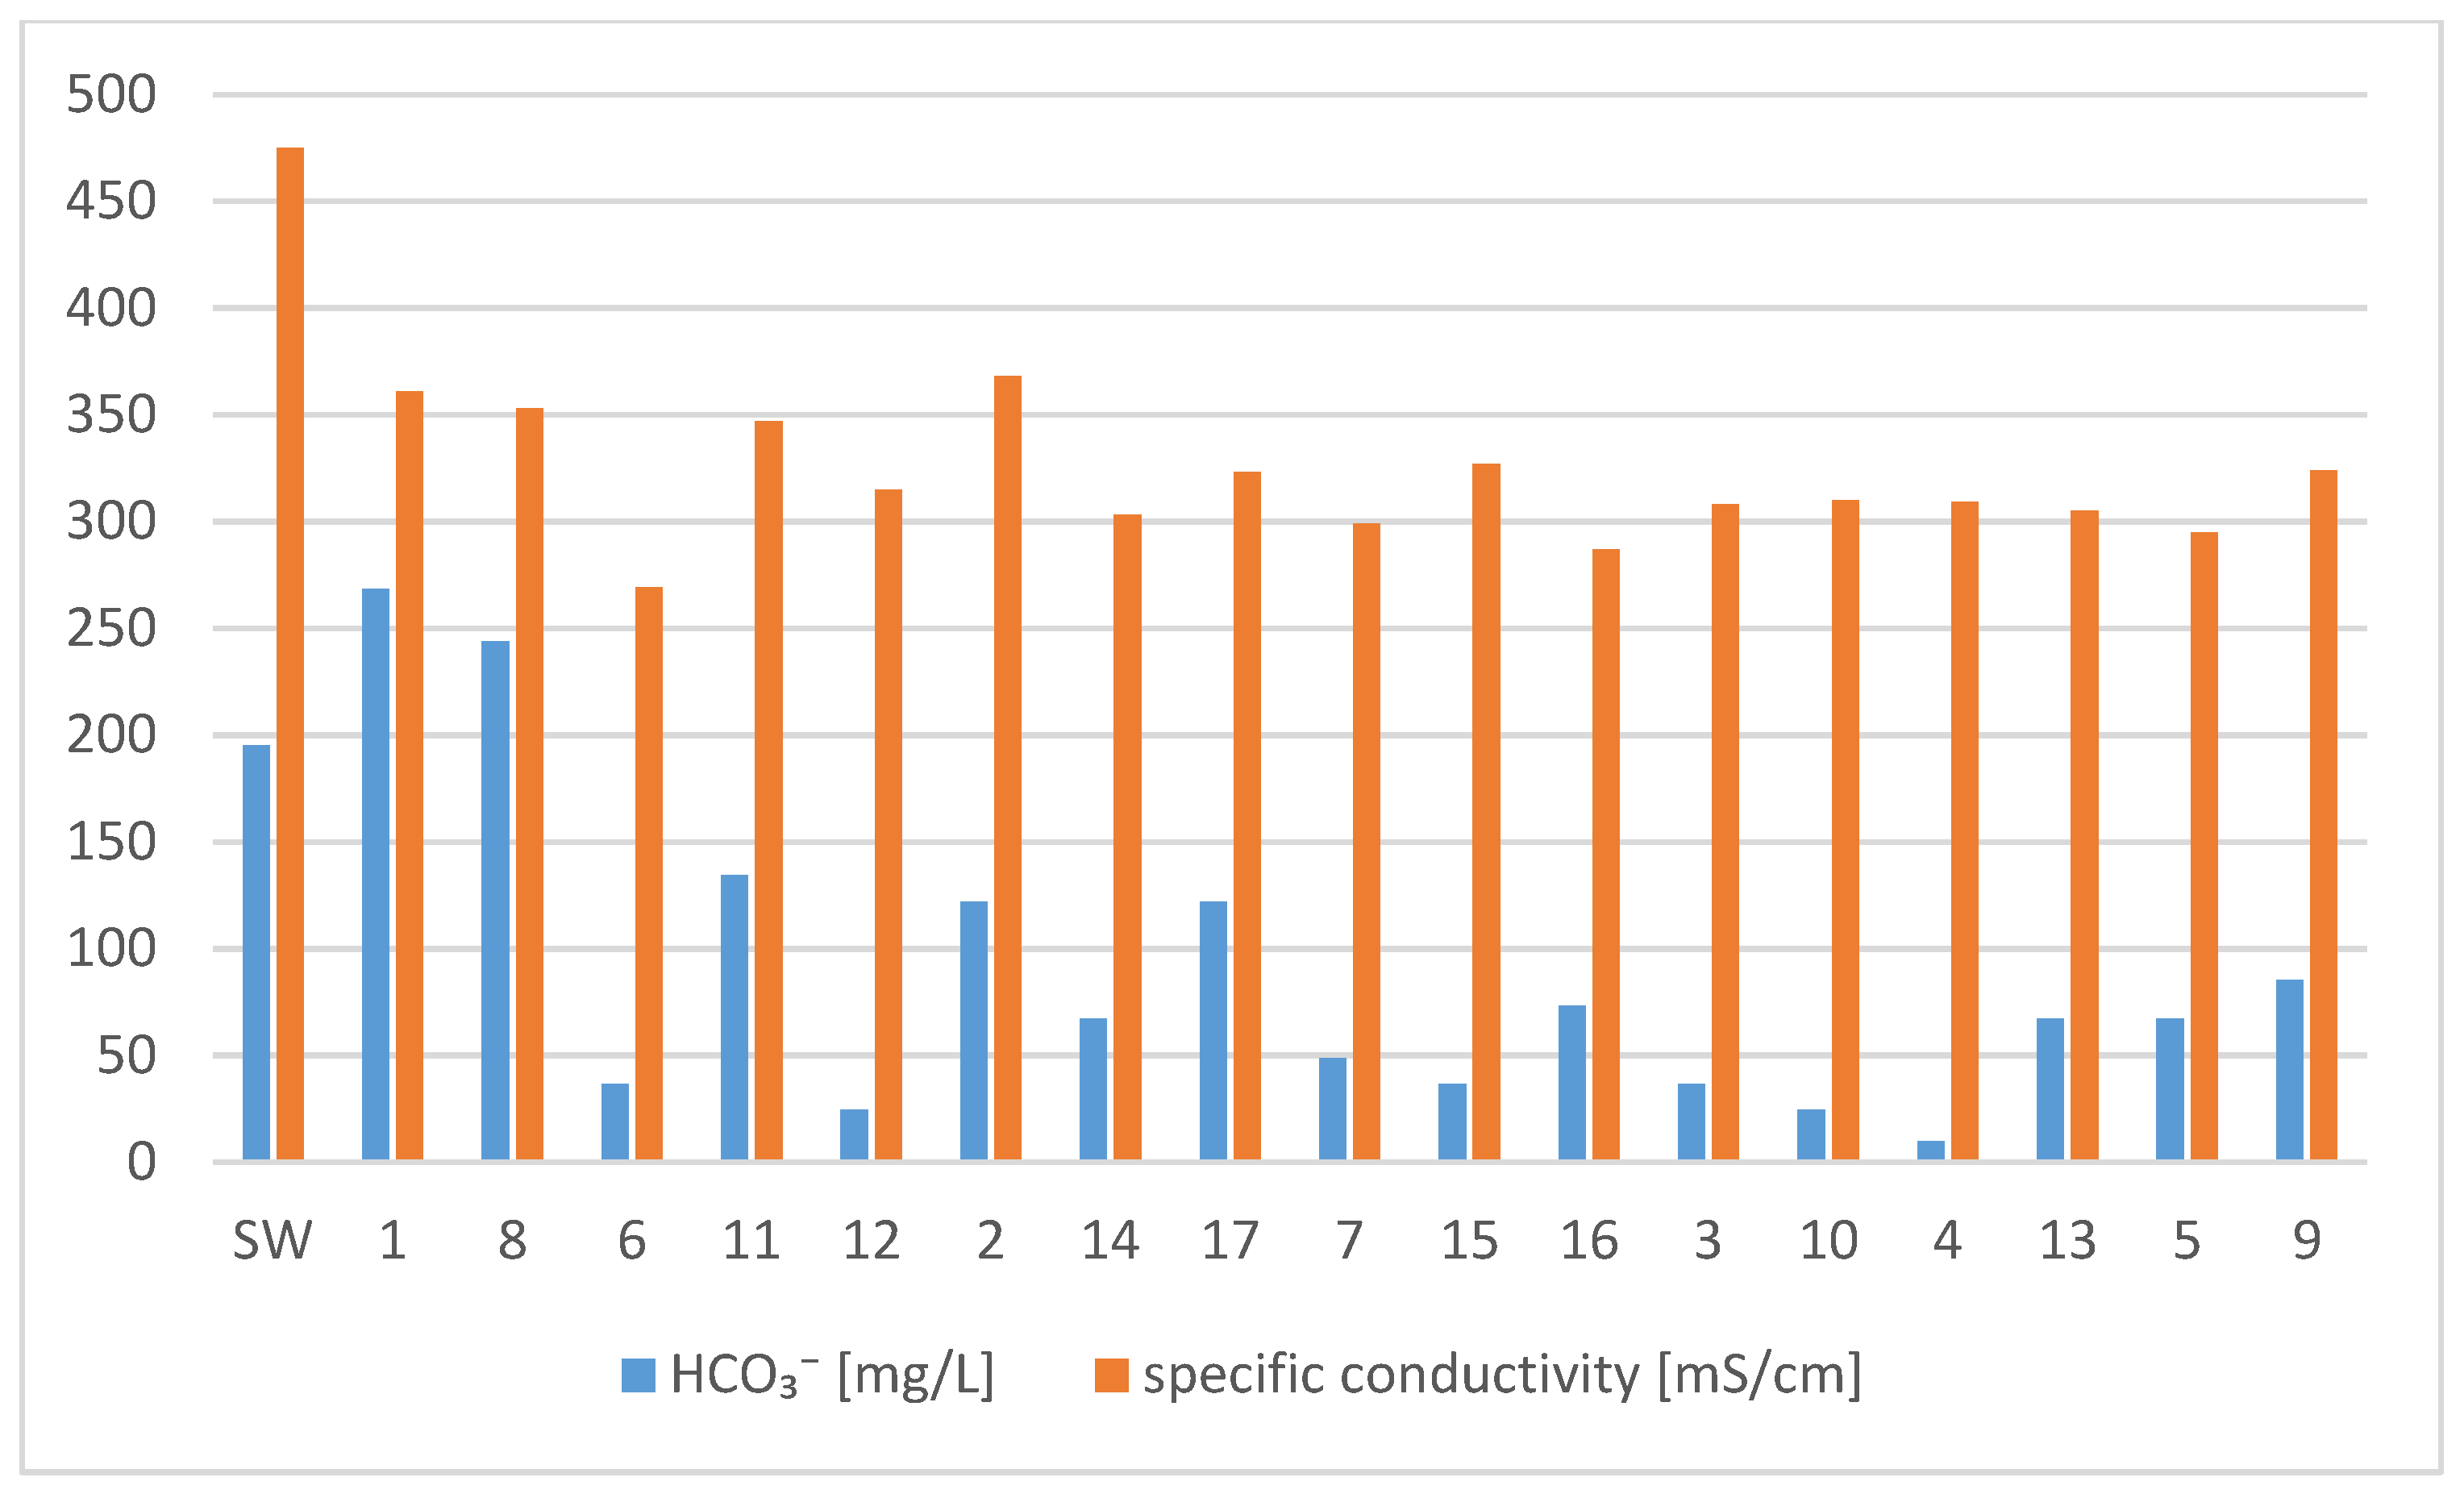
2.3. Water Chemistry Test
- -
- a group of indicators characterizing salinity-conductivity, chlorides, sulphates, calcium, magnesium, total hardness
- -
- a group of indicators characterizing acidification (acidification)-pH, alkalinity
- -
- a group of indicators characterizing the corrosiveness of water-the content of free carbon dioxide (total acidity of water), reaction, carbonate hardness of water, total alkalinity of water, content of bicarbonates, dissolved substances.
- -
- a group of indicators characterizing the biogenic conditions (nutrients)-ammonium nitrogen, nitrate nitrogen (V), phosphate nitrogen.
- -
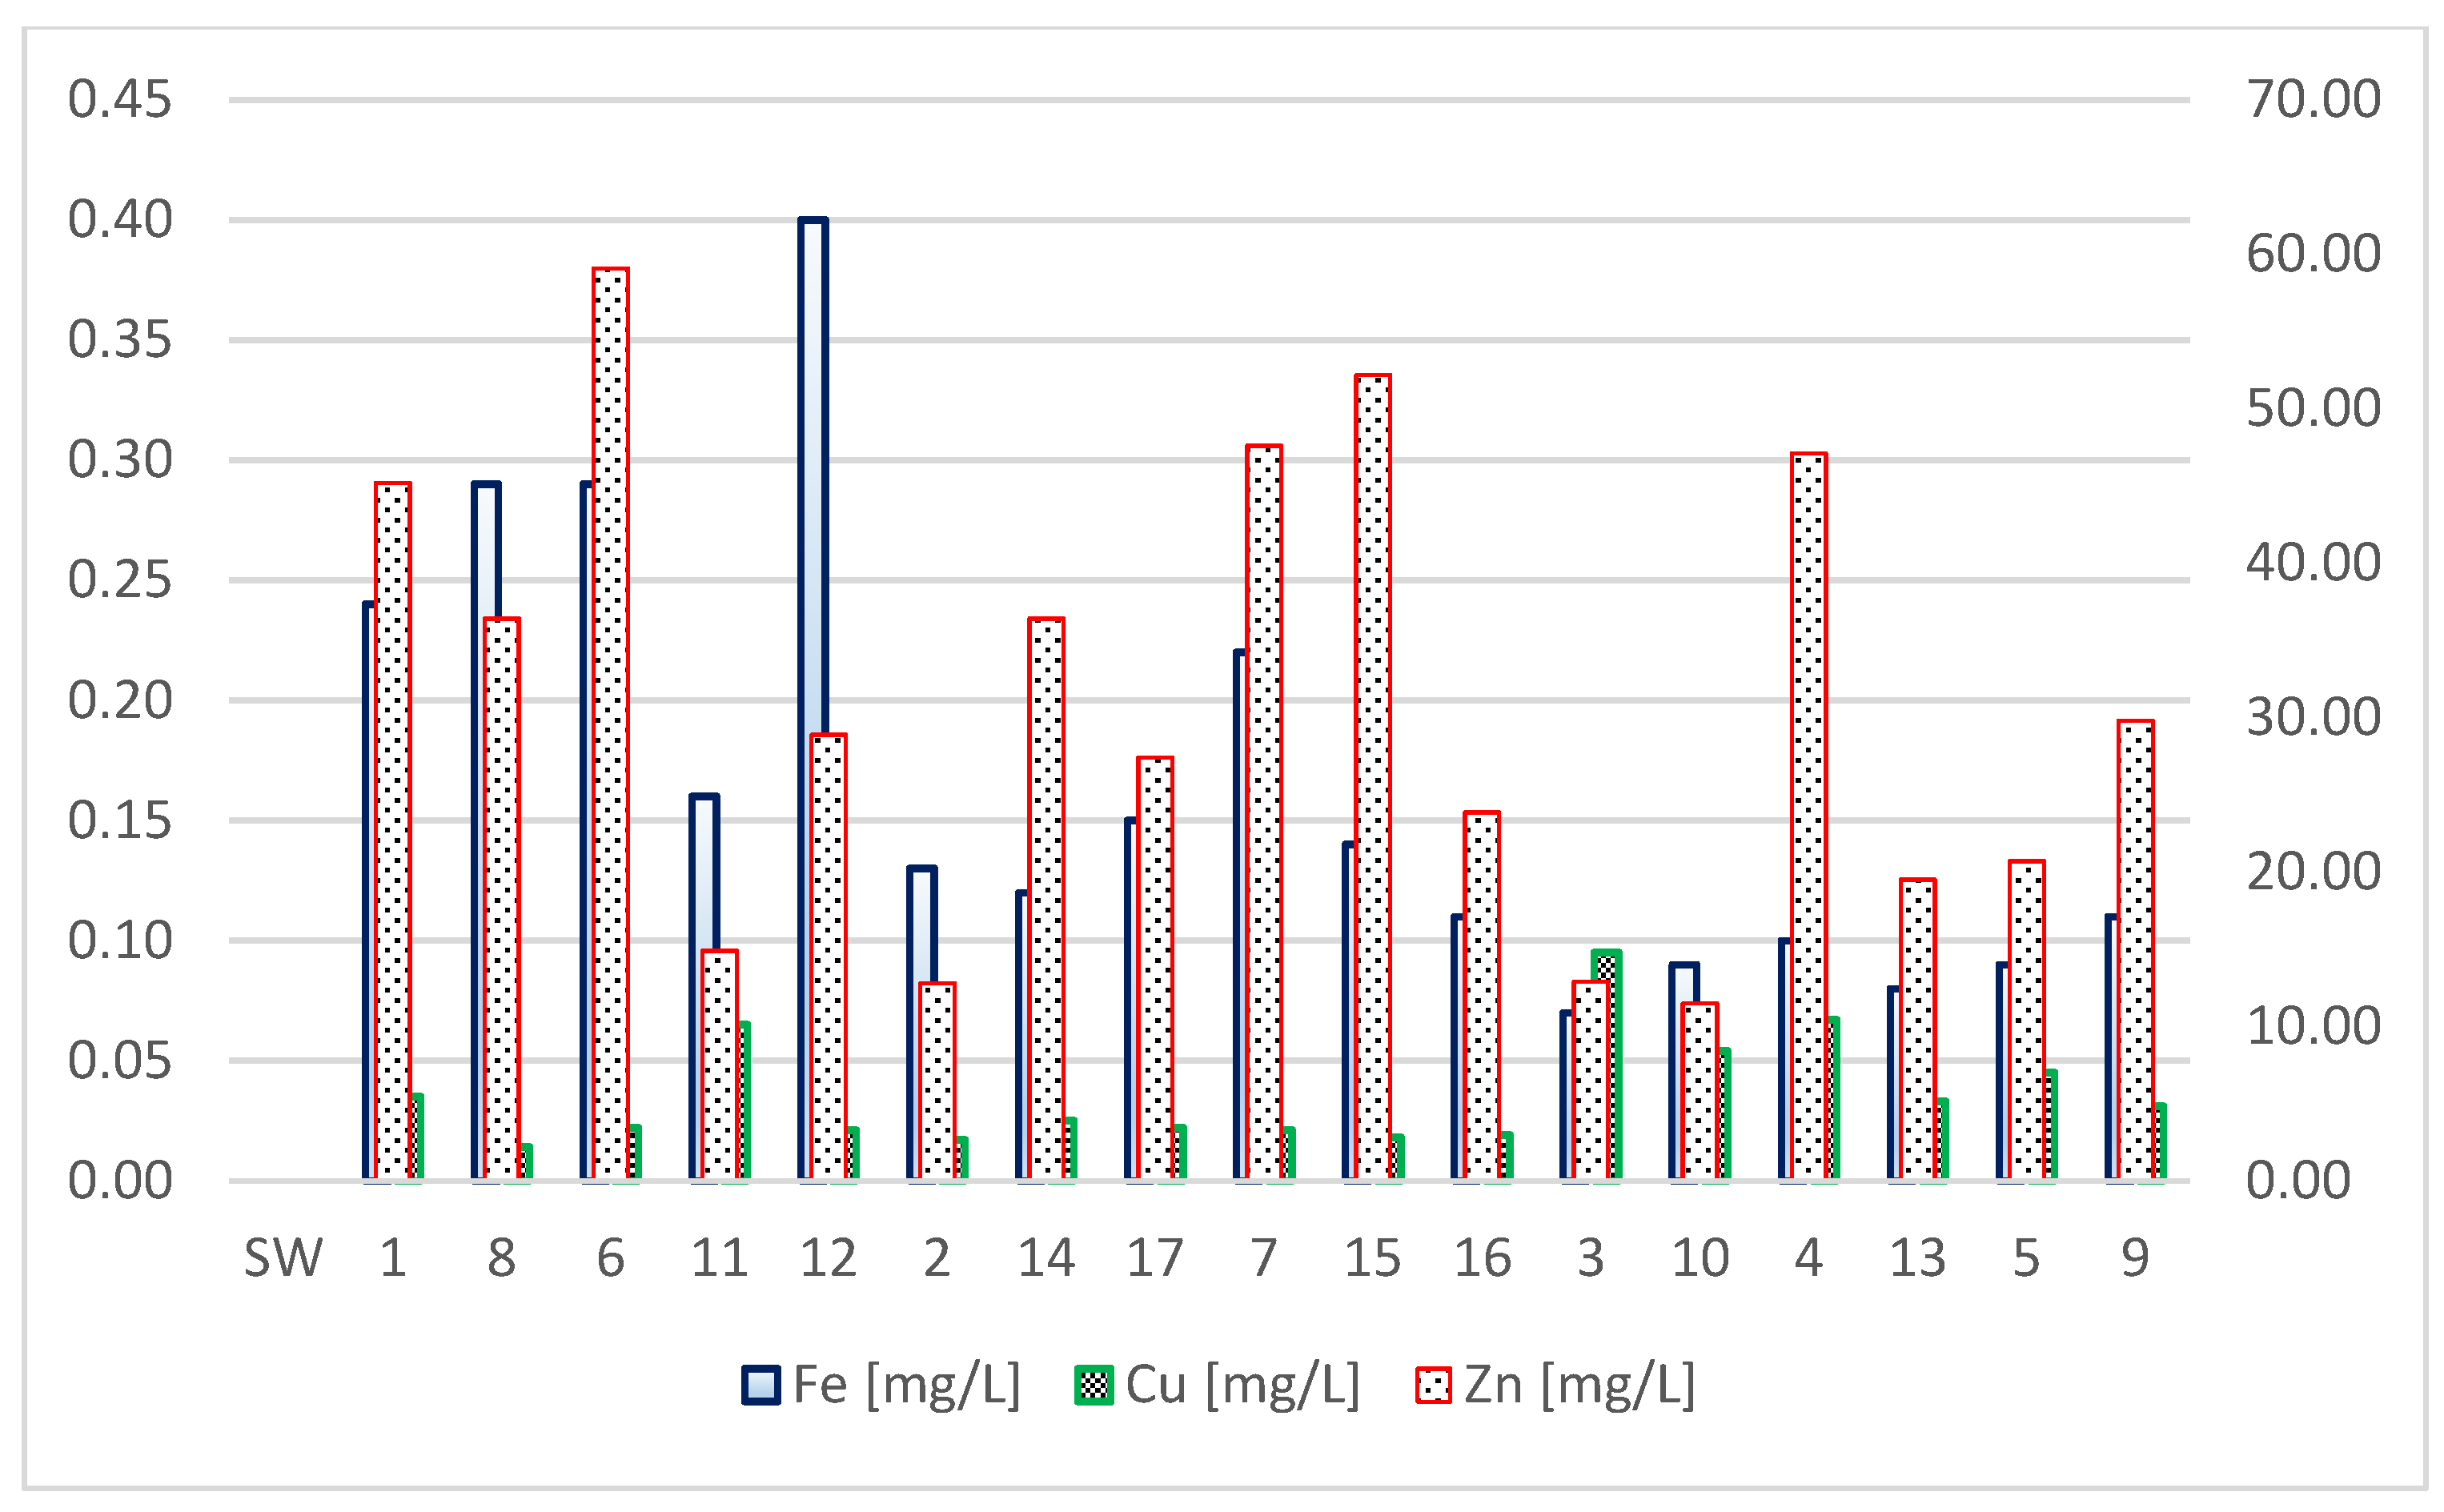
- metals: concentrations of iron, zinc, and copper.
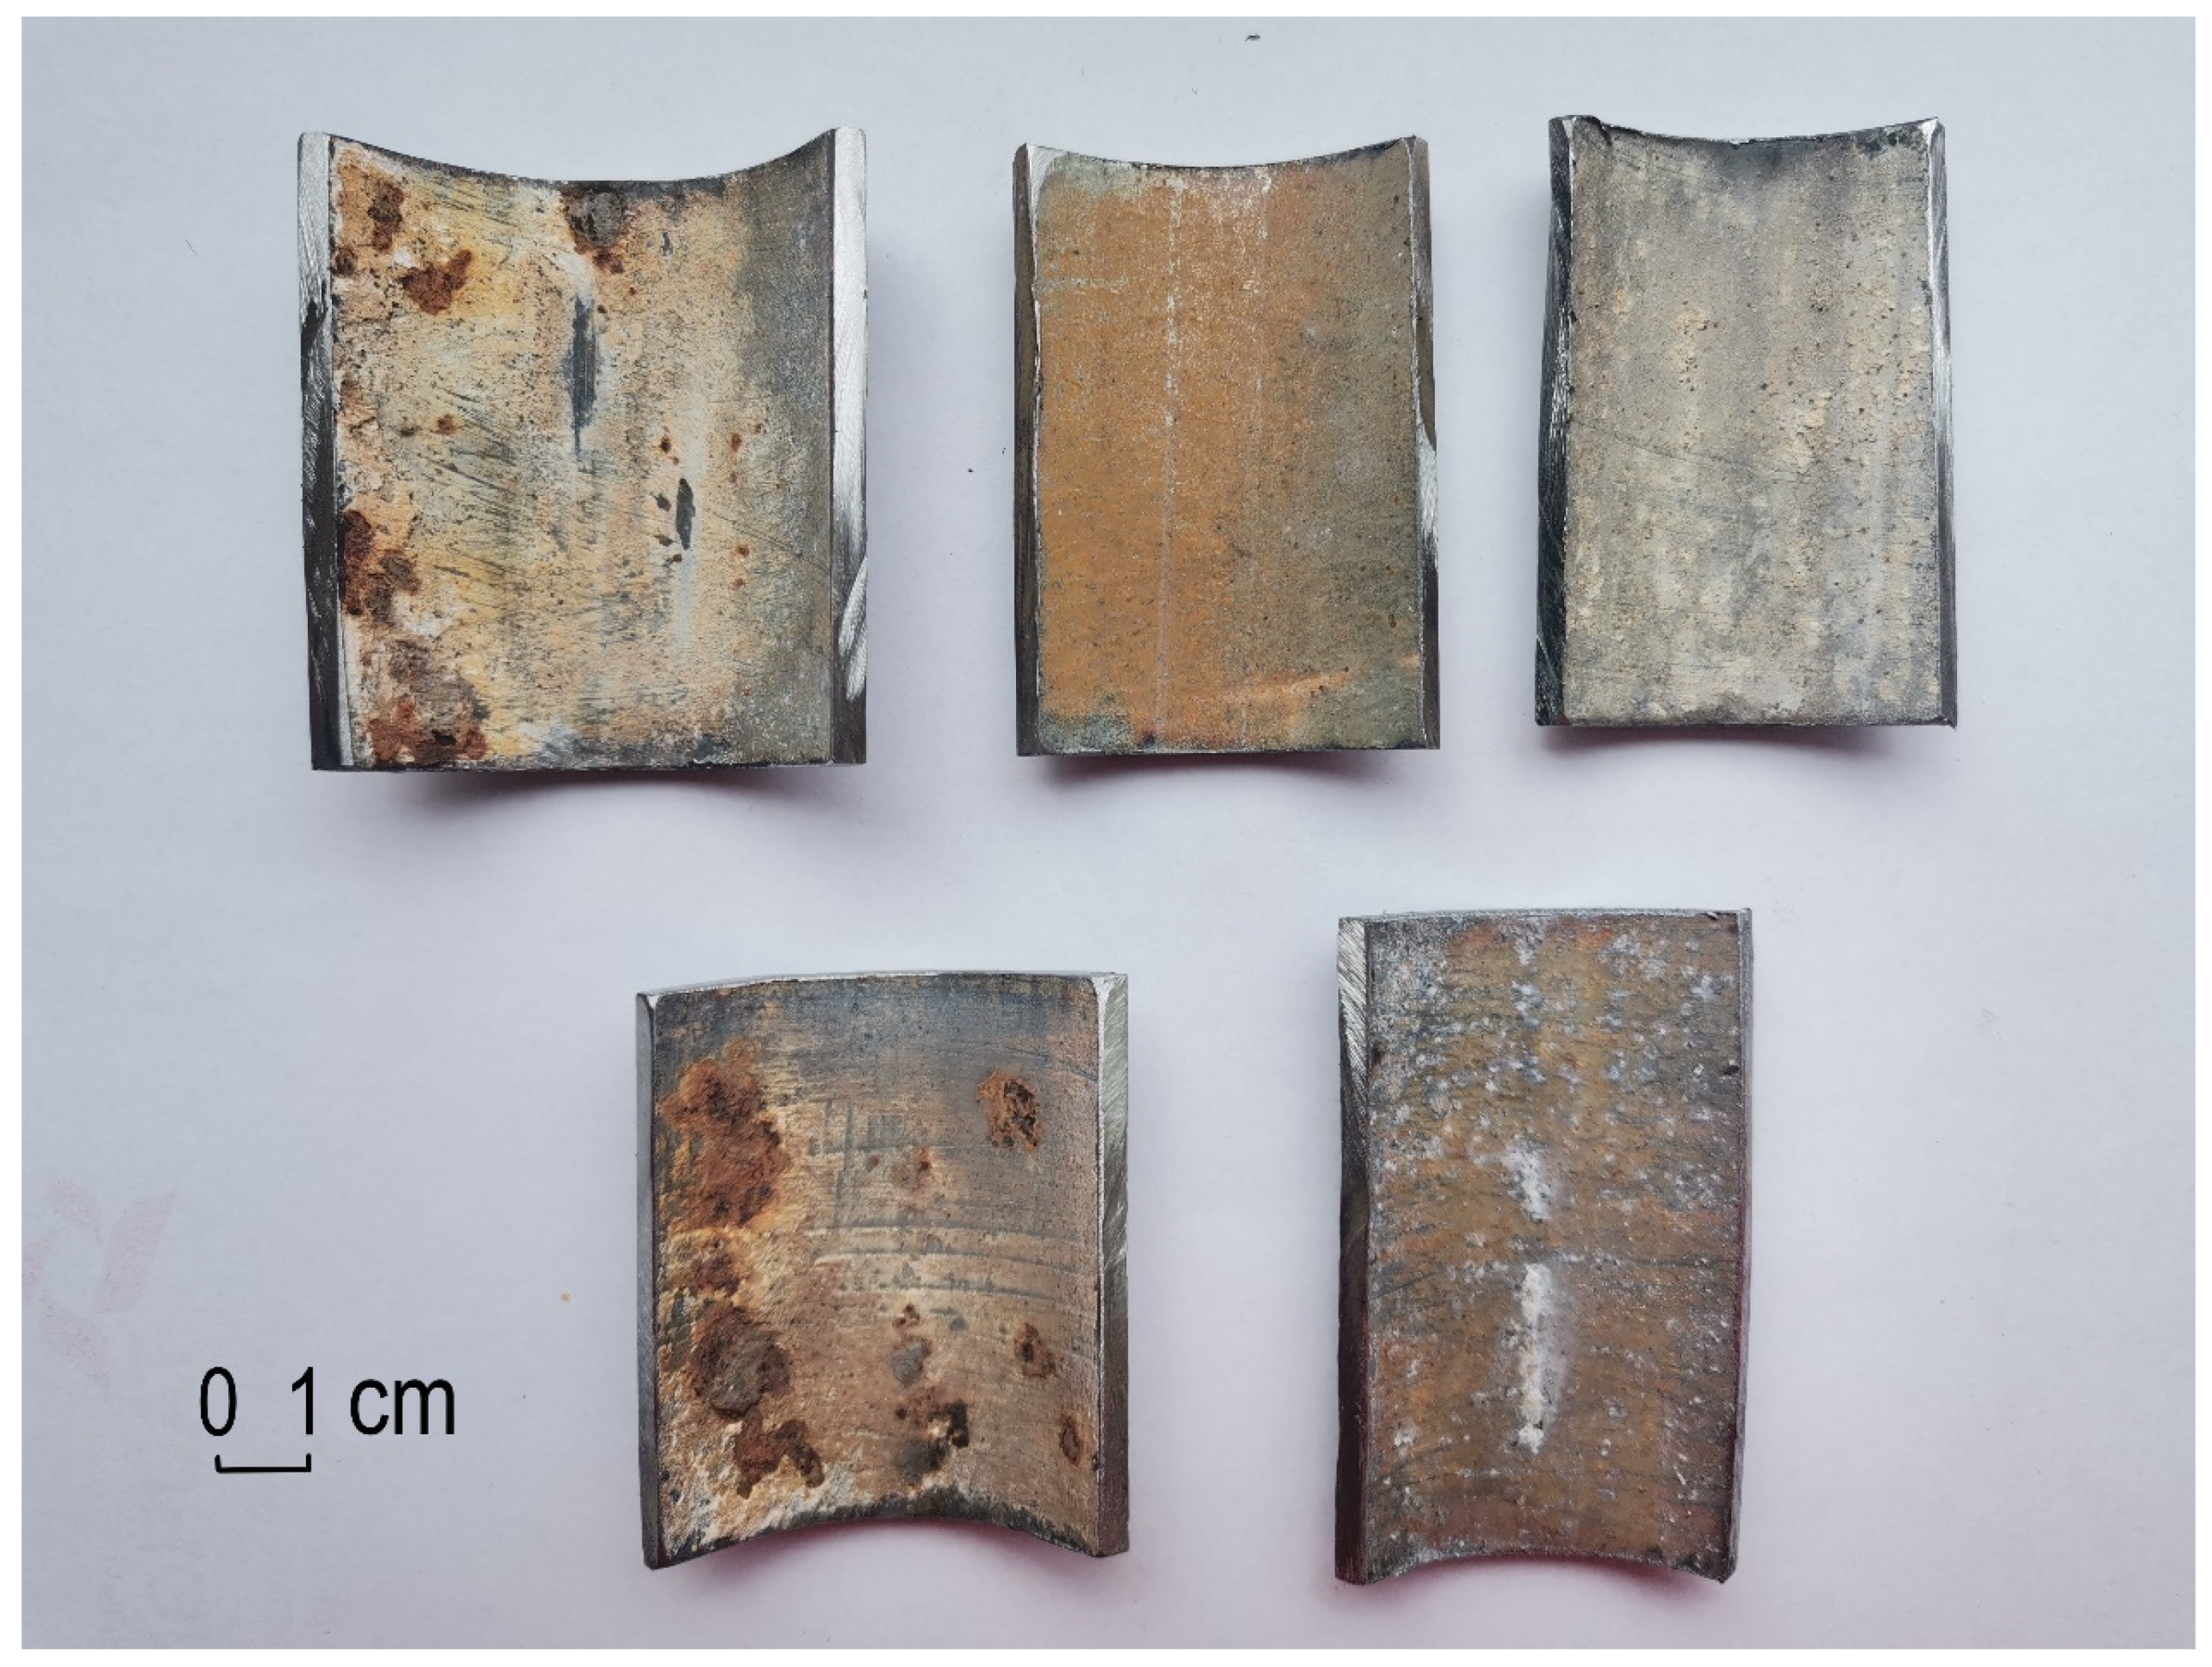
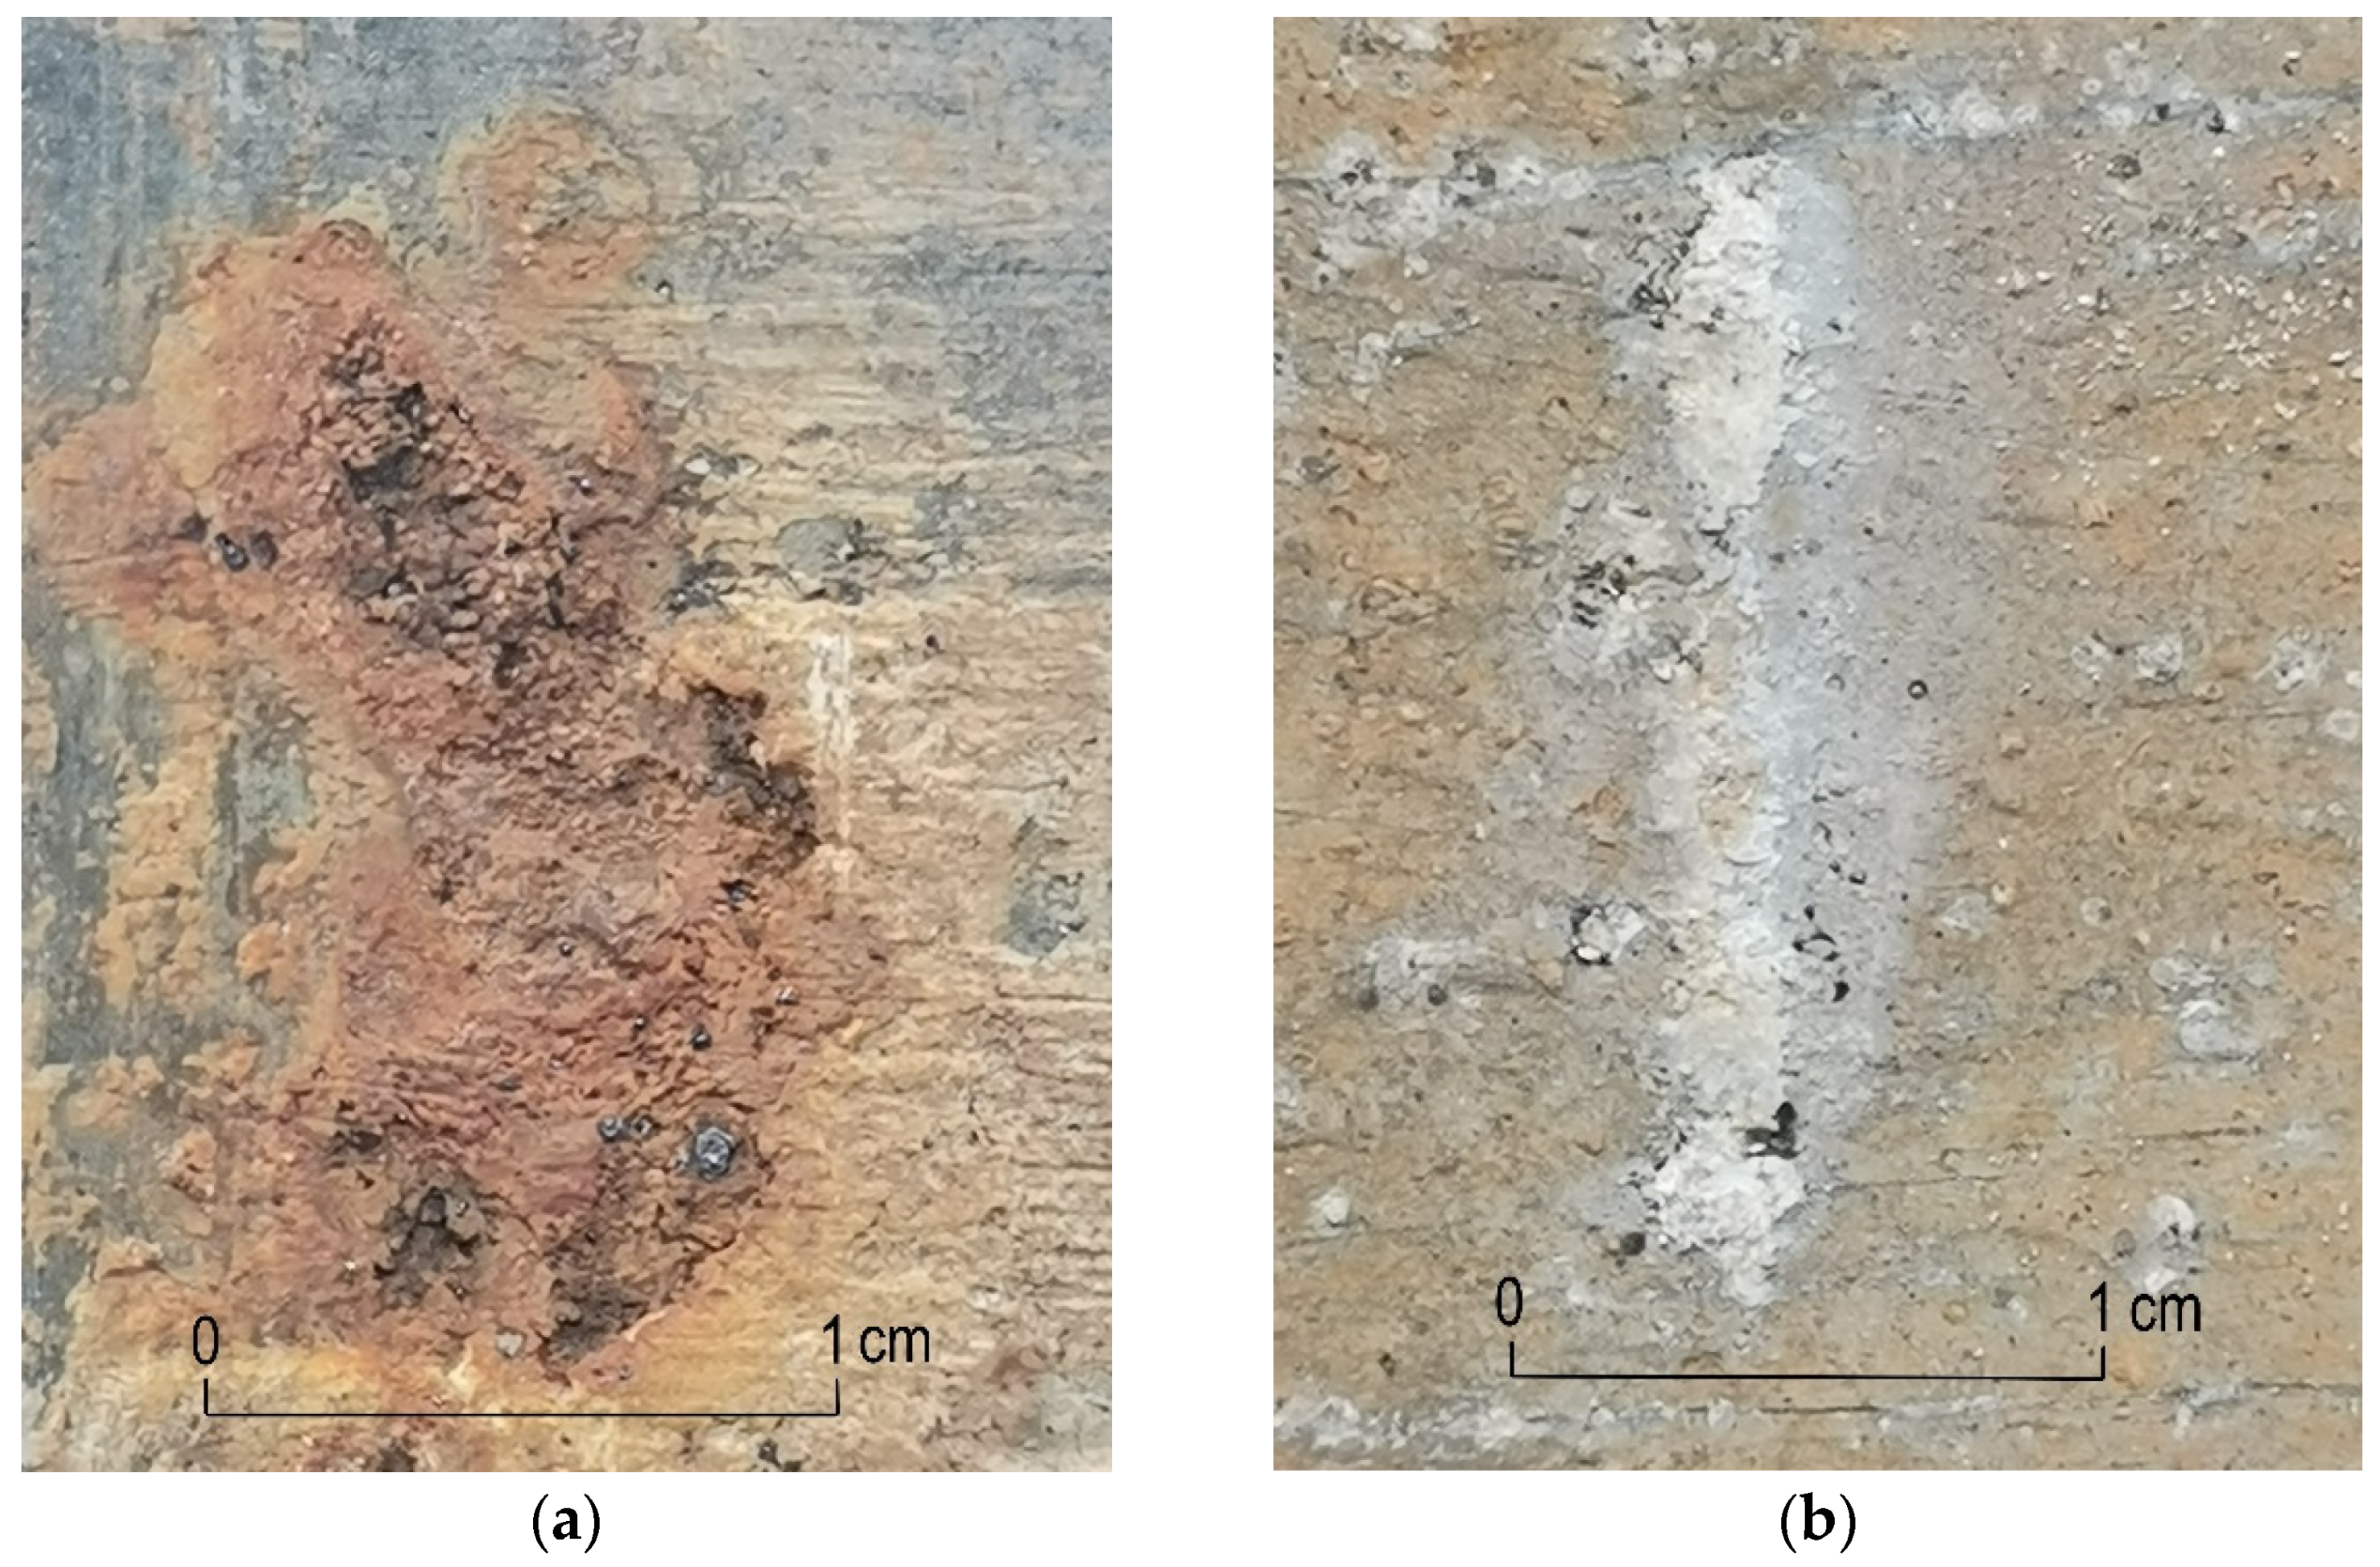
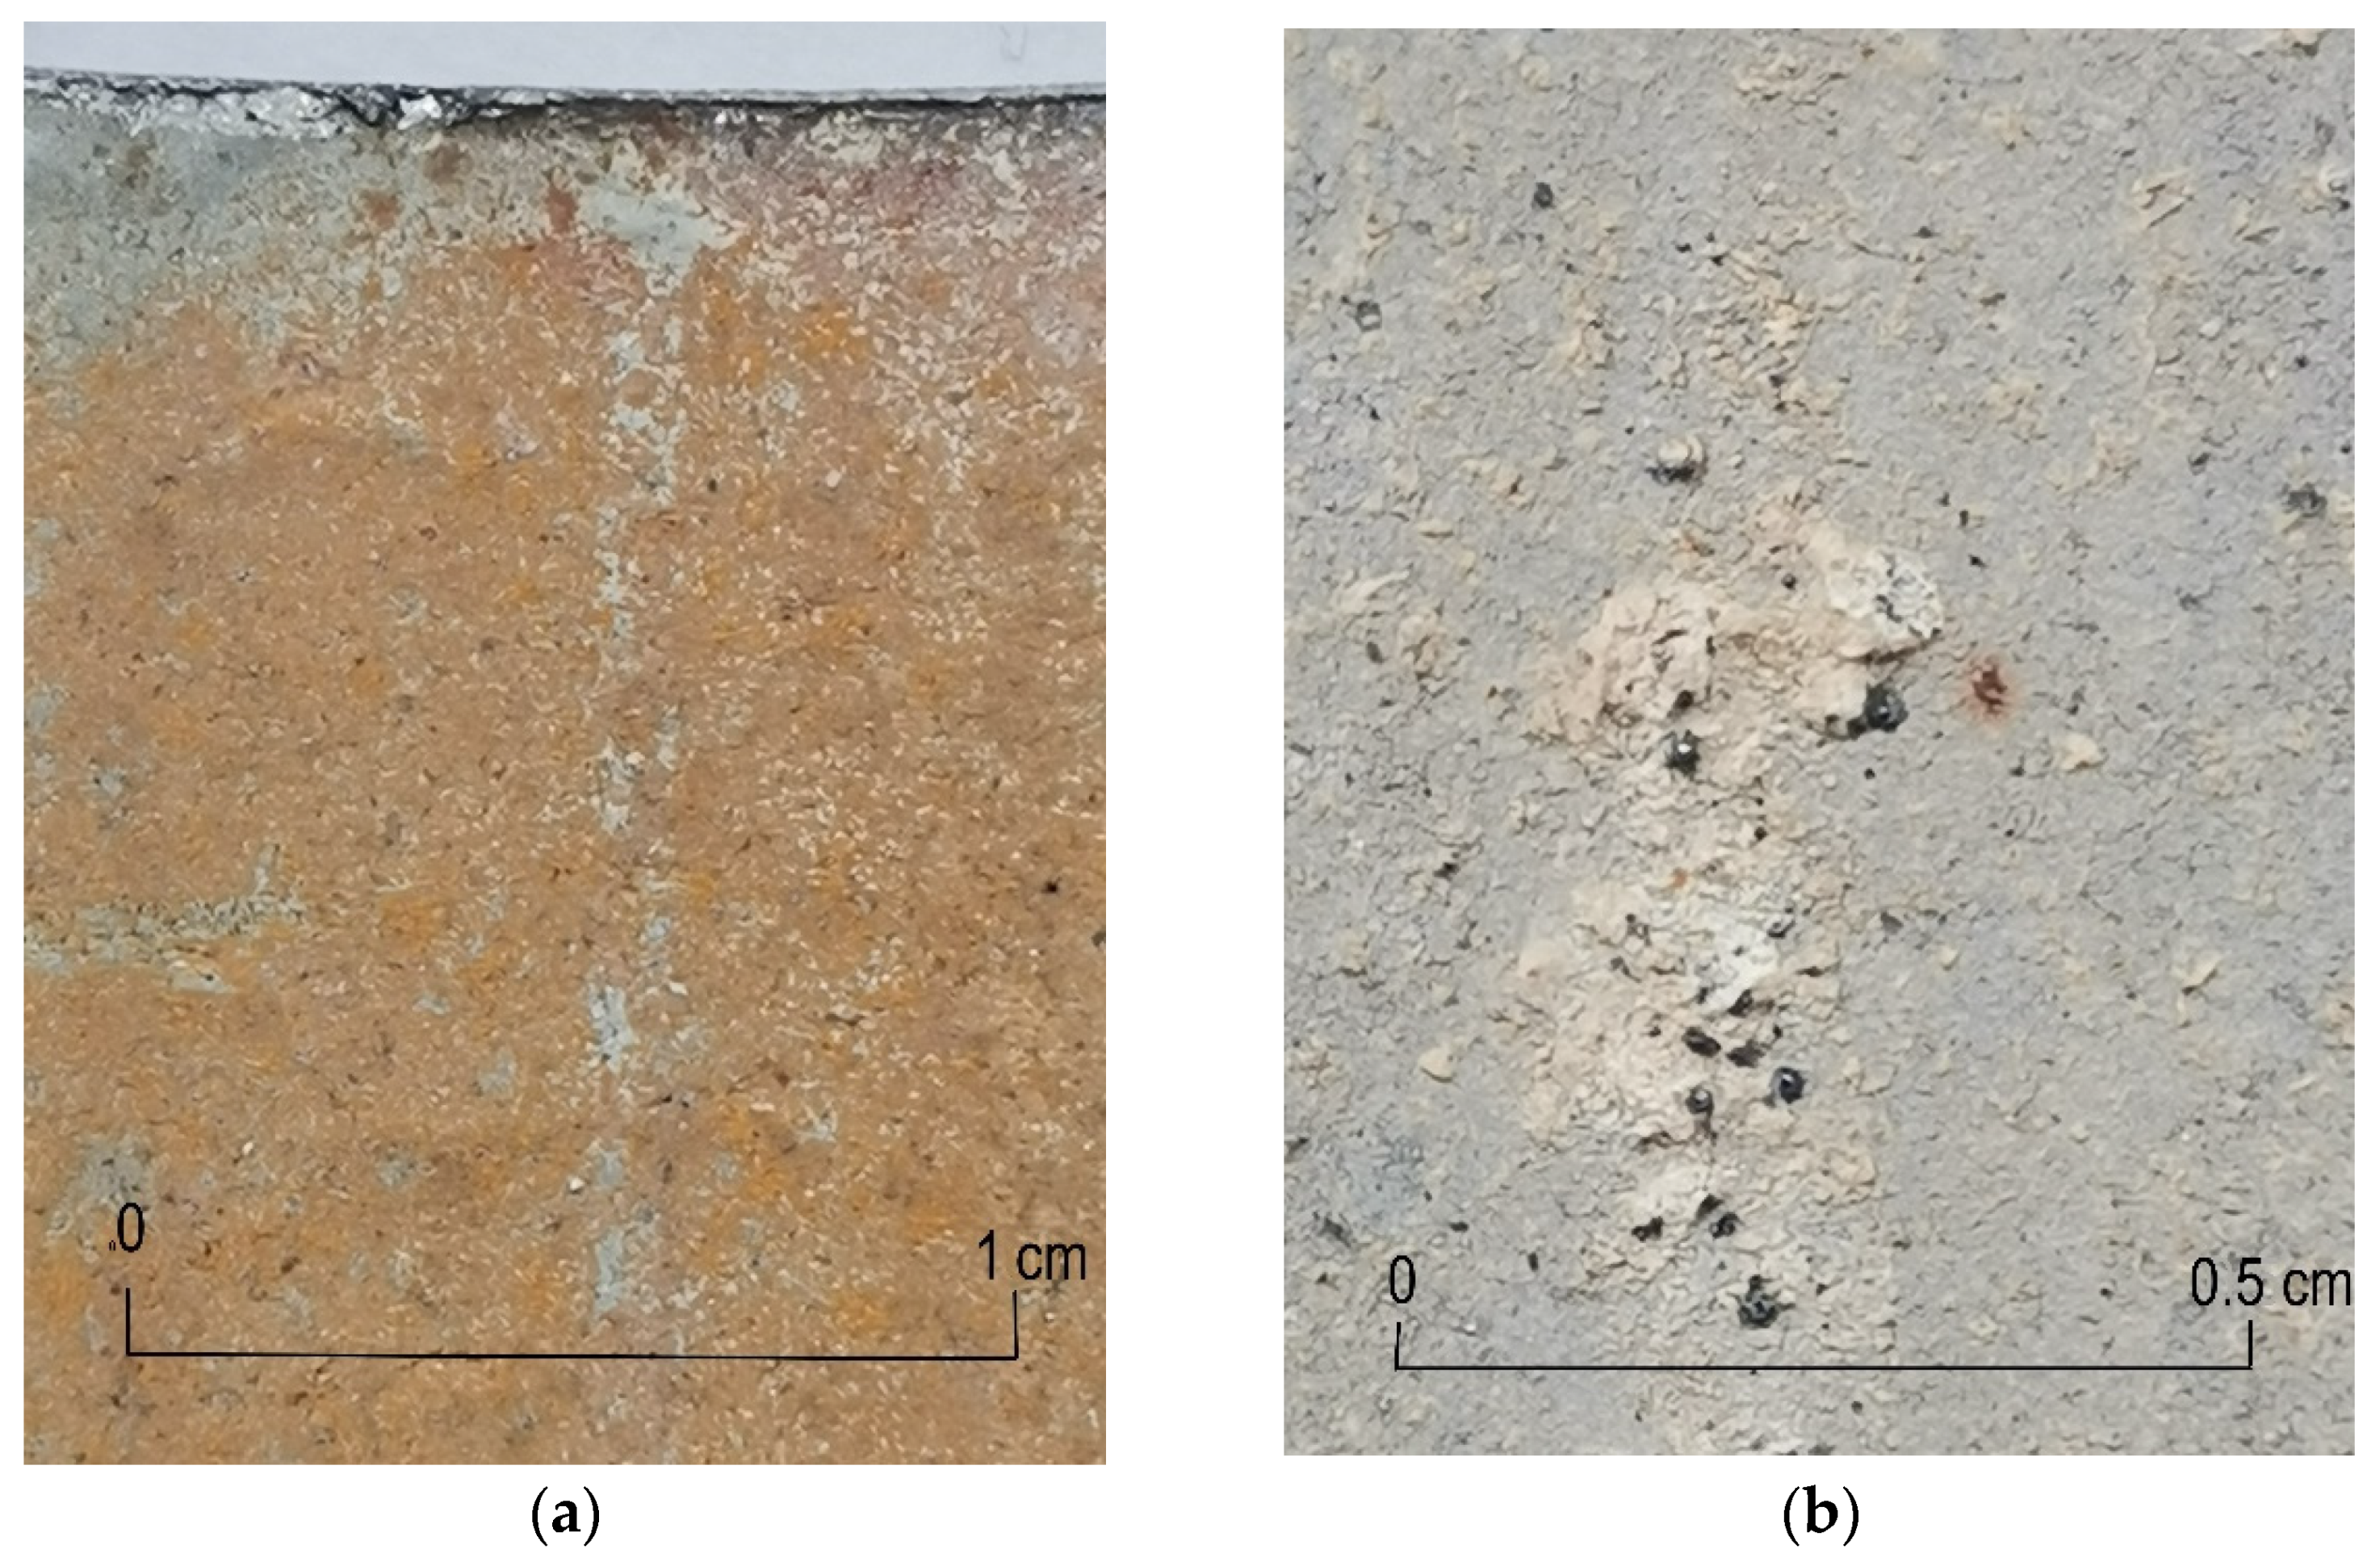
3. Research Results
- -
- Pipe 4: visible white coating of the pipe surface with local small corrosion pits.
- -
- Pipe 5: the entire surface is evenly covered with a rusty tarnish.
- -
- Pipe 8: the entire surface is evenly covered with a white tarnish.
- -
- Pipe 12: the surface is covered with a white tarnish with point pitting.
- -
- Pipe 15: surface covered with a rusty tarnish, locally visible white corrosion centers in the form of spots and streaks.
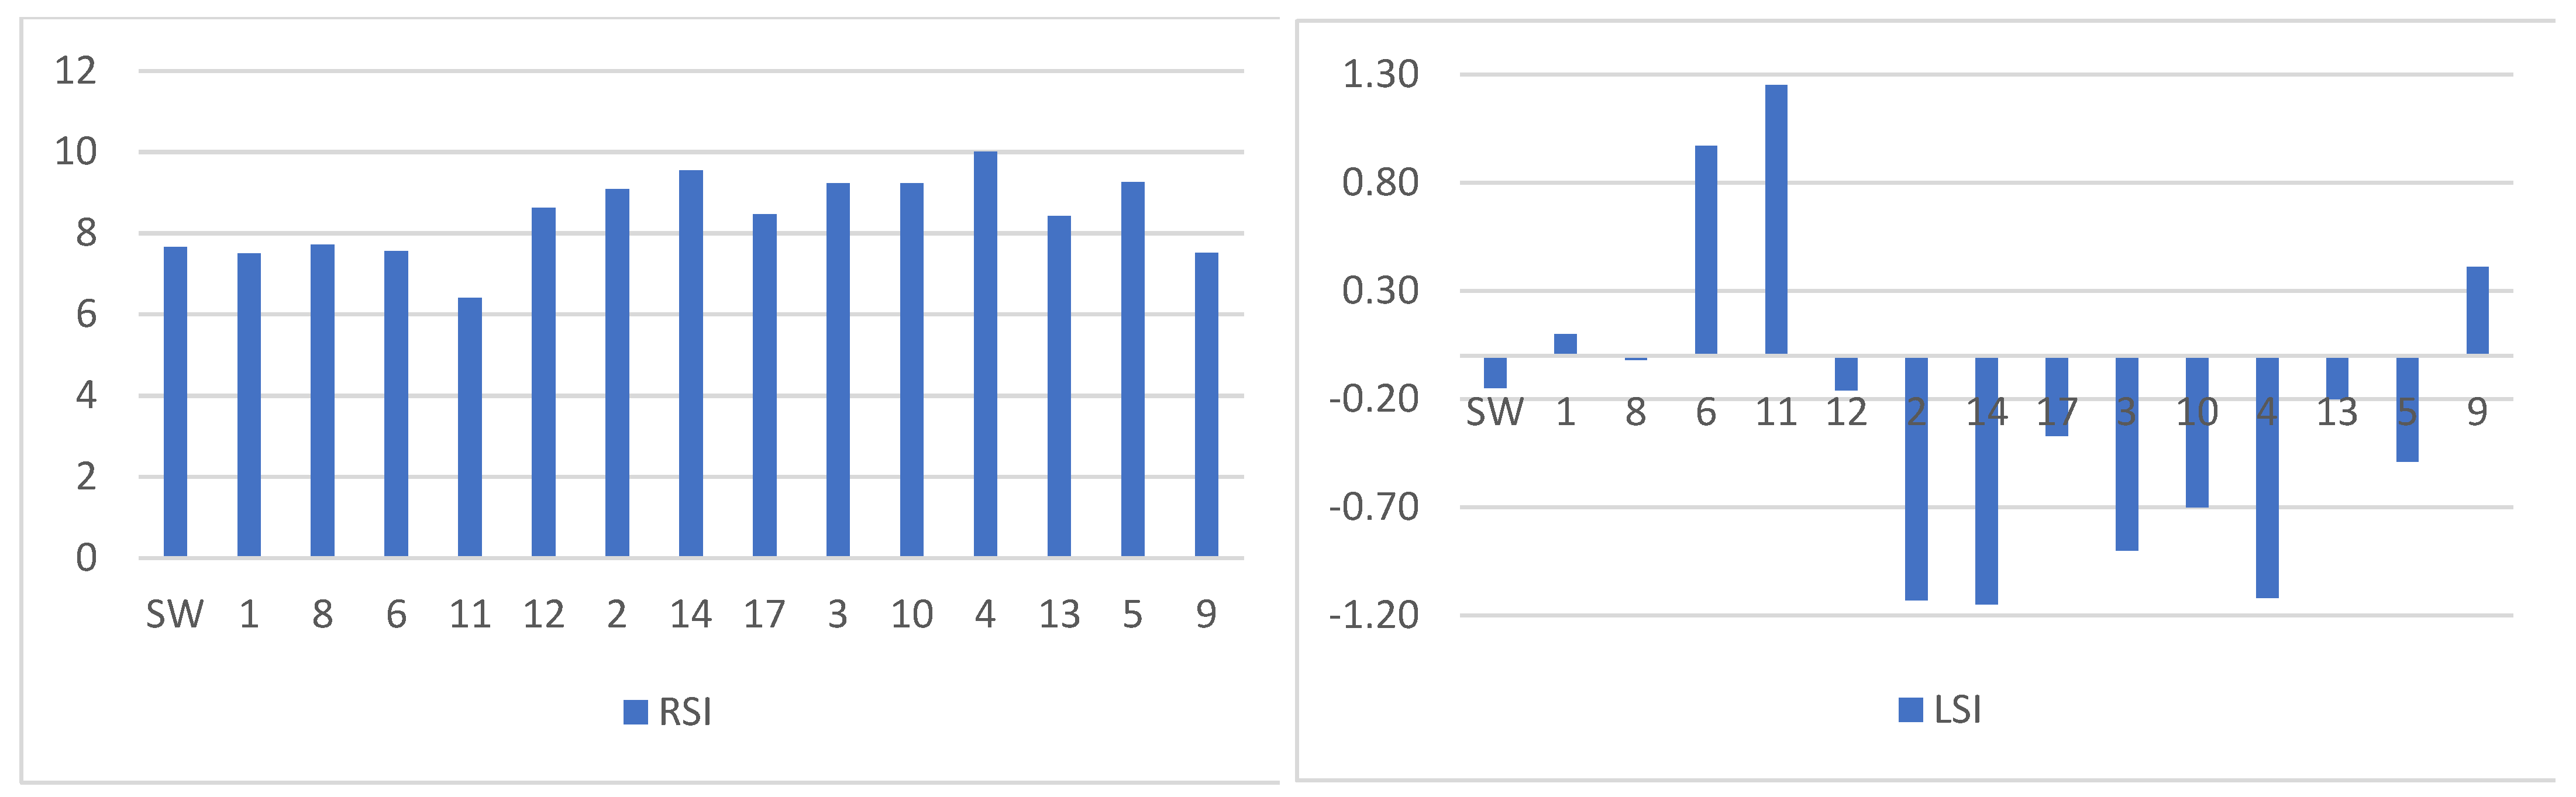
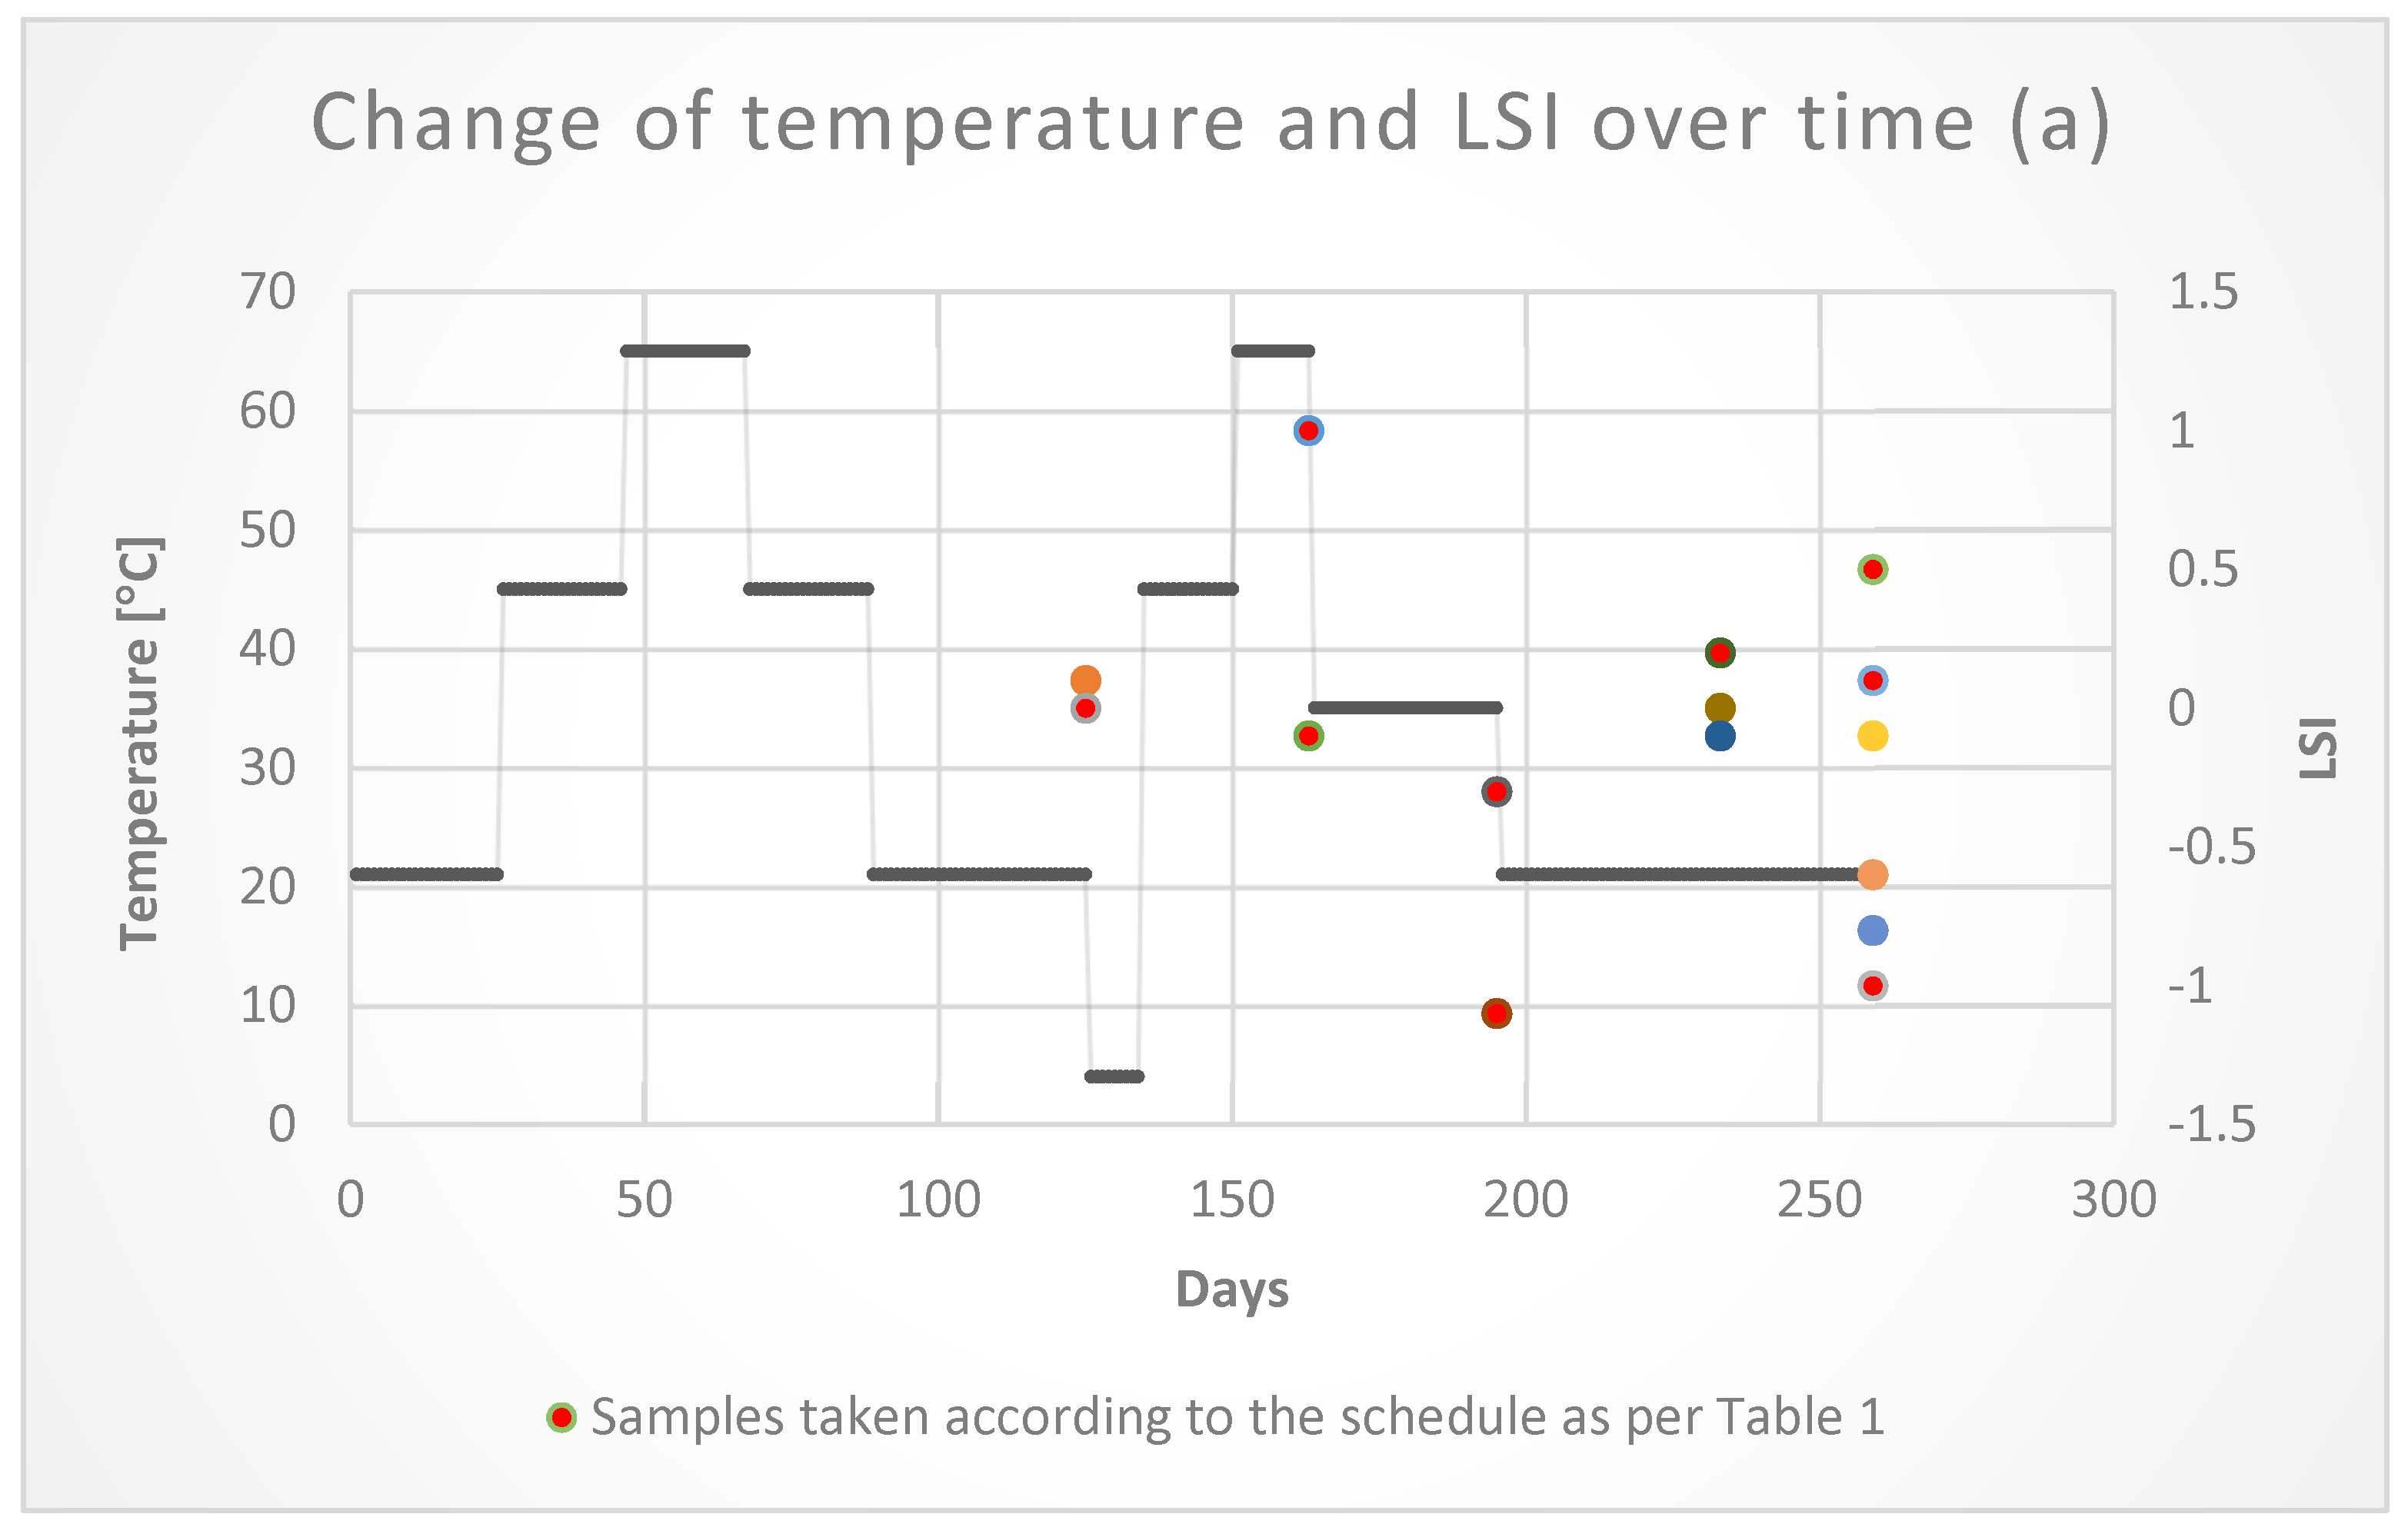
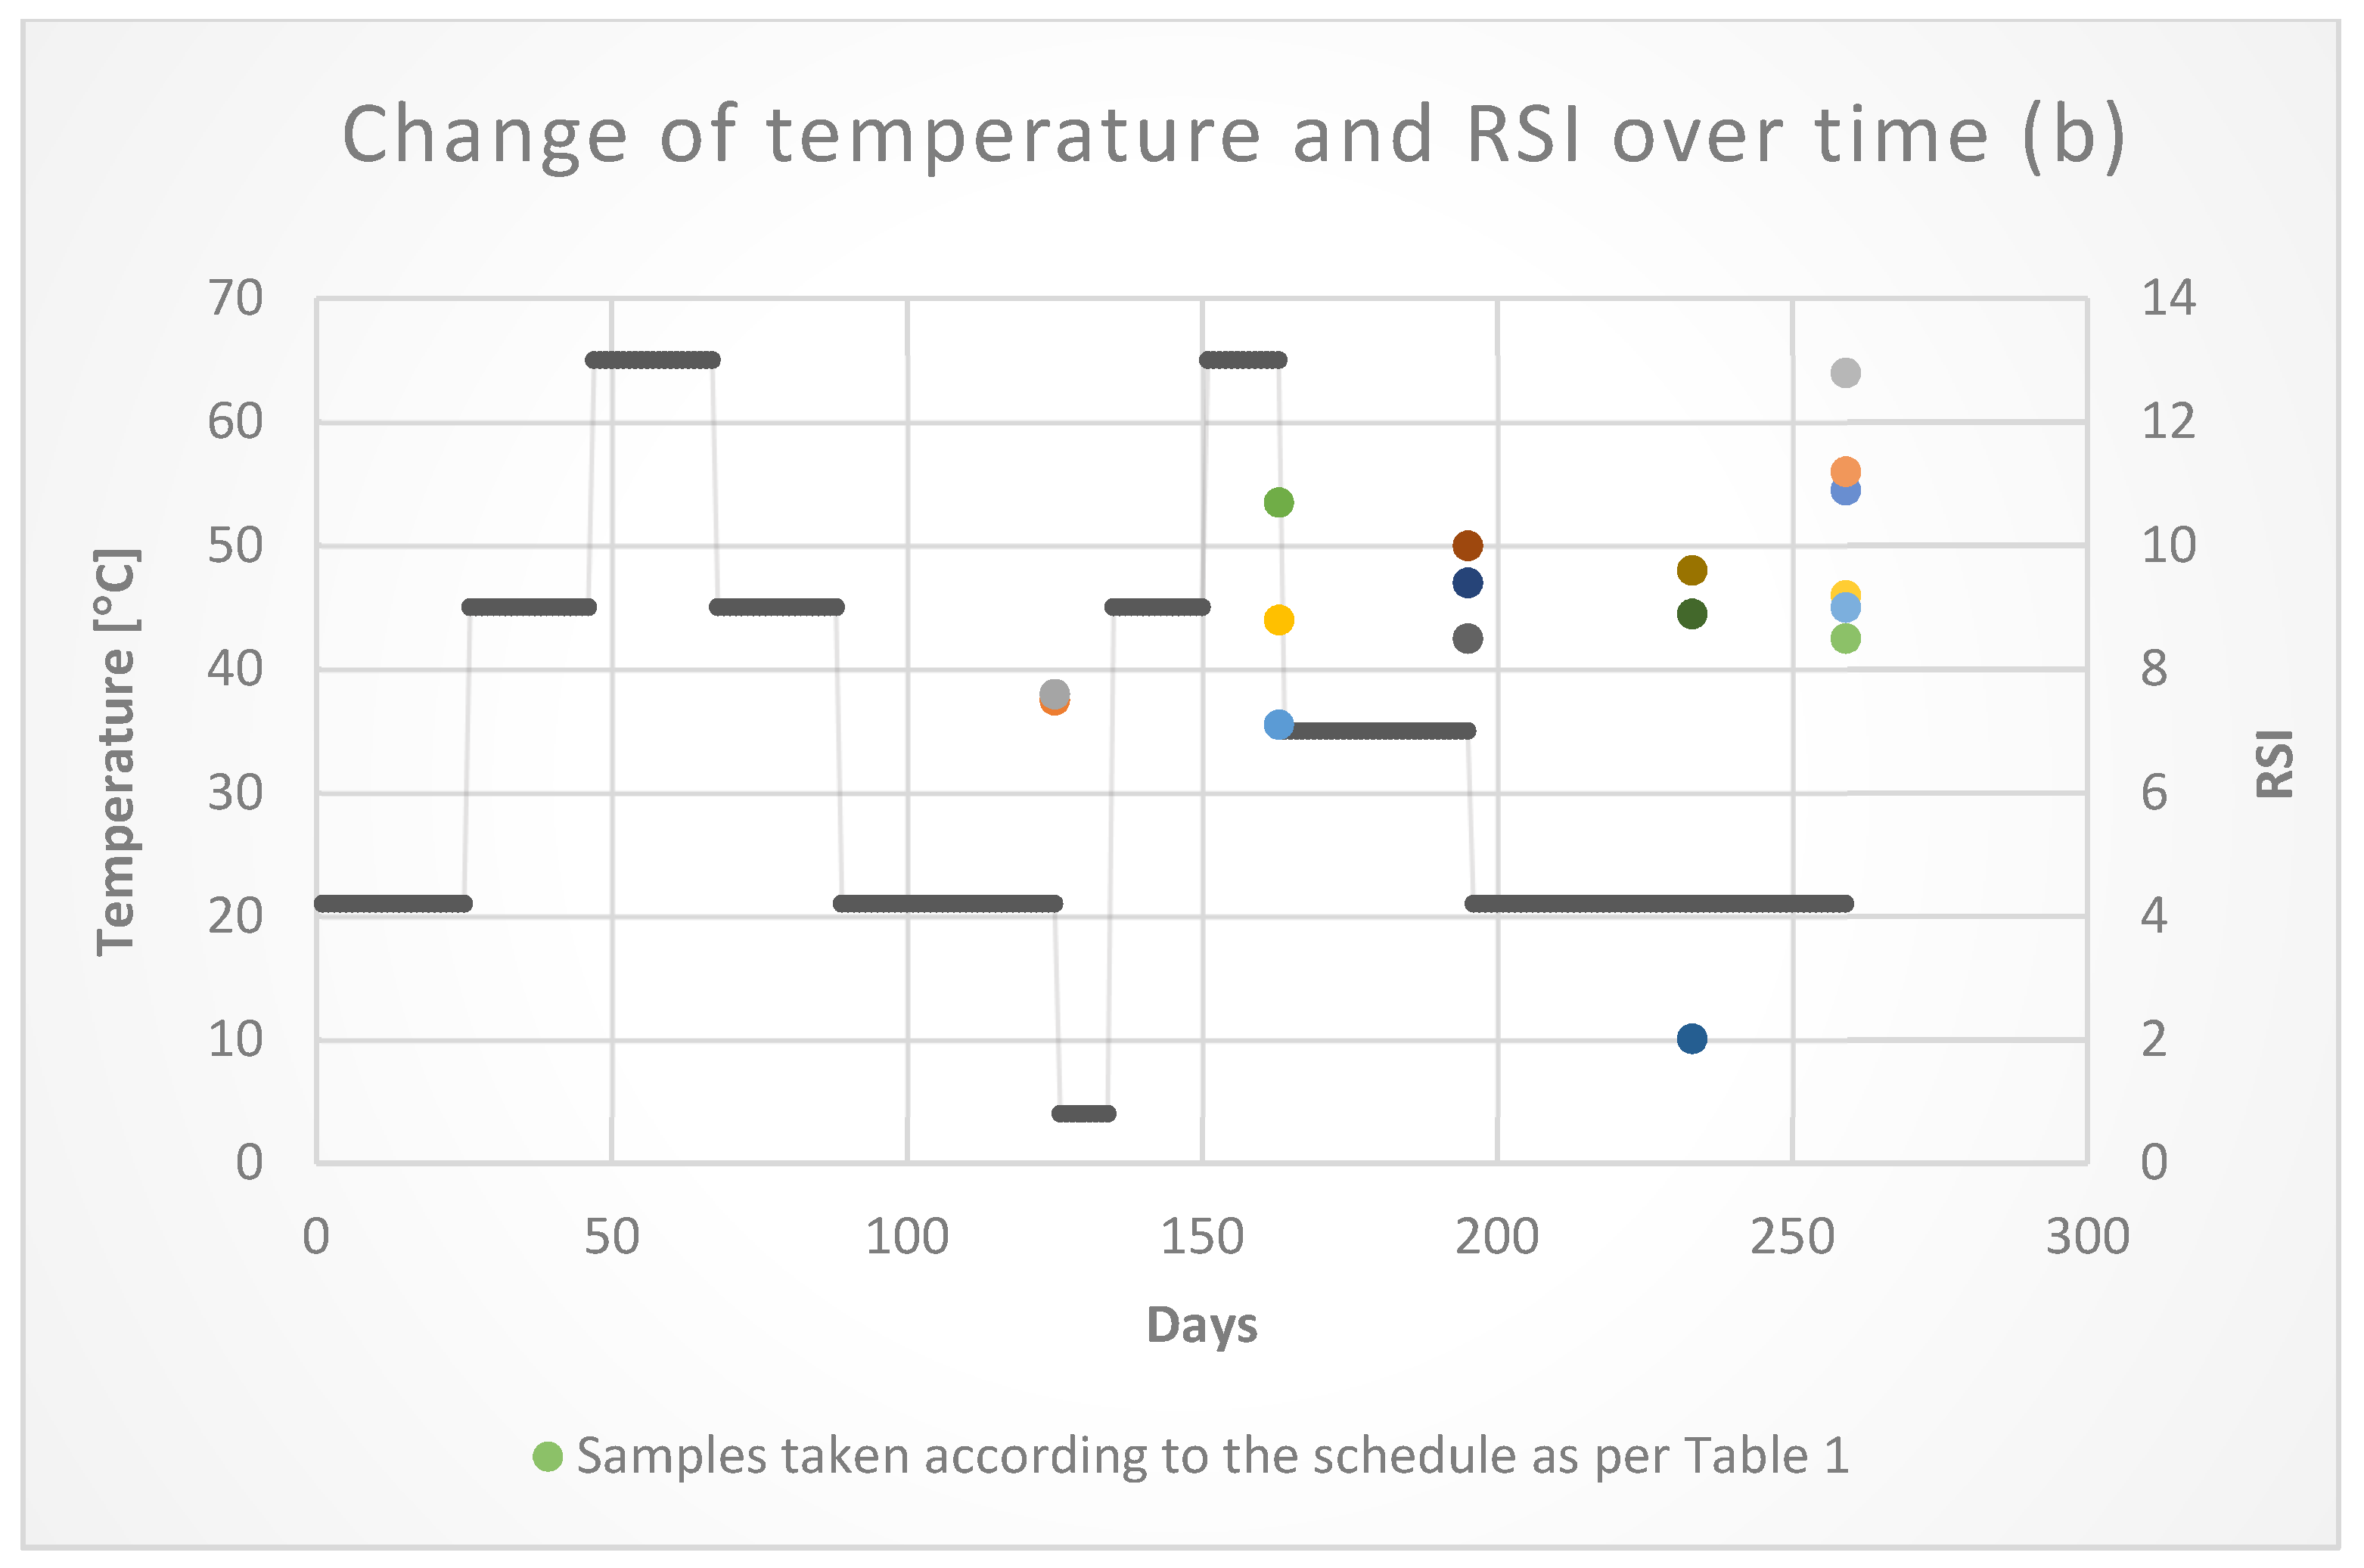
It indicates the required amount of CO2 providing the balance between dissolved bicarbonate and undissolved calcium carbonate. The content of aggressive and bound carbon dioxide expressed in the equation is taken into account:
AI = [CO2]2 [CO2zw] + [CO2agr]
4. Conclusions
Author Contributions
Funding
Institutional Review Board Statement
Informed Consent Statement
Data Availability Statement
Conflicts of Interest
References
- Chatterjee, B. Hot Dip Galvanizing. Hot Dip Galvaniz. Today 2006, 3, 33–37. [Google Scholar]
- Wilmot, B.; Thompson, R.; Barnett, W. Corrosion of hot dip galvanized piping used for re-circulating mine water. Hot Dip Galvaniz. 2006, 3, 33–37. [Google Scholar]
- Bae, C.-H.; Park, N.-S.; Park, S.-Y.; Lee, H.-D.; Hong, S.-H. Assessment of galvanized steel pipes for water service inbuildings by direct diagnosis method. J. Water Supply Res. Technol. 2007, 56, 335–342. [Google Scholar] [CrossRef]
- Andrianov, A. Pitting corrosion of galvanized pipes in hot water supply systems. In Proceedings of the XXIV International Scientific Conference “Construction the Formation of Living Environment”, Moscow, Russia, 22–24 April 2021. [Google Scholar]
- Malesińska, A.; Rogulski, M.; Puntorieri, P.; Barbaro, G.; Kowalska, B. Displacements of the pipe system caused by a transient phenomenon using the dynamic forces measured in the laboratory. Meas. Control 2018, 51, 443–452. [Google Scholar] [CrossRef] [Green Version]
- Brzezinska, D.; Bryant, P.; Markowski, A.S. An Alternative Evaluation and Indicating Methodology for Sustainable Fire Safety in the Process Industry. Sustainability 2019, 11, 4693. [Google Scholar] [CrossRef] [Green Version]
- Stagrum, A.E.; Andenæs, E.; Kvande, T.; Lohne, J. Climate Change Adaptation Measures for Buildings—A Scoping Review. Sustainability 2020, 12, 1721. [Google Scholar] [CrossRef] [Green Version]
- Gałaj, J.; Drzymała, T.; Pełech, A.; Šukys, R. Analysis of the impact of water flow rate of selected Turbo type nozzle on the distribution of sprinkling intensity. In Proceedings of the 13th International Conference Modern Building Materials, Structures and Techniques, Vilnius, Lithuania, 16–17 May 2019. [Google Scholar]
- Malesińska, A.; Kubrak, M.; Rogulski, M.; Puntorieri, P.; Fiamma, V.; Barbaro, G. Water Hammer Simulation in a Steel Pipeline System with a Sudden Cross Section Change Journal of Fluids Engineering. Trans. ASME 2021, 143, 4050728. [Google Scholar]
- Huang, Y.-H.; Shen, T.S. An Article on Green Firefighting Equipment in Taiwan. Sustainability 2021, 13, 12421. [Google Scholar] [CrossRef]
- Wang, L.; Liu, X.; Fang, L.; Wu, Z.; Chen, H. Corrosion analysis of a steel drinking water pipe in an indoor environment. Mater. Perform. 2012, 51, 62–65. [Google Scholar]
- American Galvanizers Association. Hot-Dip Galvanizing for Corrosion Protection of Steel Products; American Galvanizers Association: Englewood, CO, USA, 2000. [Google Scholar]
- Hill, C.P.; Cantor, A.F. Internal Corrosion Control in Water Distribution Systems; Manual of Water Supply Practices—M58; American Water Works Association: Denver, CO, USA, 2011. [Google Scholar]
- EN 12502-3:2005; Protection of Metallic Materials Against Corrosion—Guidance on the Assessment of Corrosion Likelihood in Water Distribution and Storage Systems—Part 3: Influencing Factors for Hot Dip Galvanised Ferrous Materials. European Committee for Standardization: Brussels, Belgium, 2005.
- World Health Organization (WHO). Guidelines for Drinking-Water Quality; WHO: Genewa, Switzerland, 2011.
- Vasconcelos, H.C.; Fernández-Pérez, B.M.; González, S.; Souto, R.M.; Santana, J.J. Characterization of the Corrosive Action of Mineral Waters from Thermal Sources: A Case Study at Azores Archipelago, Portugal. Water 2015, 7, 3515–3530. [Google Scholar] [CrossRef]
- Withers, A. Options for recarbonation, remineralisation and disinfection for desalination plants. Desalination 2005, 179, 11–24. [Google Scholar] [CrossRef]
- Delion, N.; Mauguin, G.; Corsin, P. Importance and impact of post treatment on design and operation of SWRO plants. Desalination 2004, 165, 323–334. [Google Scholar] [CrossRef]
- Zehra, S.; Mobin, M.; Aslam, J. Environmentally Sustainable Corrosion Inhibitors. In Fundamentals and Industrial Applications; Elsevier: Amsterdam, The Netherlands, 2022; pp. 3–23. [Google Scholar]


| Specimen No | Initial Values 9 January 2020 | 10 January 2022 | |||||||||||||
|---|---|---|---|---|---|---|---|---|---|---|---|---|---|---|---|
| Empty Tube Mass S | Cups | Tube with Water Mass | L | D | V | G | Empty Tube Mass S | G | |||||||
| g | g | g | mm | mm | mm3 | mm | g | mm | |||||||
| 1 | 2171.5 | 2171.4 | 31.6 | 31.7 | 3173.4 | 3173 | 447 | 447.0 | 53.2 | 52.9 | 4 × 10⁶ | 3.5 | 2171.6 | 2171.4 | 3.5 |
| 2171.3 | 31.7 | 3173.1 | 447 | 53 | 3.6 | 2171.3 | 3.6 | ||||||||
| 2171.3 | 31.7 | 3173.1 | 446.9 | 52.5 | 3.5 | 2171.3 | 3.6 | ||||||||
| 2 | 2219.2 | 2219.1 | 32 | 32.0 | 3219.2 | 3219 | 445.5 | 445.7 | 53.2 | 53.1 | 4 × 10⁶ | 3.5 | 2219.2 | 2219.0 | 3.5 |
| 2219.1 | 32 | 3218.9 | 445 | 52.9 | 3.6 | 2219.0 | 3.6 | ||||||||
| 2218.9 | 32 | 3218.9 | 446.5 | 53.3 | 3.6 | 2219.1 | 3.6 | ||||||||
| 3 | 2175.5 | 2175.4 | 31.2 | 31.3 | 3174.9 | 3174.9 | 446.5 | 445.8 | 52.9 | 52.6 | 4 × 10⁶ | 3.6 | 2175.7 | 2175.5 | 3.5 |
| 2175.3 | 31.3 | 3175.1 | 445.5 | 52.8 | 3.6 | 2175.5 | 3.6 | ||||||||
| 2175.3 | 31.3 | 3174.6 | 445.5 | 52 | 3.6 | 2175.5 | 3.5 | ||||||||
| 4 | 2184.8 | 2184.7 | 31.8 | 31.8 | 3175.9 | 3175.8 | 445.5 | 445.5 | 52.7 | 52.6 | 4 × 10⁶ | 3.5 | 2185.4 | 2185.1 | 3.6 |
| 2184.6 | 31.8 | 3175.8 | 445.5 | 52.7 | 3.5 | 2185.2 | 3.6 | ||||||||
| 2184.7 | 31.7 | 3175.7 | 445.5 | 52.5 | 3.6 | 2185.2 | 3.5 | ||||||||
| 5 | 2108.4 | 2108.4 | 31.5 | 31.6 | 3117.7 | 3117.7 | 445 | 444.8 | 52.9 | 52.8 | 4 × 10⁶ | 3.3 | 2108.7 | 2108.6 | 3.5 |
| 2108.4 | 31.7 | 3117.7 | 445 | 53.4 | 3.3 | 2108.6 | 3.5 | ||||||||
| 2108.4 | 31.6 | 3117.6 | 444.5 | 52.2 | 3.2 | 2108.5 | 3.4 | ||||||||
| 6 | 2167.6 | 2167.4 | 31.9 | 32.0 | 3155.9 | 3155.7 | 445.5 | 445.5 | 52.7 | 52.4 | 4 × 10⁶ | 3.5 | 2167.9 | 2167.6 | 3.6 |
| 2167.4 | 32 | 3155.7 | 445.5 | 52.4 | 3.5 | 2167.7 | 3.6 | ||||||||
| 2167.3 | 32.1 | 3155.6 | 445.5 | 52 | 3.5 | 2167.7 | 3.5 | ||||||||
| 7 | 2214.5 | 2214.3 | 31.9 | 31.9 | 3213.8 | 3213.6 | 445.5 | 445.2 | 52.8 | 53.1 | 4 × 10⁶ | 3.5 | 2214.6 | 2214.4 | 3.5 |
| 2214.2 | 31.9 | 3213.5 | 445 | 53 | 3.5 | 2214.3 | 3.6 | ||||||||
| 2214.2 | 31.9 | 3213.5 | 445 | 53.4 | 3.6 | 2214.3 | 3.5 | ||||||||
| 8 | 2173.9 | 2173.8 | 31.8 | 31.8 | 3170.5 | 3170.4 | 445.5 | 445.5 | 52.5 | 52.8 | 4 × 10⁶ | 3.6 | 2174.0 | 2173.9 | 3.7 |
| 2173.7 | 31.8 | 3170.4 | 445.5 | 52.9 | 3.6 | 2173.8 | 3.6 | ||||||||
| 2173.8 | 31.9 | 3170.2 | 445.5 | 53 | 3.4 | 2173.8 | 3.5 | ||||||||
| 9 | 2124.5 | 2124.4 | 31.3 | 31.4 | 3137 | 3137.0 | 446.5 | 446.5 | 53.3 | 53.4 | 4 × 10⁶ | 3.4 | 2124.7 | 2124.6 | 3.4 |
| 2124.3 | 31.4 | 3137 | 446.5 | 53.5 | 3.4 | 2124.6 | 3.4 | ||||||||
| 2124.4 | 31.4 | 3137.1 | 446.5 | 53.3 | 3.5 | 2124.6 | 3.4 | ||||||||
| 10 | 2139.9 | 2139.8 | 31.7 | 31.7 | 3161.8 | 3161.8 | 450 | 450.0 | 53 | 52.9 | 4 × 10⁶ | 3.4 | 2140.1 | 2139.9 | 3.4 |
| 2139.8 | 31.6 | 3161.9 | 450 | 52.8 | 3.5 | 2139.9 | 3.5 | ||||||||
| 2139.7 | 31.7 | 3161.8 | 450 | 52.8 | 3.4 | 2139.8 | 3.4 | ||||||||
| 11 | 2146.9 | 2146.8 | 31.5 | 31.6 | 3162 | 3162.0 | 450 | 450.0 | 53 | 52.9 | 4 × 10⁶ | 3.4 | 2147.2 | 2147.0 | 3.4 |
| 2146.8 | 31.6 | 3162 | 450 | 53.2 | 3.4 | 2147.0 | 3.4 | ||||||||
| 2146.8 | 31.6 | 3162 | 450 | 52.6 | 3.4 | 2146.9 | 3.4 | ||||||||
| 12 | 2200.9 | 2200.9 | 31.4 | 31.5 | 3213.4 | 3213.4 | 445.5 | 445.5 | 52.7 | 52.9 | 4 × 10⁶ | 3.6 | 2201.3 | 2201.1 | 3.4 |
| 2200.9 | 31.6 | 3213.4 | 445.5 | 53.4 | 3.5 | 2201.1 | 3.4 | ||||||||
| 2200.9 | 31.6 | 3213.4 | 445.5 | 52.7 | 3.5 | 2201.1 | 3.4 | ||||||||
| 13 | 2174.3 | 2174.2 | 31.5 | 31.5 | 3183.5 | 3183.5 | 445 | 445.5 | 52.9 | 52.9 | 4 × 10⁶ | 3.5 | 2174.6 | 2174.4 | 3.4 |
| 2174.2 | 31.5 | 3183.5 | 446 | 52.9 | 3.6 | 2174.4 | 3.6 | ||||||||
| 2174.2 | 31.5 | 3183.5 | 445.5 | 53 | 3.6 | 2174.3 | 3.6 | ||||||||
| 14 | 2238.3 | 2238.2 | 31.3 | 31.3 | 3248.4 | 3248.4 | 450 | 448.5 | 53 | 52.9 | 4 × 10⁶ | 3.6 | 2238.4 | 2238.2 | 3.6 |
| 2238.2 | 31.3 | 3248.4 | 445.5 | 53 | 3.6 | 2238.1 | 3.6 | ||||||||
| 2238.2 | 31.3 | 3248.4 | 450 | 52.8 | 3.6 | 2238.2 | 3.6 | ||||||||
| 15 | 2110.7 | 2110.7 | 31.5 | 31.5 | 3119.5 | 3119.5 | 445 | 445.0 | 53 | 53.0 | 4 × 10⁶ | 3.6 | 2111.4 | 2111.1 | 3.5 |
| 2110.7 | 31.4 | 3119.5 | 445 | 53.2 | 3.6 | 2111.2 | 3.6 | ||||||||
| 2110.7 | 31.5 | 3119.5 | 445 | 52.9 | 3.6 | 2111.1 | 3.6 | ||||||||
| 16 | 2233.8 | 2233.8 | 31.4 | 31.4 | 3232.7 | 3232.7 | 446 | 445.7 | 53.3 | 52.9 | 4 × 10⁶ | 3.7 | 2234.0 | 2233.9 | 3.6 |
| 2233.8 | 31.4 | 3232.7 | 445.5 | 52.7 | 3.6 | 2233.9 | 3.6 | ||||||||
| 2233.8 | 31.4 | 3232.7 | 445.5 | 52.8 | 3.7 | 2233.8 | 3.7 | ||||||||
| 17 | 2122.2 | 2122.2 | 31.8 | 31.8 | 3136.8 | 3136.8 | 445 | 445.0 | 53.3 | 53.4 | 4 × 10⁶ | 3.4 | 2122.1 | 2122.1 | 3.4 |
| 2122.2 | 31.7 | 3136.8 | 445 | 53.6 | 3.5 | 2121.9 | 3.5 | ||||||||
| 2122.2 | 31.8 | 3136.8 | 445 | 53.4 | 3.4 | 2121.8 | 3.4 | ||||||||
| Parameter | Units | Examined Water |
|---|---|---|
| pH | - | 7.35 |
| General alkalinity | mval/L | 3.2 |
| Overall hardness | mval/L | 5.0 |
| Calcium hardness | mval/L | 3.7 |
| Carbon dioxide free | mg/L | 8.8 |
| Aggressive carbon dioxide | mg/L | 2.2 |
| Nitrates l | mg/L | 1.9 |
| Sulfur | mg/L | 75 |
| Chlorides | mg/L | 127.8 |
| Phosphates | mg/L | 0.19 |
| Dry residue l | mg/L | 534 |
| Conductivity | μS/cm | 475 |
| Oxidability | mg O2/L | 1.1 |
| Specimen No | Observed Change | Before | After | Increment |
|---|---|---|---|---|
| 5 | Change in wall thickness | 3.3 mm | 3.5 mm | +0.2 mm |
| 3.3 mm | 3.5 mm | +0.2 mm | ||
| 3.2 mm | 3.4 mm | +0.2 mm | ||
| 8 | 3.6 mm | 3.7 mm | +0.1 mm | |
| 3.6 mm | 3.6 mm | +0.0 mm | ||
| 3.4 mm | 3.5 mm | +0.1 mm | ||
| 12 | 3.6 mm | 3.4 mm | −0.2 mm | |
| 3.5 mm | 3.4 mm | −0.1 mm | ||
| 3.5 mm | 3.4 mm | −0.1 mm | ||
| 4 | Change in mass | 2184.7 g | 2185.1 g | +0.4 g |
| 15 | 2110.7 g | 2111.1 g | +0.4 g |
Publisher’s Note: MDPI stays neutral with regard to jurisdictional claims in published maps and institutional affiliations. |
© 2022 by the authors. Licensee MDPI, Basel, Switzerland. This article is an open access article distributed under the terms and conditions of the Creative Commons Attribution (CC BY) license (https://creativecommons.org/licenses/by/4.0/).
Share and Cite
Wojtkowska, M.; Malesińska, A.; Machowska, A.; Puntorieri, P.; Barbaro, G.; Fiamma, V.; Biedugnis, S. The Influence of Water Quality Change on the Corrosion Process in Galvanized Pipes of Fire Protection Installations. Sustainability 2022, 14, 7708. https://doi.org/10.3390/su14137708
Wojtkowska M, Malesińska A, Machowska A, Puntorieri P, Barbaro G, Fiamma V, Biedugnis S. The Influence of Water Quality Change on the Corrosion Process in Galvanized Pipes of Fire Protection Installations. Sustainability. 2022; 14(13):7708. https://doi.org/10.3390/su14137708
Chicago/Turabian StyleWojtkowska, Małgorzata, Agnieszka Malesińska, Agnieszka Machowska, Pierfabrizio Puntorieri, Giuseppe Barbaro, Vincenzo Fiamma, and Stanisław Biedugnis. 2022. "The Influence of Water Quality Change on the Corrosion Process in Galvanized Pipes of Fire Protection Installations" Sustainability 14, no. 13: 7708. https://doi.org/10.3390/su14137708
APA StyleWojtkowska, M., Malesińska, A., Machowska, A., Puntorieri, P., Barbaro, G., Fiamma, V., & Biedugnis, S. (2022). The Influence of Water Quality Change on the Corrosion Process in Galvanized Pipes of Fire Protection Installations. Sustainability, 14(13), 7708. https://doi.org/10.3390/su14137708