Article

Analysis of Coupling Coordination Relationship between the Accessibility and Economic Linkage of a High-Speed Railway Network Case Study in Hunan, China

School of Civil Engineering, Central South University, Changsha 410075, China
*
Author to whom correspondence should be addressed.
Sustainability 2022, 14(13), 7550; https://doi.org/10.3390/su14137550
Submission received: 29 May 2022 / Revised: 16 June 2022 / Accepted: 18 June 2022 / Published: 21 June 2022
(This article belongs to the Special Issue The Role of Transport Infrastructure in Regional Development)

Abstract

:
The construction of a high-speed railway is important to the transportation network and economic development of a region. To further understand the interaction between accessibility and urban economic linkage in the context of high-speed railway networks, this study investigated the spatial and temporal changes in the coupling coordination between accessibility and economic linkage after a high-speed railway was opened in Hunan Province, China, using a coupling coordination model. The aim of this research is to explore the role that high-speed rail construction plays in regional development. Results indicate that (1) after the high-speed railway was opened, the accessibility of cities in Hunan Province has improved significantly, although the overall pattern has not changed by much. This is because it still shows a radiation pattern, with the Changsha–Zhuzhou–Xiangtan urban agglomeration at its core, which has subsequently spread to surrounding areas; (2) the improvement in urban accessibility has strengthened the economic linkages between cities, and the overall spatial pattern has gradually evolved from a point-axis pattern to a network pattern. The bipolar trend of total regional economic linkage has become more pronounced than what it was before; (3) the overall coordination degree of accessibility and economic linkage coupling in Hunan Province is primary coupling, and the phenomenon of regional polarization is prominent, thus showing the overall spatial pattern of ‘strong in the east and weak in the west.’ Further strengthening the construction of the high-speed railway in the northern part of Hunan, promoting the economic construction in the western and southern parts of Hunan, and building a spatial pattern of synergistic integration for Hunan’s continued transportation and economic development are suggested.

1. Introduction

Sustainable transport is integral to our societies [1]. In the context of worsening climate change around the world, traffic congestion and energy consumption are the main issues facing sustainable transportation. Transportation infrastructure construction can play a part in reducing the cost of more sustainable transport options [2]. As an important part of transportation infrastructure, high-speed rail railways have great potential to promote sustainable transportation development [3].
The first high-speed railway route (Tokaido Shinkansen) was opened in Japan in 1964, and since then, high-speed railways have gradually moved further into the limelight. In 2003, the first rapid railway (Shenyang to Qinhuangdao) to be designed and built in China started to operate. The average speed of the train was 200 km/h, which has now become the starting point for high-speed railways. China’s railway network completed its sixth round of speed increases in 2007, and from then on, high-speed trains became a part of daily life for Chinese people [4]. In 2008, China’s first high-speed railway with a maximum speed of 350 km/h (Beijing–Tianjin intercity railway) opened for business, thus completing the transformation of China’s high-speed railway network. Shaw divided the development of high-speed railways in China into four stages, based on the changes made to China’s high-speed railway services [5]. With the development of the economy, the business of high-speed railways in China continues to develop, the number of miles travelled via high-speed railways continues to climb, and China’s high-speed railway network is increasingly perfected. According to the 2019 framework which outlines the features of a country with a strong transportation network, by 2035, China will have basically succeeded in building a country with a strong transportation network, and it will have formed a modern, comprehensive, transportation system. A high-speed railway network is an integral part of a modern transportation system [6]. In order to fully utilize the role of railways in sustainable transportation, scholars optimized railways’ scheduling designs by using heuristic models and metaheuristic models to ensure the transportation efficiency of railways [7,8].
Timewise, high-speed railways have compressed the spatial distance between regions, influenced transportation patterns, reshaped the spatial layout of the economy, enhanced the flow of various items between cities, and they have had a massive impact upon many industries. The introduction of high-speed railways has attracted additional passengers and has had a great impact on the tourism industry in major cities [9,10]. Medical care and medical parity have been boosted by high-speed railways [11]. High-speed railways have helped reduce environmental pollution in the study area [12]. A mature, high-speed railway network not only shortens intercity travel time and improves accessibility, but it also enhances interregional economic exchanges.

1.1. Accessibility

Accessibility, first proposed by Hasen in 1959, refers to the possibility of interaction between each point in a transportation network, and moreover, how easy it is to get from one location to another [13]. Accessibility refers to the opportunity for interaction, and degree of interaction, between nodes in the transportation network in a study area. The construction of transportation infrastructure can make a difference to the spatial pattern of accessibility [14]. Accessibility often determines the mobility of city elements. Many scholars have performed research on the impact of the introduction of high-speed railways on the accessibility of a study area. At the national level, the opening of high-speed railways can have different impacts on the accessibility of different types of cities in China, which leads to a trend of regional differentiation [15,16]. Accessibility is most significantly improved for cities that are situated along the high-speed rail line. Using a gravity model to measure accessibility, scholars concluded that Italy’s high-speed railway has increased accessibility to cities that are situated along the line by 32%, whereas accessibility to other regions has only increased by 6% [17]. The construction of high-speed railways improves overall regional accessibility and it significantly benefits areas that are situated along the route; however, it also increases regional imbalances [18]. In terms of urban agglomerations, high-speed railways can effectively promote the regional integration of urban clusters [19,20,21]. There are many ways to measure accessibility, such as grid accessibility [22], weighted average travel time [23,24], the cumulative opportunity measure [25], and the gravity model [26,27]. Grid accessibility has the advantage of dealing with problems concerning large study sizes and long timespans. The weighted average travel time considers city attributes, such as population and gross domestic product (GDP). The cumulative opportunity measure is often adopted in studies concerning accessibility in a district, which treat opportunities within a certain distance threshold equally. The gravity model can fully reflect the influence of road network traffic characteristics on accessibility.

1.2. Economic Linkage

With the opening of high-speed railways, improved accessibility has no doubt boosted the economic links between cities. Economic linkages refer to goods, labour, capital, technological, and information exchanges between relevant regions [28]. Economic linkages reflect how well the economic centre can radiate and spread to its surrounding areas, in addition to the impact that these surrounding areas have on the economic centre. Economic linkage intensity is an indicator used to measure the magnitude of an economic linkage. Given that economic linkages use the law of distance decay, the gravity model is usually used to calculate economic linkages between regions. The gravitational model is a widely used model of spatial interactions [28,29]. Djankov used the gravity model to conduct an empirical analysis of economic linkages concerning trade in nine Russian regions and fourteen regions in the former Soviet Union [30]. Akter selected GDP per capita, population, and exchange rate to construct a gravity model for analysing the economic potential of tourism in Bangladesh [31]. Hussain applied the gravity model to learn about and judge the health of Asian economies [32]. Scholars have applied different distance variables to the gravitational model, such as using either geographical distance [33] or temporal distance [34]. With the development of road networks and modern transportation, travel is becoming more convenient, geographical distance has fewer limitations, and thus, the time taken to travel a certain distance will be less than before.

1.3. Coupled Coordination Model

Driven by the rapid development of high-speed railways, urban accessibility is improving, and economic links between cities are becoming more sophisticated than before. Accessibility and economic linkage promote each other and grow together [35]. Coupling is a concept in physics that is often used to indicate the extent to which two or more systems affect each other by interacting with each other [36]. The main methods to deal with system coupling coordination are the grey correlation model, the node model, and the coupling coordination degree model [37]. The grey correlation model mainly deals with correlations among uncertainties [38]. The node model focuses on the coordinated development of nodes, such as bus stations and train stations, and the overall regional economy [39]. The coupled coordination degree model is a means of assessing the overall degree of development in a study area. The advantage of the coupling coordination degree model is that it not only reflects the coupling coordination status among subsystems, but it can also quantify the development level of each subsystem [40]. Determining the indicator weights among systems is important for coupled coordination models, and the main methods are principal component regression [41], geographic and time-weighted regression (GTWR) [42], and the entropy weighting method [43,44]. Principal component regression is mainly applicable to models with a large number of indicators; GTWR considers the spatial geographical location of a study area; and the entropy weighting method is based on the weights obtained from the calculation of the indicator values. The coupling coordination degree model has been widely used in the fields of ecological environment and urbanisation [43,45,46], upstream and downstream enterprises of industrial chains [47,48], and land use and transportation development [49,50]. At the same time, scholars have mainly used coupled coordination models to study the interrelationship between traffic accessibility and economic development [51,52]. Our results reveal that most regions are unevenly developed and have a higher level of economic development than their transportation systems; however, how the coupled coordination of regional accessibility and economic linkage changes under the influence of a high-speed railway needs further research.
Hunan Province is in south-central China, between China’s coastal open belt and the Yangtze River basin open area; thus, it has a superior geographical position. By 2019, Hunan Province’s high-speed railway mileage reached 1892 km, ranking the highest among Chinese provinces; therefore, this study uses the socioeconomic data and weighted travel times of Hunan Province in 2008 and 2019 to compare the accessibility, economic linkage intensity, and the coupling coordination between those two factors before (2008) and after (2019) the introduction of a high-speed railway in order to investigate the differences in the spatial and temporal distribution of the three. This research provides recommendations for improving the coupled and coordinated relationship between regional accessibility and economic linkage in the context of high-speed rail development. It helps promote the mutual development of accessibility and economic linkage, and it lays the foundation for promoting sustainable regional development.
This paper consists of four sections. The detailed background of the study area, including geographic status, HSR networks, data sources, as well as the methodologies for data processing, is introduced in Section 2. The results are presented and discussed in Section 3. The final section contains the conclusions of the study and recommendations for promoting sustainable urban transport.

2. Materials and Methods
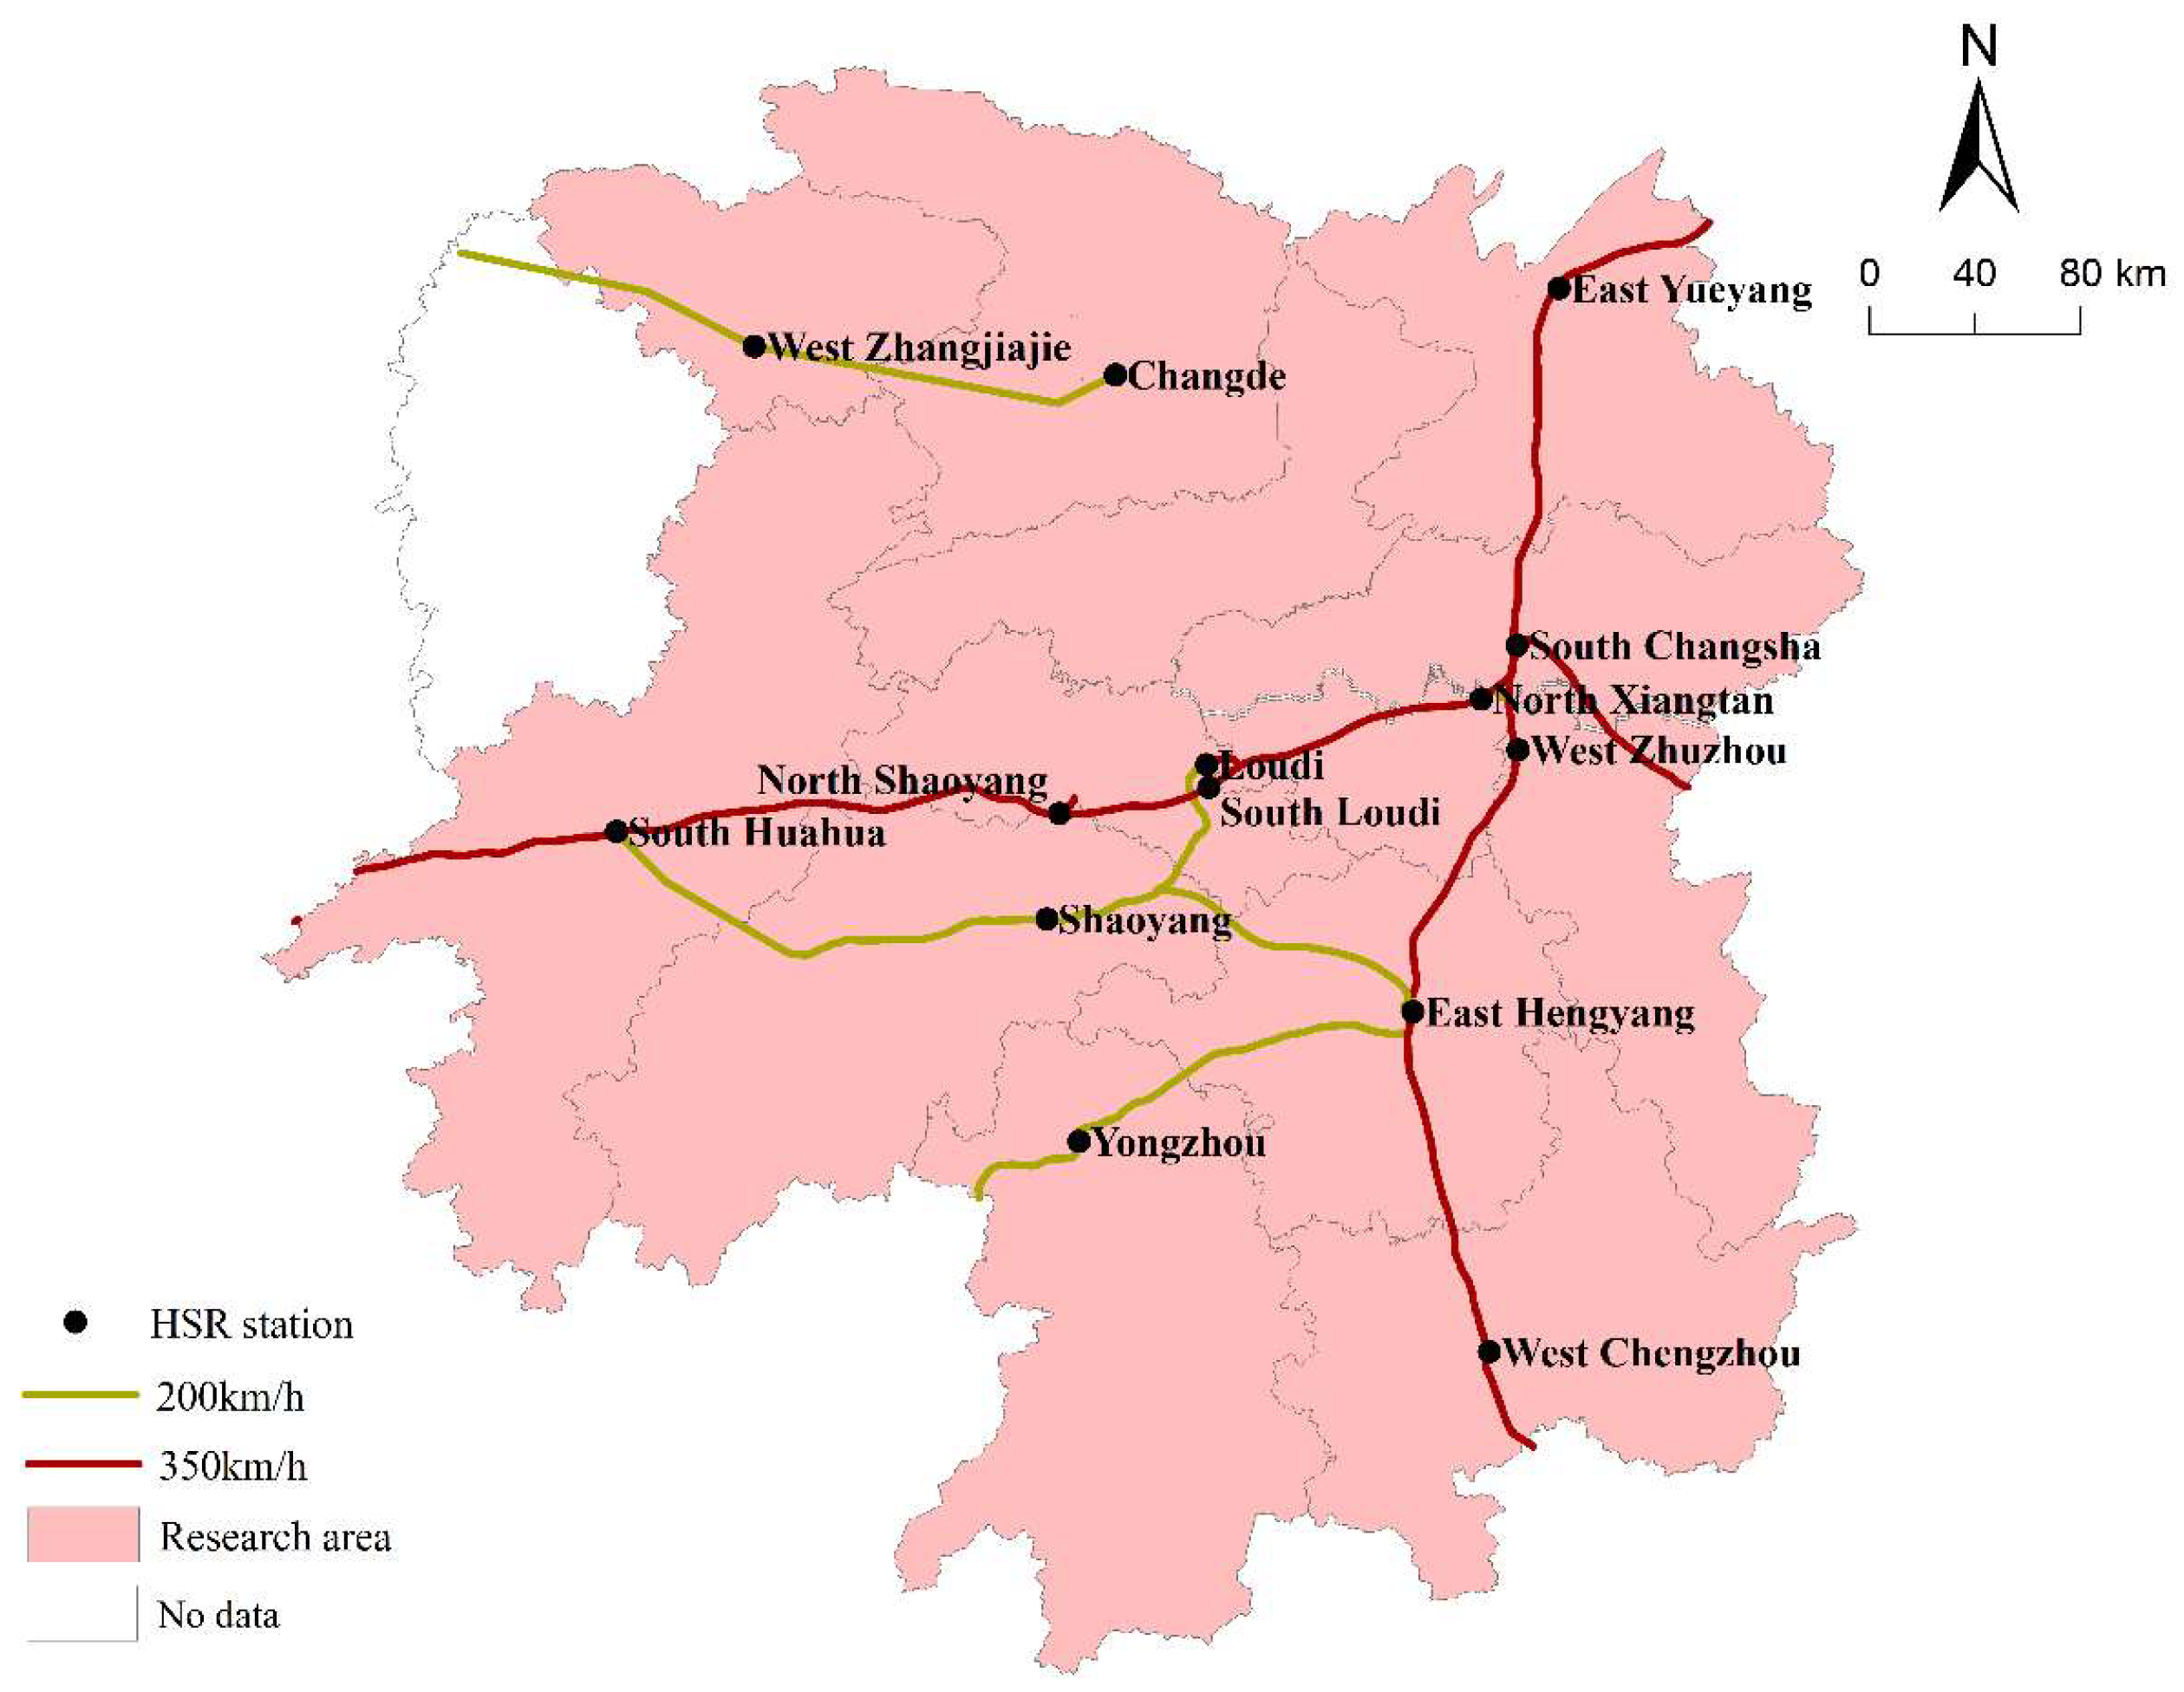
2.1. Study Area

Hunan Province is located in south-central China, it lies at 108°47′ to 114°15′ east longitude, and 24°38′ to 30°08′ north latitude. Its regions include Jiangxi, Chongqing, Guizhou, Guangdong, Guangxi, and Hubei. The total area is 359,000 m2, and the resident population is 220 million. The total area is 211,800 m2, and the resident population is 220 million. Hunan Province is divided into 14 prefecture-level cities, 19 county-level cities, and 60 counties according to the 2019 Hunan Statistical Yearbook. Currently, Hunan Province is trying to develop the economy while ensuring that transportation infrastructure is not left behind.
On 26 December 2009, the first Beijing–Guangzhou high-speed railway in Hunan Province was opened. Since then, the railway network of the province has been developing rapidly. By the end of 2019, Hunan Province formed a regional railway network, based primarily on the Beijing–Guangzhou and Shanghai–Kunming high-speed railways, and supported by the Hengyang–Liuzhou high-speed railway, and the Loudi–Shaoyang, Huaihua–Hengyang, and Qianjiang–Changde rapid railways.
In January 2021, the 14th Five-year Plan of Hunan proposed building a comprehensive transportation corridor of ‘three verticals and five horizontals’ across the province. The key projects for the construction of the railway are clear. The results of the previous construction, the Hunan high-speed railway transportation network, have become gradually clearer (Figure 1).

2.2. Data Sources

Thirteen Hunan prefecture-level cities, namely, Changsha, Zhuzhou, Xiangtan, Hengyang, Shaoyang, Yueyang, Changde, Zhangjiajie, Yiyang, Chenzhou, Yongzhou, Huaihua, and Loudi were selected as the study units. The resident population and GDP were taken from the 2009 and 2020 Hunan Statistical Yearbooks [53,54]. Data for 2008 were derived from the updated April 2008 train schedules of Yien Technology. The 2018 data were obtained from Ctrip, a well-known Chinese travel website, in October 2019. The vector data of city boundaries and highway networks were extracted from the topographic map of China provided by the National Geographic Information Center. In an attempt to mirror ‘real-life’ scenarios, if a direct train exists between two cities, then the shortest duration stated in the train schedule is selected as the travel time; otherwise, the travel time is determined according to the principle of the shortest time for the transfer.

2.3. Research Methods

2.3.1. Weighted Average Travel Time

Choosing an appropriate accessibility metric is important. The economic and social level of a city affects the movement of people. Regional accessibility is not only related to regional location and transportation, but also to the level of local economic development. Considering the minimum time cost of transportation networks, and the impact of urban development upon the movement of people, this study uses weighted average travel time to measure accessibility. Weighted average travel time is the value of the time it must take to travel from one city to another city. This time value is a composite indicator, which is closely related to city size and economic development level. The higher the value of this indicator, the higher the accessibility of the city; the lower the value of this indicator, the lower the accessibility of the city. First, the shortest travel time was acquired through software and a website. Then, the statistical yearbook was used to obtain the population and GDP of the study area, and to calculate the accessibility.
A i = j = 1 n 1 T i j × M j M j ,  
M j = G j × P j ,
where A i is the weighted average travel time for city i and measures its accessibility. n is the number of cities in the study area. T i j is the shortest travel time from city i to city j . M j is the mass of city j, which indicates the level of its development. This study used the square root of the product of a city’s resident population (10,000 people) and gross regional product (billion yuan) to measure M. G j is the gross regional product of city j, and P j is the resident population of city j.
To make the accessibility of cities in the study area more intuitive, the accessibility coefficient was obtained by taking the ratio of the accessibility value of each city and dividing it by the average of the accessibility values of all the studied cities in Hunan Province.
A i = A i i = 1 n A i / n ,
where A i is the accessibility coefficient of city i. A i is the weighted average travel time of the city, and n is the number of cities in the study area.

2.3.2. Economic Linkage Intensity

Economic linkage intensity is used to describe the closeness of economic ties among cities, thus reflecting the ability of a city to radiate its economic strength to surrounding areas. The closer the economic exchange between two cities, the stronger the economic ties. In this study, the distance variable was time distance.
I i j = P i G i P j G j T i j 2 ,
I i = i = 1 n I i j ,
where I i j is the economic linkage intensity between city i and city j , P is the resident population of the city, G is the regional GDP of the city, and T i j is the minimum travel time from city i to city j . I i is the total economic linkage of city i to other cities in Hunan Province, and n is the number of cities.

2.3.3. Coupled Coordination Model

Accessibility and urban economic linkage are two closely related systems that are interdependent and interact with each other. The coupled coordination model is primarily a measure of the degree to which two or more subsystems interact with each other in a system; therefore, a coupled coordination degree model was used to investigate the relationship between accessibility and economic linkage. The greater the degree of coupling coordination, the more likely it is that accessibility and economic linkage will coordinate well with the ordered structure. If the coupling coordination is low, then the two systems will produce a disorderly and chaotic state.
C = 2 U 1 + U 2 ( U 1 + U 2 ) 2 ,
T = α U 1 + β U 2 ,
D = C T
where C is the coupling degree of accessibility and economic linkage, T is the reconciliation factor between accessibility and economic linkage, and D is the coupling coordination degree between accessibility and economic linkage. U1, U2 are normalised values of the city’s accessibility and economic linkage, and α and β denote the weights of accessibility and economic linkage in the system. Given that the level of urban economic linkage is the result of the combined effect of multiple factors, and a high-speed railway is only one of the factors, α is 0.4 and β is 0.6. The coupling coordination degree has six main types, as presented in Table 1.

3. Results

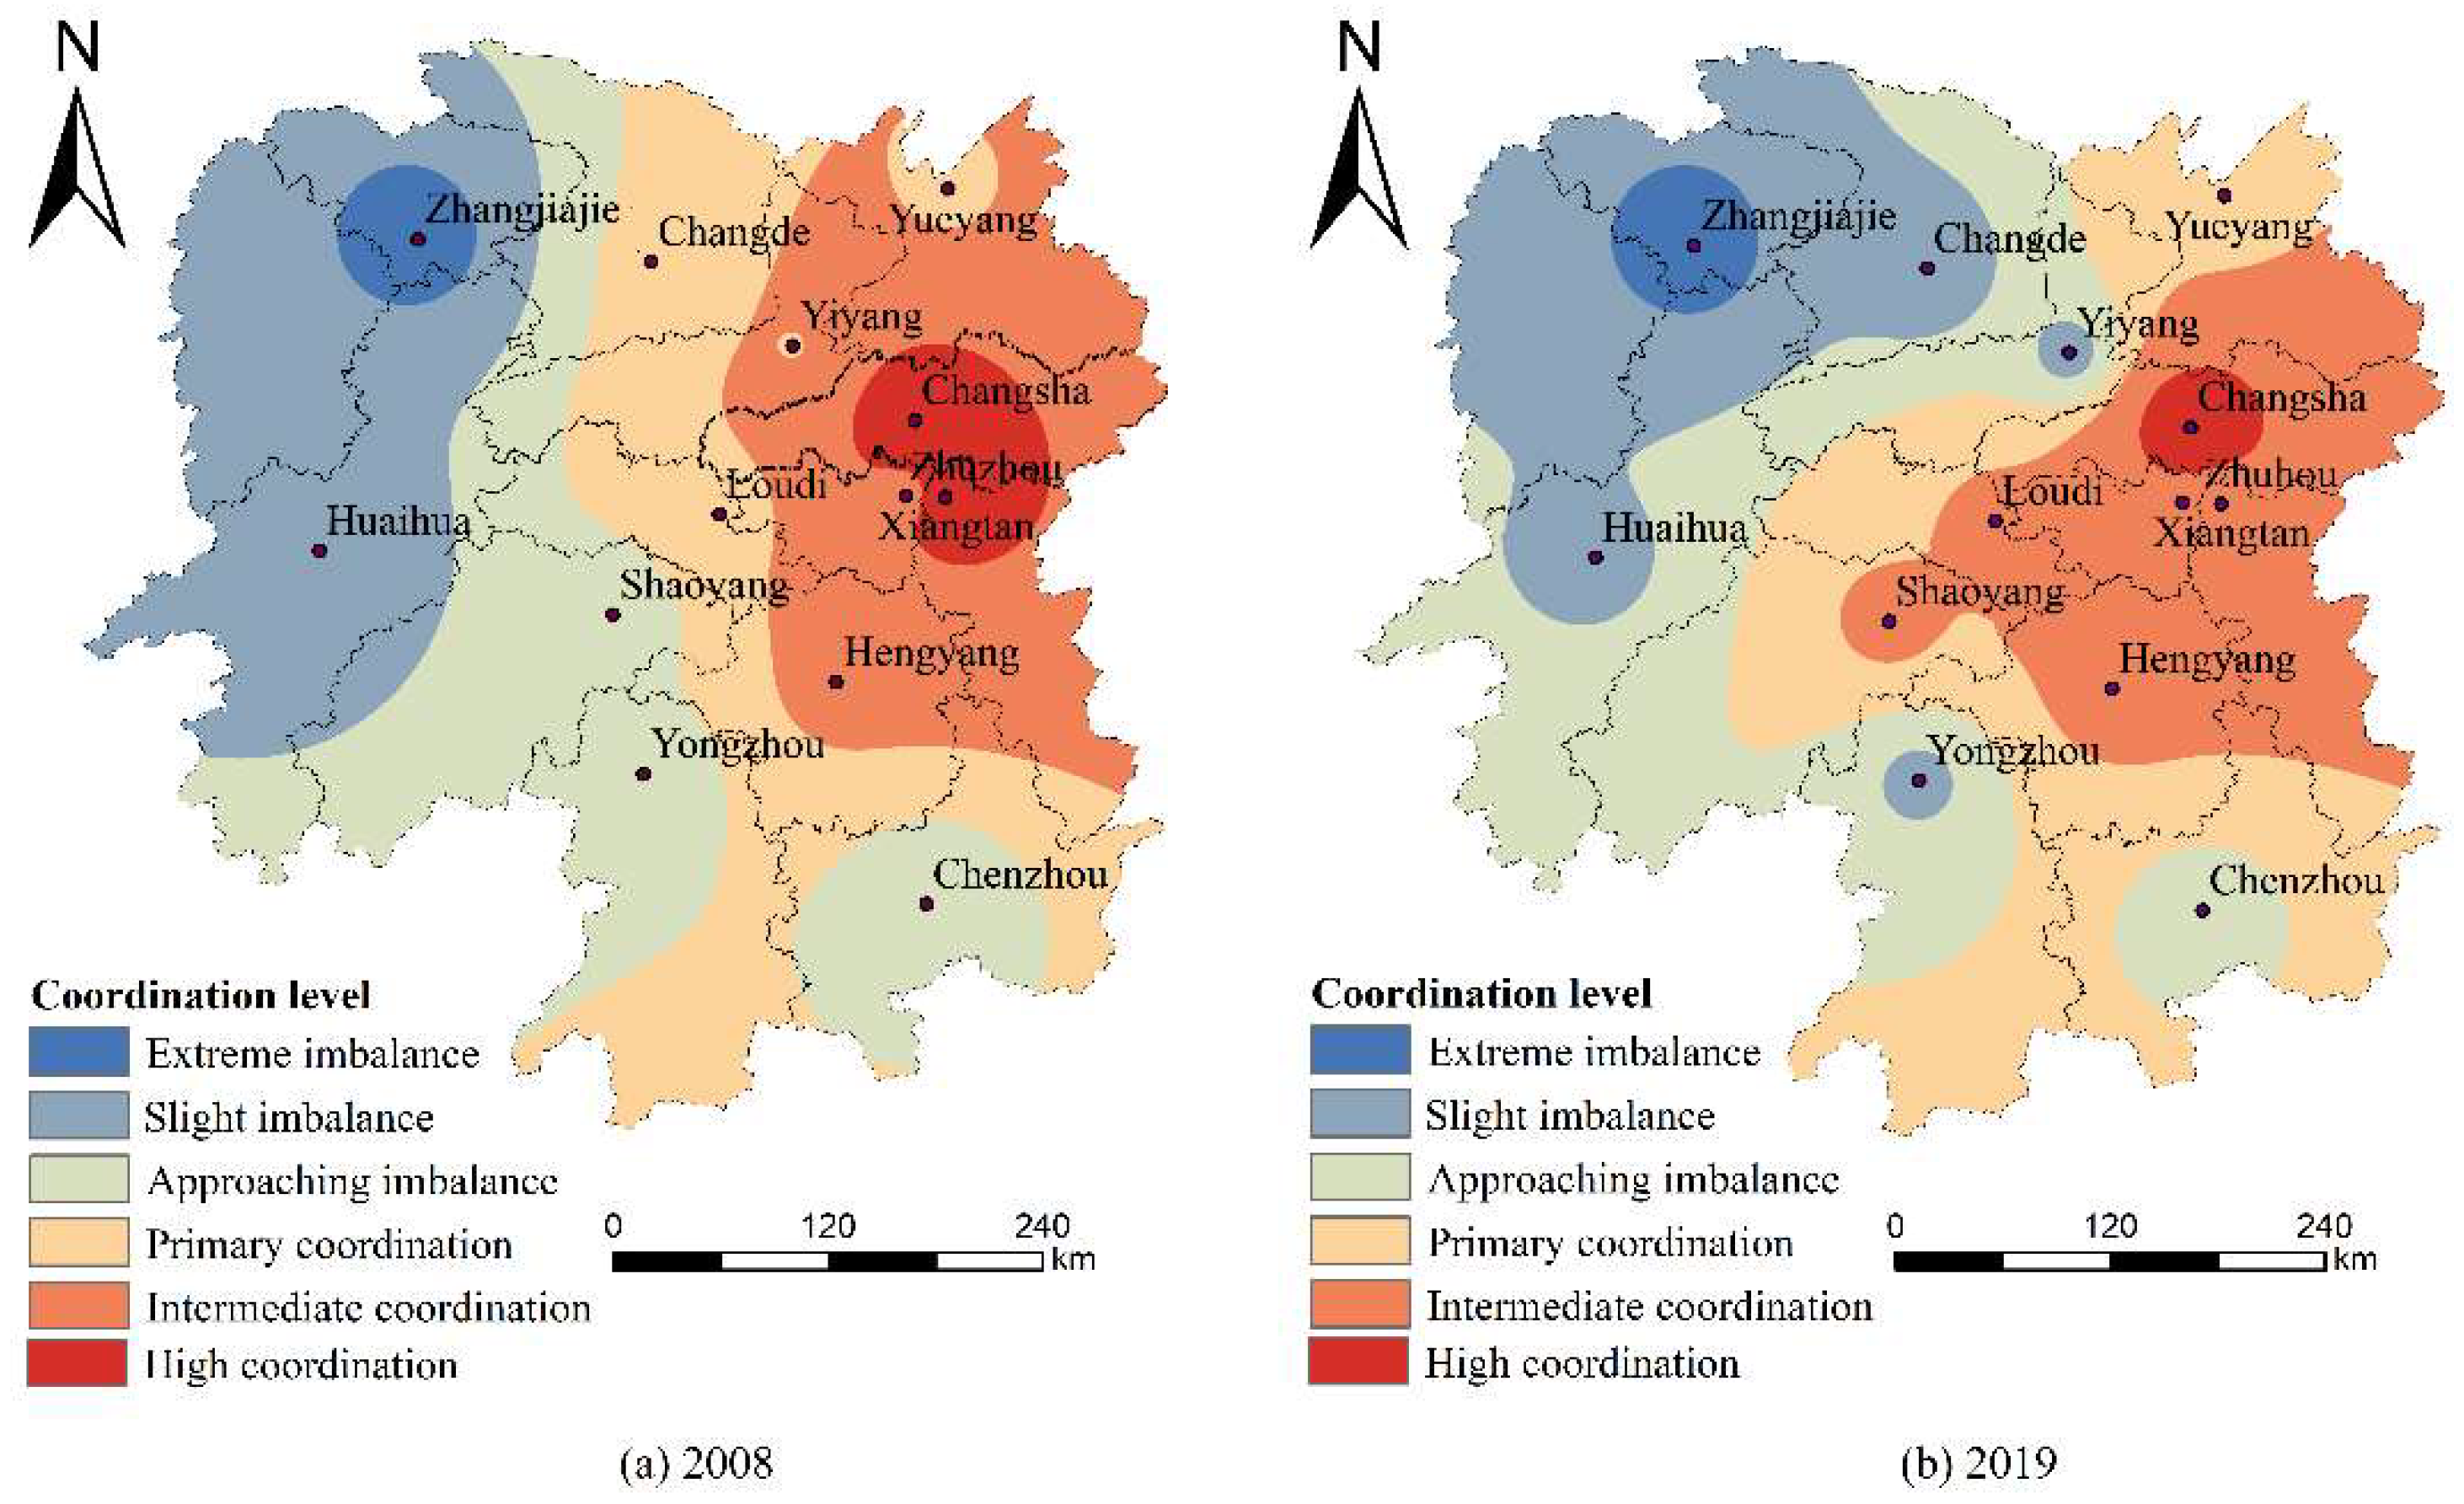
3.1. Spatial and Temporal Differences in Accessibility

The accessibility of each city in Hunan Province was determined using the effective average travel time to observe the spatial and temporal changes in accessibility after the high-speed railway was opened. Table 2 shows that the introduction of the high-speed railway has greatly reduced the travel time between cities.
The overall pattern of high-speed railway accessibility in Hunan Province uses the Changsha–Zhuzhou–Xiangtan city cluster as the core and shows a radiation pattern that spreads to surrounding areas. The areas with better accessibility before and after the introduction of the high-speed railway are located in Changsha City and its surrounding cities, whereas the hilly and mountainous terrain in western Hunan limits the spread of the high-speed railway network, thus resulting in poor accessibility to Zhangjiajie and its surrounding areas. As illustrated in Figure 2, although the overall layout for accessibility before and after the introduction of the high-speed railway in Hunan Province does not significantly change, the improvement of city accessibility is obvious, especially in Shaoyang, Changsha, Huaihua, and Yueyang, where the effective travel time reduction reaches more than 55%. Since the opening of several high-speed railway lines in Hunan Province, the effective travel time of each city has been greatly reduced, and thus, the accessibility of cities has been significantly improved, especially in cities along the Beijing–Guangzhou and Shanghai–Kunming high-speed rail lines. The construction of high-speed railways is of great significance to the improvement of the accessibility of cities.
The introduction of high-speed railways has improved urban transportation in Hunan Province to different degrees, and has shortened the temporal and spatial distances between cities to some extent. Before the introduction of the high-speed railway, the average value of the weighted average travel time in Hunan cities was 221.51 min; after the high-speed railway was introduced, the average value shrank to 120.71 min, thus shortening the weighted average travel time by 100.80 min. Out of all the Hunan cities, Shaoyang experienced the most proportional reduction in weighted average travel time, from 252.47 min to 79.09 min, which equates to a reduction rate of 68.67%; the largest reduction was found in Huaihua, from 364.16 min before the introduction of the high-speed railway to 157.10 min, which equates to a reduction of 207.06 min. Before the introduction of the high-speed railway, the railway network in the province was fairly ordinary, and the average travel time in the city was four hours. In Zhangjiajie, Huaihua, and the surrounding areas of the western part of Hunan Province, the terrain is mountainous and complex, and the weighted average travel time within this part of the province is more than six hours. After the introduction of the high-speed railway, the average travel time between cities in Hunan Province improved to about two hours. Comparing the traffic before and after the introduction of the high-speed railway, in many places in Hunan, it has obviously improved a great deal after the introduction of the high-speed railway.
The rate of change in accessibility varies across cities in Hunan Province. Figure 2 shows that the Huaihua–Shaoyang–Hengyang and Yueyang–Changzhutan–Chenzhou spatial and temporal distances have been significantly shortened, with a ‘T’-shaped spatial pattern. The degree of improvement in terms of accessibility gradually decreases along the ‘T’ outward expansion. Zhangjiajie and Changde in north-western Hunan, and Yiyang in northern Hunan, have seen limited improvements to accessibility. Indeed, the predominance of mountains in the northwestern part of Hunan Province makes it difficult to improve traffic. Moreover, the number of railway lines and the speed of the trains passing through these cities are limited.
Before the introduction of the high-speed railway in Hunan Province, six cities had below-average accessibility; after it was introduced, five have been left with such an accessibility rate, and the overall pattern before and after the introduction of the high-speed railway has not significantly changed. Before and after the introduction of the high-speed railway, Changsha, Zhuzhou, and Xiangtan are ranked in the top three in terms of accessibility, thus leading the province. Zhangjiajie is ranked in last place, thus indicating its poor accessibility. Among the remaining cities, Shaoyang has benefited from the introduction of the Shanghai–Kunming high-speed railway, and it has experienced the most significant improvement in terms of rank, rising from 10th place before the introduction of the high-speed railway, to fourth place post-introduction. Although Changde’s accessibility has also improved, its degree of progress is somewhat insufficient compared with other cities in the province, thus it ranks near the bottom.

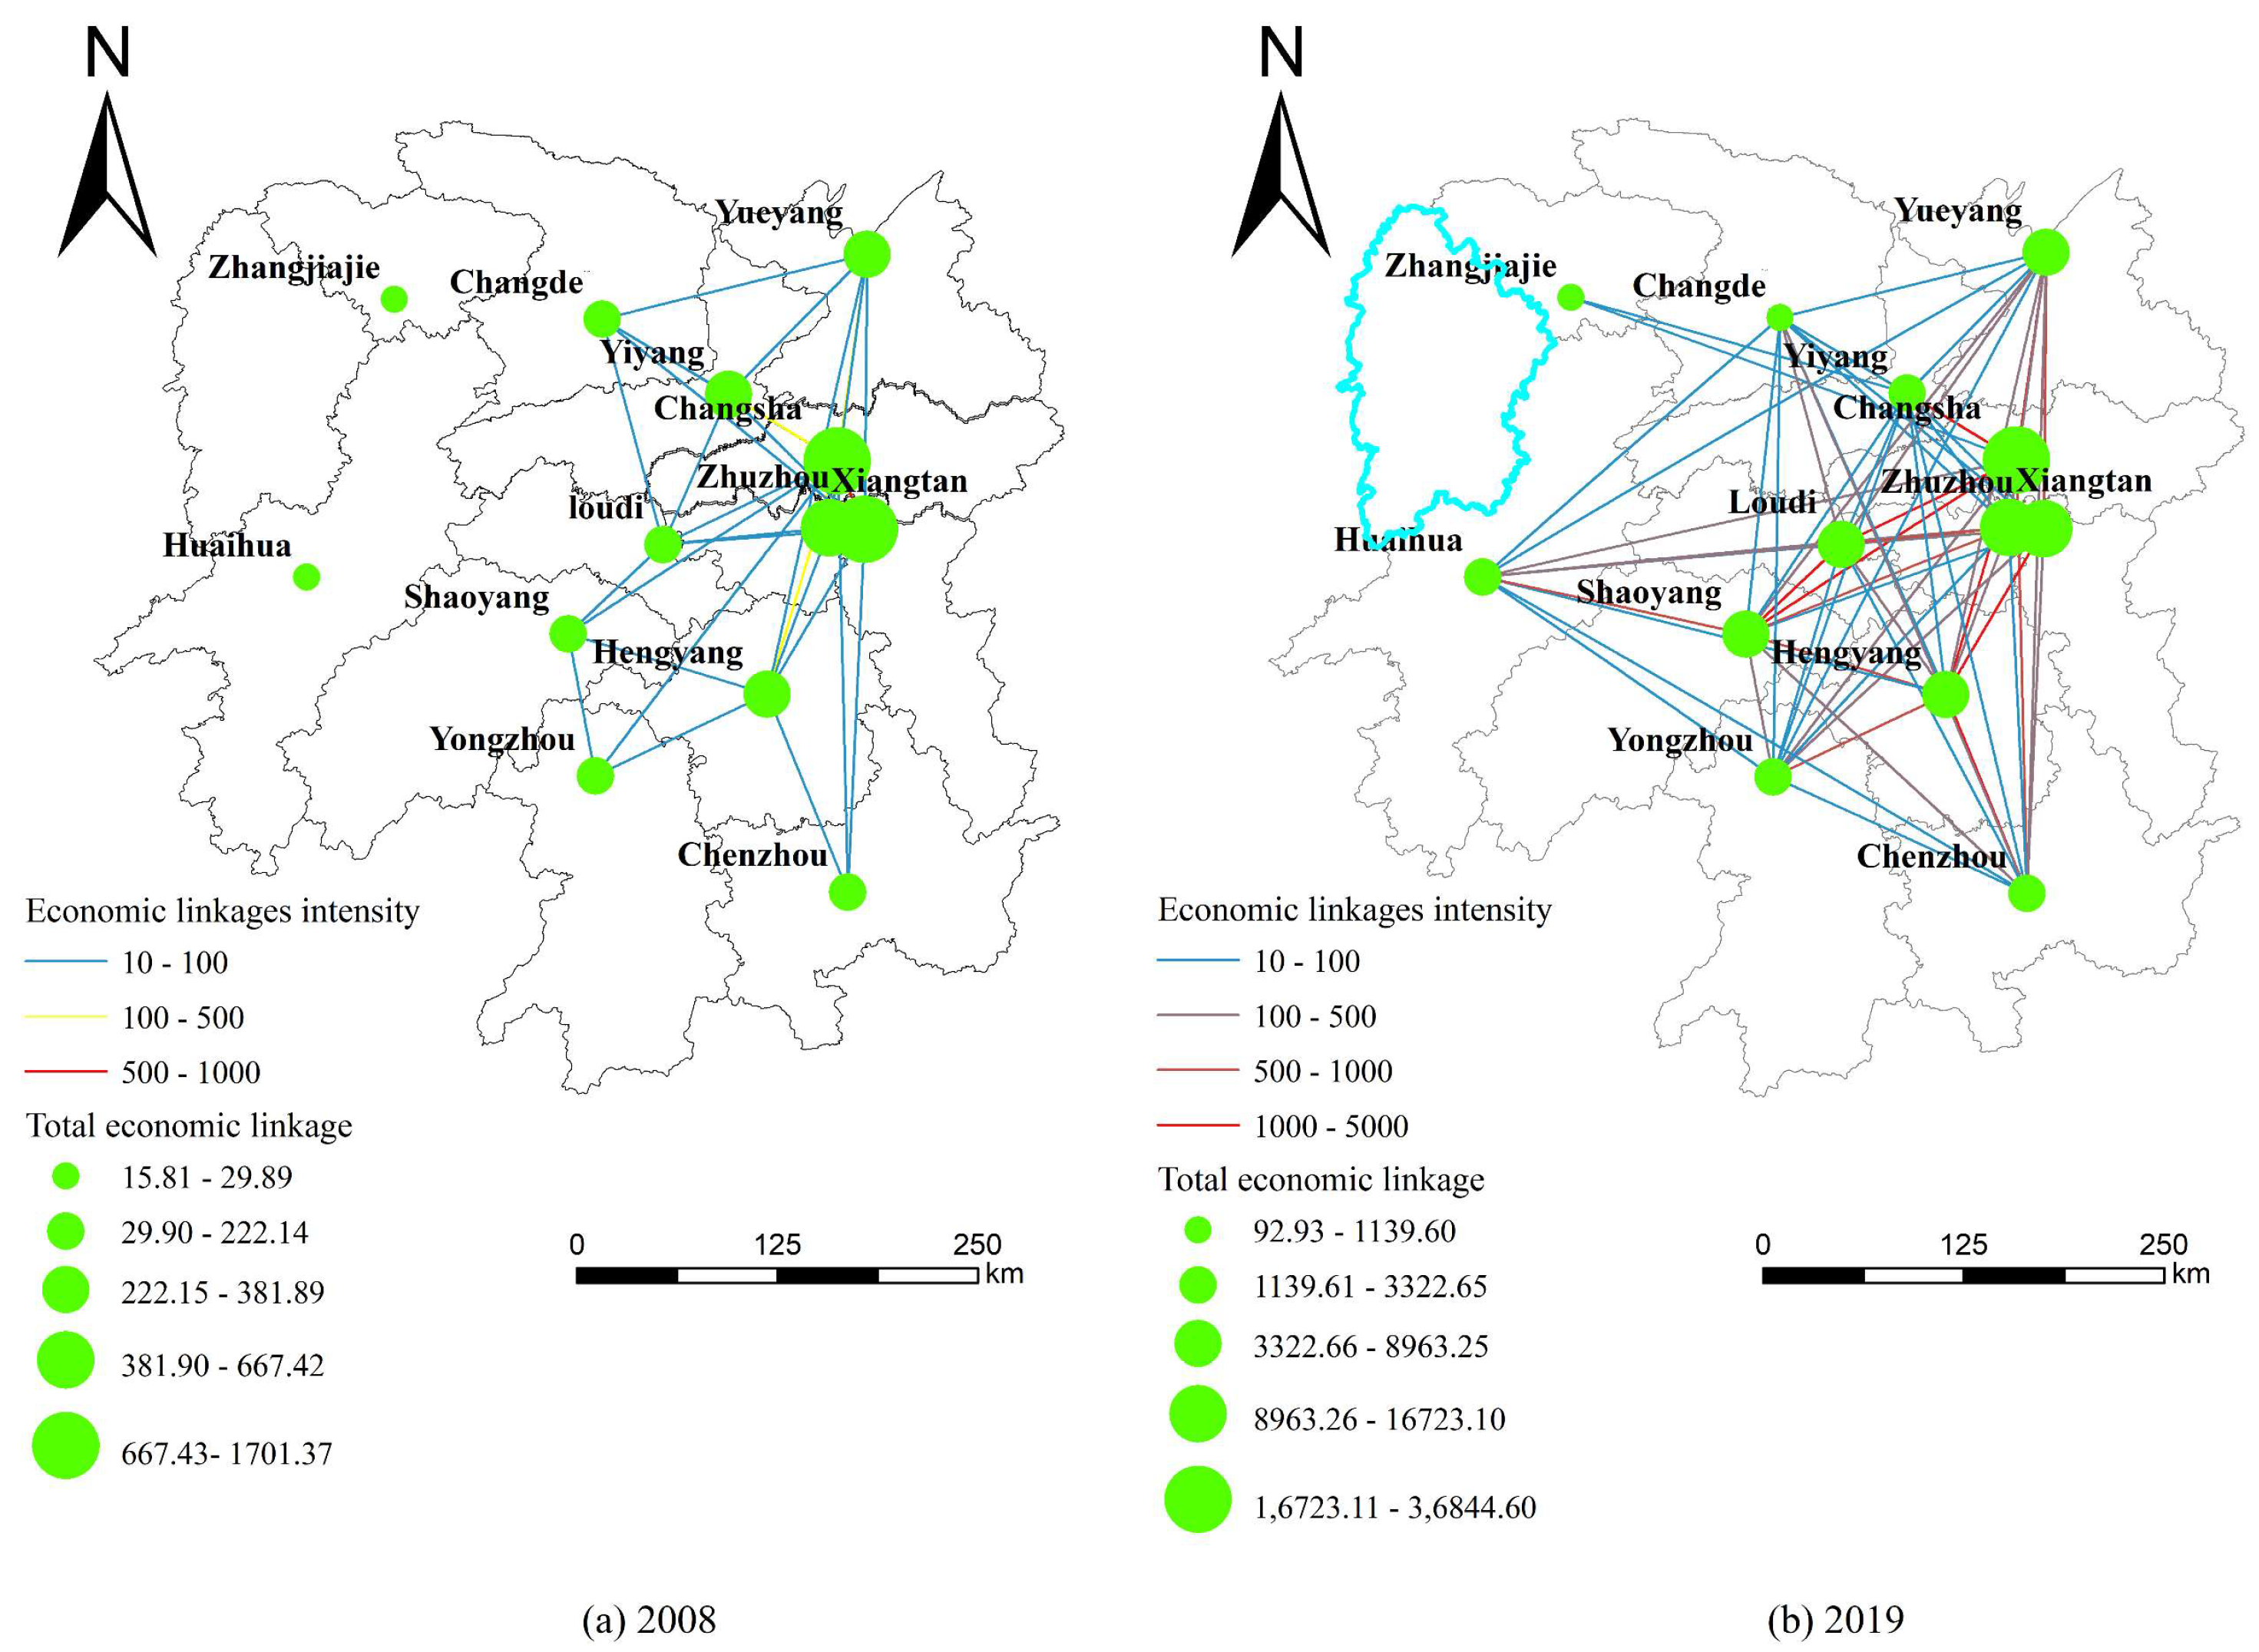
3.2. Spatial Layout of Economic Linkage

Table 3 shows the total economic linkage and the ranking of cities in Hunan Province before and after the introduction of the high-speed railway.
As shown in Figure 3, the introduction of high-speed rail has led to a gradual evolution of the overall spatial pattern of economic linkage intensity from a point-axis model to a network model. Before the introduction of the high-speed railway, the economic linkage intensity in the eastern part of Hunan Province was much higher than in other regions of the province, with its main core being the integrated urban areas of Changsha, Zhuzhou, and Xiangtan. Huaihua and Zhangjiajie, located in the western part of Hunan Province, have limited economic linkages with other cities for various reasons, such as their deviated geographic location, closed traffic system, and backward urban development. Their total number of economic linkages also lag behind other cities in Hunan. After the introduction of the high-speed railway, the economic linkages between cities have become closer than before, and the total number of linkages has risen significantly. The Changsha–Zhuzhou–Xiangtan city cluster is becoming increasingly integrated, and it continues to occupy the top three in terms of total economic linkage. The central cities of Shaoyang, Huaihua, and Loudi have been enhanced with the introduction of the Shanghai–Kunming high-speed railway, which has enhanced accessibility and strengthened intercity economic linkages. Moreover, Zhangjiajie has developed an increasing number of economic contacts with other cities in the province, but the total number of economic linkages is still somewhat insufficient compared with other cities.
The total number of economic linkages in each city has been greatly enhanced. After the introduction of the high-speed railway, the total number of economic linkages in the province has increased by 19.43 times. The most significant growth is in Huaihua, where the total number of economic linkages has increased by 62.30 times. The city with the lowest level of growth in terms of economic linkages is Zhangjiajie, which improved by 15.8 times. Before the introduction of high-speed rail, the economic linkages between cities in the Hunan Province were relatively low, and were mainly concentrated in areas near Changsha. After the introduction of high-speed rail, the economic linkages between cities have been significantly strengthened, and a clear trend of expansion from the east to the centre has been formed.
The introduction of high-speed rail has led to an increasing difference between the total number of economic linkages formed in developed and less developed regions. Before the introduction of the high-speed railway, the city with the largest number of total economic linkages was Changsha, and the city with the lowest number of economic linkages was Zhangjiajie, with total economic linkages of 1701.37 and 15.81, respectively, and a difference of 1685.56 between them. After the introduction of high-speed rail, the largest and smallest numbers of total economic linkages still belong to Changsha and Zhangjiajie, respectively, but the numbers of total economic linkages are 36,844.56 and 92.93, respectively. The difference has reached 36,751.63. Changsha is at the core of the Changsha–Zhuzhou–Xiangtan city cluster, along with a few high-speed rail links. Rich transportation resources have caused Changsha’s number of total economic linkages to rise rapidly. Improvements to Zhangjiajie’s transportation network have been limited. Despite reduced travel times in Changde, not enough economic exchange with other cities in the province occurs. Zhangjiajie has not fully exploited the advantages of its unique tourism resources, thus its total number of economic linkages is limited, and it can only improve the city to a certain extent.
A clear spatial hierarchy of economic linkages exists among cities in Hunan Province. Figure 3 illustrates that the dense economic linkages are mainly in the eastern and central parts of Hunan, whereas the economic linkages in the western part of Hunan are obviously sparser, thus showing an overall spatial pattern of ‘strong in the east and weak in the west’.

3.3. Coupling Coordination Degree Analysis

Table 4 shows the coupling types of cites in Hunan Province before and after the opening of the high-speed railway.
From the comparison of the results in Table 4, the mean value before the introduction of the high-speed railway is 0.546, and the mean value after the introduction of the high-speed railway is 0.533, with little change before and after, and both belonging to primary coupling. Changsha’s accessibility has an excellent synergistic relationship with economic ties, and the introduction of several high-speed rail lines has enhanced its accessibility whilst promoting economic exchanges with other cities. Zhangjiajie has poor synergy between the two and is a ‘double-low’ city, with low economic ties and low accessibility. Shaoyang and Huaihua have seen substantial improvements in their transportation networks because of the introduction of high-speed rail lines, which have played a supportive role in economic development; moreover, coupling coordination has improved by more than 10%. Yiyang and Changde have seen a decline in coupling coordination, from primary coupling to declining coupling, due to limited transportation network improvements which fail to keep up with the economic development rate, thus causing a failure to meet economic development needs.
As shown in Figure 4, high coordination, intermediate coordination, primary coordination, approaching imbalance, slight imbalance, and extreme imbalance exist simultaneously in the region, and the spatial differentiation between gradient levels is obvious. The coupling coordination in the plains of eastern Hunan is generally higher than that in the hilly and mountainous areas of western Hunan, within which, the Changsha–Zhuzhou–Xiangtan urban agglomeration is at the core. Strategic policy priorities and economic resources have been preferentially concentrated in eastern cities, and thus, their accessibility and economic links have remained high. After the completion of the high-speed railway, the coordination shows a trend of gradient improvement from northeast to southwest, whereas the coordination in the northern part of Hunan Province begins to decline, echoing the spatial layout of accessibility and intensity of the economic ties above. As a result of the Shanghai–Kunshan high-speed railway, the Loudi–Shaoyang railway was opened, and the accessibility in Loudi and Shaoyang improved, as did their economic exchanges with other cities; therefore, coordination in these cities has effectively been improved. Although Changde and Yiyang have improved their accessibility, they are still slightly lacking compared with other cities; furthermore, the construction of high-speed rail has come to a relative standstill in these cities, with coordination declining instead.
According to the above classification of accessibility and economic linkage coupling, Hunan Province can be divided into four types of zones: excellent accessibility, cities with high total economic linkage (Type I); average accessibility, cities with high total economic linkage (Type II); better accessibility, cities with low total economic linkage (Type III); and poor accessibility, cities with low total economic linkage (Type IV) (Figure 5).
Combining the above data, we can conclude that Changsha, Zhuzhou, and Xiangtan are Type I cities. Their accessibility and economic development are mutually reinforcing. The three cities are strategically located by the Xiangjiang River, and they have a superior geographical location. Chenzhou is a Type II city, as its accessibility development lags behind its economic development. It must accelerate the construction of a modern transportation system so that residents can have additional travel options. Hengyang, Shaoyang, Yueyang, and Loudi are Type III cities, as they are lagging behind transportation development, and thus, they must identify their own city-specific industries and strengthen their economic ties with the Changsha–Zhuzhou–Xiangtan city cluster. Most of these cities are in the middle of Hunan, and they play an important role in the central hub in terms of promoting economic exchanges between the east and west of Hunan. Changde, Zhangjiajie, Yiyang, Yongzhou, and Huaihua are Type IV cities. Most of these cities are located in the west and north of Hunan, with poor accessibility and slow economic development. They should focus upon strengthening their economic and transportation infrastructures in order to construct a positive cycle of reinforcement between their economies and transportation networks.

4. Conclusions and Policy Implications

4.1. Conclusions

In the context of HSR networks, exploring the coupling and coordination between regional accessibility and economic linkages is essential for guiding sustainable urban transportation development strategies. This study has evaluated the coupling and coordination degree between regional accessibility and economic linkages. The focus of this study is to quantitatively examine the coordination relationship and spatial distribution between regional accessibility and economic linkages by using weighted average travel time, the gravity model, and the coupling and coordination degree model. The following conclusions can be drawn.
(1) With the increasing improvement of the Hunan high-speed railway network, the travel time between cities has been reduced, and their accessibility has been improved to a certain extent, with an average value of 45.51%. The spatial pattern of accessibility does not significantly change before and after the introduction of the high-speed railway, and it shows a radiation pattern with the Changsha–Zhuzhou–Xiangtan city cluster at the core, spreading outwards. The accessibility of each city is improved to different degrees, among which, Shaoyang has the greatest improvement with 68.97%, whereas Yiyang has a limited improvement of only 7%, which is also the lowest overall improvement.
(2) Increased accessibility strengthens interregional economic linkages, whereas interregional economic patterns change. After the introduction of the high-speed railway, the economic exchanges between cities have become significantly more frequent than before, and the spatial pattern has gradually evolved from a point-axis model to a network model. The total number of economic linkages in each city has improved to different degrees, and the three cities with the highest growth rates in terms of economic linkage are Huaihua, Shaoyang, and Loudi; however, this improvement is limited, and stems from the fact that the bipolar trend is more obvious than before.
(3) Hunan Province demonstrates, in general, primary coupling in terms of accessibility and economic linkage coupling coordination, and the two-level regional phenomenon is prominent. The Changsha–Zhuzhou–Xiangtan urban agglomeration has good coupling coordination because of better geographical conditions, more mature transportation development, and a higher economic level compared with the other cities; however, the western part of Hunan and its northwestern region have poor coupling coordination as a result of many factors, such as urban geographic constraints and limited transportation conditions.
On the basis of the above findings, this study proposes the following recommendations to improve the coupled and coordinated relationship between regional accessibility and economic linkages.

4.2. Policy Implications

Railways are relatively stable modes of transportation [55]. Due to their low cost and the fact that travelling by rail is a form of long-distance transportation, railways will become increasingly important to future transportation systems. Railway and economic development complement one another. In order to promote the sustainable development of regional transportation, the economy and railroads need to develop together in a coordinated manner. The policy implications are as follows.
Firstly, the construction of high-speed railways in northern and western Hunan must be strengthened. Accessibility in the northern part of Hunan is poor. To strengthen the economic exchange between the east and west of Hunan, the construction of high-speed railways from Changde and Yiyang to Changsha must be accelerated. Such an acceleration could greatly reduce the space–time distance between the east and west of Hunan. It could also connect with the Qianzhangchang Railway, which will undoubtedly further improve the railway network structure in the north-western channel of Hunan, as well as the traffic infrastructure conditions along the route, and it could accelerate the economic development of north Hunan.
Secondly, the western and southern Hunan regions must be developed in accordance with their intrinsic advantages. They should take advantage of the superior geographical position in the southern Hunan region, and they should increase the economic exchanges between the southern Hunan region and its surrounding areas, especially the Guangdong–Hong Kong–Macao Bay Area, the Beibu Gulf, and the Association of Southeast Asian Nations region. The southern Hunan region should try to attract excellent enterprises from developed regions, actively undertake industrial transfers, and strive to build model inland open cooperation zones. Special industries in western Hunan must also be vigorously developed. The western Hunan region is rich in tourism-based resources, but the terrain is complex, the ecological environment is fragile, and the overall development level is not high. The region should develop a green economy with the premise of ensuring ecology.
Lastly, a regional space must be built for integrated transportation and economic development. More specifically, a ‘one main two vice’ city belt should be constructed to create two high-speed rail economic belts. With the Changsha–Zhuzhou–Xiangtan city cluster at the core, and Yueyang and Hengyang as the subcentres, both must act as the core node of the regional economy which encourages economic radiation, they must promote the construction of the Beijing–Guangzhou and Shanghai–Kunming high-speed railway economic belts, and they must build a synergistic and integrated spatial pattern of Hunan’s economic development.
The accessibility calculation in this article is the duration of time taken to travel from one city high-speed railway station to another, ignoring the distance between the high-speed railway station and the city centre. Moreover, the calculation of the total number of economic linkages in a city only considers the economic linkages generated by the city in relation to other cities in Hunan Province, ignoring the economic linkages between other provincial areas. These shortcomings may have caused some errors in the calculation results. In future studies, these errors will be analysed and solved, and more comprehensive conclusions will be obtained.

Author Contributions

Conceptualization, M.Z. and Y.X.; methodology, M.Z.; software, M.Z.; validation, M.Z. and Y.X.; formal analysis, Y.X.; investigation, C.L.; resources, C.L.; data curation, C.L.; writing—original draft preparation, M.Z.; writing—review and editing, M.Z.; visualization, M.Z.; supervision, C.L. All authors have read and agreed to the published version of the manuscript.

Funding

This research received no external funding.

Institutional Review Board Statement

Not applicable.

Informed Consent Statement

Not applicable.

Data Availability Statement

The case analysis data used to support the findings of this study are available from the corresponding author upon request.

Acknowledgments

The authors would like to thank the valuable comments from anonymous reviewers.

Conflicts of Interest

The authors declare no conflict of interest.

References

  1. Oladele, A.S. Technological Advances and Sustainable Workforce Development through Enhanced Collaboration for Sustainability of Transport Infrastructure. In Proceedings of the ASCE International Conference on Transportation and Development (ASCE ICTD), Seattle, WA, USA, 26–29 May 2020; pp. 277–286. [Google Scholar]
  2. Pagliara, F.; Henke, I. The Impacts of High-Speed Rail on Territorial Accessibility: A Comparison Among Some European Countries. In Proceedings of the 21st International Conference on Computational Science and Its Applications (ICCSA), Cagliari, Italy, 13–16 September 2021; pp. 242–254. [Google Scholar]
  3. Kortazar, A.; Bueno, G.; Hoyos, D. Environmental balance of the high speed rail network in Spain: A Life Cycle Assessment approach. Res. Transp. Econ. 2021, 90, 101035. [Google Scholar] [CrossRef]
  4. Jiao, J.; Wang, J.; Jin, F.; Dunford, M. Impacts on accessibility of China’s present and future HSR network. J. Transp. Geogr. 2014, 40, 123–132. [Google Scholar] [CrossRef]
  5. Shaw, S.-L.; Fang, Z.; Lu, S.; Tao, R. Impacts of high speed rail on railroad network accessibility in China. J. Transp. Geogr. 2014, 40, 112–122. [Google Scholar] [CrossRef]
  6. An, Y.; Wei, Y.D.; Yuan, F.; Chen, W. Impacts of high-speed rails on urban networks and regional development: A study of the Yangtze River Delta, China. Int. J. Sustain. Transp. 2021, 16, 483–495. [Google Scholar] [CrossRef]
  7. Grujicic, I.; Raidl, G.; Schobel, A.; Besau, G. A Metaheuristic Approach for Integrated Timetable Based Design of Railway Infrastructure. In Proceedings of the 3rd International Conference on Road and Rail Infrastructure (CETRA), Split, Croatia, 28–30 April 2014; pp. 691–696. [Google Scholar]
  8. Sama, M.; D’Ariano, A.; Pacciarelli, D.; Corman, F. Lower and upper bound algorithms for the real-time train scheduling and routing problem in a railway network. In Proceedings of the 14th IFAC Symposium on Control in Transportation Systems (CTS), Istanbul, Turkey, 18–20 May 2016; pp. 215–220. [Google Scholar]
  9. Huang, Y.; Xu, W. Spatial and temporal heterogeneity of the impact of high-speed railway on urban economy: Empirical study of Chinese cities. J. Transp. Geogr. 2021, 91, 102972. [Google Scholar] [CrossRef]
  10. Jin, S.; Yang, J.; Wang, E.; Liu, J. The influence of high-speed rail on ice-snow tourism in northeastern China. Tour. Manag. 2020, 78, 104070. [Google Scholar] [CrossRef]
  11. Liu, G.G.; Tang, C.X.; Liu, Y.H.; Bu, T.; Tang, D.S. Will high-speed railway influence the healthcare seeking behaviour of patients? Quasi-experimental evidence from China. Health Policy Plan 2021, 36, 1633–1643. [Google Scholar] [CrossRef]
  12. Li, Q.; Dong, A.; Zhang, B. Impact of the opening of high-speed rail on environmental pollution in the Yangtze River Economic Belt: Promoting or inhibiting? Int. J. Environ. Sci. Technol. 2022, 1–16. [Google Scholar] [CrossRef]
  13. Hansen, W.G. How Accessibility Shapes Land Use. J. Am. Inst. Plan. 1959, 25, 73–76. [Google Scholar] [CrossRef]
  14. Gao, X.C.; Wang, B.; Sun, D.Q. Do railways improve territorial cohesion of the Tibetan Plateau? A case study of the Qinghai-Tibet Railway. Appl. Geogr. 2022, 144, 102720. [Google Scholar] [CrossRef]
  15. Jiang, B.; Chu, N. Comprehensive Evaluation of Accessibility in China’s High-Speed Rail Network Based on the Perspective of Time, Economy, and Frequency. J. Urban Plan Dev. 2017, 143, 05017009. [Google Scholar] [CrossRef]
  16. Yang, H.; Dijst, M.; Witte, P.; Van Ginkel, H.; Yang, W. The Spatial Structure of High Speed Railways and Urban Networks in China: A Flow Approach. Tijdschr. Voor Econ. Soc. Geogr. 2018, 109, 109–128. [Google Scholar] [CrossRef] [Green Version]
  17. Cascetta, E.; Carteni, A.; Henke, I.; Pagliara, F. Economic growth, transport accessibility and regional equity impacts of high-speed railways in Italy: Ten years ex post evaluation and future perspectives. Transp. Res. A Policy Pract. 2020, 139, 412–428. [Google Scholar] [CrossRef] [PubMed]
  18. Hong, W.; Su, M. Influence of Rapid Transit on Accessibility Pattern and Economic Linkage at Urban Agglomeration Scale in China. Open Geosci. 2019, 11, 804–814. [Google Scholar] [CrossRef]
  19. Liu, L.; Zhang, M. The Impacts of High-Speed Rail on Regional Accessibility and Spatial Development-Updated Evidence from China’s Mid-Yangtze River City-Cluster Region. Sustainbility 2021, 13, 4227. [Google Scholar] [CrossRef]
  20. Fan, J.; Kato, H.; Yang, Z.; Li, Y. Effects From Expanding High-Speed Railway Network on Regional Accessibility and Economic Productivity in China. Transp. Res. Rec. 2022, 2676, 145–160. [Google Scholar] [CrossRef]
  21. Xu, J.; Zhang, M.; Zhang, X.; Wang, D.; Zhang, Y. How does City-cluster high-speed rail facilitate regional integration? Evidence from the Shanghai-Nanjing corridor. Cities 2019, 85, 83–97. [Google Scholar] [CrossRef]
  22. Borzacchiello, M.T.; Nijkamp, P.; Koomen, E. Accessibility and urban development: A grid-based comparative statistical analysis of Dutch cities. Environ. Plan B Plan Des. 2010, 37, 148–169. [Google Scholar] [CrossRef] [Green Version]
  23. Luo, H.N.; Qian, Y.S.; Zeng, J.W.; Wei, X.T.; Guang, X.P. An Empirical Analysis of Logistics Corridors and Regional Economic Spatial Patterns from the Perspective of Compressive Transportation between Urban Agglomerations. Land 2022, 11, 726. [Google Scholar] [CrossRef]
  24. Yhee, H.; Kim, S.; Kang, S. GIS-Based Evaluation Method for Accessibility of Social Infrastructure Facilities. Appl. Sci. 2021, 11, 5581. [Google Scholar] [CrossRef]
  25. Cui, M.Y.; Levinson, D. Accessibility and the Ring of Unreliability. Transp. A Transp. Sci. 2018, 14, 4–21. [Google Scholar] [CrossRef] [Green Version]
  26. Bhatt, D. GIS and Gravity Model-Based Accessibility Measure for Delhi Metro. Ijst-T Civ. Eng. 2022. [Google Scholar] [CrossRef]
  27. Gharaibeh, A.A.; Tawil, H.S.; Alomari, A.H. Developing an indicative spatial accessibility analysis tool for urban public transportation system. Case Stud. Transp. Policy 2022, 10, 175–186. [Google Scholar] [CrossRef]
  28. Li, S.; Gong, J.; Deng, Q.; Zhou, T. Impacts of the Qinghai-Tibet Railway on Accessibility and Economic Linkage of the Third Pole. Sustainbility 2018, 10, 3982. [Google Scholar] [CrossRef] [Green Version]
  29. Falk, M. A gravity model of foreign direct investment in the hospitality industry. Tour. Manag. 2016, 55, 225–237. [Google Scholar] [CrossRef]
  30. Djankov, S.; Freund, C. Trade Flows in the Former Soviet Union, 1987 to 1996. J. Comp. Econ. 2002, 30, 76–90. [Google Scholar] [CrossRef]
  31. Akter, H.; Akhtar, S.; Ali, S. Tourism demand in Bangladesh: Gravity model analysis. Tourism 2017, 65, 346–360. [Google Scholar]
  32. Hussain, Z.; Raza, S.H.; Shaheen, W.A. Trade, Infrastructure and Geography: An Application of Gravity Model on Asian Economies. Int. J. Transp. Econ. 2020, 47, 145–169. [Google Scholar] [CrossRef]
  33. Yu, Y.; Han, Q.W.; Tang, W.W.; Yuan, Y.B.; Tong, Y. Exploration of the Industrial Spatial Linkages in Urban Agglomerations: A Case of Urban Agglomeration in the Middle Reaches of the Yangtze River, China. Sustainbility 2018, 10, 1469. [Google Scholar] [CrossRef] [Green Version]
  34. Wang, J.; Jiao, J.; Jin, F. Spatial effects of high-speed rails on interurban economic linkages in China. Acta Geogr. Sin. 2014, 69, 1833–1846. [Google Scholar] [CrossRef]
  35. Sun, W.; Wang, C.; Liu, C.G.; Wang, L. High-Speed Rail Network Expansion and Its Impact on Regional Economic Sustainability in the Yangtze River Delta, China, 2009–2018. Sustainbility 2022, 14, 155. [Google Scholar] [CrossRef]
  36. Tao, Z.M. Research on the Degree of Coupling between the Urban Public Infrastructure System and the Urban Economic, Social, and Environmental System: A Case Study in Beijing, China. Math. Probl. Eng. 2019, 2019, 8206902. [Google Scholar] [CrossRef]
  37. Hu, Y.Q.; Chen, Y.Z. Coupling of Urban Economic Development and Transportation System: An Urban Agglomeration Case. Sustainbility 2022, 14, 3808. [Google Scholar] [CrossRef]
  38. Huang, Y.S.; Shen, L.; Liu, H. Grey relational analysis, principal component analysis and forecasting of carbon emissions based on long short-term memory in China. J. Clean Prod. 2019, 209, 415–423. [Google Scholar] [CrossRef]
  39. Vale, D.S.; Viana, C.M.; Pereira, M. The extended node-place model at the local scale: Evaluating the integration of land use and transport for Lisbon’s subway network. J. Transp. Geogr. 2018, 69, 282–293. [Google Scholar] [CrossRef]
  40. Wang, X.P.; Song, J.N.; Duan, H.Y.; Wang, X.E. Coupling between energy efficiency and industrial structure: An urban agglomeration case. Energy 2021, 234, 121304. [Google Scholar] [CrossRef]
  41. Lu, H.; Zhou, L.; Chen, Y.; An, Y.; Hou, C. Degree of coupling and coordination of eco-economic system and the influencing factors: A case study in Yanchi County, Ningxia Hui Autonomous Region, China. J. Arid. Land 2017, 9, 446–457. [Google Scholar] [CrossRef] [Green Version]
  42. Zhang, Q.; Shen, J.; Sun, F. Spatiotemporal differentiation of coupling coordination degree between economic development and water environment and its influencing factors using GWR in China’s province. Ecol. Model. 2021, 462, 109794. [Google Scholar] [CrossRef]
  43. Chu, N.; Zhang, P.; Wu, X. Spatiotemporal evolution characteristics of urbanization and its coupling coordination degree in Russia—perspectives from the population, economy, society, and eco-environment. Environ. Sci. Pollut. Res. 2022. [Google Scholar] [CrossRef]
  44. Tomal, M. Evaluation of coupling coordination degree and convergence behaviour of local development: A spatiotemporal analysis of all Polish municipalities over the period 2003–2019. Sustain. Cities Soc. 2021, 71, 102992. [Google Scholar] [CrossRef]
  45. Zhang, T.; Li, L. Research on temporal and spatial variations in the degree of coupling coordination of tourism-urbanization-ecological environment: A case study of Heilongjiang, China. Env. Dev. Sustain. 2021, 23, 8474–8491. [Google Scholar] [CrossRef]
  46. Zheng, J.; Hu, Y.; Boldanov, T.; Bazarzhapov, T.; Meng, D.; Li, Y.; Dong, S. Comprehensive assessment of the coupling coordination degree between urbanization and ecological environment in the Siberian and Far East Federal Districts, Russia from 2005 to 2017. Peerj 2020, 8, e9125. [Google Scholar] [CrossRef]
  47. Li, Q.; Su, Y.; Pei, Y.; Ieee Computer, S.O.C. Research on Coupling Coordination Degree Model between Upstream and Downstream Enterprises. In Proceedings of the 1st International Conference on Information Management, Innovation Management and Industrial Engineering, Taipei, Taiwan, 19–21 December 2008; pp. 172–175. [Google Scholar]
  48. Dong, F.; Li, W. Research on the coupling coordination degree of “upstream-midstream-downstream” of China’s wind power industry chain. J. Clean Prod. 2021, 283, 124633. [Google Scholar] [CrossRef]
  49. Li, C.; Gao, X.; He, B.-J.; Wu, J.; Wu, K. Coupling Coordination Relationships between Urban-industrial Land Use Efficiency and Accessibility of Highway Networks: Evidence from Beijing-Tianjin-Hebei Urban Agglomeration, China. Sustainbility 2019, 11, 1446. [Google Scholar] [CrossRef] [Green Version]
  50. Liu, W.; Wang, J. Evaluation of coupling coordination degree between urban rail transit and land use. Int. J. Commun. Syst. 2021, 34, e4015. [Google Scholar] [CrossRef]
  51. Tomal, M. Analysing the coupling coordination degree of socio-economic-infrastructural development and its obstacles: The case study of Polish rural municipalities. Appl. Econ. Lett. 2021, 28, 1098–1103. [Google Scholar] [CrossRef]
  52. Du, Q.; Wang, X.; Li, Y.; Zou, P.X.W.; Han, X.; Meng, M. An analysis of coupling coordination relationship between regional economy and transportation: Empirical evidence from China. Environ. Sci. Pollut. Res. 2022, 22, 34360–34378. [Google Scholar] [CrossRef]
  53. Hunan Investigation Team of the National Bureau of Statistics. Hunan Statistical Yearbook; China Statistics Press: Beijing, China, 2020. [Google Scholar]
  54. Hunan Investigation Team of the National Bureau of Statistics. Hunan Statistical Yearbook; China Statistics Press: Beijing, China, 2009. [Google Scholar]
  55. Dingil, A.E.; Esztergar-Kiss, D. The Influence of the Covid-19 Pandemic on Mobility Patterns: The First Wave’s Results. Transp. Lett. Int. J. Transp. Res. 2021, 13, 434–446. [Google Scholar] [CrossRef]
Figure 1. The 2019 Hunan High-speed Rail Network.
Sustainability 14 07550 g001
Figure 2. Spatial Change Analysis of Accessibility in (a) 2008 and (b) 2019. (c) is the change rate of accessibility.
Sustainability 14 07550 g002
Figure 3. Spatial Changing Analysis of Economic Linkages in (a) 2008 and (b) 2019.
Sustainability 14 07550 g003
Figure 4. Spatial Distribution of Coupling Coordination Level between Accessibility and Economic Linkage in (a) 2008 and (b) 2019.
Sustainability 14 07550 g004
Figure 5. Accessibility and Economic Linkage Coupling Classification Chart.
Sustainability 14 07550 g005
Table 1. Coupling coordination range and level.
CCDCoordination Level
0 < D ≤ 0.2Extreme imbalance
0.2 < D ≤ 0.4Slight imbalance
0.4 < D ≤ 0.5Approaching imbalance
0.5 < D ≤ 0.7Primary coordination
0.7 < D ≤ 0.9Intermediate coordination
0.9 < D ≤ 1High coordination
Table 2. Weighted average travel time in Hunan Province.
CityWeighted Average Travel TimeAccessibility Coefficient
Before HSR (min)After HSR (min)Reduction Rate %Before HSR %After HSR %
Changsha132.6944.3366.590.600.37
Zhuzhou130.1676.0941.540.590.63
Xiangtan158.3273.6953.450.710.61
Hengyang168.6086.0448.970.760.71
Shaoyang252.4779.0968.671.140.66
Yueyang213.7494.5155.780.960.78
Changde218.58187.7514.110.991.56
Zhangjiajie401.48260.6035.091.812.16
Yiyang171.82156.958.660.781.30
Chenzhou260.44128.4850.671.181.06
Yongzhou247.15144.8941.381.121.20
Huahuai364.16157.1056.861.641.30
Loudi160.0579.7350.190.720.66
Table 3. Total economic linkage by city in Hunan Province.
CityTotal Economic Linkages
Before HSRRankingAfter HSRRankingRate of Change (%)
Changsha1701.37136,844.56121.66
Zhuzhou1313.62215,242.67311.60
Xiangtan667.42316,723.06225.06
Hengyang381.8948963.25423.47
Shaoyang142.98108570.29559.94
Yueyang351.9355814.7876.52
Changde222.1471139.60125.13
Zhangjiajie15.811392.93135.88
Yiyang332.1961518.45114.57
Chenzhou124.71113322.65826.64
Yongzhou152.1791616.721010.62
Huahuai29.89121862.12962.30
Loudi215.8088113.40637.60
Table 4. Coupling types of cites in Hunan Province.
CityThe Coupling of Accessibility and Economic Linkage Intensity in Harmony
Before HSRCoordination LevelAfter HSRCoordination Level
Changsha0.998High coordination1.000High coordination
Zhuzhou0.925High coordination0.746Intermediate coordination
Xiangtan0.740Intermediate coordination0.769Intermediate coordination
Hengyang0.623Primary coordination0.633Primary coordination
Shaoyang0.430Approaching imbalance0.631Primary coordination
Yueyang0.582Primary coordination0.556Primary coordination
Changde0.508Primary coordination0.310Slight imbalance
Zhangjiajie0.100Extreme imbalance0.100Extreme imbalance
Yiyang0.597Primary coordination0.358Slight imbalance
Chenzhou0.409Approaching imbalance0.457Approaching imbalance
Yongzhou0.441Approaching imbalance0.372Slight imbalance
Huahuai0.209Slight imbalance0.375Slight imbalance
Loudi0.535Primary coordination0.621Primary coordination
Publisher’s Note: MDPI stays neutral with regard to jurisdictional claims in published maps and institutional affiliations.

