Article

Environmental Performance Reporting and Assessment of the Biodegradable Waste Treatment Plants Registered to EMAS in Italy

Department of Engineering for Environment, Land, and Infrastructures DIATI, Politecnico di Torino, Corso Duca degli Abruzzi 24, 10129 Turin, Italy
*
Author to whom correspondence should be addressed.
Sustainability 2022, 14(12), 7438; https://doi.org/10.3390/su14127438
Submission received: 11 May 2022 / Revised: 11 June 2022 / Accepted: 13 June 2022 / Published: 17 June 2022
(This article belongs to the Special Issue Techno-Sustainable Biowaste Management Strategy)

Abstract

:
This study investigates how the environmental performances of biodegradable waste (e.g., organic fraction of municipal solid waste, green waste, agro-industrial waste) treatment plants are reported and how their improvement is planned by the managing companies, and assesses current key quantitative data versus the Best Available Techniques associated emission levels (BAT-AELs). Based on their Environmental Statements (ESs), 16 installations registered to EMAS in Italy in 2021 were analyzed. A set of 15 technical-environmental-social key aspects was described through 131 different indicators. Emissions to air, odor emissions, energy consumption/production, waste production and water consumption were the only key aspects considered significant and quantified by at least 50% of the ESs. Improvement targets were set by 38% of the companies for process management, and by 25% for emissions to air, for a total allocated budget of 25.2 M€. Odor emissions were mostly below the lower BAT-AELs, while NH3 concentration values were slightly above the lower BAT-AELs, demonstrating good performance levels and an overall improvement trend in the period 2018–2020 (−6% and −33.6%, respectively). This study provides interesting hints on the environmental performances of biodegradable waste treatment plants, also contributing to raise the trust of the wide public towards this waste treatment sector.

1. Introduction

In Europe (EU-28) in 2018, 252.4 Mt of municipal solid waste (MSW) was generated [1], including 140 Mt of biodegradable waste [2]. The per capita production of biodegradable waste recorded in 2020 in Europe (EU-27) was 546 kg [3]. Biodegradable waste is defined as “any waste capable of undergoing anaerobic or aerobic decomposition” [4], meaning the organic fraction of MSW (OFMSW), green waste from gardens and parks, sewage sludge, paper and paperboard, and more. Biodegradable waste should not be confused with the narrower term “biowaste”, i.e., green waste, food waste from households, restaurants, caterers and retail premises, and waste from food processing plants [5]. The disposal of food waste alone was estimated to be responsible for 186 Mt of CO2 equivalent emissions in Europe [6]. The United Nation’s 2030 Agenda established 17 Sustainable Development Goals (SDGs), and several can be linked to waste management [7,8]. Among them, SDG 11 (Sustainable cities and communities) calls for a reduction of waste management impact, SDG 12 (sustainable consumption and production) requests reductions in food waste and agricultural and food-industry losses, and SDG 7 (affordable and clean energy) can be supported by waste-to-energy technologies [9]. In the 8th Environmental Action Programme [10] by the European Commission (EC), extensive focus is given to the transition to a circular economy. A circular economy requires improved and efficient waste management strategies [11], and a key role belongs to biodegradable waste.
Even if paper/cardboard and textiles may also be recycled, the treatment of biodegradable waste is generally based on aerobic or anaerobic microorganisms that decompose waste into simpler organic compounds, CO2 and water, and methane from anaerobic processes. Those treatments are usually fed by OFMSW, green waste, and sewage sludge. Aerobic treatments produce compost, which is valuable as a soil conditioner, while anaerobic treatments produce biogas and digestate, which may be applied to soil as a conditioner or sent for composting. In 2018, 58.6% of the biodegradable waste produced in the EU-28 was recycled or composted, 26.8% was used for biogas or energy production, 12.2% was disposed of in landfills, 1.9% was incinerated, and 0.5% was destined for other treatments [3]. Differences among the member states are significant [3]: in 2018, virtuous countries such as Germany, Italy, Netherlands, and Sweden recycled or recovered energy from more than 96% of biodegradable waste, while Romania, Greece, the Czech Republic, and Bulgaria landfilled over 40% of biodegradable waste.
Extensive research has been dedicated to assessing the environmental performance of specific technological options to valorize biodegradable waste. For instance, anaerobic digestion and incineration with energy recovery were compared in relation to the primary energy produced and CO2 equivalent emissions [12]. Life-Cycle Assessment (LCA) was used to evaluate the conversion of different biodegradable wastes into biofuel [13,14], or the use of woody biomass for polyphenols extraction [15] and soil amelioration [16]. Some studies described the environmental performance of specific technological approaches, such as anaerobic digestion coupled with a combined heat and power plant [17]. Other studies analyzed the environmental performance of biodegradable waste treatments in specific geographical contexts, for instance sub-Saharan Africa [18] and Sweden [19]. Although LCA has become extremely popular, it has some documented limitations. Firstly, it may present significant weaknesses related to data quality and reliability [20,21]. In addition, how system boundaries are drawn significantly influences the results, especially when waste biomass is considered [22], since clarifications on whether to include or exclude the activities occurring before its collection are necessary [23]. Furthermore, LCA results are specific to the considered context and only valid for the analyzed case study [19].
To the best of our knowledge, in the scientific literature, there is a lack of focus on how the companies in the biodegradable waste management sector evaluate their environmental impacts and plan to improve their environmental performance. This work analyses the metrics and current levels of environmental performance and the objectives set for its improvement by the Italian biodegradable waste treatment plants registered to the European Eco-Management and Audit Scheme (EMAS). EMAS [24] is, along with ISO 14001 [25], the voluntary international standard for the implementation of environmental management systems. Unlike ISO 14001, EMAS requires organizations to annually publish the relevant environmental information of the registered installations in an Environmental Statement (ES), which is then validated by an independent environmental verifier. Compared to existing literature, the main novelties of this work are the use of publicly available and independently validated and certified data [26,27], and the emphasis on how the companies in the biodegradable waste management sector assess their environmental performance and plan to improve them.
This study is based on the data included in the ESs of the EMAS registered plants operating in the biodegradable waste treatment sector in Italy in 2021. The Italian sector was chosen as a case study representative in the European context of the countries that are more virtuous in managing biodegradable waste [3]. The environmental assessment presented here was aimed at: (i) identifying the performance indicators and metrics used by the companies to describe the environmental impacts of their plants; (ii) analyzing which aspects, how, and to what extent are these companies committed to improving their environmental performances; and (iii) comparing the environmental performances of those plants to the Best Available Techniques associated emission levels (BAT-AELs), defined by the Best Available Techniques Reference Document (BREF) for waste treatment [28].

2. Methodology

2.1. Inventory

An inventory of the Italian plants treating biodegradable waste and registered to EMAS in 2021 was compiled in the form of an Excel database. The inventory was obtained by cross-checking the database of the National Environmental Agency of waste management companies [29,30] with the National Register of the EMAS-certified sites [31], considering the NACE codes “E38.2.x” (i.e., waste treatment and disposal). The ESs of the identified plants were screened to exclude those not matching the research scope. Specifically, the plants performing mechanical biological treatment were excluded since their feedstock is generally not exclusively composed of biodegradable waste, but includes mixed and unsorted waste.

2.2. Data analysis

2.2.1. Technical Features of the Plants

The technical features of the selected plants were analyzed, collecting data about process management (capacity, feedstock, technical characteristics of the aerobic and anaerobic processes implemented), and exhaust air treatment. The feedstock was categorized into OFMSW, green waste from parks and gardens, agro-industrial and livestock waste, sewage sludge, wood and paper waste, and other waste.

2.2.2. Reporting on Key Aspects

The data reported by the companies in the ESs, describing 15 environmental, technical and social key aspects (emissions to air/water, odor/noise emissions, waste production, raw materials/energy/water consumption, effects on biodiversity, risks of environmental accidents, soil contamination, stakeholder engagement, transport, process management, and energy production) were analyzed as follows:
  • Identification of the relevance of each aspect as assessed by each company, leading to a classification as “significant” or “non-significant”;
  • Identification of the specific metrics and indicators used for the quantification of each aspect (with a specific insight devoted to the reporting of greenhouse gas (GHG) emissions);
  • Identification of the improvement objectives set for each aspect in 2017–2020, including related actions, metrics, and allocated budget.

2.2.3. Environmental Performance Analysis

To analyze and compare the environmental performances of the selected plants, four key performance indicators (KPIs) were adopted. The first two KPIs were odor and NH3 concentrations in the exhaust air, the only indicators described by BAT-AELs in the BREF for waste treatment [28]. Only the plants that monitored odor and NH3 concentrations in the exhaust air continuously, or at least three times per year, were considered, since intermittent sampling is characterized by bias increasing at low sampling frequencies [32]. The resulting yearly average values were then compared to the associated BAT-AELs. The other two KPIs adopted for the comparison were the compost and biogas specific (per ton of treated biodegradable waste) productions.
Quantitative data, expressed as yearly average values for each of the 4 KPIs, were collected from the ESs of each plant. For all KPIs, the trends were evaluated, also determining the variations compared to the baseline levels reported for 2018. The presence of linear correlations among the environmental performances reported for the four KPIs and the plants’ characteristics was investigated through a correlation test, and correlations having p < 0.05 were considered significant. The observed correlations were finally compared with the scientific literature and the information reported in the BREF for waste treatment [28].

3. Results and Discussion

A total of 24 biodegradable waste treatment installations were registered to EMAS in 2021 (5.2% of the total listed in the databases of the National Environmental Agency). The adoption of the EMAS certification in the Italian biodegradable waste management sector is low, but considerably higher compared to the overall European waste management sector, which is below 1% [33]. However, 5.2% is remarkably lower than the 73.0% EMAS adoption rate of the Italian waste incineration sector [34], possibly due to the high public resistance faced by the waste incineration companies. This difference may suggest that, among the reasons influencing EMAS adoption [35,36], improving company image and relationships with local communities have a significant role.
Out of the 24 EMAS-registered plants, 16 were selected after screening the ESs, as 8 plants either performed a mechanical biological treatment of MSW or did not disclose relevant data regarding the treatment of biodegradable waste in their ESs.

3.1. Technical Features of the Plants

All plants performed aerobic processes, while 7 out of 16 were also anaerobic. Six companies announced plans to add an anaerobic section to their facility in the future. The feedstock of the biodegradable waste treatment plants was mostly composed of OFMSW (71% of the total), followed by green waste (18%) and sewage sludge (5%) (Table 1), while the composition of the treated waste was not disclosed by 4 plants. The plants that only performed aerobic digestion treated mostly OFMSW (65% of the total) with a significant amount of green waste (21%) and wood and paper waste (8%). The plants that implemented anaerobic digestion treated less green waste (15% of the total), and no wood and paper waste, offset by an increase in the amount of OFMSW (76%) and sewage sludge (8%) treated. For aerobic digestion, 69% of the plants adopted static windrows and 31% adopted dynamic windrows. Out of the 7 plants also performing anaerobic digestion of the biodegradable waste, 2 implemented a wet digestion, and 4, a dry digestion in batch reactors under mesophilic conditions. Regarding exhaust air treatment, 15 plants adopted biofilters, and fewer added other devices (wet scrubber, bag filter, cyclone, water spray). One plant used a wet scrubber as the only solution for exhaust air treatment. Overall, the plants had a waste treatment capacity of nearly 1022 t/y, while at single plant level, the capacity varied from 6 to 490 t/y (median value 40.2).

3.2. Reporting on Key Aspects (Significance, Indicators, and Improvement Objectives)

Table 2 summarizes the data related to the 15 environmental and technical key aspects disclosed in the ESs. Emissions to air, odor emissions, energy consumption, waste production and water consumption were the only key aspects considered significant by at least 50% of the organizations. The same aspects were also the most quantified, along with energy production, accounting for 69% of the 131 different environmental performance indicators reported in the ESs. A strong positive correlation was found between the significance of a single aspect and the total number of indicators used to describe it: r(13) = 0.77, p < 0.001). The aspect of noise emissions was considered significant only by the companies managing composting plants (50% of the total). This is possibly related to the fact that green waste shredding and compost packaging, recognized in some ESs as the most impactful activities regarding noise emissions, are performed on a larger scale in those plants. Unexpectedly, noise emissions were quantified only in the ESs of aerobic-anaerobic digestion plants. On the contrary, the aspect of energy production was considered significant and quantified exclusively by plants performing anaerobic digestion due to their biogas production.
The improvement targets and the allocated budget followed a significantly different distribution compared to significance and indicators. In detail, the technical aspects related to process management exhibited the highest number of objectives (11 out of 44), and the highest target occurrence rate in the ESs (61.5% reported at least one related improvement objective). Otherwise, for the aspects considered most significant (emissions to air, odor emissions, energy consumption, waste production, and water consumption), a total of 19 improvement objectives out of 44 were set. Improvement objectives were also set for the aspects energy production (3 objectives), risks of environmental accidents (3), and releases to water (5).
Process management also had the highest allocated budget (17.2 M€), followed by emissions to the air (5.6 M€). Those two aspects accounted for over 90% of the total allocated budget (25.2 M€), primarily due to the high resources assigned to expensive technical interventions such as refurbishing the processes or substituting equipment. The average budget allocated to a single objective targeting the improvement of these two aspects was equal to 2148 and 1867 k€, respectively. No correlation was found between the significance attributed to the mentioned key aspects and the budget allocated for their improvement. Although the number of improvement objectives and amount of allocated budget regarding a few aspects differed for plants performing only aerobic or aerobic-anaerobic digestion, none of those discrepancies could be attributed to the differences in the plants’ processes.

3.2.1. Metrics and Indicators Used to Quantify the Aspects

A total of 131 different indicators were found in the analyzed ESs. No indicator was reported by all companies, but recurring environmental metrics were observed. The most used indicator, “total annual mass of waste produced”, was found in 8 ESs, followed by “total annual electricity consumption”, “total annual electricity production”, and “total annual mass of waste produced per typology”, all reported in 6 ESs. Emissions to air was the environmental aspect exhibiting the highest number of indicators (29). The list of the environmental performance indicators found in at least two different ESs (Table 3) represents a valuable reference set of metrics to describe the environmental performance of biodegradable waste treatment plants.

3.2.2. GHG Emissions

The reporting of GHG emissions was sufficiently detailed and explained only in a few ESs (Table 4). Of the 11 ESs reported quantitative data on produced GHG emissions, only eight ESs also disclosed specific information on related sources. Four plants reported the GHG emissions attributed to the biological process (i.e., CO2 emitted during composting or contained in the biogas produced), while four and six plants reported the estimated emissions due to energy consumption and use of fuel, respectively. The emissions related to the combustion of biogas were not reported, since it is considered carbon neutral [37].
None of the organizations considered the GHG emissions related to waste collection and transportation to the plant. This omission is remarkable since, for instance, the managing company of the “La” plant estimated that the emissions related to waste collection and transportation accounted for 70% of the total, in line with results available in the scientific literature [38]. The contribution to GHG emissions of the disposal of the waste originating from the plant’s activities was also neglected in all ESs.
On the other hand, the avoided GHG emissions were quantified in 6 ESs. Six out of seven plants that produced biogas estimated the GHG emissions related to the production of the recovered energy considering the Italian energy mix, and three plants also estimated the GHG emissions associated with the production of conventional fertilizers. None of the ESs estimated the avoided GHG emissions related to the landfill disposal of the waste treated in the plant.

3.2.3. Improvement Objectives

Table 5 lists the improvement objectives set by the organizations managing the 16 biodegradable waste treatment plants considered in the study. A large variability of actions was found among the improvement objectives set by the different companies. “Performance improvement through renovation” was the objective with the highest occurrence (6 out of 16 ESs), associated with the aspect of process management. Improvement objectives with two occurrences were found for the following aspects: releases to water, waste production, energy consumption, and energy production. Interestingly, the aspect of emissions to air, despite being considered significant by most companies and quantified with the highest number of indicators, was targeted by relatively few (4 out of 16 ESs) and different (each occurring only in 1 ES) improvement objectives, mainly related to GHG emissions reduction.

3.3. Environmental Performances’ Analysis

3.3.1. Compost and Biogas Specific Production

Considering the 10 plants reporting quantitative data on compost production from 2018 to 2020, the average value of specific compost production (i.e., tons of compost per ton of treated biodegradable waste) was 0.140 ± 0.074 t/t. While the total amount of produced compost increased by 7.2%, in the same period an 11.6% decrease in the average specific compost production was recorded (0.144 ± 0.063 t/t in 2020). As expected, the plants that focused only on aerobic treatment had a significantly higher specific compost production (0.178 ± 0.057 t/t) than the ones that also performed anaerobic digestion (0.093 ± 0.029 t/t) (Figure 1). The plants that employed static windrows exhibited higher specific compost production (0.169 ± 0.036 t/t) than those using dynamic windrows (0.090 ± 0.031). However, three out of the four plants that adopted dynamic windrows performed both aerobic and anaerobic processes, heavily influencing this result.
The biogas production during the period 2018–2020 was reported by six plants, with an average specific biogas production equal to 55.9 ± 18.9 Nm3 per ton of treated waste. The total biogas production was almost constant during this 3 year period (−0.1%), while the specific biogas production increased by 8.2% (57.7 ± 18.1 Nm3/t in 2020). A very strong positive correlation was found, although available data was scarce, between the specific biogas production and the percentage of OFMSW among the waste treated, r(3) = 0.91, p = 0.034. This result was expected as the analyzed plants that treated less OFMSW processed more green waste or sewage sludge. Those biomasses are characterized by a higher lignin and a lower organic content, respectively, both associated with lower biogas yields [39,40].
No linear correlation was observed between the specific compost production and the specific biogas production for the six plants performing both aerobic and anaerobic digestion. No linear correlation was also found between plant capacity and specific compost and biogas production.

3.3.2. Odor Emissions and Emissions to Air

Figure 2 presents the yearly average concentrations of odor and NH3 in the exhaust air. When data from more than one emission point were available (e.g., reception area, composting shed, packing area), the highest emission levels were considered in the analysis. Figure 3 compares the performances of the single plants for the two parameters.
The average odor emissions of the seven plants that reported quantitative data from 2018 to 2020 were 151 ± 35 OUE/Nm3 in 2020 (−6.0% from 2018). Odor emissions were excellent compared to the BREF reference values, and generally the plants performed below the lower BAT-AEL (200 OUE/Nm3). Exceptions were the “La” plant, characterized by odor concentrations slightly above the lower BAT-AEL (217 OUE/Nm3 in 2020), and the “Sd” plant, which reported 354 OUE/Nm3 in 2017 followed by considerably lower results in the following years. Odor emissions were lower in plants that performed aerobic and anaerobic digestion (148.1 ± 20.7 OUE/Nm3 in 2020) than in plants that only performed aerobic digestion (179.3 ± 35.5 OUE/Nm3 in 2020), although the scarcity of the data must be noted. In the plants that perform aerobic and anaerobic digestion of biodegradable waste, the lack of air flows in the anaerobic digesters and their gas-tight seals could limit odor emissions during the anaerobic stage. Furthermore, the anaerobic digestate used by those plants in the following aerobic stage should be a weaker source of odor emissions than untreated biodegradable waste [41].
The average NH3 emissions of the 8 plants that reported quantitative data from 2018 to 2020 were 1.35 ± 1.36 mg/Nm3 in 2020, with a 33.6% decrease from the 2018 levels heavily influenced by the 99.4% reduction of the “Es” plant’s emission levels in the same period. NH3 emissions were generally slightly higher than the lower BAT-AEL (0.3 mg/Nm3) and always significantly below the upper BAT-AEL (20 mg/Nm3). No significant linear correlation between the plants’ technical characteristics and their NH3 emission levels could be observed.

4. Conclusions

This work analyzed 16 installations treating biodegradable waste in Italy and registered to EMAS in 2021, based on the public verified and certified data presented in their Environmental Statements (ESs), with the aim of investigating three main issues:
(i)
Identification of the performance indicators and metrics used by the companies to describe the environmental impacts of their plants: The key aspects considered significant and quantified in the ESs by at least 50% of the organizations were emissions to air, odor emissions, energy consumption, and waste production. A strong positive correlation linked the significance of specific key aspects and the number of related indicators. Produced and avoided GHG emissions were reported in 69% and 38% of the ESs, respectively, but crucial contributions ,such as waste transportation and disposal of the originated waste, were neglected.
(ii)
Analysis of which aspects, how and to what extent are companies committed to improving their environmental performances: Overall, the analyzed ESs declared 44 improvement objectives: 11 related to process management, and 19 related to odor emissions, emission to air, energy/water consumption, and waste production. Over 90% of the allocated budget was associated with improvements related to process management and to emissions to air, and no correlation was found between the significance of specific key aspects and the budget allocated for their improvement.
(iii)
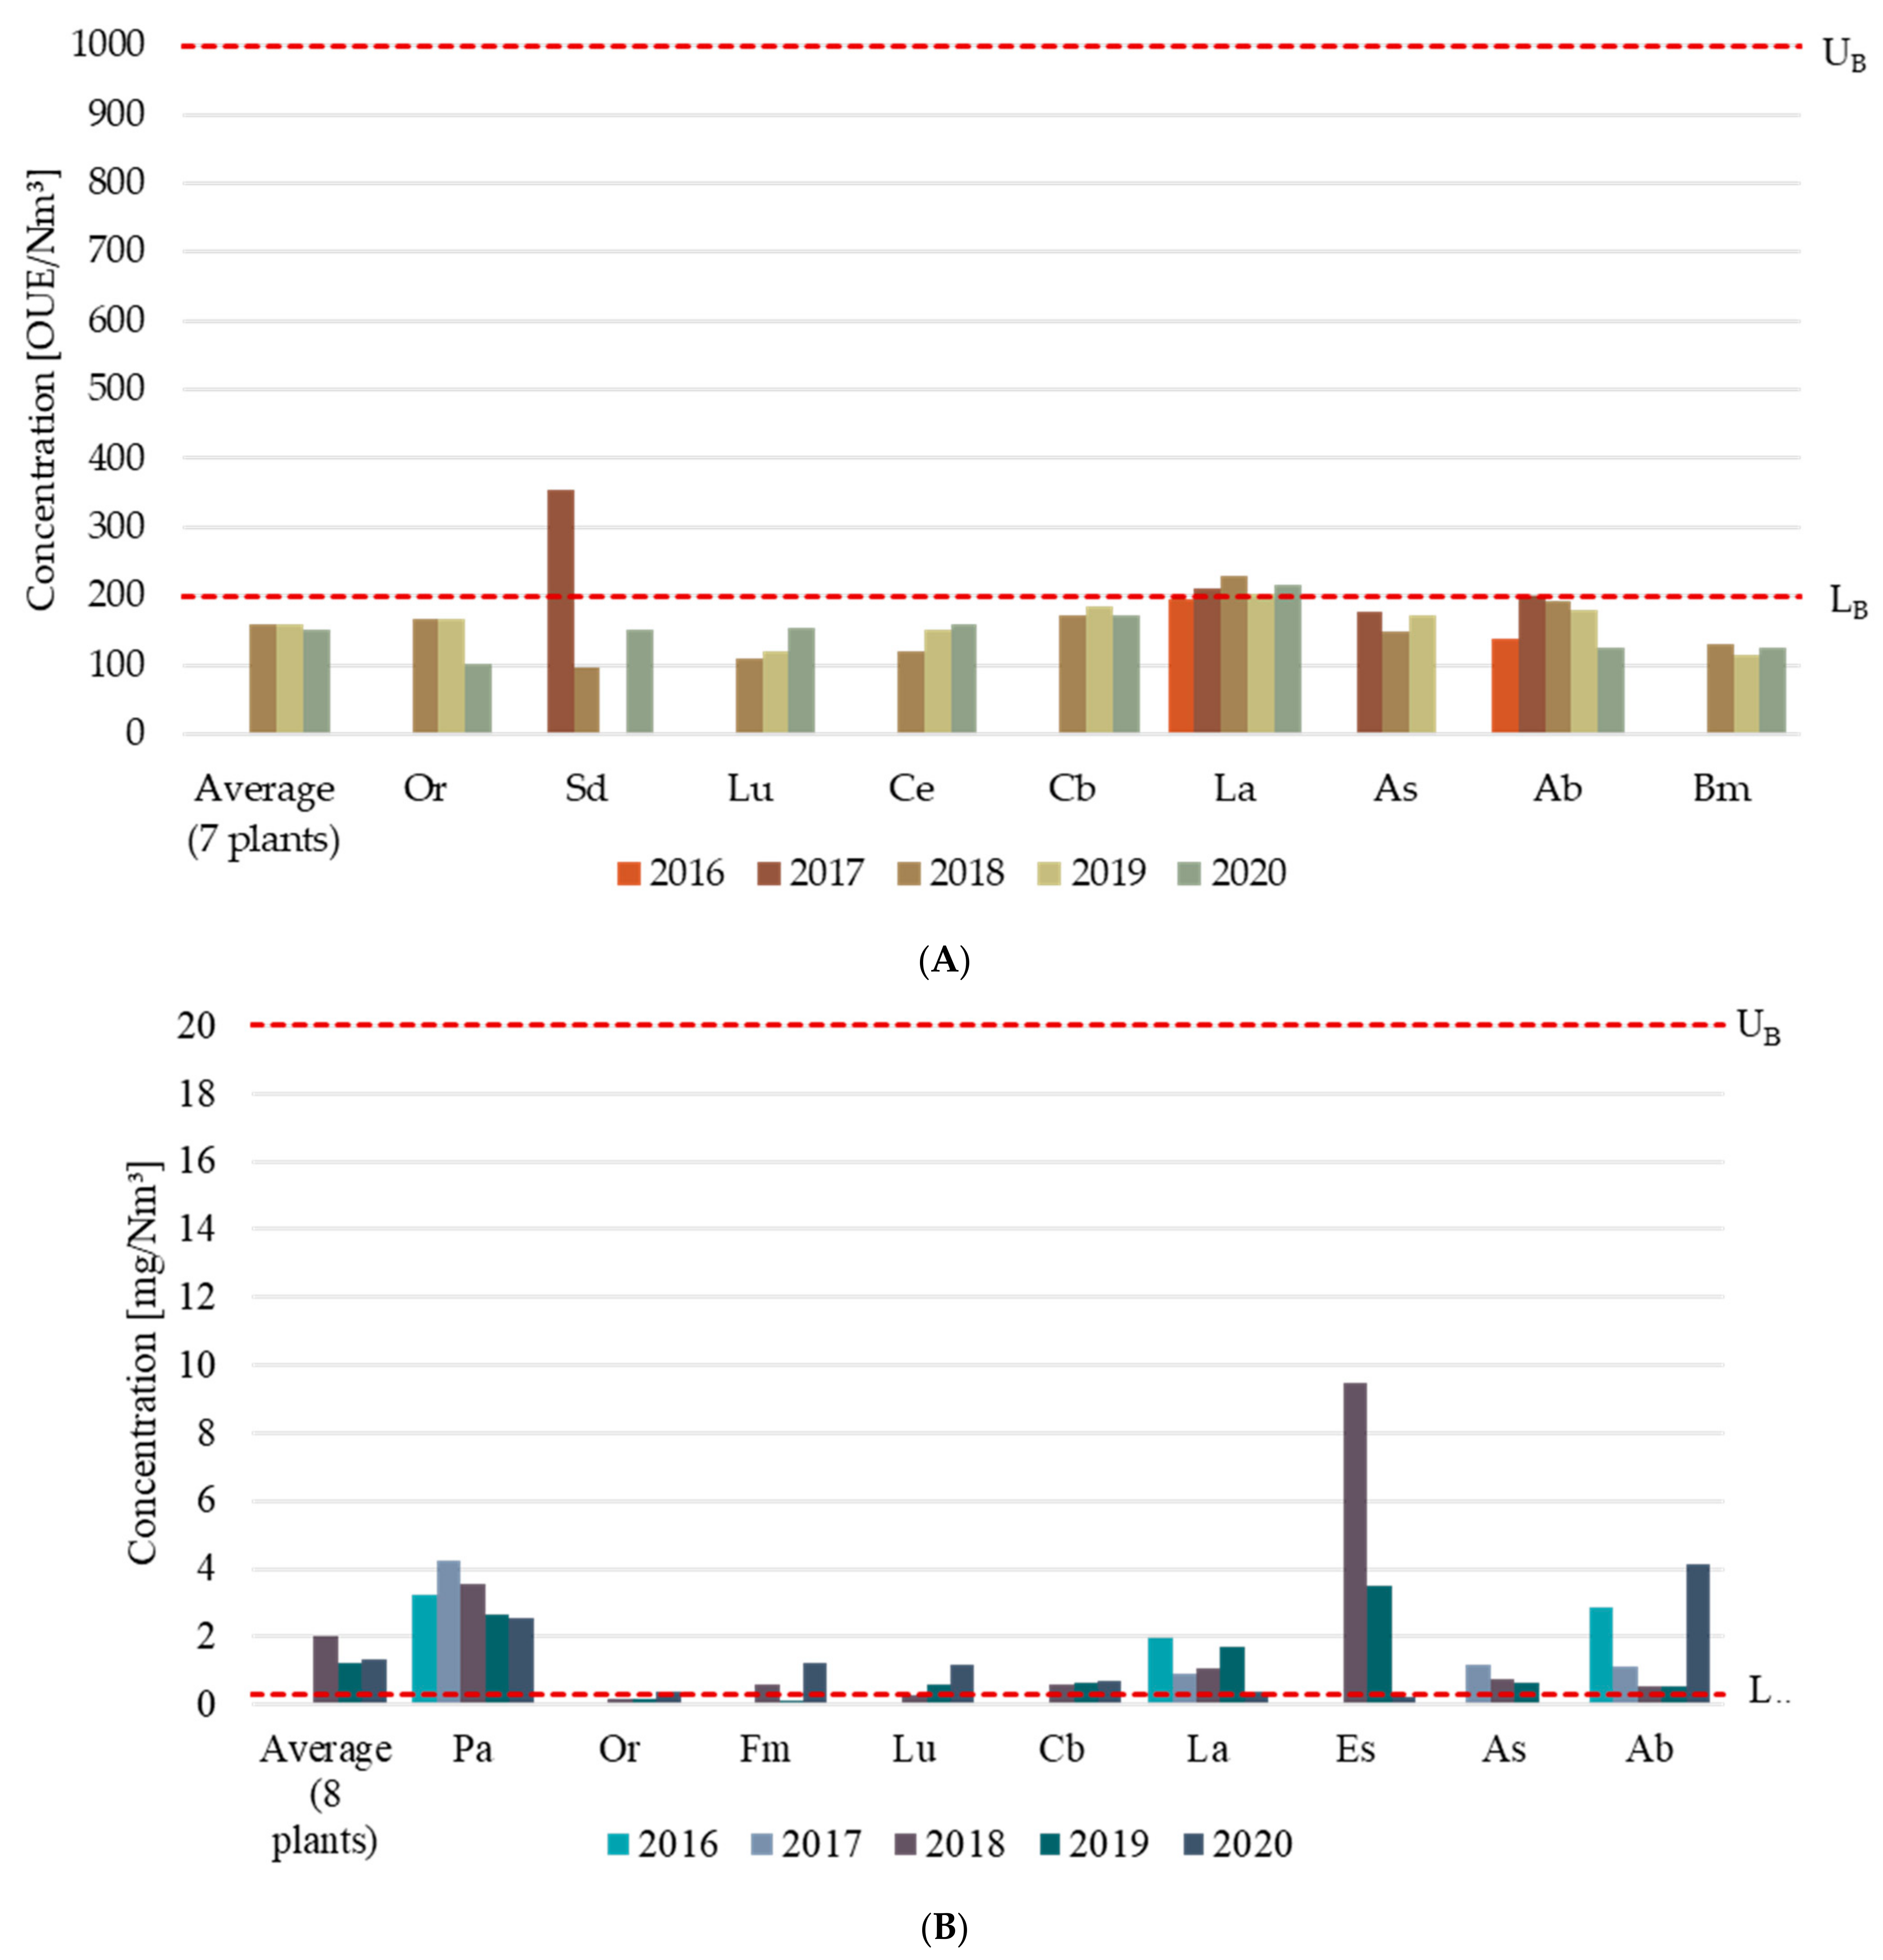
Comparison of the environmental performances of the plants to the BAT-AELs defined for odor and NH3 concentration: Odor emissions (151 ± 35 OUE/Nm3 in 2020) were mostly below the lower BAT-AEL (200 OUE/Nm3), with lower (−17%) values for anaerobic/aerobic combined processes compared with aerobic processes. NH3 concentrations in the exhaust air (1.35 ± 1.36 mg/Nm3 in 2020) were slightly above the lower (0.3 mg/Nm3) and significantly below the upper BAT-AEL (20 mg/Nm3).
This study provides several interesting indications about the environmental performance of biodegradable waste treatment plants. It showed that EMAS-registered companies had a substantial commitment to monitoring and improving their environmental performances, which are excellent compared with the associated BAT-AELs. Therefore, EMAS can be considered an efficient environmental management system to improve both the environmental performance of the registered companies and the trust of the wide public in the waste treatment sector [42]. Moreover, EMAS ESs are a source of public, verified, and certified data and allow the drawing of a quantitative and comparative environmental analysis of different installations.

Author Contributions

Conceptualization, C.C.; methodology, C.C. and S.F.; investigation, S.C.; data curation, S.C.; writing—original draft preparation, S.C.; writing—review and editing, C.C. and S.F.; visualization, S.C.; supervision, C.C. and S.F. All authors have read and agreed to the published version of the manuscript.

Funding

This research received no external funding.

Institutional Review Board Statement

Not applicable.

Informed Consent Statement

Not applicable.

Data Availability Statement

Publicly available datasets were analyzed in this study. This data can be found in the Environmental Statements concerning the analyzed plants, which can be obtained contacting the managing companies or visiting their websites.

Conflicts of Interest

The authors declare no conflict of interest.

References

  1. Eurostat Municipal Waste by Waste Management Operations. Available online: https://ec.europa.eu/eurostat/databrowser/view/ENV_WASMUN__custom_1977762/default/table?lang=en (accessed on 26 January 2022).
  2. European Commission. A Sustainable Bioeconomy for Europe: Strengthening the Connection between Economy, Society and the Environment: Updated Bioeconomy Strategy; Publications Office: Brussels, Belgium, 2018. [Google Scholar]
  3. Eurostat Management of Waste by Waste Management Operations and Type of Material-Sankey Diagram Data. Available online: https://ec.europa.eu/eurostat/databrowser/view/env_wassd/default/table?lang=en (accessed on 26 January 2022).
  4. European Commission. Council Directive 1999/31/EC of 26 April 1999 on the Landfill of Waste; European Commission: Brussels, Belgium, 1999. [Google Scholar]
  5. European Commission. Directive 2008/98/EC of the European Parliament and of the Council of 19 November 2008 on Waste and Repealing Certain Directives (Text with EEA Relevance); European Commission: Brussels, Belgium, 2008. [Google Scholar]
  6. Scherhaufer, S.; Moates, G.; Hartikainen, H.; Waldron, K.; Obersteiner, G. Environmental Impacts of Food Waste in Europe. Waste Manag. 2018, 77, 98–113. [Google Scholar] [CrossRef]
  7. Pujara, Y.; Pathak, P.; Sharma, A.; Govani, J. Review on Indian Municipal Solid Waste Management Practices for Reduction of Environmental Impacts to Achieve Sustainable Development Goals. J. Environ. Manag. 2019, 248, 109238. [Google Scholar] [CrossRef] [PubMed]
  8. Sharma, H.B.; Vanapalli, K.R.; Samal, B.; Cheela, V.R.S.; Dubey, B.K.; Bhattacharya, J. Circular Economy Approach in Solid Waste Management System to Achieve UN-SDGs: Solutions for Post-COVID Recovery. Sci. Total Environ. 2021, 800, 149605. [Google Scholar] [CrossRef] [PubMed]
  9. AlQattan, N.; Acheampong, M.; Jaward, F.M.; Ertem, F.C.; Vijayakumar, N.; Bello, T. Reviewing the Potential of Waste-to-Energy (WTE) Technologies for Sustainable Development Goal (SDG) Numbers Seven and Eleven. Renew. Energy Focus 2018, 27, 97–110. [Google Scholar] [CrossRef]
  10. European Commission. Decision (EU) 2022/591 of the European Parliament and of the Council of 6 April 2022 on a General Union Environment Action Programme to 2030; European Commission: Brussels, Belgium, 2022. [Google Scholar]
  11. Schroeder, P.; Anggraeni, K.; Weber, U. The Relevance of Circular Economy Practices to the Sustainable Development Goals. J. Ind. Ecol. 2019, 23, 77–95. [Google Scholar] [CrossRef] [Green Version]
  12. Demichelis, F.; Piovano, F.; Fiore, S. Biowaste management in Italy: Challenges and perspectives. Sustainability 2019, 11, 4213. [Google Scholar] [CrossRef] [Green Version]
  13. Demichelis, F.; Laghezza, M.; Chiappero, M.; Fiore, S. Technical, Economic and Environmental Assessement of Bioethanol Biorefinery from Waste Biomass. J. Clean. Prod. 2020, 277, 124111. [Google Scholar] [CrossRef]
  14. Osman, A.I.; Mehta, N.; Elgarahy, A.M.; Al-Hinai, A.; Al-Muhtaseb, A.H.; Rooney, D.W. Conversion of Biomass to Biofuels and Life Cycle Assessment: A Review. Environ. Chem. Lett. 2021, 19, 4075–4118. [Google Scholar] [CrossRef]
  15. Barjoveanu, G.; Pătrăuțanu, O.-A.; Teodosiu, C.; Volf, I. Life Cycle Assessment of Polyphenols Extraction Processes from Waste Biomass. Sci. Rep. 2020, 10, 13632. [Google Scholar] [CrossRef]
  16. Da Costa, T.P.; Quinteiro, P.; Tarelho, L.A.C.; Arroja, L.; Dias, A.C. Life Cycle Assessment of Woody Biomass Ash for Soil Amelioration. Waste Manag. 2020, 101, 126–140. [Google Scholar] [CrossRef]
  17. Cusenza, M.A.; Longo, S.; Guarino, F.; Cellura, M. Energy and Environmental Assessment of Residual Bio-Wastes Management Strategies. J. Clean. Prod. 2021, 285, 124815. [Google Scholar] [CrossRef]
  18. Komakech, A.J.; Sundberg, C.; Jönsson, H.; Vinnerås, B. Life Cycle Assessment of Biodegradable Waste Treatment Systems for Sub-Saharan African Cities. Resour. Conserv. Recycl. 2015, 99, 100–110. [Google Scholar] [CrossRef]
  19. Sonesson, U.; Björklund, A.; Carlsson, M.; Dalemo, M. Environmental and Economic Analysis of Management Systems for Biodegradable Waste. Resour. Conserv. Recycl. 2000, 28, 29–53. [Google Scholar] [CrossRef]
  20. Lei, H.; Li, L.; Yang, W.; Bian, Y.; Li, C.-Q. An Analytical Review on Application of Life Cycle Assessment in Circular Economy for Built Environment. J. Build. Eng. 2021, 44, 103374. [Google Scholar] [CrossRef]
  21. Zhang, J.; Qin, Q.; Li, G.; Tseng, C.-H. Sustainable Municipal Waste Management Strategies through Life Cycle Assessment Method: A Review. J. Environ. Manag. 2021, 287, 112238. [Google Scholar] [CrossRef]
  22. Seber, G.; Malina, R.; Pearlson, M.N.; Olcay, H.; Hileman, J.I.; Barrett, S.R.H. Environmental and Economic Assessment of Producing Hydroprocessed Jet and Diesel Fuel from Waste Oils and Tallow. Biomass Bioenergy 2014, 67, 108–118. [Google Scholar] [CrossRef]
  23. Olofsson, J.; Börjesson, P. Residual Biomass as Resource–Life-Cycle Environmental Impact of Wastes in Circular Resource Systems. J. Clean. Prod. 2018, 196, 997–1006. [Google Scholar] [CrossRef]
  24. European Commission. Council of the EU Regulation (EC) No 1221/2009 of the European Parliament and of the Council of 25 November 2009 on the Voluntary Participation by Organisations in a Community Eco-Management and Audit Scheme (EMAS); European Commission: Brussels, Belgium, 2009. [Google Scholar]
  25. ISO 14001:2015; Environmental Management Systems. Requirements with Guidance for Use. 3rd ed. ISO: Geneva, Switzerland, 2015.
  26. Comoglio, C.; Botta, S. The Use of Indicators and the Role of Environmental Management Systems for Environmental Performances Improvement: A Survey on ISO 14001 Certified Companies in the Automotive Sector. J. Clean. Prod. 2012, 20, 92–102. [Google Scholar] [CrossRef]
  27. Petrosillo, I.; De Marco, A.; Botta, S.; Comoglio, C. EMAS in Local Authorities: Suitable Indicators in Adopting Environmental Management Systems. Ecol. Indic. 2012, 13, 263–274. [Google Scholar] [CrossRef]
  28. Pinasseau, A.; Zerger, B.; Roth, J.; Canova, M.; Roudier, S. Best Available Techniques (BAT) Reference Document for Waste Treatment Industrial Emissions Directive 2010/75/EU (Integrated Pollution Prevention and Control); Publications Office of the European Union: Luxembourg, 2018. [Google Scholar]
  29. ISPRA. Catasto Nazionale Rifiuti: Search of the Authorizations Contained in the MUD Databases. Available online: https://www.catasto-rifiuti.isprambiente.it/index.php?pg=comautmudoperazione&regid=01&nomereg=Piemonte&provid=004&nomeprov=Cuneo&comid=01004113&nomecom=Magliano%20Alfieri&ta=&cerca=cerca&p=1&opr=&opd=&rv=&tipogest=&tipogest1=&attivata=si&width=1536&height=864&advice=si (accessed on 16 February 2022).
  30. ISPRA. Catasto Nazionale Rifiuti: Localization of Municipal Waste Treatment Plants-Composting, Composting/Anaerobic Digestion, Anaerobic Digestion Plants, Year. 2020. Available online: https://www.catasto-rifiuti.isprambiente.it/index.php?pg=gestnazione&aa=2019&regid=&mappa=4&width=1280&height=720&advice=si (accessed on 16 February 2022).
  31. ISPRA. List of Organizations Registered to EMAS. Available online: https://www.isprambiente.gov.it/it/attivita/certificazioni/emas/elenco-organizzazioni-registrate-emas (accessed on 1 November 2021).
  32. Wang, A.; Tu, R.; Gai, Y.; Pereira, L.G.; Vaughan, J.; Posen, I.D.; Miller, E.J.; Hatzopoulou, M. Capturing Uncertainty in Emission Estimates Related to Vehicle Electrification and Implications for Metropolitan Greenhouse Gas Emission Inventories. Appl. Energy 2020, 265, 114798. [Google Scholar] [CrossRef]
  33. European Commission; Joint Research Centre; Dri, M.; Canfora, P.; Antonopoulos, I.; Gaudillat, P. Best Environmental Management Practice for the Waste Management Sector: Learning from Frontrunners; Publications Office: Brussels, Belgium, 2018. [Google Scholar]
  34. Comoglio, C.; Castelluccio, S.; Scarrone, A.; Fiore, S. Environmental Sustainability Reporting in the Waste-to-Energy Sector: Performance Indicators and Improvement Targets of the EMAS-Registered Waste Incineration Plants in Italy. 2022; in preparation. [Google Scholar]
  35. Álvarez-García, J.; Del RíoRama, M.D.L.C. Sustainability and EMAS: Impact of Motivations and Barriers on the Perceived Benefits from the Adoption of Standards. Sustainability 2016, 8, 1057. [Google Scholar] [CrossRef] [Green Version]
  36. Tourais, P.; Videira, N. Why, How and What Do Organizations Achieve with the Implementation of Environmental Management Systems?—Lessons from a Comprehensive Review on the Eco-Management and Audit Scheme. Sustainability 2016, 8, 283. [Google Scholar] [CrossRef] [Green Version]
  37. Carnevale, E.; Lombardi, L. Comparison of Different Possibilities for Biogas Use by Life Cycle Assessment. Energy Procedia 2015, 81, 215–226. [Google Scholar] [CrossRef] [Green Version]
  38. Chen, T.-C.; Lin, C.-F. Greenhouse Gases Emissions from Waste Management Practices Using Life Cycle Inventory Model. J. Hazard. Mater. 2008, 155, 23–31. [Google Scholar] [CrossRef] [PubMed]
  39. Campuzano, R.; González-Martínez, S. Characteristics of the Organic Fraction of Municipal Solid Waste and Methane Production: A Review. Waste Manag. 2016, 54, 3–12. [Google Scholar] [CrossRef]
  40. Sosnowski, P.; Wieczorek, A.; Ledakowicz, S. Anaerobic Co-Digestion of Sewage Sludge and Organic Fraction of Municipal Solid Wastes. Adv. Environ. Res. 2003, 7, 609–616. [Google Scholar] [CrossRef]
  41. Orzi, V.; Cadena, E.; D’Imporzano, G.; Artola, A.; Davoli, E.; Crivelli, M.; Adani, F. Potential Odour Emission Measurement in Organic Fraction of Municipal Solid Waste during Anaerobic Digestion: Relationship with Process and Biological Stability Parameters. Bioresour. Technol. 2010, 101, 7330–7337. [Google Scholar] [CrossRef]
  42. Nowicki, P.; Ćwiklicki, M.; Kafel, P.; Wojnarowska, M. Credibility of Certified Environmental Management Systems: Results from Focus Group Interviews. Environ. Impact Assess. Rev. 2021, 88, 106556. [Google Scholar] [CrossRef]
Figure 1. Influence of plants’ operations on the specific compost production.
Sustainability 14 07438 g001
Figure 2. Yearly average concentrations of odor and NH3 in the exhaust air. LB: lower BAT-AEL; UB: upper BAT-AEL; cross: average; horizontal line: median.
Sustainability 14 07438 g002
Figure 3. Comparison of the odor (A) and NH3 (B) emissions of the biodegradable waste management plants with the BAT-AELs. (LB: lower BAT-AEL; UB: upper BAT-AEL).
Sustainability 14 07438 g003
Table 1. Summary of the main technical characteristics of the considered biodegradable waste treatment plants (OFMSW: organic fraction of municipal solid waste; Ag&Li: agro-industrial and livestock waste). The reported annual treated waste is the mean value recorded over the period 2018–2020. All aerobic and anaerobic processes are performed indoors. The Pa plant operates aerobic and anaerobic digestion in separate facilities. Aerobic process: St = static windrow, Dy = dynamic windrow, ns = not specified. Anaerobic process: We = wet digestion, Dr = dry digestion, ns = not specified. Energy recovery: E = electricity production, EH = electricity and heat production. Exhaust air treatment: x = type of treatment(s) used.
Operational DataProcessExhaust Air Treatment
SiteFeedstockAnnual Treated WasteAerobicAnaerobicBio-FilterWet ScrubberBag FilterCycloneWater Spray
OFMSWGreenAg&LiSew. SludgeWood&PaperOthers TypeTypeEnergy Recovery
%%%%%%K Tons--------
Pa4814 38 51.4StWeEx
Or------40.5StDrExx
Fa133212932247.4St x
Fm------25.6Dy x x
Sd------17.3St x
Lu77192 1<159.9DyDrEHx
Ce8614 145.2DyDrEHx
Ca8020<1 55.9DyDrEHxx x
La87121 <1 67.5St x xx
Es------490.1StWeEHxx
Sc 100 6.1ns x
As8416 12.0St x x
Ab7327 26.4ns xx
Sr937 39.9nsnsEx
Bm937 <1 28.5St x x
Tc8119 1 7.8St x
Table 2. Summary of the key aspects considered in the ESs, regarding their significance assessment, quantification, and improvement targets.
AspectSignificantDescribed by IndicatorsNo. of IndicatorsESs with ObjectivesNo. of ObjectivesTot BudgetBudget Per Objective
%%-%-k€k€
Emissions to Air75.084.62923.1456001867
Odor Emissions75.069.2930.84750375
Energy Consumption75.061.52530.85438146
Waste Production62.569.21830.85100100
Water Consumption50.046.2107.71570570
Noise Emissions37.530.880.000
Soil Contamination37.50.000.000
Biodiversity25.030.8110.000
Raw Materials Consumption25.023.160.000
Transport25.07.727.710
Risk of Env. Accidents25.00.0023.131010
Energy Production12.546.21123.13335112
Releases to Water12.515.4230.85200100
Process Management0.00.0061.51117,1802148
Stakeholder Engagement0.00.0015.42126
Table 3. List of the most frequently reported (in at least two different ESs) environmental performance indicators.
AspectIndicatorUnitNo. of ESs
Emissions to AirMean annual concentrations of pollutants emitted to airmg/Nm35
Concentration of contaminants emitted to air from grab samplingmg/Nm34
Total annual CO2 mass emitted to airt3
Total annual CO2 mass avoided to airt3
Total annual CO2 mass emitted to air per treated wastet/t3
Emissions flow rateNm3/h3
Total annual greenhouse gas mass emitted to airt2
Total annual greenhouse gas mass emitted to air by sourcet2
Releases to WaterMean annual concentrations of pollutants released to waterVarious2
Waste ProductionTotal annual mass of waste producedt8
Total annual mass of waste produced per typologyt6
Total annual mass of waste produced per treated wastet/t2
Energy ConsumptionTotal annual electricity consumptionMWh6
Total annual oil consumptiont5
Total annual electricity consumption per treated wasteMWh/t4
Total annual energy consumptionMWh3
Total annual methane consumptiont, Sm32
Water ConsumptionTotal annual water consumptionm35
Total annual water consumption per treated wastem3/t4
Raw Material ConsumptionTotal annual reagents consumptiont2
Odor EmissionsMean annual concentrations of odors emitted to airOUE/m35
Concentration of odors emitted to air from grab samplingOUE/m34
Noise EmissionsMaximum noise levels at the plant’s boundariesdB4
Maximum noise levels at sensitive receptorsdB4
Energy ProductionTotal annual electricity productionMWh6
Total annual heat productionMWh2
Total annual energy productionMWh2
BiodiversityTotal site aream24
Table 4. Overview of the reporting of GHG emissions in the ESs. N = no, Y = yes, x = quantified.
SiteProduced EmissionsAvoided Emissions
ConsideredProcess
Emissions
Energy
Consumed
FuelsConsideredEnergy
Produced
Fertilizers Produced
PaN Yx
OrY xYx
FaN N
FmY x N
SdY N
LuYxxxYxx
CeYxxxYxx
CaYxxxYxx
LaN N
EsYx Yx
ScY N
AsN N
AbY xN
SrY N
BmY xN
TcN N
Table 5. List of objectives and related actions set by organizations.
AspectObjectiveActionNo. of ESs
Emissions to AirReduction of GHG emissionsIncreased biogas recovery1
Equipment conversion to biomethane1
Installation of photovoltaic panels1
Reduction of emissionsImproved suction system1
Releases to WaterReduction of discharges to be purifiedRealization of a coverage2
Improvement of the management of water dischargesConstruction of new tanks2
Realization of a purifier1
Waste ProductionReduction of waste producedIncreased compost recovery during refining2
Exclusion of the biotrickling system from the emission treatment system1
Raising the awareness of waste donors1
Improvement of waste managementMapping of the waste produced1
Energy ConsumptionReduction of electricity consumptionComponent replacement2
Energy efficiency improvementBiomethane production from new anaerobic composting line1
Staff training1
Reduction of the consumption of oilEquipment replacement1
Water ConsumptionReduction in consumption of water drawnUse of wastewater1
Odor EmissionsReduction of odor emissionsInstallation of a new scrubber1
Closure of the compost storage area1
Increase of windrows irrigation1
Improvement of odor managementInstallation of continuous monitoring1
TransportImprovement of the viabilityReorganization of the access node1
Stakeholder EngagementIncreased awarenessExternal initiatives1
Improvement of relations with stakeholdersGuided tours1
Process ManagementPerformance improvementRenovation6
Maintenance event preventionImprovement of the water network1
Internal waste handling improvementRenovation1
Realization of a sludge drying plant-1
Construction of a green waste processing plant-1
Installation of a compost pellet plant-1
Energy ProductionIncrease in the electricity producedComponent replacement1
Optimization of biogas production2
Risk of Environmental AccidentsPrevention of emergenciesExpansion of the storage capacity of the leachate1
Pollution preventionConstruction of a compost packaging plant1
Fire management improvementFormation of a fire team1
Publisher’s Note: MDPI stays neutral with regard to jurisdictional claims in published maps and institutional affiliations.

