1. Introduction
The clear identification of cables and conductors is a critical duty in terms of safety. The improper choice can cause the failure in electrical equipment, hence resulting in the need for repair and endangering the lives of electrical technicians. Electrotechnical services spend a significant amount of time on cable tracing and conductor identification operations. Agricultural enterprises are even more susceptible to this problem due to the lack of marking of cables; in some case, it approaches 80–90% [
1]. Such figures arise from the fact that agricultural enterprises are dominated by premises with an aggressive environment of wiring and means of its marking, and in addition the agriculture sphere is constantly experiencing a shortage of a highly qualified labor force, including electrical specialists, in comparison with other sectors of the world economy. According to the Russian methodological recommendations on labor standards for work on the maintenance and repair of electrical networks, electric power devices and equipment (2016), up to 1.8 man-hours are spent on the identification of conductors. However, in fact, the labor costs of conductor identification operation often go beyond the limits set by the recommendations due to the marking problem. Our own experience of interaction with electrical personnel at agro-industrial facilities confirms it. Labor costs per operation at some facilities reach up to 3 man-hours.
1.1. Existing Methods for Identifying Conductors
There are many methods for cable tracing and conductor identification operations, from the simplest one of visual contact to quite expensive devices. To start with, the application of a visual contact method is not possible when identifying hidden wiring. This method is a source of errors if there is a large number of cables, especially of the same color. Marking may be erroneous due to human error, and marking abrasion may lead to incorrect identification. Moreover, this method cannot be applied in the absence of markings on the already installed electrical wiring. On the contrary, the application of devices with different working principles can greatly facilitate the task of conductor identification.
The simplest method is a continuity test by means of a varied number of devices, including multimeters and improvised means (simple combination of LED and a battery). The principle of the method is to connect different conductors at the beginning and end of the cable until the electrical circuit of the multimeter (or another device) is closed. Despite the topic being seemingly well studied, research on facilitating the conduct of continuity tests is nevertheless still being conducted. Papers [
2,
3] propose new designs of devices that allow checking the polarity and the continuity of any type of cables. Paper [
4] demonstrates how to test cables containing up to 160 wires, which are frequently utilized in military computers. To address issues with the initial design’s reliability, the authors designed generic adaptor boards and adaptor cables with some modifications. Paper [
5] presents the development of continuity/insulation automatic test stations, including such aspects as its design, software, prototypes as well as issues of their maintenance and repair. However, it is worth noting that the application of a continuity test can have a limitation as the method stipulates a certain condition—the conductor must be dead, which in some cases can be a difficult task due to the impossibility (or undesirability) of disconnecting power consumers.
Another widespread way of continuity testing is signal tracing, the essence of which is the use of two devices: signal generator and a signal tracer (probe). The signal generator is connected to a conductor and sends signals through it, whereas the signal tracer is used to look for this signal, hence determining the right conductor. The most common signal used in line/conductor tracking is the tone one. Modern tone generators have many service functions: detecting the presence of voltage in a conductor, detecting polarity, short circuit, resistance and capacitance of conductors and also be used as a service communication channel [
6]. As a result, many patents are devoted to the use of signal tracing for conductor identification. Methods of line conductors’ identification presented in [
7,
8] comprise a signal generator of different frequencies on each phases on a substation and a consumer meter or a phase detection device discriminating the due signal. Paper [
9] patents the unique characteristics of a generated signal and a unique identifier of this signal, which allows identifying, locating and tracing a large number of wires in a multiple wire electrical system. However, signal tracing also has the same disadvantage as the previous method—the conductor under investigation must be dead.
To eliminate the problem with the disconnection of cables, there is a method of cable tracing proposed in [
10,
11,
12]. It lies in using power line carrier (PLC) technology and implies the use of PLC modems on a server and clients. After analyzing data obtained from the PLC, a server in accordance with the developed algorithm allows a repair team to discriminate wires in cables. A similar principle is used in [
13,
14,
15] describing the methods for phase identification by means of a smart meter. Despite the solved problems, the said methods have limited application. First, the systems are proposed to be used in power networks; second, they are stationary; third, they require quite a lot of capital investment.
Summing up, it is possible to conclude that although the operation of conductor identification seems an easy job and a deeply researched topic, there are some stumbling blocks to consider and resolve. First, in some cases, conductor identification may turn out to be time-consuming due to the large quantity of unidentified conductors or cables. It requires easy and speed detection operations. Second, the majority of methods for conductor identification stipulate that power lines should be de-energized and have uninsulated parts of conductors that also exacerbate the situation with the identification duration, especially if equipment or consumer supplied through a line under investigation cannot be de-energized without certain consequences. Third, the decisive reason for choosing a certain method of conductor identification is based on economic feasibility, which is achieved only by using simple identification methods. Therefore, there is an urgent necessity to find a method to identify a conductor by uncomplicated and convenient actions without disconnecting electrical equipment from the power supply and, moreover, without going beyond the scope of economic feasibility.
1.2. Hypothesis of Using Acoustic Signal for Identifying Conductors
After conducting literature and market research on existing technologies, we have concluded that signal tracing when identifying conductors is the most convenient among others; however, the main pain point is the necessity for de-energized uninsulated parts of conductors to connect signal generators. One of the possible tracing signal carriers able to overcome that problem can be sound (acoustic signal). Sound is used both for controlling and measuring purposes (in particular, in flaw detection) and for active action on a substance (ultrasonic cleaning, machining, welding, etc.).
There are huge number of scientific works devoted to the application of sound for identifying different structural health parameters in many fields, including material, civil and petrochemical engineering. For example, acoustic technology was considered in papers [
16,
17] for the identification of corrosion flaws in materials, in paper [
18] for determining the damage in the reinforced concrete beams under four-point bending, in paper [
19] for identifying the degradation in carbon fiber composite pressure vessels, in paper [
20] for monitoring and localization of defects and wire breaking of bridge cables and in paper [
21] for mapping the discharges in electrical discharge machining.
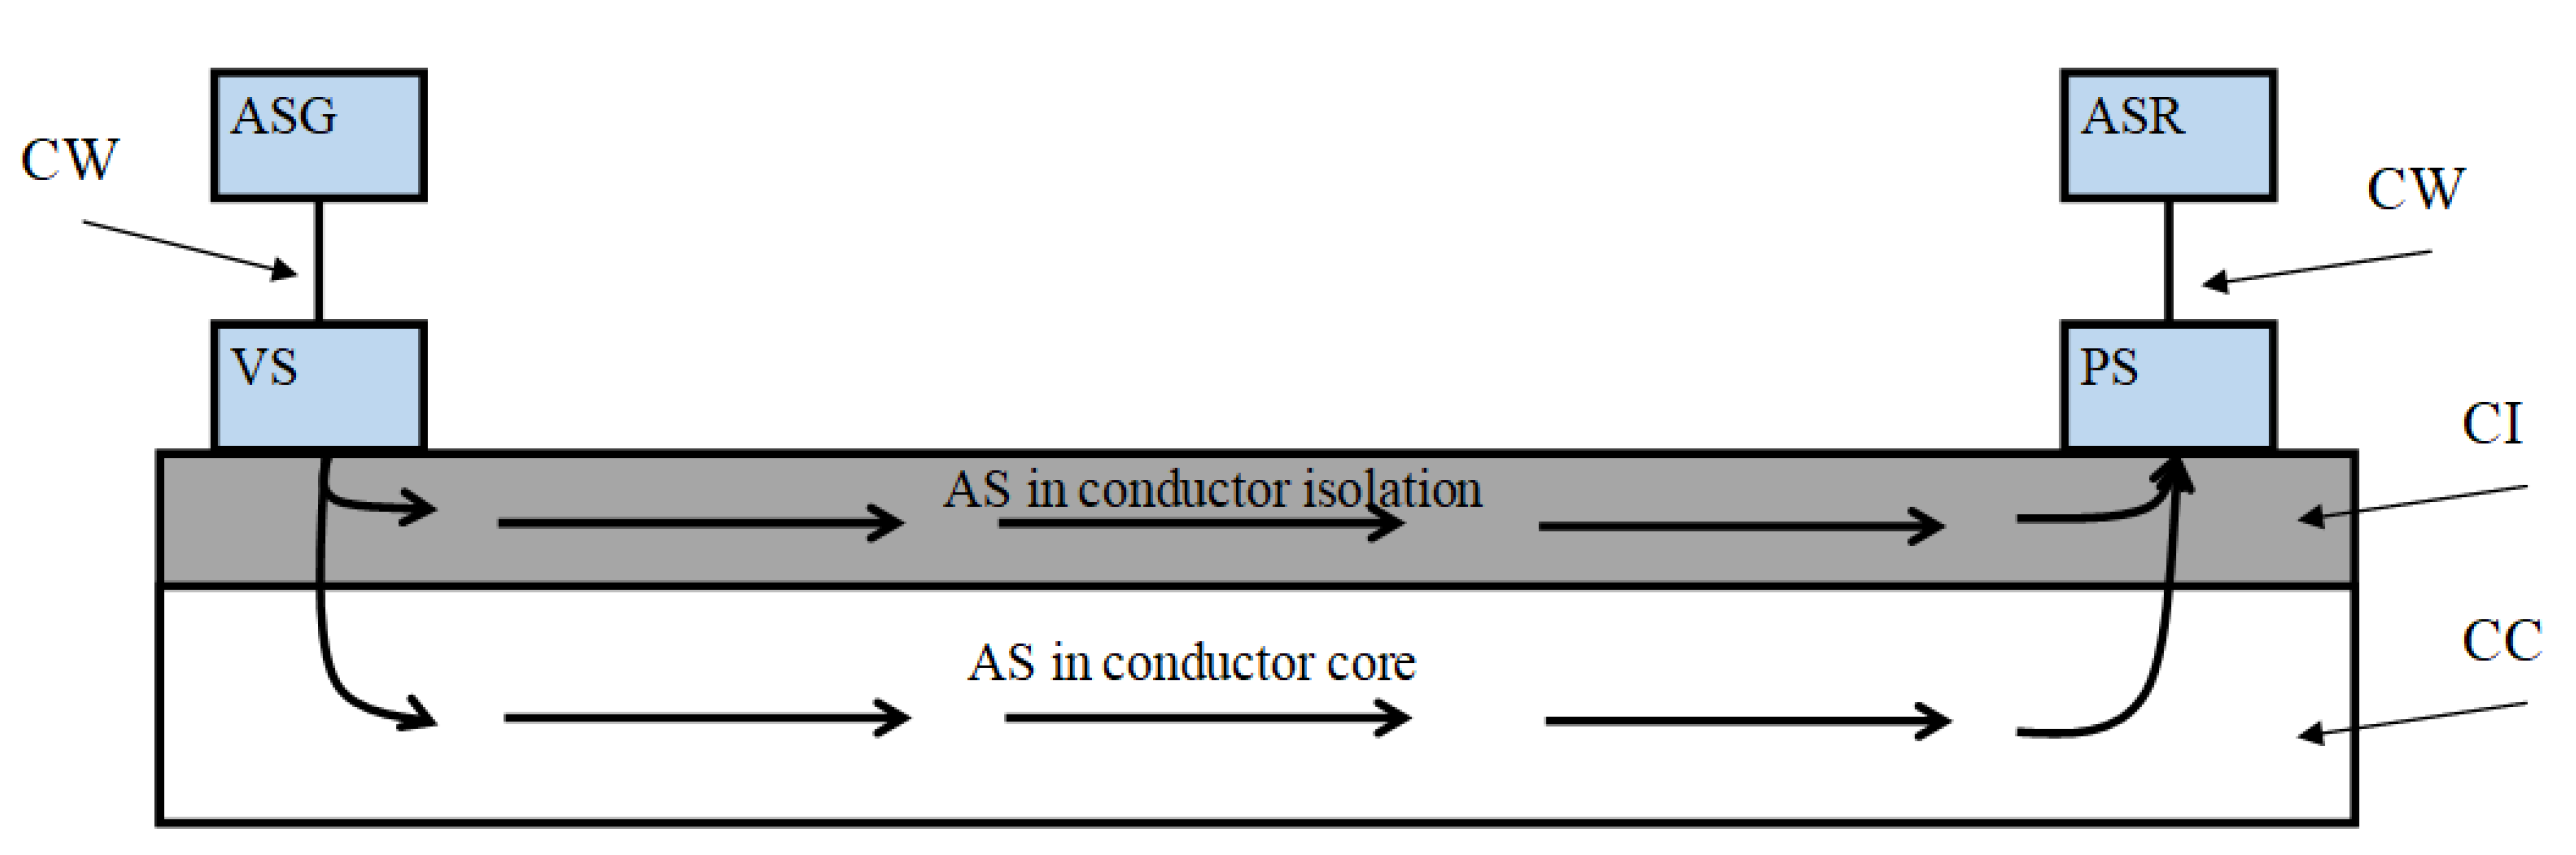
Acoustic signal is able to propagate in different mediums as well as transfer from one medium to another one. From the above, we hypothesized that this property could be a solution for line identification without damaging the conductor insulation. To do this, an acoustic signal should be created by a generator and transmitted to conductor insulation. Then, the signal should transfer to the conductive core and propagate there. In turn, the acoustic signal receiver will have an opportunity to trace the signal at the other end of said conductor.
1.3. Article Contribution and Organization
In the study, the hypothesis of using an acoustic signal as a carrier for identifying conductors was considered. For this purpose, a mathematical model was derived to determine the sound pressure level in conductors, taking into account such factors as the length of the identified conductor, the frequency of the applied acoustic signal, the cross-section of the conductor and its material, the thickness and material of the insulation and the speed of sound waves in conductors and insulating materials. The credibility of the mathematical model and calculations performed on its basis was confirmed by an experiment to identify the conductor by means of the assembled device prototype implementing the acoustic method application. It should be noted that due to gaps in the literature devoted to the time intervals of identification process, the study includes the model of identification time decomposed into its constituents and data on experiments to determine them. The assessment of the acoustic method effectiveness was conducted on the basis of this model.
The manuscript has been organized into the relevant sections.
Section 2 describes the essence of the acoustic method for identifying conductors.
Section 3 details the mathematical model of the sound propagation in conductors and insulation as well as calculations to determine the sound pressure level subject to identified conductor length, conductor cross-section and insulation type.
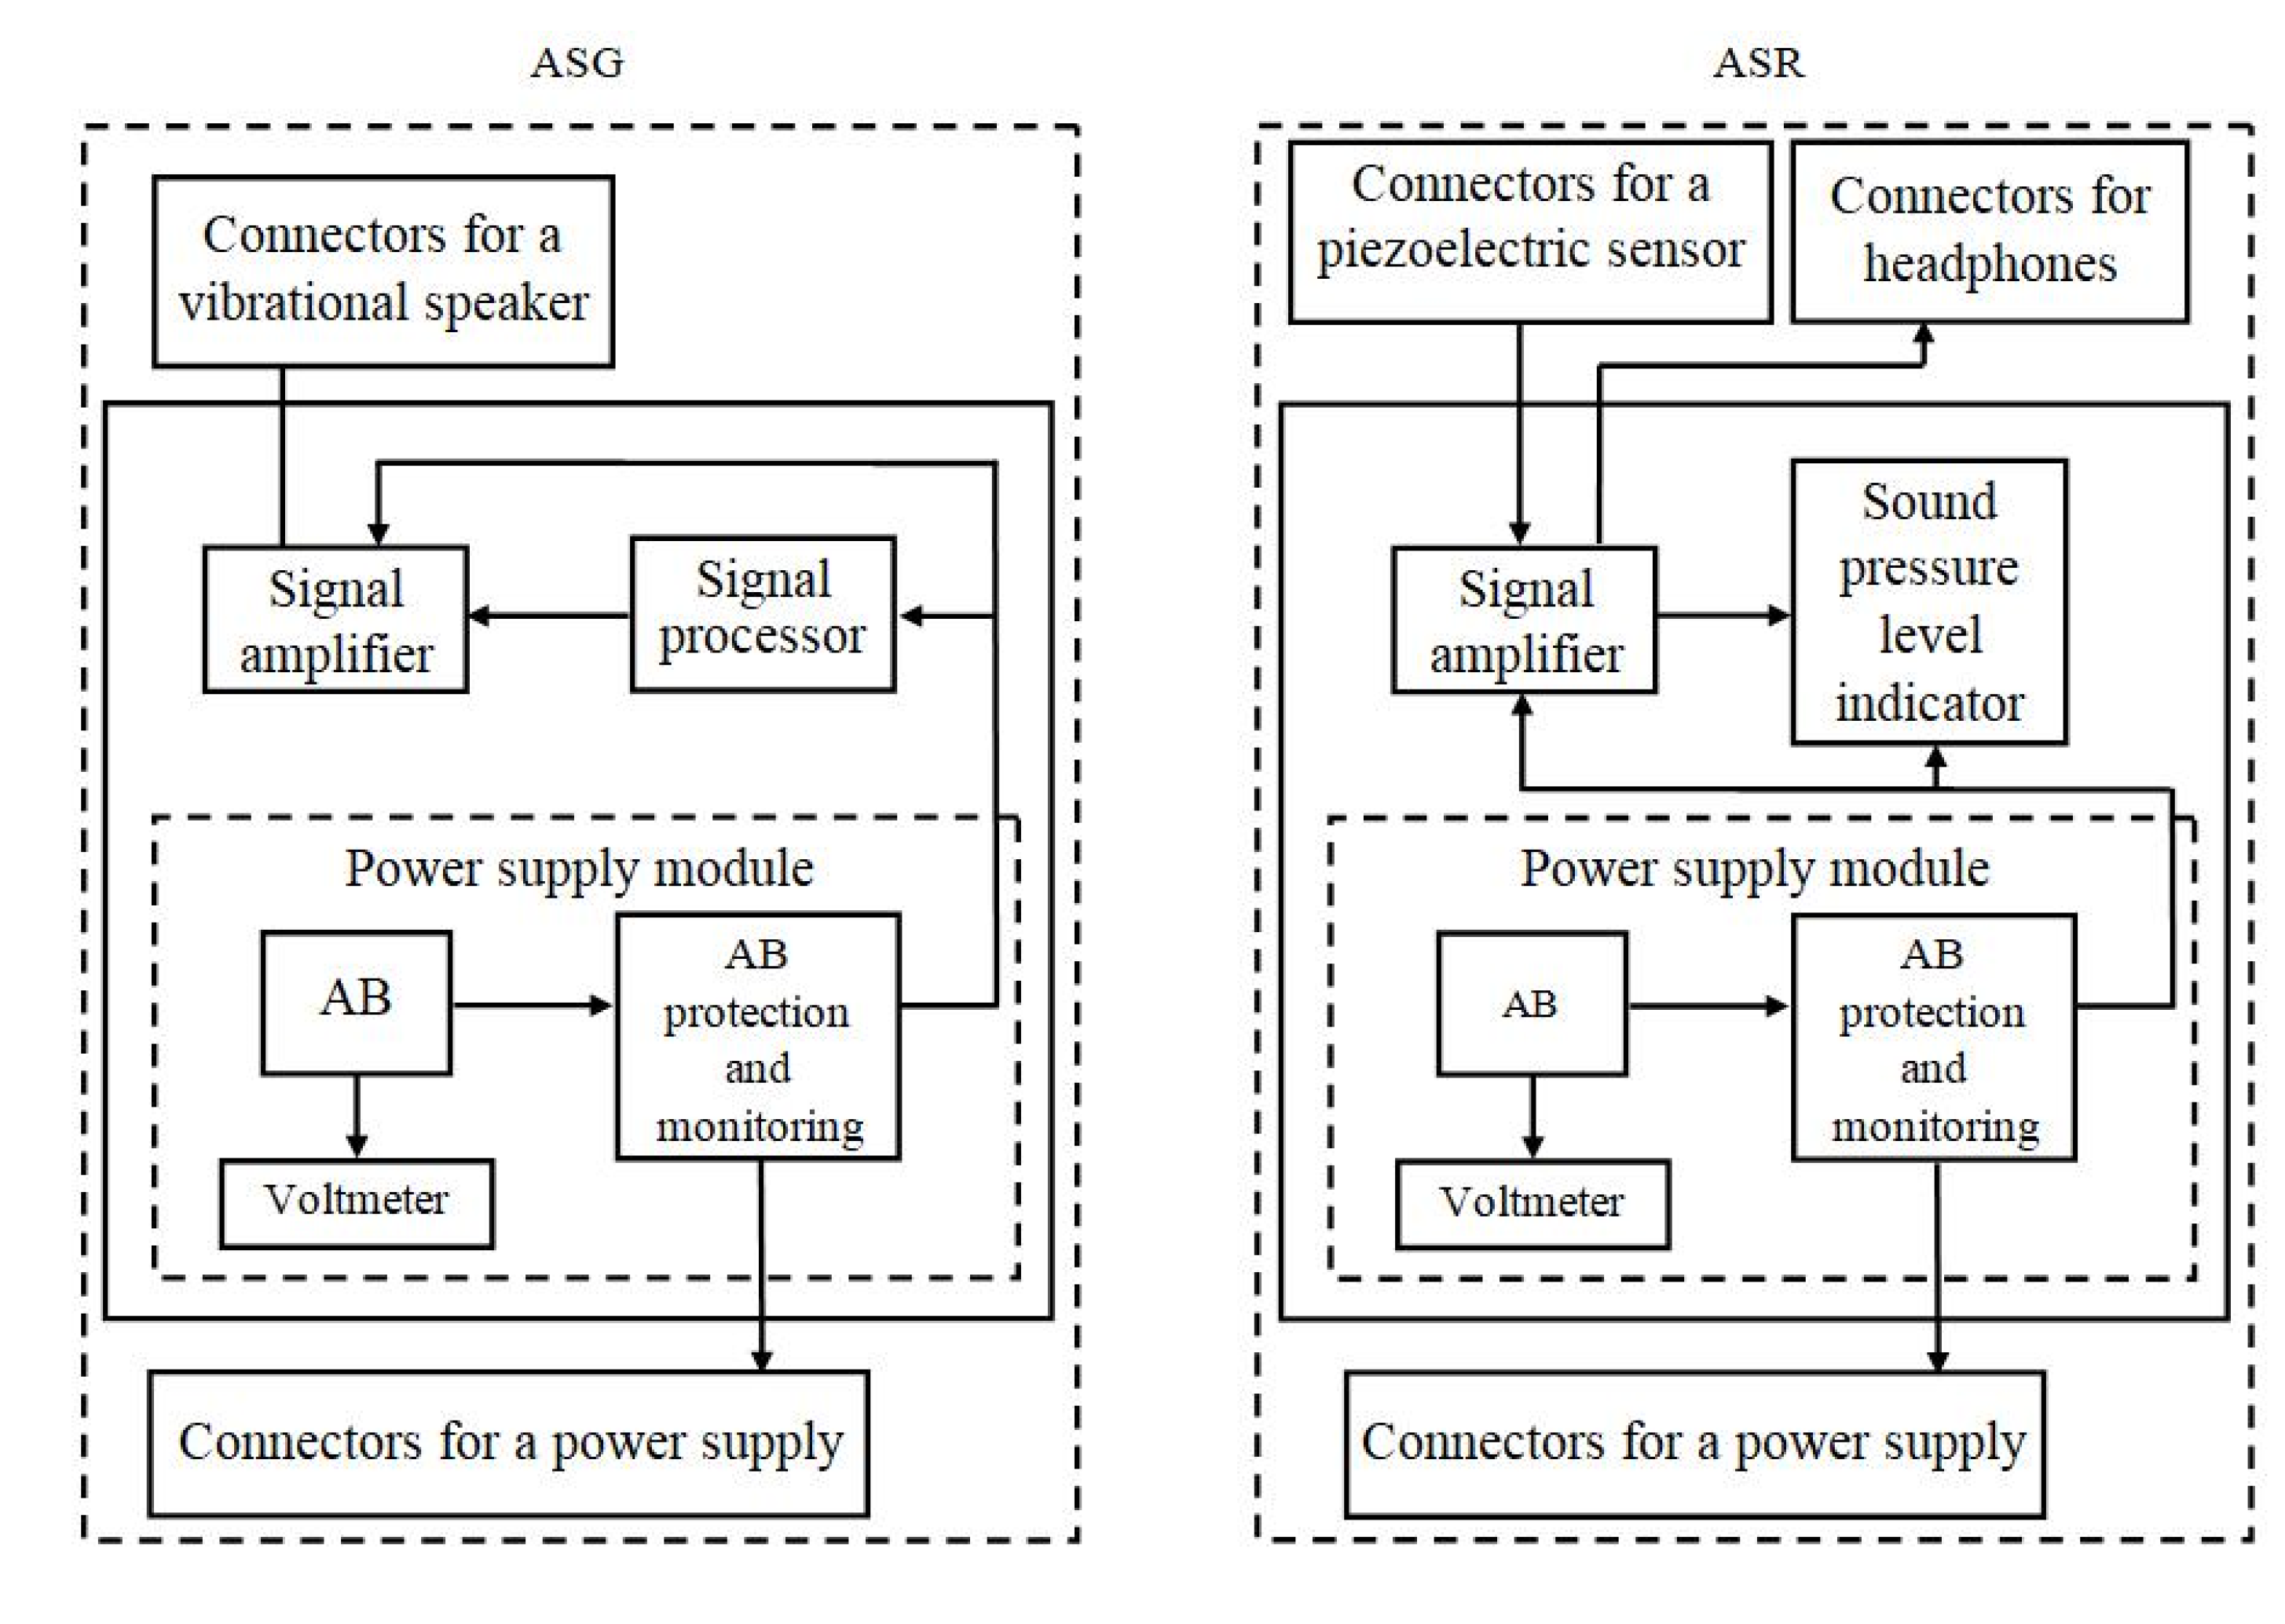
Section 4 is devoted to the assembled prototype of the conductor identification device enabling the acoustic method to be applied.
Section 4 also describes the conducted multivariate experiment to test the acoustic method for identifying conductors and the prototype of a conductor identification device and discusses the obtained results.
Section 5 is aimed at a feasibility study of the acoustic method through the analyses of conductor identification operation duration when applying different identification methods. The final conclusions are drawn in
Section 6.
3. Mathematical Modeling of Sound Propagation in Conductors and Insulation
The literature review revealed that an acoustic signal has not been applied as signal carrier for conductor tracing; however, the theory of sound propagation in different mediums is well studied. Therefore, we applied existing methods [
22,
23,
24,
25] in order to mathematically model the sound propagation in conductors and insulation, hence calculating the sound pressure level at any points of conductors. This mathematical model and calculations within it are necessary to assess the capabilities of the proposed method.
The main parameter of acoustic signals is the sound pressure [
25] showing the deviation of sound pressure from the ambient atmospheric pressure. The sound pressure level in conductors is influenced by such factors as the length of the identified conductor, the frequency of the applied acoustic signal, the cross-section of the conductor and its material, the thickness and material of the insulation and the speed of sound waves in conductors and insulating materials.
In acoustics, the unit for measuring the sound pressure level, sound intensity, sound power and other acoustic parameters is the decibel (dB). The decibel is used to compare the characteristics of acoustic devices reflected on a logarithmic scale. Decibels allow measuring the relationship between all physical quantities, and, in addition, absolute values can be compared with their help. The developed methodology for calculating the sound pressure level in conductors are as follows:
- 1.
To set the initial data such as the length of a conductor (distance from identification point to sound source), the frequency of the supplied signal, the cross-section of the conductor as well as the sound pressure level of the sound source , dB.
- 2.
To determine the wavelength of acoustic waves
, m:
where
is the propagation velocity of acoustic waves, m/s;
is frequency of acoustic waves, Hz;
- 3.
To determine the propagation constant
, m
−1:
- 4.
To determine force
, N, applied to a conductor by a vibrational speaker:
where
is the mechanical stress, N/m2, Pa;
is the contact area between a conductor and a vibrational speaker, m2.
- 5.
To determine the absolute elongation of a conductor
, m:
where
is applied force, N;
is conductor length, m;
is conductor cross-section, m2;
is modulus of material elasticity, N/m2.
- 6.
To determine the relative length of the conductor after the absolute elongation
, m:
where
is conductor length, m.
- 7.
To determine the conductor deformation
, dimensionless number (DN):
where
is the relative length of the conductor, m;
is the wavelength of acoustic waves, m.
- 8.
To determine the displacement amplitude of conductor particles
, m:
where
is conductor deformation, DN;
is the propagation constant, m−1.
- 9.
To determine the vibration velocity in a conductor V, m/s:
where
is the frequency of the acoustic signal, Hz;
is displacement amplitude of conductor particles, m.
- 10.
To determine the reflection coefficient at the interface between two media (conductive core-conductor insulation),
, DN:
where
is the acoustic resistance of the conductor core, kg/(m2·s);
is the acoustic resistance of the conductor insulation, kg/(m2·s).
The acoustic resistance of conductor core
, kg/(m
2·s), is calculated as follows:
where
is longitudinal wave velocity in a conductor core, m/s;
is the density of conductor core material, kg/m3.
- 11.
To determine the loss coefficient of sound wave energy transition into other energy types (in particular into heat)
, DN:
where
α is the sound absorption coefficient, cm−1;
λ is the wavelength of the acoustic waves, m.
The values of the sound absorption coefficient are usually written in measurement units of dB/сm. According to [
26], α equals to 2.44 × 10
−4 dB/cm for copper and 3.15 × 10
−4 dB/cm for aluminum. In order to convert units from dB/cm to 1/cm, it is necessary to use the following equation:
- 12.
To determine the sound pressure level at the identification point
, dB:
where
is vibration velocity in a conductor, m/s;
is the reference value of vibration velocity, m/s;
is the sound pressure level of the sound source, dB;
is the reflection coefficient at the interface between two media, DN;
is the loss coefficient, DN.
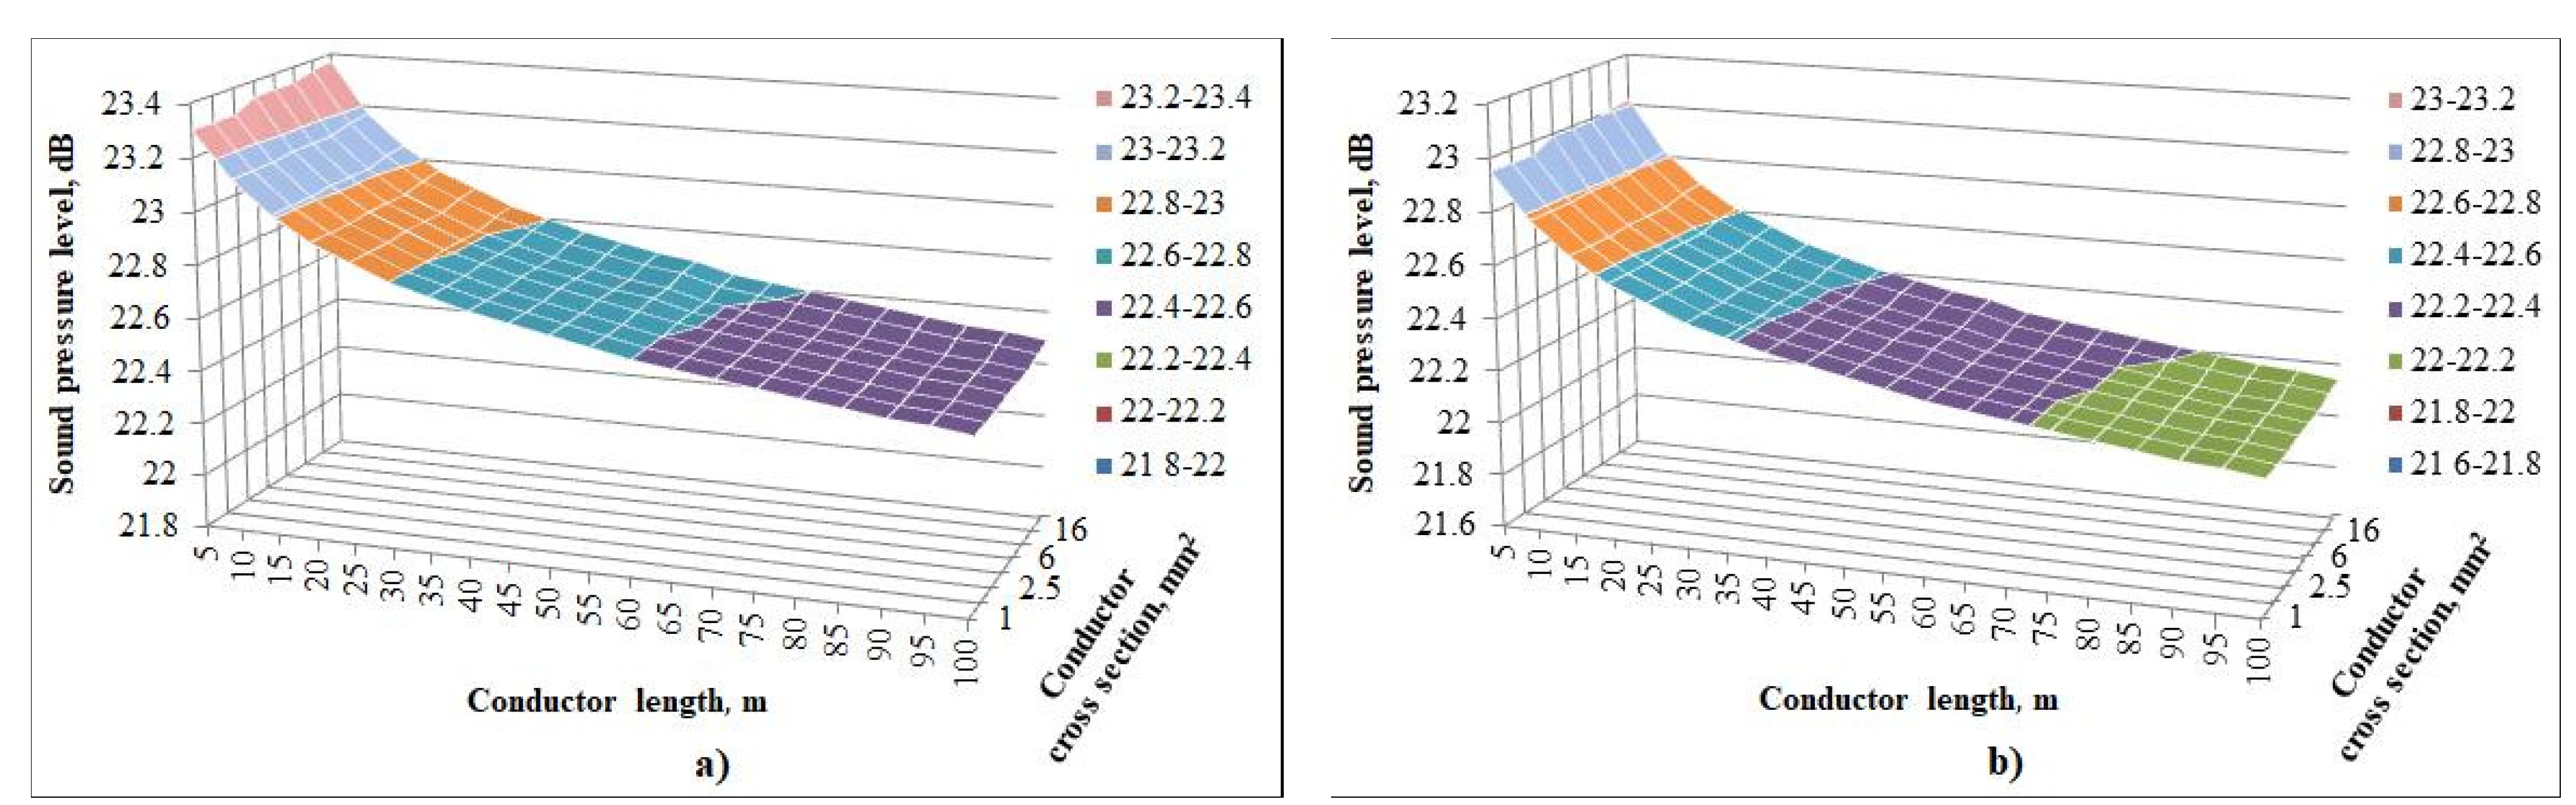
Using the proposed mathematical model, the sound pressure level was calculated depending on the distance from the identification point to the sound source and on the cross-section of the identified conductor. For calculations, the two most common types of insulation for conductors were used: these are PVC and the polyethylene one. The immutable initial data were the sound pressure level of the sound source equal to 30 dB and the frequency of the supplied signal in 80 Hz. It should be noted that such a signal frequency was chosen for several reasons. First, the frequency must be above 20 Hz, as a human is not able to sense a signal in a frequency range below this level. Secondly, the frequency should not be a multiple of the frequency of the electrical network, that is, 50, 60, 100, 120 Hz, etc. In addition, it must be taken into account that the higher the frequency of the applied signal, the higher the loss of acoustic energy, but, at this time, the use of the frequency range below 80 Hz are not justified due to the technical features of common vibrational speakers.
On the basis of the conducted theoretical calculations, graphs of these dependencies were constructed, which are shown in
Figure 2.
The calculated data shows that the propagation of sound pressure in conductors weakly depends on the length of identified conductor. Therefore, when identifying a copper conductor with a cross section of 2.5 mm2, the sound pressure level at a distance (from the identification point to the signal source) of 100 m turned out to be only 3.65% (0.85 dB) less than at a distance of 5 m.
Likewise, the cross section of the conductor does not have a strong influence on the sound pressure level. The calculated data showed that the highest sound pressure level at the identification point was achieved when using a conductor with a cross section of 25 mm2. Therefore, the difference in sound pressure level at the minimum and maximum cross sections was approximately 0.07 dB, that is 0.42%.
The type of insulation affects the propagation of sound pressure, which is due to the fact that the insulating material has different densities impacting the speed of sound and the sound pressure level. However, the obtained data revealed that the insulation type has a negligible effect on sound propagation. Therefore, the sound pressure level in a conductor with polyethylene insulation is higher than that with PVC insulation by 0.05 dB, which is approximately 0.22%.
The largest losses in sound pressure level in conductors were likewise discovered to occur near the beginning of identified conductor. This is due to acoustic waves scattering at the contact point between vibrational speaker and conductor insulation as well as due to the law of sound absorption. Thus, sound pressure losses in a copper conductor of a cross section of 2.5 mm2 and with PVC insulation will be 7.2 dB at the distance of 30 m from the sound source while it will be 7.55 dB at the distance of 100 m. Therefore, the change in level losses at the distances of 30 m and 100 m is just 0.35 dB, that is, 4.64%.
5. Analyses of Conductor Identification Operation Duration
So as to calculate the effectiveness of the acoustic method for conductor identification, it is necessary to compare it with existing methods in terms of the time spent on identification process. The identification time was decomposed into constituents whereas experiments made it possible to obtain the numerical values of these constituents. In the experiments, identification was carried out by such methods as continuity testing, signal tracing and the use of acoustic signals. FRLS cable with a cross section of 2.5 mm2 was used as a control sample of the wiring, internal and external insulation of which are made of polyvinyl chloride. The number of experiment repetitions for each operation was 10.
The general expression for determining the maximum time for required conductor identification
, min, can be found according to the following equation:
where
is time spent on performing one identification operation, min;
is number of identification operations necessary to be carried out to find the required conductor, pcs.
In turn, the average time of one identification operation
, min, can be determined by:
where
is identification complexity factor;
time spent on the operations of conductors’ insulation, min;
is time spent on the operations of identification means’ connection, min;
is time spent on the identification of required conductor, min.
At the same time, all the found constituents can also be decomposed into their constituents. Therefore, the time of conductor insulation operations
is found by:
where
is time spent on removing identification insulation at the first point, min;
is time spent on removing identification insulation at the second point, min;
is time spent on isolating the conductor after identification at the first point, min;
is time spent on isolating the conductor after identification at the second point, min.
The experiments made it possible to obtain the constituents for conductor insulation time. It was found that time spent on removing identification insulation at the first and second points for continuity test ( and ) equaled 1 min 40 s, while time spent on isolating the conductor after identification at these points ( and ) was 3 min 08 s. Concerning the signal tracing method, both and were 1 min 30 s and and were the same as for the continuity test (3 min 08 s). Therefore, time spent on the operations of conductors’ insulation was equal to 9 min 36 s for the continuity test and 9 min 16 s for signal tracing.
Time of identification means’ connection operations
is found by:
where
is time spent on connecting identification means at the first point, min;
is time spent on connecting identification means at the second point, min;
is time spent on disconnecting identification means at the first point, min;
is time spent on disconnecting identification means at the second point, min;
During the experiments, it was found that time spent on connecting identification means at the both points for continuity test ( and ) were 2 min whereas time spent on disconnecting identification means ( and ) were 2 min 10 s. For the signal tracing method, and were 1 min 30 s, while and were 1 min 15 s. Therefore, time spent on the operations of identification means’ connection was equal to 8 min 20 s for the continuity test and 5 min 30 s for signal tracing.
Time spent on the identification of required conductor cannot be decomposed into components, and the conducted experiments revealed that it was equal to an average of 3 min 1 s for the continuity test and 2 min 10 s for signal tracing
In contrast to standard conductor identification methods, the application of acoustic signal makes it possible to facilitate the identification process. It is due to the fact that removing the insulating layer and the subsequent conductor isolating is not needed since the acoustic method allows identification to be carried out without ensuring contact with the conductor cores, that is, the signal can be fed directly through the insulation at any point of the conductor. Thus, the Equation (18) will look like:
In turn, the conducted experiments revealed that the use of acoustic method (Conductor identification device) allows increasingly reducing both time intervals. Operations on identification means’ connection was 2 min 50 s, while the identification time of the required conductor was 2 min.
As regard to the identification complexity factor, it is determined on the basis of the State Itemized Cost Estimate Standards and the Unified Norms and Prices adopted in the Russian Federation and depends on the conductor length and the type of wiring (hidden or open wiring).
Table 2 presents the identification complexity factor
subject to the parameters listed above. The factor is taken equal to 1 for the least labor-intensive combination of parameters, that is, for identifying internal power networks made with the conductor cross section of 1.5 to 6 mm
2 and laid openly on brick and concrete foundations.
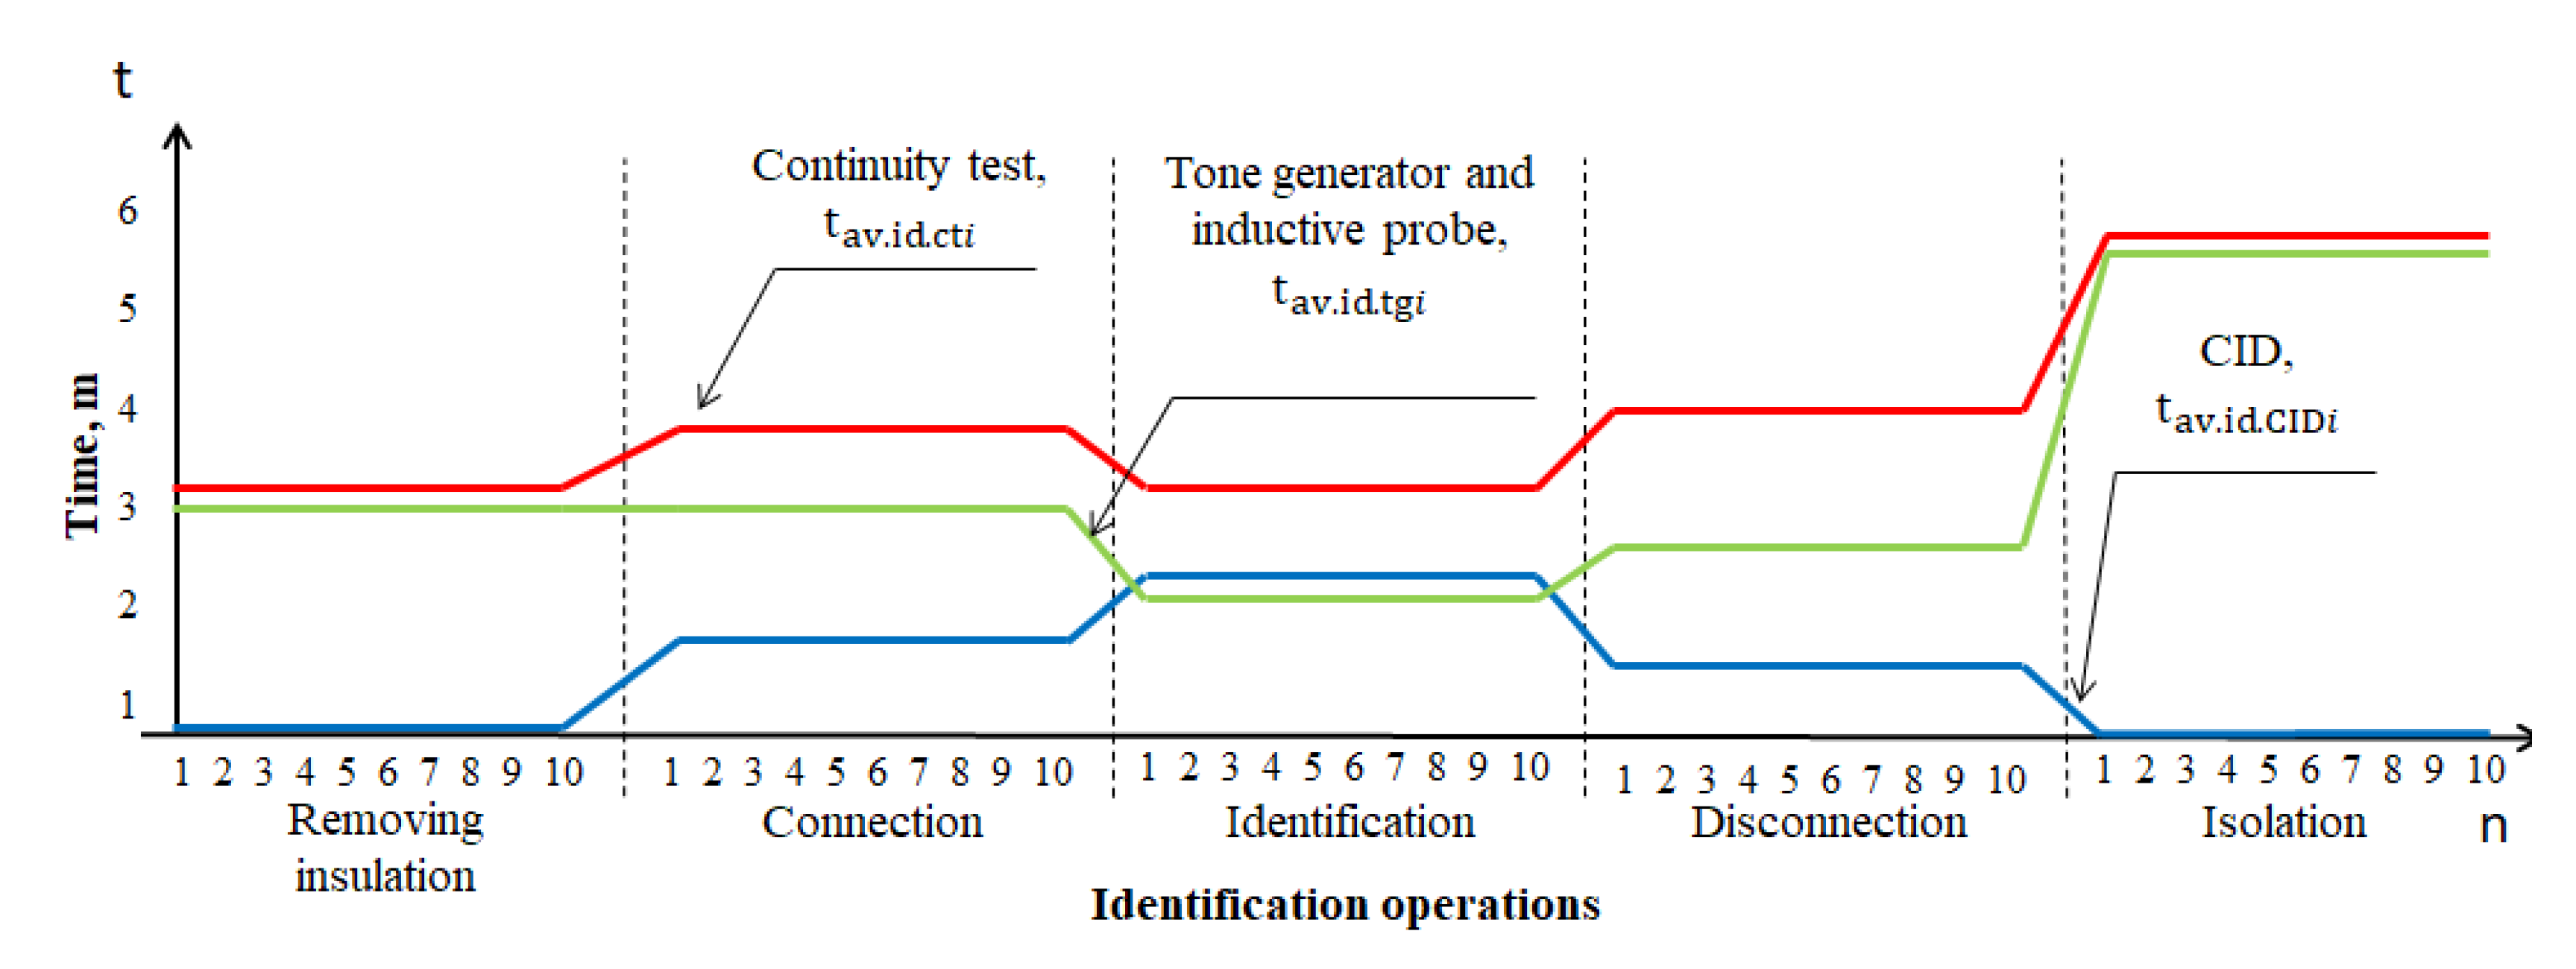
As a result of all obtained data, a graph of the average time for identifying conductors was drawn up with a breakdown of its constituents (
Figure 8). Graphs are built for various methods and technical means of identification, namely for continuity test, signal tracing and acoustic methods.
The graph shows that the developed CID device allows reducing the time of identification operations by more than 2 times. The average time of one identification operation is 4 min 50 s for acoustic method while it is 20 min 57 s for continuity test and 16 min 56 s for signal tracing
It is also necessary to take into account that the maximum time for required conductor identification
is greatly influenced not only by the average time of one identification operation
, but also by the number of identification operations
. The number of identification operations depends on the number of conductors, among which the necessary one is being looked for. At the same time, the conductors can be located in a common cable sheath that complicates the process of conductor identification. Therefore,
will be defined as the sum of the conductor cores in all cables, that is:
where
is number of cables, among which the required one is located, pcs.;
is number of conductor cores in one cable, pcs.
The application of an acoustic signal also allows a reduction in the number of identification operations as the supplied acoustic signal can be detected in all conductor cores in a cable, albeit with different sound pressure levels. In this case, the identification process will consist of two steps: first, it will be necessary to test one core of each cable and, after detecting the required cable, to test each core until the required conductor is found. Thus, the number of identification operations will be found by Equation (20):
where
is number of cores in a cable where the identified conductor is located, pcs.;
is number of cables, among which the required one is located, pcs.
Examples should be considered to understand the importance of this constituent. Therefore, if there are two three-core cables among which a conductor is needed to be identified, a continuity test or signal tracing methods would require a maximum of six identification operations. If the acoustic method is applied in this case, four operations would be required. This difference will be higher when more cable and cores are used. Likewise, the maximum number of identification operations among three four-core cables will be twelve for standard methods and six for the acoustic method.
Therefore, the analysis of conductor identification operation time revealed that the acoustic method has an undeniable advantage over other methods such as continuity test or signal tracing. The proposed method allows a significant reduction in both the duration of conductor identification operation as well as the number of these operations.
6. Conclusions
For identifying conductors, there are many methods, among which it is possible to distinguish the simple one as visual contact and device-based ones such as a continuity test and signal tracing. Although the operation of conductor identification seems an easy job and a deeply researched topic, there are some stumbling blocks to consider and resolve. In some cases, conductor identification may turn out to be time-consuming due to the large quantity of unidentified conductors (cables) and the certain stipulation that conductors should be de-energized and have uninsulated parts. The proposed method based on the use of an acoustic signal as a trace signal carrier makes it possible to facilitate the identification process and ameliorate the problems of other methods. It is achieved by the fact that the acoustic signal can be fed directly through the insulation at any point of the conductor.
Mathematical modeling of sound propagation in conductors and insulation and calculations within it allowed assessment of the possibility of the application of the acoustic method for identifying conductors. According to the model, the main parameter of acoustic signal propagation in conductors is sound pressure level, which is influenced by such factors as the length of identified conductor, the frequency of applied acoustic signal, the cross-section of conductor and its material, the thickness and material of conductor insulation and the speed of sound waves in conductors and insulating materials. The performed calculations revealed that the acoustic method has remarkable capabilities for identifying conductors. Therefore, the difference in sound pressure level between at distance from the identification point to the signal source of 5 m and that of 100 m is only 3.65%. The difference in sound pressure level at the minimum and maximum cross sections (1 mm2 and 25 mm2, respectively) is insignificant and amounts to 0.07 dB. Likewise, the insulation type of conductors also has a negligible effect on sound propagation.
The assembled prototype of conductor identification device showed the hypothesis of using acoustic signal for identifying conductors holds. The results from a multivariate experiment matched the theoretical data obtained using the developed mathematical model. The average percentage of discrepancy was approximately 1.44%, while the maximum did not exceed 2.9%. In addition, the cost of prototype assembly amounted to approximately US$ 142, which indicates the economic feasibility of the proposed method.
The conducted analysis of conductor identification operation time revealed that the acoustic method has an undeniable advantage over other methods such as continuity testing or signal tracing. The proposed method allows for a significant reduction both in the duration of conductor identification operation as well as the number of these operations. Nevertheless, further study is needed to gather and analyze practical experience with the proposed method in various laying conditions of conductors as well as various conductor types. It will allow, first, for the identification of the best application areas for the method and developing recommendations for method application; second, for the indication of possible errors and assessment of the method’s reliability; third, for the improvement of the developed mathematical model of sound propagation in conductors. In addition, improving the method’s technological implementation is also an important area of research, that is, upgrading the conductor identification device.


