3.1. Life Cycle Impact Assessment
The EFs of the production of the conventional and the innovative SP are demonstrated in detail for the most significant ReCiPe impact category of climate change (excluding biogenic carbon) in
Figure 6. The burdens of the most important used materials and processes are also included.
In general, climate change states that an emission of a greenhouse gas causes an increased atmospheric concentration of greenhouse gases, which, in turn, increase the radiative forcing capacity, thus raising the global mean temperature. Climate change is solely due to CO
2 emissions and to a lesser extent to methane and nitrous oxide (Ν
2O) emissions from combustion of gas for thermal processes and lignite for electricity generation [
33].
As it is observed in
Figure 6, the carbon footprint of the CP is equal to 1.52 × 10
−1 kg CO
2 equivalent (eq.), whereas the footprint of the SP is 59.7% higher and equal to 2.44 × 10
−1 kg CO
2 eq.
Starting with the CP, the sectors with the greatest burden on climate change are the raw materials needed for its production, namely LDPE and HDPE granulates, which are responsible for 69% of its carbon footprint. This is in line with the study of Siracusa et al. (2014), who observed that the most environmentally impacting phases during the production of a plastic food packaging are the production of the granules [
41]. This fact is expected since LLDPE and HDPE granulates are fossil based materials and for or during their production there is consumption of fossil resources, release of emissions and consumption of energy that have negative impact on the environment [
42].
Concerning the SP, the burdens presented in
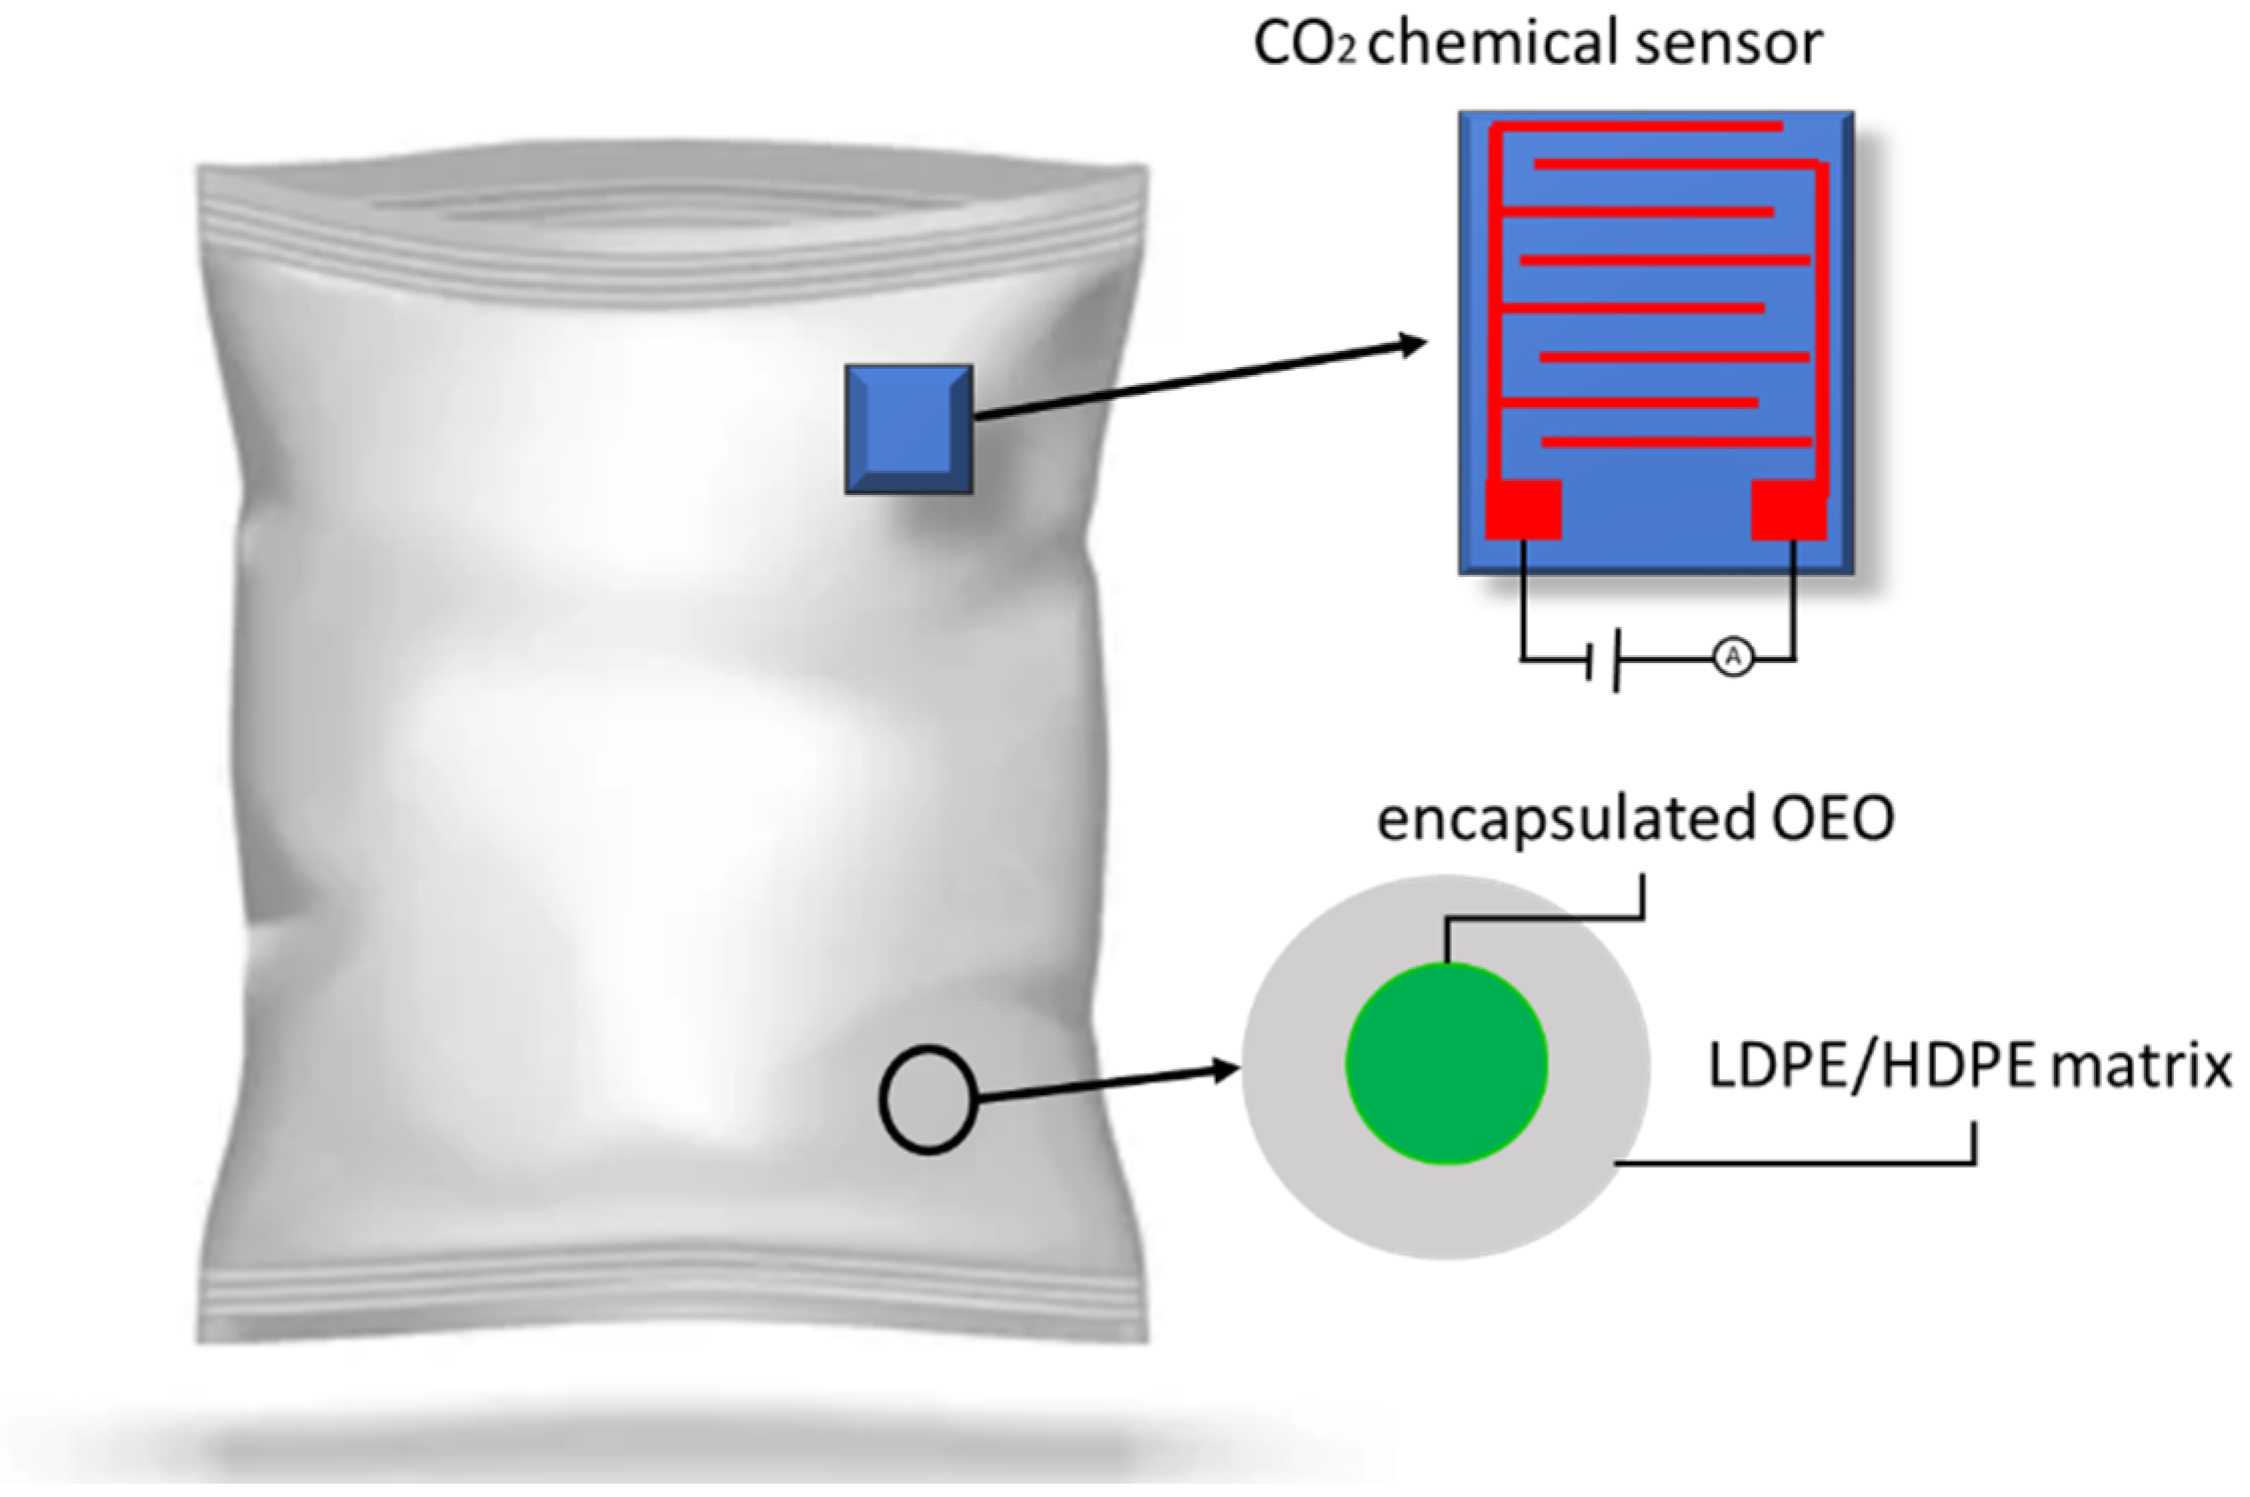
Figure 6 refer to the production of the CP, which is described previously, the fabrication of the integrated sensor for CO
2 detection and the production of the OEO that attributes the property of AP. Among the two new agents added in the packaging, the CO
2 chemical sensor has the predominant share in the additional burden of the SP and, therefore, the detailed carbon footprint of its fabrication is presented in
Figure 7.
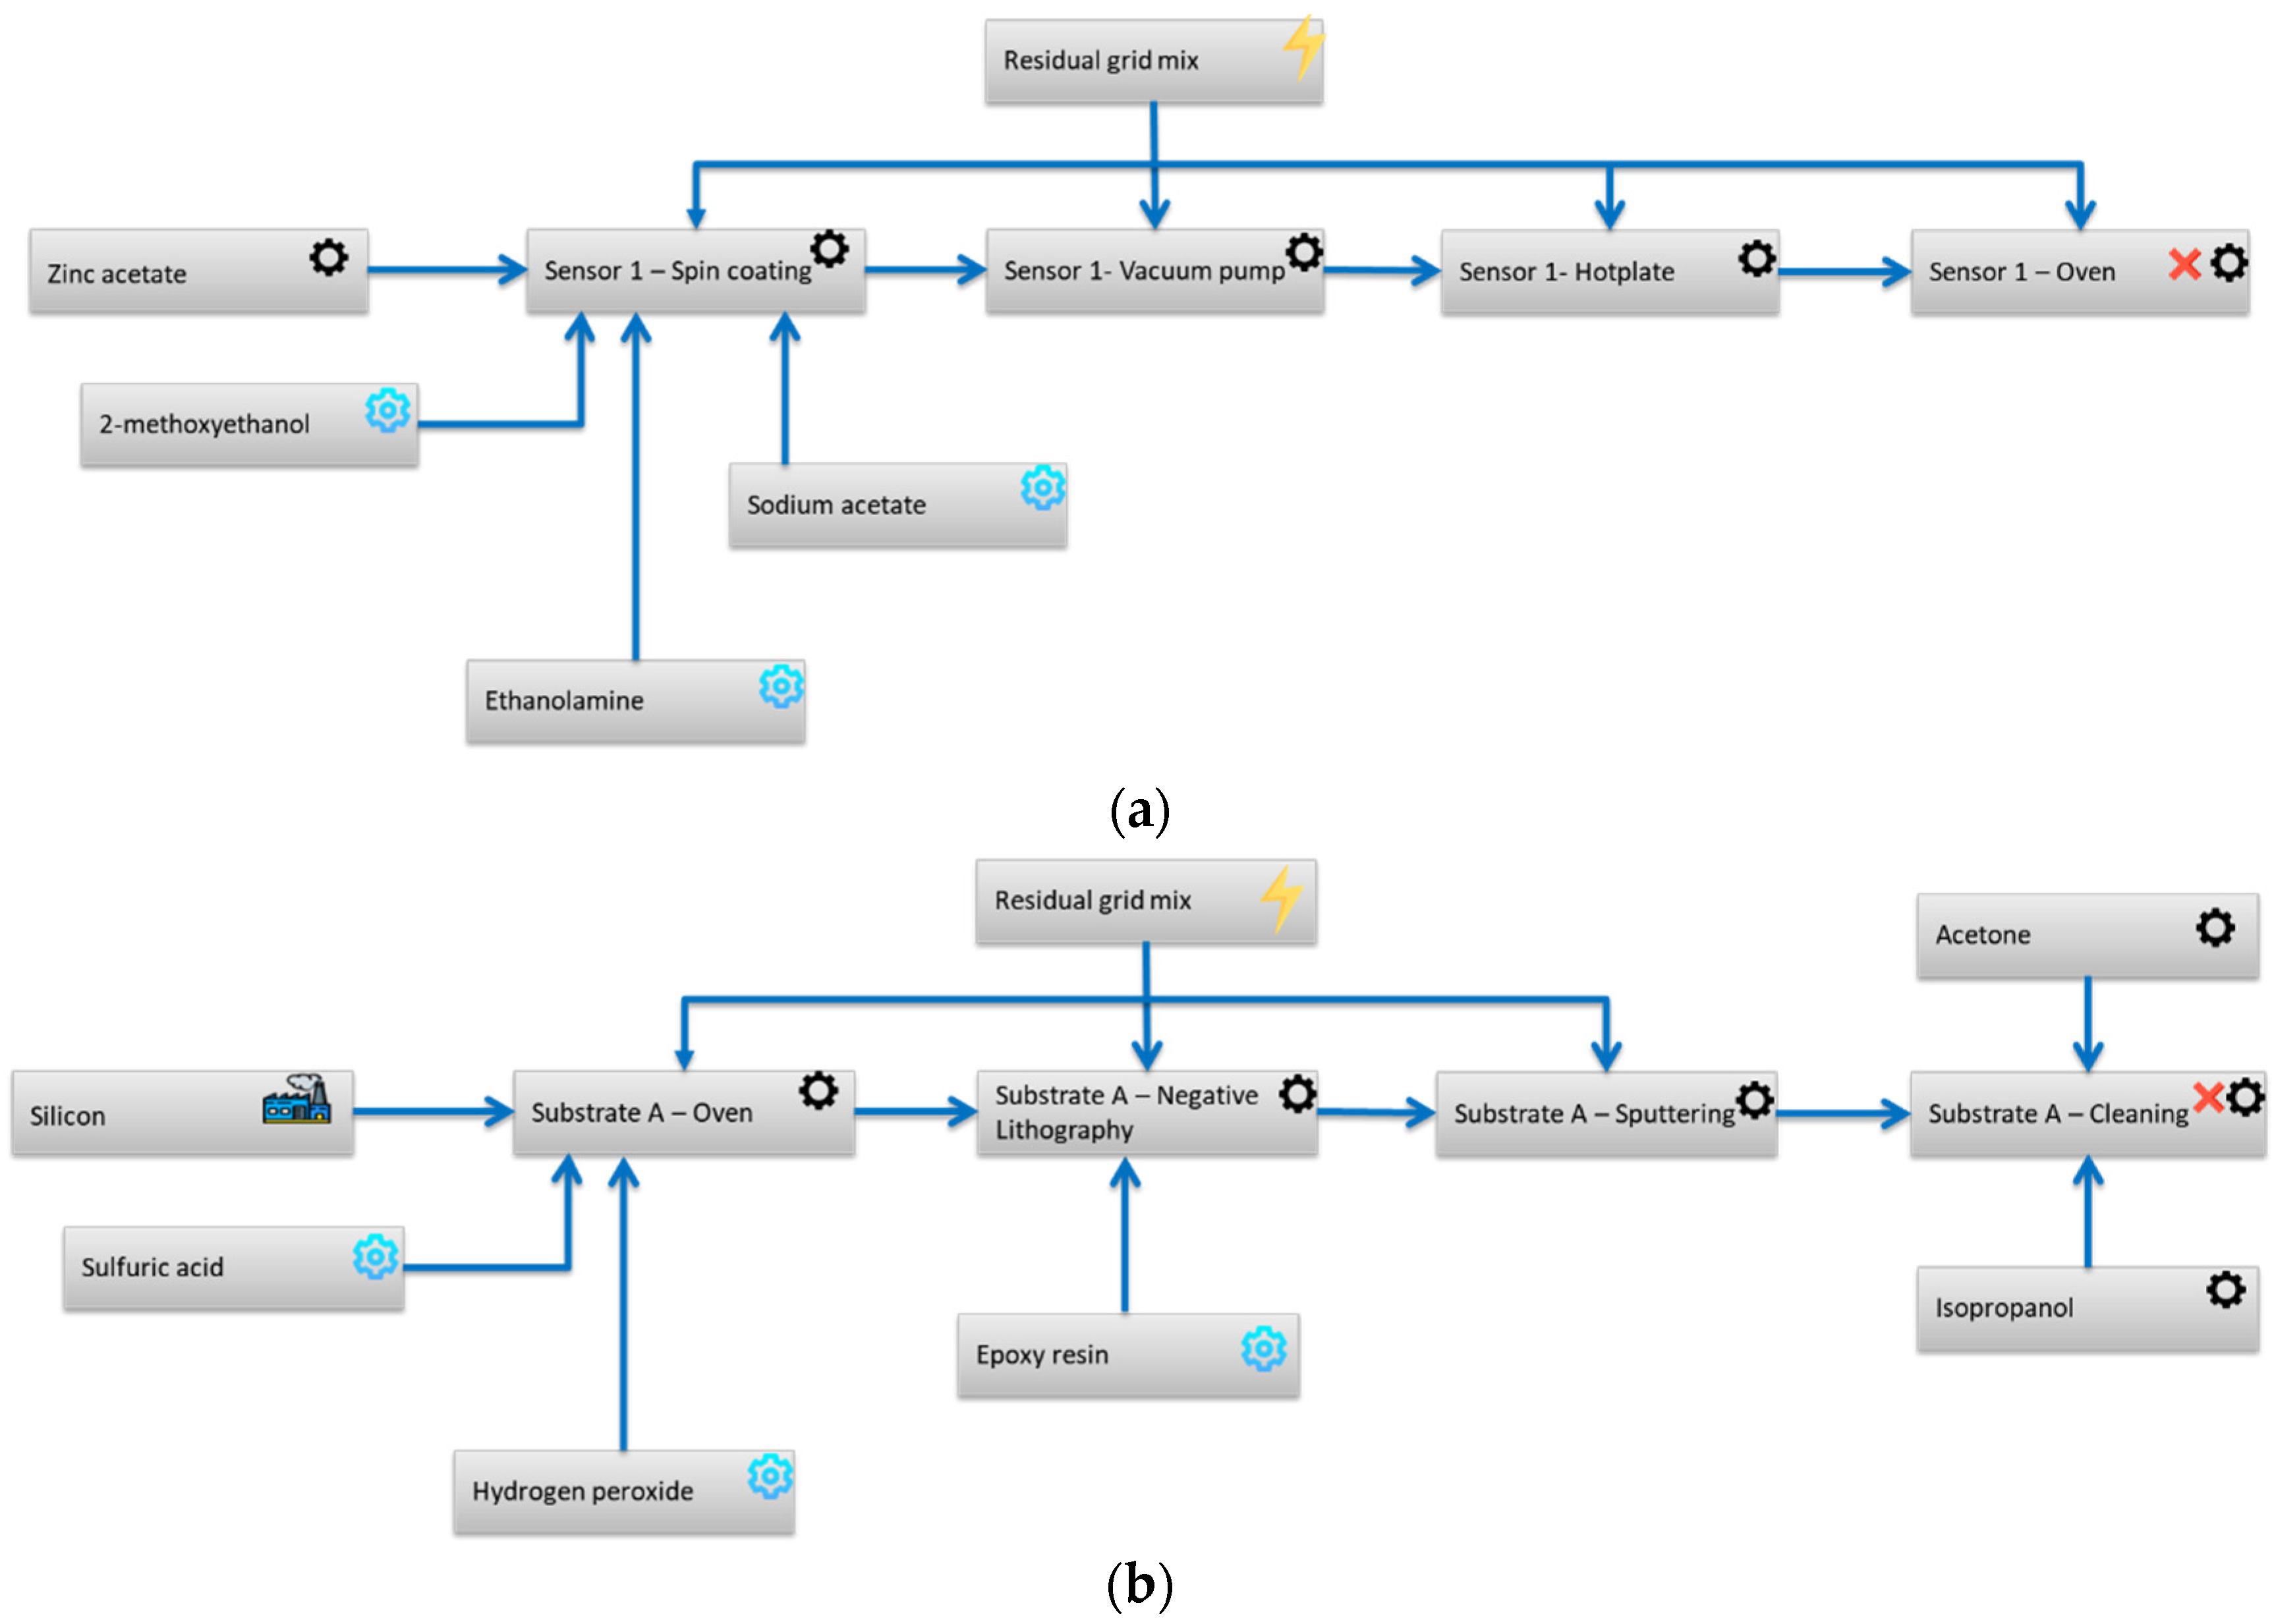
As observed in
Figure 7, the fabrication of the substrate A (SiO
2 substrate) has the largest contribution in climate change category due to the significant electricity consumption during the processes of the annealing in the oven, the negative lithography and the DC magnetron sputtering, as it is also highlighted in
Table 3. Among the different materials used for the fabrication of the integrated CO
2 sensor, the solvent of 2-methoxyethanol is the most “damaging” because of its large quantity required for the fabrication of the sensing film, compared to the zinc acetate, ethanolamine and sodium acetate, whose quantities are approximately 9, 32 and 670 times lower. On the contrary, the substrate B that is exclusively produced from PET has the lowest carbon contribution.
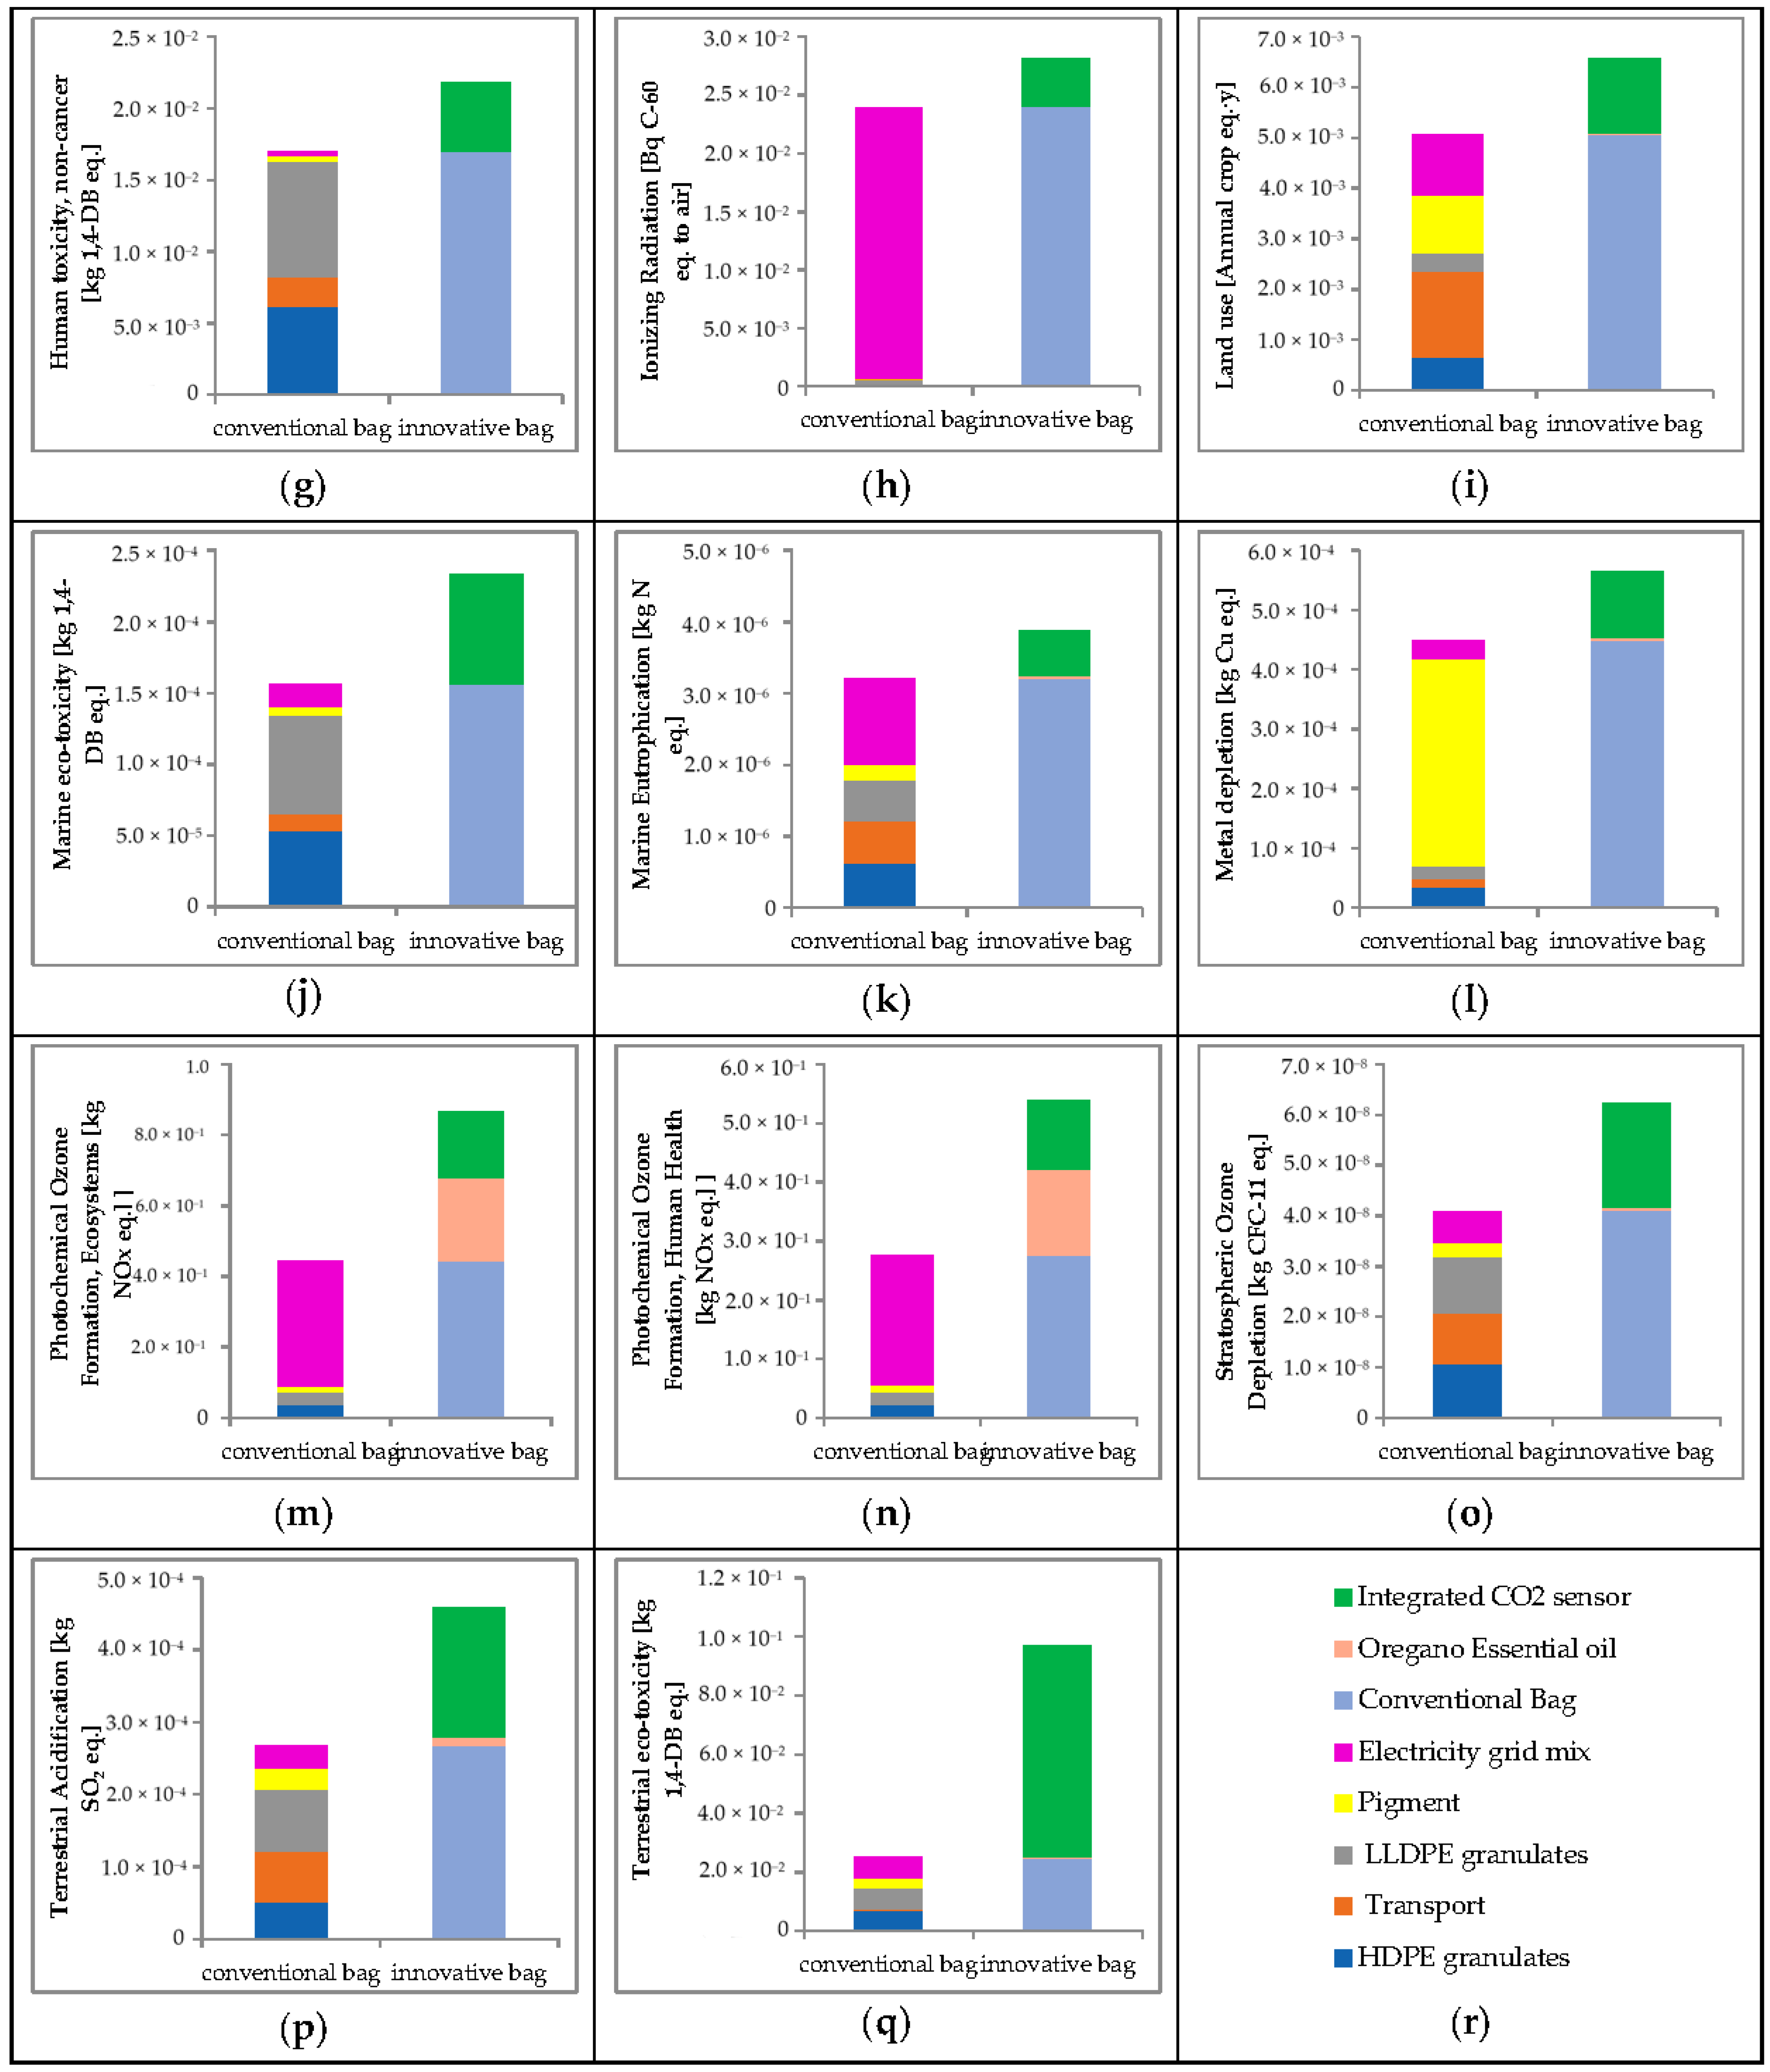
The EFs of the production of the conventional and the innovative packaging concerning the other 17 ReCiPe categories are presented in
Figure 8.
Starting with the CP, the highest burden in most of the impact categories, and, specifically, in fine particulate matter formation, fossil depletion, freshwater, marine and terrestrial eco−toxicity, human toxicity (cancer and non-cancer), stratospheric ozone depletion and terrestrial acidification is due to the LDPE granulates. This means that the raw materials are responsible for the major environmental burden mainly associated with respiratory inorganics and fossil fuels impact categories, as it is also confirmed in the study of Leceta et al. (2013) [
43]. In general, conventional plastics, manufactured from petrochemical polymers, such as LDPE, from fossil fuels consume non-renewable and finite resources [
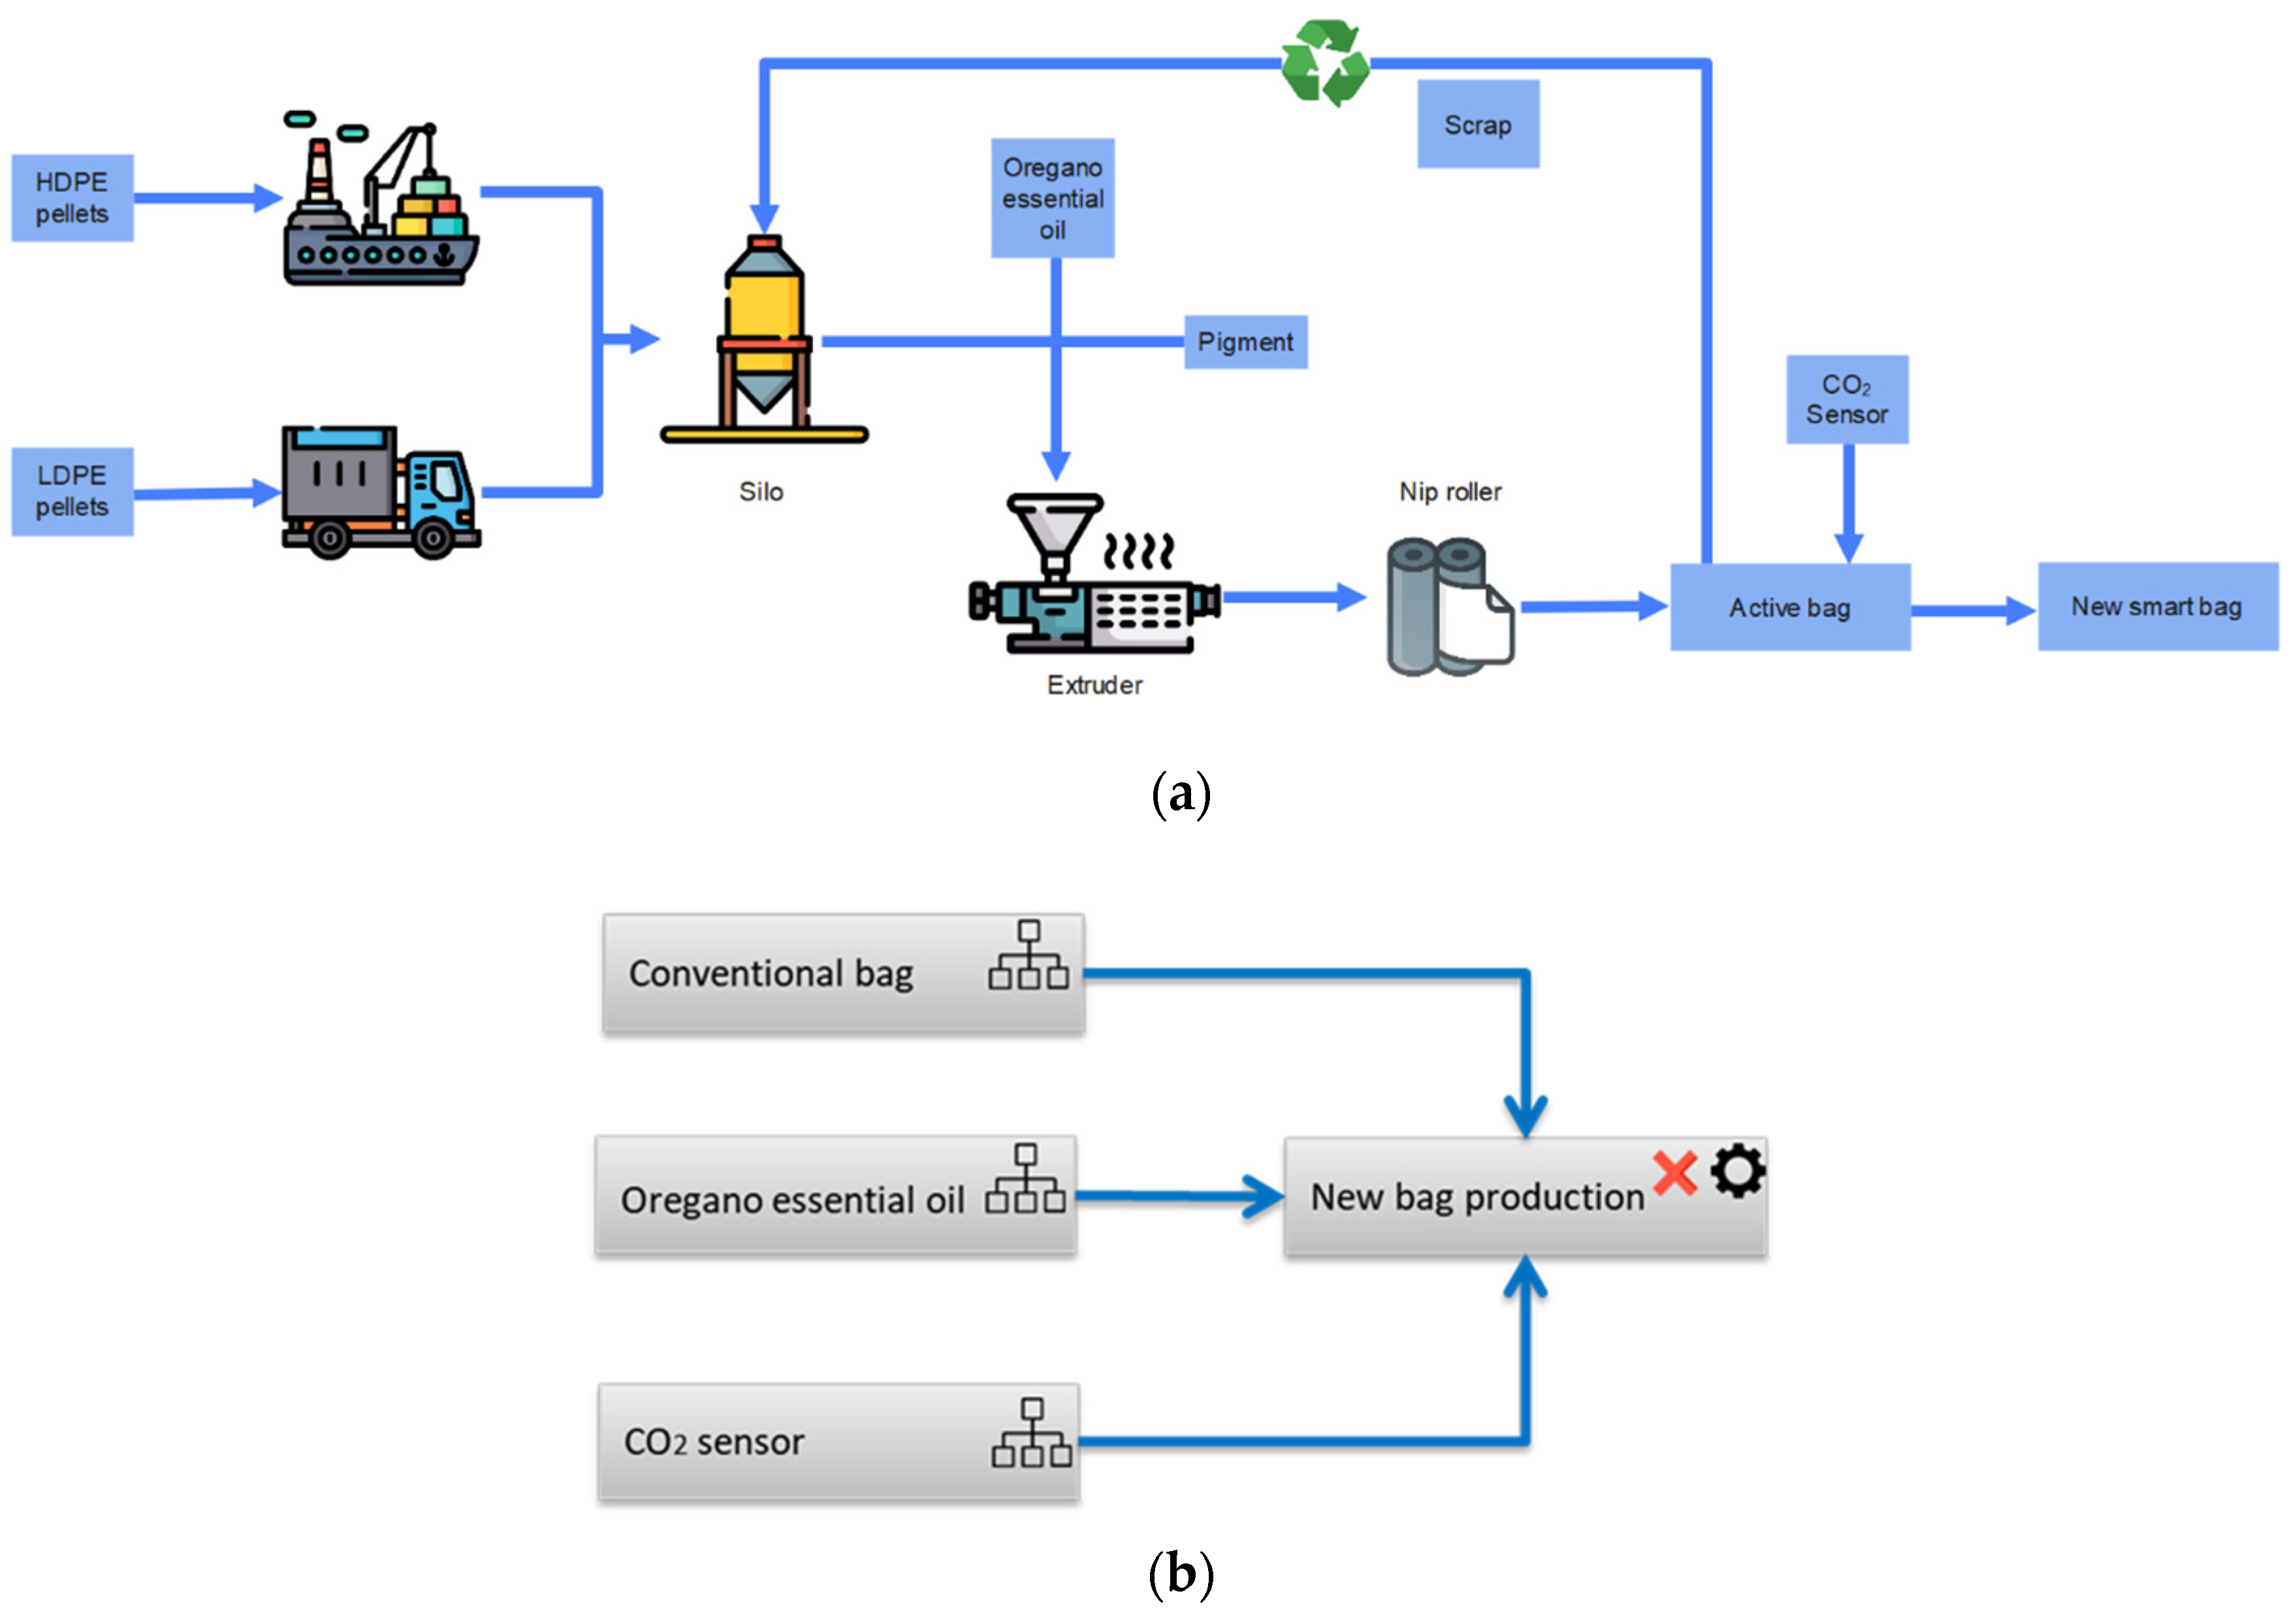
44] and the production of their granulates is a crucial stage when considering their EF. It is worth mentioning that the fact that our study involves recycled material at a high percentage of 60% contributes to the lowering of the environmental load of the whole CP. In fact, Gomez and Escobar (2022) mentioned that by increasing the amount of recyclable material during the production of plastic bags, the environmental impact is considerably reduced since the raw material extraction is avoided [
42]. The next most influential life cycle stage is the manufacturing of the packaging, and specifically the extrusion, the nip rolling, the cutting and the recycling extrusion, which are represented by the factor of electricity grid mix in
Figure 8, whereas the transport and the pigment have minor shares. These results are in complete agreement with the work of Mori et al. [
45], who performed an LCA analysis of LDPE bags and found out that the highest contribution in all impact categories is by the granulate production (approximately 60–80%), followed by the bag manufacturing (30%) and transport (~2%) [
45].
Considering the innovative packaging, its environmental impact is elevated in all the studied categories, compared to CP, predominantly due to the addition of the CO
2 chemical sensor (IP) and to a negligible extent due to the encapsulation of OEO (AP). As in the climate change category, the most important burden of the CO
2 integrated sensor is attributed to the SiO
2 substrate (Substrate A) and, specifically, to the electricity since high amounts of it are required mainly for the DC sputtering, which is a energy-intensive process (electricity consumption: 200 Wh). A better comparison between the EFs of the conventional and the SP systems can be achieved through
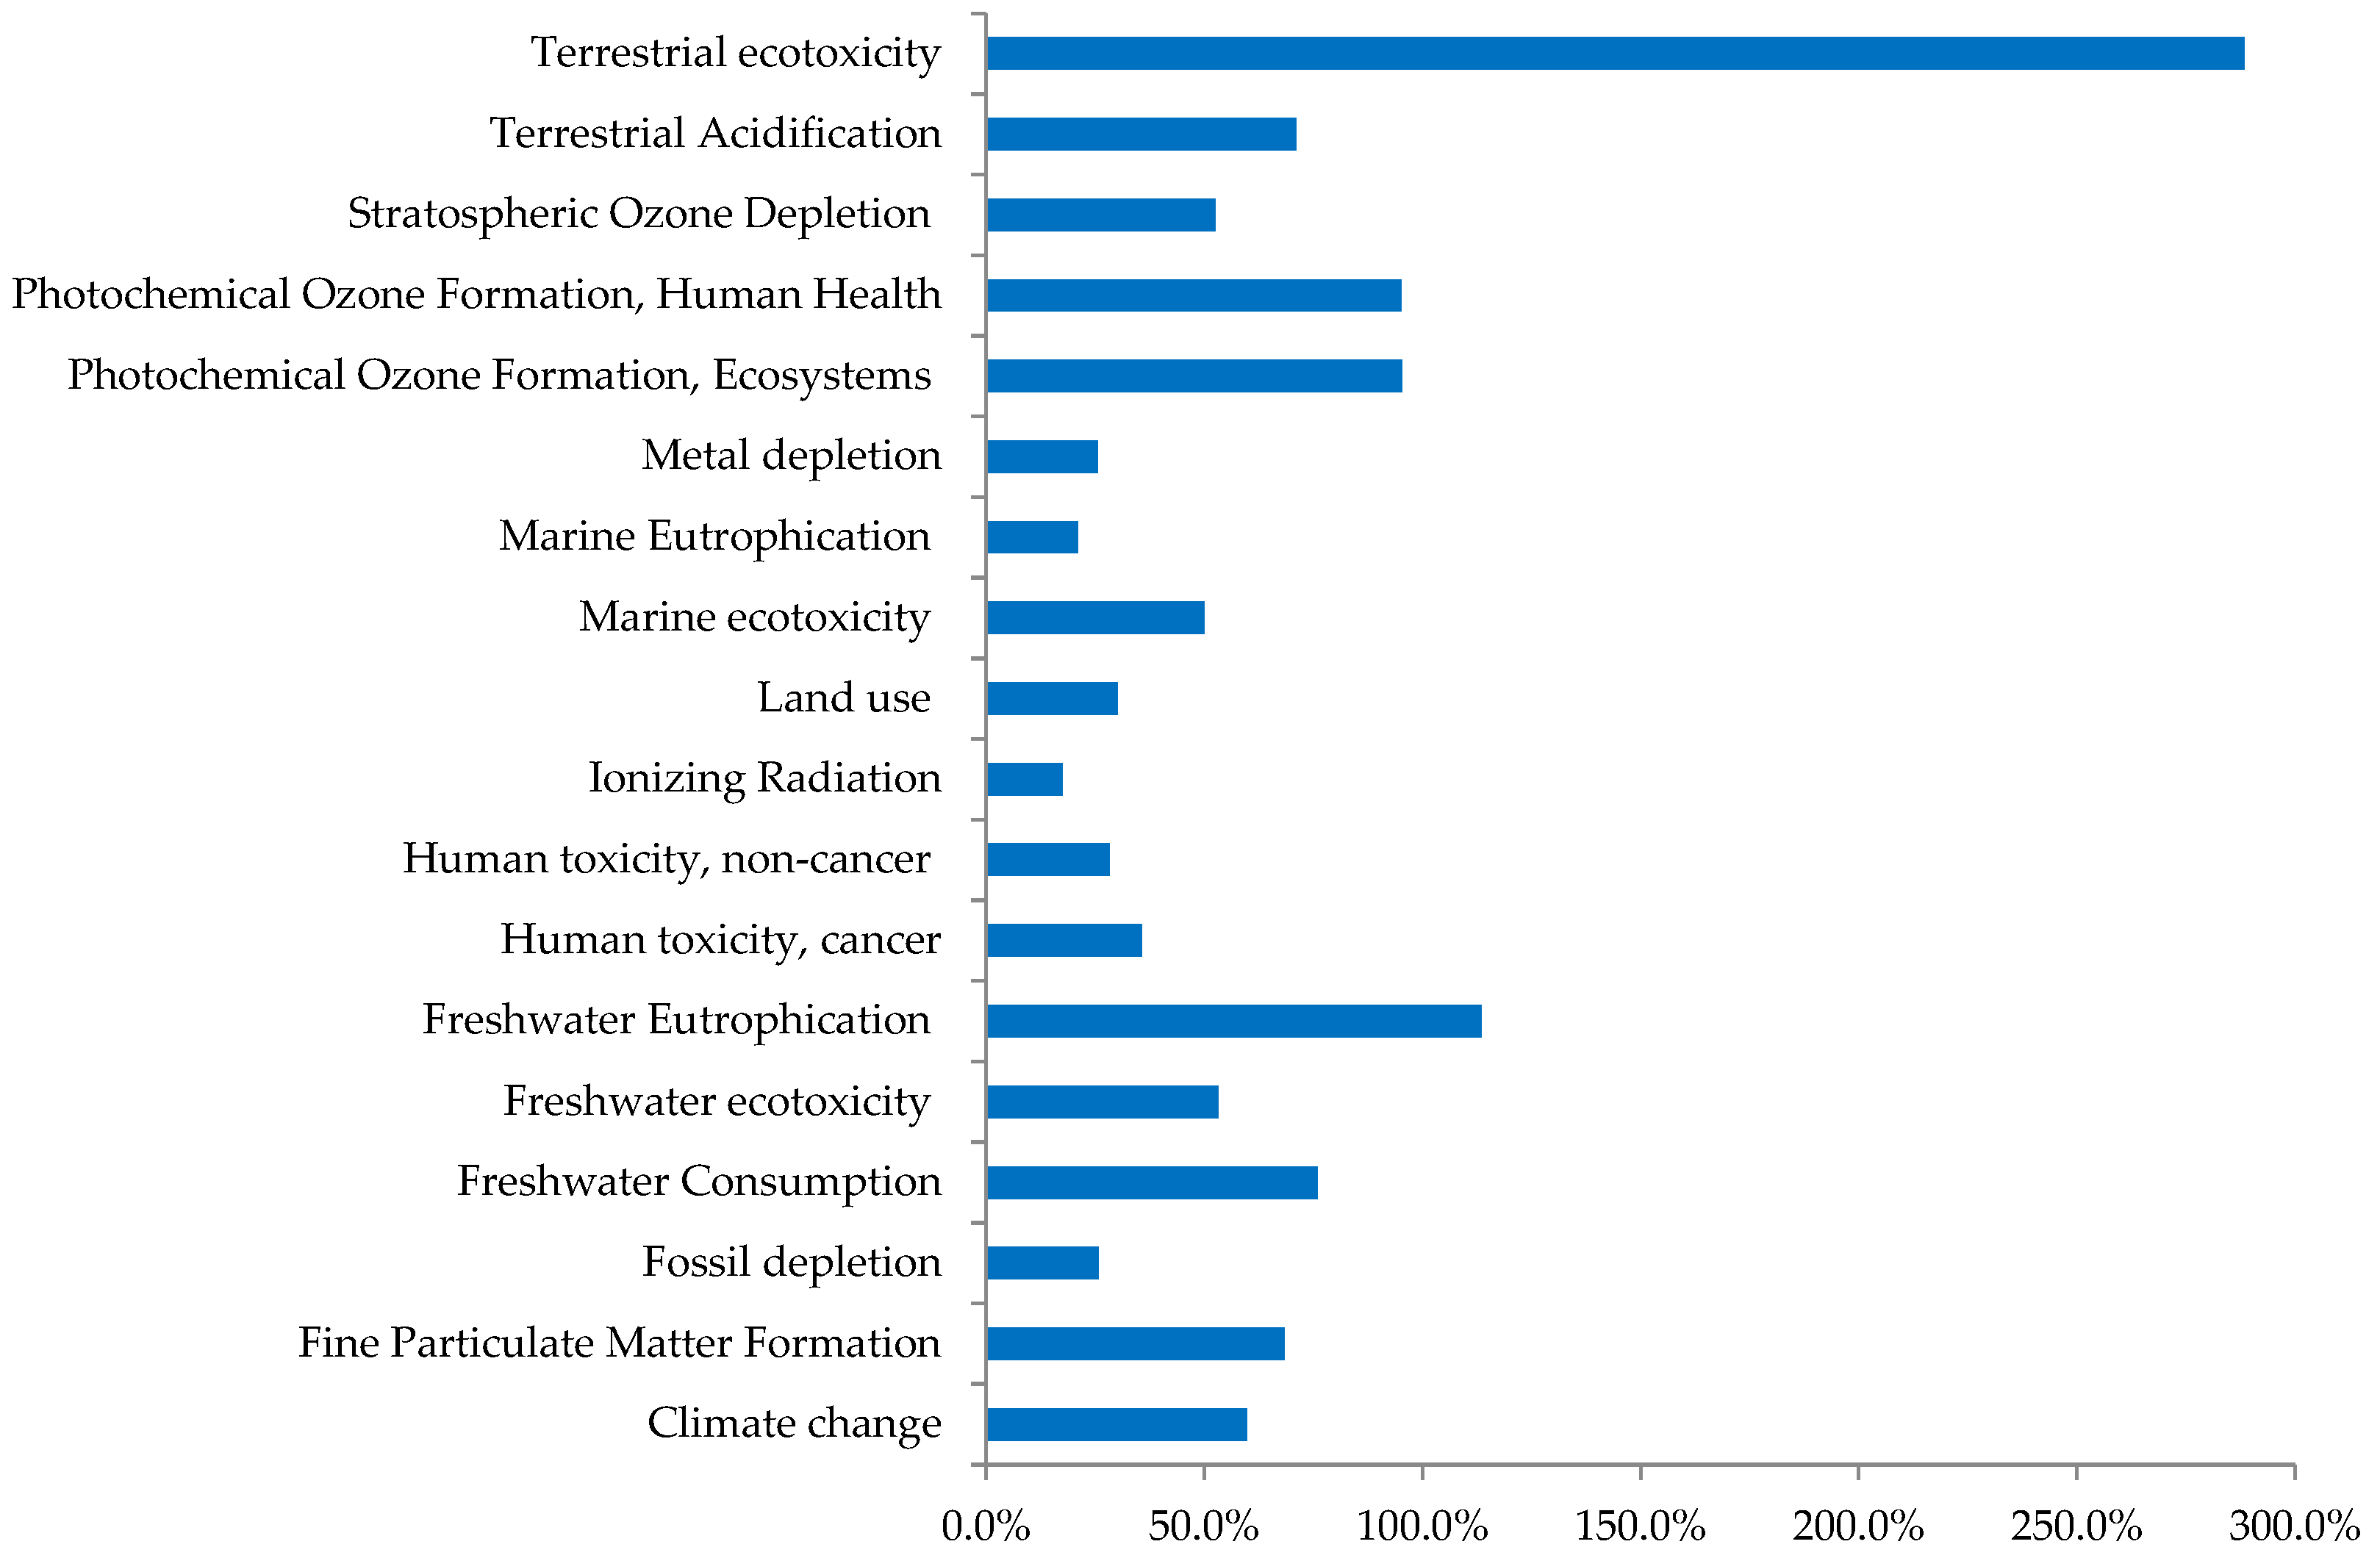
Figure 9. There, the rates of the increase of the EF (EF) of the SP compared to that of the CP, calculated as [(EF innov − EF conv) × (EF conv)
−1], are presented.
The average rate of the EF increases of the SP, after the addition of the chemical sensor and the OEO in the CP, is equal to 67.1%. The impact category that is the most significantly affected by the integration of the chemical sensor is the terrestrial eco-toxicity (increase rate: 288.3%). This huge additional burden is principally imputed (by 74.1%) to the source material of the CO
2 sensing film, zinc acetate. In general, zinc acetate is a salt produced by the reaction of acetic acid with zinc oxide or zinc metal. The primary hazard of zinc acetate is the threat posed to the environment since it is toxic to terrestrial plants and animals [
46]. Actually, in the study of Boros and Ostafe (2020), zinc was proved harmful for terrestrial organisms [
47]. Furthermore, in the work of Siracusa et al. (2014), it is mentioned that the emission compartment of zinc is soil [
41].
However, zinc oxide is extensively documented as a gas sensitive material, especially towards the extremely important gas of CO
2 thanks to its various and unique qualities [
48]. It should also be mentioned that ZnO nanoparticles are generally recognized as safe (GRAS) by the US Food and Drug Administration and they have been widely used in antimicrobial packaging films for food products [
49].
As it was expected, the inclusion of additional agents in a traditional CP burdens the environmental performance when considering solely the stage of the packaging production. However, the remarkable benefits of SP are observed at the stage of its use, as well as at the stage of the EoL of the contained product. The reason for this is that the principal aim of SP is the extension of the shelf life of the contained food products, and, consequently, the reduction of food waste generation. Therefore, in the next section (Discussion), the two important stages of the use and the EoL of both packagings and their contained sensitive food product are taken into consideration.
3.2. Interpretation of Environmental Impacts
The evaluation and the comparison of the environmental impact of CP and SP, including their use and their EoL, as well as the EoL of the contained sensitive food product (e.g. fruits, vegetables and meat) equal to 10 kg, was performed by adapting four use scenarios in order to achieve a broader and more complete estimation. More precisely, the scenarios claim that:
the CP generates 30% food waste
the SP can generate 5% food waste (optimistic scenario)
the SP can generate 10% food waste (realistic scenario)
the SP can generate 20% food waste (conservative scenario).
The scenarios are based on the fact that the SP prolongs the shelf life of the contained sensitive product by delaying the microbial spoilage through the controlled release of the antimicrobial agents of the encapsulated OEO. The additional shelf life allows the reduction of the wastage of the product contained in the SP compared to that contained in CP.
The comparative environmental assessment results are shown in
Figure 10.
As it can be seen, when considering the stages after the production of the packaging, the trend of the environmental performance is modified with the carbon footprint of CP being equal to 4.97 kg CO2 eq., whereas the footprint values of SP at the optimistic, realistic and conservative scenario are lowered to 3.93, 4.16 and 4.61 kg CO2 eq., respectively.
Figure 10 includes the sectors of the production of packaging (described in detail previously), the production of the sensitive food product, the food retail, the EoL of the plastic waste comprising of 37% recycling, 40% incineration and 23% landfilling and the EoL of the organic waste derived from the packaged food product consisting of 40% composting and 60% landfilling.
Among all the aforementioned sectors, the production of the contained food product has the greatest burden in all the scenarios in the climate change impact category with an average value of 62.8% since it has the highest weight (10 kg) compared to 67.86 g of the SP. The production of the sensitive food product requires important amounts of energy, water, fertilisers and pesticides in the case of fruit or vegetable, etc. However, this factor presents the same value in every case and does not affect the comparison of the environmental performance of the different packaging systems in our study.
The most crucial factor is the EoL of the organic waste, the environmental burden of which is 1.36 kg CO
2 eq. in the CP case contributing to the 27.4% of the total environmental burden. On the contrary, in the optimistic, realistic and conservative scenario of the SP, the burden of the EoL of the organic waste is significantly decreased to 0.23, 0.25 and 0.91 kg CO
2 eq., contributing to the 5.8, 10.9 and 19.6% of the total load, respectively. This reduction has an obvious impact in the environmental performance of the SP that is improved not only in the most significant impact category of climate change, but also in other ReCiPe impact categories, as shown in
Table 5.
In
Table 5, the EFs of the production, use and EoL of the packaging systems, as well as of the EoL of the contained food product, on all the ReCiPe impact categories are demonstrated. Furthermore, the rate of change of the EF of the SP compared to that of CP, which is calculated as: [(EF innov − EF conv) × (EF conv)
−1], is presented. Negative percentages indicate superiority of the SP compared to CP, whereas positive values of the rates show inferiority of the SP.
Starting with the optimistic scenario, the SP demonstrates negative rates at 14 out of 18 impact categories, confirming its clear environmental advantages over CP. In the other 4 categories the percentages of SP are positive, but their values are very low (<3%), with the only exception of ionizing radiation category, in which the value of the rate of change is high-end equal to 8.3%. This is because the higher footprint of the production of SP compared to CP is not counterbalanced in this category by the less wastage of the contained sensitive product achieved by SP.
In general, ionizing radiation is related to the anthropogenic emissions of radionuclides into the environment generated during the nuclear fuel cycle (mining, processing and waste disposal), as well as during other human activities, such as coal burning and phosphate rocks extraction [
34]. The benefit of the smaller amounts of food waste by SP, which is reflected in the decrease of the footprint of food waste EoL, is not as important as in the other impact categories. Therefore, the superiority of the SP is not highlighted in ionizing radiation.
Concerning the realistic scenario, the innovative SP has lower environmental impact (negative rates) than the CP on 11 categories, approximately the same environmental impact on 5 categories (rates range: 0–3.5%) and higher environmental impact on the 2 categories of ionizing radiation and terrestrial eco-toxicity (8.3 and 5.1%, respectively). As explained in the previous section, the chemical sensor that is used in the SP for CO2 detection is based on zinc oxide, which contains a heavy metal with negative effects in terrestrial plants and animals and this is the reason for the increased load in terrestrial eco-toxicity category.
Finally, when adapting the conservative scenario, the SP demonstrates improved environmental performance in 7 impact categories (negative rates), almost the same performance as CP in 6 categories (rates range: 0–1%) and worse performance in 5 categories (rates range: 4.7–13.0%). These are fossil depletion, ionizing radiation, photochemical ozone formation (ecosystems and human health) and terrestrial eco-toxicity categories.
Overall, SP is substantially superior to CP when considering their environmental footprint in many impact categories and, especially, in climate change, the environmental importance of which is rated by the Federal Environment Agency as being “very high” [
50].


 ,
, 


