1. Introduction
Rapid urbanisation of many large cities around the world has led to a sharp increase in heavy vehicle congestion. Traffic congestion is known to degrade ambient air quality and increase noise pollution, collisions, and driver frustration [
1,
2]. London, being the largest city in the UK and among the most populated urban city centres of the world (this estimate does not include the thousands that travel from the suburbs to the capital for work daily), suffers from the worst traffic congestion in the UK, and is among the worst in Europe [
3]. The Congestion Charge was introduced to specific areas within the centre of London with the aim to reduce congestion and ensuing greenhouse gas emissions. There is now an ultra-low emission zone (ULEZ) charge in operation in central and outer London aimed at reducing nitrogen dioxide by around 30% across London [
4].
Connected fully autonomous vehicles (ConFAVs) have the potential to increase road capacity using vehicle platooning [
5], with a lower impact on land occupancy due to a reduced demand in available parking spaces, while allowing basic access to transport for individuals who are unable to drive and promoting equity among the able-bodied and disabled users. However, many public opinion surveys have been undertaken worldwide about the use of autonomous and self-driving vehicles, and the results have shown common concerns that lead to public hesitance towards the technology. Some common concerns included software misuse/hacking, data privacy, inclement weather, interacting with conventional vehicles, interaction with vulnerable road users (i.e., pedestrians and cyclists), user safety, affordability, equipment failure, legal liability of owners, and allowing their child to ride in the car by themselves [
6,
7,
8,
9,
10,
11,
12]. Studies have shown that it may be difficult for passengers to tell the difference between the vehicle driving autonomously and them being driven by a human [
13],
Using vehicle-to-vehicle communication, ConFAVs on similar route trajectories can travel together in a platoon to increase efficiency. Research has defined a vehicle platoon as a group of connected automated vehicles (CAVs) traveling together at a consensual speed, following the leading vehicle while maintaining a predetermined inter-vehicle distance [
14]. Platooning is considered to contribute to the improvement of mobility, fuel consumption, travel time, and traffic safety. The concept has been tested in a series of real-world trials [
15,
16] funded by government bodies and private firms, to study the strategies and technologies for platooning vehicles on un-modified public highways [
17,
18].
The present research study was designed to examine if a network’s efficiency could change with the number of ConFAVs within it, by looking at the changes in average delays and level of service (LOS) of two isolated networks in East London.
1.1. The Definition of Traffic Congestion
Researchers have over the years published different definitions of traffic congestion, with the most common being defined as a traffic state impacted by traffic flow parameters—such as volume, speed, and density—or as a phenomenon of lost time caused by slow moving vehicles. Another theory looks at the relationship between traffic supply and demand, where traffic congestion develops when the traffic demand exceeds the amount of traffic that the road can supply (capacity) [
19]. The term ‘congestion’ is therefore defined in the context of this research as the state of traffic impacted by lost time (delay) caused by slow-moving vehicles.
1.2. Maximising Transportation Resources Using Intelligent Transport Systems
Jiehao Sun et al. (2021) analysed the control and management of urban traffic congestion, proposing countermeasures and solutions to alleviate traffic congestion by breaking down six specific ways in which urban congestion could be optimised. These are listed in
Table 1 [
19]. Their research argues that one way to optimise conditions to reduce congestion is
“vigorously” developing intelligent transportation systems to make use of and improve the existing road resources.
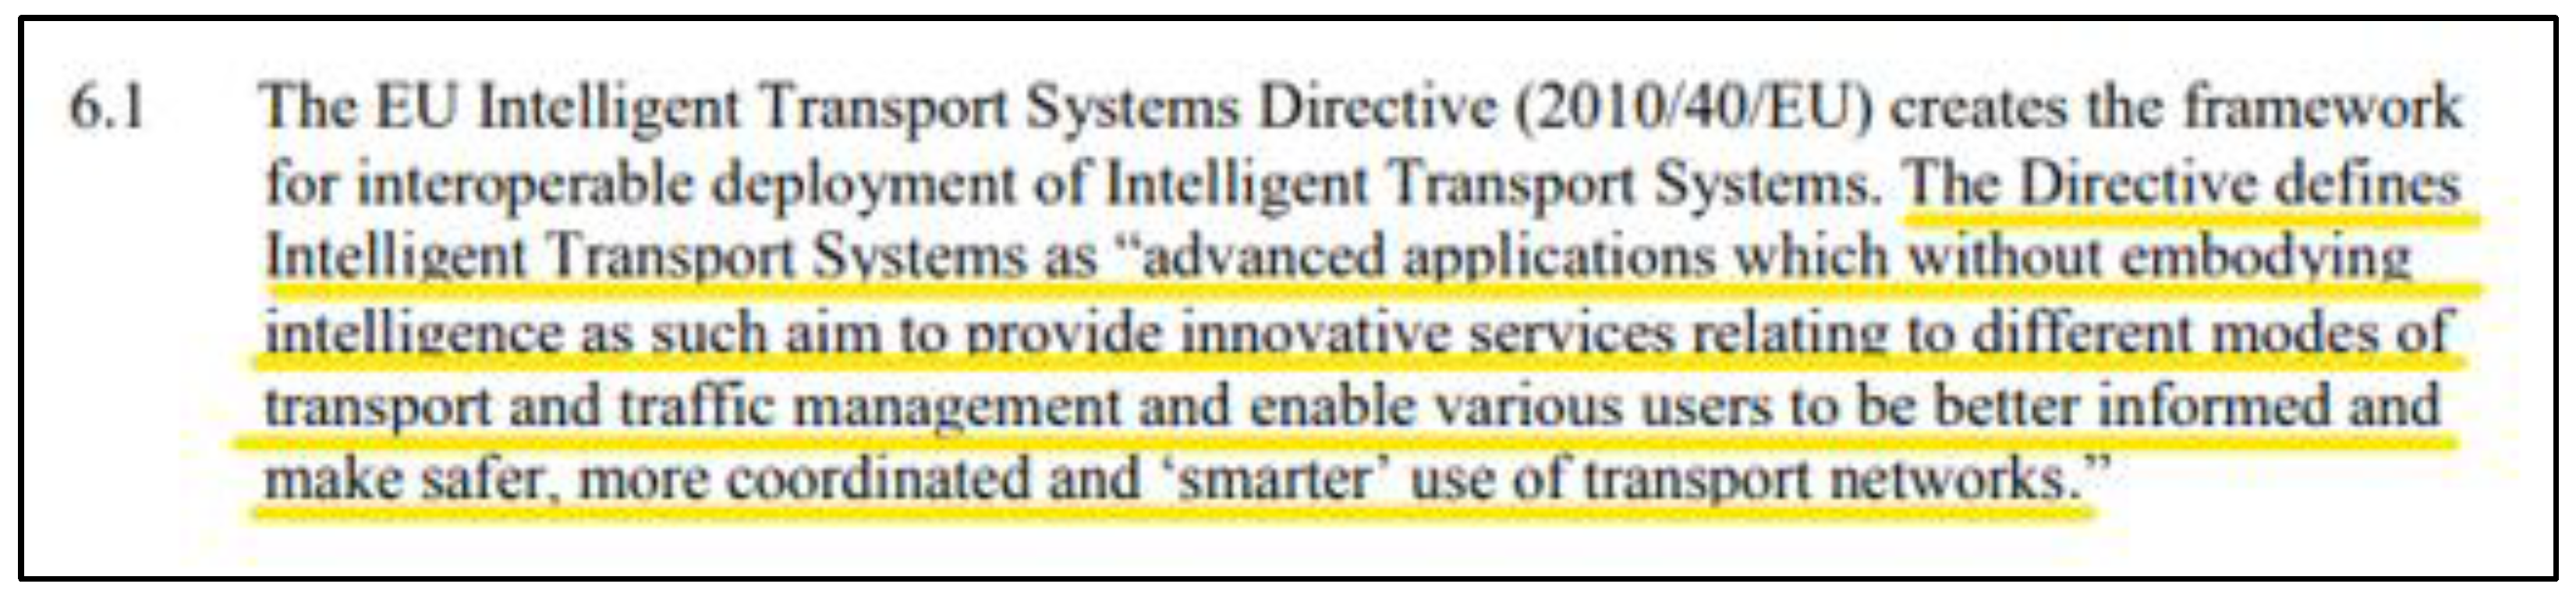
Intelligent Transport Systems or ‘ITS’—as described by the European Commission’s Directive 2010/40/EU in
Figure 1 [
20]—could play a significant role in reducing some negative effects of transport and potentially become a major contributor for fulfilling the European Union’s aim of a
‘sustainable and well-functioning’ transport sector increasing safety while tackling Europe’s growing emission and congestion problems [
21,
22].
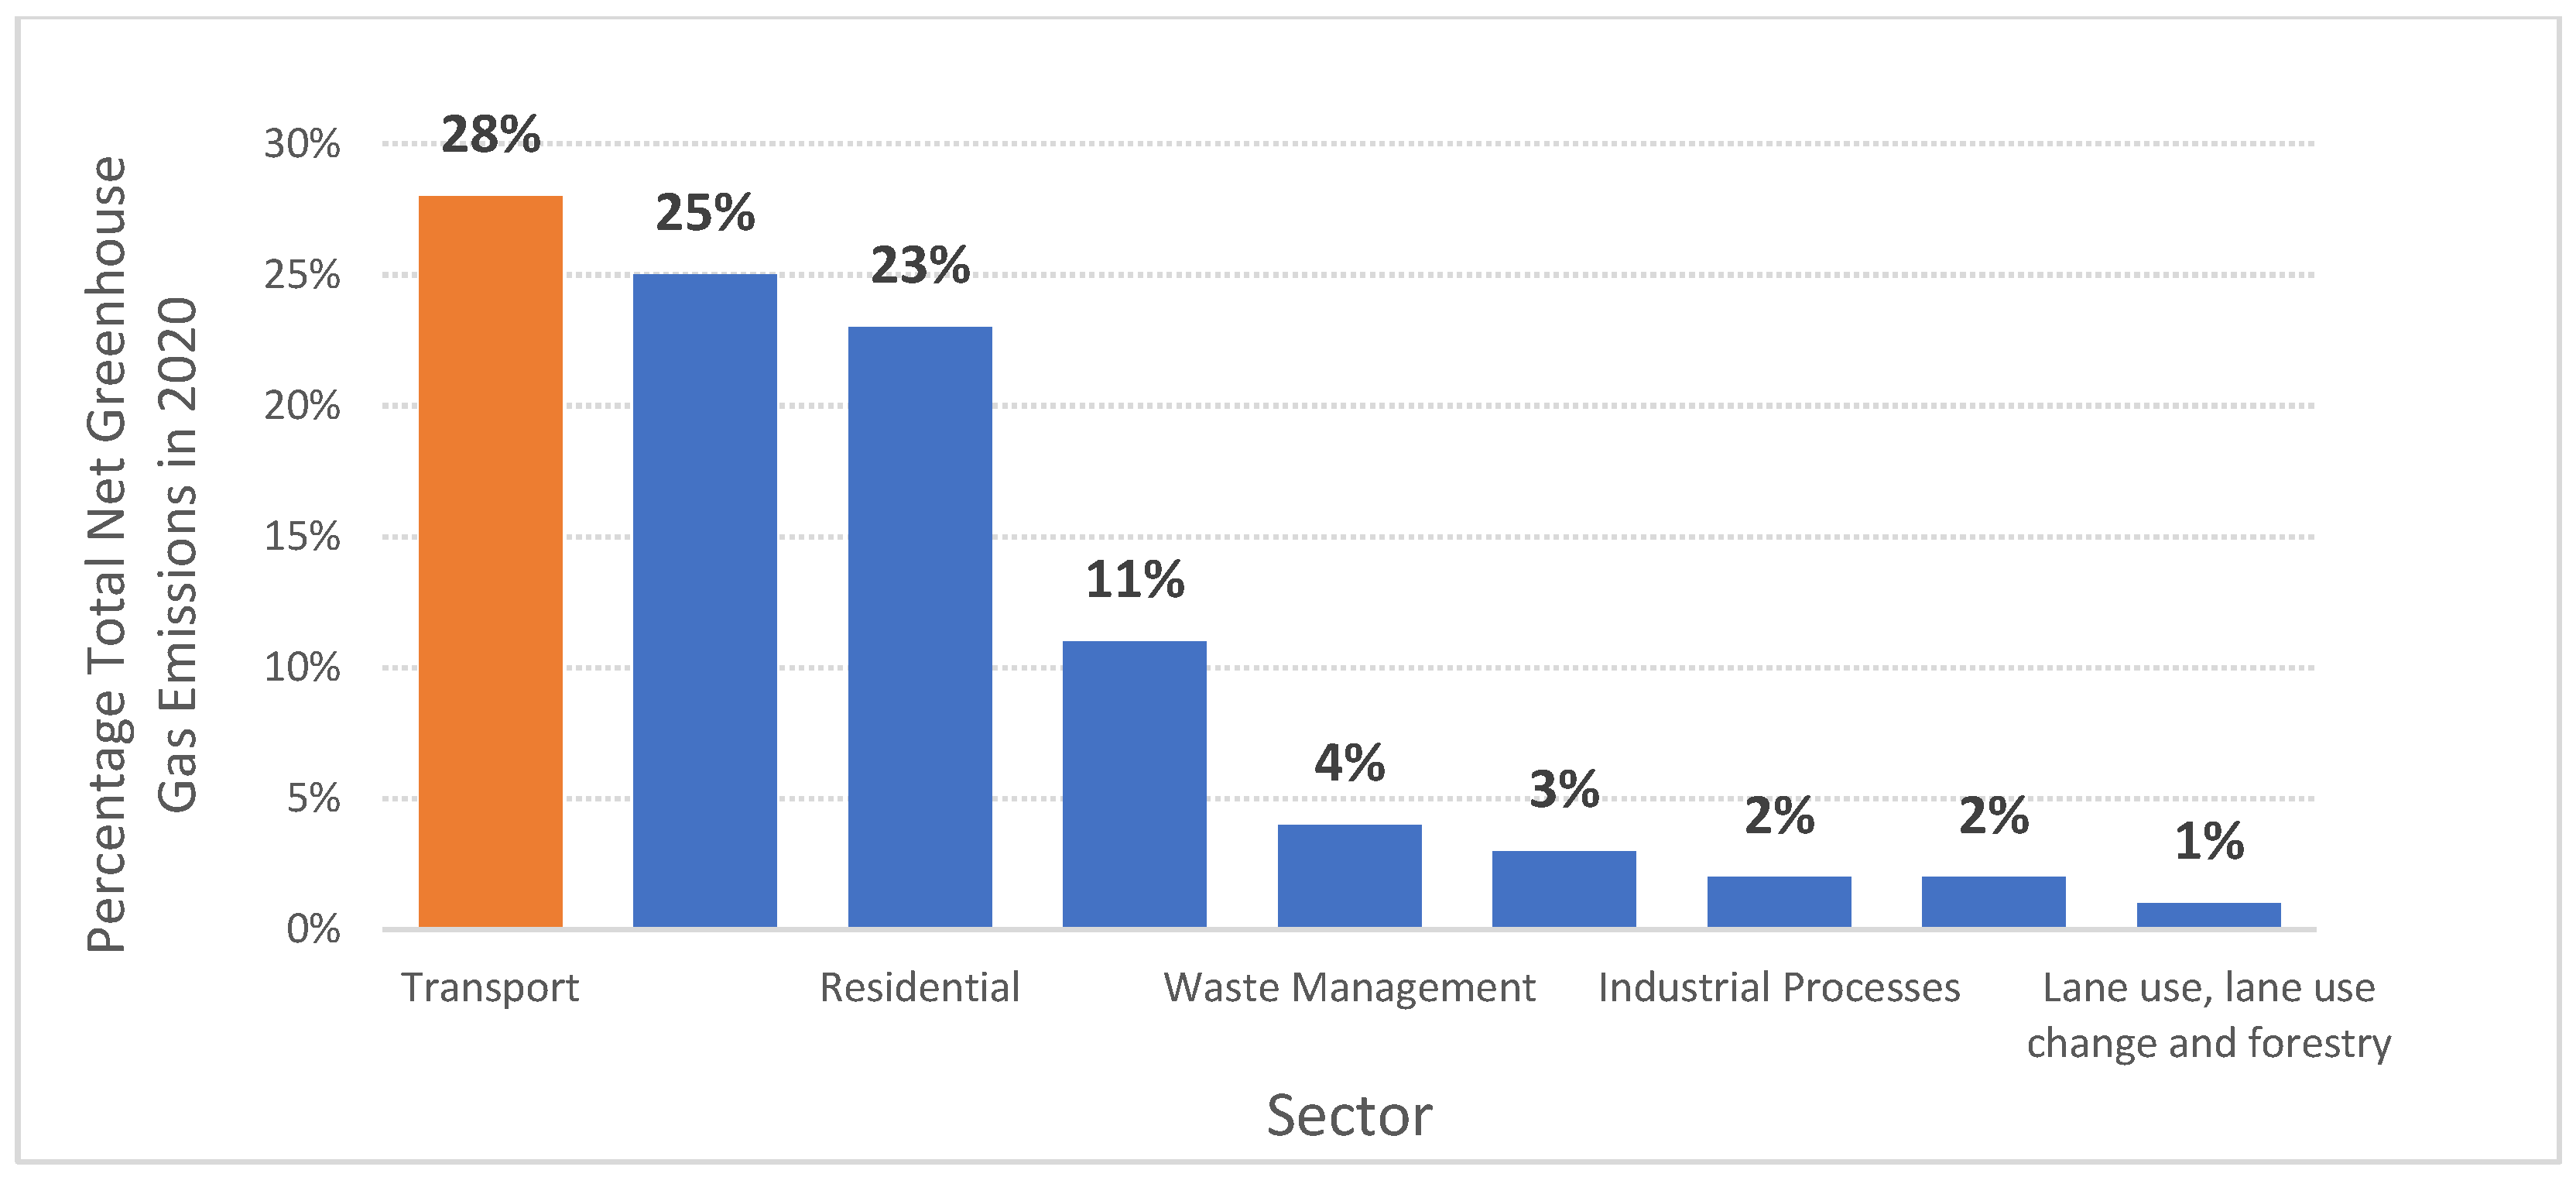
1.3. The Impact of the Transportation Sector on Greenhouse Gas Emissions
According to statistics published by the Department of Business, Energy & Industrial Strategy, the transportation sector was responsible for around 28% of UK greenhouse gas end-user emissions in 2020—mostly by measuring carbon dioxide emissions [
23]. This national figure is measured only by vehicles used in road transport, domestic aviation, railways, and domestic shipping; emissions from transport related infrastructure, air conditioning, international aviation and shipping emissions are not accounted for.
Figure 2 shows how the transport sector compares against others.
It should be noted that carbon dioxide emissions measured in the statistics above for the transportation sector were closely related to the amount of fuel used, whilst nitrous oxide and methane emissions were influenced more by the age and type of vehicle [
23]. Research shows that drivers go through a variety of driving cycles during congested conditions, which leads to extra fuel consumption [
24].
1.4. Transport in East London
This study has been focussed on a developing section of East London which is known for great transportation links. The area has excellent connections for rapid transit, light rail, buses, and taxis, and it features an extensive network of cycle routes. Research undertaken by the UK’s Department for Transport (DfT) shows that 27% of commuters travelled to work by car in 2018 [
25]. Further and more in-depth research carried out by Transport for London (TfL) in 2020 shows that the main mode of travel across a 7-day week was public transport.
Table 2 below details the number (in millions) of estimated daily average trips in Greater London by the mode of transport.
Table 3 draws a comparison of travelling by car versus public transport and other modes collectively. This shows that just about a third of all journeys over 2018 and 2019 were conducted by cars [
26].
In summary, almost a third of greenhouse gas emissions are a direct result of the transportation industry (road, domestic aviation, railways, and domestic shipping) and just over a third of journeys in Greater London are undertaken by car. This research aims to develop insight into whether or not ConFAVs replacing conventional human-driven cars could have an impact on congestion, and as a result improve fuel efficiency and reduce fuel-related greenhouse gas emissions.
3. Methodology
3.1. Overview of the Proposed Model
To address shortcomings of current models, where the ConFAV’s behaviour remained the same regardless of the type of vehicle it followed, the model developed in the present study programmed the ConFAV to be more cautious when following a conventional human driven vehicle. This model was then used to examine the potential for ConFAVs to reduce congestion and associated carbon footprint. To achieve this, the car-following behaviour was programmed using Wiedemann 99 parameters and platoons were allowed up to a maximum of six vehicles.
The road networks for the case studies were simulated using PTV VISSIM software. The model was calibrated and validated using field data collected from several sites within the Queen Elizabeth Olympic Park in East London. Another shortcoming addressed in the current research work is the limited information about the transitional period from zero autonomy to full autonomy on the already congested road network, as these vehicles are typically tested individually or in small numbers and in a controlled environment. This was addressed by modelling different network penetration levels of ConFAVs by gradually introducing them into the network traffic volume, namely 0%, 20%, 40%, 60%, 80%, and 100% (i.e., until all vehicles within the network were ConFAVs). The resulting average delays were noted against each penetration level, and similarly noted for the subsequent level of service for the roads. This helped to understand how the network’s efficiency changes when the number of ConFAVs increases, and the potential benefits for these self-driving vehicles on congestion and the ensuing greenhouse gas emissions.
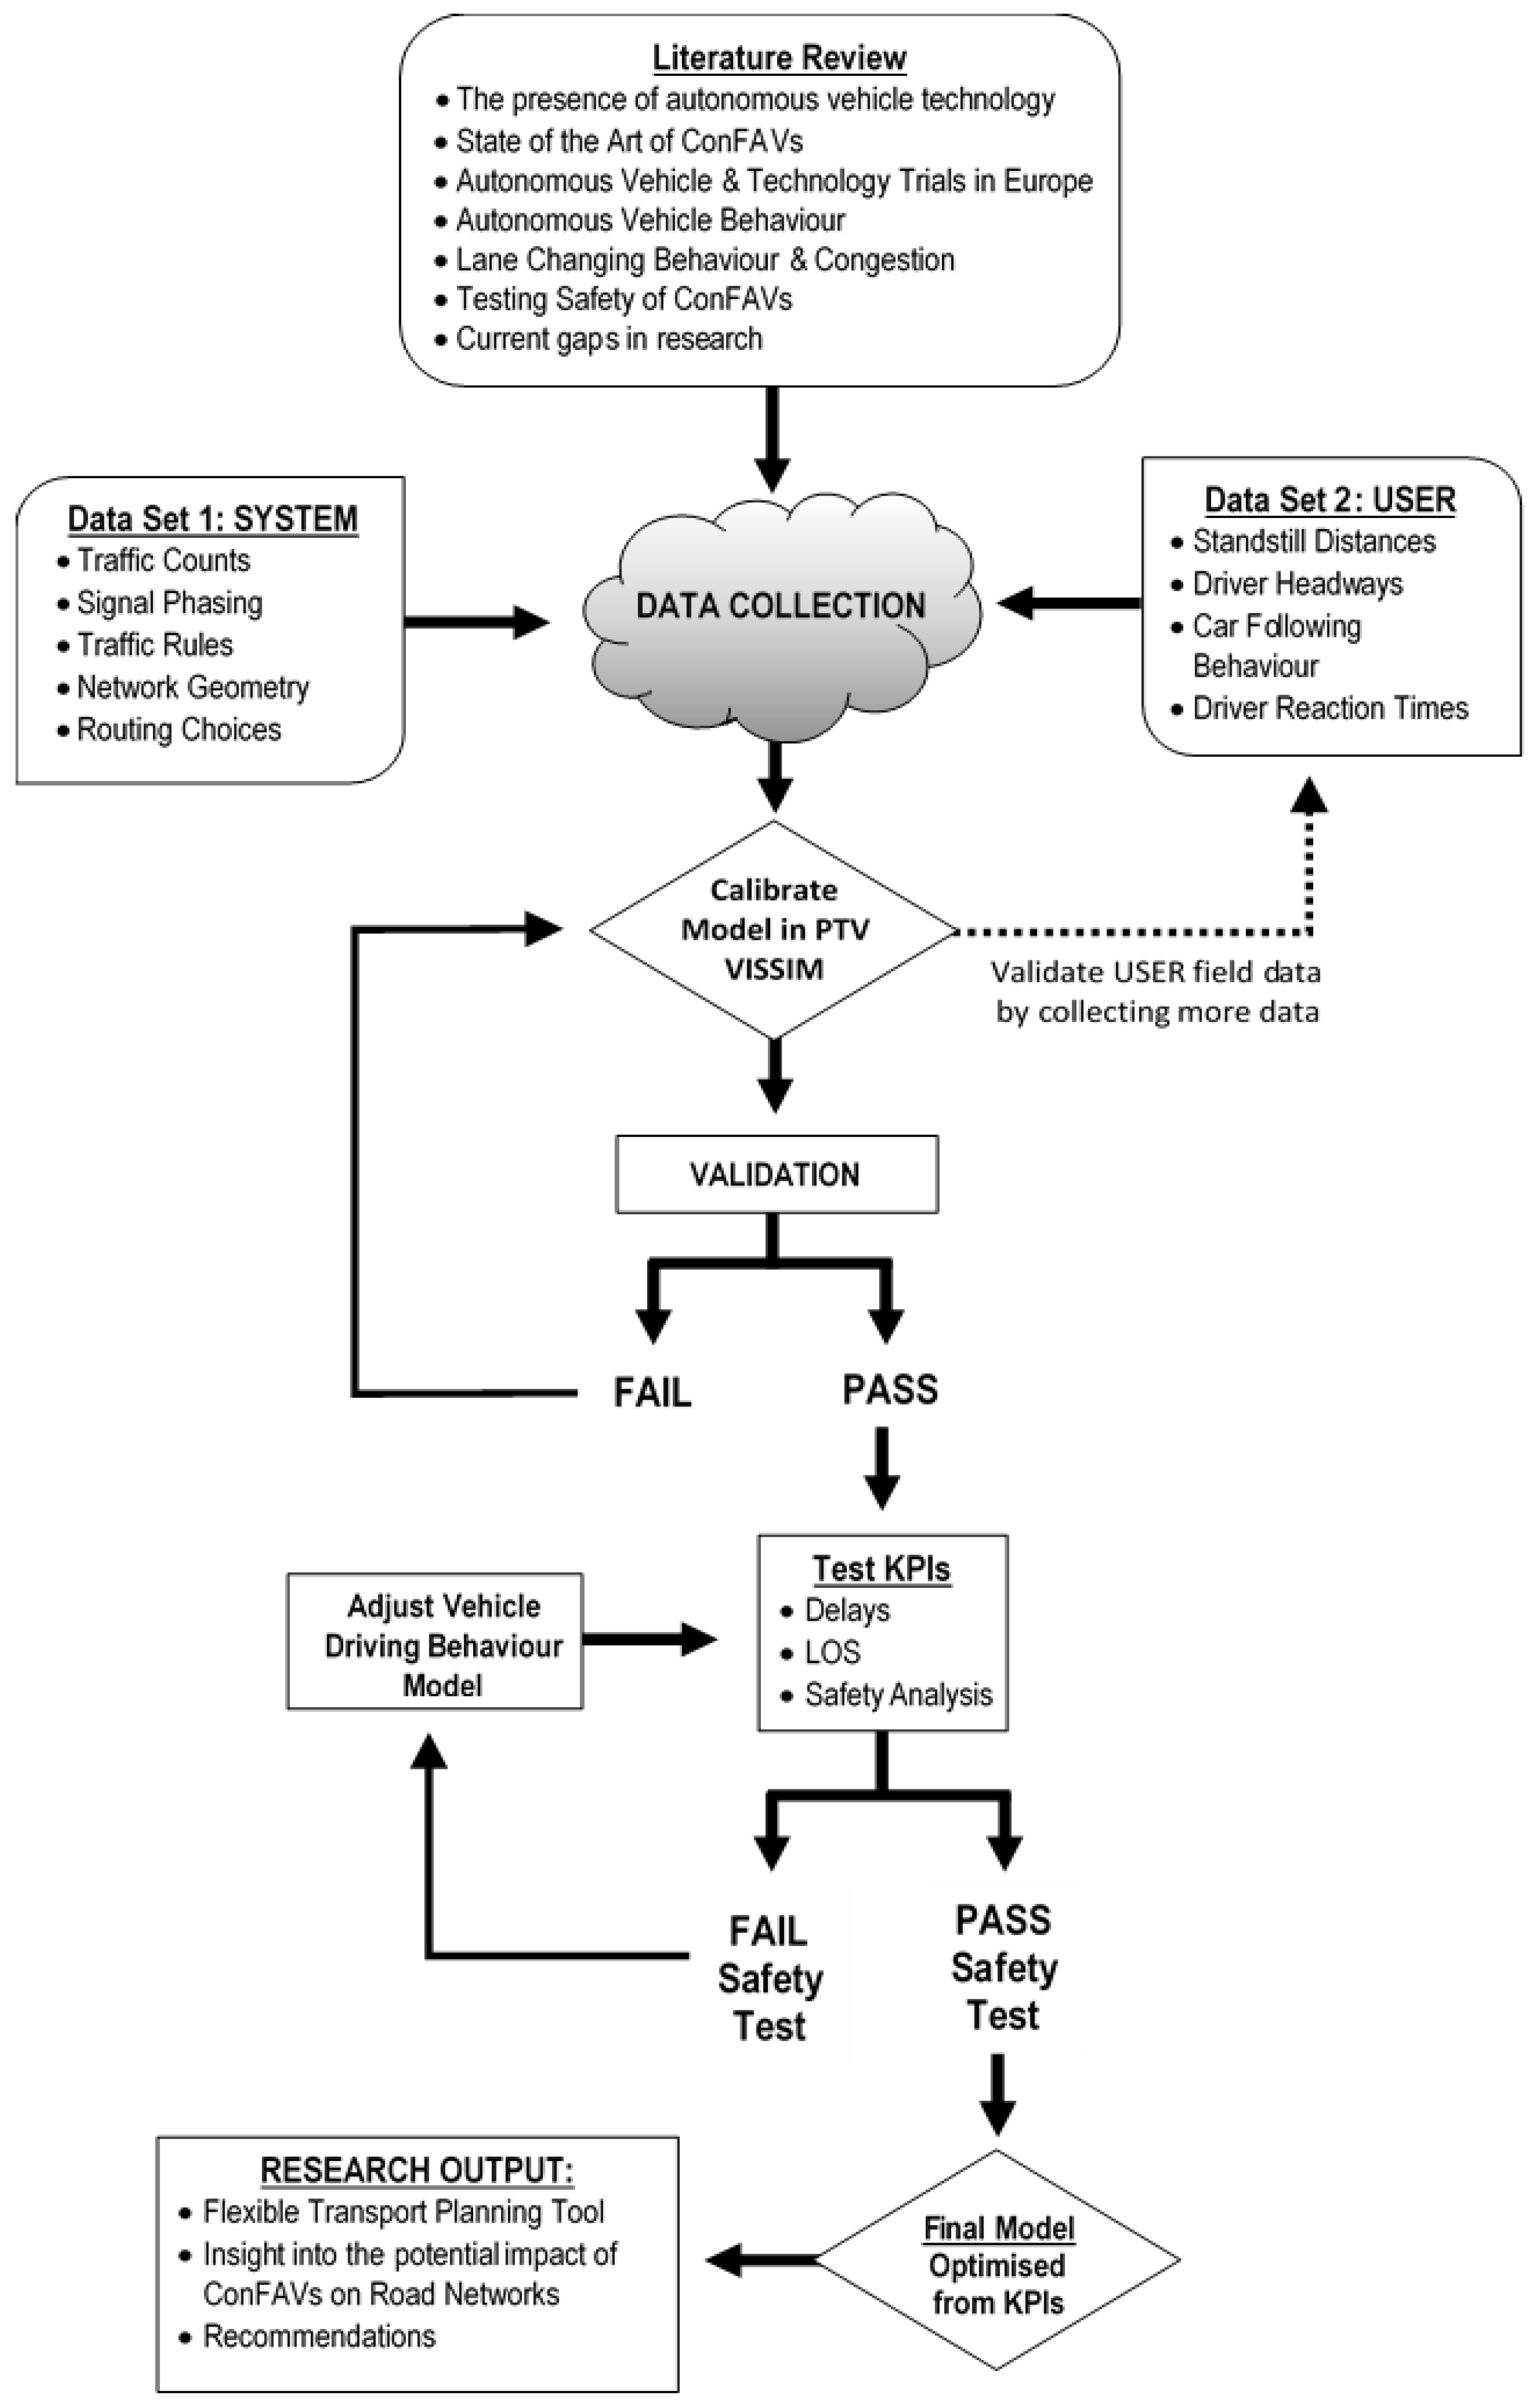
The framework for the development of the model is summarised in the flowchart depicted in
Figure 4. The key inputs to the model are from the literature review (namely, the behaviour of ConFAVs in urban settings, their operational impact on the road network and risk factors), the system dataset (which includes traffic counts, signal phasing, road network geometry, and vehicle routing choices), and the user dataset (such as standstill distance, driving headway, reaction time, and car following behaviour). The main output of the model is vehicle delay information, which is used to calculate the level of service (LOS) and thus congestion. In the present research work, ConFAVs were modelled using a microsimulation software based on assumptions of possible driving behaviours. The selection of software hinged on the need for a microsimulation tool with a computer-aided design (CAD) graphical user interface (GUI), which was also used by local councils and government regulatory offices. PTV VISSIM was selected because it was designed to assess all traffic-related aspects of a network via scientific behavioural models that simulated “realistic behaviour of all road users within the existing and planned infrastructure”. The developers also issue regular updates that incorporate the latest research findings [
33]. Two datasets—a combination of existing information and generated data derived from site observations, calculations, and assumptions that are corroborated by existing research—were fed into the base model designed in PTV VISSIM. The base models were simulated in VISSIM to show how a ‘normal’ network would behave with only conventional vehicles on the road. ConFAVs were then be introduced to the network in increments of 20% until full network penetration—i.e., 100% ConFAVs—was achieved. Travel time was monitored throughout the simulations, and the projected trajectories of each vehicle were closely examined to identify potentially serious conflicts.
3.2. Modelling the Platooning of ConFAVs
While the automated driving of a ConFAV is believed to reduce the risk of accidents and improve overall safety, it is argued that their ability to form platoons could potentially increase the capacity of the highway and reduce fuel consumption. This feature maintains the desired inter-vehicle distances, a concept introduced by adaptive cruise control (ACC) using radar and lidar [
64]. Cooperative adaptive cruise control (CACC), which incorporates vehicle-to-vehicle (V2V) communication, provides the following vehicle with more information about its preceding vehicle, and is the concept that is designed into VISSIM’s platooning feature. PTV VISSIM has created several driving behaviour attributes for the modelling of platooning among connected vehicles. The feature was meant to model the effects of platooning on overall traffic, and not to investigate the detailed trajectories of the individual vehicles within the platoon, as their trajectories are dependent upon that of the leading vehicle and not their individual behaviour model.
While in a platoon, necessary lane changes remain active, so the vehicles within the platoon may leave the platoon according to their allocated route choices or paths of dynamic assignment, or because they belong to a class of vehicles for which the lane is blocked further downstream [
59]. A given vehicle would increase the distance between itself and the preceding vehicle until a safe distance is gained for it to leave the platoon. A vehicle may change lanes only for a change of route.
If the route takes the platoon to a new link/connector which disallows platooning or allows fewer vehicles in the platoon, the platoon will split accordingly [
59]. The maximum platooning desired speed may override that of the lead vehicle, forcing it to drive at a reduced speed. Each vehicle in the platoon will follow the lead vehicle in a coordinated manner, while maintaining a safety distance from its preceding vehicle.
A summary of the other attributes and assumptions about platooning in the model are as follows:
Only vehicles using the same driving behaviour will form a platoon.
A vehicle or a platoon of vehicles can attempt to join another vehicle/platoon from behind if its distance from the last vehicle in the platoon is below 250 m.
The platoons were capped at six vehicles.
The maximum platoon speed is the maximum speed at which all vehicles in the platoon can drive.
The maximum platooning desired speed will not be higher than the speed of the reduced speed area.
Any ConFAV within the network can be the lead vehicle.
It is assumed that if the platoon is broken, the vehicle at the front of the broken section would become the new lead vehicle.
3.3. Use of a Car Following Model
It is important to mimic the stochastic nature of traffic in simulations, to form a true representation of natural traffic flow models. PTV VISSIM was selected as the simulation tool because of its widespread use across the UK transportation industry, including local consultancies and regulatory bodies, with more than 16,500 users worldwide [
58]. The foundation of PTV VISSIM is the Wiedemann’s car-following model.
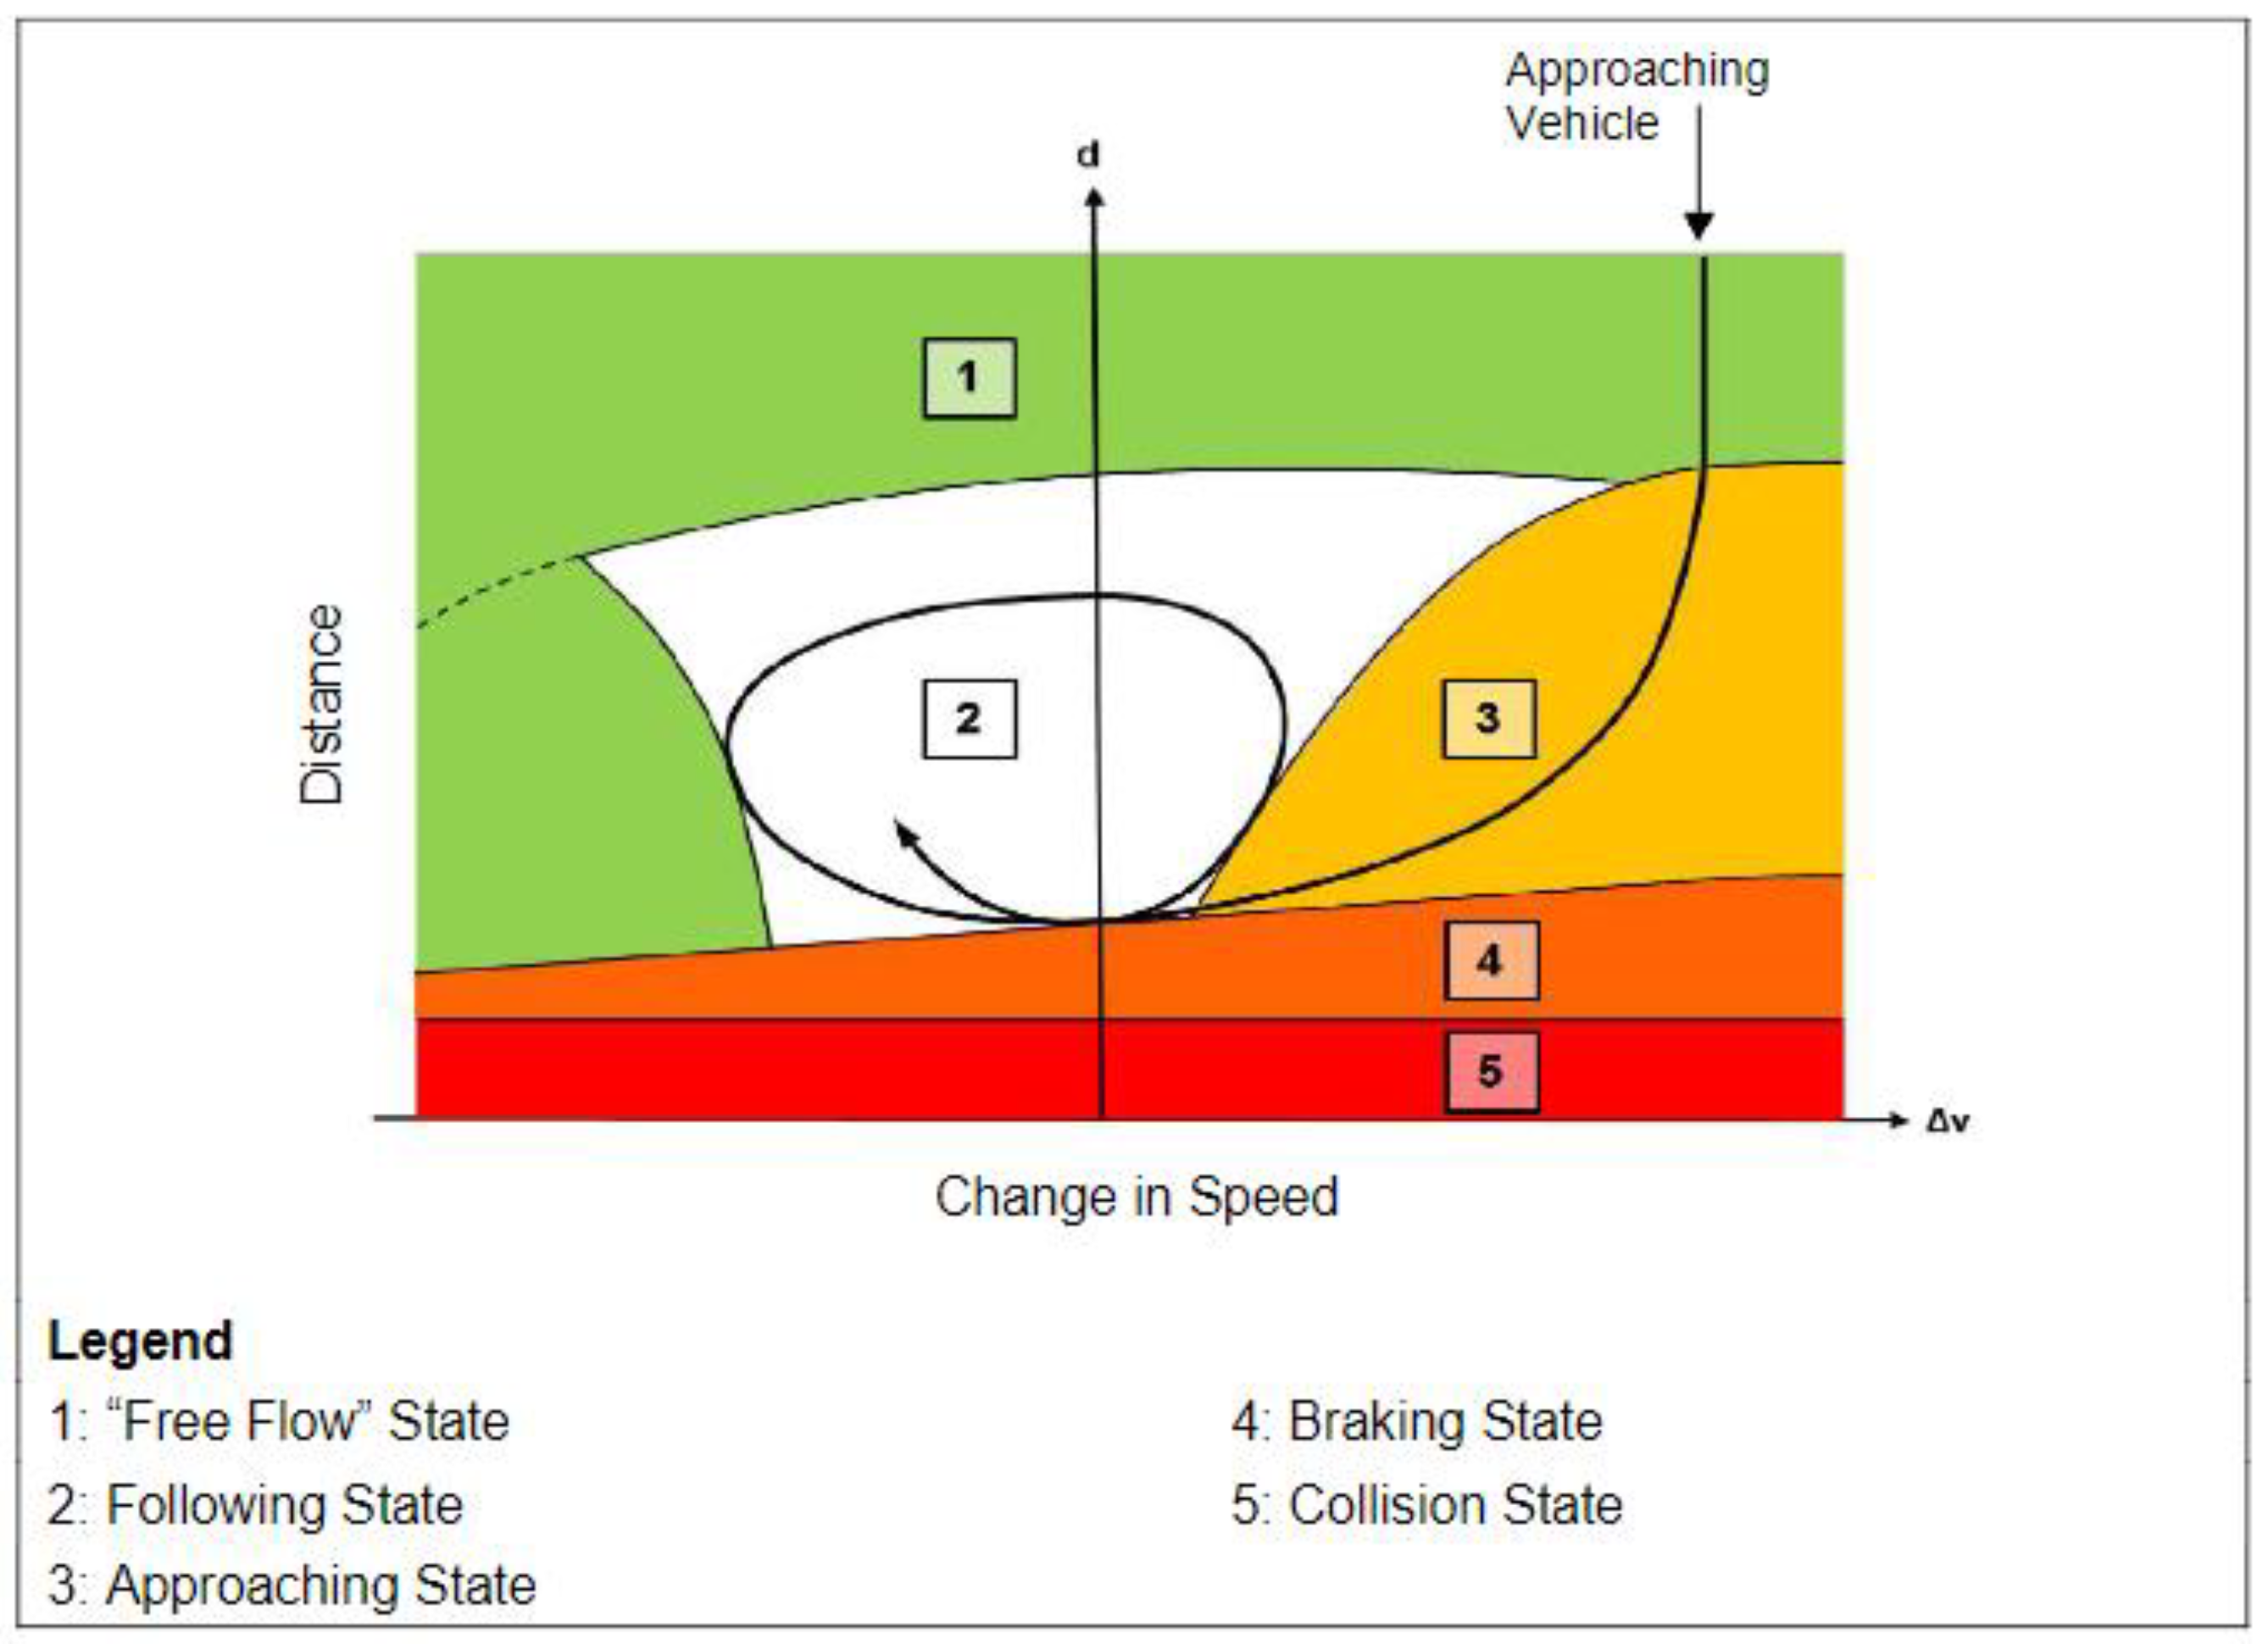
Wiedemann, in his calculations, used psycho-physical perception to create a stochastic distribution model. The basic concept behind his model is a driver’s individual perception threshold. In this theory, a fast-moving vehicle will begin to decelerate as it approaches a slower vehicle and will do so until it reaches a speed lesser than the vehicle it follows, as it will be unable to determine the speed of the leading vehicle. Once the speed falls below that of the leading vehicle, another perception threshold is reached and the car following will slowly accelerate to match the speed of the car in front. Wiedemann based his calculations on the assumption that there are four states of driving before collision, whilst taking into consideration a distribution function of the speed and distance behaviour of the vehicle, as depicted in
Figure 5 [
63].
The first state that the approaching vehicle will enter is the free flow or free driving state, where there are no influences on the vehicle joining the procession. The vehicle will reach and maintain its desired speed. The maintenance of this speed is dependent on the physical capabilities of the individual vehicle. Older conventional vehicles without assistive driving, will oscillate around the desired speed, whereas newer human controlled vehicles with cruise control can maintain the speed. The second state experienced will be the approaching state, where the vehicle acknowledges the vehicle ahead and reduces its speed below that of the preceding vehicle. The following state is achieved when the vehicle follows the one ahead without consciously accelerating or decelerating. The desired safety distance is maintained, but it is expected that the difference in the speeds of the two vehicles will oscillate around zero (hence the circular pattern in the graph shown in
Figure 5). If the vehicle fails to maintain its safety distance, the braking state is next. In this state, the vehicle would have had to apply medium-to-high deceleration rates to bring it back to its desire safety distance, avoiding the collision state.
3.4. Other ConFAV Modelling Assumptions
In the present research study, ConFAVs were introduced in the PTV VISSIM network as a new vehicle type with the same physical attributes of a small car, and their potential driving behaviour type attributes were then modified, particularly those of car-following behaviours and the platooning requirements detailed in the previous sub-section. Other assumptions used to programme the vehicle type within the simulation software are as follows:
Smaller lateral space is needed while overtaking.
Acceleration and deceleration is executed without distribution.
Desired speed is kept without any distribution.
Reaction time at traffic signals is set to zero (0).
Speed is adjusted to arrive at green assuming C2X communication.
In programming the global values for the Wiedemann 99 Parameters, the ConFAV was assigned greater values for the standstill distance and headway time if it is following conventional vehicle with a human driver. This allowed the ConFAV to behave more cautiously around other vehicles it cannot communicate with (the conventional human driven vehicle). Typically, a global value for each of the Wiedemann 99 Parameters are assigned to a ConFAV regardless of the type of vehicle in front of it. To improve this, in the current research project, the assigned values were adjusted based on the type of the vehicle in front (i.e., whether it is another ConFAV or a conventional human driven vehicle). In order to calibrate and validate the proposed model, two case studies were considered and corresponding field data were collected as described next.
3.5. Case Studies
Two case studies have been examined in the present research work with the aim of calibrating and validating the proposed model. The case studies included two isolated networks within the Queen Elizabeth Olympic Park in East London, which were observed and modelled. The two sites considered in the case studies were chosen as they represented two key types of transportation needs: residential and commercial.
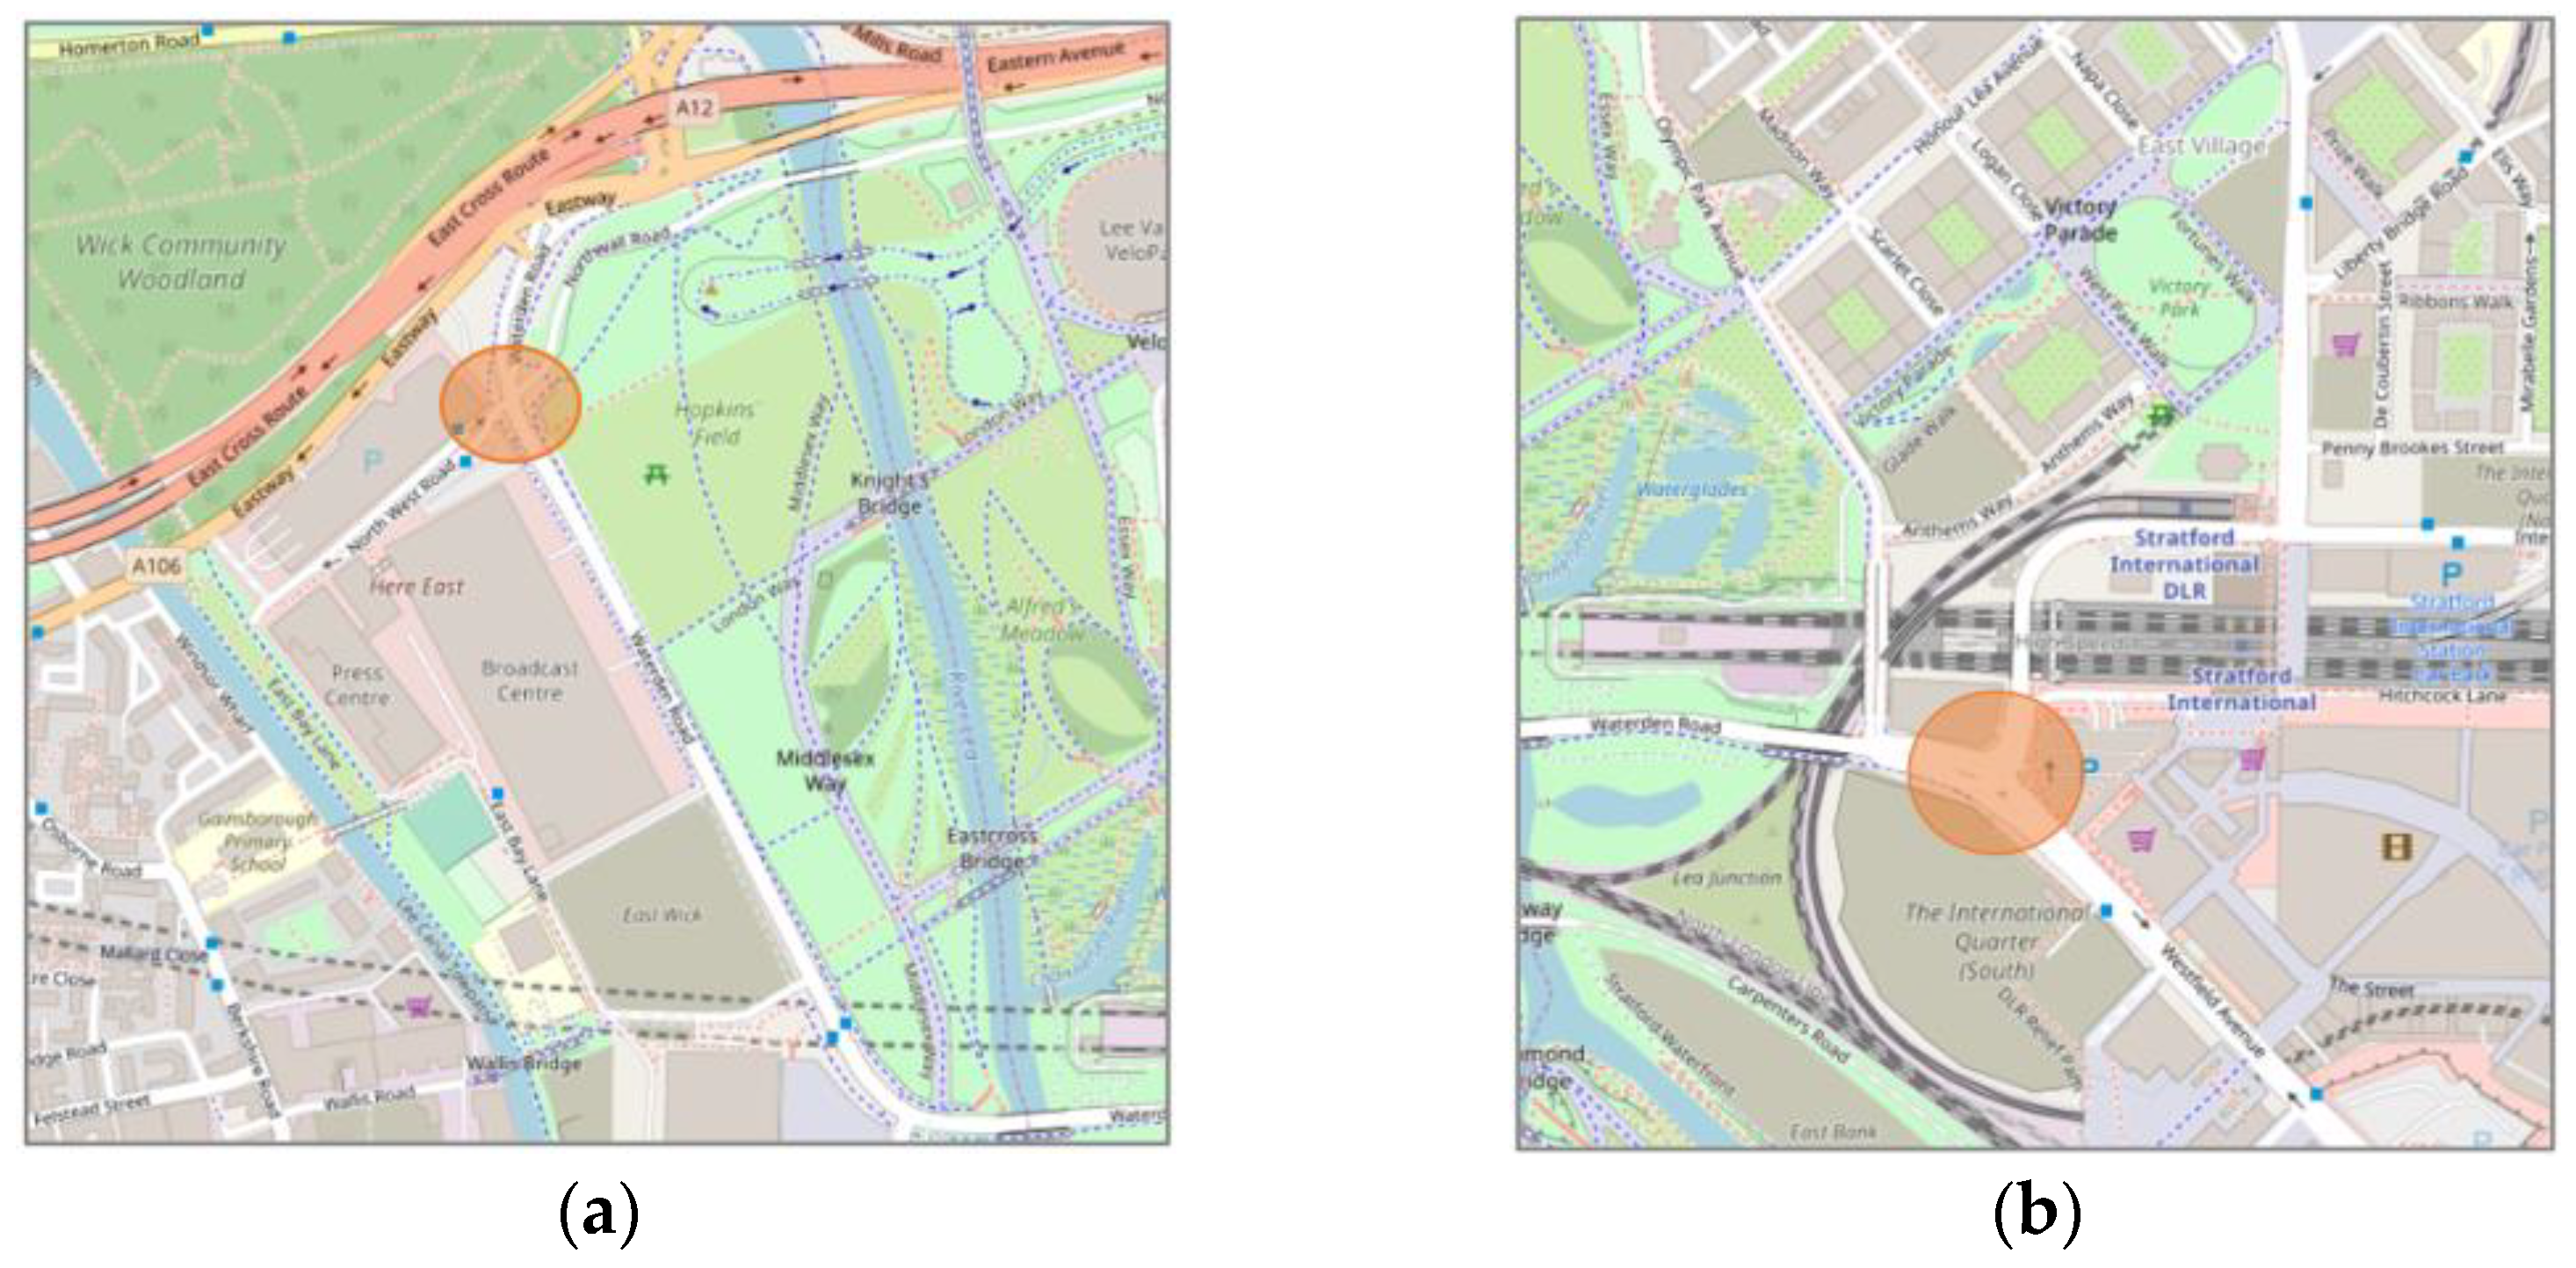
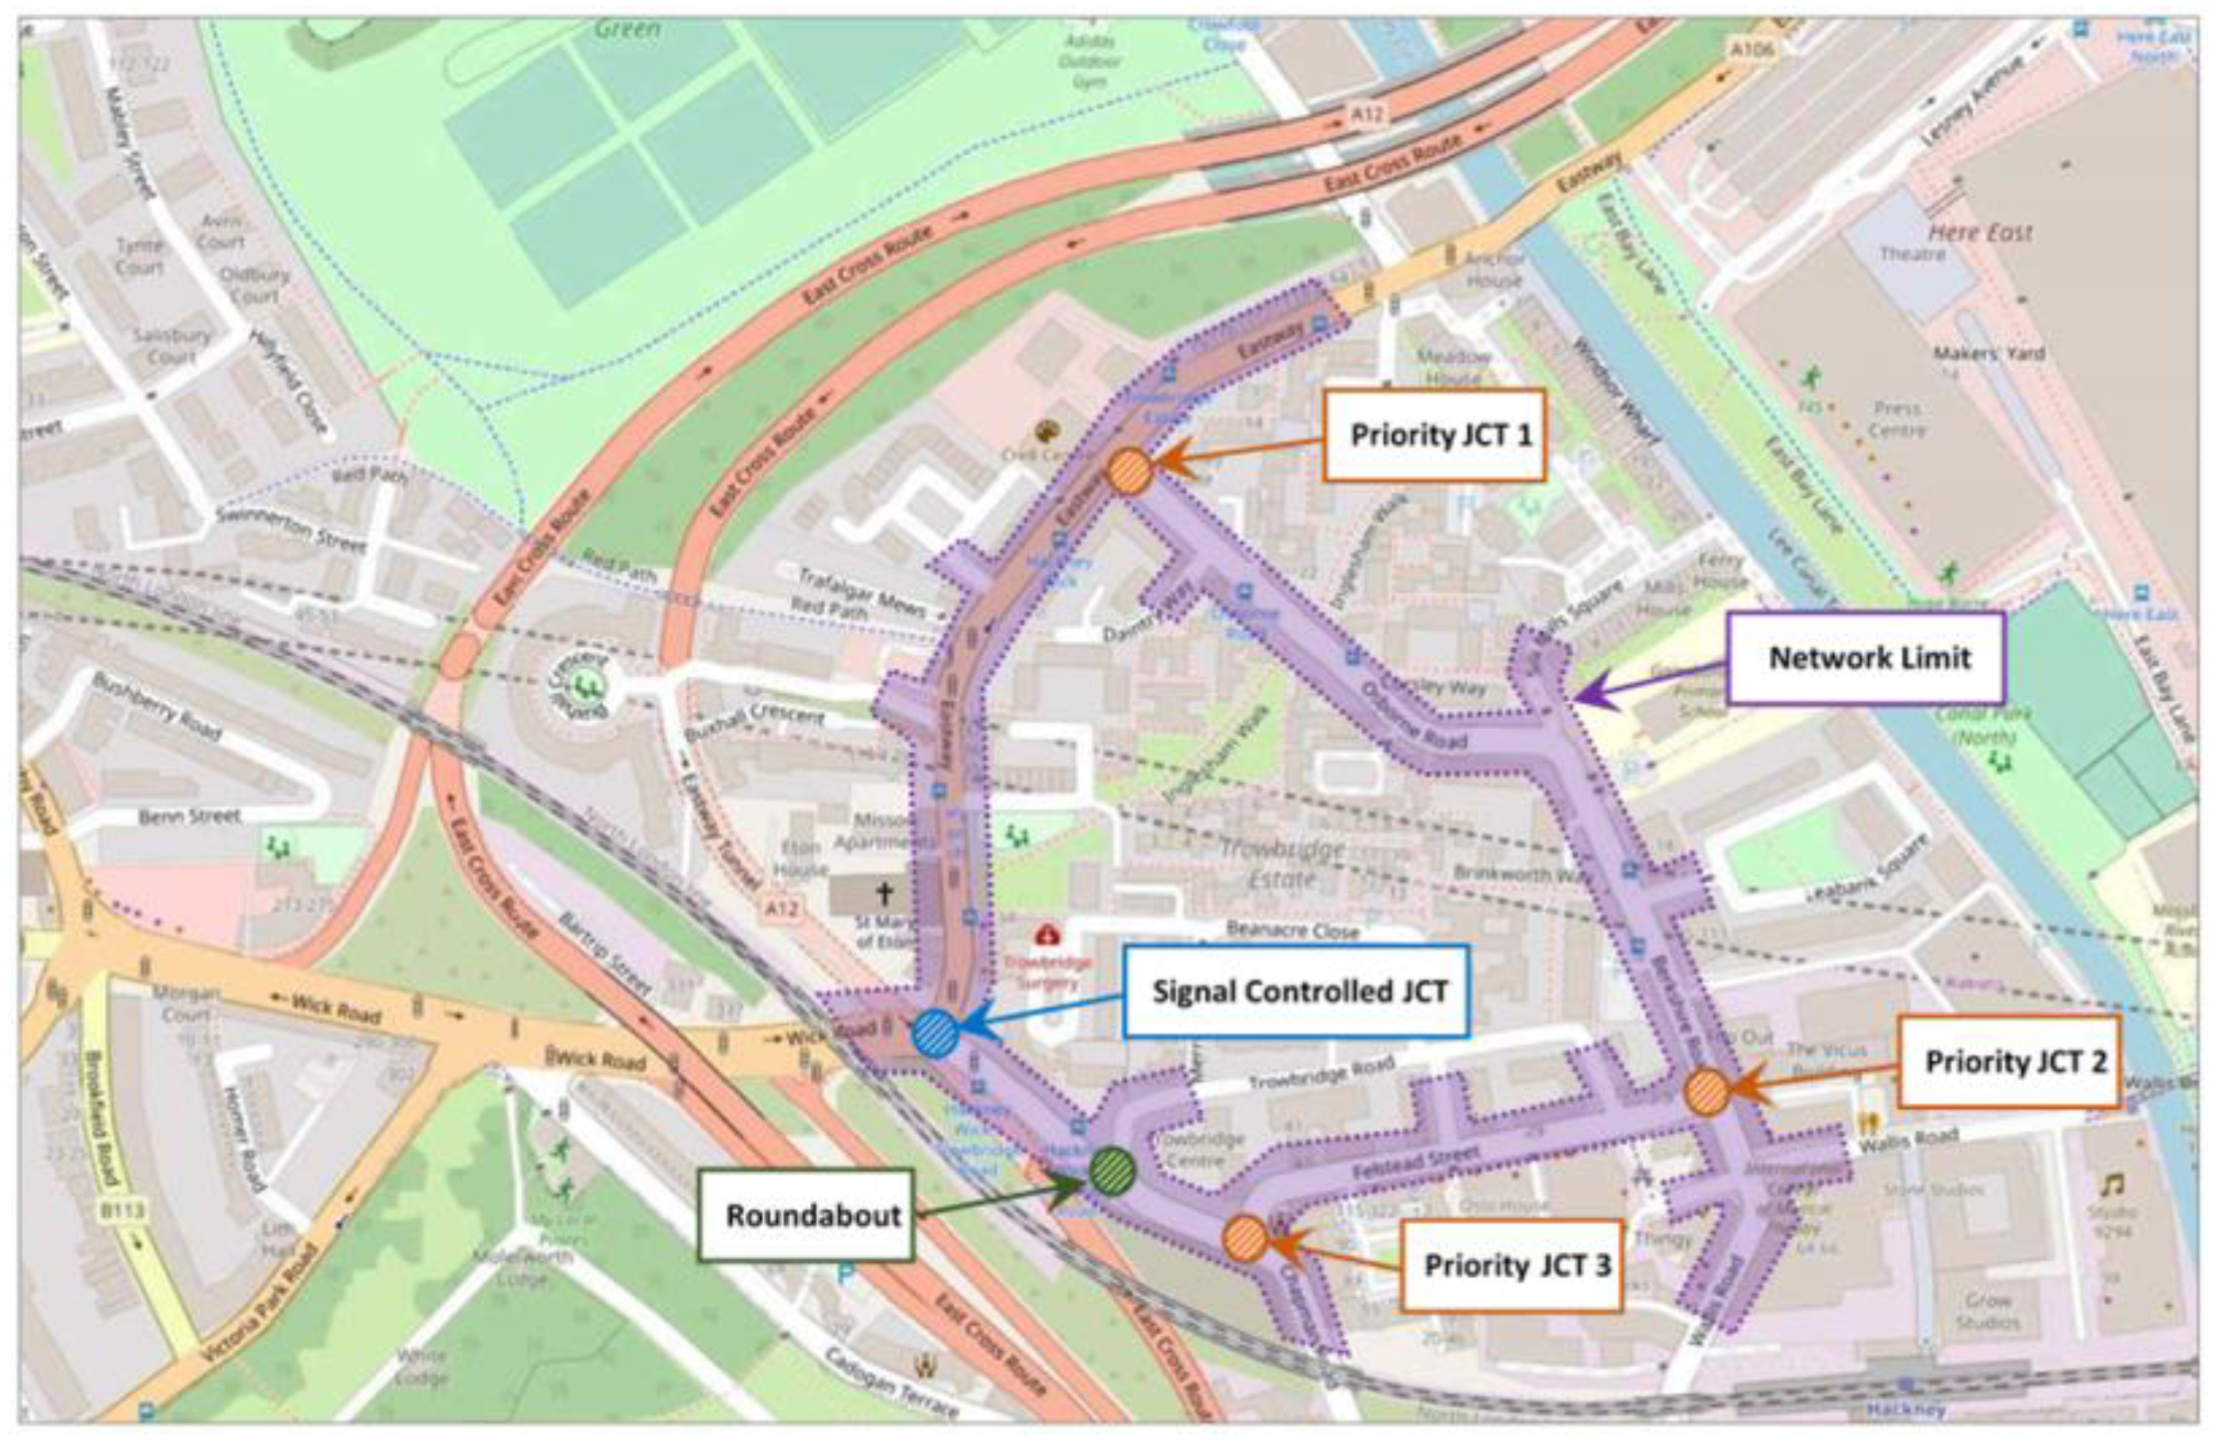
3.5.1. Case Study: Site A—Residential Area: Hackney Wick
Hackney Wick is an urban developing community that sits to the west of the Queen Elizabeth Olympic Park (QEOP) and the new communities of Eastwick and Sweetwater to the east and is within proximity of the West Ham FBC Stadium, London Aquatics Centre, and the Westfield Shopping Centre (Europe’s largest shopping mall). This community has grown in popularity since the London 2012 Olympics, attracting investment from different landowners, organisations, and government bodies [
65]. The layout of the site is shown in
Figure 6. This section of the East London community was chosen to be modelled as it represents all three main junction types assessed in the present study. The isolated network being modelled is shown bordered in purple, and the location of the different junction types is also highlighted in orange for the priority junction type, blue for the signal-controlled junction type, and green for the roundabout junction type. The traffic conditions simulated in this case study were mostly ‘free-slow’ conditions.
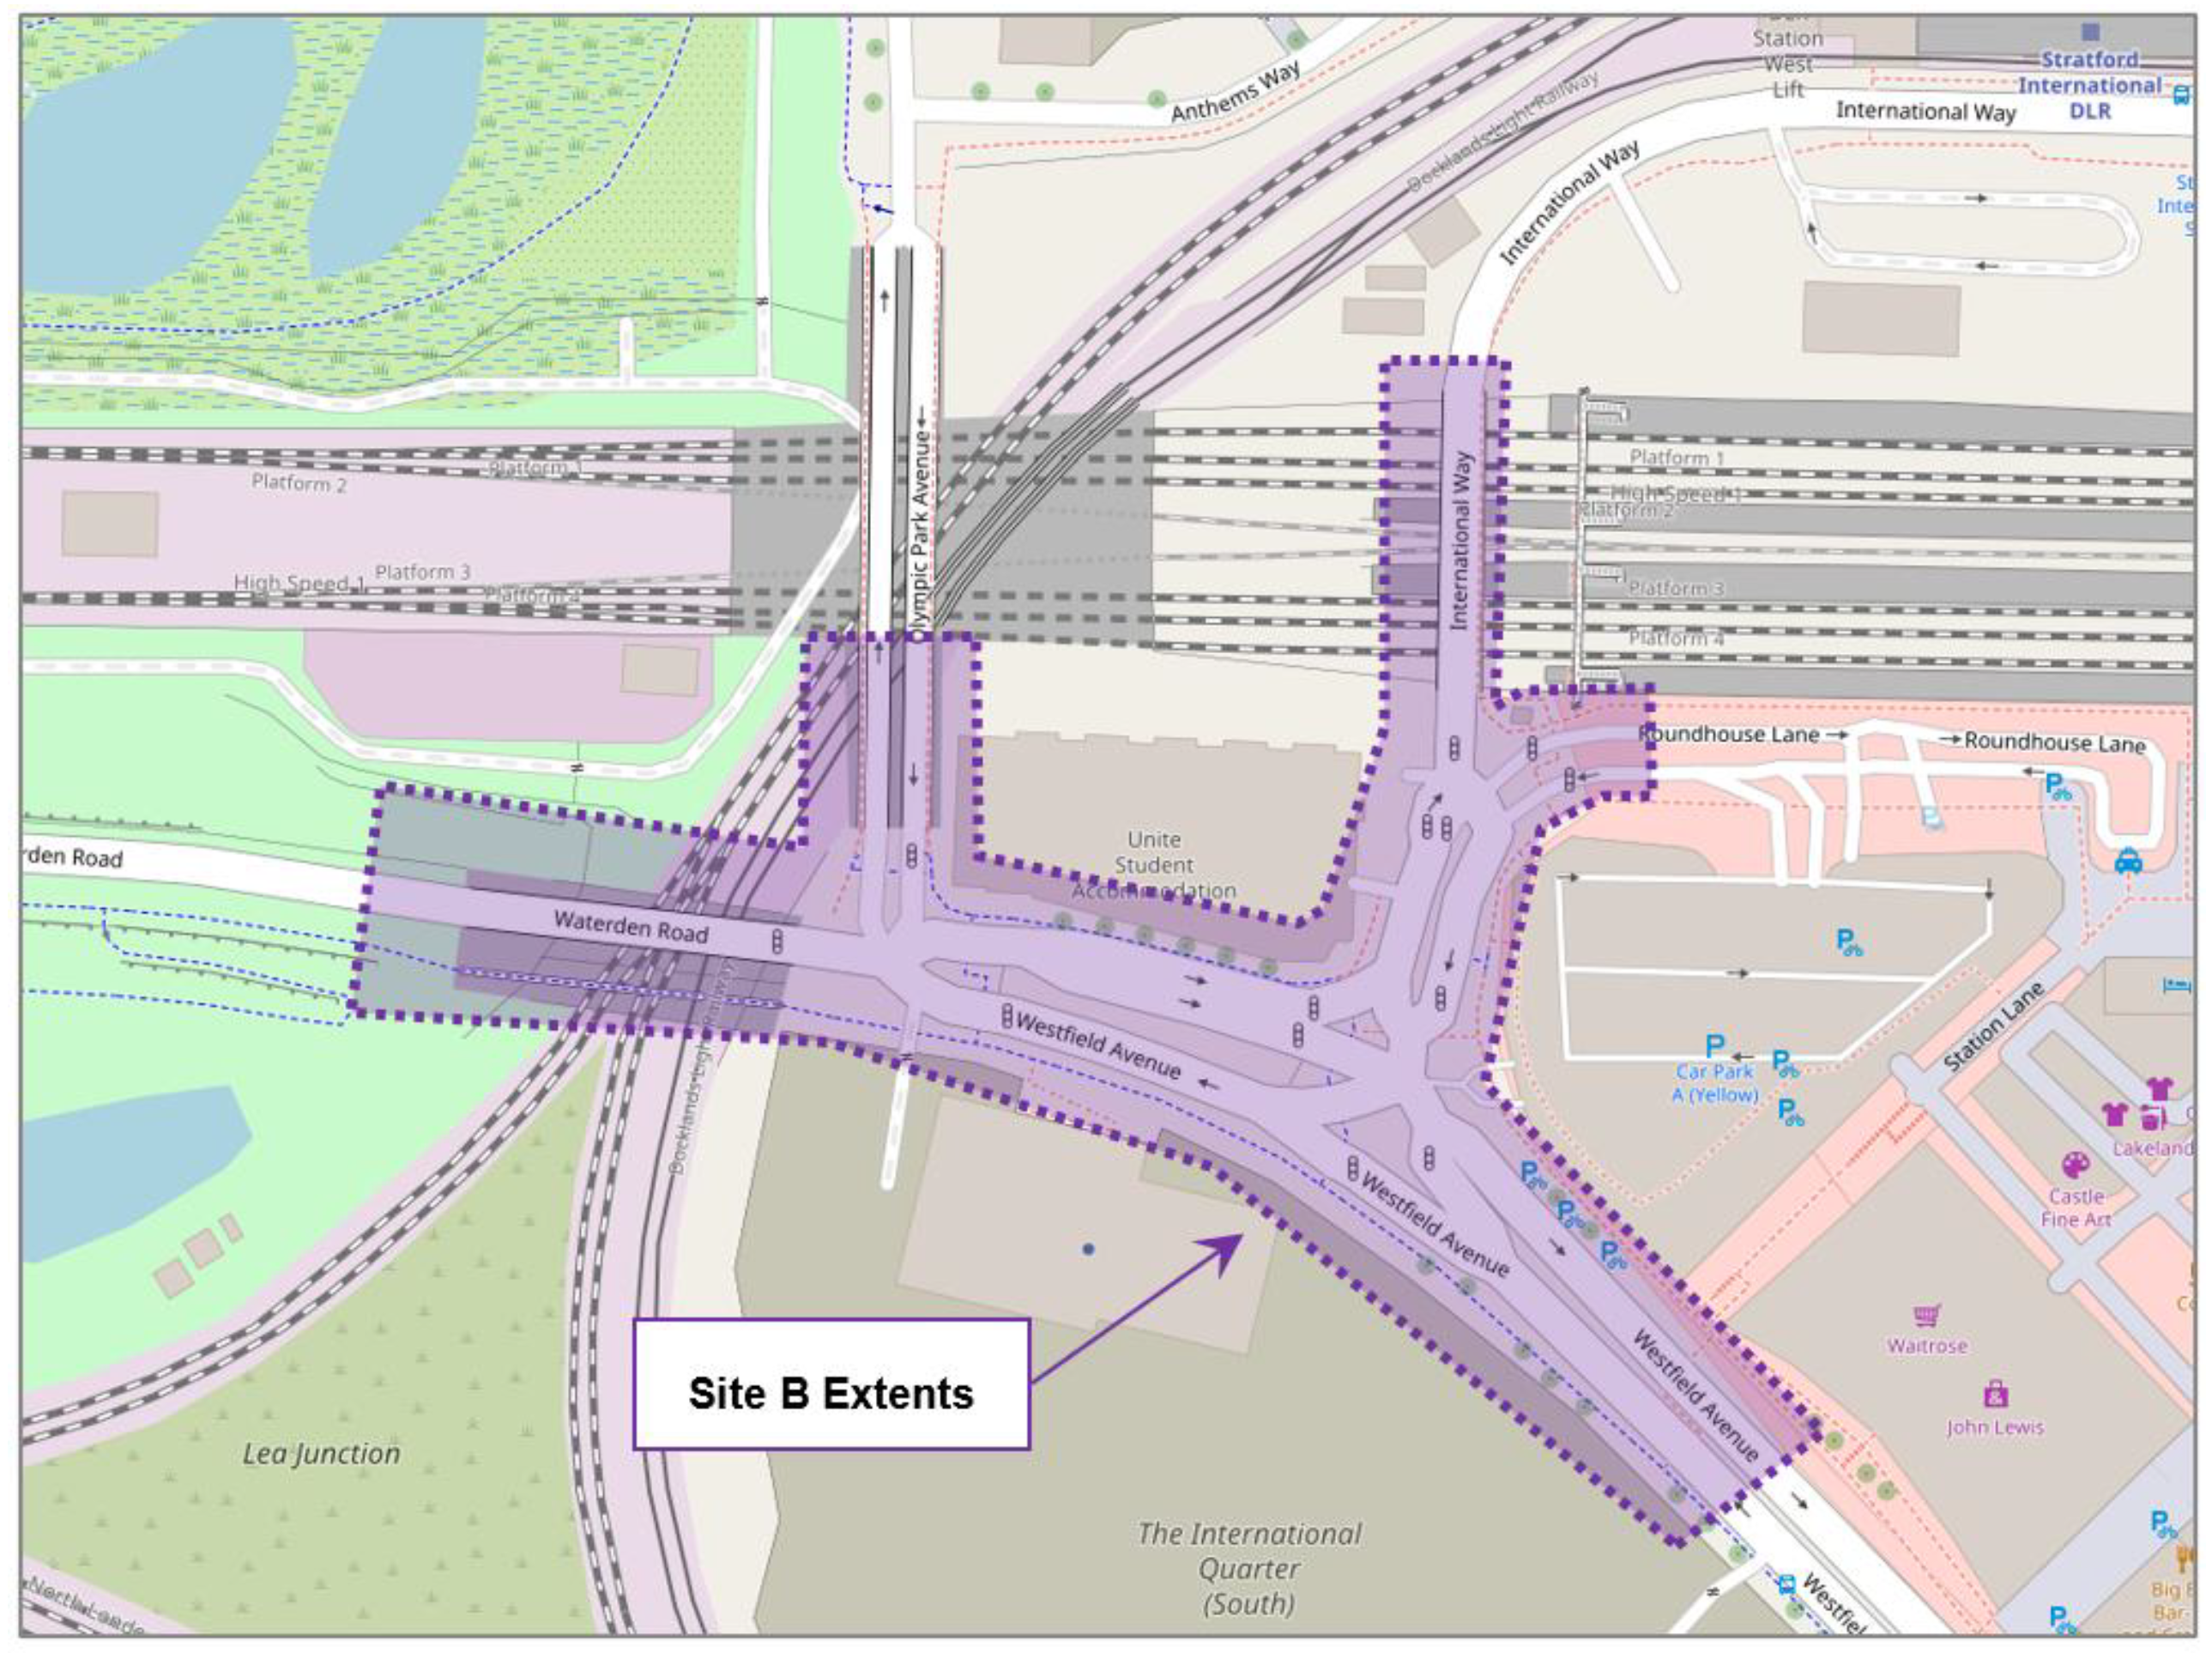
3.5.2. Case Study: Site B—Commercial Area: Westfield Stratford City
This commercially focussed location was selected because of its access to the Westfield shopping centre and the major transportation links of Stratford International station. The Stratford underground station is also accessible through Westfield and by continuing south along Westfield Avenue, potentially driving the travel demand of this location. The layout of the site is shown in
Figure 7. The traffic flow conditions simulated in this case study were mostly congested conditions.
3.6. Network Geometry and Programming
In the present research study, the layout of Site A was designed using the existing footprint of the road network shown in
Figure 6, within the limits highlighted in purple. During the simulation, three priority junctions, one signal-controlled junction, and one roundabout were monitored, with the locations illustrated in
Figure 6. The signal programme for the signal-controlled junction was created based on observations recorded during a visit to the site location.
For Site B, the layout was designed using the existing footprint of the road network shown in
Figure 7, within the limits highlighted in purple in the figure. The signal programme for the junctions was created based on observations recorded during a visit to the site location.
The measures of effectiveness (MOE) that were used in the calibration of the model developed in the present study were performance measures identified as system-defined and user-defined input parameters (summarised in
Table 4). System-defined parameters are high-level and usually those that are predefined by the traffic management system (speed limits, signal timings, etc.), the geometric layout of the road network, the volume of traffic and their routing choices. Some parameters that are user-defined in the simulation programme include headway times, standstill distances, and the driver’s lack of attention and reaction time.
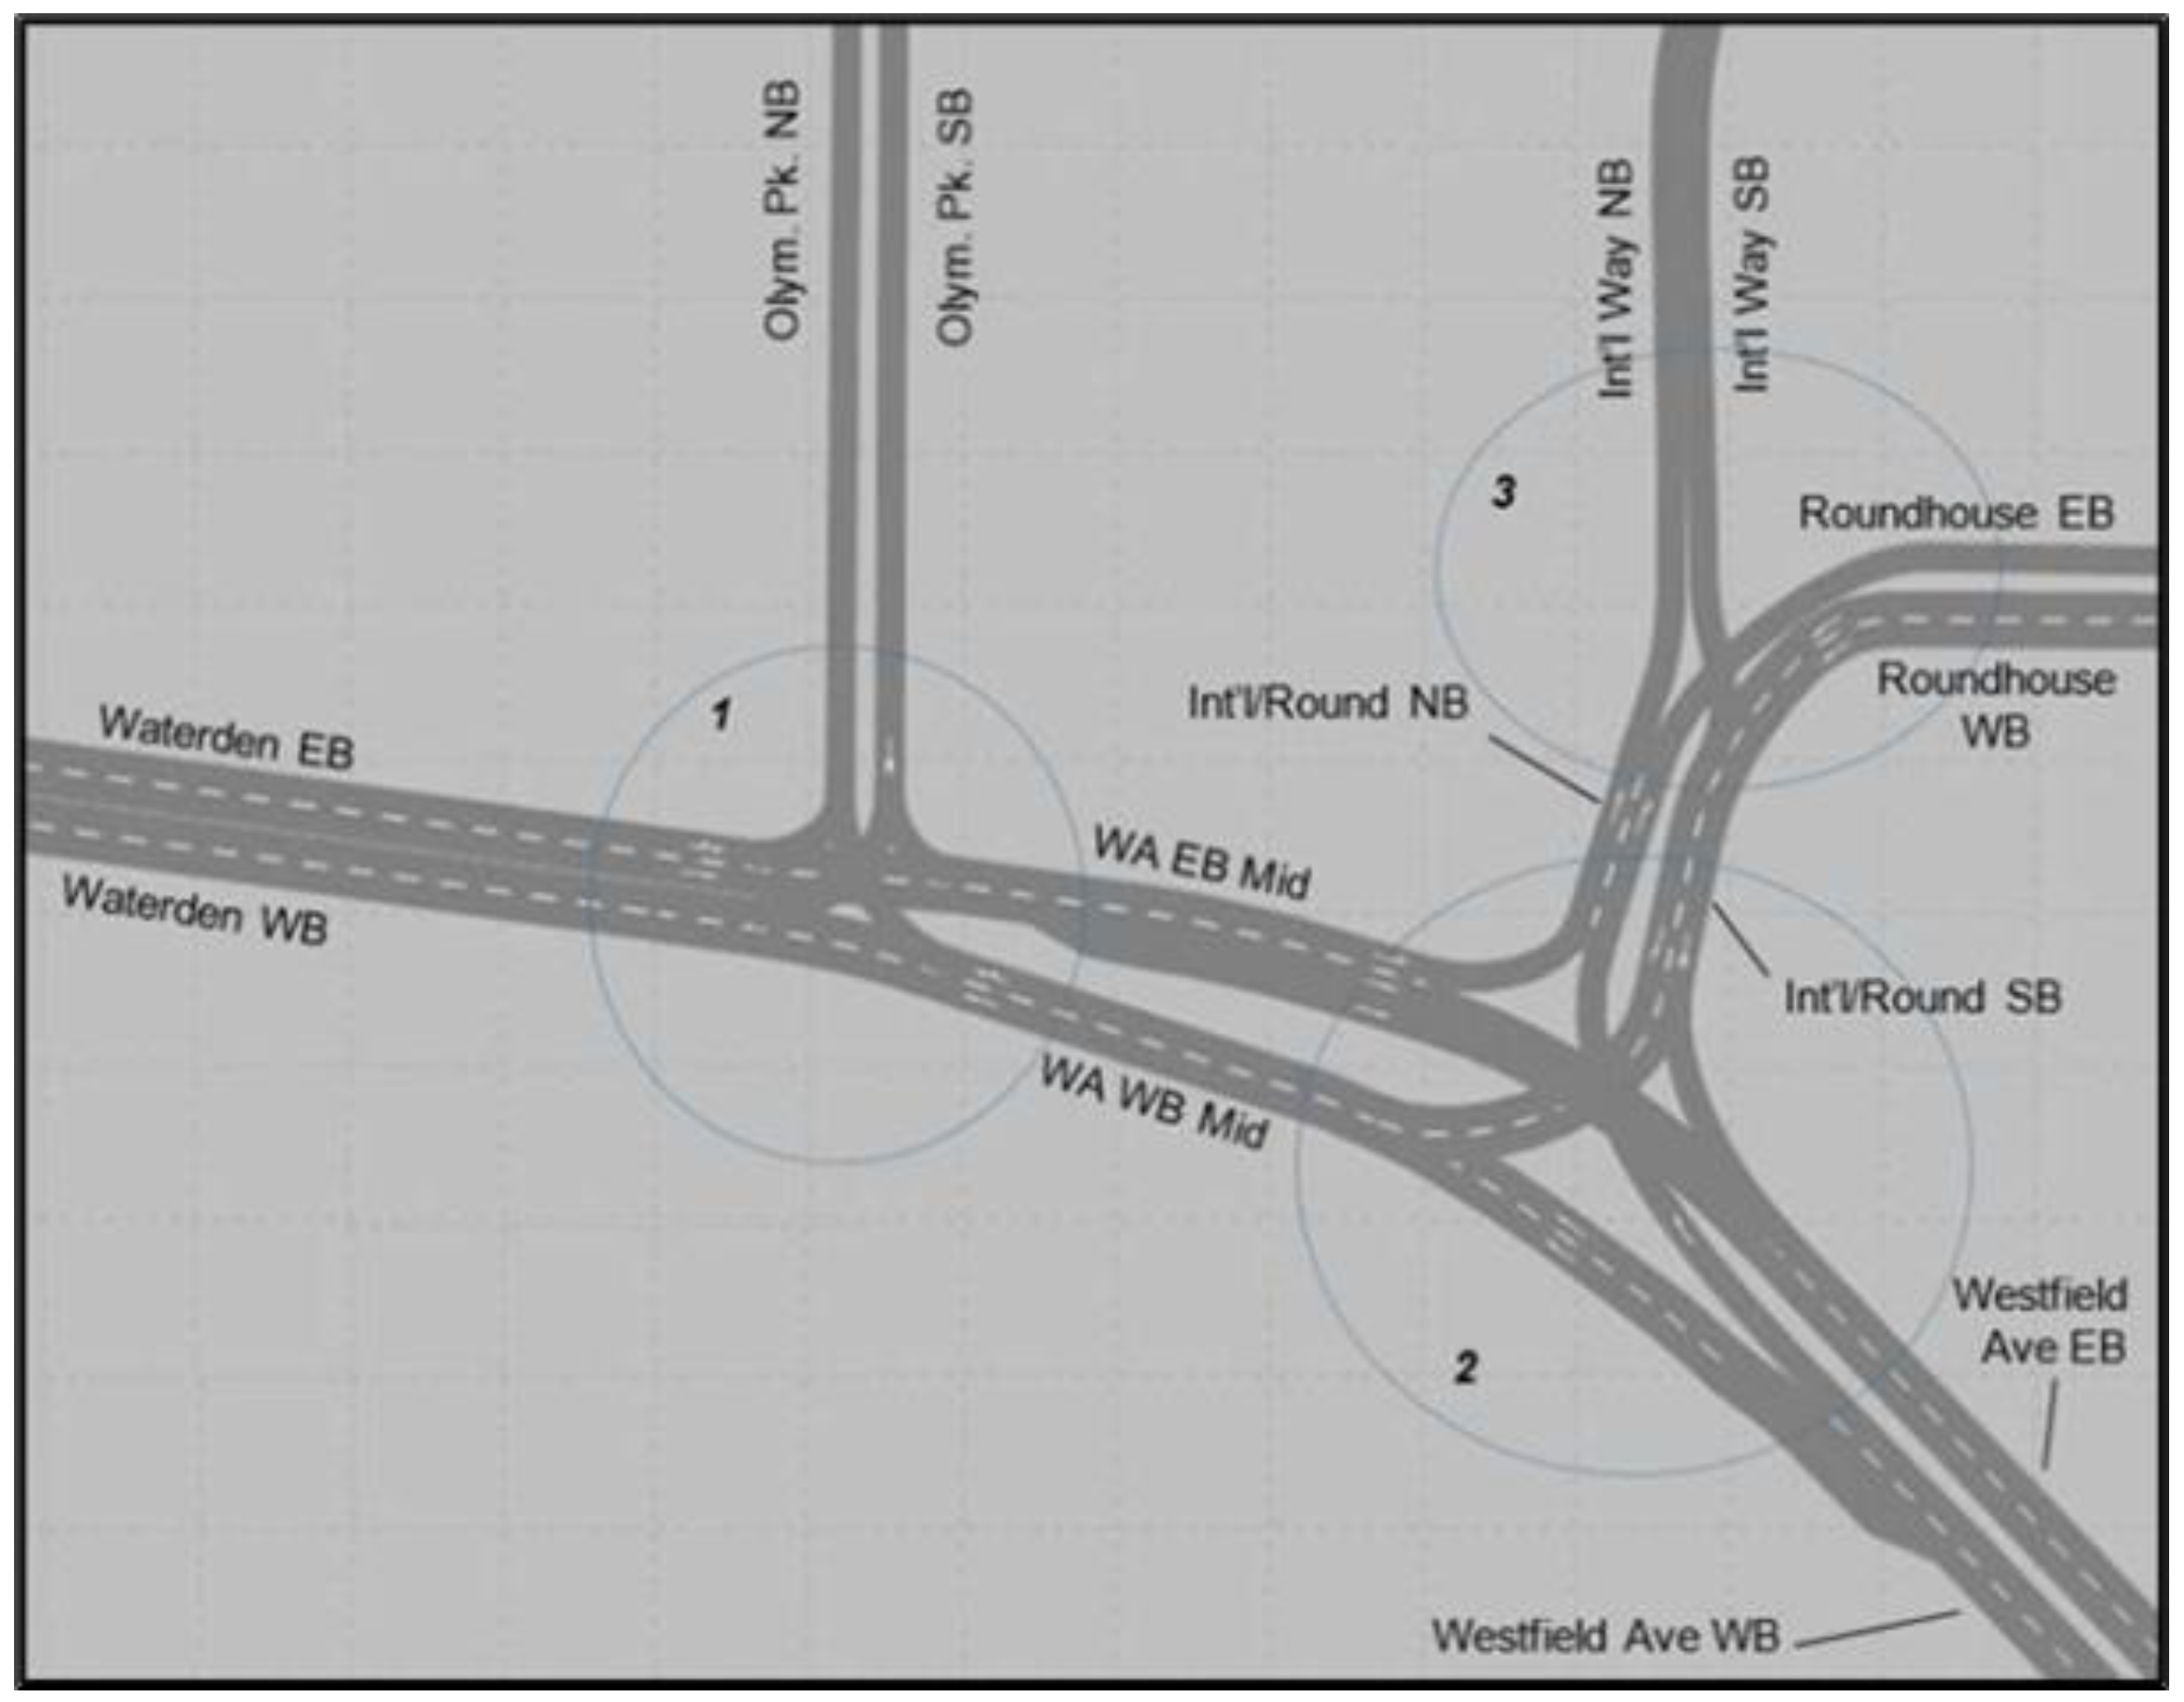
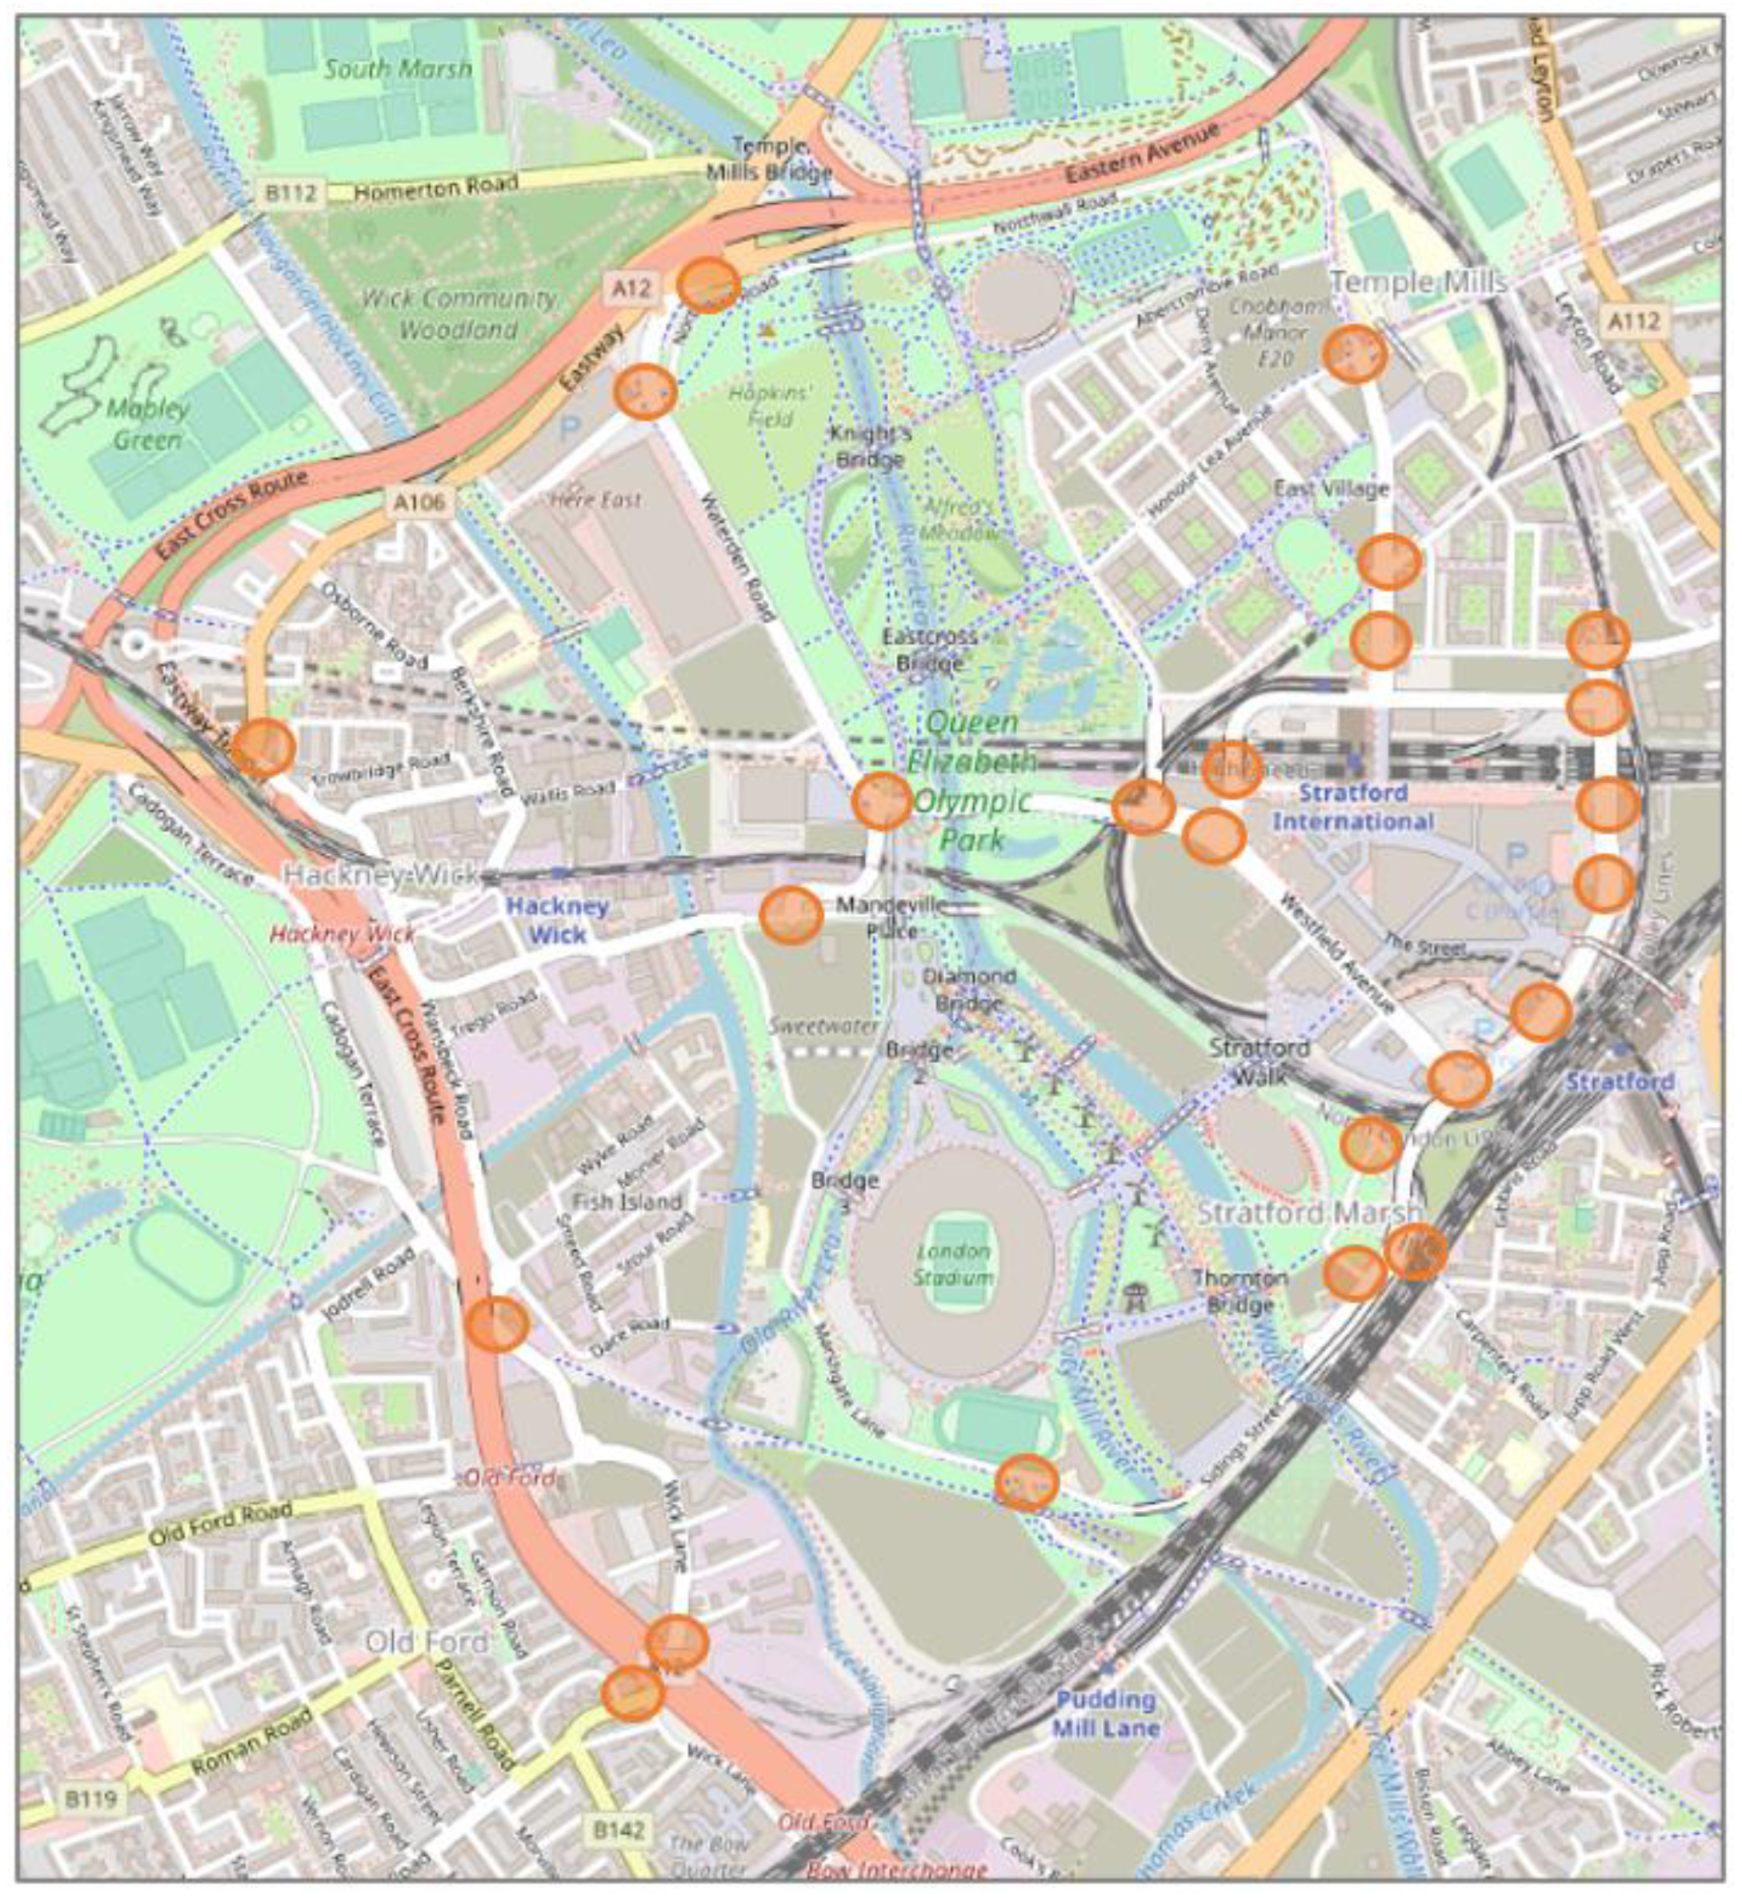
3.7. Field Data Collection
Both quantitative and qualitative data were collected in the field through notetaking and video recordings to programme the parameters listed in
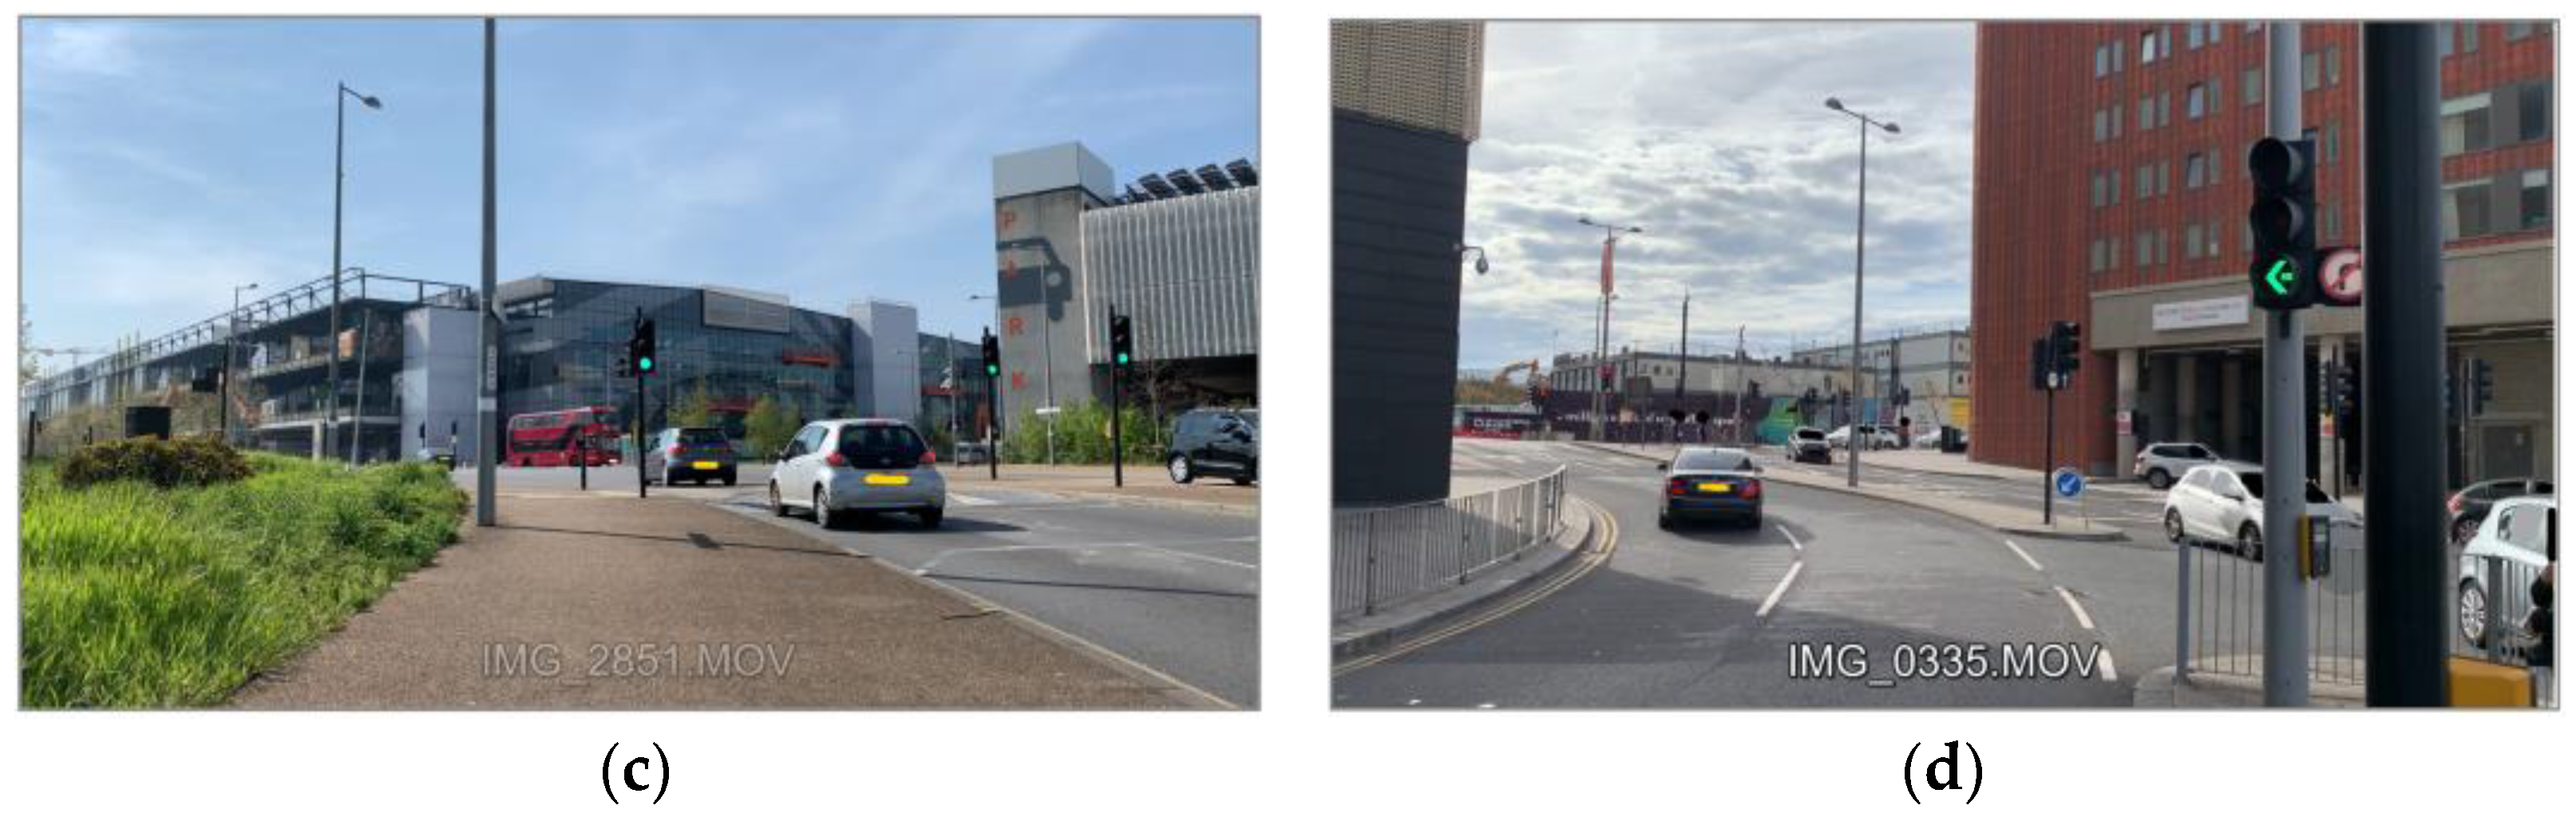
Table 2. A total of 24 recordings were made at different intersections within the Queen Elizabeth Olympic Park to capture signal timings, speed limits, routing choices, and user behaviour data. Videos were captured over a 2-h period around Midday on a Saturday, when Westfield is known to attract a high level of patrons, and specifically on a day when there were no games at the stadium. Roads are usually obstructed to facilitate match days. The test sites are labelled in orange on the map in
Figure 8 below.
All 24 recordings were used to program system-defined parameters; however, only five test sites were selected to capture the headway times, standstill distances, temporary lack of attention, and reaction times of the drivers. These sites were selected due to their proximity to the A12 motorway, direct connection to the Westfield shopping centre, and the observed traffic volumes (with two sample sites depicted in
Figure 9).
To aid in the calculation of distances present in the videos, free HPI checks were conducted on each stopped vehicle to record the exact vehicle makes so that their dimensions could be taken from their manufacturers. After the model was calibrated with the system-defined input data, an initial run was carried out with the software’s default user-defined values. Afterwards, multiple runs were conducted to verify that the new parameter (shown in
Table 5) set would generate significant results.
Data was collected again on a different day, five months later. The videos were recorded on a Friday between the hours of 11:00 am and 1:00 pm, to capture the user-defined behaviour modelled previously. The five-months gap was to facilitate similar weather conditions, as the winter months had fallen in between the two dates. The new dataset showed no change in five out of the seven parameters (as seen in
Table 6), and minor changes in the remaining two. When simulated, these changes showed no statistically significant results, and so the final readings taken in the second dataset were used to calibrate the model.
3.8. Method of Evaluating Congestion
Congestion performance was evaluated by calculating the delay of a vehicle on its route choice, by subtracting from its actual travel time a theoretical one in which there were no other vehicles, and/or no signal controls or other reasons for stops to occur [
34]. If no vehicle is captured in the time interval, then this is left blank as there is nothing to compare it to. The recorded delays were then used to determine the subsequent level of service (LOS) on that link/route, which was calculated differently if the intersection is signal-controlled or not. The LOS calculation parameters are shown in
Table 7.
3.9. Simulation
Six ConFAV network penetration levels were tested in the experiment and their effects observed. The experiment started with all traffic flow being the conventional human controlled vehicle (0% ConFAV), then the ConFAVs were introduced in 20% increments of the network traffic volume until 100% penetration was attained.
The average vehicle delay over the 2-h simulation time along all route choice movements within each junction under review was compared for six ConFAV penetration levels, and the percentage change in the recorded average delay from 0% ConFAV penetration to 100% ConFAVs was calculated for each route. Within each network, observations were made according to route choice movements within the junction under review, which are broken down as follows:
Case Study: Site A—Residential Area: Hackney Wick—There were a total of 33 movements tested within this network:
- o
Six movements within each priority junction adding up to 18 movements
- o
Nine within the roundabout
- o
Six within the signal-controlled junction
Case Study: Site B—Commercial Area: Westfield Stratford City—There were a total of 18 movements tested within the network:
- o
Six movements within each of the three signal-controlled junctions
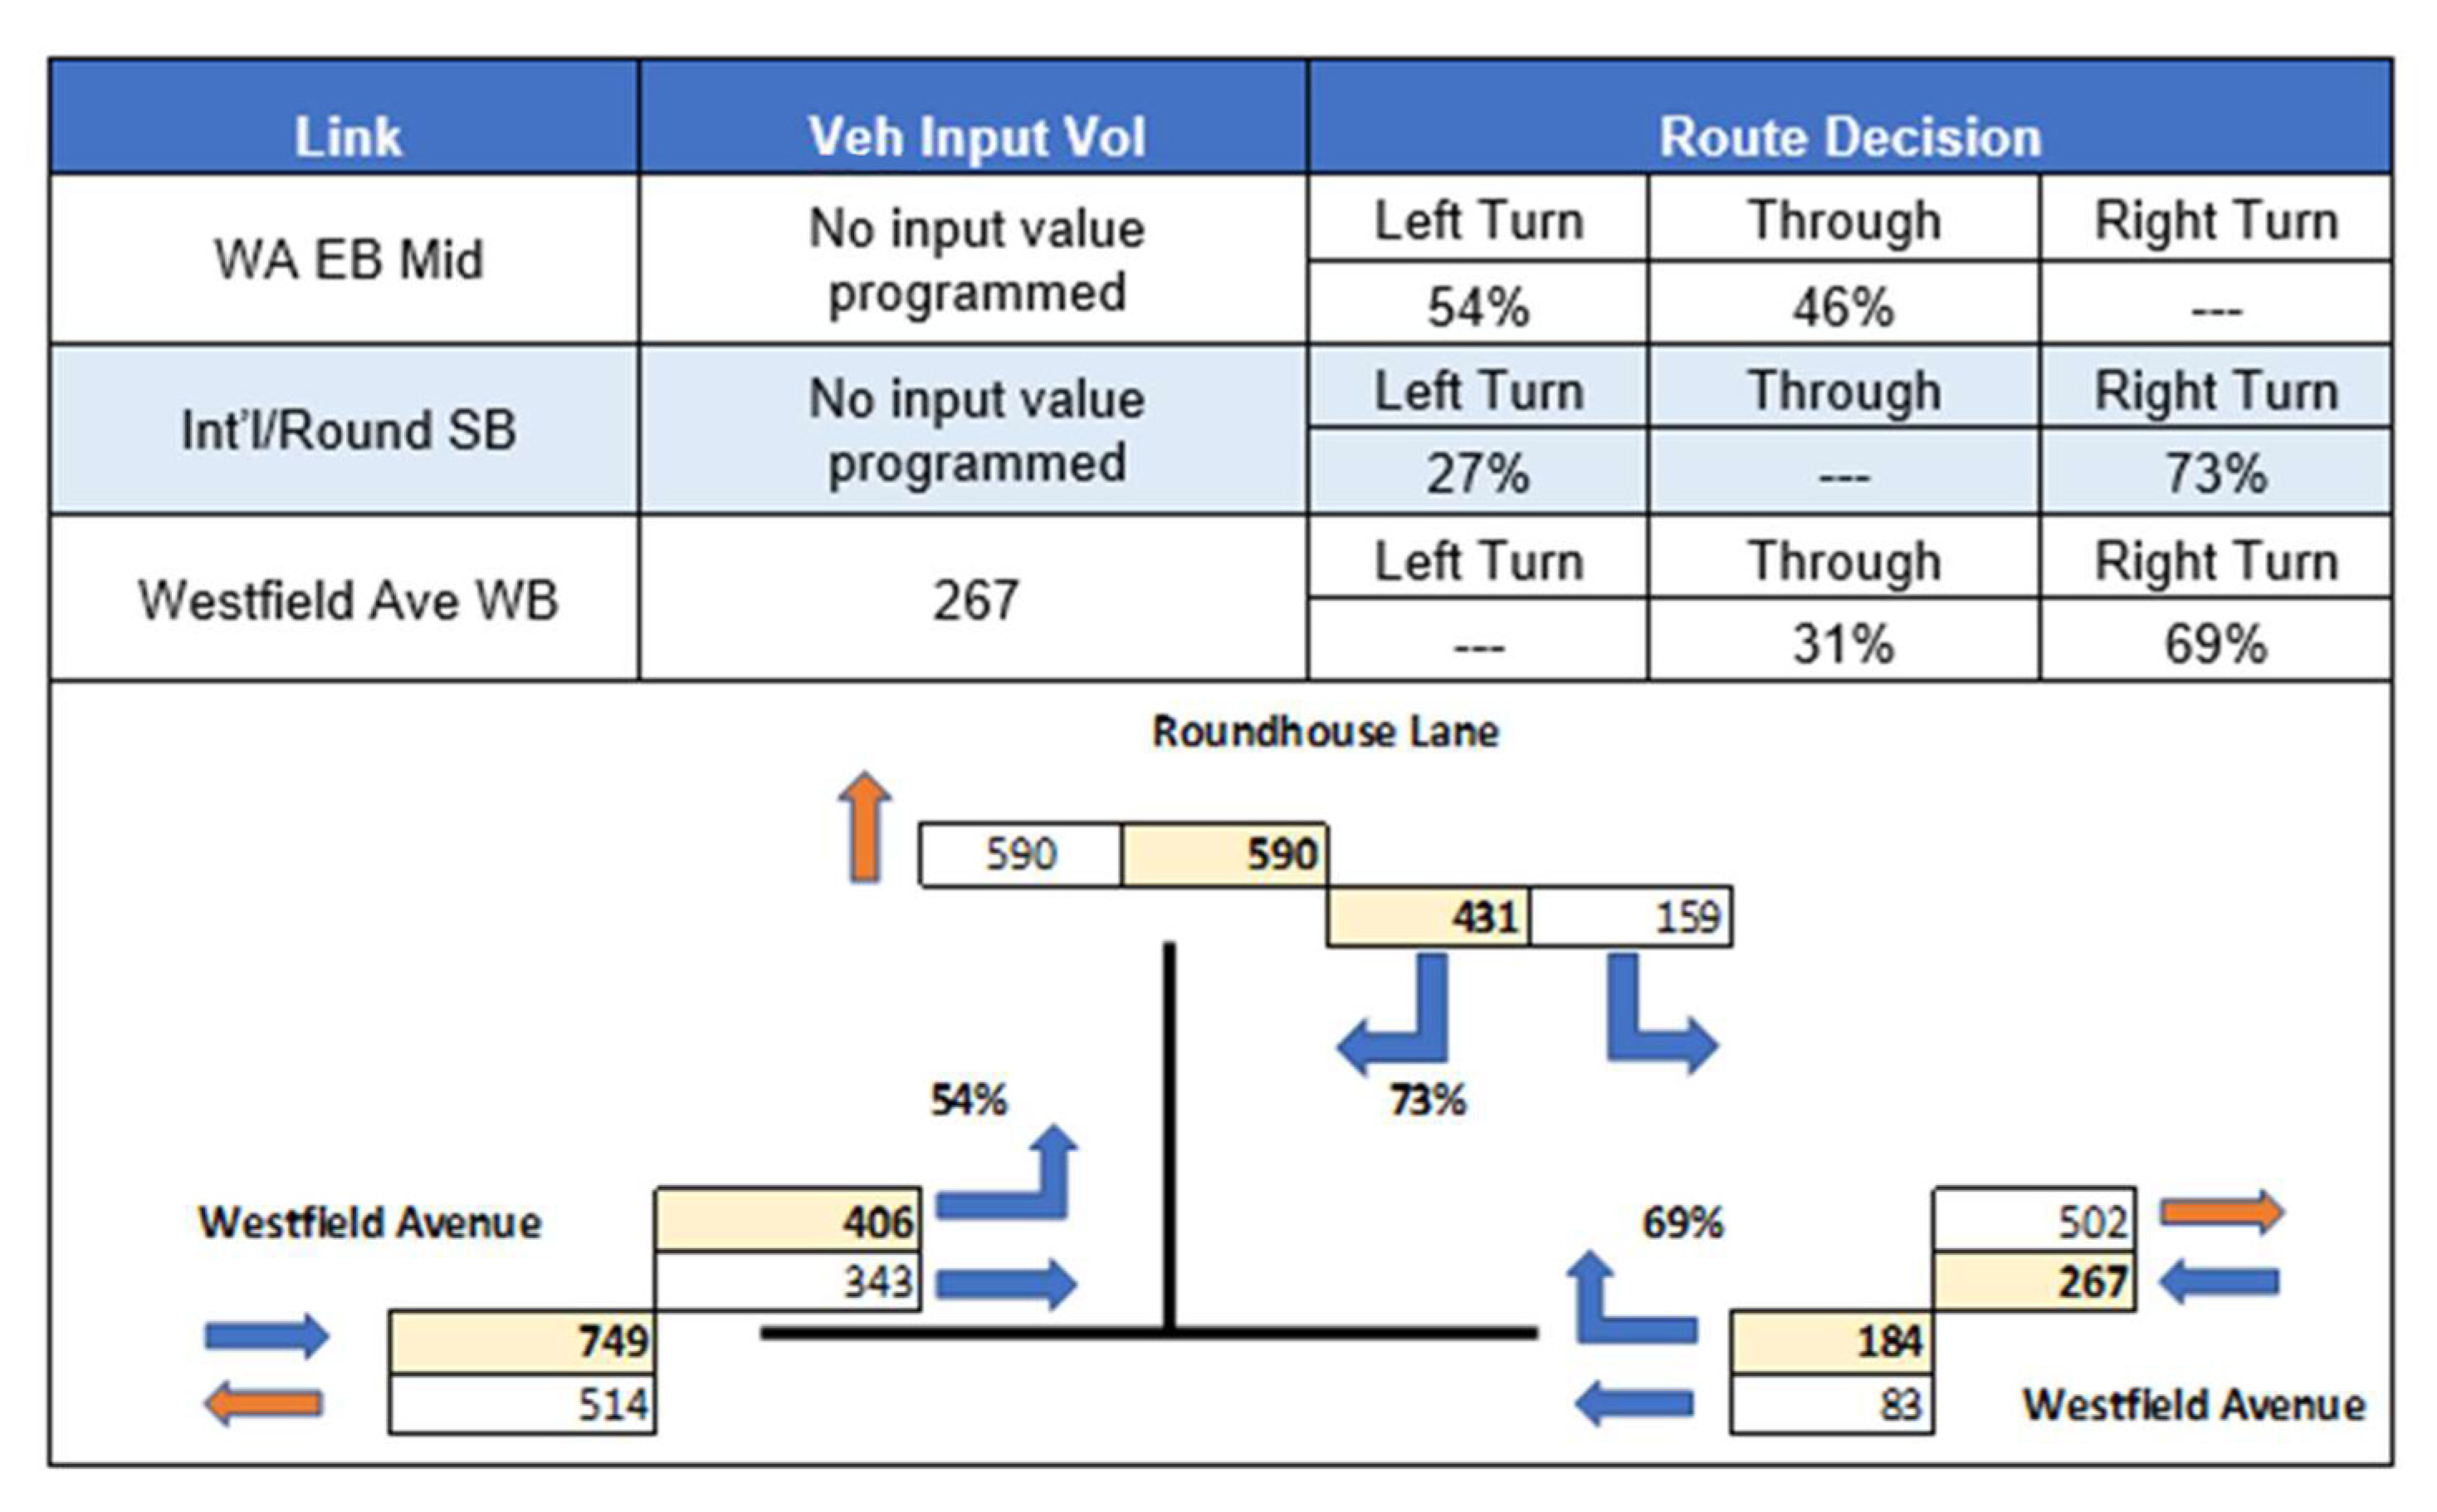
3.10. Network Vehicle Input
Raw vehicle data from the Department for Transport (DfT) count points were used to estimate the number of vehicles entering the network. The raw vehicle data for cars passing the count points were taken between the hours of 11:00 and 13:00 for the two most recent years available, ignoring data for 2020 due to the impact of the nationwide lockdowns that were in effect.
For Case Study A, there were four input points, and the point with the highest volume was calibrated at 731 vehicles per hour. Case Study B had five input points with the highest volume calibrated at 742 vehicles per hour.
Figure 10 below shows an example of how volumes were calculated in Junction 2.
3.11. Limitations of the Study
A fixed, non-dynamic matrix for route assignment was employed, to keep the area contained to the isolated footprint, where vehicles will be tracked between named zones.
The analysed scenarios were considered as ‘boundary conditions’ since the FAVs were not allowed to exceed the acceleration and deceleration constraints applied.
The suspensions of the vehicles were not taken into consideration.
No vertical dimensions were introduced to the geometry of the network. The road surface was assumed to be completely flat.
Power and weight distributions were not altered as these refers exclusively to vehicles categorised as HGV (PTV AG, 2018), and are therefore irrelevant to this study since the ConFAV is modelled as a motor car.
A thesis licence was used for this research, and so the overall network size and number of signal controllers were limited.
The research was undertaken from a transport planning perspective and so equipped technology, autonomy outside of the investigated locations, and geofencing were outside of the scope of research.
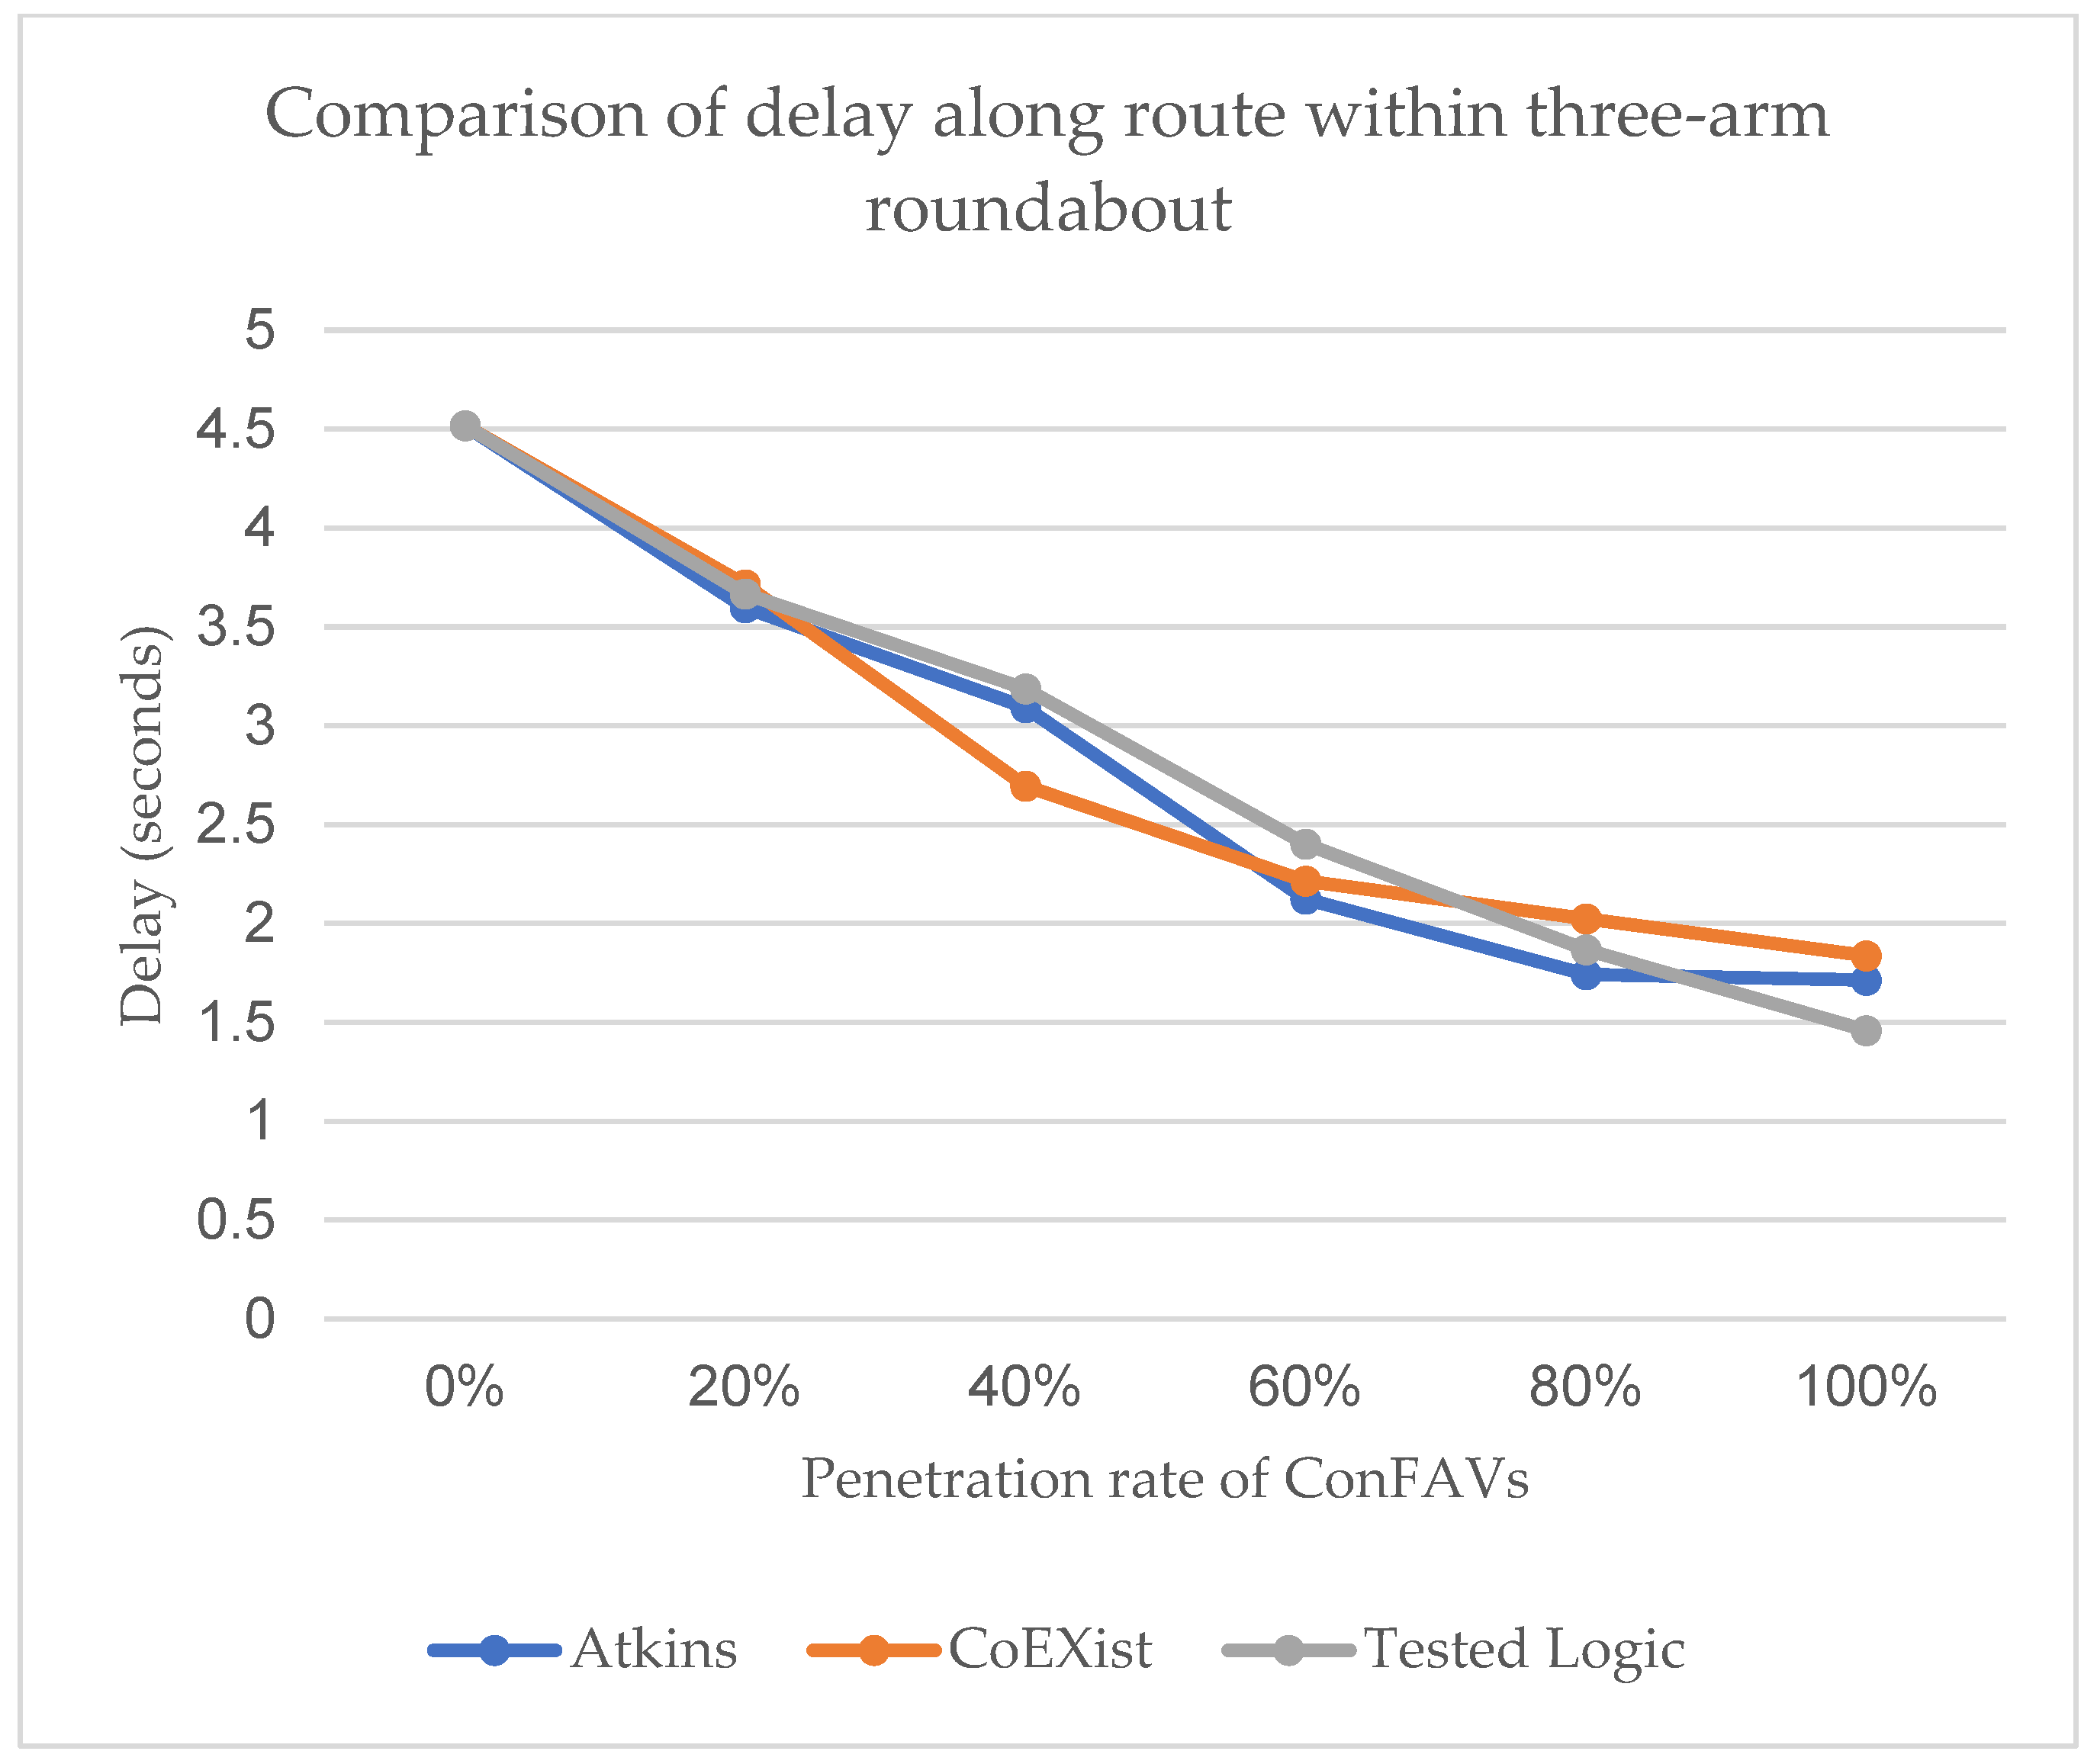
4. Congestion Performance Results and Discussion
Before the car following model developed in this research was used in the assessment of case studies, its performance in typical junctions was compared with that of the ATKINS model and CoEXist models that were discussed in
Section 2.7 of the Literature Review.
Figure 11 below shows the comparison of the three models in a single manoeuvre within a three-arm roundabout.
To examine congestion performance, vehicle delay and network LOS were estimated using the proposed model and a comparative study was undertaken across different penetration levels of ConFAVs in the network (i.e., from conventional vehicles only network to one with 100% fully autonomous vehicles).
4.1. Case Study: Site A—Residential Area: Hackney Wick
4.1.1. Priority Junction 1
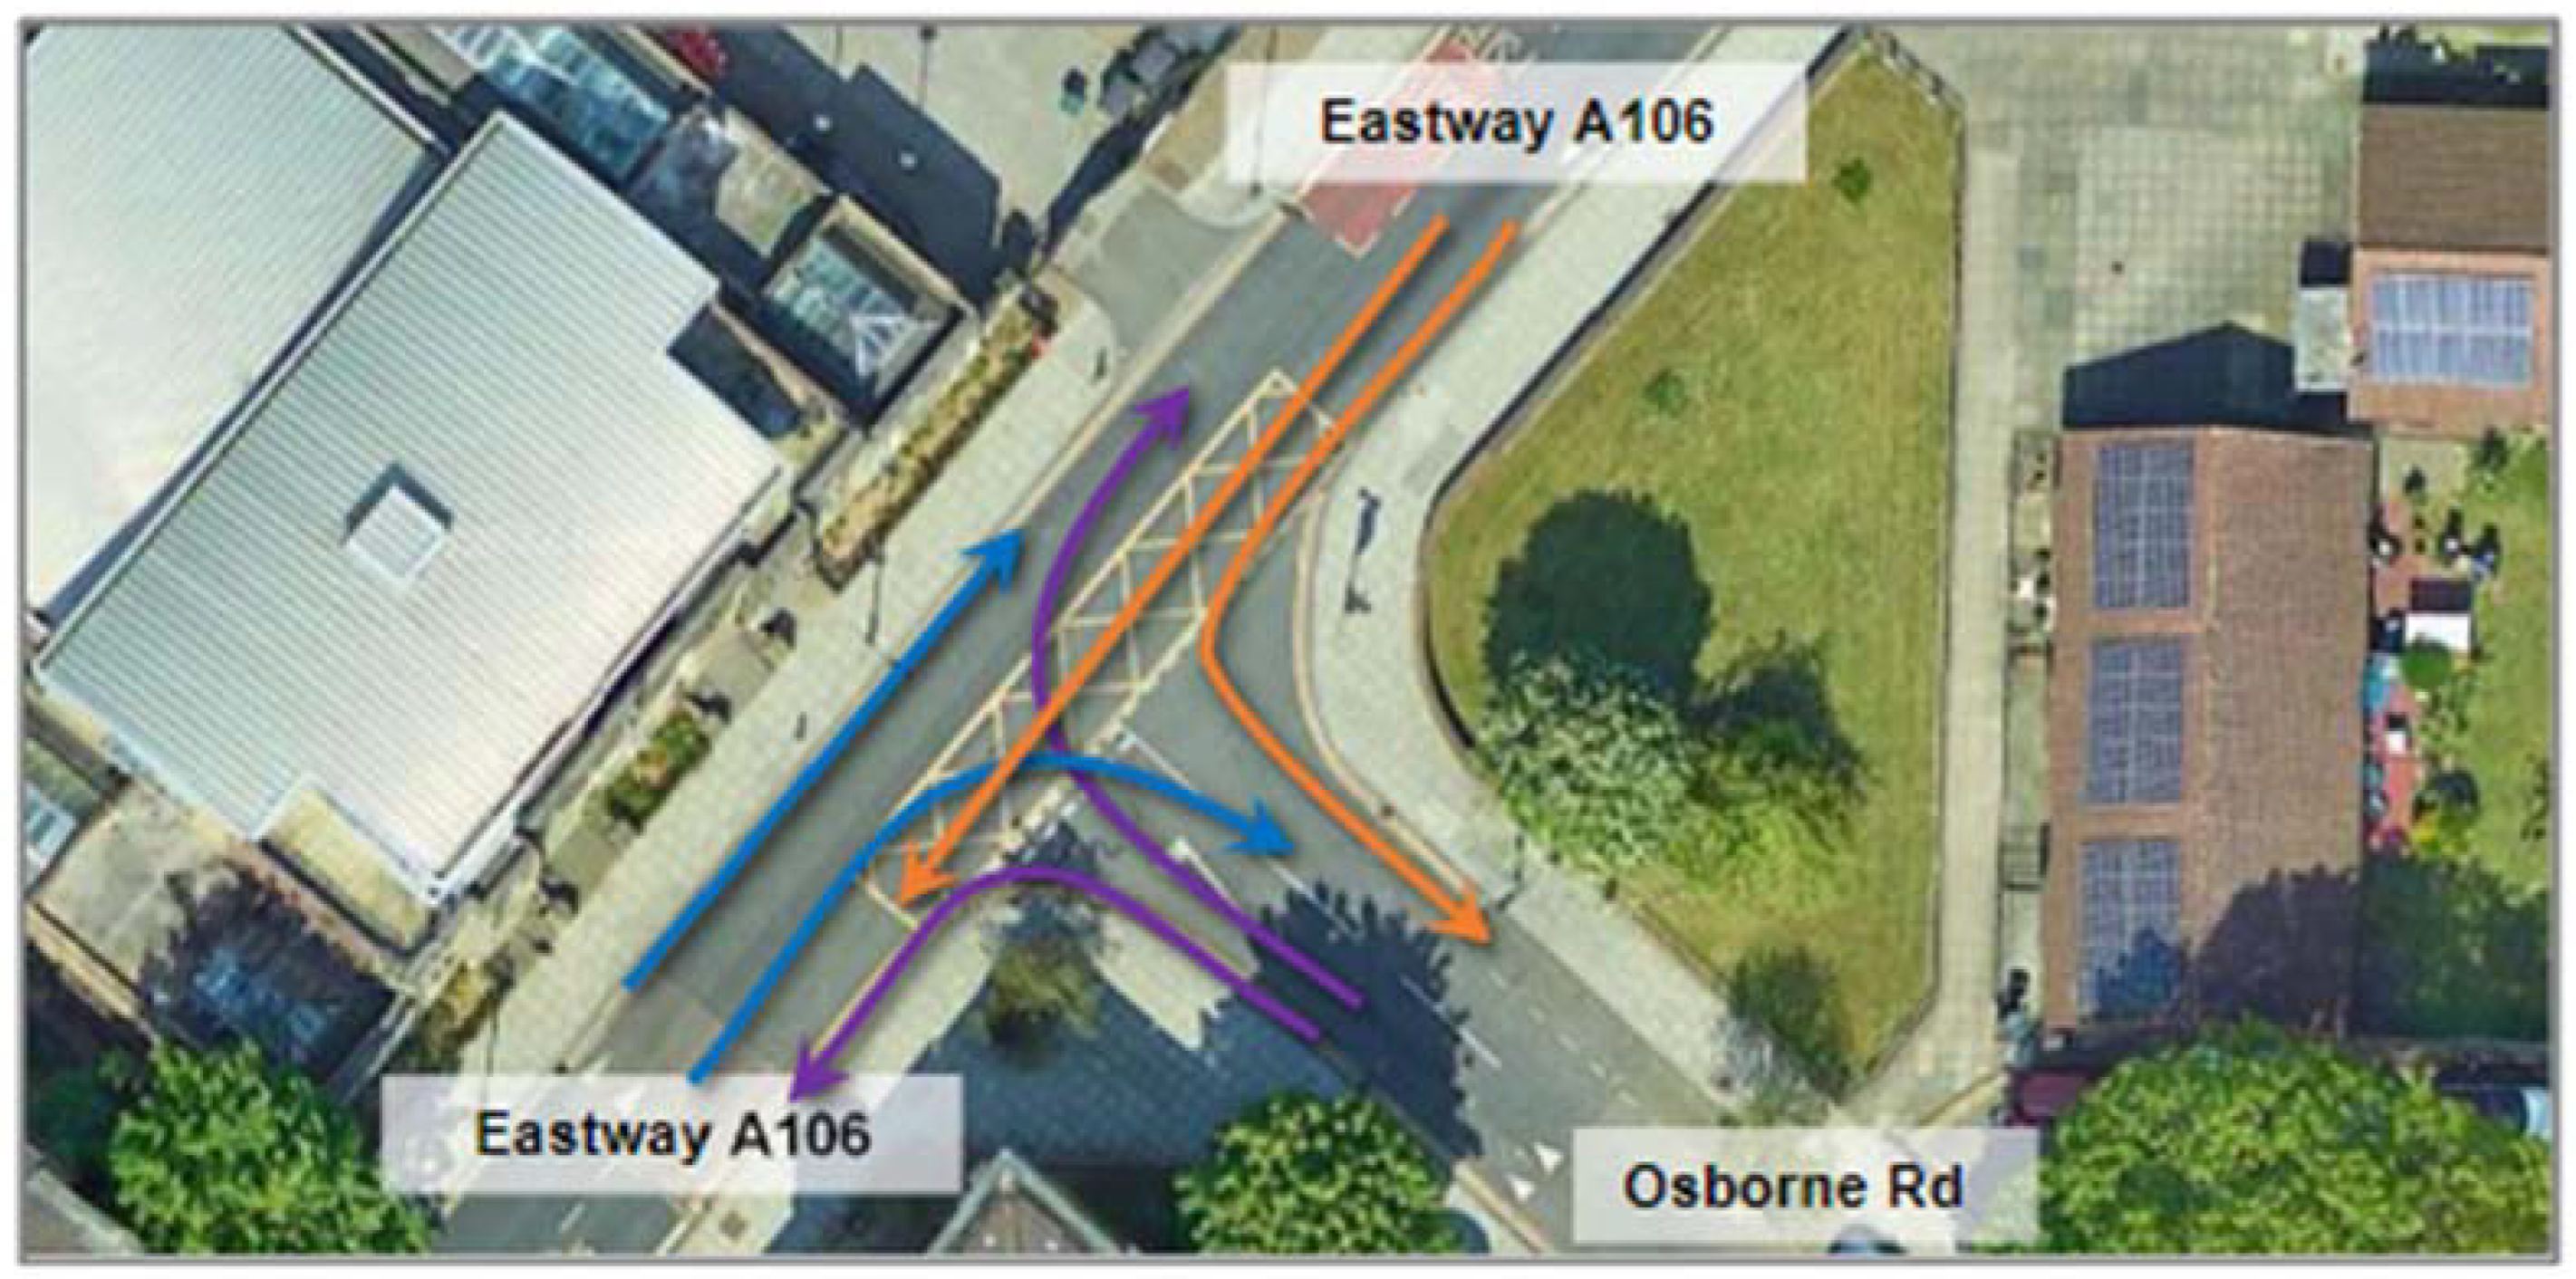
Observations were noted and compared for the three priority junctions, one roundabout, and one signal-controlled junction. Within priority Junction 1, it was observed that five out of the six movements (as shown in
Figure 12) recorded a reduction in the average delay of all vehicles. Northbound traffic on Eastway turning right unto Osborne Road saw a fluctuation throughout the simulations, with the highest recorded delay at 80% ConFAV penetration. It should be noted that all movements had very low average delays with the highest recorded being 3.279 s at 80% penetration and 3.020 s at 100% penetration.
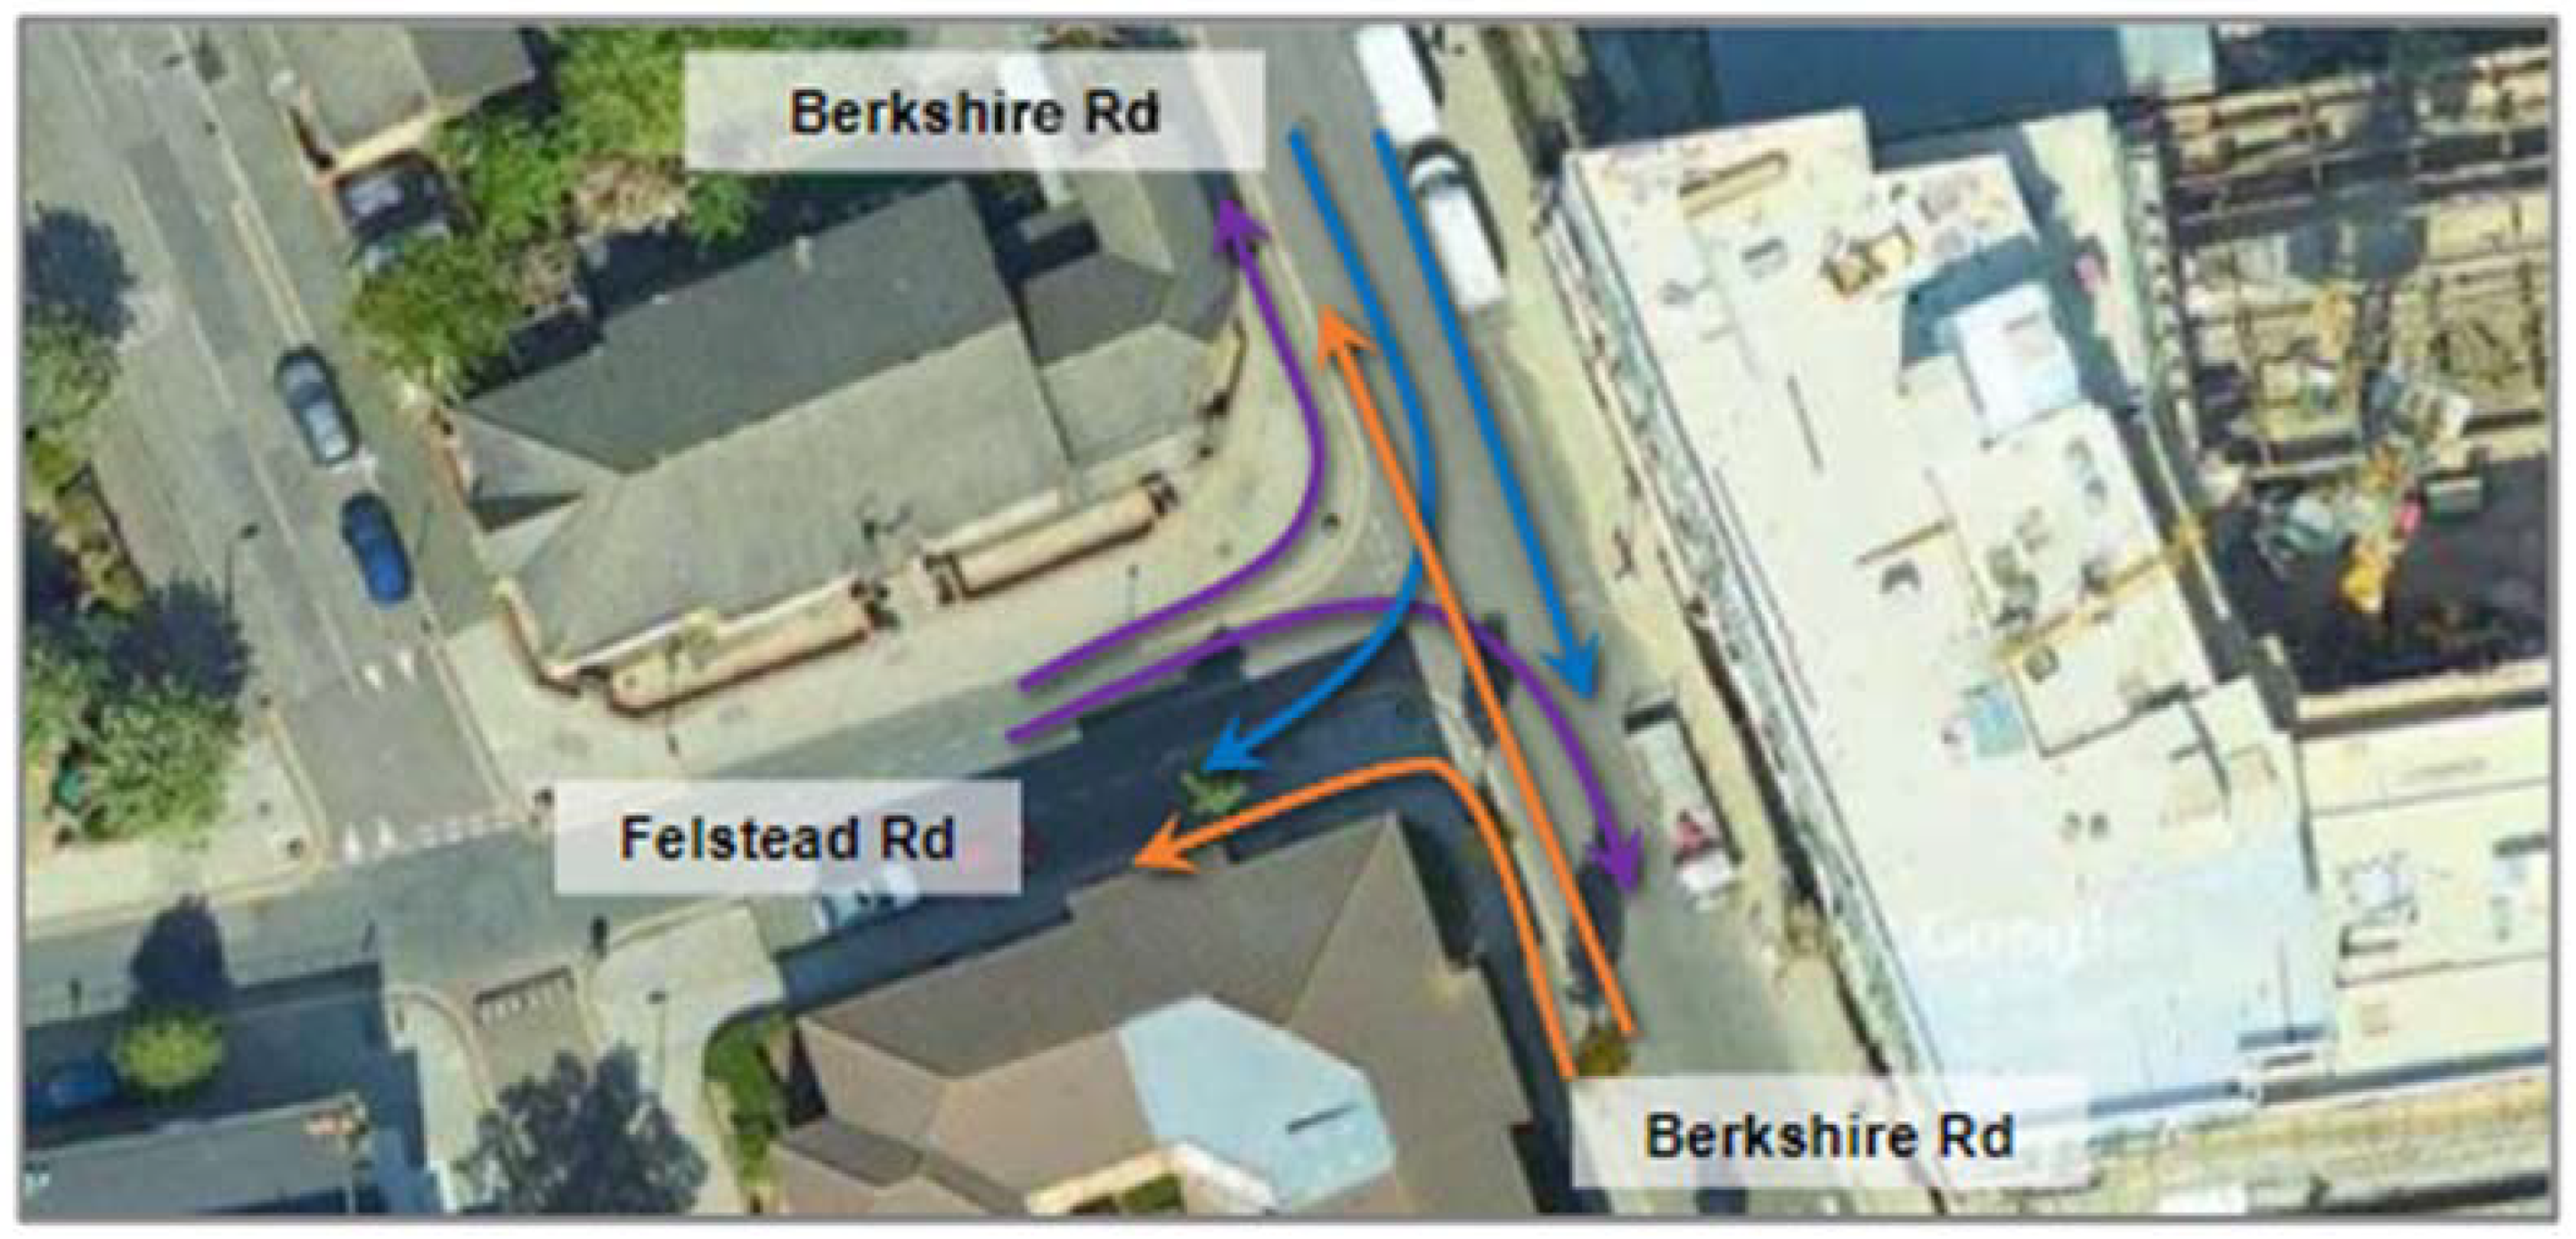
4.1.2. Priority Junction 2
Within Priority Junction 2, it was observed that four out of the six movements (as shown in
Figure 13) recorded very significant reductions in the average delay of all vehicles. Traffic exiting Felstead experienced a fluctuation throughout the simulations. Traffic turning left onto Berkshire experienced its highest level of delays during 20% ConFAV penetration, with recorded average delay rising from 0.446 to 0.775 s. Traffic turning right onto Berkshire also had its highest increase during 20% ConFAV penetration, recording 0.704 to 0.766 s. It should be noted that all movements had very low average delays with the highest recorded being 0.766 s at 100% penetration.
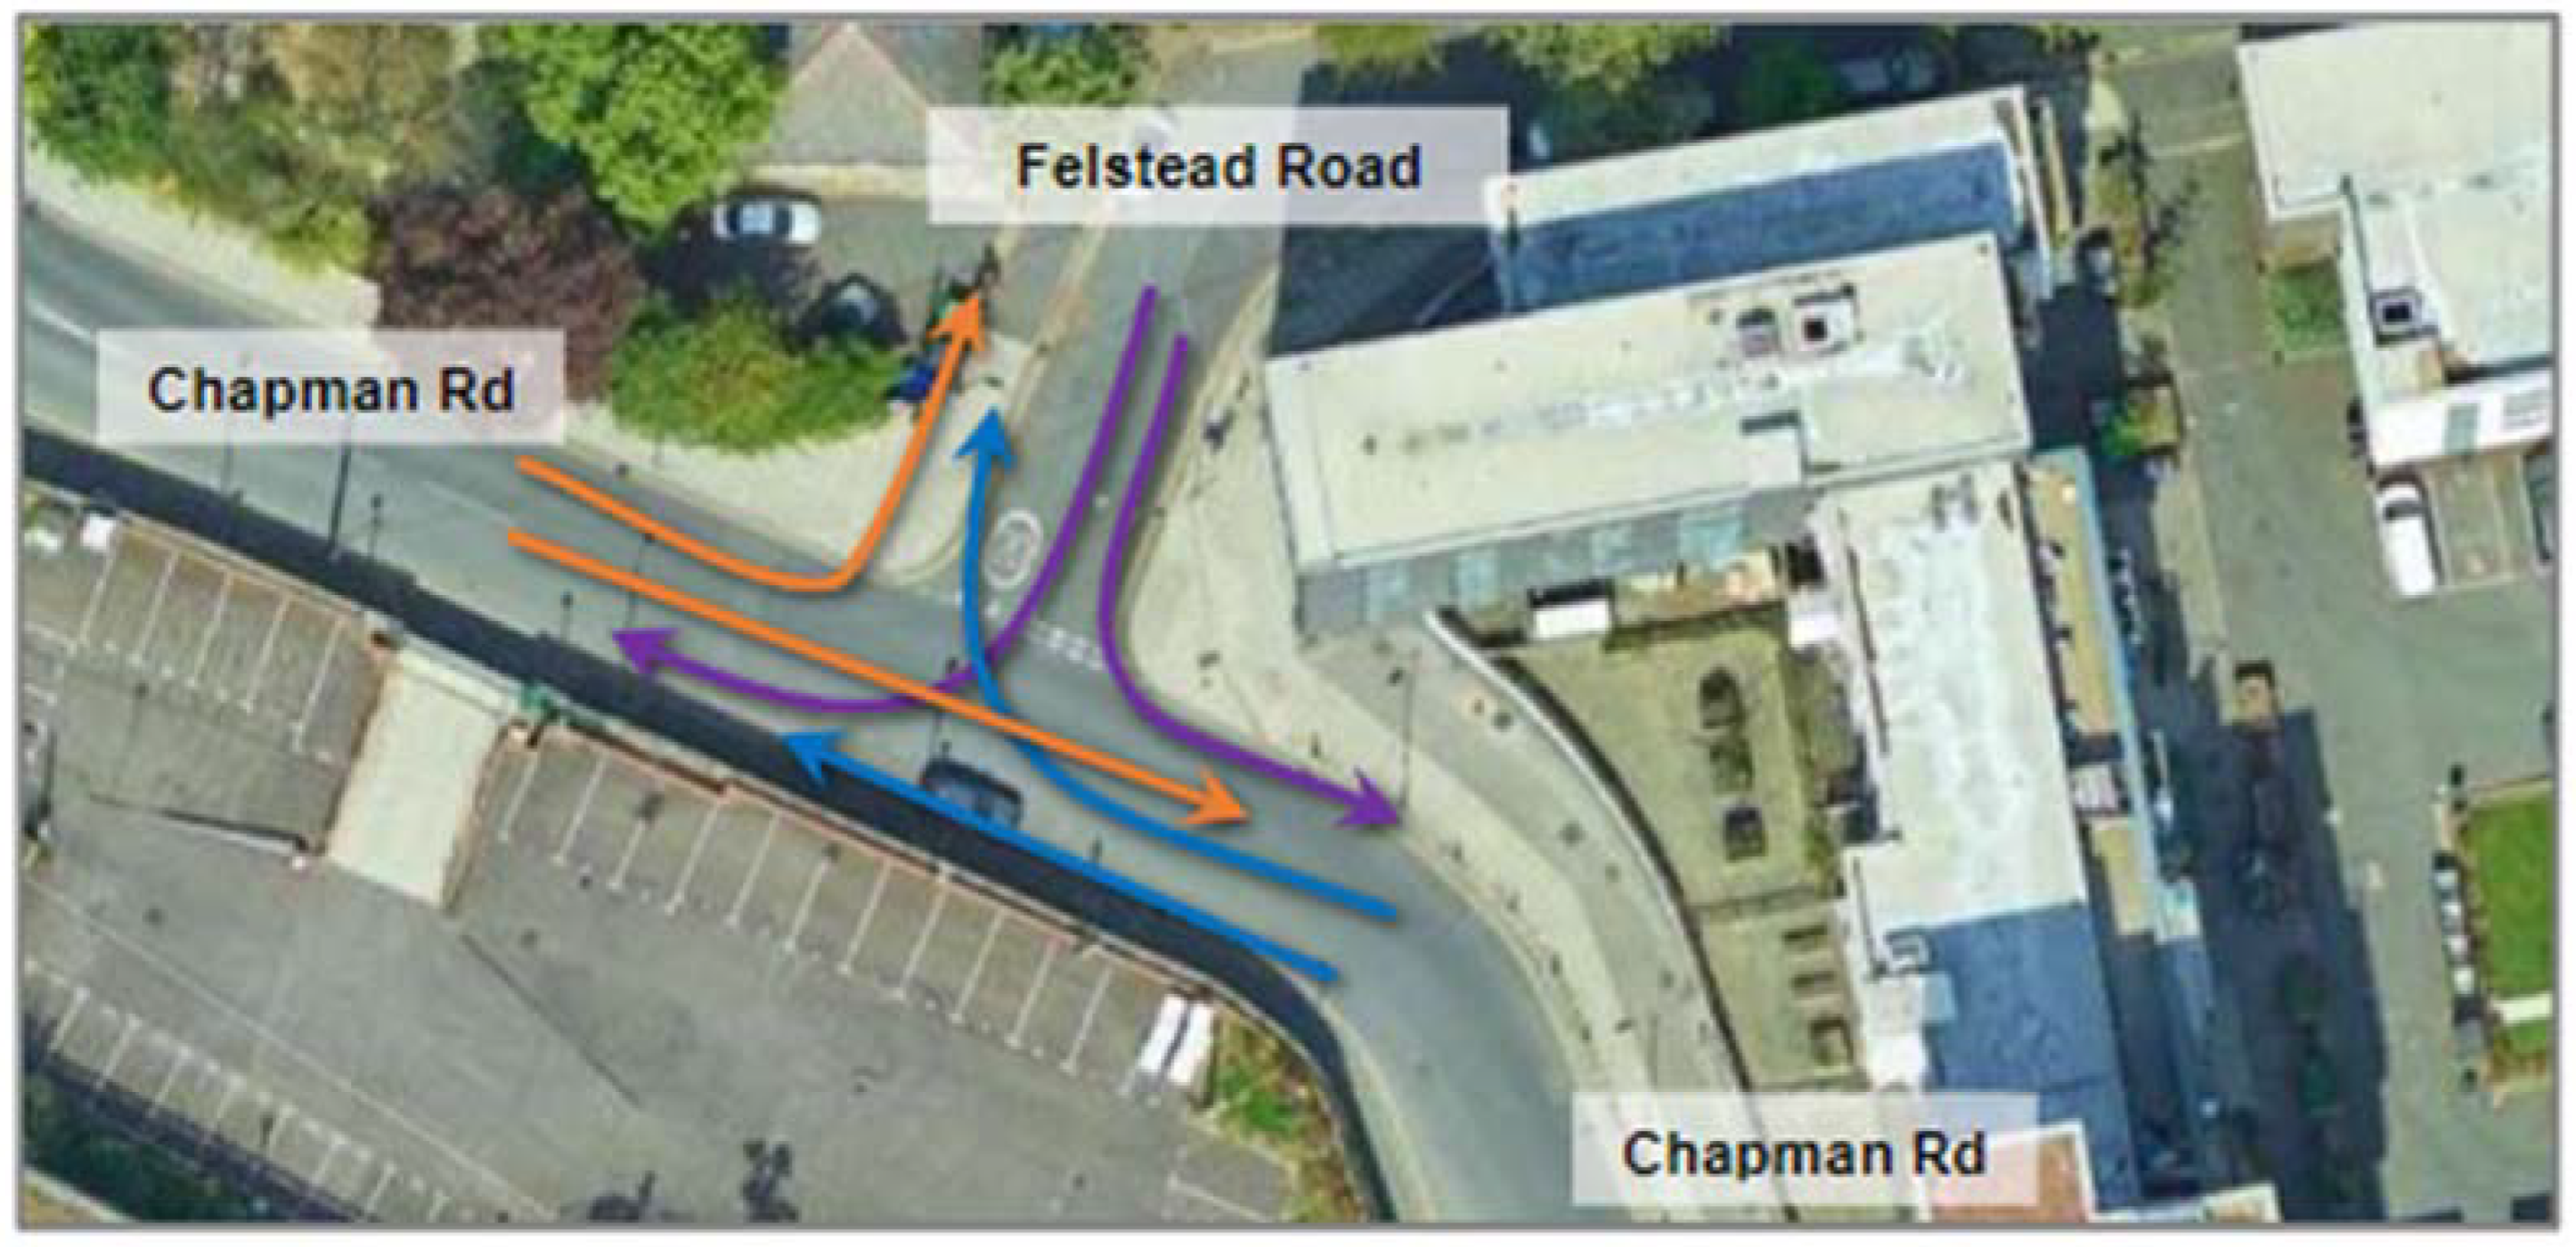
4.1.3. Priority Junction 3
Within Priority Junction 3, it was observed that four out of the six movements (as shown in
Figure 14) recorded very significant reductions in the average delay of all vehicles. Traffic turning onto Felstead experienced a fluctuation throughout the simulations with the highest level of delays recorded during 100% ConFAV penetration. Southbound traffic from Chapman Road turning left onto Felstead had a 4% increase amounting to 0.102 s at 100% penetration. Northbound traffic turning right onto Felstead Road had a 22% increase amounting to 0.035 s. It should be noted that all movements had very low average delays with the highest recorded being 2.619 s at 100% penetration.
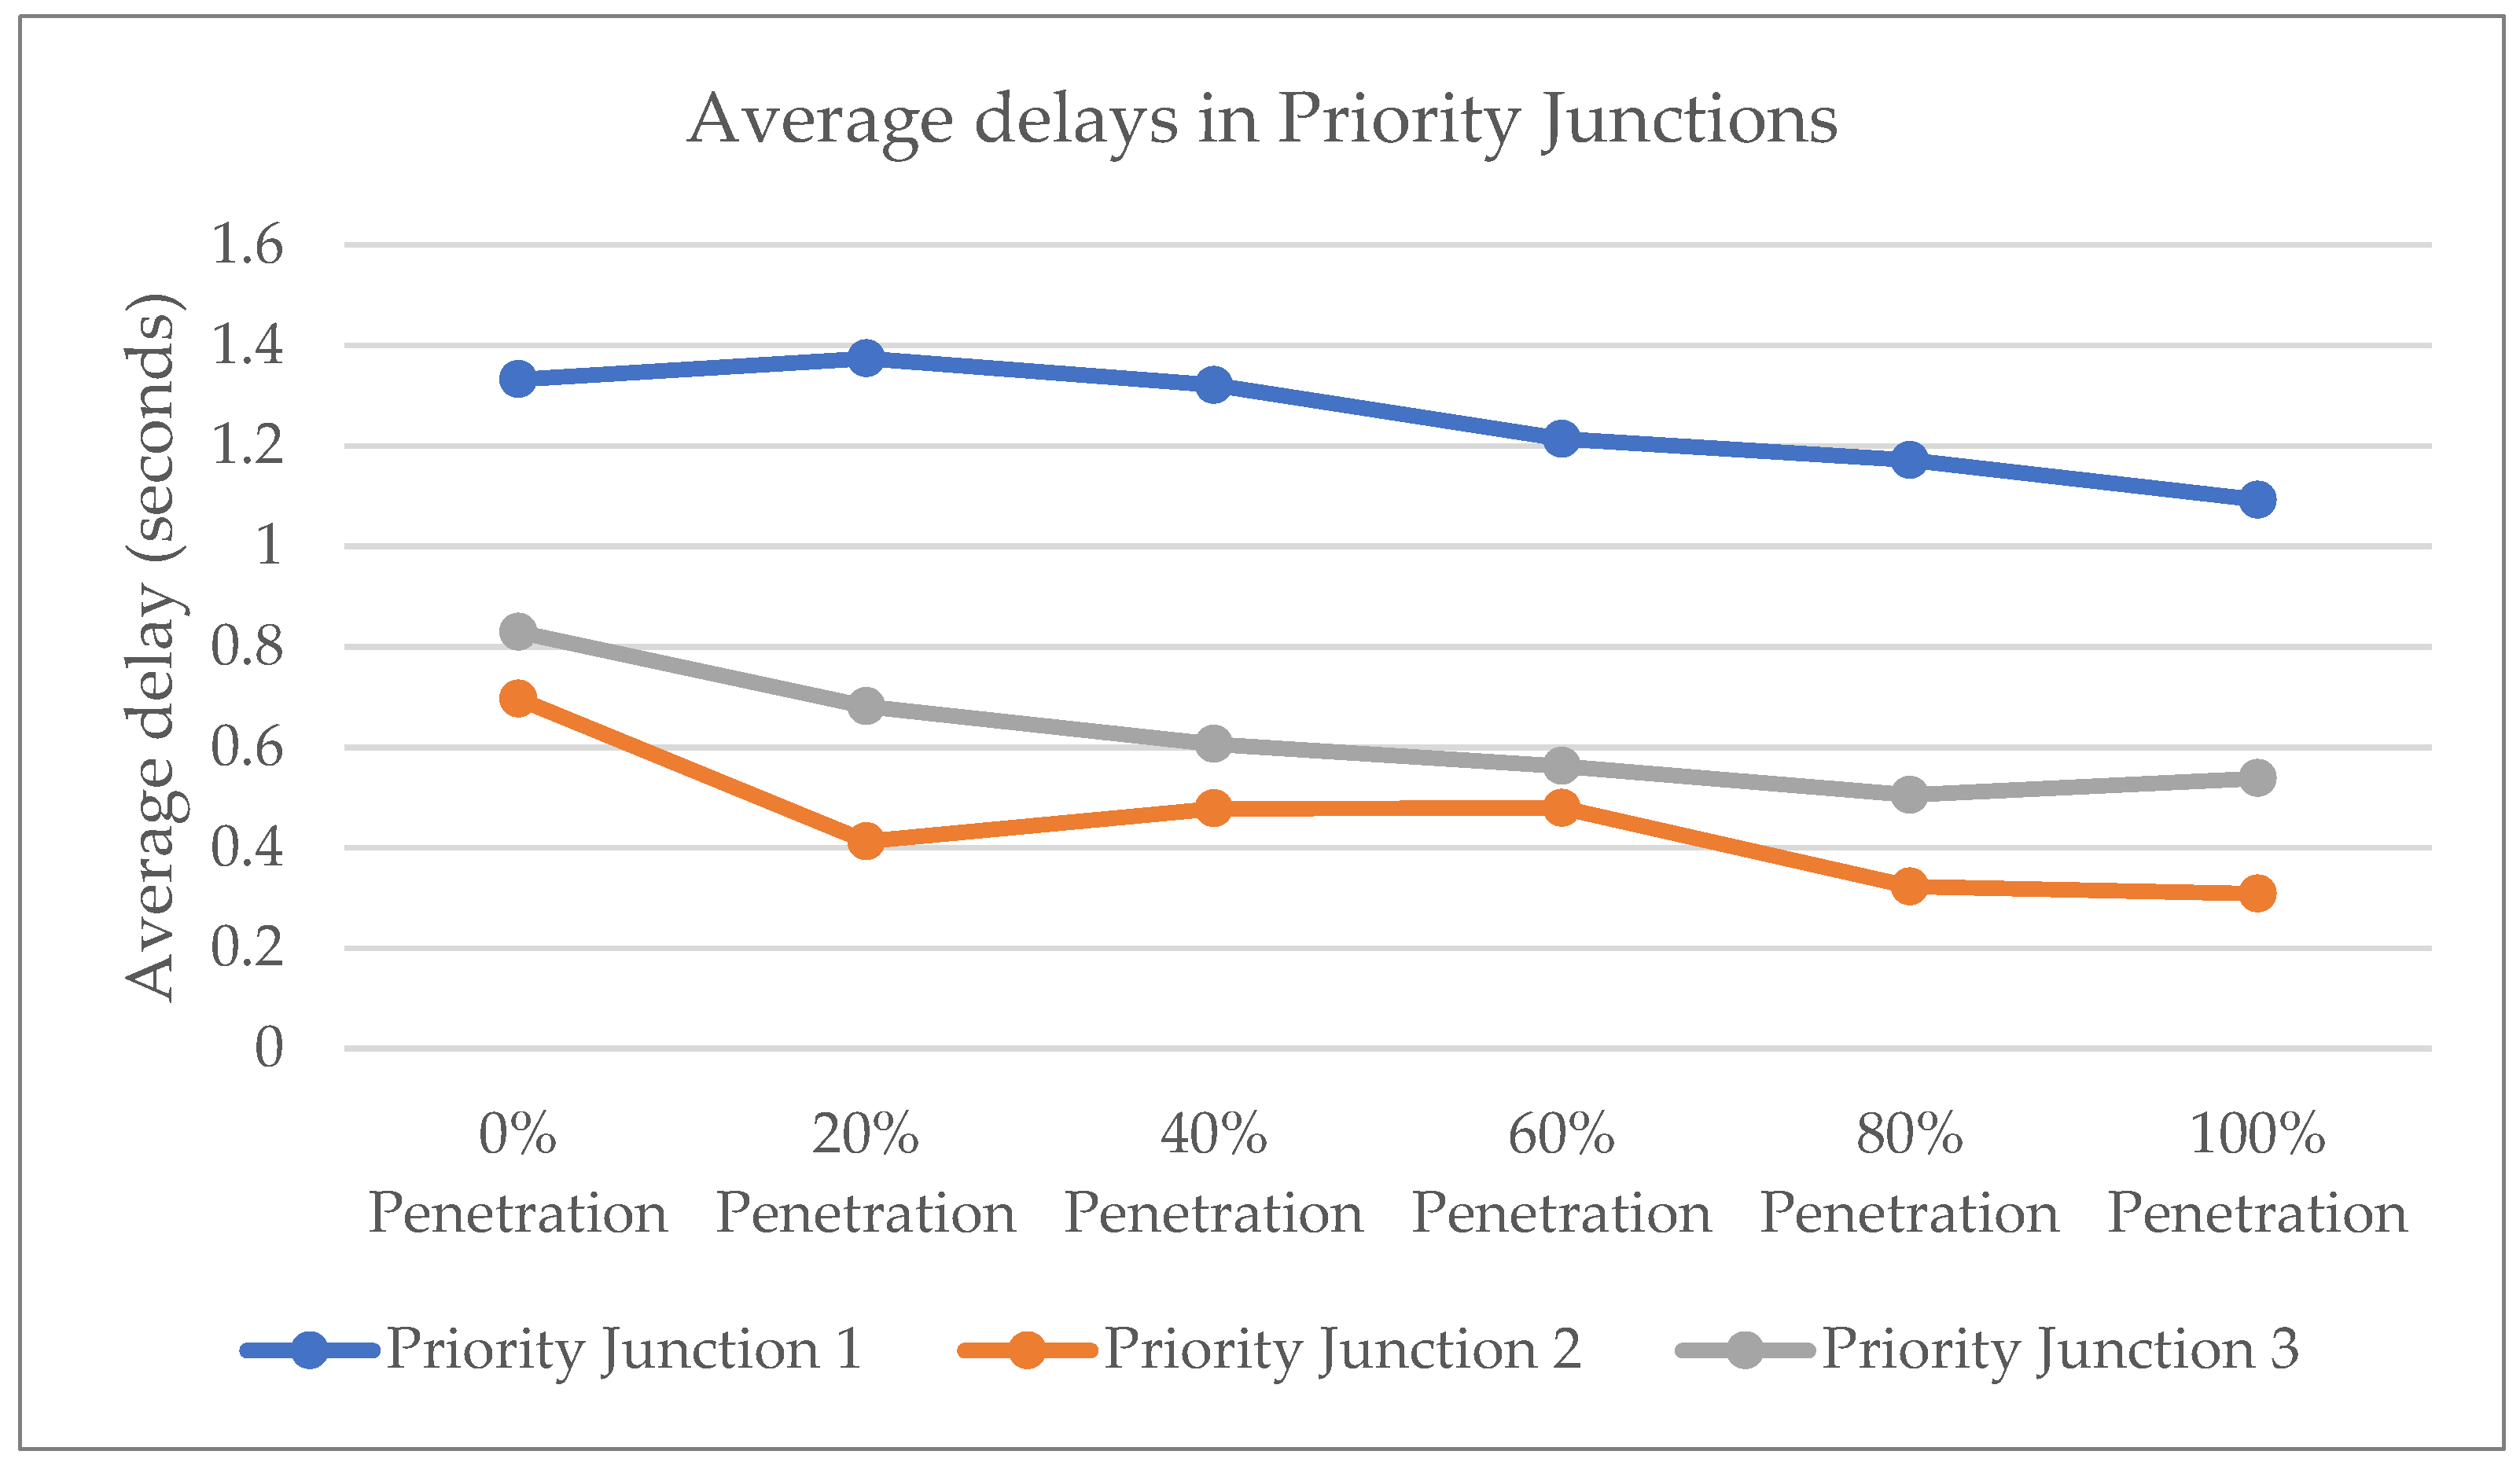
The average delay for all movements within each of the priority junctions in Site A was calculated and compared for each level of ConFAV penetration. It was observed that there was a slow decline in the average delay as the number of ConFAVs increased within the network, as illustrated in
Figure 15. Each junction maintained an excellent level of service, as the worst average delay recorded was less than 1.4 s, keeping within a level of service (LOS) of category ‘A’.
4.1.4. Roundabout Junction
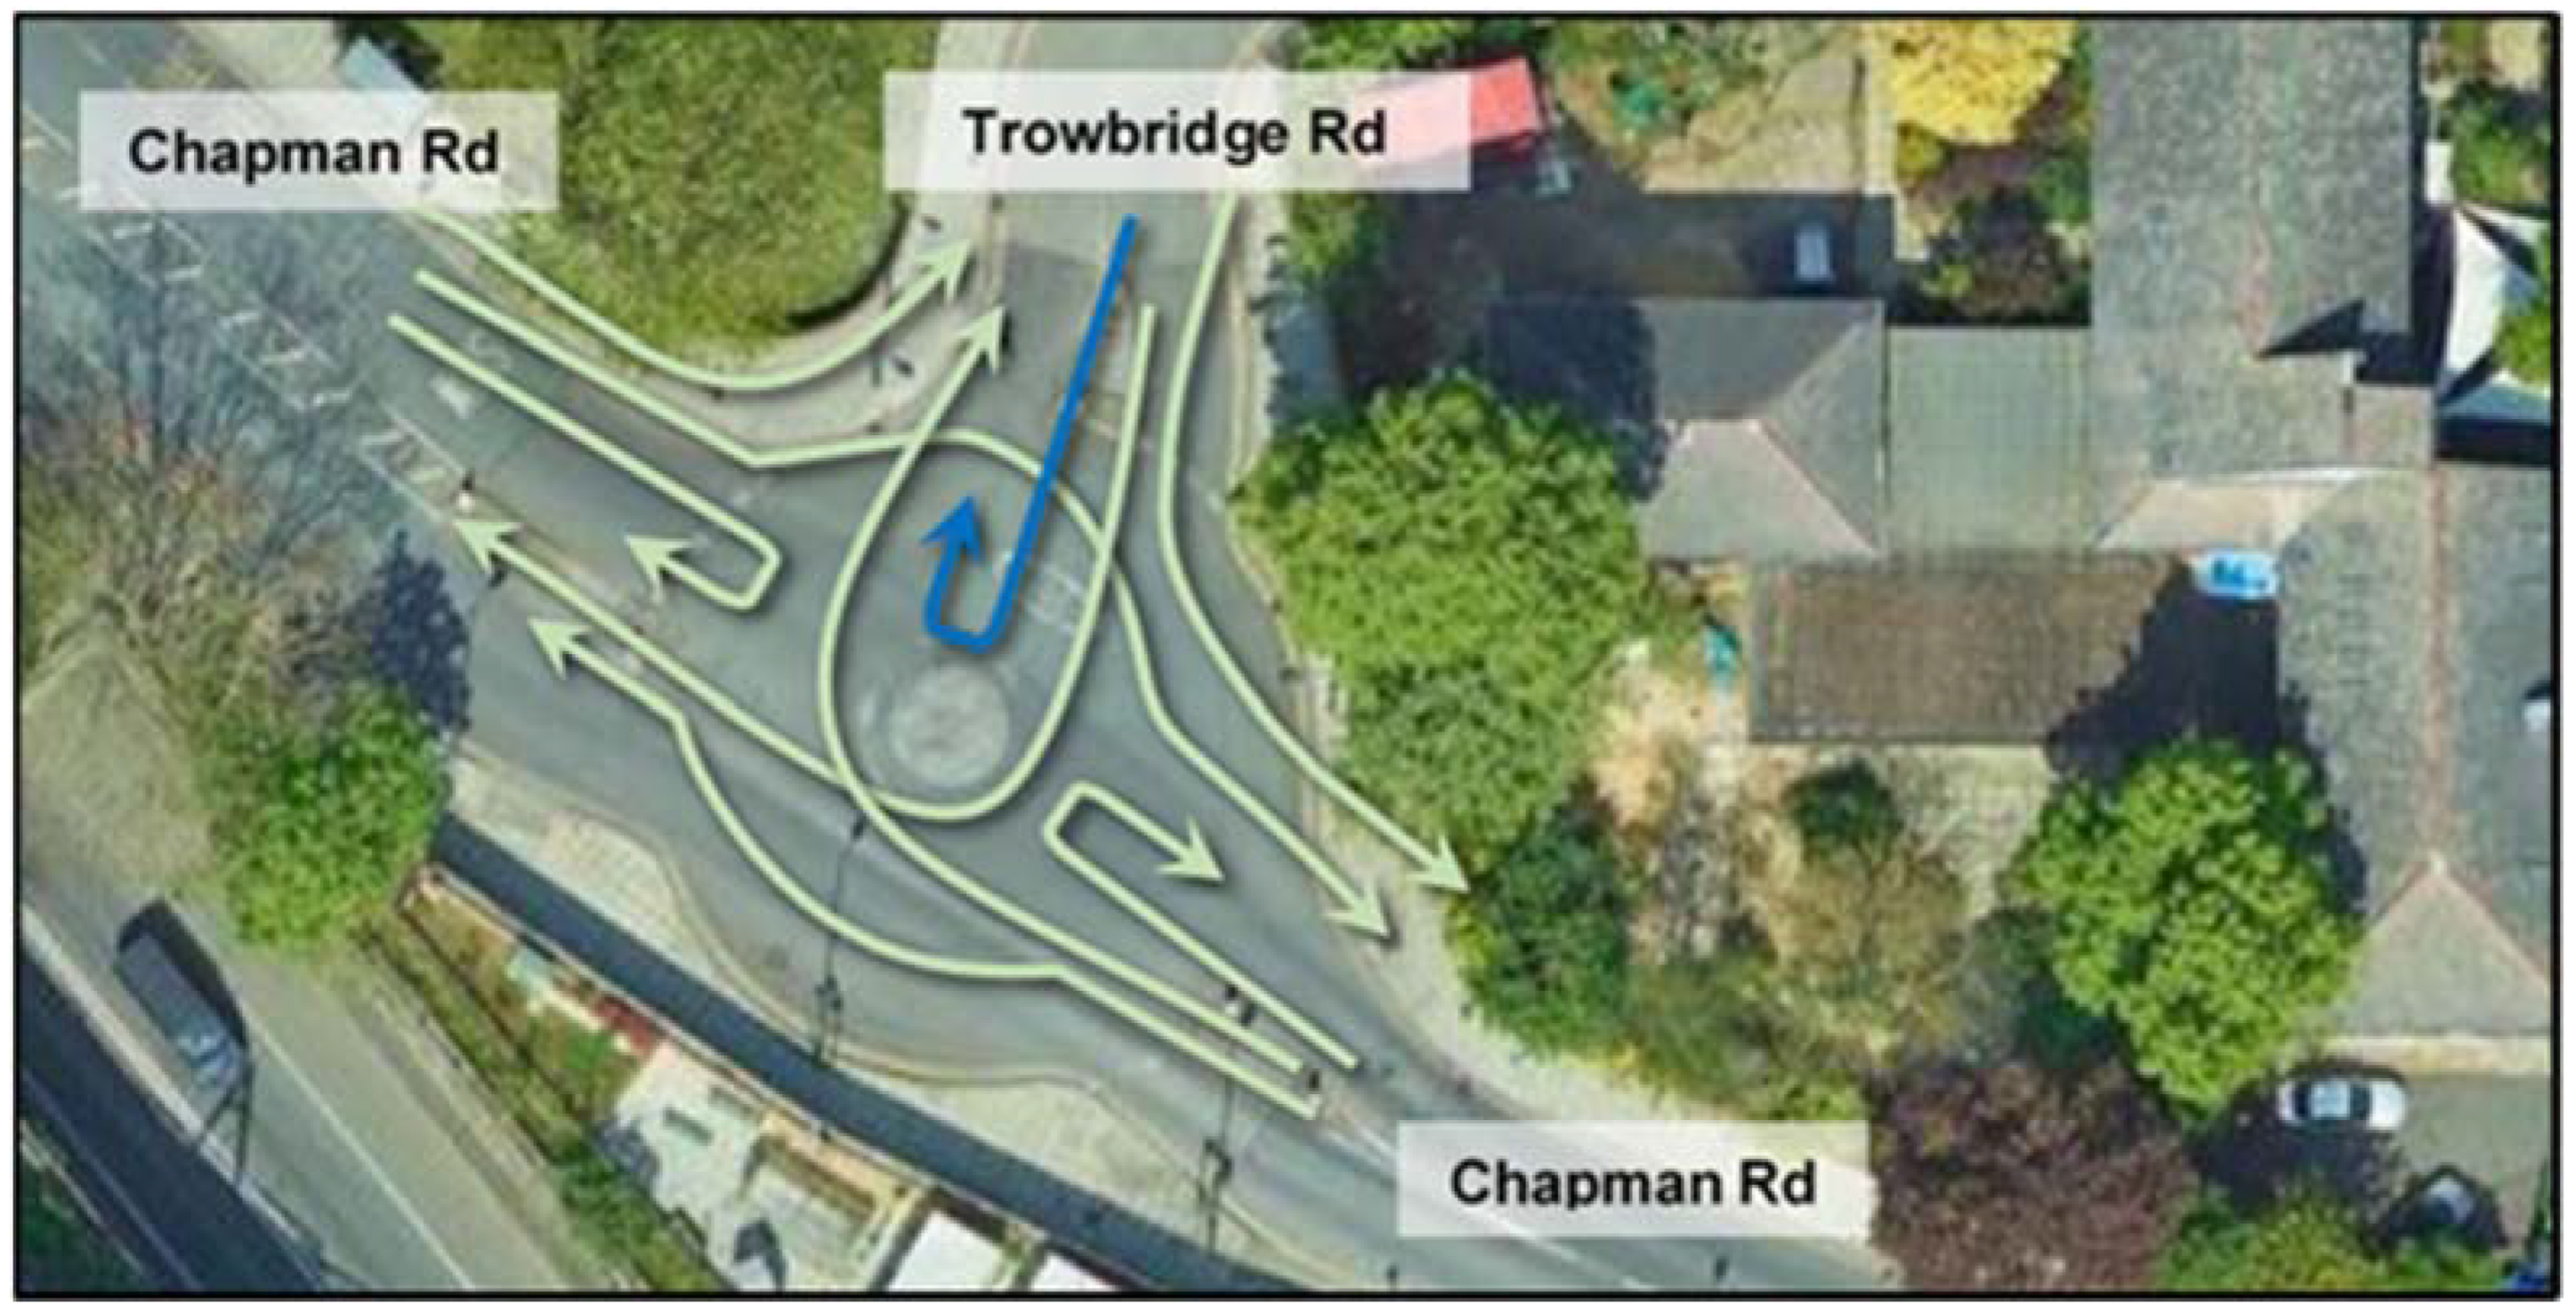
Within the roundabout, it was observed that eight out of nine movements (as shown in
Figure 16) recorded reductions in the average delay of all vehicles (when comparing 0% ConFAV penetration to 100% ConFAV penetration) ranging between 47% and 98%. Southbound traffic from Trowbridge Road that enter the roundabout to execute a U-turn experienced zero (0) delays throughout all six simulations. It should be noted that all movements had very low average delays with the highest recorded being 4.013 s at 0% penetration.
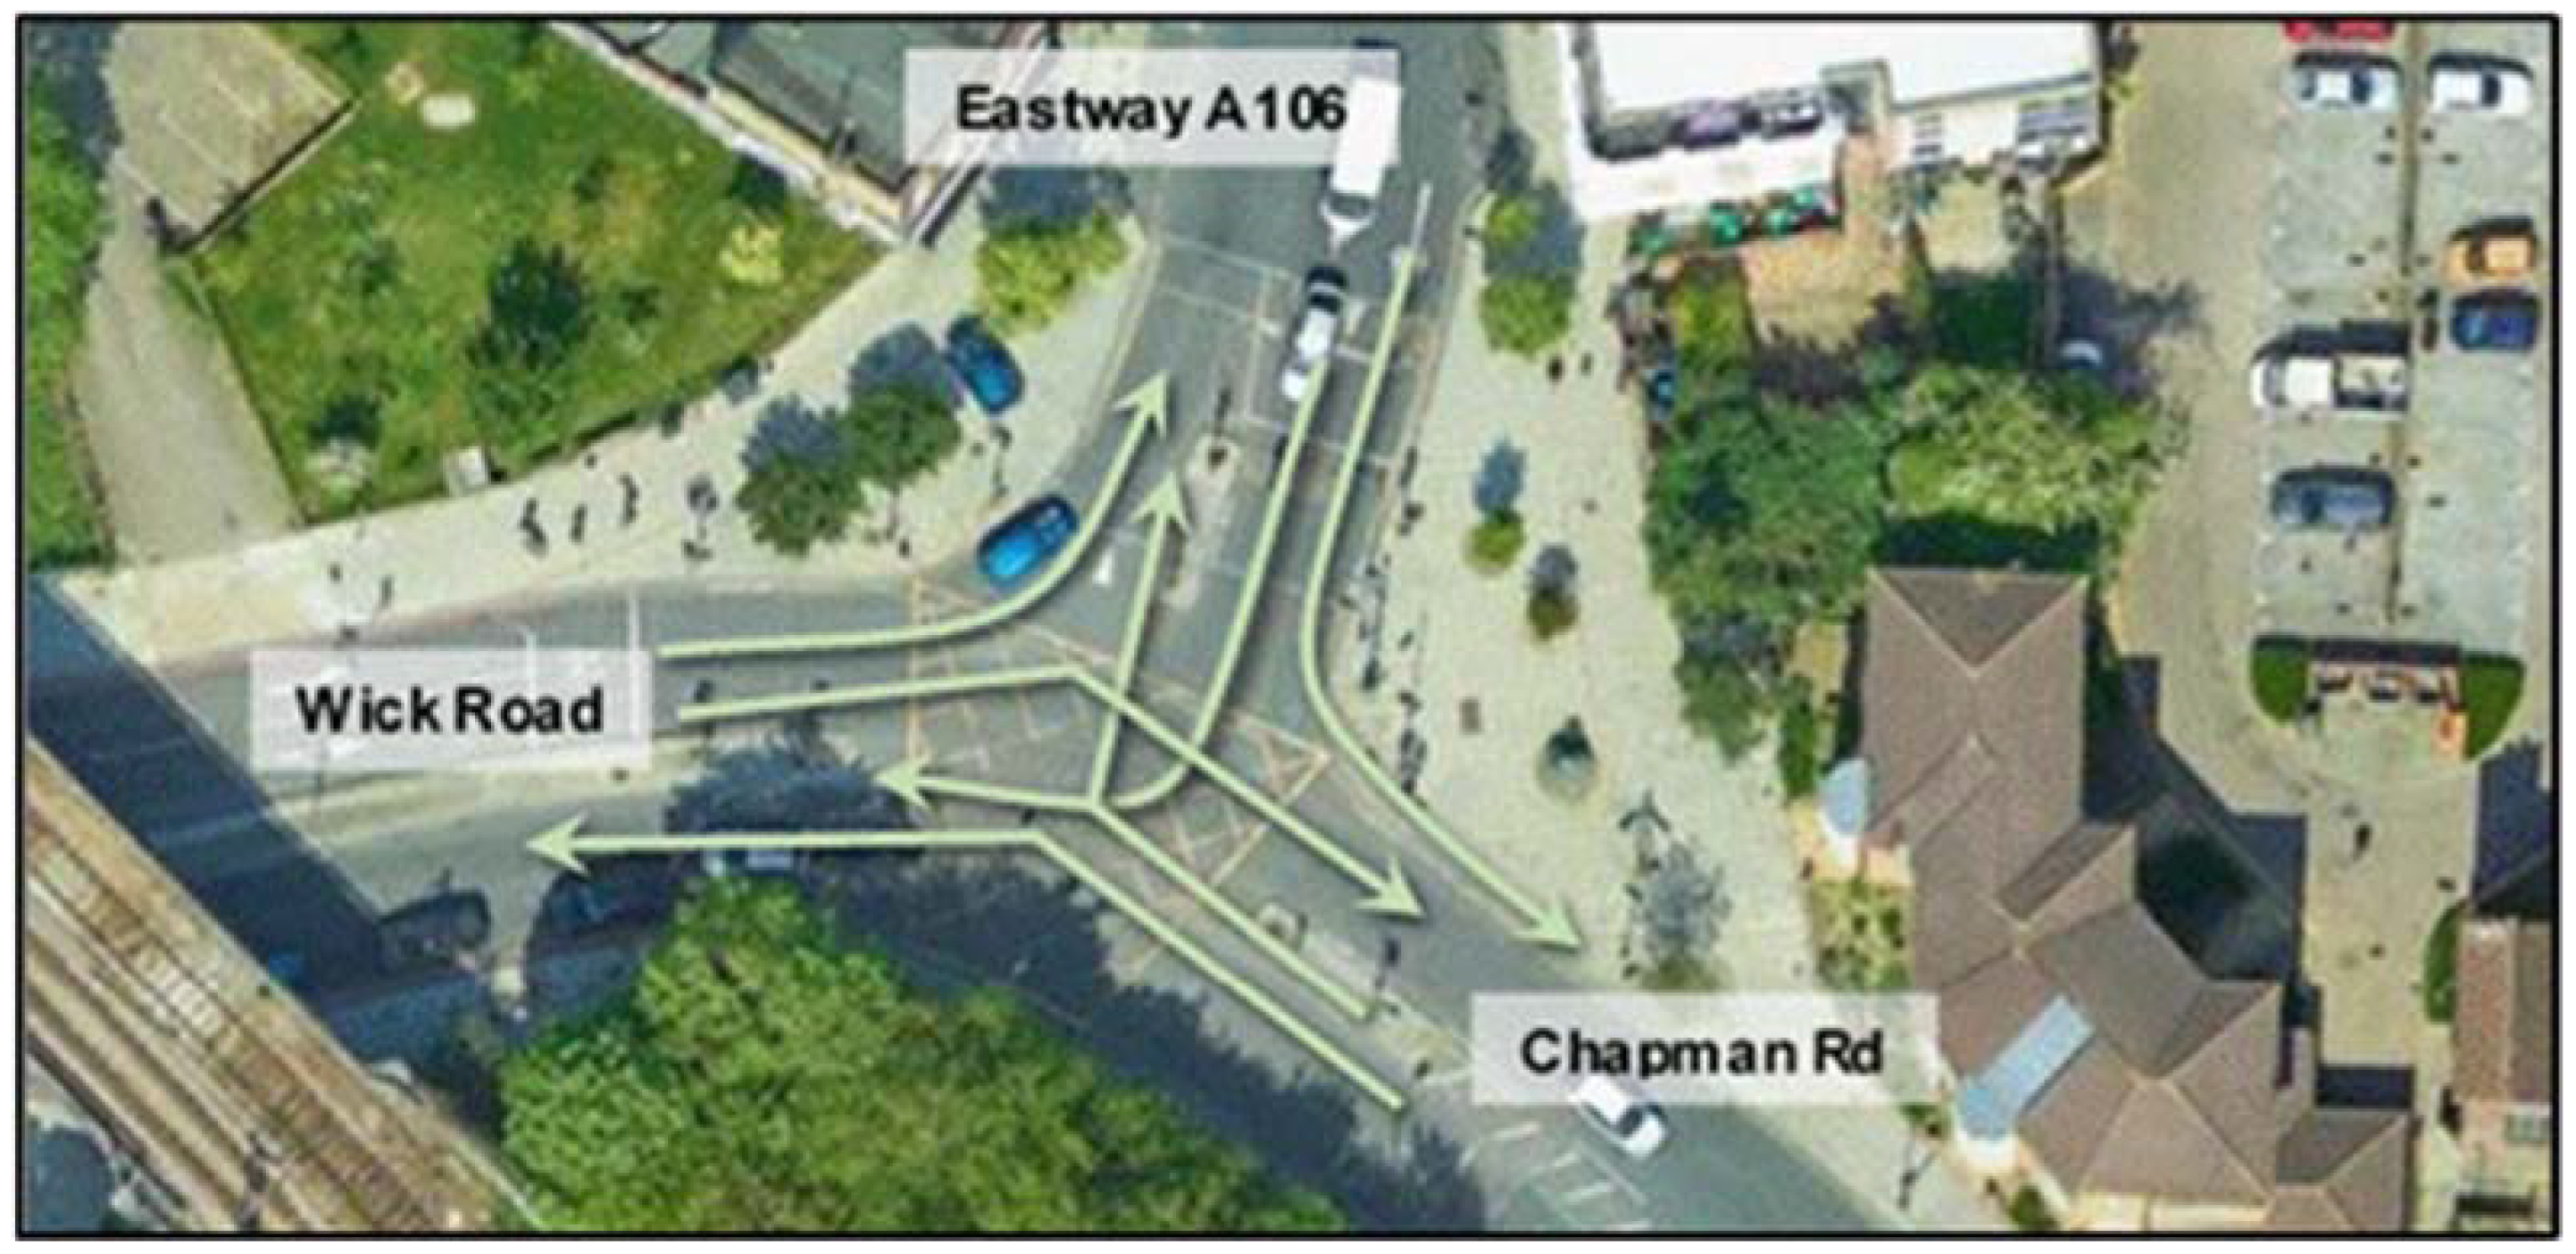
4.1.5. Signal-Controlled Junction
Within the signal-controlled junction, it was observed that all six movements (as shown in
Figure 17) recorded reductions in the average delay of all vehicles. Eastbound traffic on Wick Road turning left onto Eastway saw extremely low delays. This is the route that has a permanent green at the junction, which would explain delays being less than 1 s. Southbound traffic on Eastway turning left onto Chapman Road had a significant reduction in delay dropping from 1.338 s at 0% penetration to 0.182 s at 100% penetration. The other routes ranged between 11.617 and 18.118 s and had reductions ranging between 4% to 26% at 100% penetration from 0%.
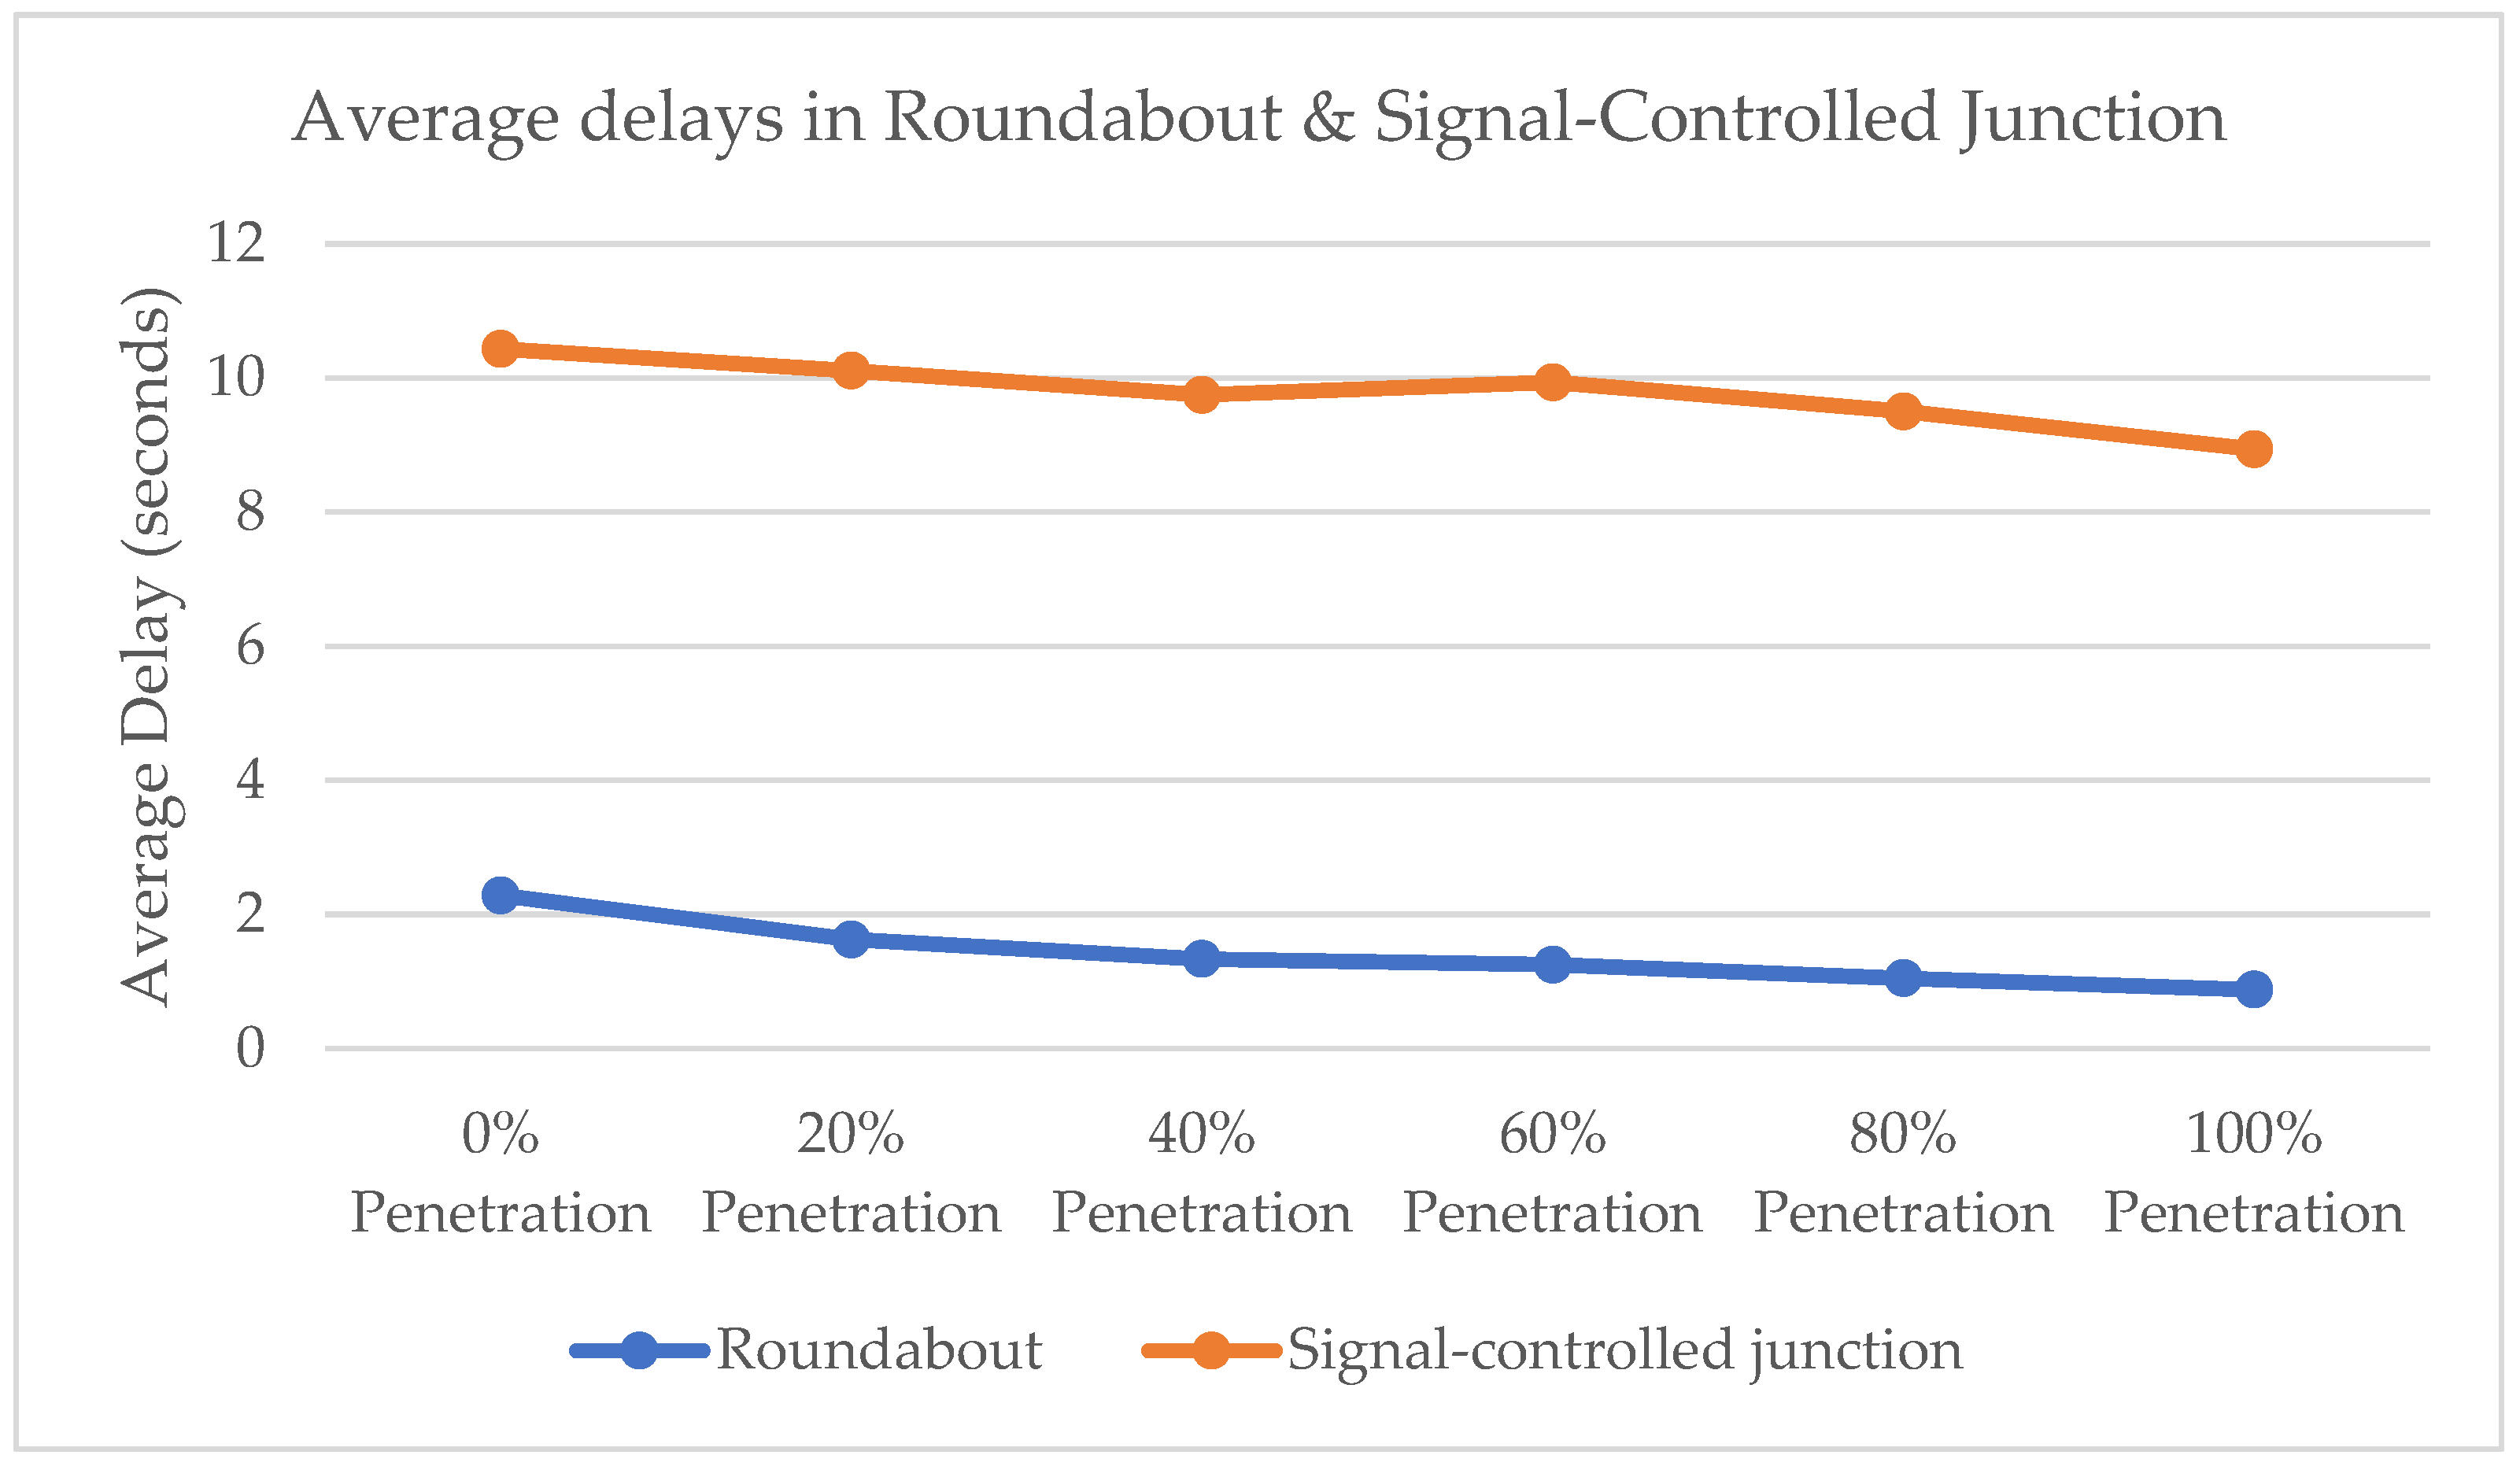
Similar to the comparison of the priority junctions in this case study, the roundabout and signal-controlled junctions both experienced a slow decline in average delay, as depicted in
Figure 18. Furthermore, the change in average delay within the signal-controlled junction was also improved from a category ‘B’ to category ‘A’.
A companion was carried out between 0% ConFAV penetration (all conventional vehicles) and 100% ConFAV penetration (no conventional vehicles in the network) for all movements within each junction, which showed that there is generally a decrease in delay, but as the junction was already performing within a good LOS, this did not lead to a change in the categorisation. Hence, most movements remained within LOS category ‘A’ (as shown in
Table 8).
4.2. Case Study: Site B—Commercial Area: Westfield Stratford City
The average vehicle delay along all 18 routes identified within network was compared among the six ConFAV penetration levels, and the percentage change in the recorded average delay from 0% ConFAV penetration to 100% ConFAVs was calculated for each route and compared. An overall reduction in average delays was seen throughout the network, ranging from 8% to 30% less delays at 100% ConFAV penetration when compared to 0% ConFAVs in the network. It was noted that five routes had a very low number of vehicles on the link (less than or equal to 3) in the simulation, which meant that the sample size was too low to produce conclusive or significant results and was thus excluded from the comparison. The name of each link used for identifying each movement in
Table 8 is shown in
Figure 19.
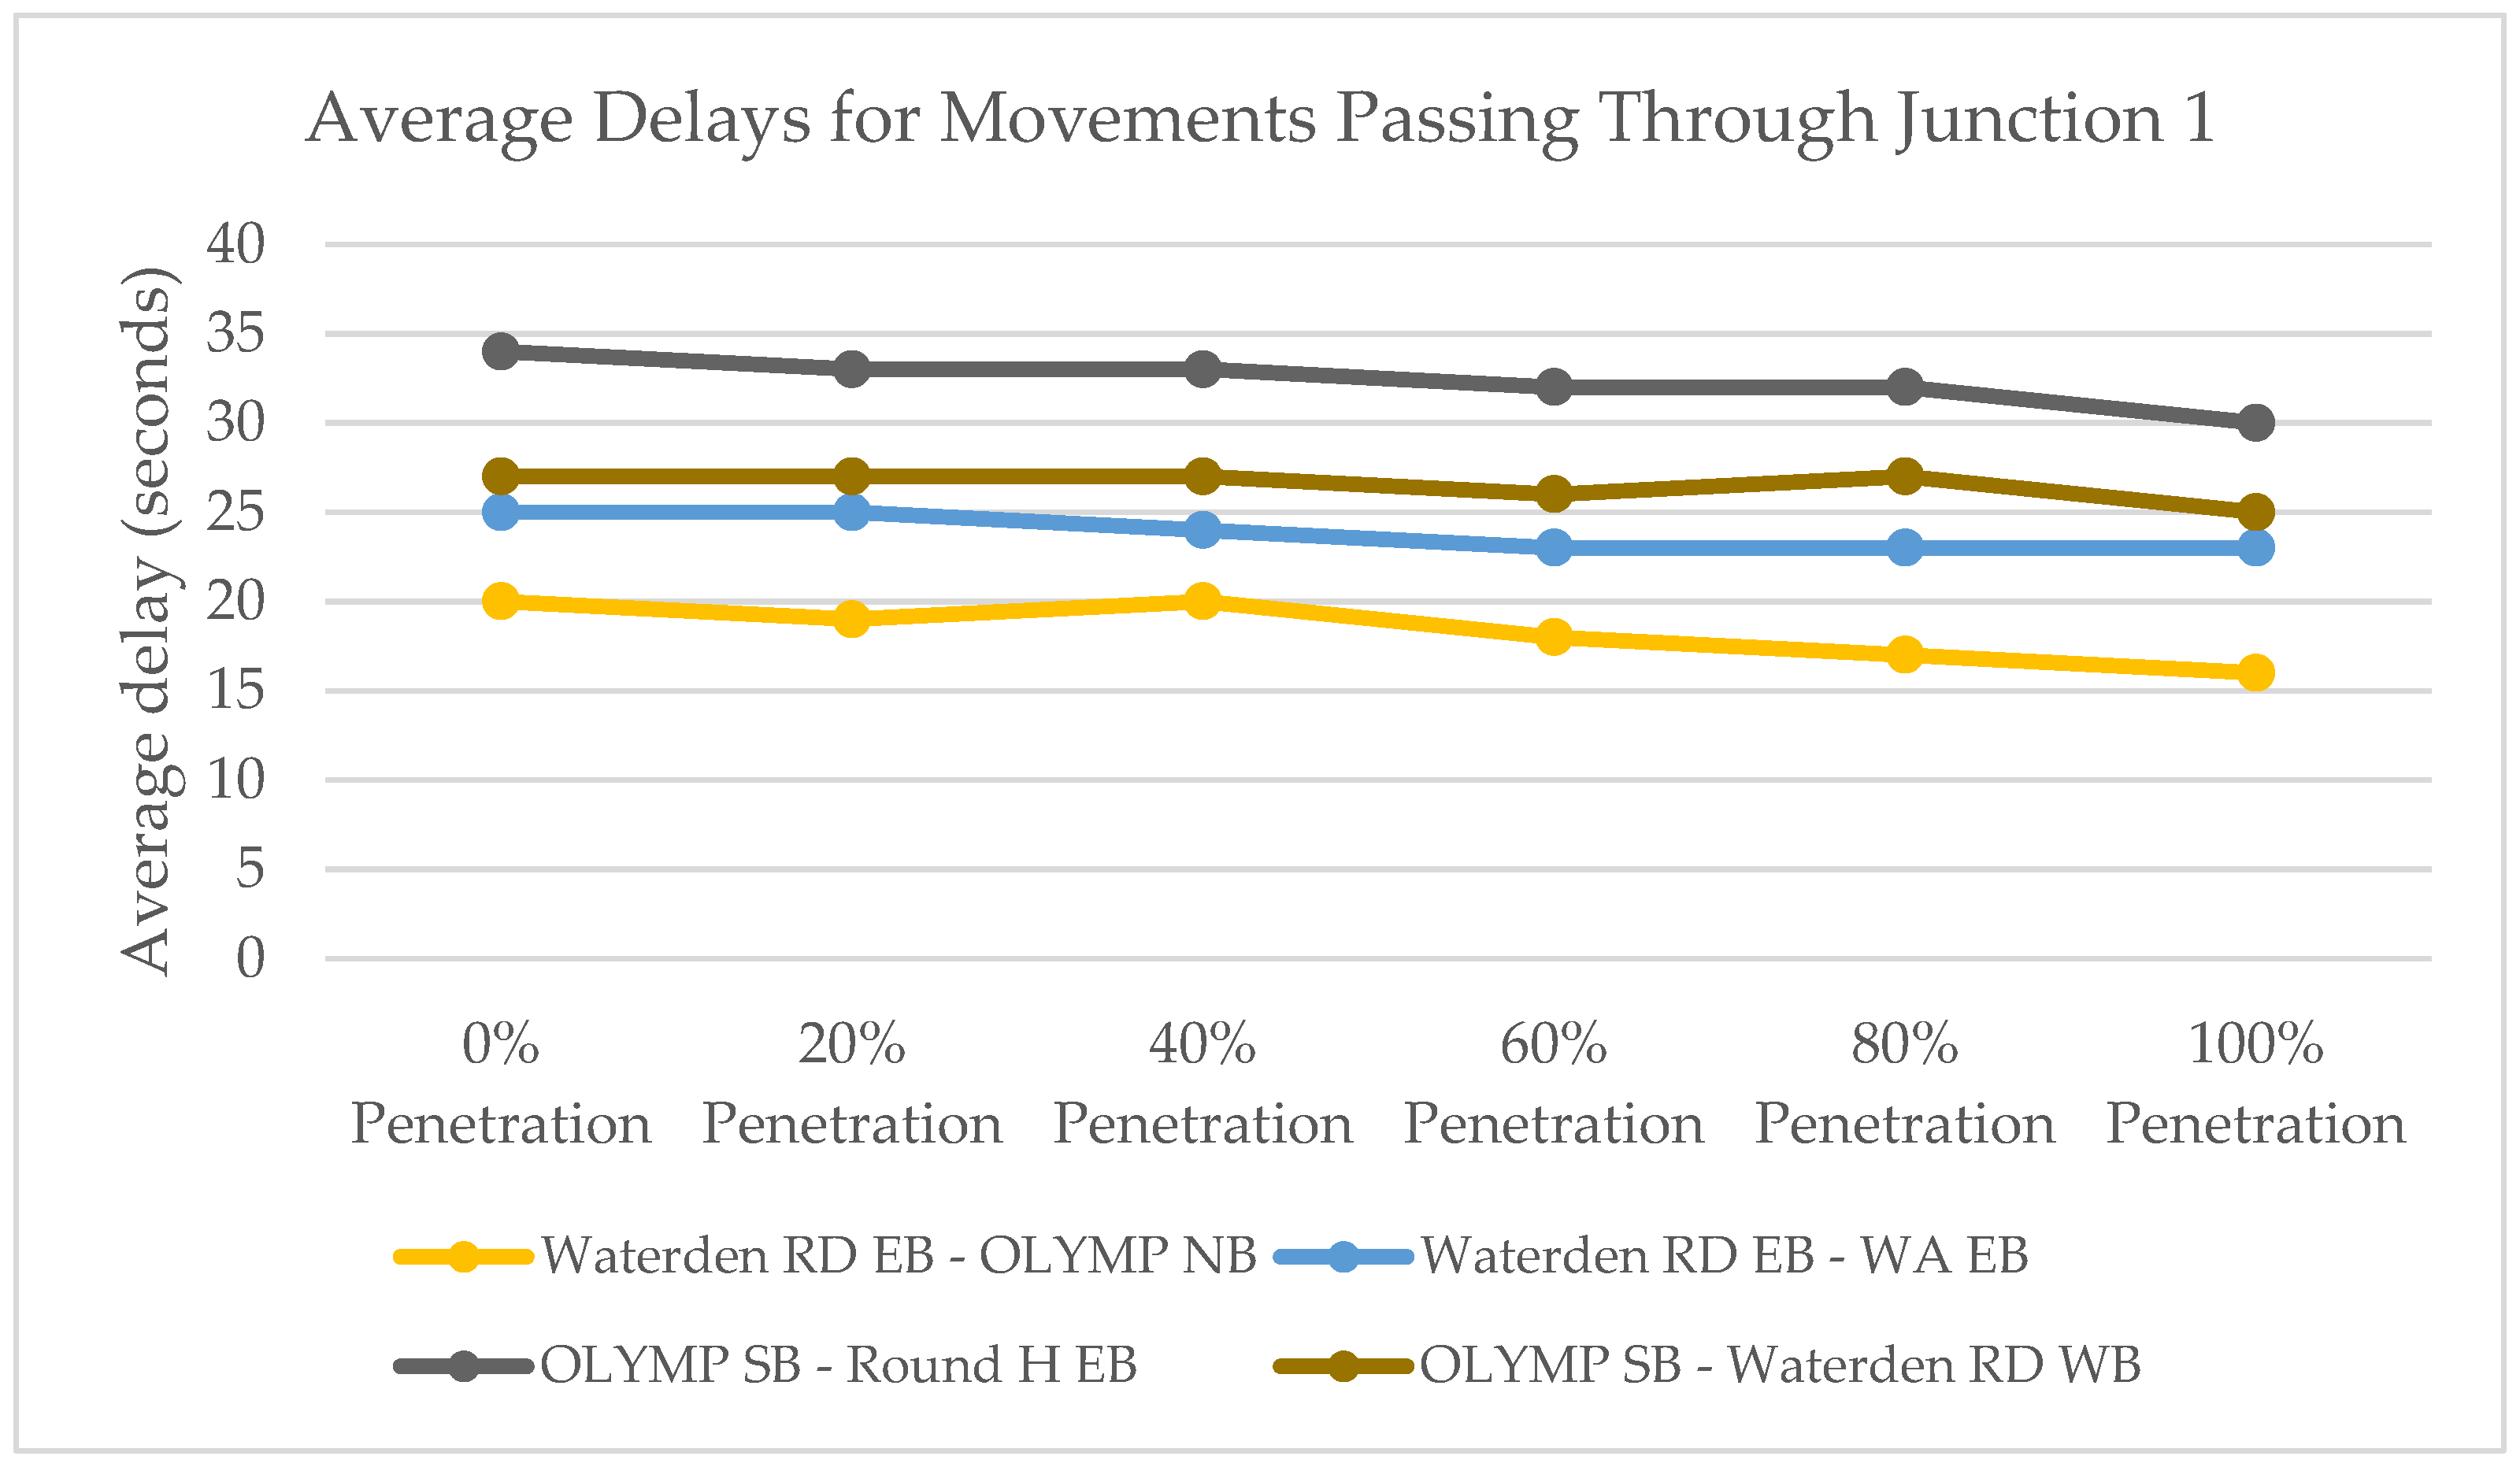
Figure 20 shows the changes in average delays for vehicles along four routes passing through Junction 1 of Site B. Similar to Site A, there is a slow decline in average delays as more ConFAVs are introduced to the network.
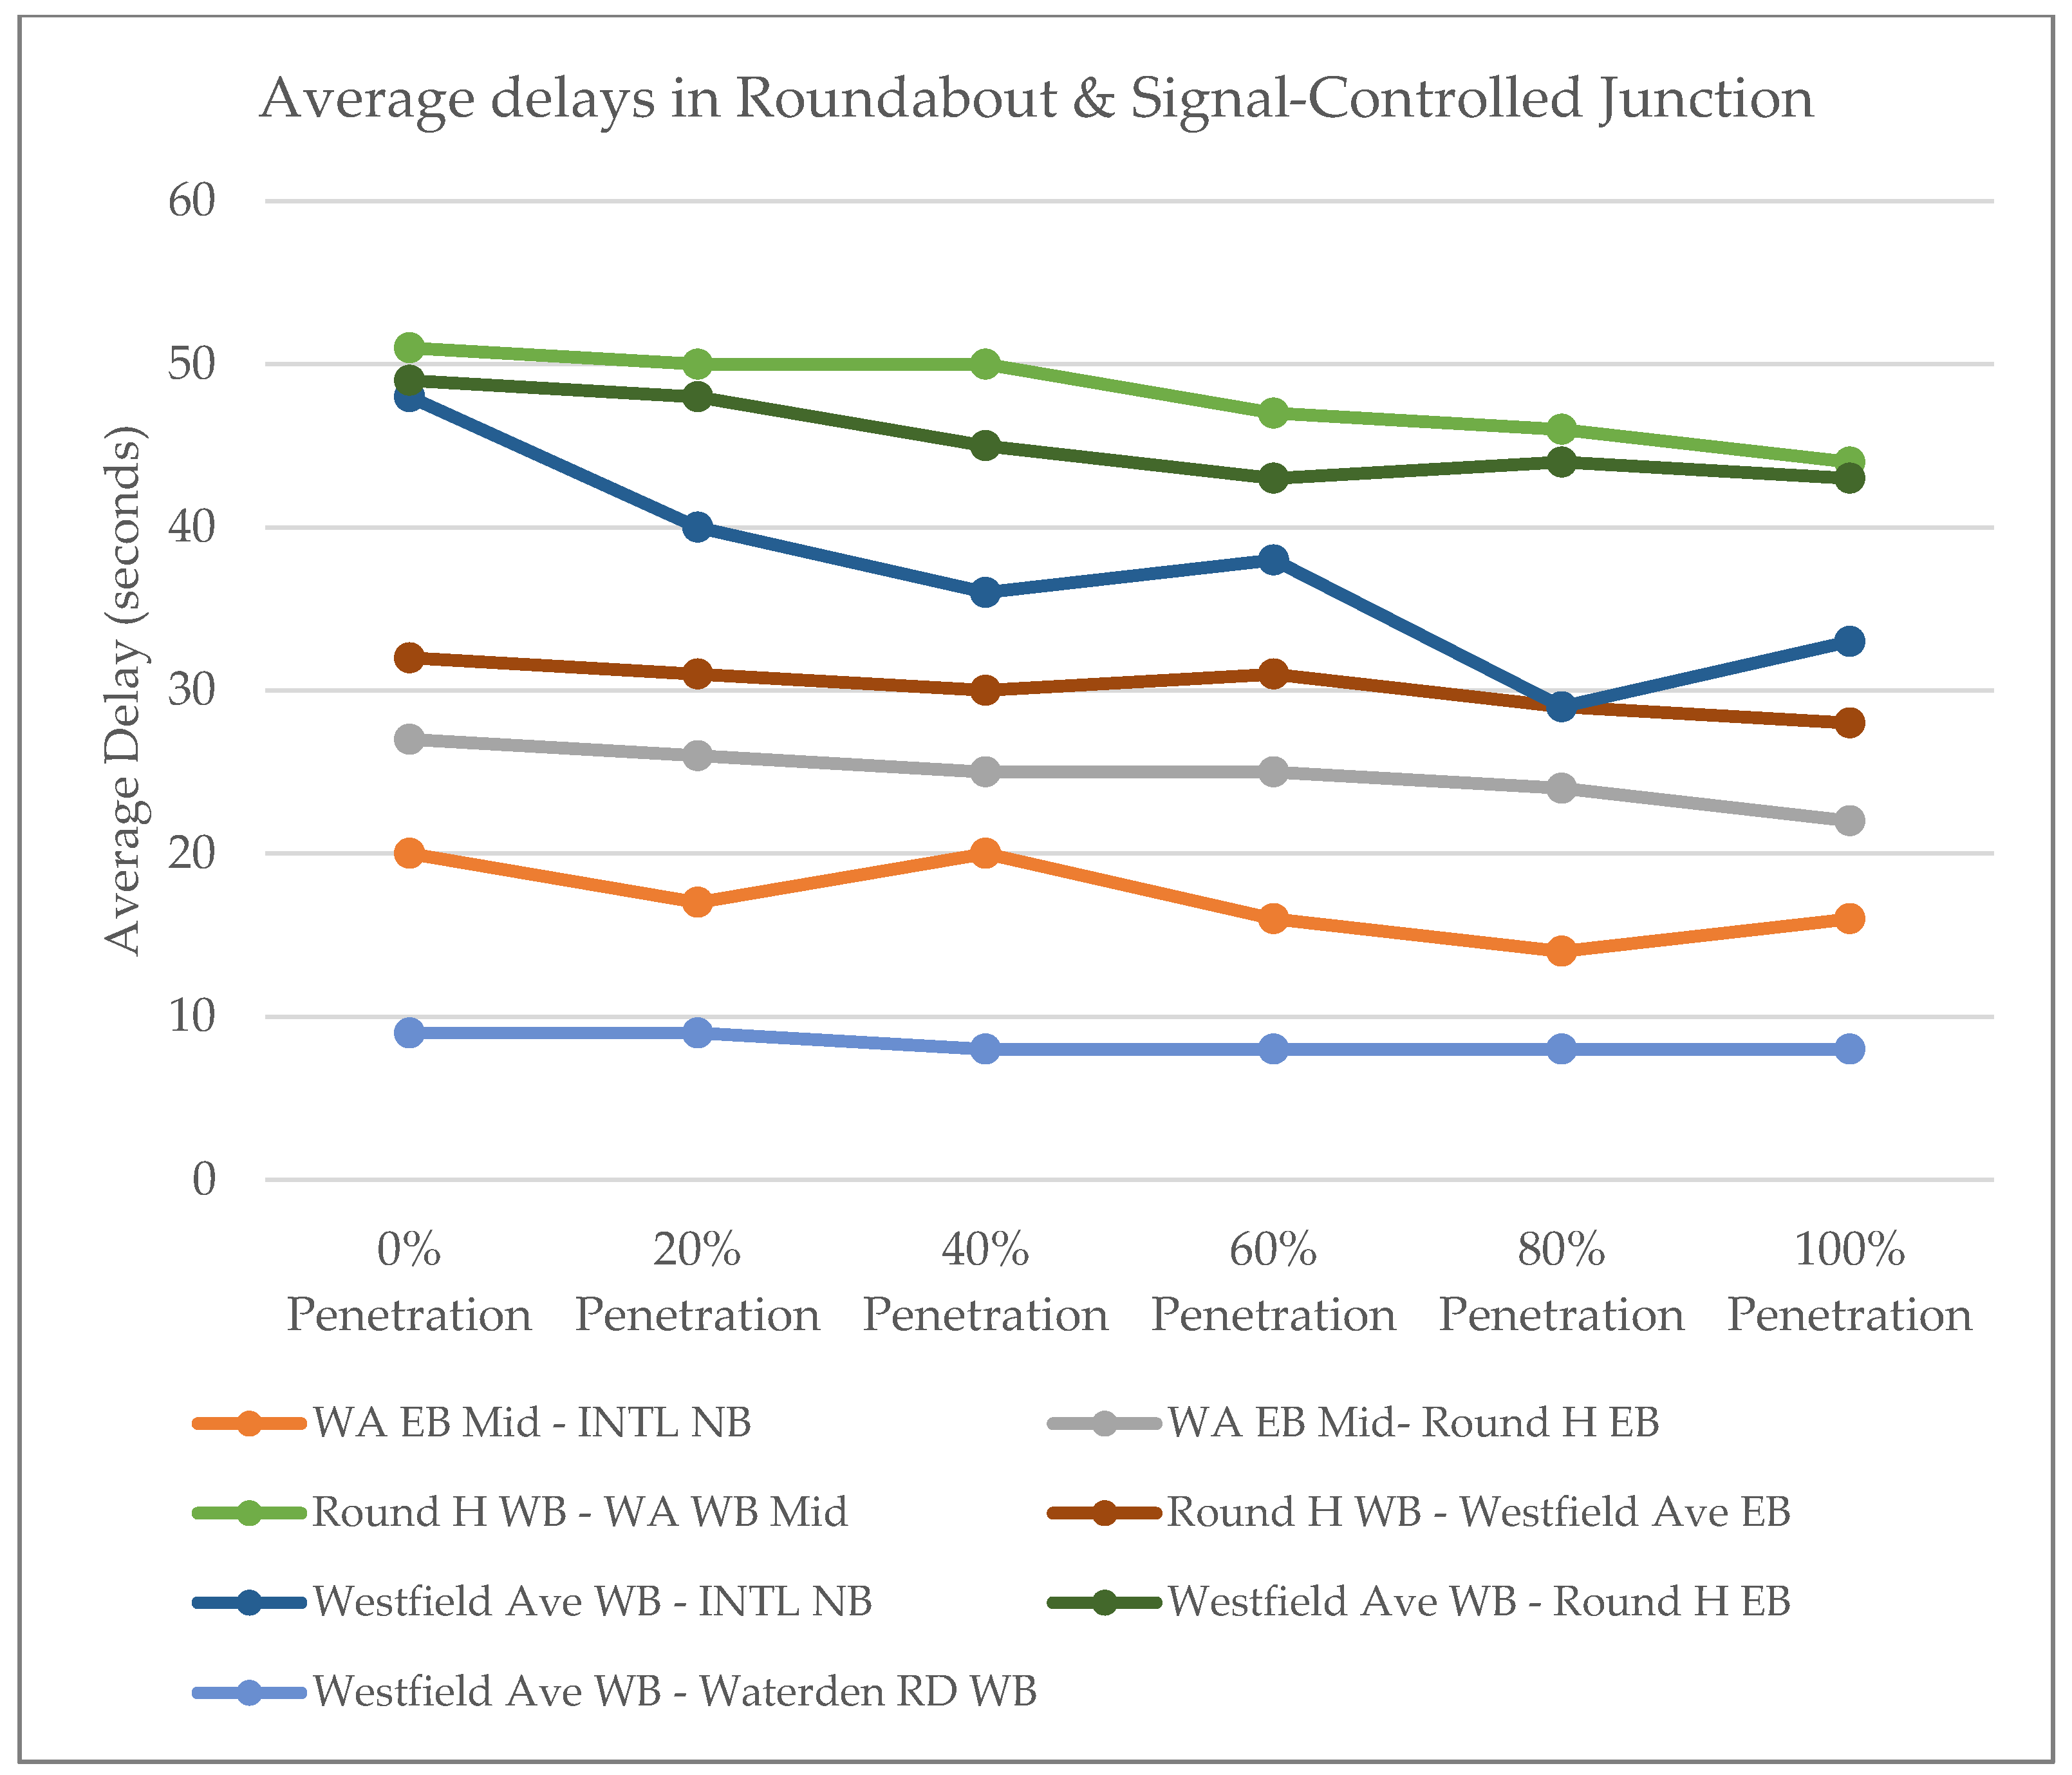
Figure 21 shows the changes for vehicles passing along some routes through Junctions 2 and 3. The resulting change in delays for these routes mirror that of Junction 1, where there is a slow decline in average delays.
A comparison was drawn for all the movements within the network between 0% penetration and 100% penetration, to see if the level of service (LOS) would change if all vehicles within the network were connected and operating autonomously. The comparative study is summarised in
Table 9, showing the percentage change and the resulting LOS categorisations. The comparison shows that there is a reduction in delay of up to 30%. The LOS categorisation and it was found that for most routes the LOS was either maintained or improved (e.g., from E to D and from C to D). These are promising results and alongside the ones reported in Case Study A in the present investigation demonstrate the potential for ConFAVs to reduce congestion and associated greenhouse gas emissions. It should be also noted that the LOS categories currently used were designed for conventional non-autonomous vehicles and these might need to be adjusted in order to capture the full benefits of ConFAVs.
5. Conclusions
Transport is one of the key contributors to greenhouse gas emissions worldwide. This is exacerbated by congestion, particularly in highly populated cities such as London. Currently, there is an increasing trend and investment in driverless vehicles that are connected with each other and also with traffic management systems (such as traffic lights). This provides an opportunity to utilise these emerging technologies to address congestion issues and thus enhance the sustainability of our road transport system. Thus, the present research study was undertaken to examine the potential for ConFAVs in reducing congestion and, consequently, greenhouse gas emissions. A numerical model was developed in order to simulate the driving behaviour of ConFAVs and different levels of penetration of these cars into the road network were considered, ranging from 0% (i.e., conventional vehicles only) to 100% (i.e., all vehicles are fully autonomous). This is vitally important as currently there is limited data on the transitional phase when ConFAVs are introduced into the road network alongside conventional vehicles. Additionally, the model also allowed for the reaction to the type of vehicle in front of the ConFAV (i.e., whether it is also autonomous or human driven). This is usually omitted in current models, and it is vitally important to capture this interaction. The road networks were simulated using PTV VISSIM software and the model.
Two real-life case studies were used to calibrate and validate the model with field data collected from several sites within the Queen Elizabeth Olympic Park in East London. This was aimed at exploring the impact of ConFAVs operating within these two case studies. The latter were chosen based on the classification of users and the transportation needs that they represented. Hackney Wick (Case Study: Site A) was selected because it was predominantly residential and Westfield (Case Study: Site B) because of the commercial district and the international train station next to it. The key findings from each case study are summarised next.
5.1. Case Study: Site A—Hackney Wick
The average delay for all movements within each of the priority junctions in Site A was calculated and compared for each level of ConFAV penetration. It was observed that there was a slow decline in the average delay as the number of ConFAVs increased within the network. The reduction in delay was up to 100%, 99%, and 89% for Priority Junctions 1, 2, and 3, respectively. Each junction maintained an excellent level of service, as the worst average delay recorded was less than 1.4 s, keeping within a level of service (LOS) of category ‘A’. Similar to the comparison of the priority junctions in this case study, the roundabout and signal-controlled junctions both experienced a slow decline in average delay. The reduction in delay was up to 98% and 86% for roundabout and signal-controlled junctions, respectively. The change in average delay within the signal-controlled junction improved the level of service from a category ‘B’ to category ‘A’. In general, the signal-controlled junction provided the highest reduction in delay (and thus congestion and corresponding greenhouse gas emissions) and this is likely due to the ConFAVs in the present model being connected to the signal system and being able to anticipate signal changes in advance. This demonstrates the potential for connected ConFAVs to reduce congestion and its environmental impact.
5.2. Case Study: Site B—Westfield
It was observed that there was an overall reduction in delays within the isolated network. Thirteen out of 18 routes were analysed (the remaining five routes within the network had extremely low levels of vehicles and so could not provide statistically conclusive results), and it was found that all routes experienced a reduction in delay up to 30% at 100% ConFAV penetration (i.e., when the road network was used by autonomous vehicles only) when compared to 0% ConFAVs (i.e., when all vehicles were human driven). Furthermore, two movements out of the 13 routes examined had improvements in their LOS category with one changing from category “D” to category “C”, and the other from Category “E” to Category “D” at 80% and 40% ConFAV penetration level, respectively.
5.3. Overall Conclusion
The case studies considered in the present study led to a conclusion that increased numbers of ConFAVs driving in platoons within the network reduce delays and as a result either maintained the LOS of the chosen route or made it better. The lead vehicle in the platoon was able to anticipate changes in signals and communicate this with the trailing vehicles, allowing them to perform better at signalised junctions. Platoons also increased network capacity on congested links, allowing better performance in the average delays, as observed in Case Study B.
Results showed that it was possible to achieve a reduction in the average delay of a vehicle of up to 100% through the introduction of large volumes of ConFAVs, which translates to a significant reduction in greenhouse gas emissions. This coupled with the fact that ConFAVs are predominantly electric and the overall increasing trend towards electric vehicles points to a more sustainable road transport system.
5.4. Future Work
It would be beneficial if further research is conducted to ascertain if similar results could be achieved through the provision of real-time traffic signal status in all human driven vehicles, allowing the driver to adjust their speeds accordingly. This would reduce the number of start–stop instances in the drive cycle, which could cut back on the vehicle’s generated emissions. To fully realise this potential solution, future research will be required to look at larger networks with more degraded levels of service. The parameters for LOS categorisation used may also need rethinking as a delay of 1 s may have a different impact on platoons of ConFAVs than it would on conventional vehicles traversing the junction.
However, while the potential success of the ConFAV in reducing congestion is apparent, the number of ConFAVs on the road is highly dependent on customer acceptance and willingness to buy these vehicles. Continuous research into the common concerns of future customers will be key in the implementation of widespread ConFAV uptake.


