
Quantifying Fenestration Effect on Thermal Comfort in Naturally Ventilated Classrooms

Abstract
:1. Introduction
1.1. Challenge of GCC Countries’ Climate and Dependency on Passive Ventilation
1.2. Thermal Comfort Perception of GCC’s Learners
1.3. Influencing Factors on Thermal Comfort
1.4. Objectives
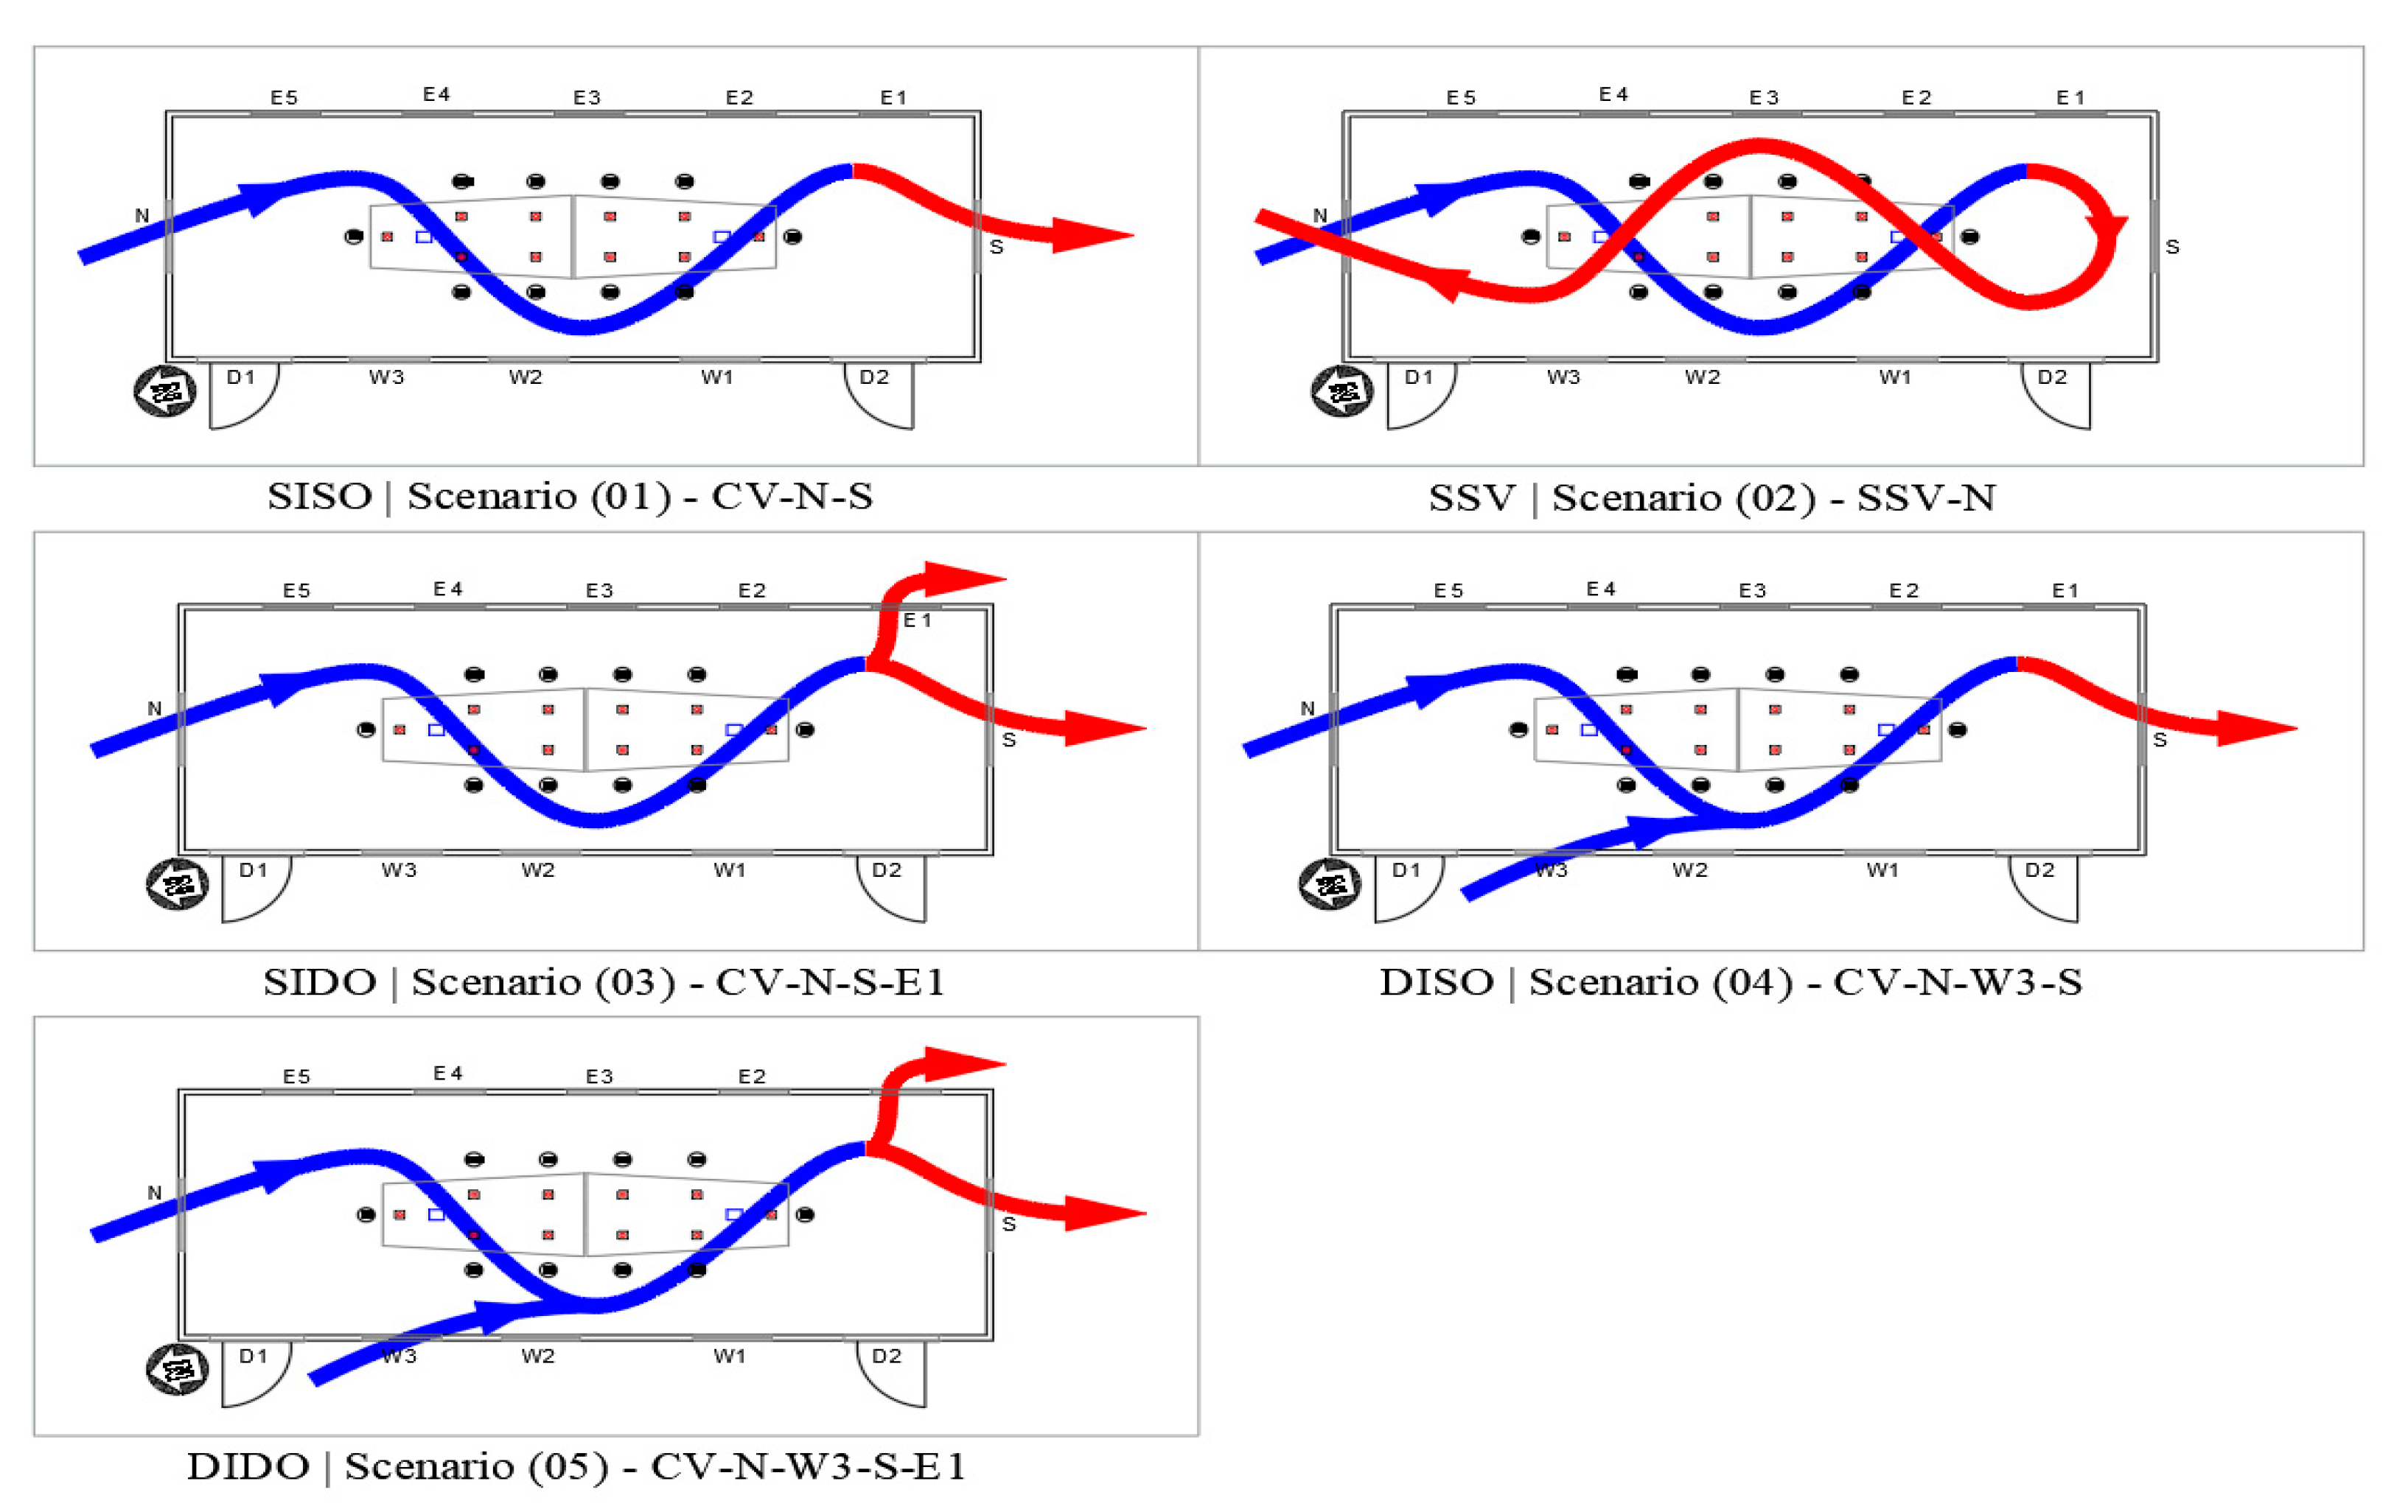
- To quantify the effect of openings (fenestration) on the windward and leeward sides to evaluate their effects on thermal comfort by carrying out a comparison between five ventilation scenarios represented in single inlet single outlet (SISO), single inlet double outlet (SIDO), double inlet single outlet (DISO), double inlet double outlet (DIDO) and single-side ventilation (SSV).
- To study the effect of occupancy load on thermal comfort.
- To compare between cross ventilation (CV) and single-side ventilation (SSV).
2. Materials and Methods
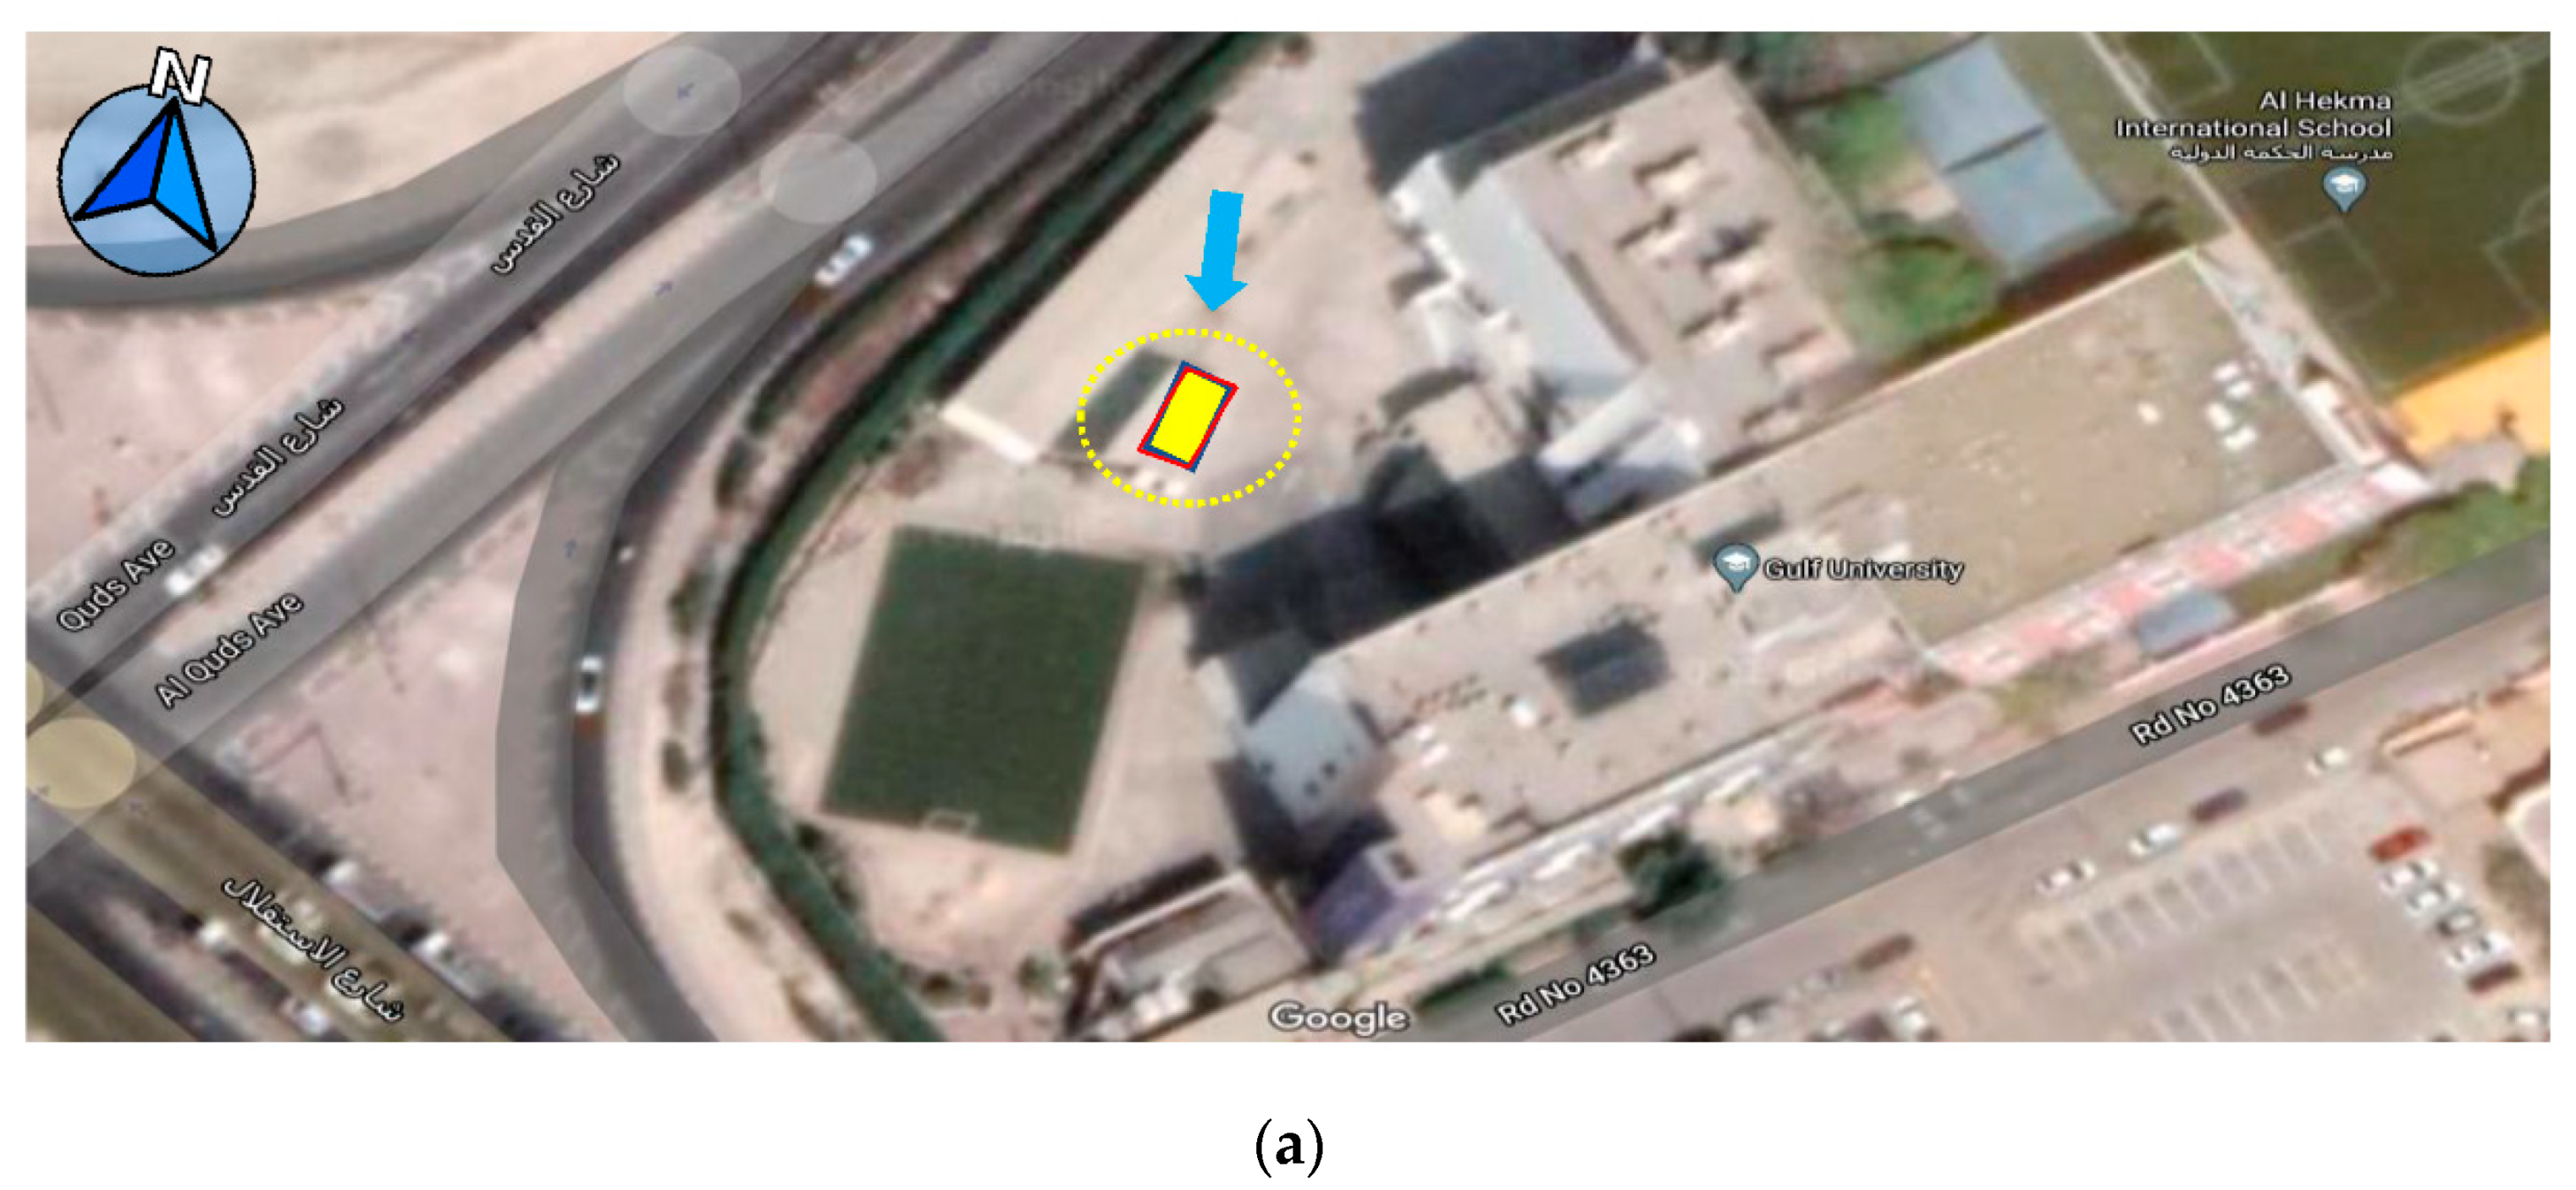
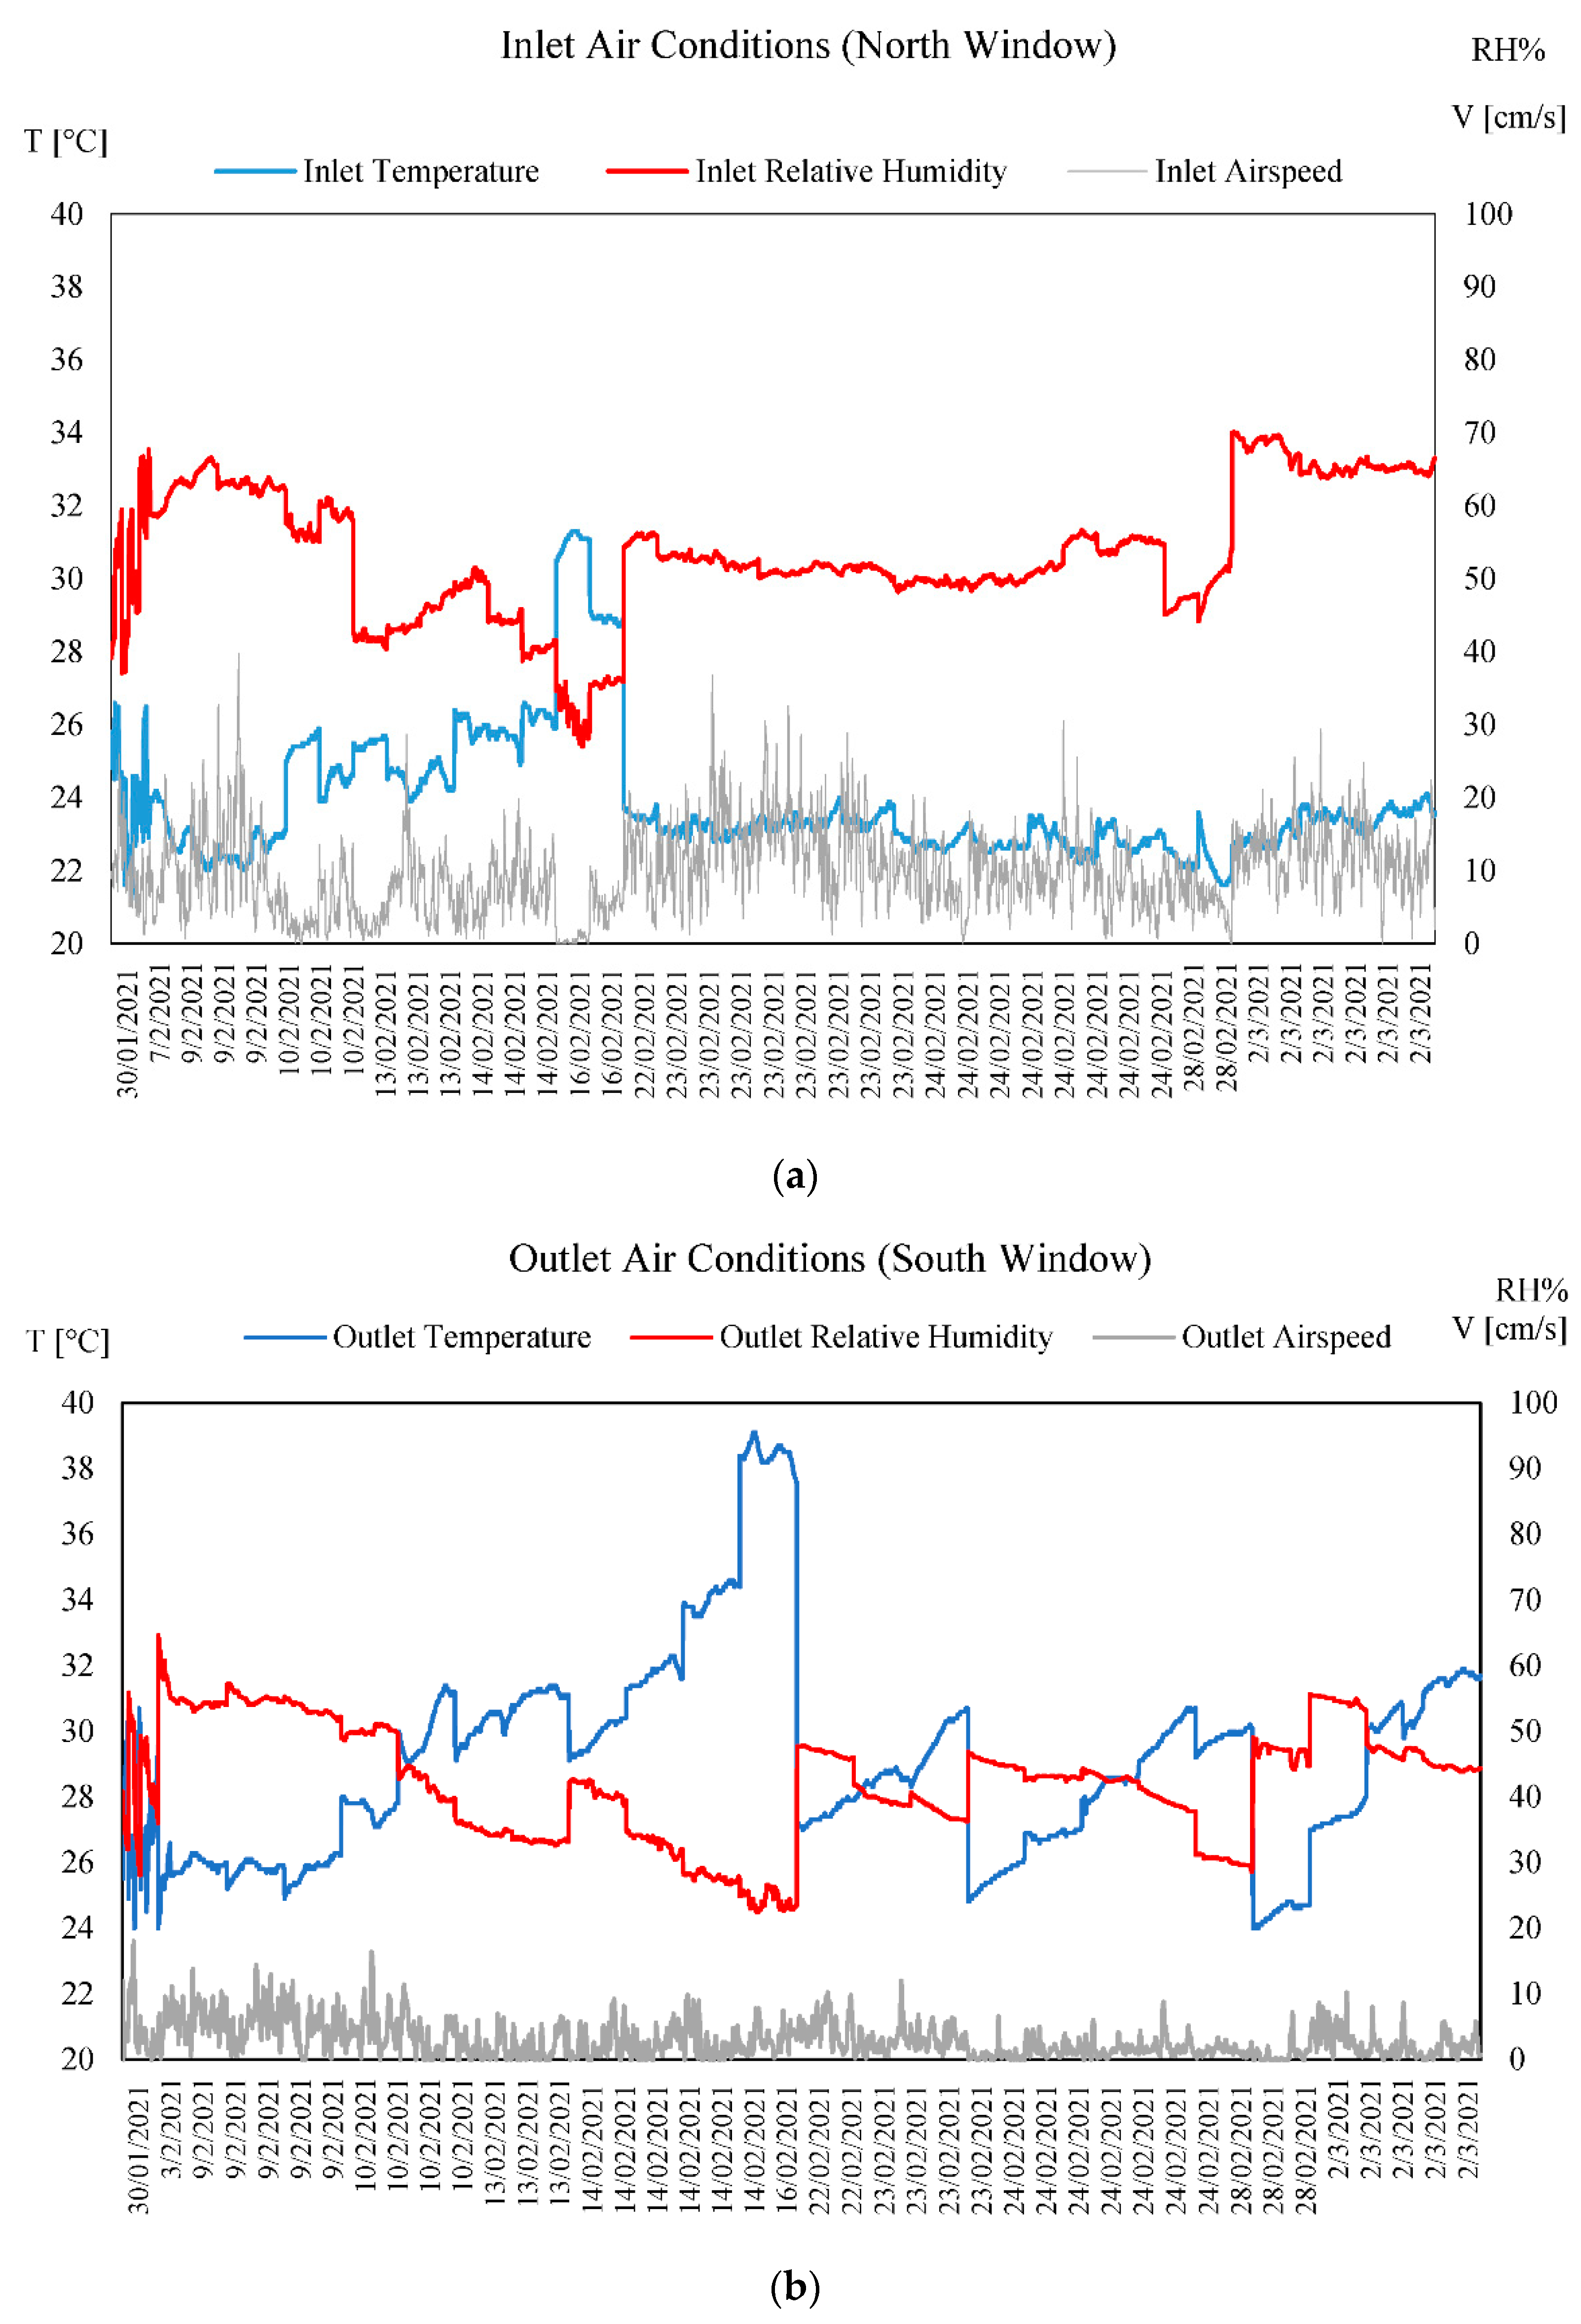
2.1. Monitoring the Air Conditions at Inlet(s) and Outlet(s)
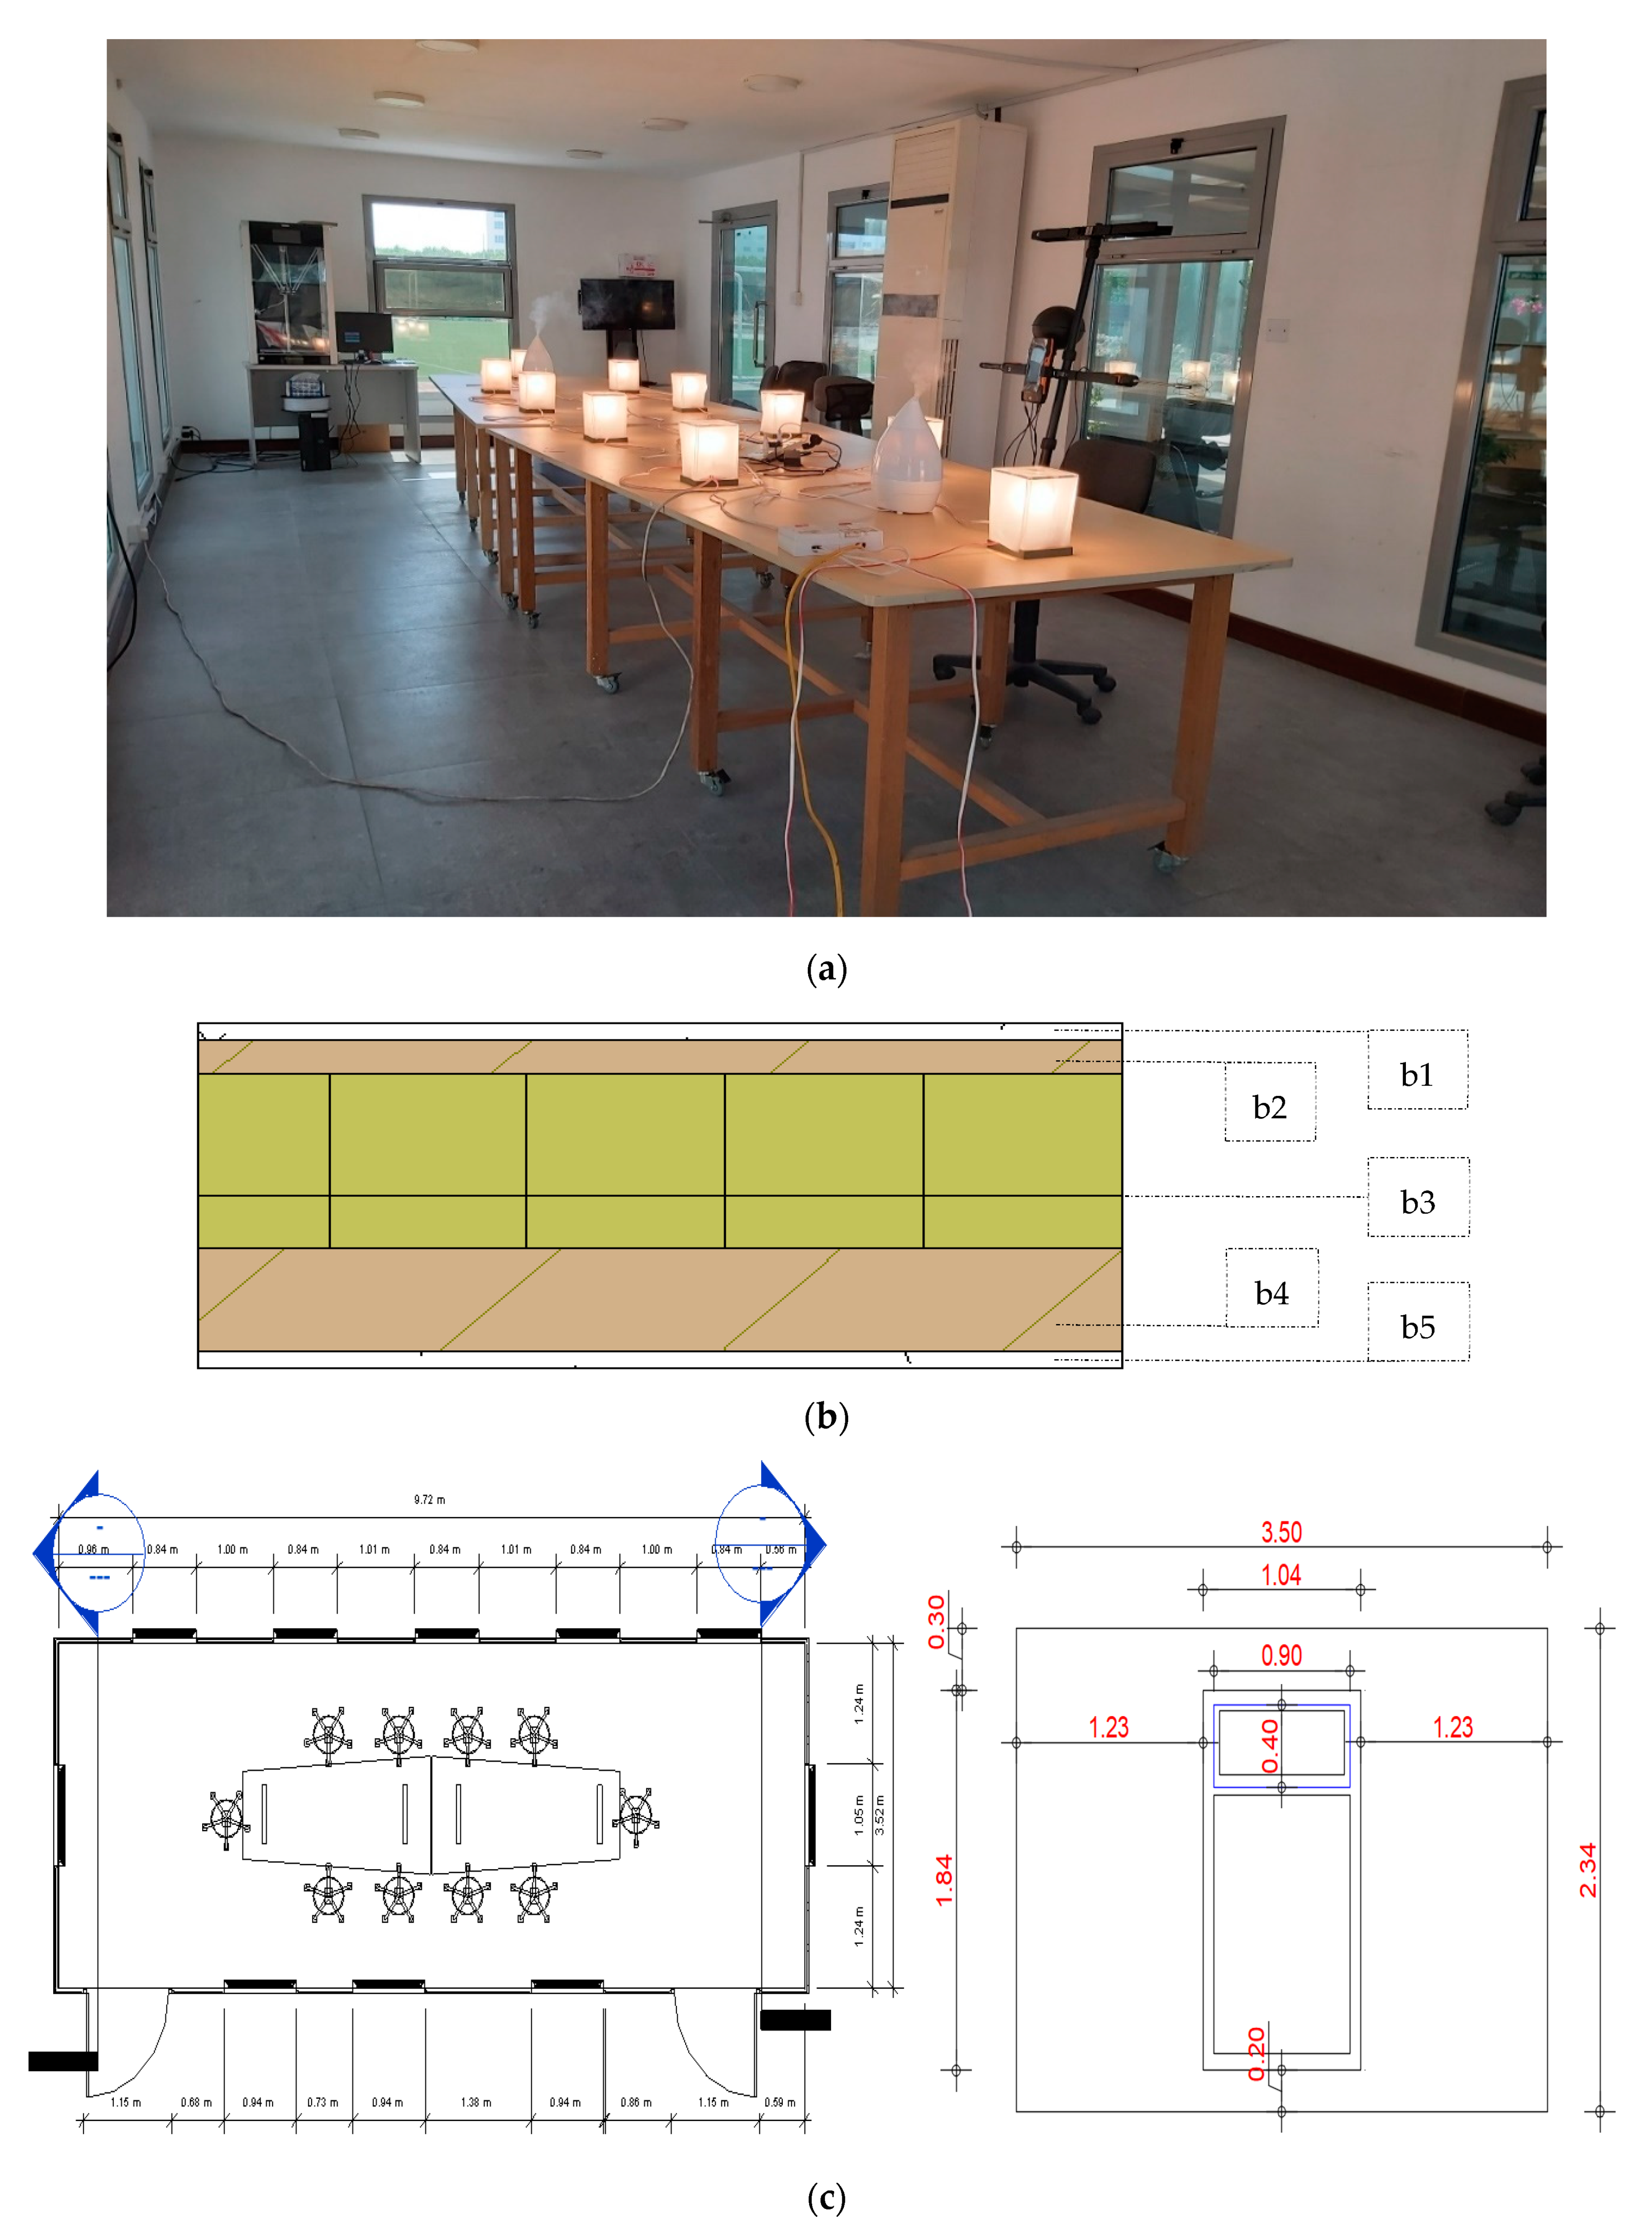
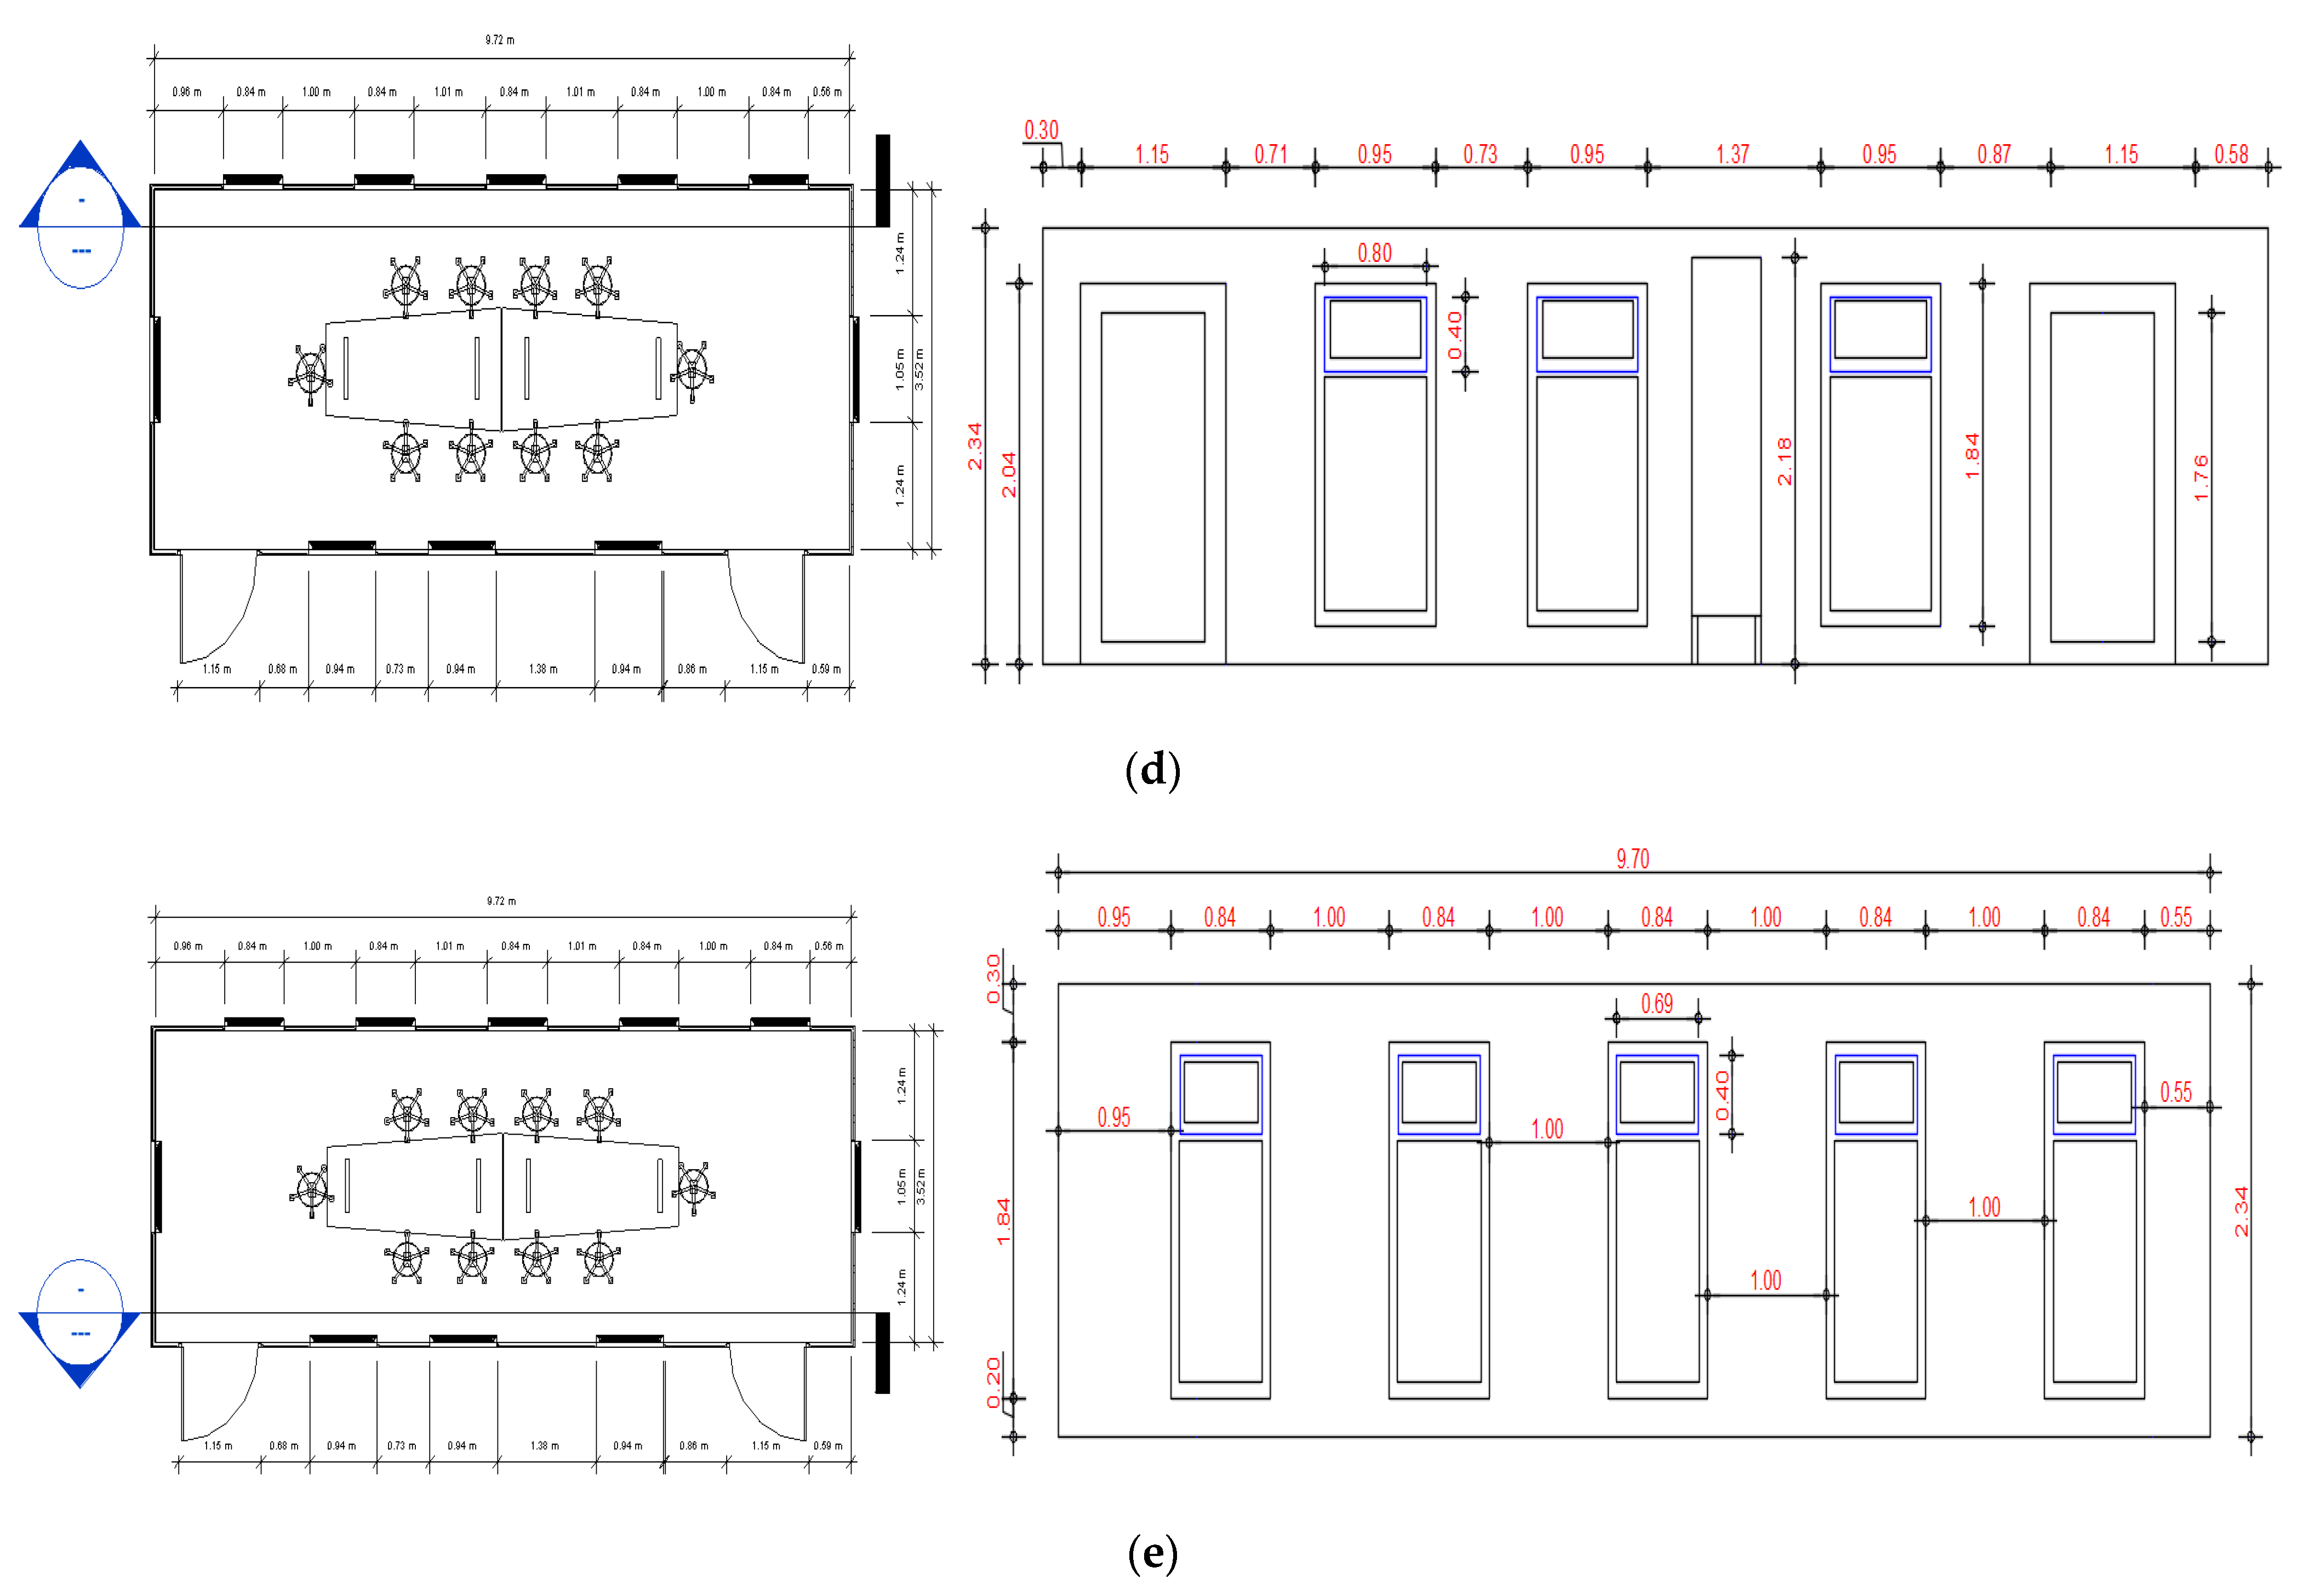
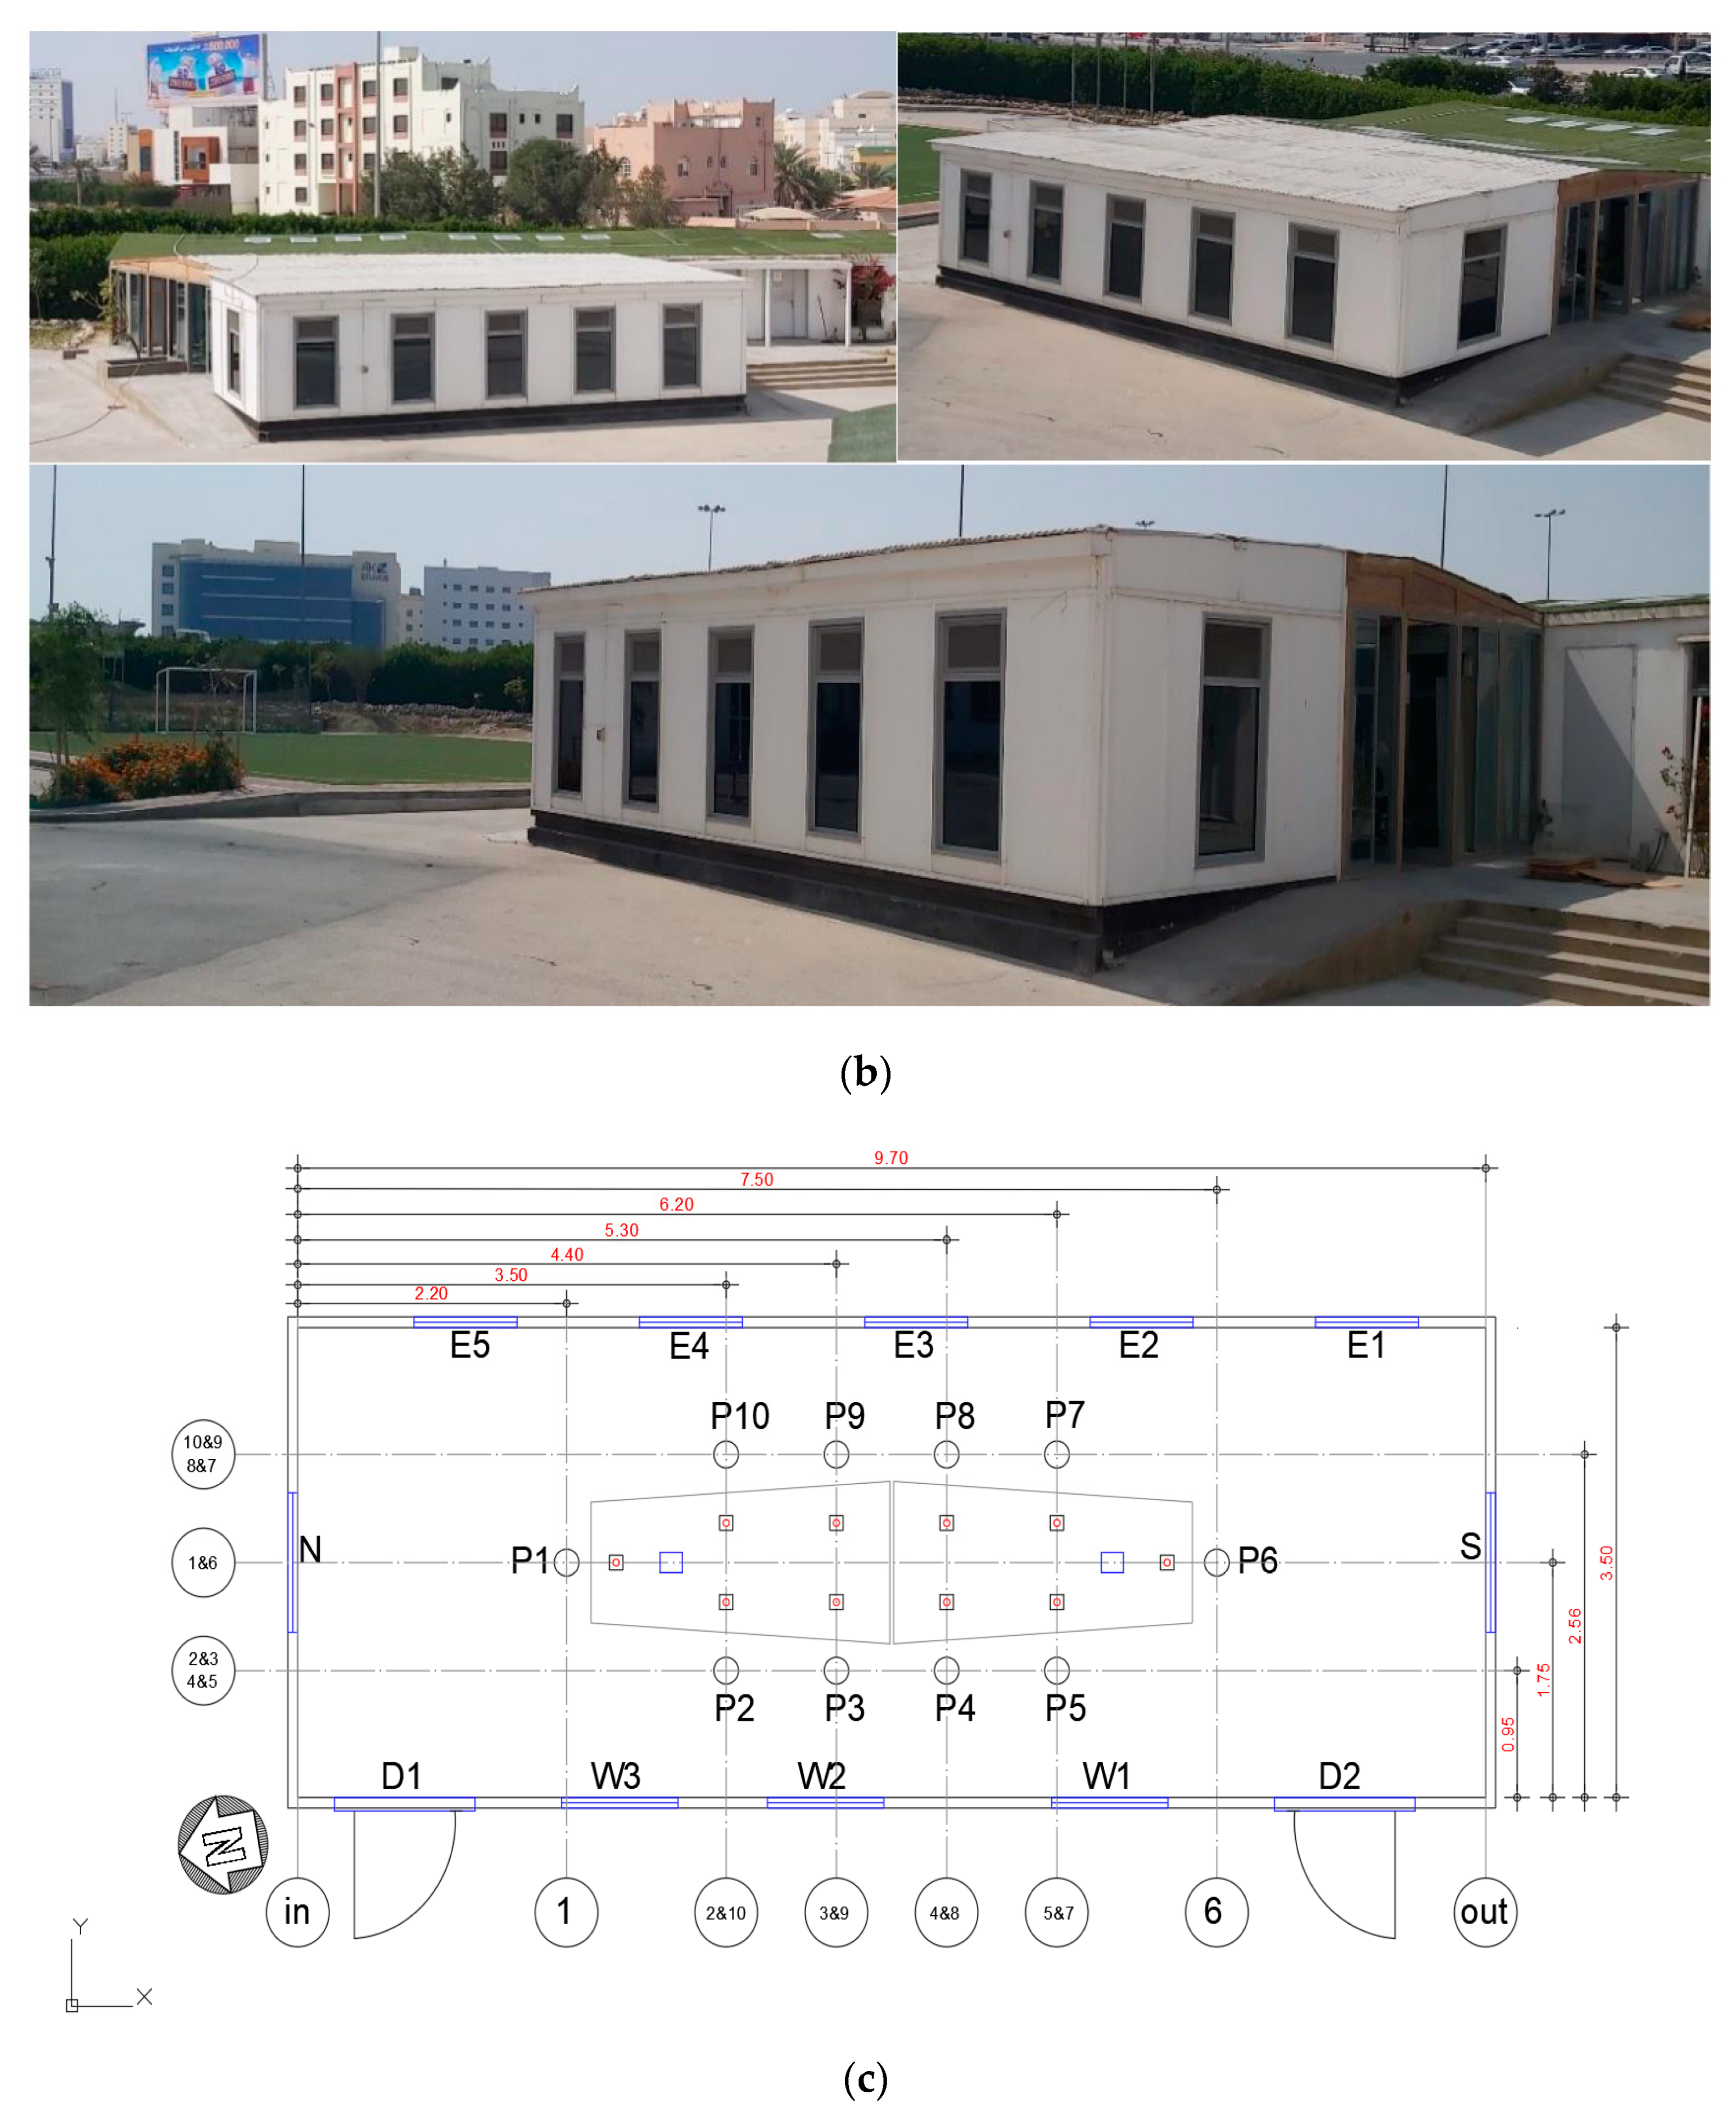
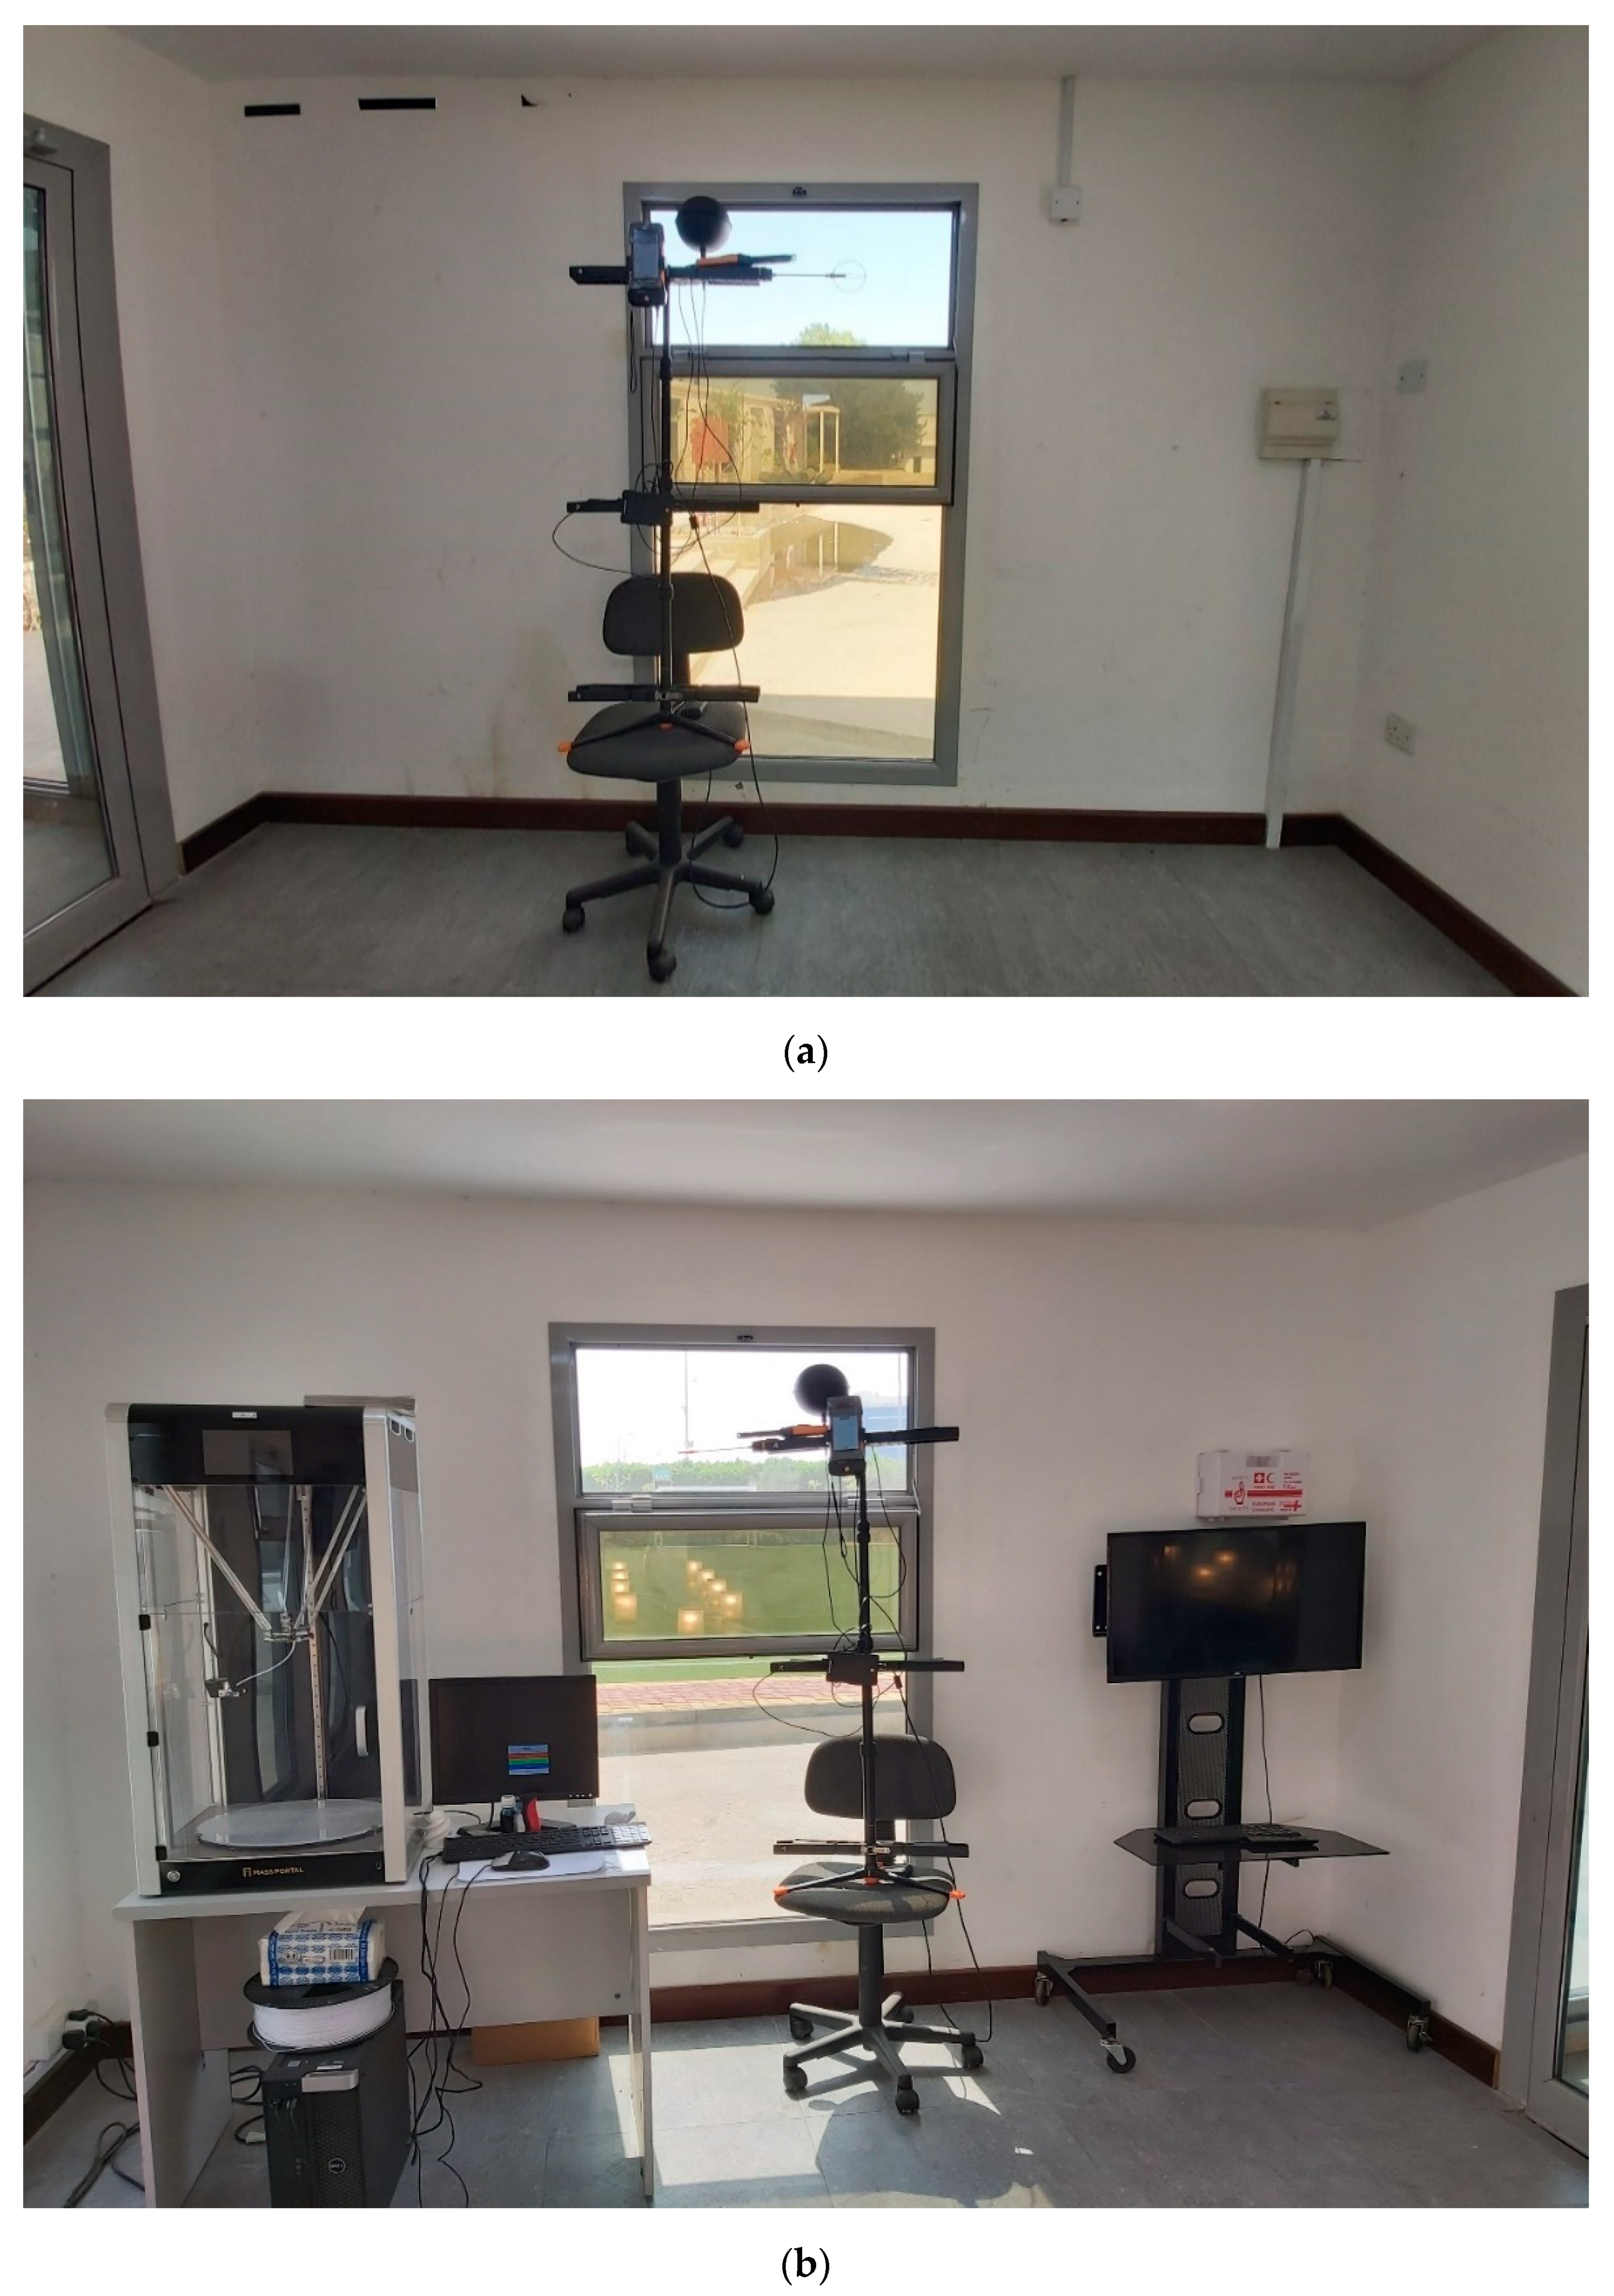
2.2. Classroom Setup
2.3. Recording Measurements
2.4. Five Ventilation Scenarios
2.4.1. Experiments’ Repeatability
2.4.2. Climate Applicability
2.4.3. Inlets and Outlets Effect
2.4.4. Occupancy Effect
2.4.5. Cross Ventilation versus Singe-Side Ventilation
3. Results and Discussion
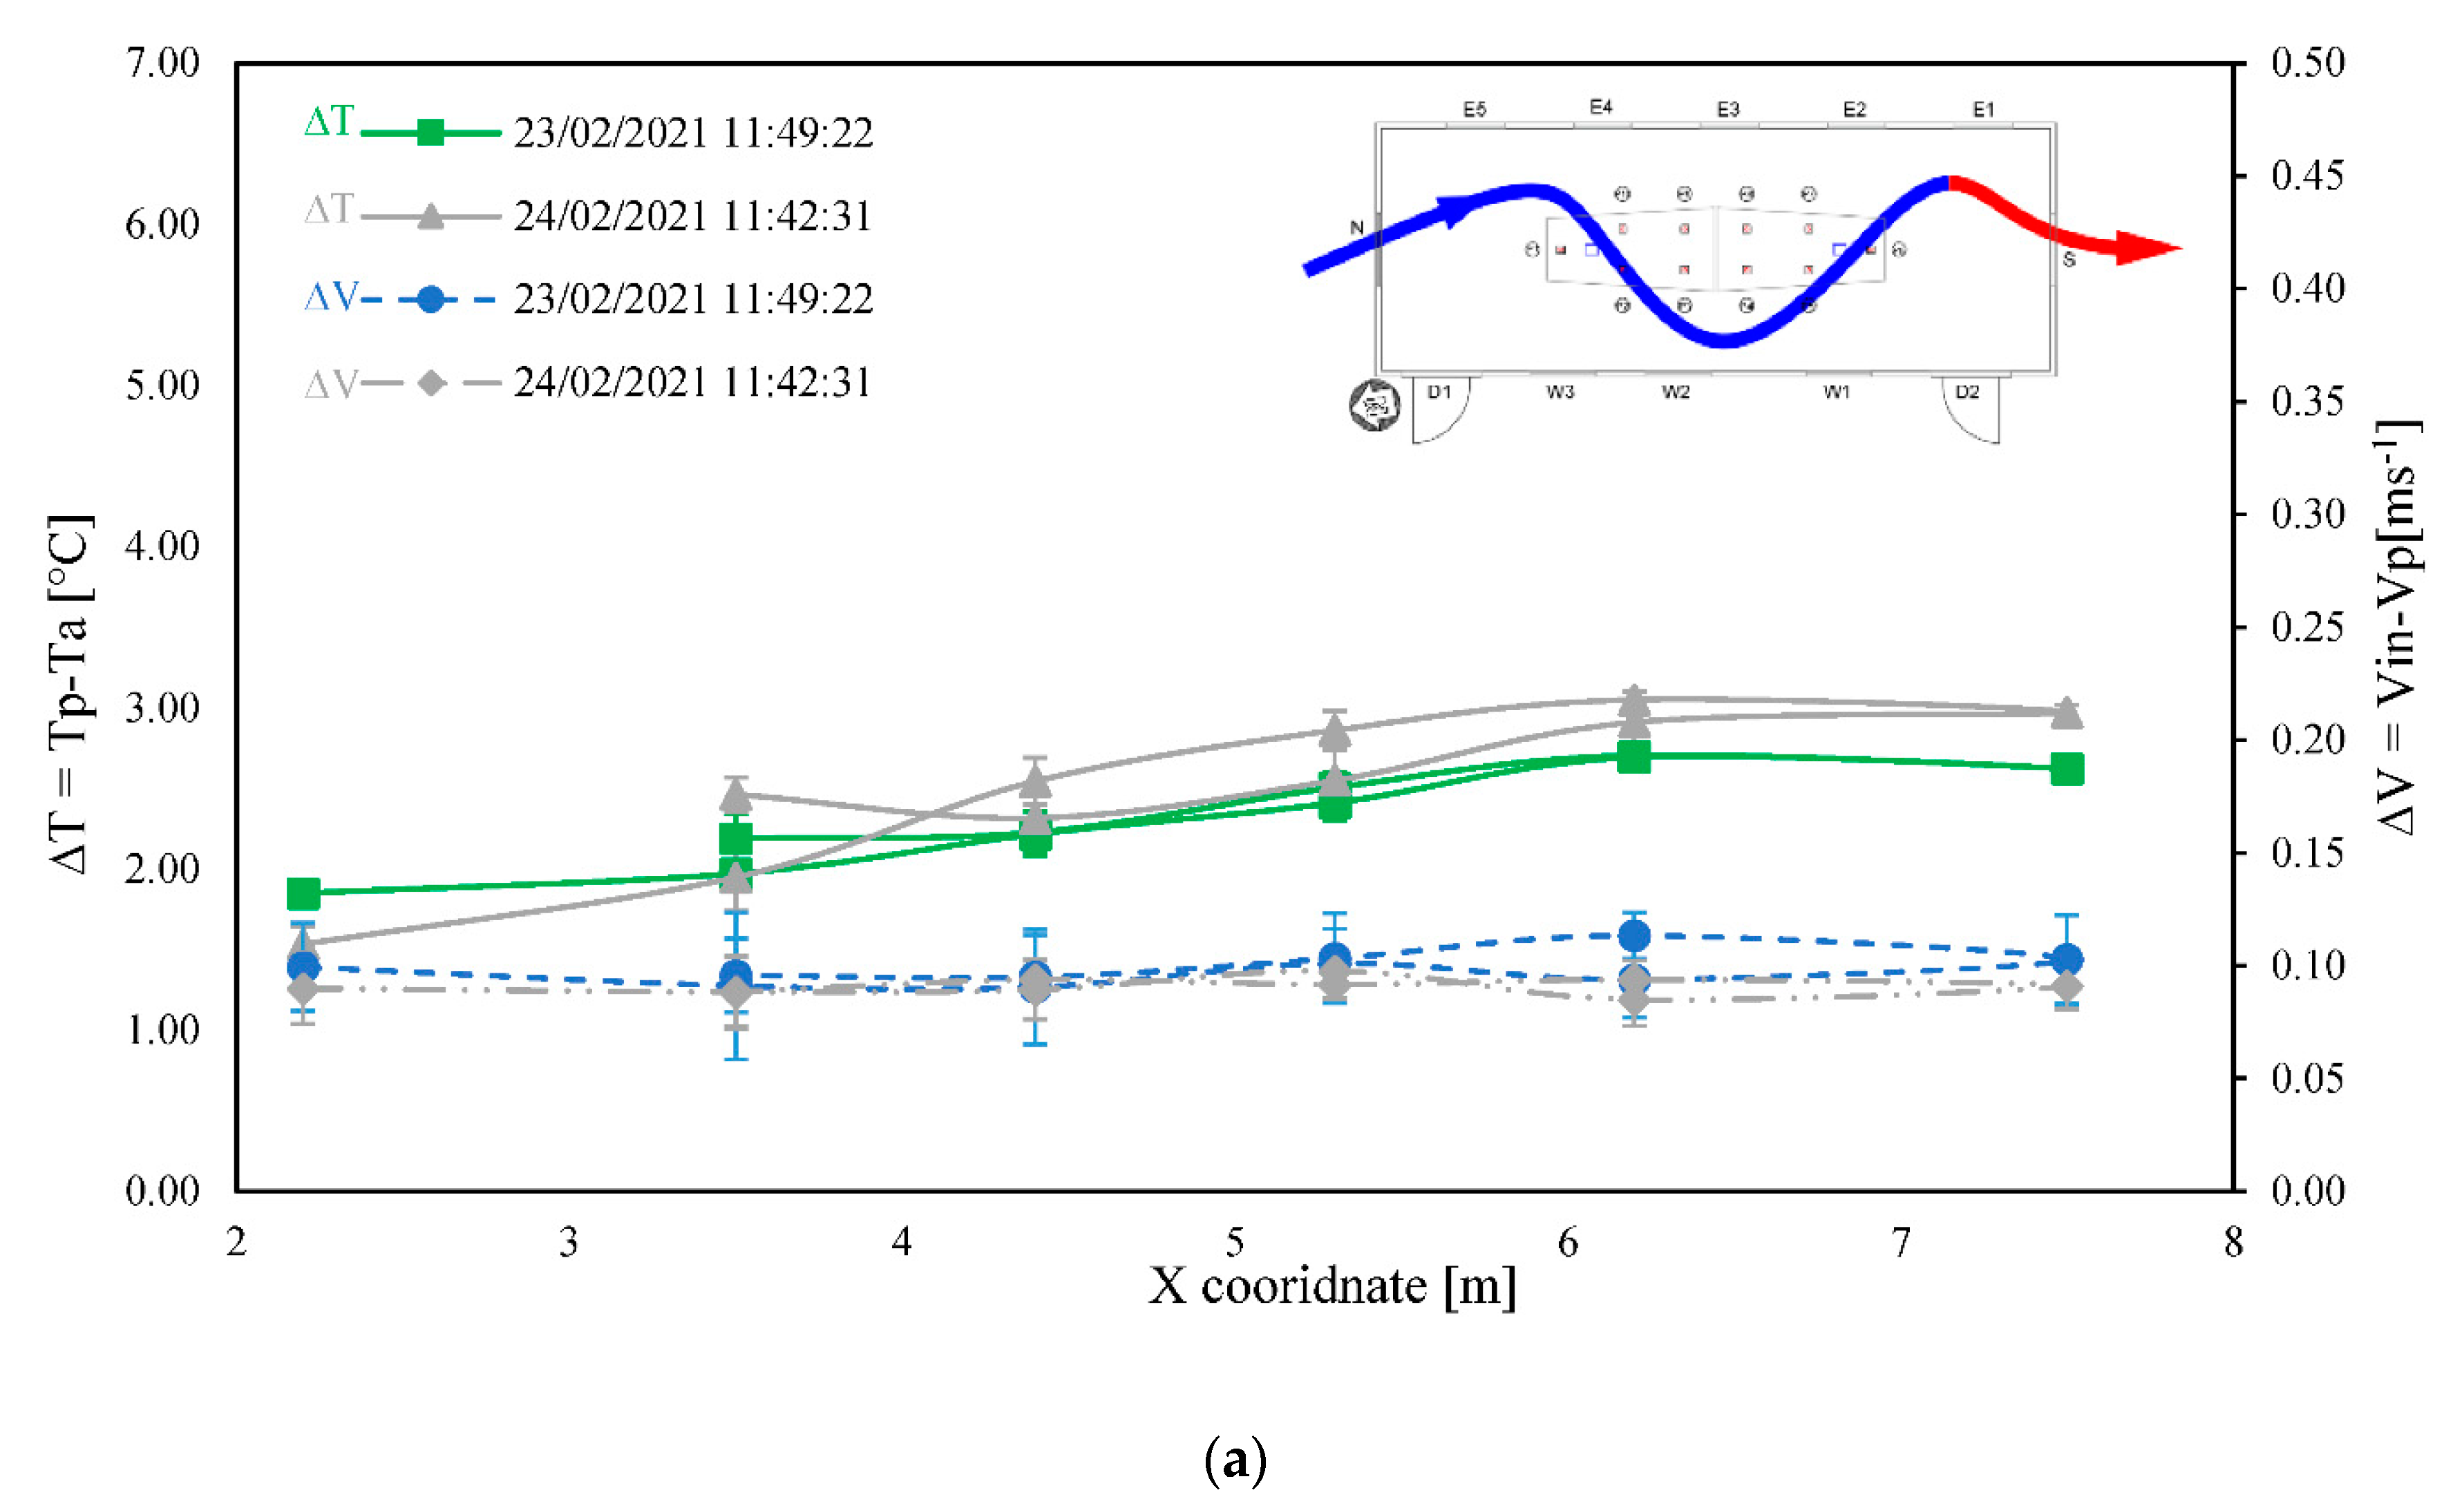
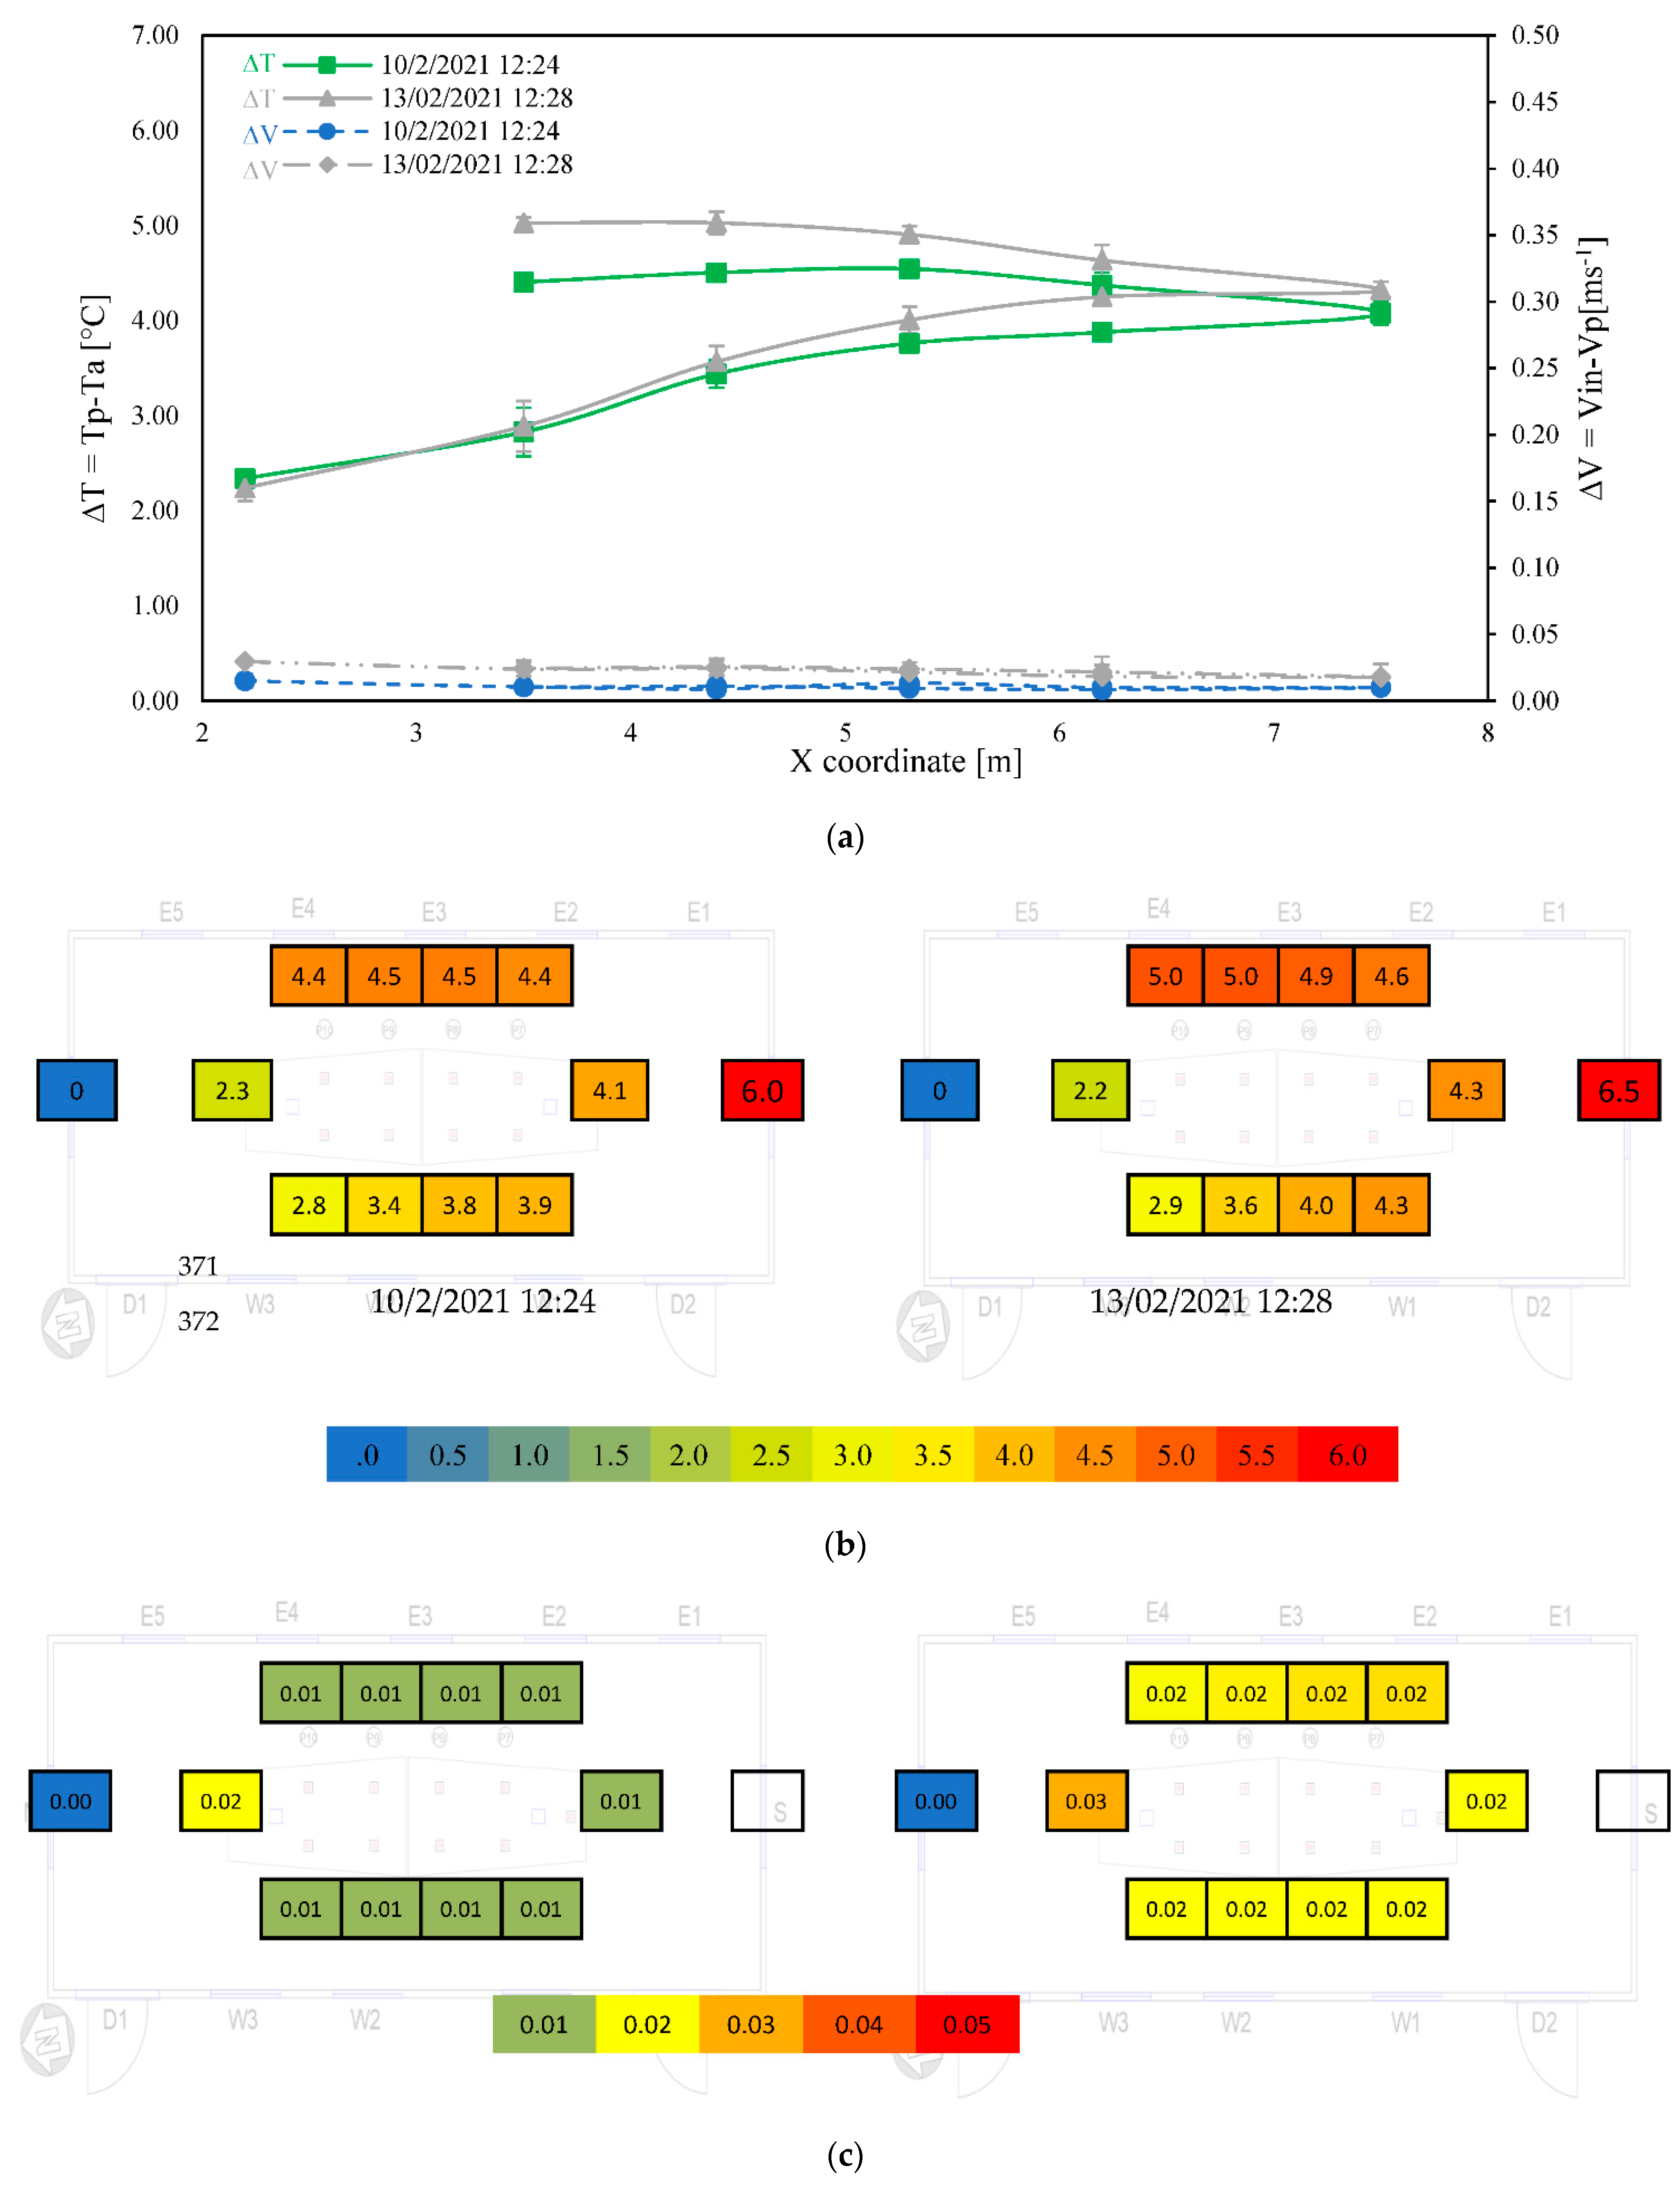
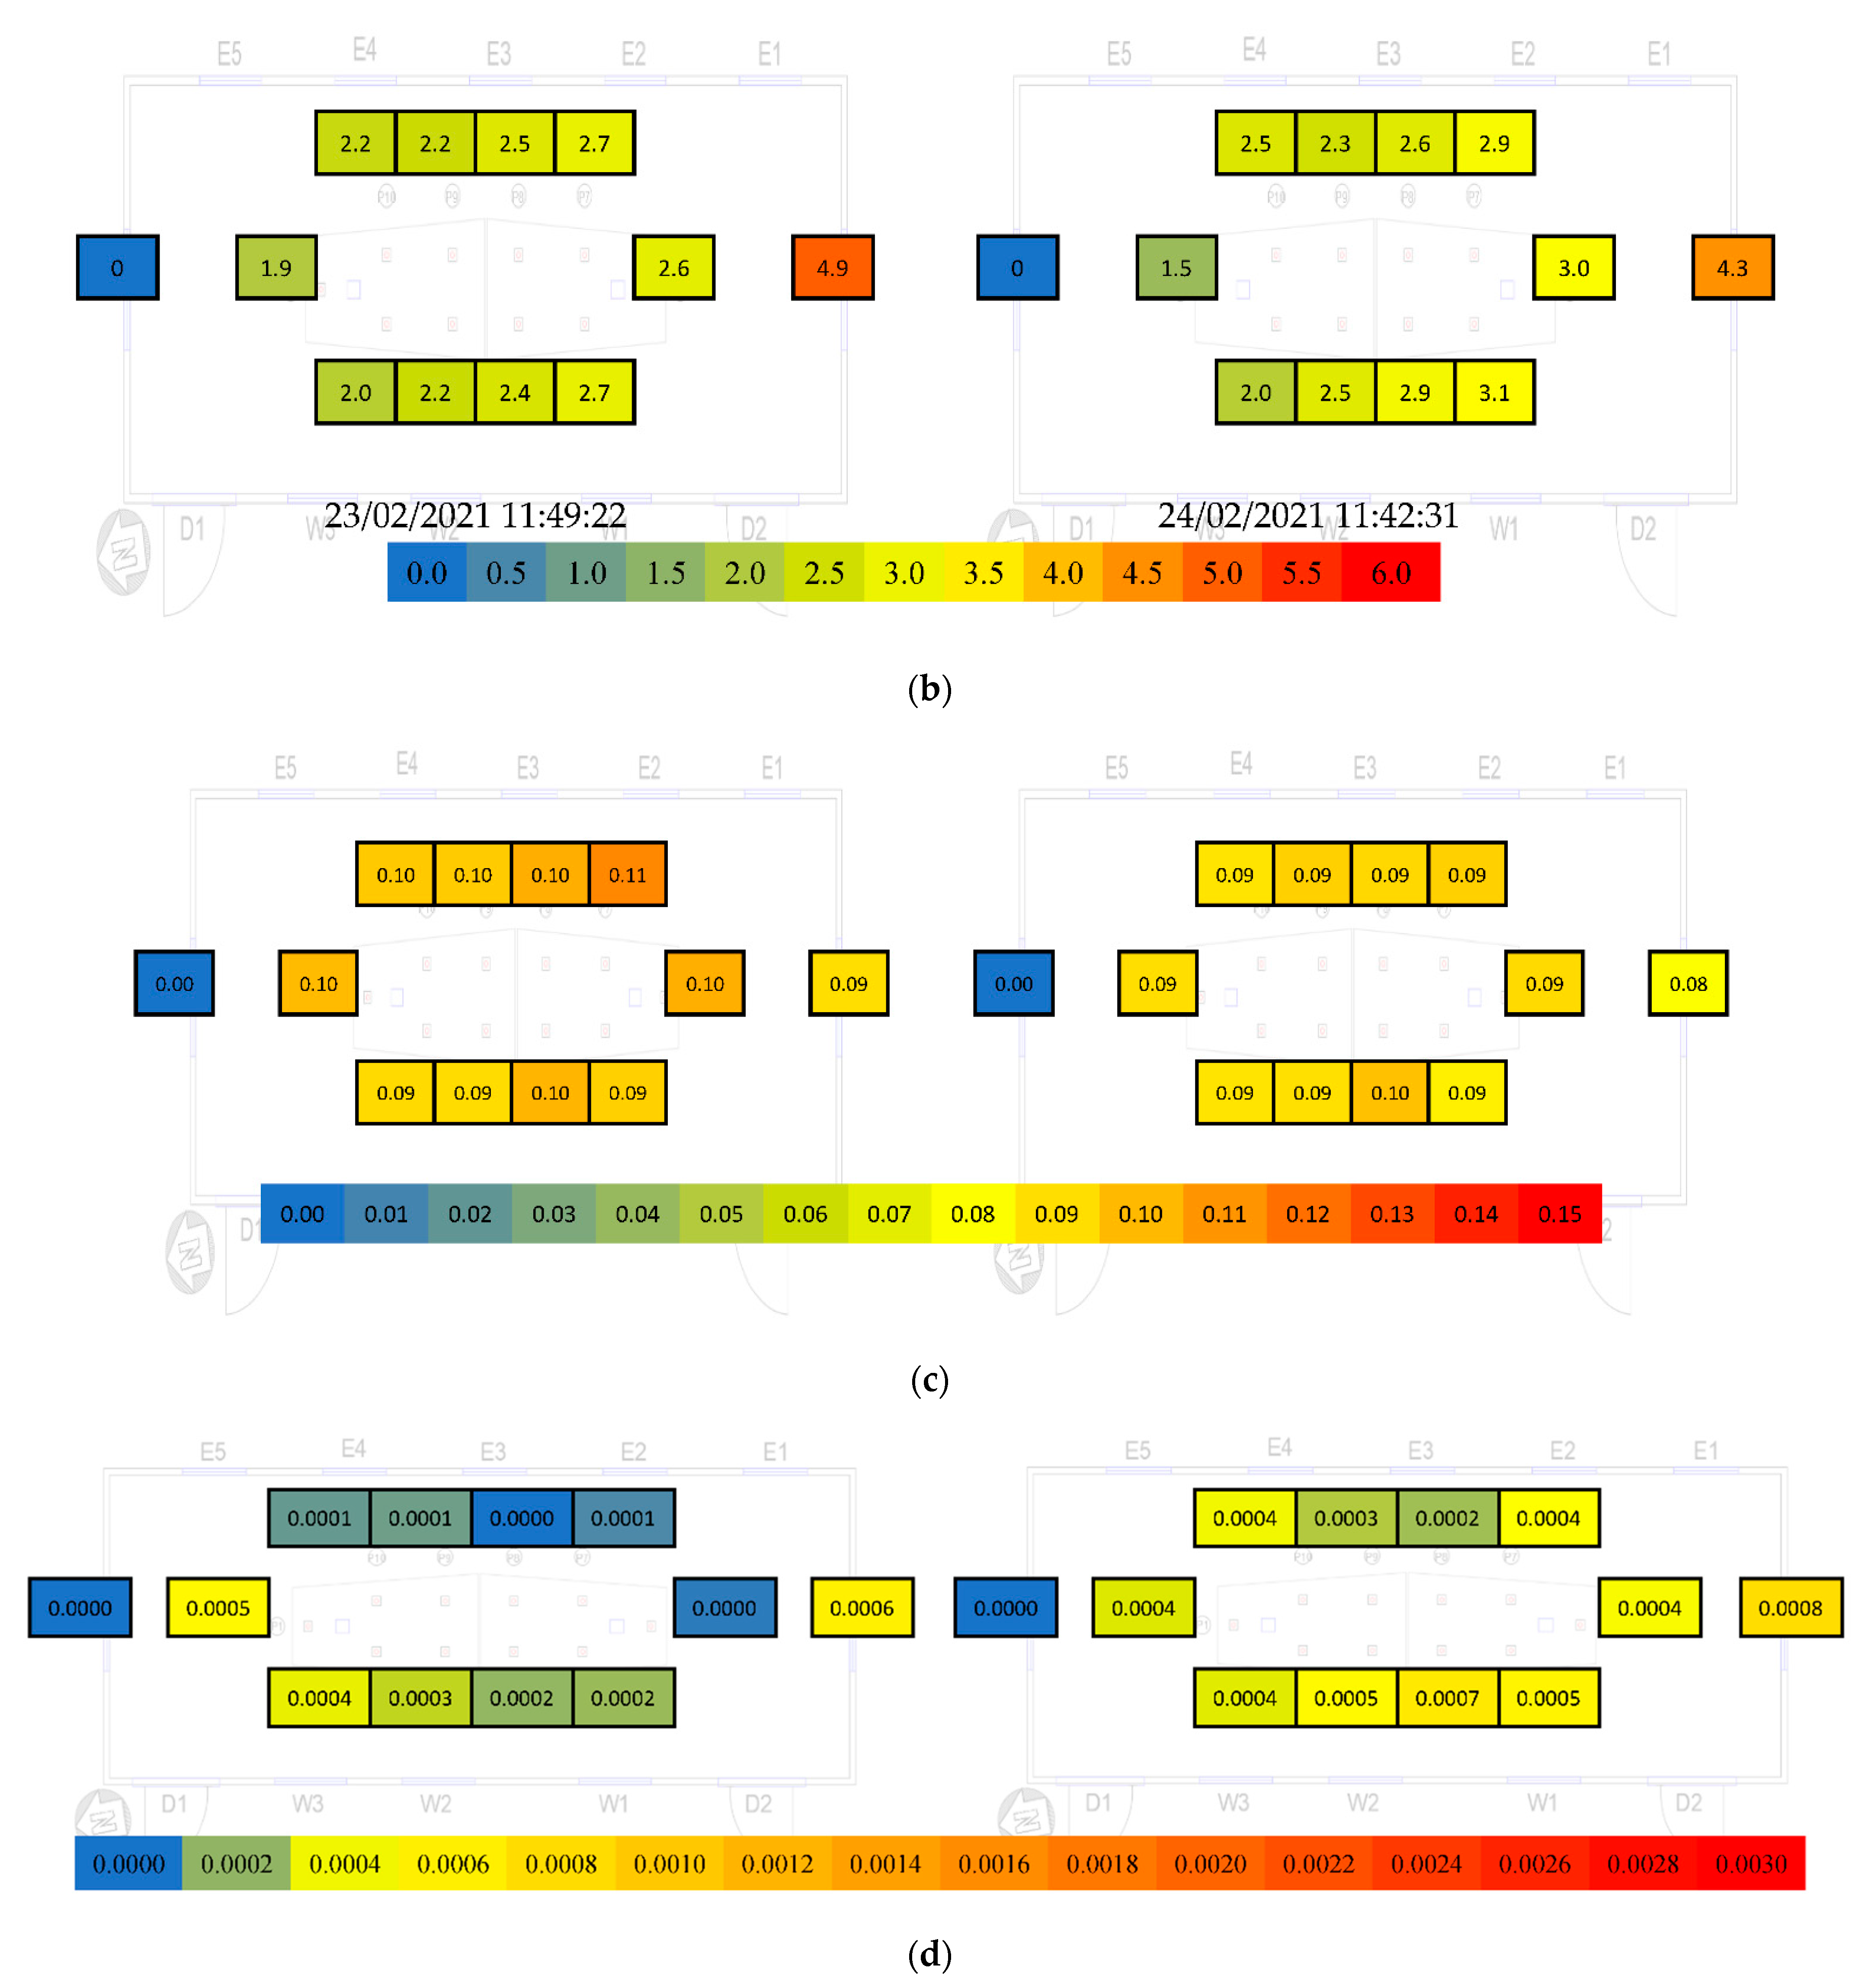
3.1. Repeatability Analysis
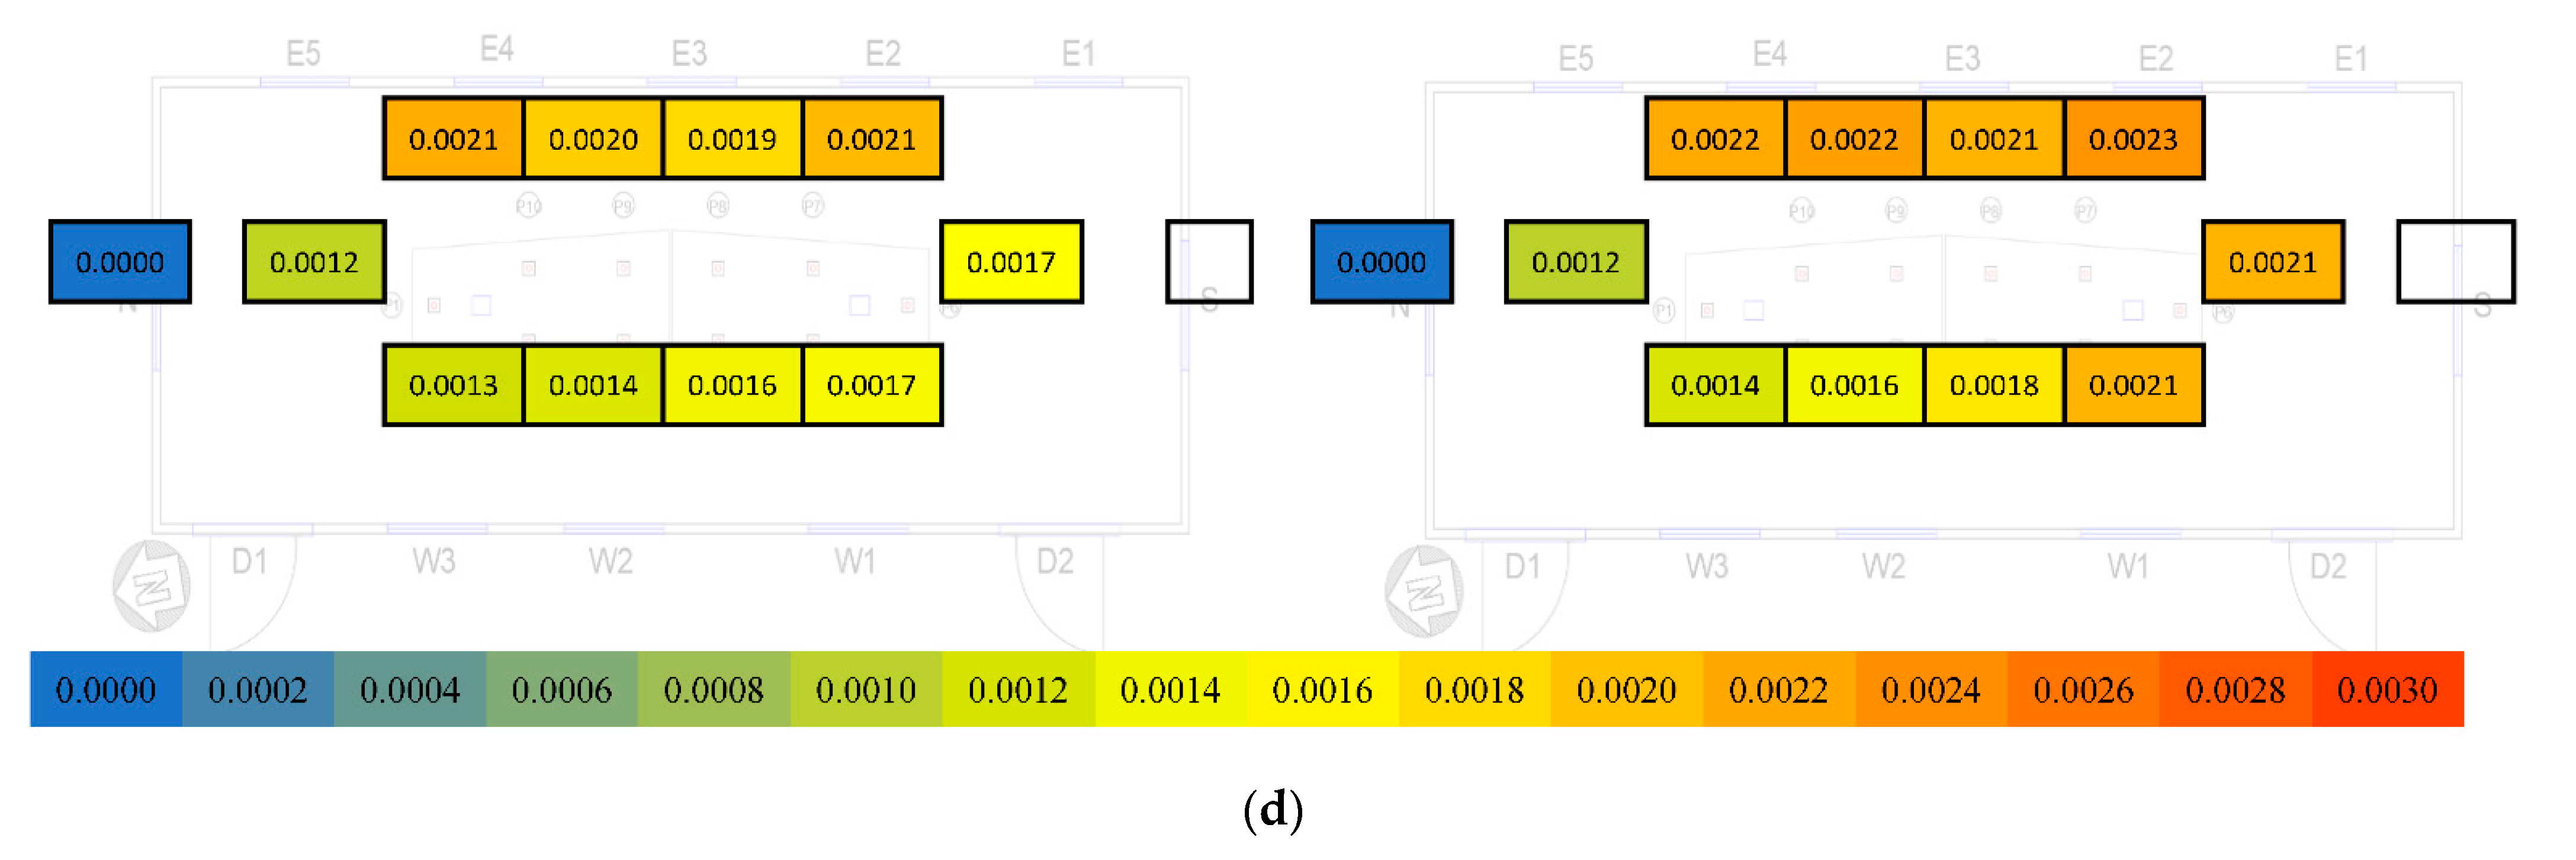
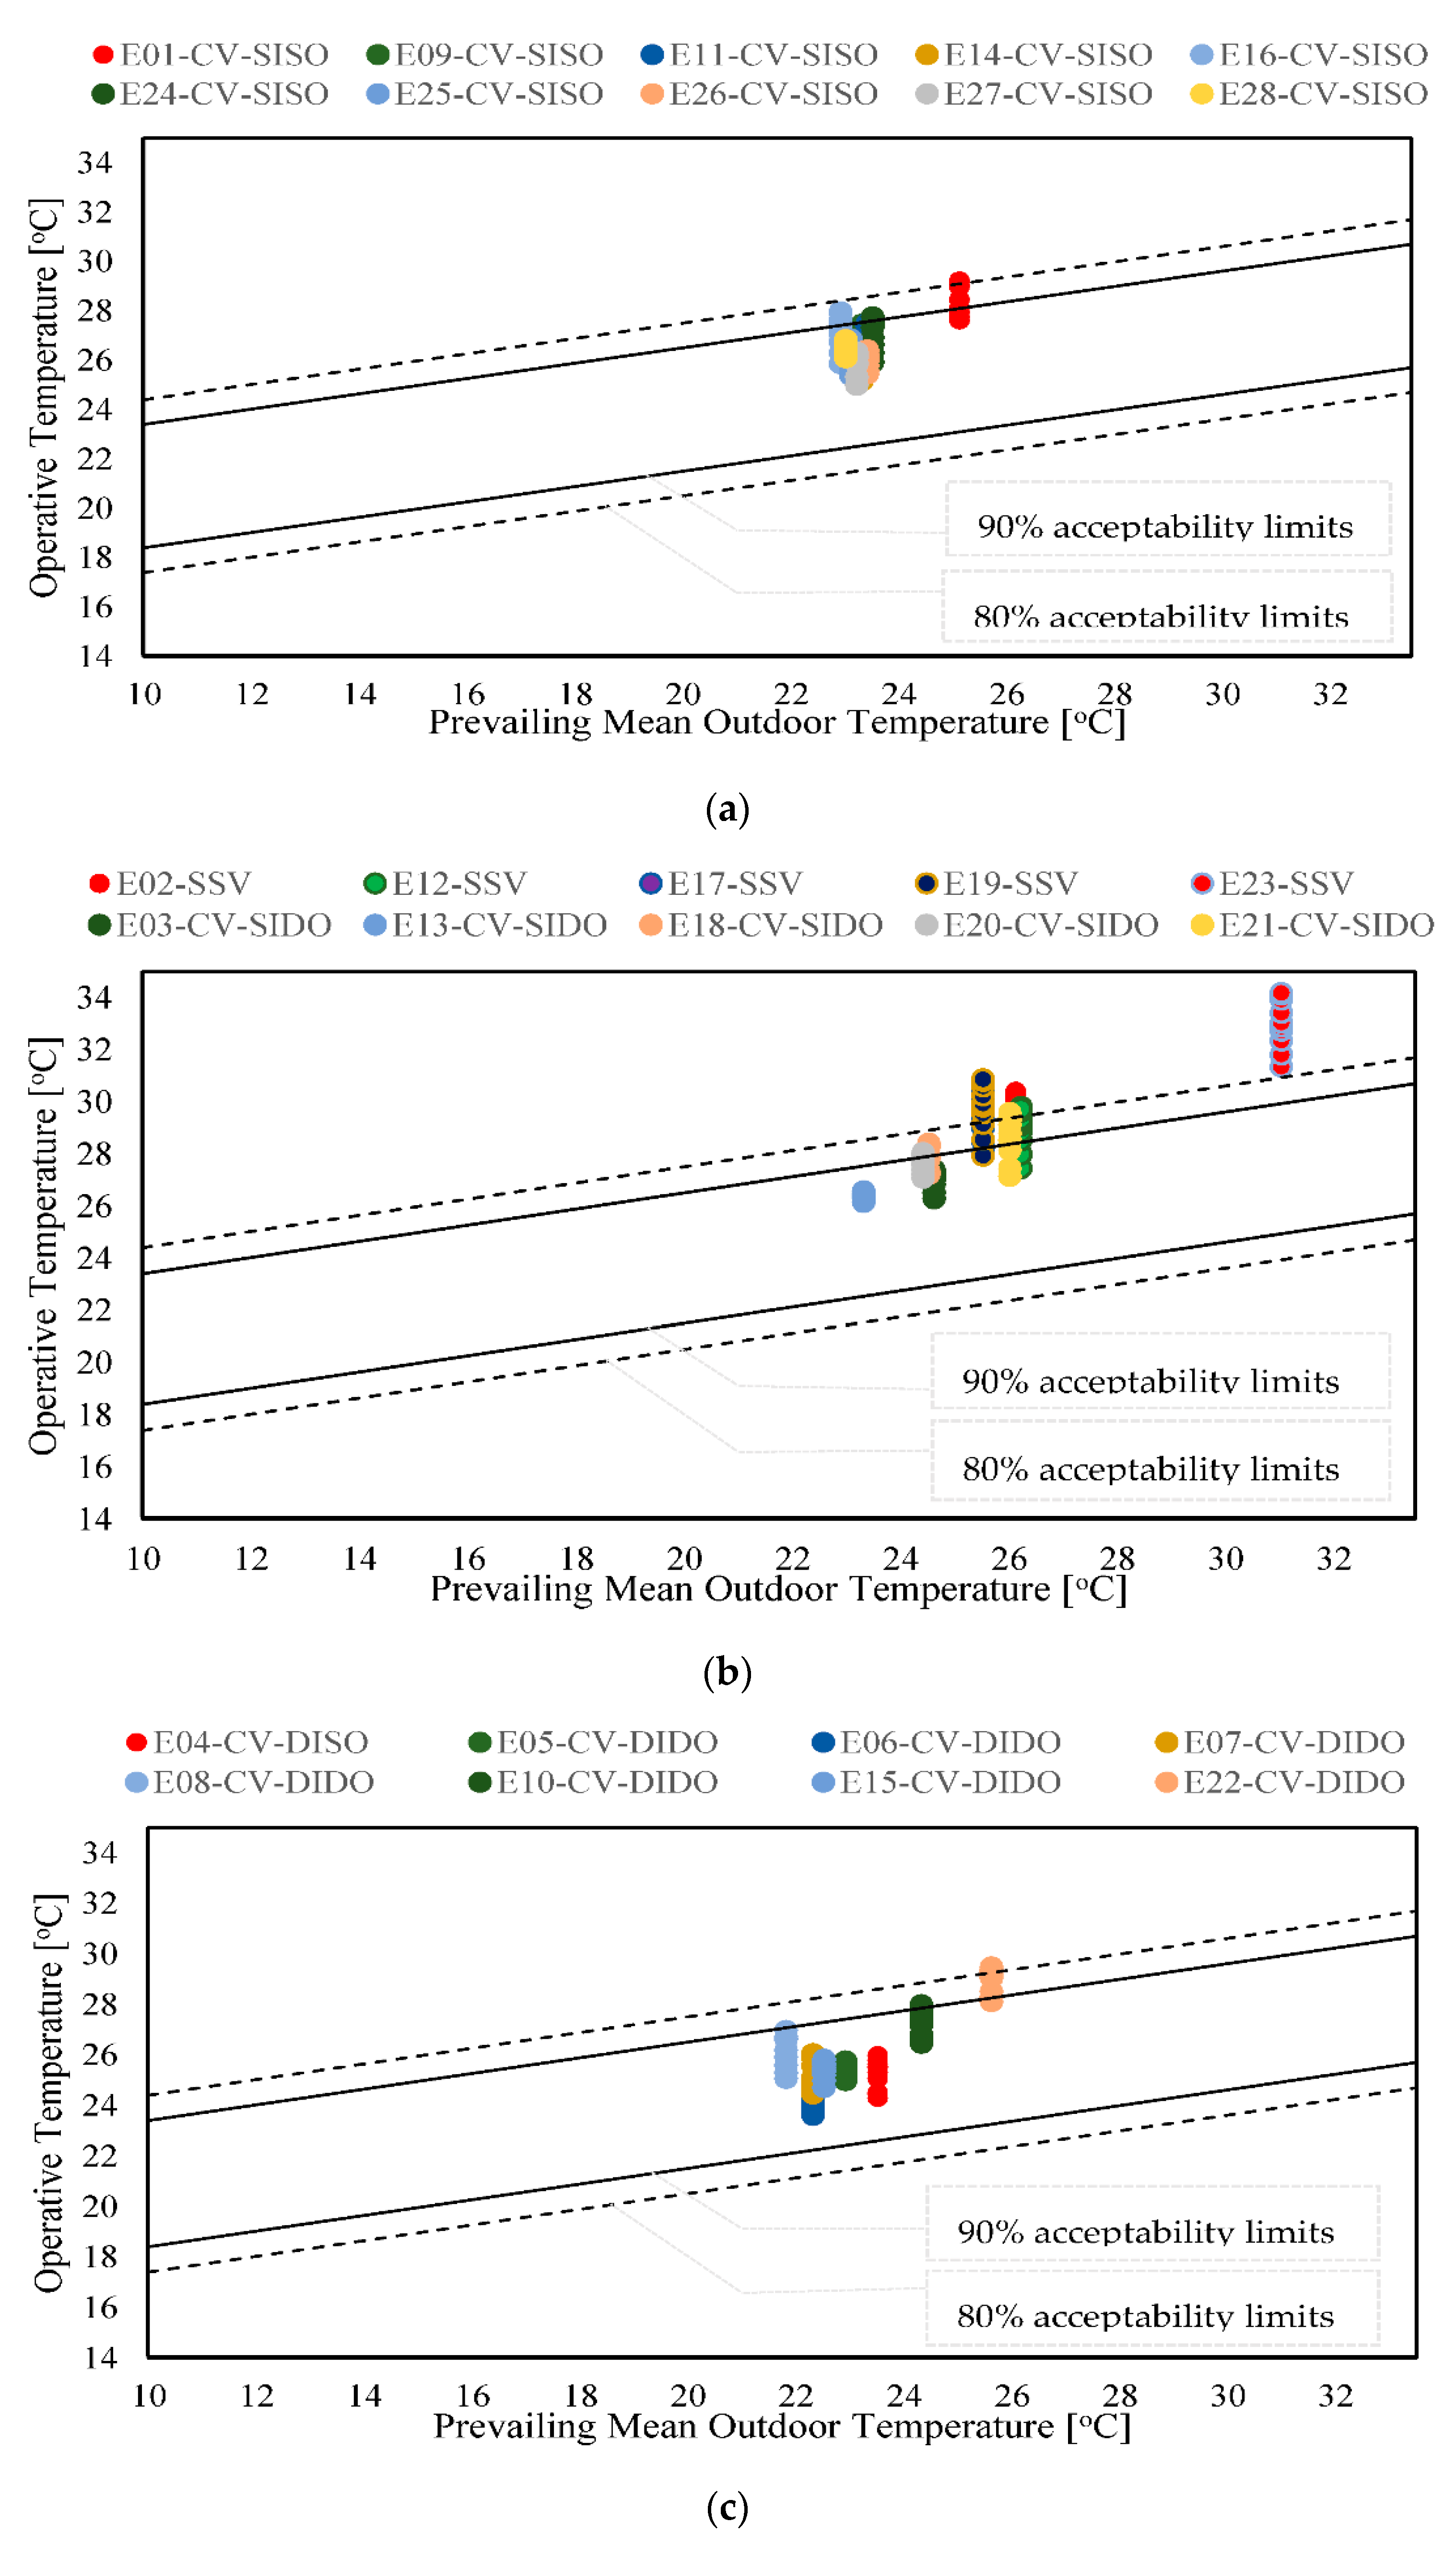
3.2. Comfort Assessment
3.3. Inlets and Outlets Effect
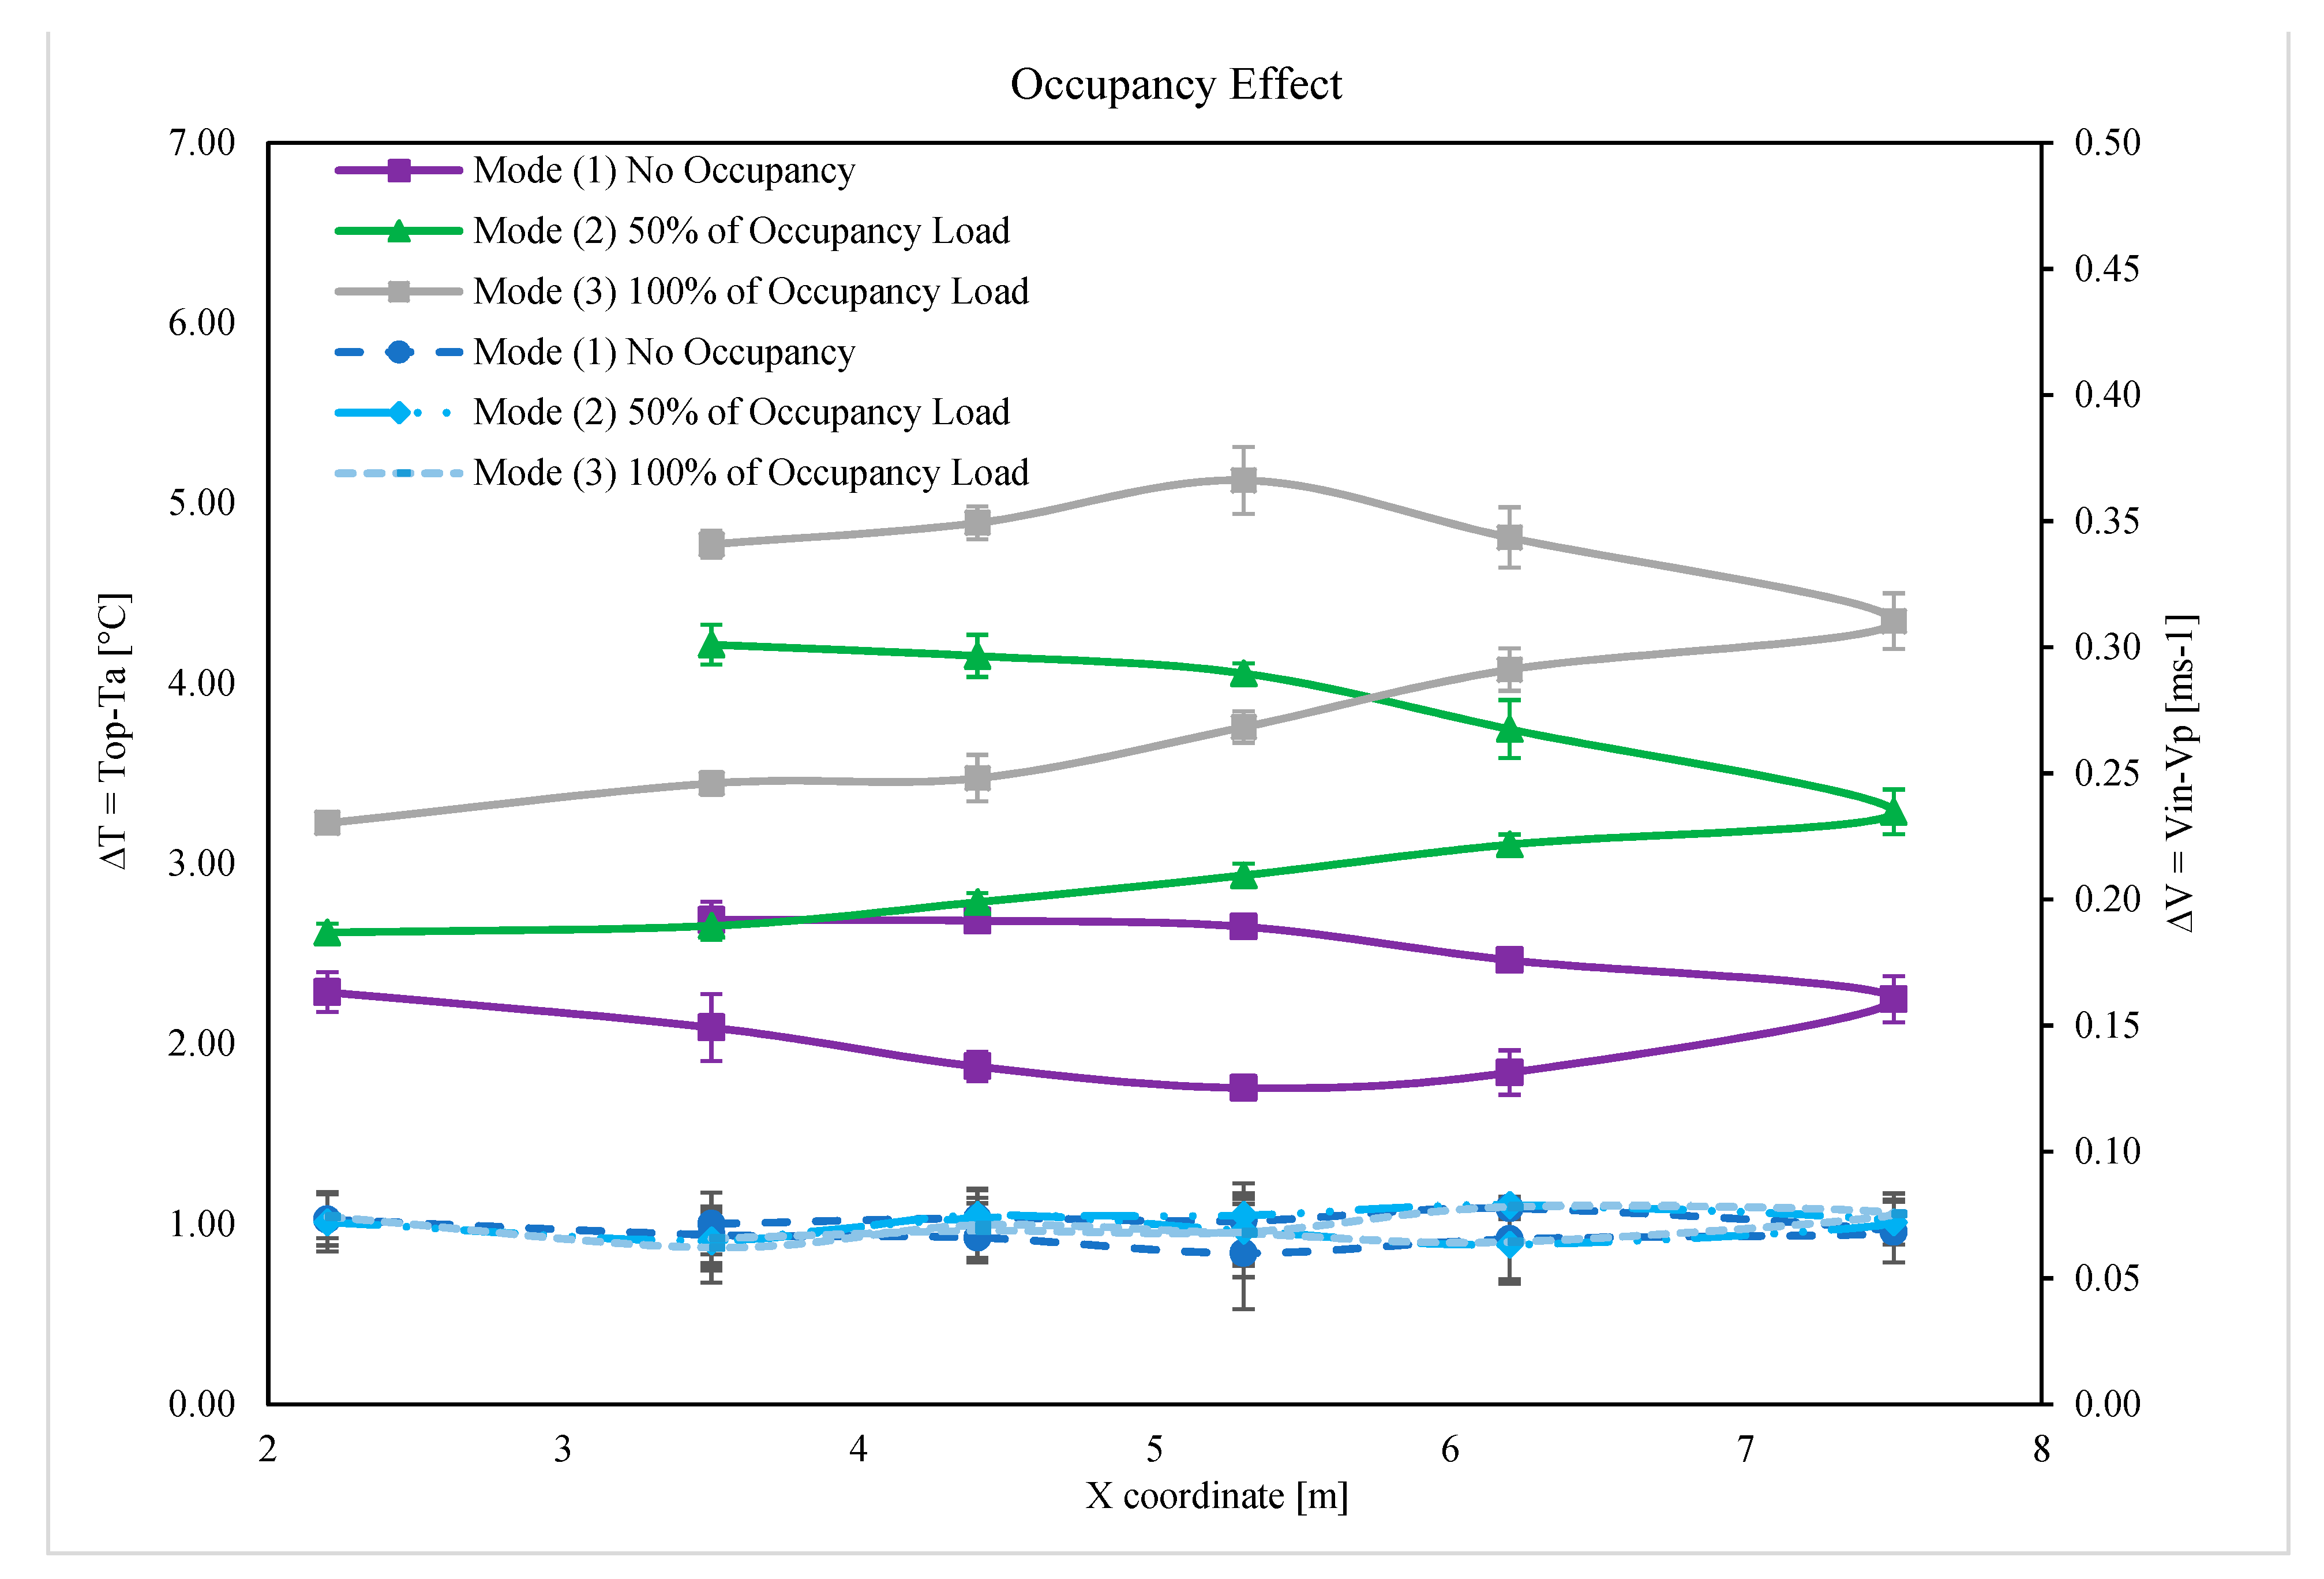
3.4. Occupancy Effect
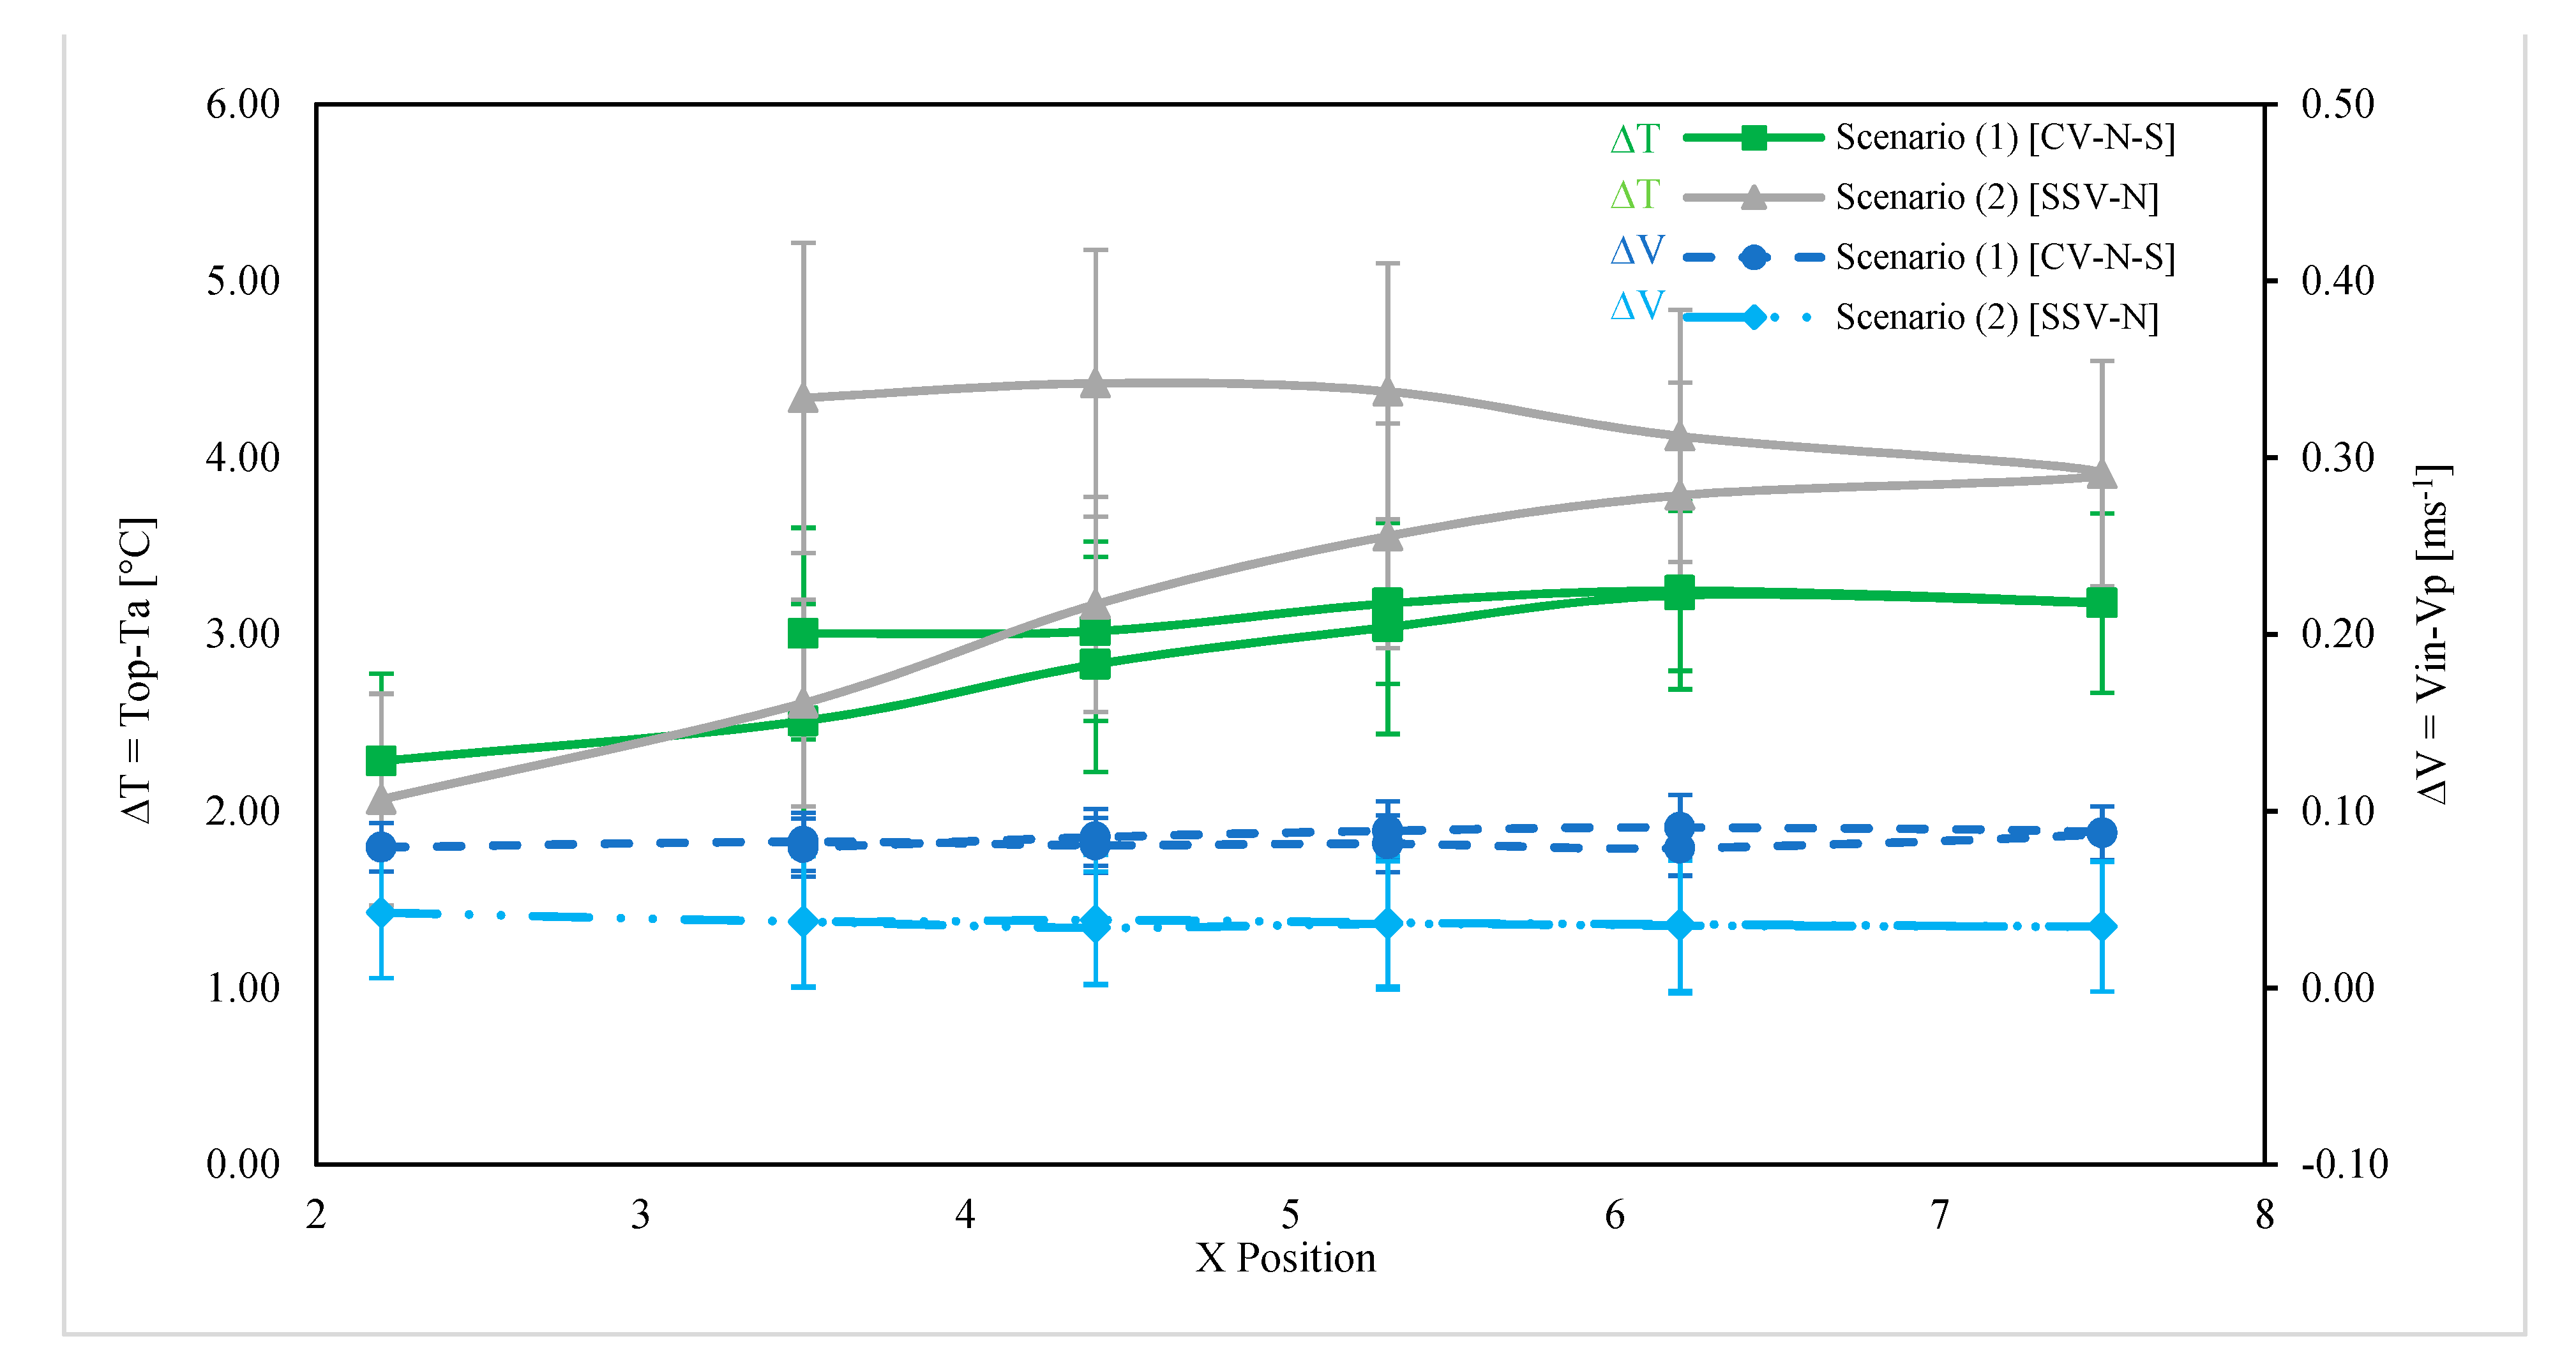
3.5. Cross Ventilation versus Singe-Side Ventilation Analysis
4. Conclusions
- The repeatability of experiments showed accurate results with an acceptable level of confidence by using the measurement devices of this study, while recording the indoor parameters of dry air temperature, humidity, globe temperature and airspeed for the repeated experiments, either it was cross-ventilation (CV) or single-side ventilation (SSV).
- Single-side ventilation cannot offer thermal comfort except at high airspeed (ACH > 1.14), while comfort is attained by cross-ventilation at ambient outdoor temperature ranged between 21.8 °C to 26.8 °C, considering the maximum temperature difference of 1.8 °C for maximum prevailing outdoor temperature when the inlet airspeed less than 0.2 ms−1.
- The increase in inlet temperature for measured locations ranged between 1.8–5.3 °C.
- The difference between monitored locations and inlet air temperature is inversely proportional to the number of air change per hour inside the classroom.
- The double inlet single outlet “DISO” scenario achieves the lowest temperature difference compared with the other scenarios at the same ACH.
- The difference between location and inlet air temperature is directly proportional to occupancy load.
- Using cross-ventilation instead of single-side ventilation reduces the temperature differences in all locations between 0.5 to 2.5 °C. Cross ventilation increases the entrained air causing the airspeed for all locations to increase up to three folds.
- On the extent of saving energy consumed inside mechanically ventilated buildings, it is recommended to depend on the passive ventilation either it is cross ventilation or single-sided mode. The measured findings indicate up to 85% of climate outdoor conditions provide full and partial thermal satisfaction for occupants, while 15% offer dissatisfaction due to the low airspeed associated with occupants are free to adapt their clothing.
Author Contributions
Funding
Institutional Review Board Statement
Informed Consent Statement
Data Availability Statement
Acknowledgments
Conflicts of Interest
References
- Yang, L.; Yan, H.; Lam, J.C. Thermal comfort and building energy consumption implications—A review. Appl. Energy 2014, 115, 164–173. [Google Scholar] [CrossRef]
- Koch-Nielsen, H. Stay Cool: A Design Guide for the Built Environment in Hot Climates; Routledge: London, UK, 2013. [Google Scholar]
- Ole Fanger, P. What is IAQ? Indoor Air 2006, 16, 328–334. [Google Scholar] [CrossRef]
- Korsavi, S.S.; Montazami, A.; Mumovic, D. Indoor air quality (IAQ) in naturally-ventilated primary schools in the UK: Occupant-related factors. Build. Environ. 2020, 180, 106992. [Google Scholar] [CrossRef]
- Kabirikopaei, A.; Lau, J.; Nord, J.; Bovaird, J. Identifying the K-12 classrooms’ indoor air quality factors that affect student academic performance. Sci. Total Environ. 2021, 786, 147498. [Google Scholar] [CrossRef]
- Hviid, C.A.; Pedersen, C.; Dabelsteen, K.H. A field study of the individual and combined effect of ventilation rate and lighting conditions on pupils’ performance. Build. Environ. 2020, 171, 106608. [Google Scholar] [CrossRef]
- Smedje, G.; Norbäck, D. New Ventilation Systems at Select Schools in Sweden—Effects on Asthma and Exposure. Arch. Environ. Health Int. J. 2000, 55, 18–25. [Google Scholar] [CrossRef]
- Griffiths, M.; Eftekhari, M. Control of CO2 in a naturally ventilated classroom. Energy Build. 2008, 40, 556–560. [Google Scholar] [CrossRef]
- Lei, Z.; Liu, C.; Wang, L.; Li, N. Effect of natural ventilation on indoor air quality and thermal comfort in dormitory during winter. Build. Environ. 2017, 125, 240–247. [Google Scholar] [CrossRef]
- Stabile, L.; Dell’Isola, M.; Russi, A.; Massimo, A.; Buonanno, G. The effect of natural ventilation strategy on indoor air quality in schools. Sci. Total Environ. 2017, 595, 894–902. [Google Scholar] [CrossRef] [PubMed]
- Shendell, D.G.; Prill, R.; Fisk, W.J.; Apte, M.G.; Blake, D.; Faulkner, D. Associations between classroom CO2 concentrations and student attendance in Washington and Idaho. Indoor Air 2004, 14, 333–341. [Google Scholar] [CrossRef] [PubMed]
- Ma, F.; Zhan, C.; Xu, X.; Li, G. Winter Thermal Comfort and Perceived Air Quality: A Case Study of Primary Schools in Severe Cold Regions in China. Energies 2020, 13, 5958. [Google Scholar] [CrossRef]
- Batterman, S. Review and Extension of CO2-Based Methods to Determine Ventilation Rates with Application to School Classrooms. Int. J. Environ. Res. Public Health 2017, 14, 145. [Google Scholar] [CrossRef]
- Broderick, Á.; Byrne, M.; Armstrong, S.; Sheahan, J.; Coggins, A.M. A pre and post evaluation of indoor air quality, ventilation, and thermal comfort in retrofitted co-operative social housing. Build. Environ. 2017, 122, 126–133. [Google Scholar] [CrossRef]
- Kavgic, M.; Mumovic, D.; Stevanovic, Z.; Young, A. Analysis of thermal comfort and indoor air quality in a mechanically ventilated theatre. Energy Build. 2008, 40, 1334–1343. [Google Scholar] [CrossRef]
- Chiesa, G.; Grosso, M. Geo-climatic applicability of natural ventilative cooling in the Mediterranean area. Energy Build. 2015, 107, 376–391. [Google Scholar] [CrossRef]
- Sustainable Energy Authority (sea.gov.bh). Official Report Published by National Energy Efficiency Action Plan (NEEAP); National Energy Efficiency Action Plan (NEEAP): The Kingdom of Bahrain, 2017. Available online: http://www.sea.gov.bh/wp-content/uploads/2018/04/02_NEEAP_full-report.pdf (accessed on 2 March 2021).
- Ministry of Transportation and Telecommunications. Meteorological Directorate Climate & Observation Section 1961–1990. 2020. Available online: http://www.bahrainweather.gov.bh/documents/10716/11392/monthly-climate-summary.pdf/4ca81444-f314-4a7e-8b28-6da2633901e2 (accessed on 2 March 2021).
- Singh, M.K.; Ooka, R.; Rijal, H.B.; Kumar, S.; Kumar, A.; Mahapatra, S. Progress in thermal comfort studies in classrooms over last 50 years and way forward. Energy Build. 2019, 188–189, 149–174. [Google Scholar] [CrossRef]
- Al-Khatri, H.; Alwetaishi, M.; Gadi, M.B. Exploring thermal comfort experience and adaptive opportunities of female and male high school students. J. Build. Eng. 2020, 31, 101365. [Google Scholar] [CrossRef]
- Indraganti, M. Gender Differences in Thermal Comfort and Satisfaction in Offices in GCC and Asia. In Gulf Conference on Sustainable Built Environment; Springer: Cham, Switzerland, 2020; pp. 483–497. [Google Scholar]
- Al-Rashidi, K.; Loveday, D.; Al-Mutawa, N. Impact of ventilation modes on carbon dioxide concentration levels in Kuwait classrooms. Energy Build. 2012, 47, 540–549. [Google Scholar] [CrossRef]
- Al-Rashidi, K.E.; Loveday, D.L.; Al-Mutawa, N.K. Investigating the Applicability of Different Thermal Comfort Models in Kuwait Classrooms Operated in Hybrid Air-Conditioning Mode. In Sustainability in Energy and Buildings; Springer: Berlin/Heidelberg, Germany, 2009; pp. 347–355. [Google Scholar]
- Al-Rashidi, K.; Loveday, D.; Al-Mutawa, N. Investigating the Applicability of Different Thermal Comfort Models in Naturally Ventilated Classrooms in Kuwait, Kuwait. May 2010. Available online: https://www.researchgate.net/publication/268034213_Investigating_the_Applicability_of_Different_Thermal_Comfort_Models_in_Air-Conditioned_Classrooms_in_Kuwait (accessed on 2 March 2021).
- Indraganti, M.; Boussaa, D. An adaptive relationship of thermal comfort for the Gulf Cooperation Council (GCC) Countries: The case of offices in Qatar. Energy Build. 2018, 159, 201–212. [Google Scholar] [CrossRef]
- Abdallah, A.S.H. Analysis of Thermal Comfort and Energy Consumption in Long Time Large Educational Halls (Studios), Assiut University, Egypt. Procedia Eng. 2015, 121, 1674–1681. [Google Scholar] [CrossRef] [Green Version]
- Mina, E.M.; Newell, T.A.; Jacobi, A.M. A generalized coefficient of performance for conditioning moist air. Int. J. Refrig. 2005, 28, 784–790. [Google Scholar] [CrossRef]
- Ali, H.H.; Al-Hashlamun, R. Assessment of indoor thermal environment in different prototypical school buildings in Jordan. Alex. Eng. J. 2019, 58, 699–711. [Google Scholar] [CrossRef]
- Duarte, R.; Glória Gomes, M.D.; Moret Rodrigues, A. Classroom ventilation with manual opening of windows: Findings from a two-year-long experimental study of a Portuguese secondary school. Build. Environ. 2017, 124, 118–129. [Google Scholar] [CrossRef] [Green Version]
- Guevara, G.; Soriano, G.; Mino-Rodriguez, I. Thermal comfort in university classrooms: An experimental study in the tropics. Build. Environ. 2021, 187, 107430. [Google Scholar] [CrossRef]
- Omrani, S.; Garcia-Hansen, V.; Capra, B.R.; Drogemuller, R. Effect of natural ventilation mode on thermal comfort and ventilation performance: Full-scale measurement. Energy Build. 2017, 156, 1–16. [Google Scholar] [CrossRef] [Green Version]
- Kyritsi, E.; Michael, A. An assessment of the impact of natural ventilation strategies and window opening patterns in office buildings in the mediterranean basin. Build. Environ. 2020, 175, 106384. [Google Scholar] [CrossRef]
- Ahmed, T.; Kumar, P.; Mottet, L. Natural ventilation in warm climates: The challenges of thermal comfort, heatwave resilience and indoor air quality. Renew. Sustain. Energy Rev. 2021, 138, 110669. [Google Scholar] [CrossRef]
- Olgyay, V. Bioclimatic Evaluation Method for Architectural Application. In Biometeorology; Tromp, S.W., Ed.; Pergamon: Oxford, UK, 1962; pp. 246–261. Available online: https://www.sciencedirect.com/science/article/pii/B9780080096834500346 (accessed on 2 March 2021).
- Olgyay, V.; Olgyay, A.; Lyndon, D.; Olgyay, V.W.; Reynolds, J.; Yeang, K. Design with Climate Bioclimatic Approach to Architectural Regionalism—New and Expanded Edition; REV-Revised, Ed.; Princeton University Press: Princeton, UK, 2015. [Google Scholar]
- Zuhairy, A.A.; Sayigh, A.A.M. The development of the bioclimatic concept in building design. Renew. Energy 1993, 3, 521–533. [Google Scholar] [CrossRef]
- De Dear, R.; Brager, G.S. Eveloping an Adaptive Model of Thermal Comfort and Preference. UC Berkeley: Center for the Built Environment. 1998. Available online: https://escholarship.org/uc/item/4qq2p9c6 (accessed on 2 March 2021).
- Brager, G.; de Dear, R. A Standard for Natural Ventilation. UC Berkeley: Center for the Built Environment. 2000. Available online: https://escholarship.org/uc/item/3f73w323 (accessed on 2 March 2021).
- Testo. 400 Data Sheet. Available online: https://static-int.testo.com/media/46/55/c9736d56bb90/testo-400-Datasheet-US.pdf (accessed on 2 March 2021).
- ANSI/ASHRAE. Standard 55-2017. Thermal Environmental Conditions for Human Occupancy; American Society of Heating, Refrigerating, and Air-Conditioning Engineers, Inc.: Atlanta, GA, USA, 2017. [Google Scholar]
- Thorsson, S.; Lindberg, F.; Eliasson, I.; Holmer, B. Different Methods for Estimating the Mean Radiant Temperature in an Outdoor Urban Setting. Int. J. Climatol. 2007, 27, 1983–1993. [Google Scholar] [CrossRef]
- Thomson, G.W. The Antoine Equation for Vapor-pressure Data. Chem. Rev. 1946, 38, 1–39. [Google Scholar] [CrossRef]


| Recorded Parameter | Experiment (1) | Experiment (2) |
|---|---|---|
| 23 February 2021 | 24 February 2021 | |
| Tin [°C] | 23.40 | 23.20 |
| Vin [m/s] | 0.12 | 0.10 |
| %RHin | 51.20 | 51.40 |
| Tout [°C] | 28.3 | 27.5 |
| Vout [m/s] | 0.03 | 0.02 |
| %RHout | 40.7 | 43.2 |
| Recorded Parameter | Experiment (1) | Experiment (2) |
|---|---|---|
| 10 February 2021 | 13 February 2021 | |
| Tin [°C] | 25.50 | 25.50 |
| Vin [m/s] | 0.02 | 0.03 |
| %RHin | 56.4 | 41.8 |
| Experiment Mode Scenario | E01 CV | E02 SSV | E03 CV | E04 CV | E05 CV | E06 CV | E07 CV | E08 CV | E09 CV | E10 CV |
| SISO | SSV | SIDO | DISO | DIDO | DIDO | DIDO | DIDO | SISO | DIDO | |
| Ta | 25.1 | 26.1 | 24.6 | 23.5 | 22.9 | 22.3 | 22.3 | 21.8 | 23.3 | 24.3 |
| Top @ P1 | 27.6 | 28.2 | 26.3 | 24.3 | 24.9 | 24.1 | 24.4 | 25.0 | 25.8 | 26.5 |
| Top @ P2 | 27.9 | 28.8 | 26.5 | 24.4 | 25.1 | 23.9 | 24.5 | 25.2 | 26.0 | 26.4 |
| Top @ P3 | 28.1 | 29.4 | 26.8 | 24.5 | 25.4 | 23.7 | 24.6 | 25.3 | 26.5 | 26.8 |
| Top @ P4 | 27.7 | 29.8 | 27.0 | 25.0 | 25.7 | 23.6 | 24.7 | 25.6 | 26.7 | 27.1 |
| Top @ P5 | 27.9 | 30.1 | 27.2 | 25.5 | 25.5 | 23.6 | 24.9 | 25.9 | 26.9 | 27.3 |
| Top @ P6 | 28.4 | 30.1 | 27.0 | 25.8 | 25.2 | 24.0 | 25.1 | 26.1 | 27.1 | 27.4 |
| Top @ P7 | 29.0 | 30.3 | 27.2 | 25.9 | 25.6 | 24.3 | 25.5 | 26.6 | 27.4 | 27.7 |
| Top @ P8 | 29.2 | 30.4 | 27.3 | 25.6 | 25.7 | 24.4 | 25.9 | 26.9 | 27.4 | 27.9 |
| Top @ P9 | 29.2 | 30.1 | 27.3 | 25.5 | 25.7 | 24.5 | 26.0 | 26.7 | 27.3 | 28.0 |
| Top @ P10 | 29.0 | 29.8 | 27.1 | 25.3 | 25.0 | 24.5 | 26.0 | 26.6 | 27.4 | 27.8 |
| Mode | E11 CV | E12 SSV | E13 CV | E14 CV | E15 CV | E16 CV | E17 | E18 CV | E19 SSV | E20 CV |
| SISO | SSV | SIDO | SISO | DIDO | SISO | SSV | SIDO | SSV | SIDO | |
| Ta | 23.4 | 26.2 | 23.3 | 23.3 | 22.5 | 22.9 | 25.5 | 24.5 | 25.5 | 24.4 |
| Top @ P1 | 25.6 | 27.4 | 26.5 | 25.1 | 24.7 | 25.8 | 28.0 | 27.2 | 27.9 | 27.1 |
| Top @ P2 | 25.6 | 28.0 | 26.4 | 25.3 | 24.9 | 26.3 | 28.5 | 27.3 | 28.5 | 27.2 |
| Top @ P3 | 25.8 | 28.5 | 26.1 | 25.6 | 25.2 | 26.7 | 29.0 | 27.8 | 29.1 | 27.4 |
| Top @ P4 | 26.1 | 28.8 | 26.3 | 26.0 | 25.3 | 27.0 | 29.4 | 28.3 | 29.5 | 27.8 |
| Top @ P5 | 26.4 | 29.1 | 26.3 | 26.2 | 25.3 | 27.3 | 29.5 | 28.3 | 29.8 | 27.9 |
| Top @ P6 | 26.7 | 29.2 | 26.3 | 26.3 | 25.5 | 27.2 | 29.7 | 28.4 | 29.9 | 28.0 |
| Top @ P7 | 27.1 | 29.3 | 26.4 | 26.5 | 25.6 | 27.6 | 30.0 | 28.4 | 30.2 | 27.9 |
| Top @ P8 | 27.4 | 29.6 | 26.5 | 26.6 | 25.6 | 27.9 | 30.2 | 28.2 | 30.6 | 27.9 |
| Top @ P9 | 27.5 | 29.8 | 26.4 | 26.6 | 25.7 | 27.9 | 30.3 | 28.3 | 30.8 | 27.6 |
| Top @ P10 | 27.3 | 29.7 | 26.4 | 26.3 | 25.8 | 27.9 | 30.3 | 27.9 | 30.8 | 27.6 |
| Mode | E21 CV | E22 CV | E23 SSV | E24 CV | E25 CV | E26 CV | E27 CV | E28 CV | ||
| SIDO | DIDO | SSV | SISO | SISO | SISO | SISO | SISO | |||
| Ta | 26.0 | 25.6 | 31.0 | 23.5 | 23.1 | 23.4 | 23.2 | 23.0 | ||
| Top @ P1 | 27.1 | 28.1 | 31.3 | 25.9 | 25.4 | 25.4 | 25.0 | 26.1 | ||
| Top @ P2 | 27.4 | 28.3 | 31.8 | 25.9 | 25.3 | 25.6 | 25.3 | 26.3 | ||
| Top @ P3 | 28.1 | 28.5 | 32.3 | 26.3 | 25.7 | 25.8 | 25.8 | 26.5 | ||
| Top @ P4 | 28.5 | 29.0 | 32.7 | 26.6 | 26.1 | 25.9 | 26.1 | 26.7 | ||
| Top @ P5 | 28.5 | 29.1 | 32.9 | 26.9 | 26.1 | 26.2 | 26.3 | 26.8 | ||
| Top @ P6 | 28.8 | 29.2 | 33.0 | 27.3 | 26.3 | 26.2 | 26.2 | 26.8 | ||
| Top @ P7 | 29.1 | 29.3 | 33.4 | 27.6 | 26.5 | 26.4 | 26.2 | 26.8 | ||
| Top @ P8 | 29.4 | 29.5 | 33.9 | 27.7 | 26.8 | 26.3 | 26.1 | 26.7 | ||
| Top @ P9 | 29.6 | 29.4 | 34.1 | 27.6 | 26.8 | 26.2 | 25.9 | 26.6 | ||
| Top @ P10 | 29.3 | 29.2 | 34.2 | 27.4 | 26.6 | 26.0 | 25.9 | 26.7 | ||
| E01–E28 | Twenty-eight experiments carried by authors | |||||||||
| P1–P10 | Ten Locations monitored in the studied classroom | |||||||||
| CV | Cross Ventilation | |||||||||
| SSV | Single-Side Ventilation | |||||||||
| SISO | Single Inlet Single Outlet | |||||||||
| SIDO | Single Inlet double Outlet | |||||||||
| DISO | Double Inlet single Outlet | |||||||||
| DIDO | Double Inlet double Outlet | |||||||||
| Ta | Inlet Air Temperature | |||||||||
| Top | Operative Temperature | |||||||||
| Shaded cells not complied with 90% acceptability limits of ASHRAE Standard 55 | ||||||||||
Publisher’s Note: MDPI stays neutral with regard to jurisdictional claims in published maps and institutional affiliations. |
© 2021 by the authors. Licensee MDPI, Basel, Switzerland. This article is an open access article distributed under the terms and conditions of the Creative Commons Attribution (CC BY) license (https://creativecommons.org/licenses/by/4.0/).
Share and Cite
Reda, I.; AbdelMessih, R.N.; Steit, M.; Mina, E.M. Quantifying Fenestration Effect on Thermal Comfort in Naturally Ventilated Classrooms. Sustainability 2021, 13, 7385. https://doi.org/10.3390/su13137385
Reda I, AbdelMessih RN, Steit M, Mina EM. Quantifying Fenestration Effect on Thermal Comfort in Naturally Ventilated Classrooms. Sustainability. 2021; 13(13):7385. https://doi.org/10.3390/su13137385
Chicago/Turabian StyleReda, Ibrahim, Raouf N. AbdelMessih, Mohamed Steit, and Ehab M. Mina. 2021. "Quantifying Fenestration Effect on Thermal Comfort in Naturally Ventilated Classrooms" Sustainability 13, no. 13: 7385. https://doi.org/10.3390/su13137385
APA StyleReda, I., AbdelMessih, R. N., Steit, M., & Mina, E. M. (2021). Quantifying Fenestration Effect on Thermal Comfort in Naturally Ventilated Classrooms. Sustainability, 13(13), 7385. https://doi.org/10.3390/su13137385