
The Potential of GIS Tools for Diagnosing the SFS of Multi-Family Housing towards Friendly Cities—A Case Study of the EU Member State of Poland


Abstract
1. Introduction
2. Literature Review
2.1. Origin and Architectural Features of Multi-Family Residential Estates in Poland and Other Former Socialist Countries
2.2. Core Approaches to Assessments of Multi-Family Housing
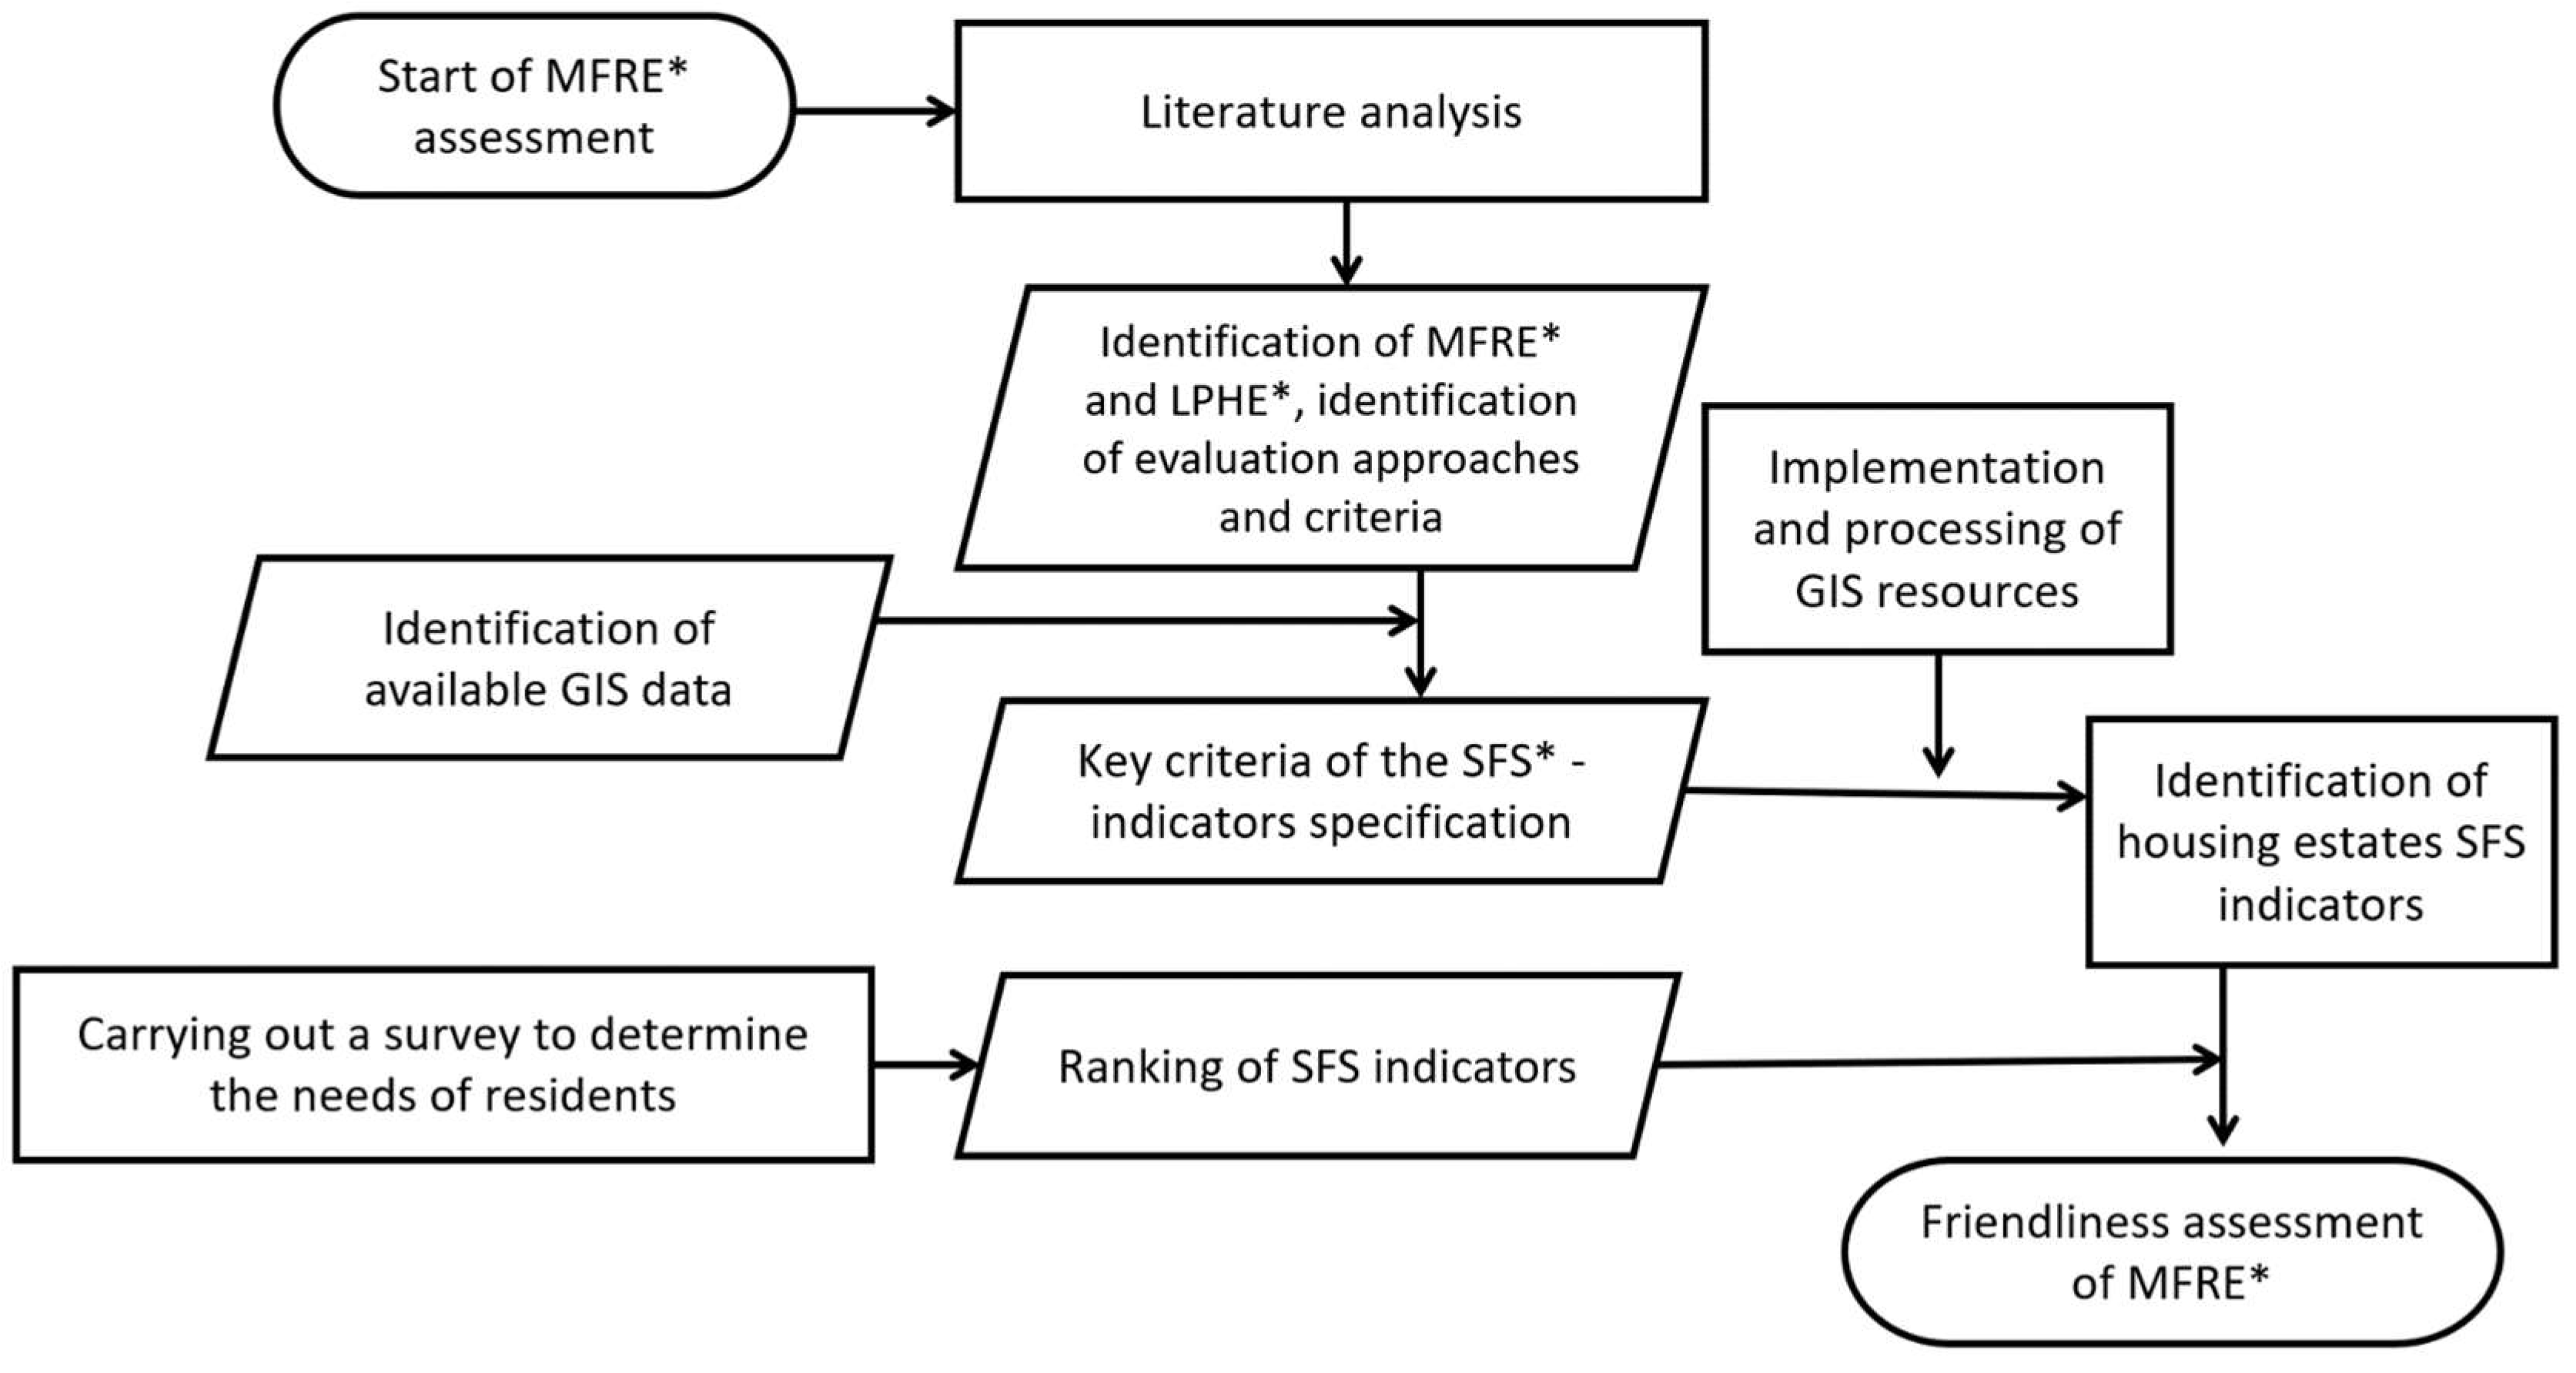
3. Materials and Methods
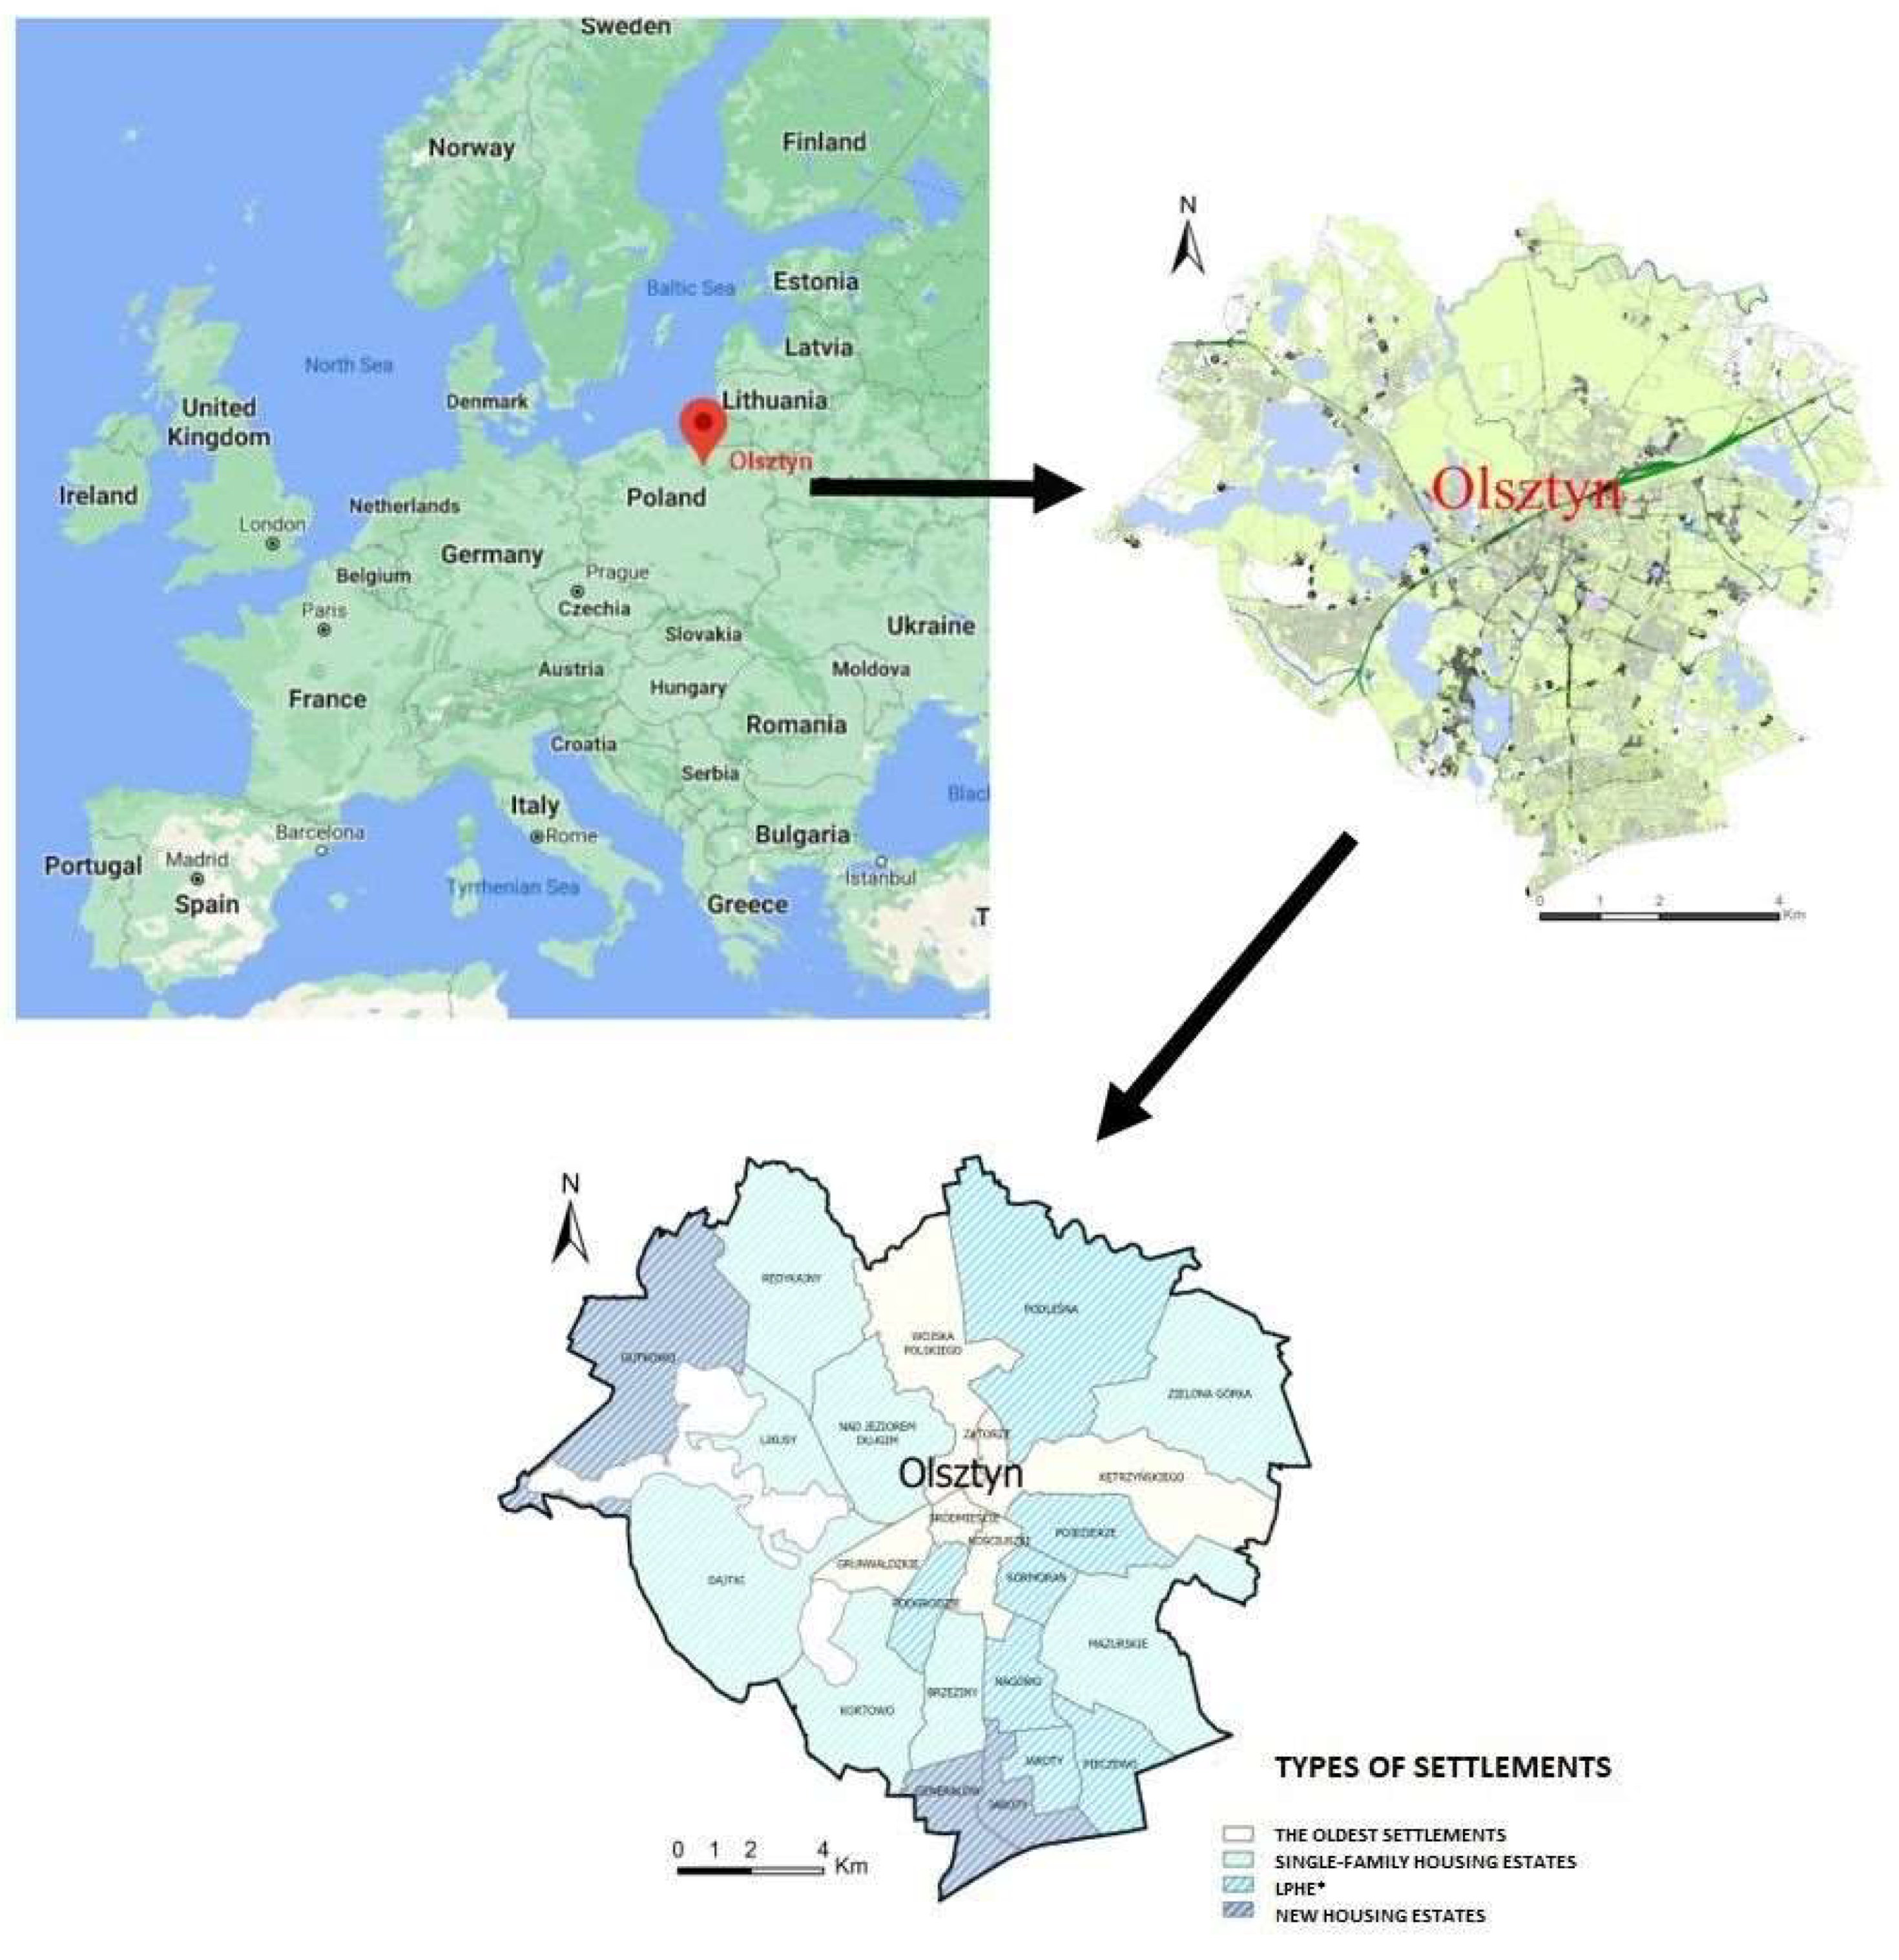
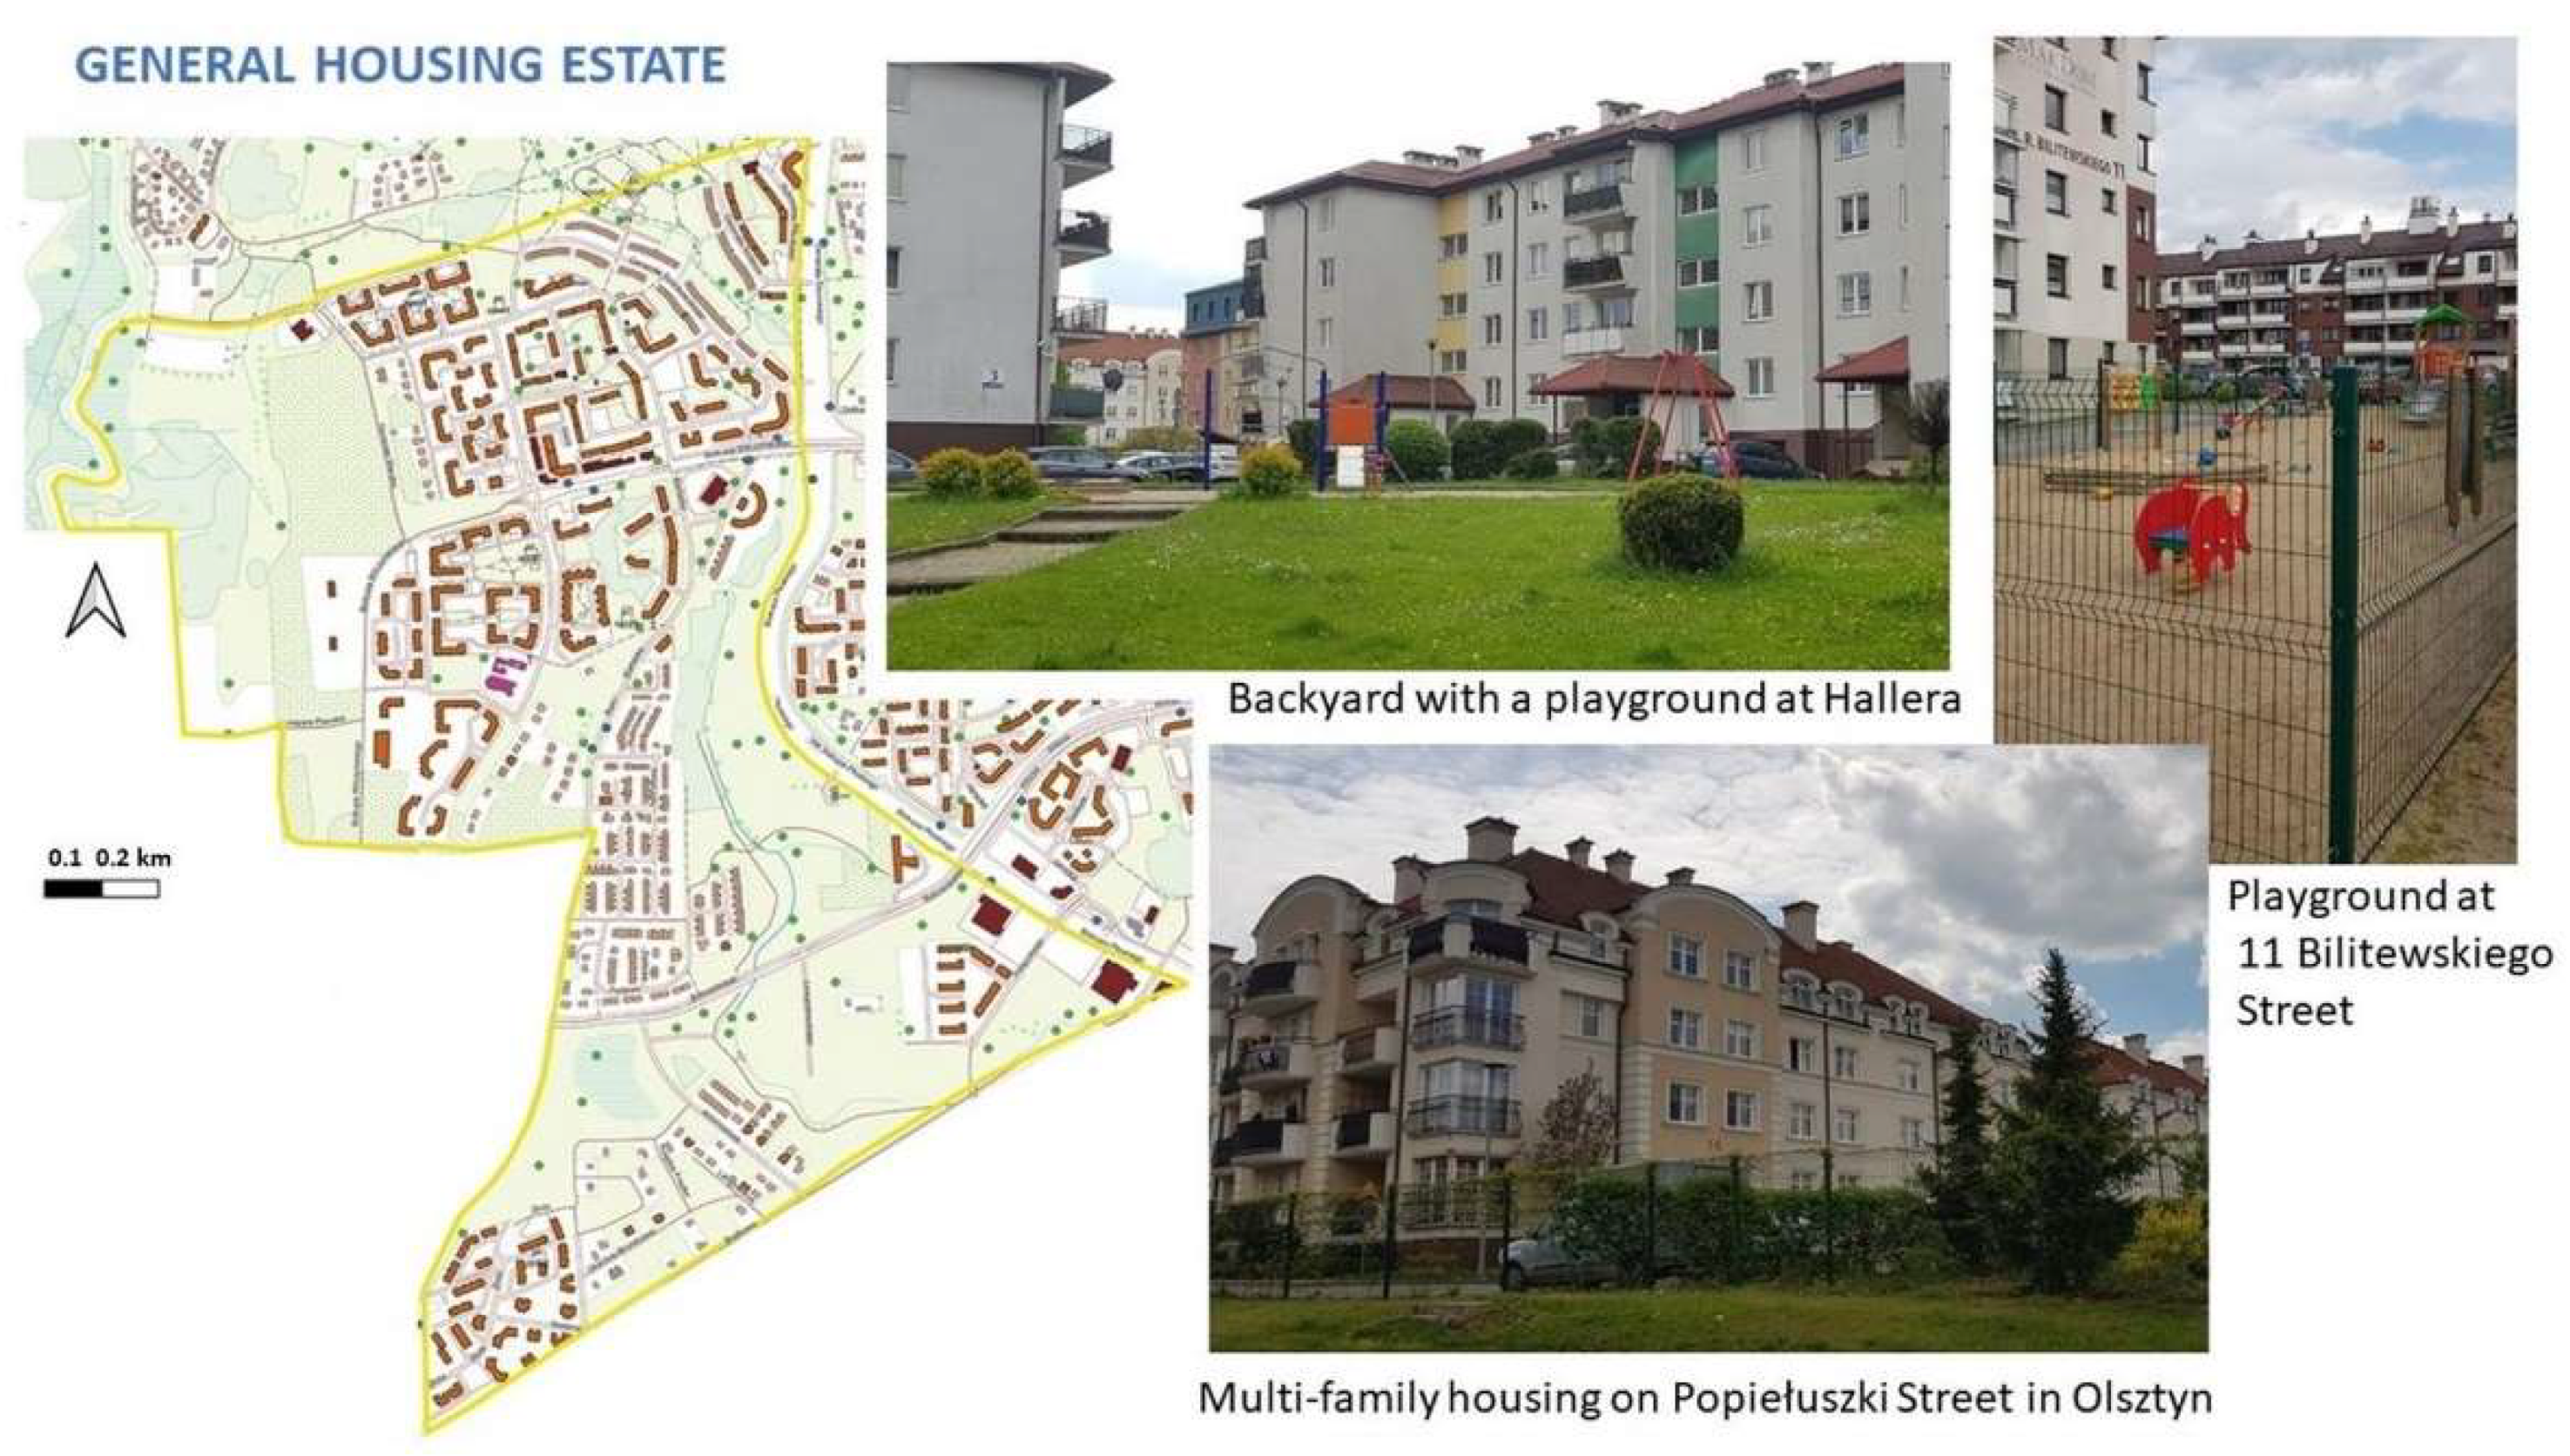
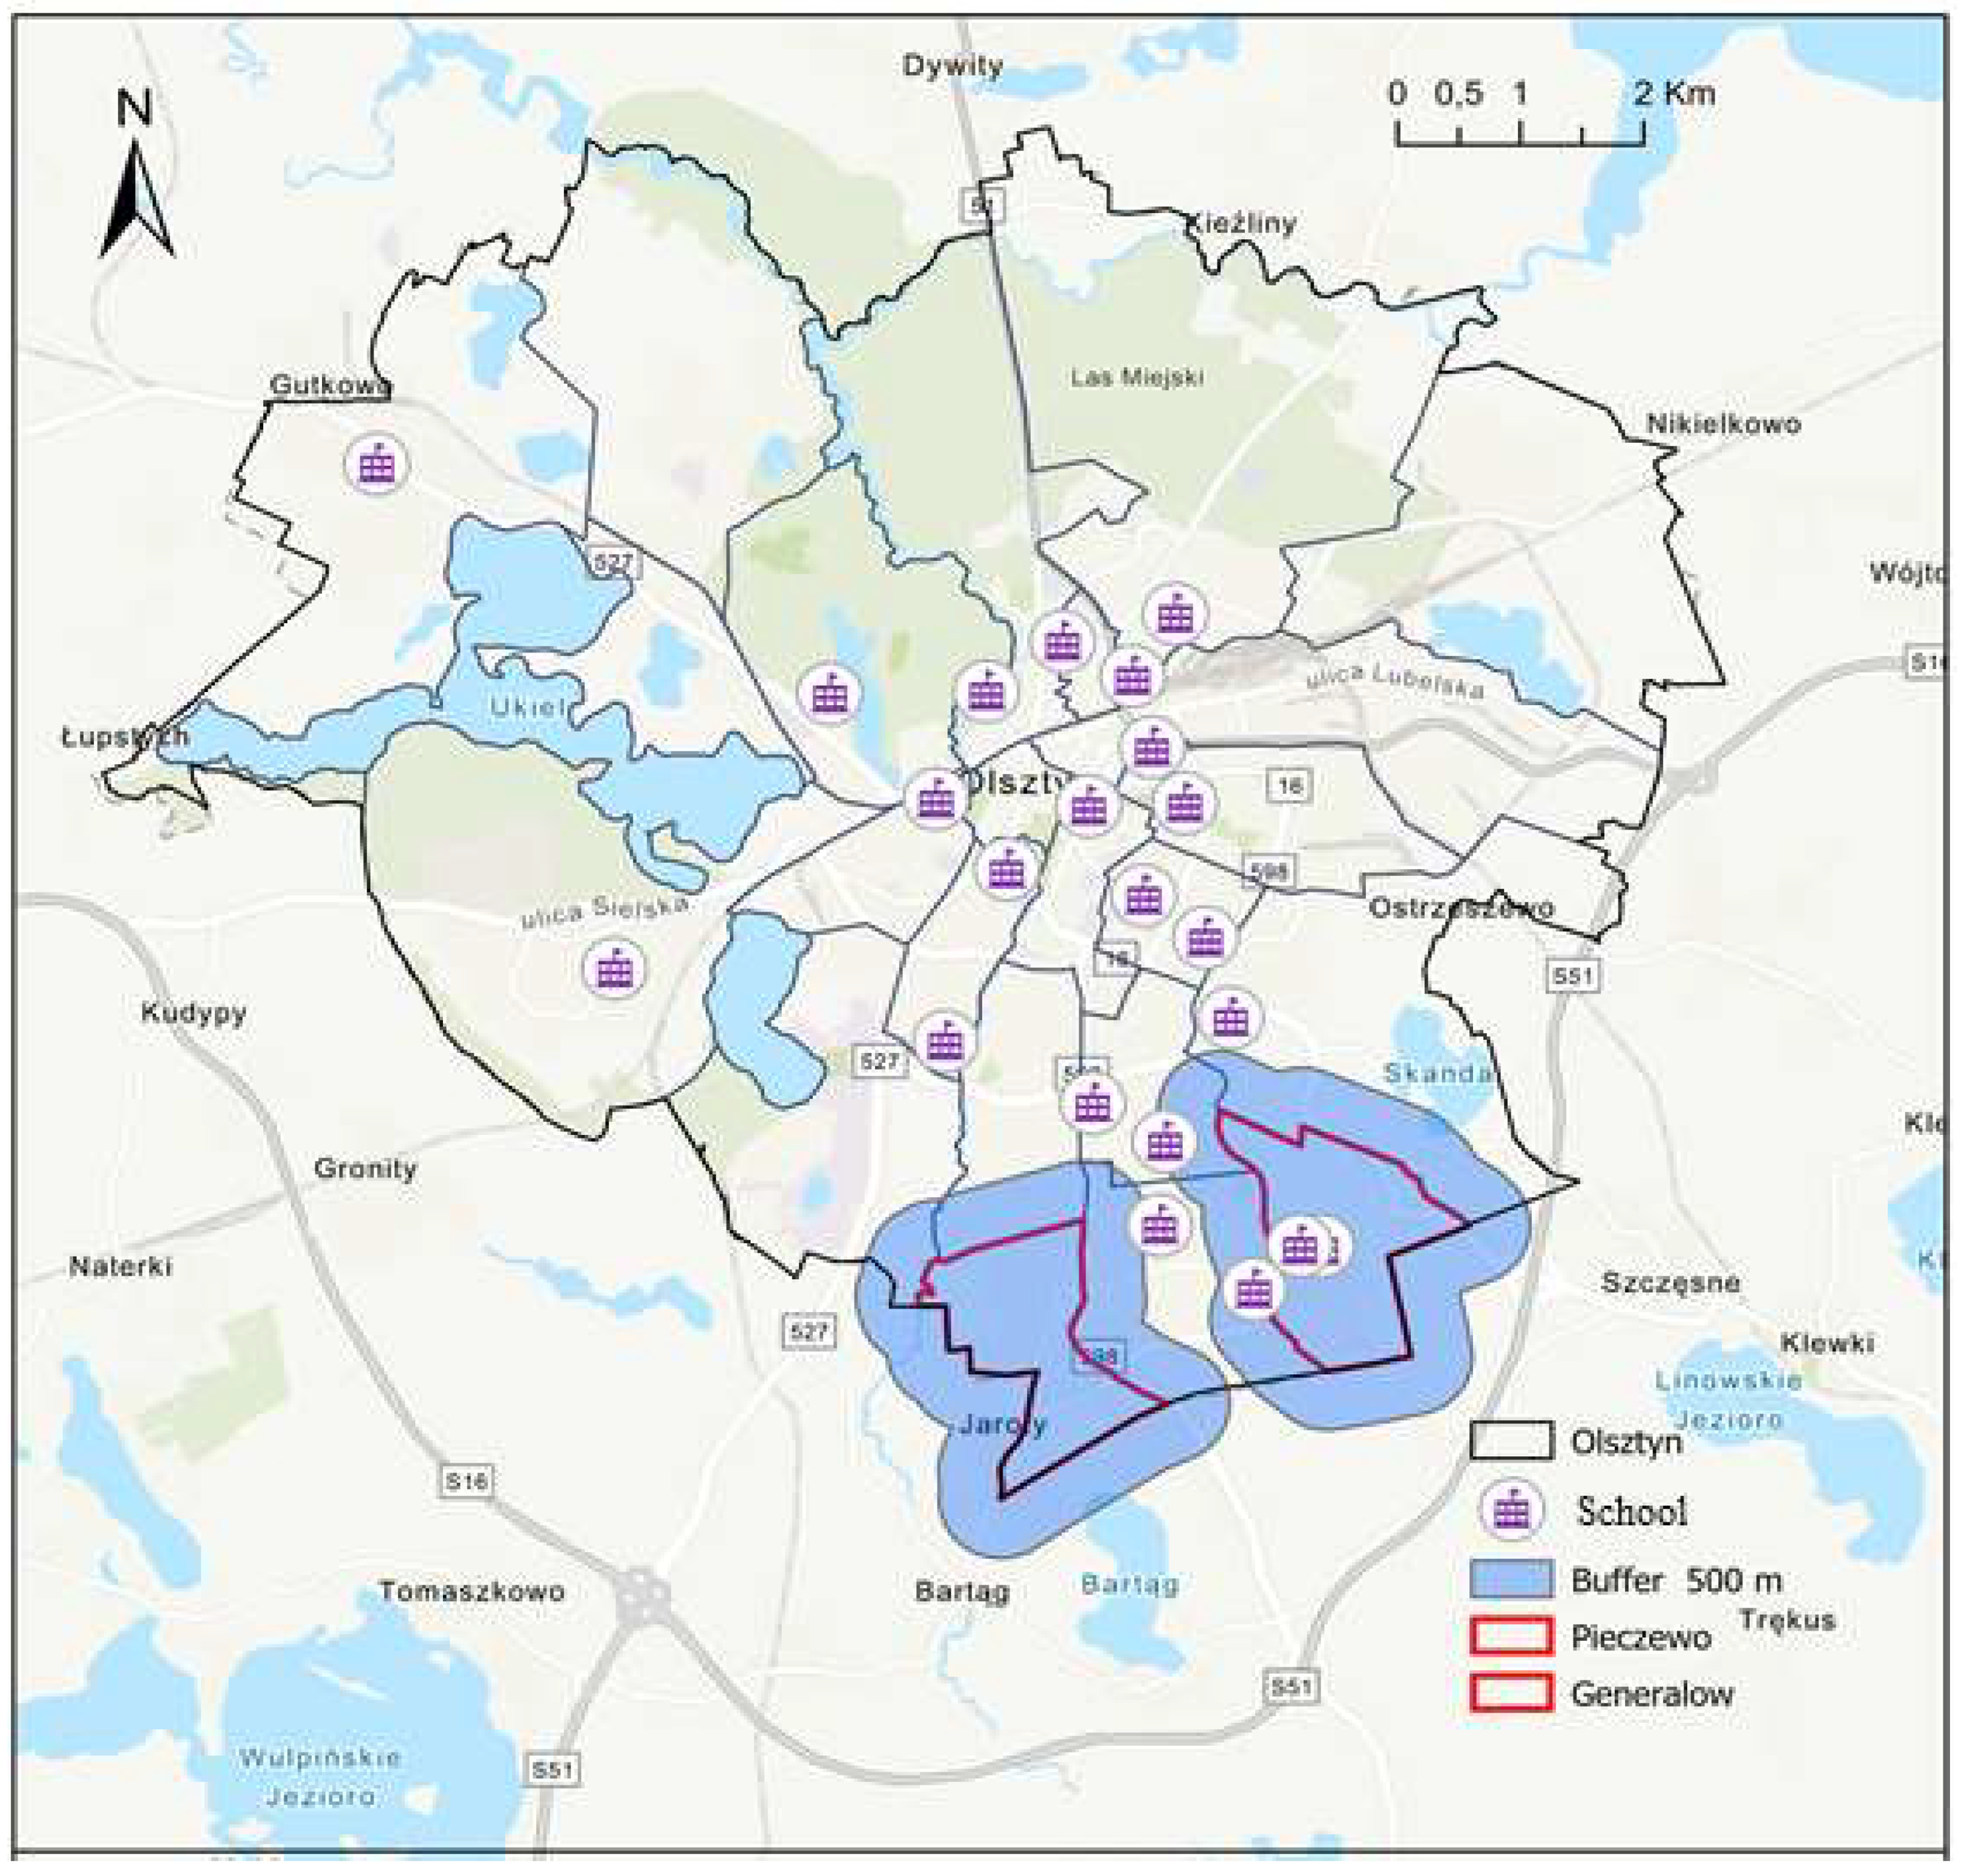
3.1. Study Area
- (1)
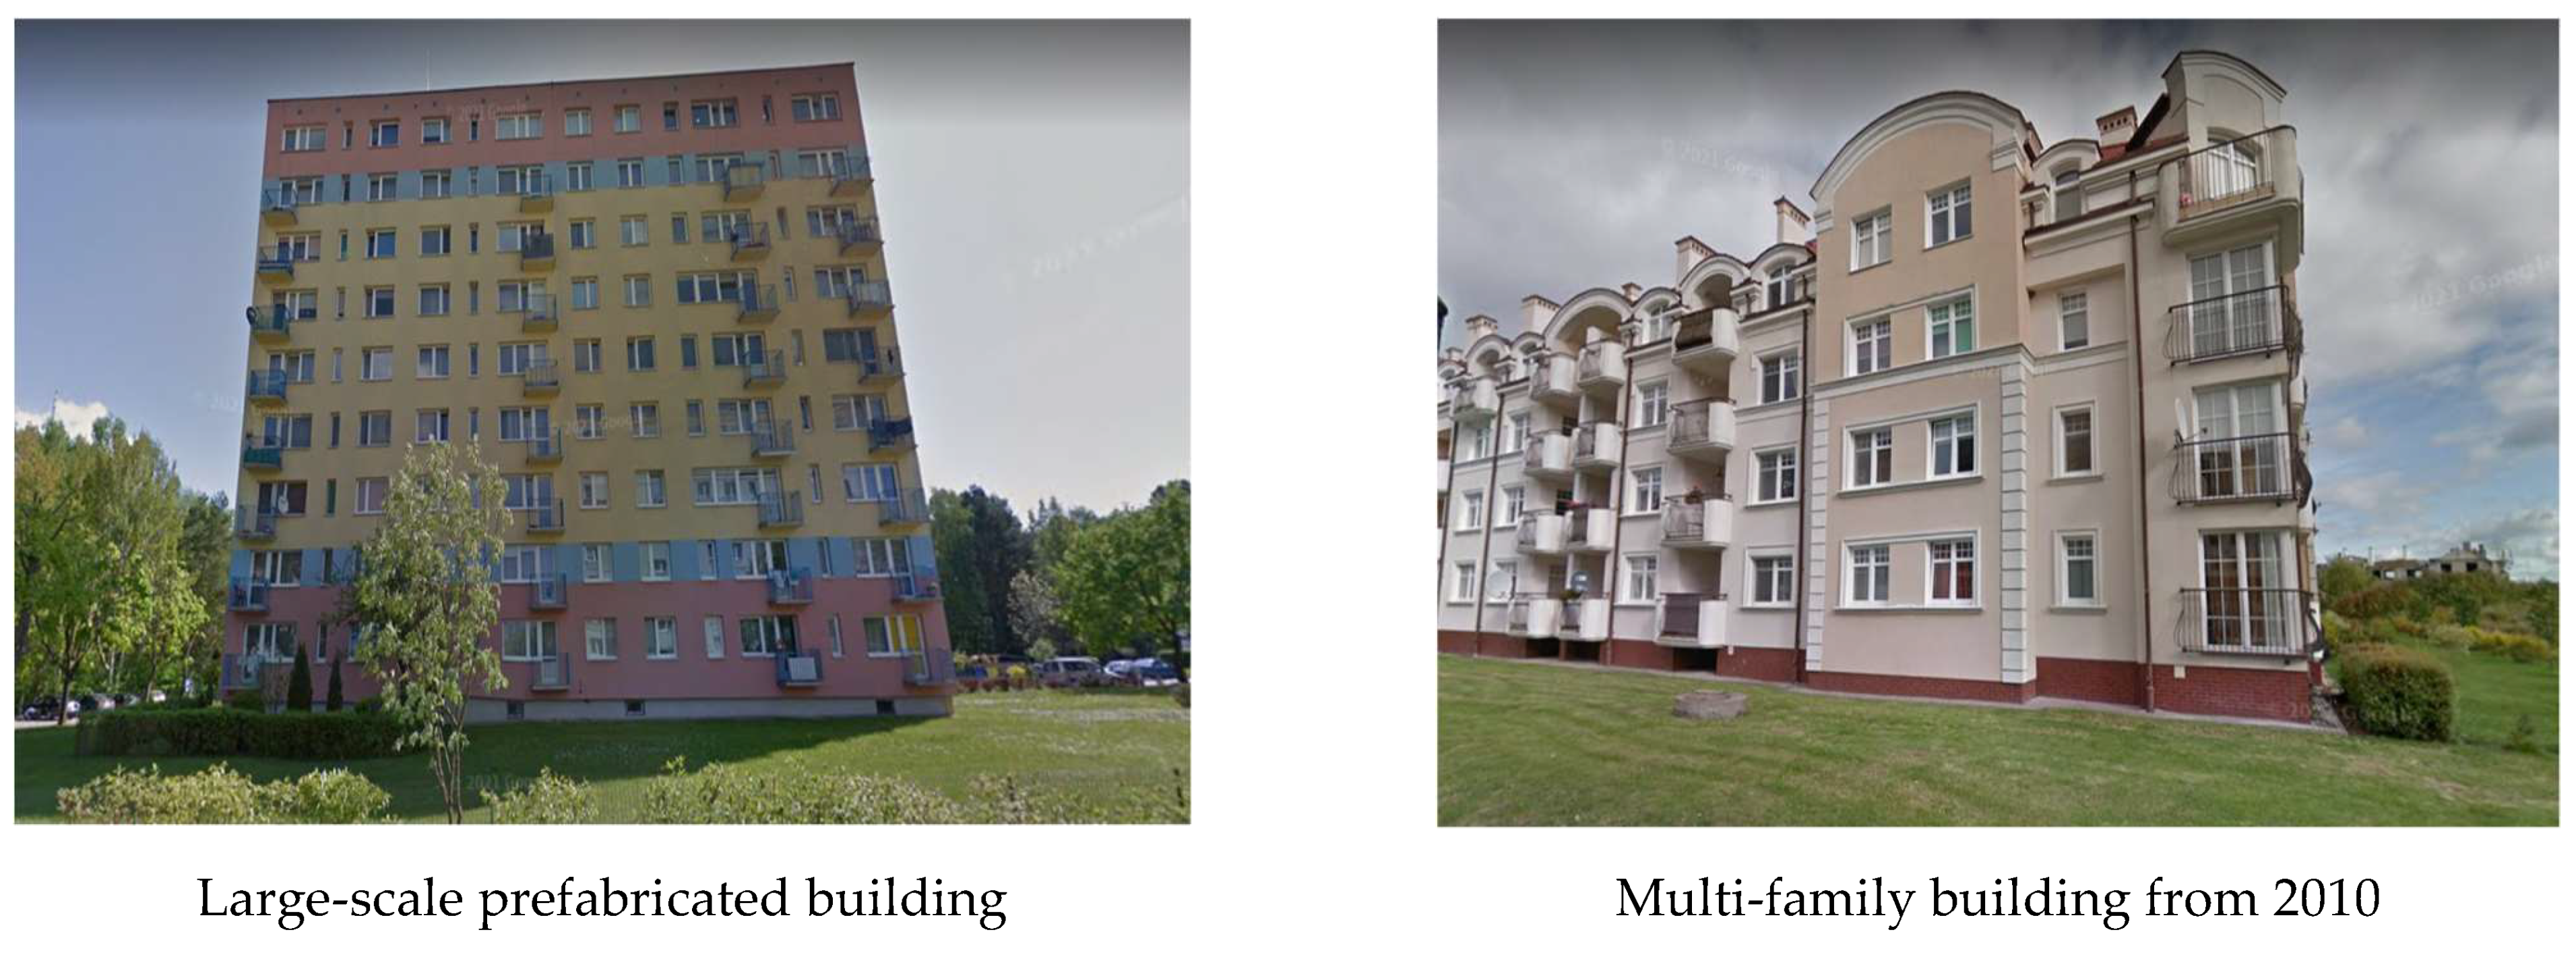
- multi-family residential estates (MFREs) developed before the introduction of precast construction technology (oldest buildings),
- (2)
- large prefabricated housing estates (LPHEs),
- (3)
- residential estates comprising single-family homes,
- (4)
- MFREs and single-family homes developed in the last 15 years.
3.2. Preparation of the Survey Questionnaire
4. Results and Discussion
4.1. Generation of a List of SFS Indicators in Multi-Family Residential Estates
- Residential safety:
- (a)
- legible network of local roads and pedestrian routes,
- (b)
- parking spaces that meet local needs,
- (c)
- access to primary healthcare providers.
- Recreation and esthetics:
- (a)
- well-designed residential greenery,
- (b)
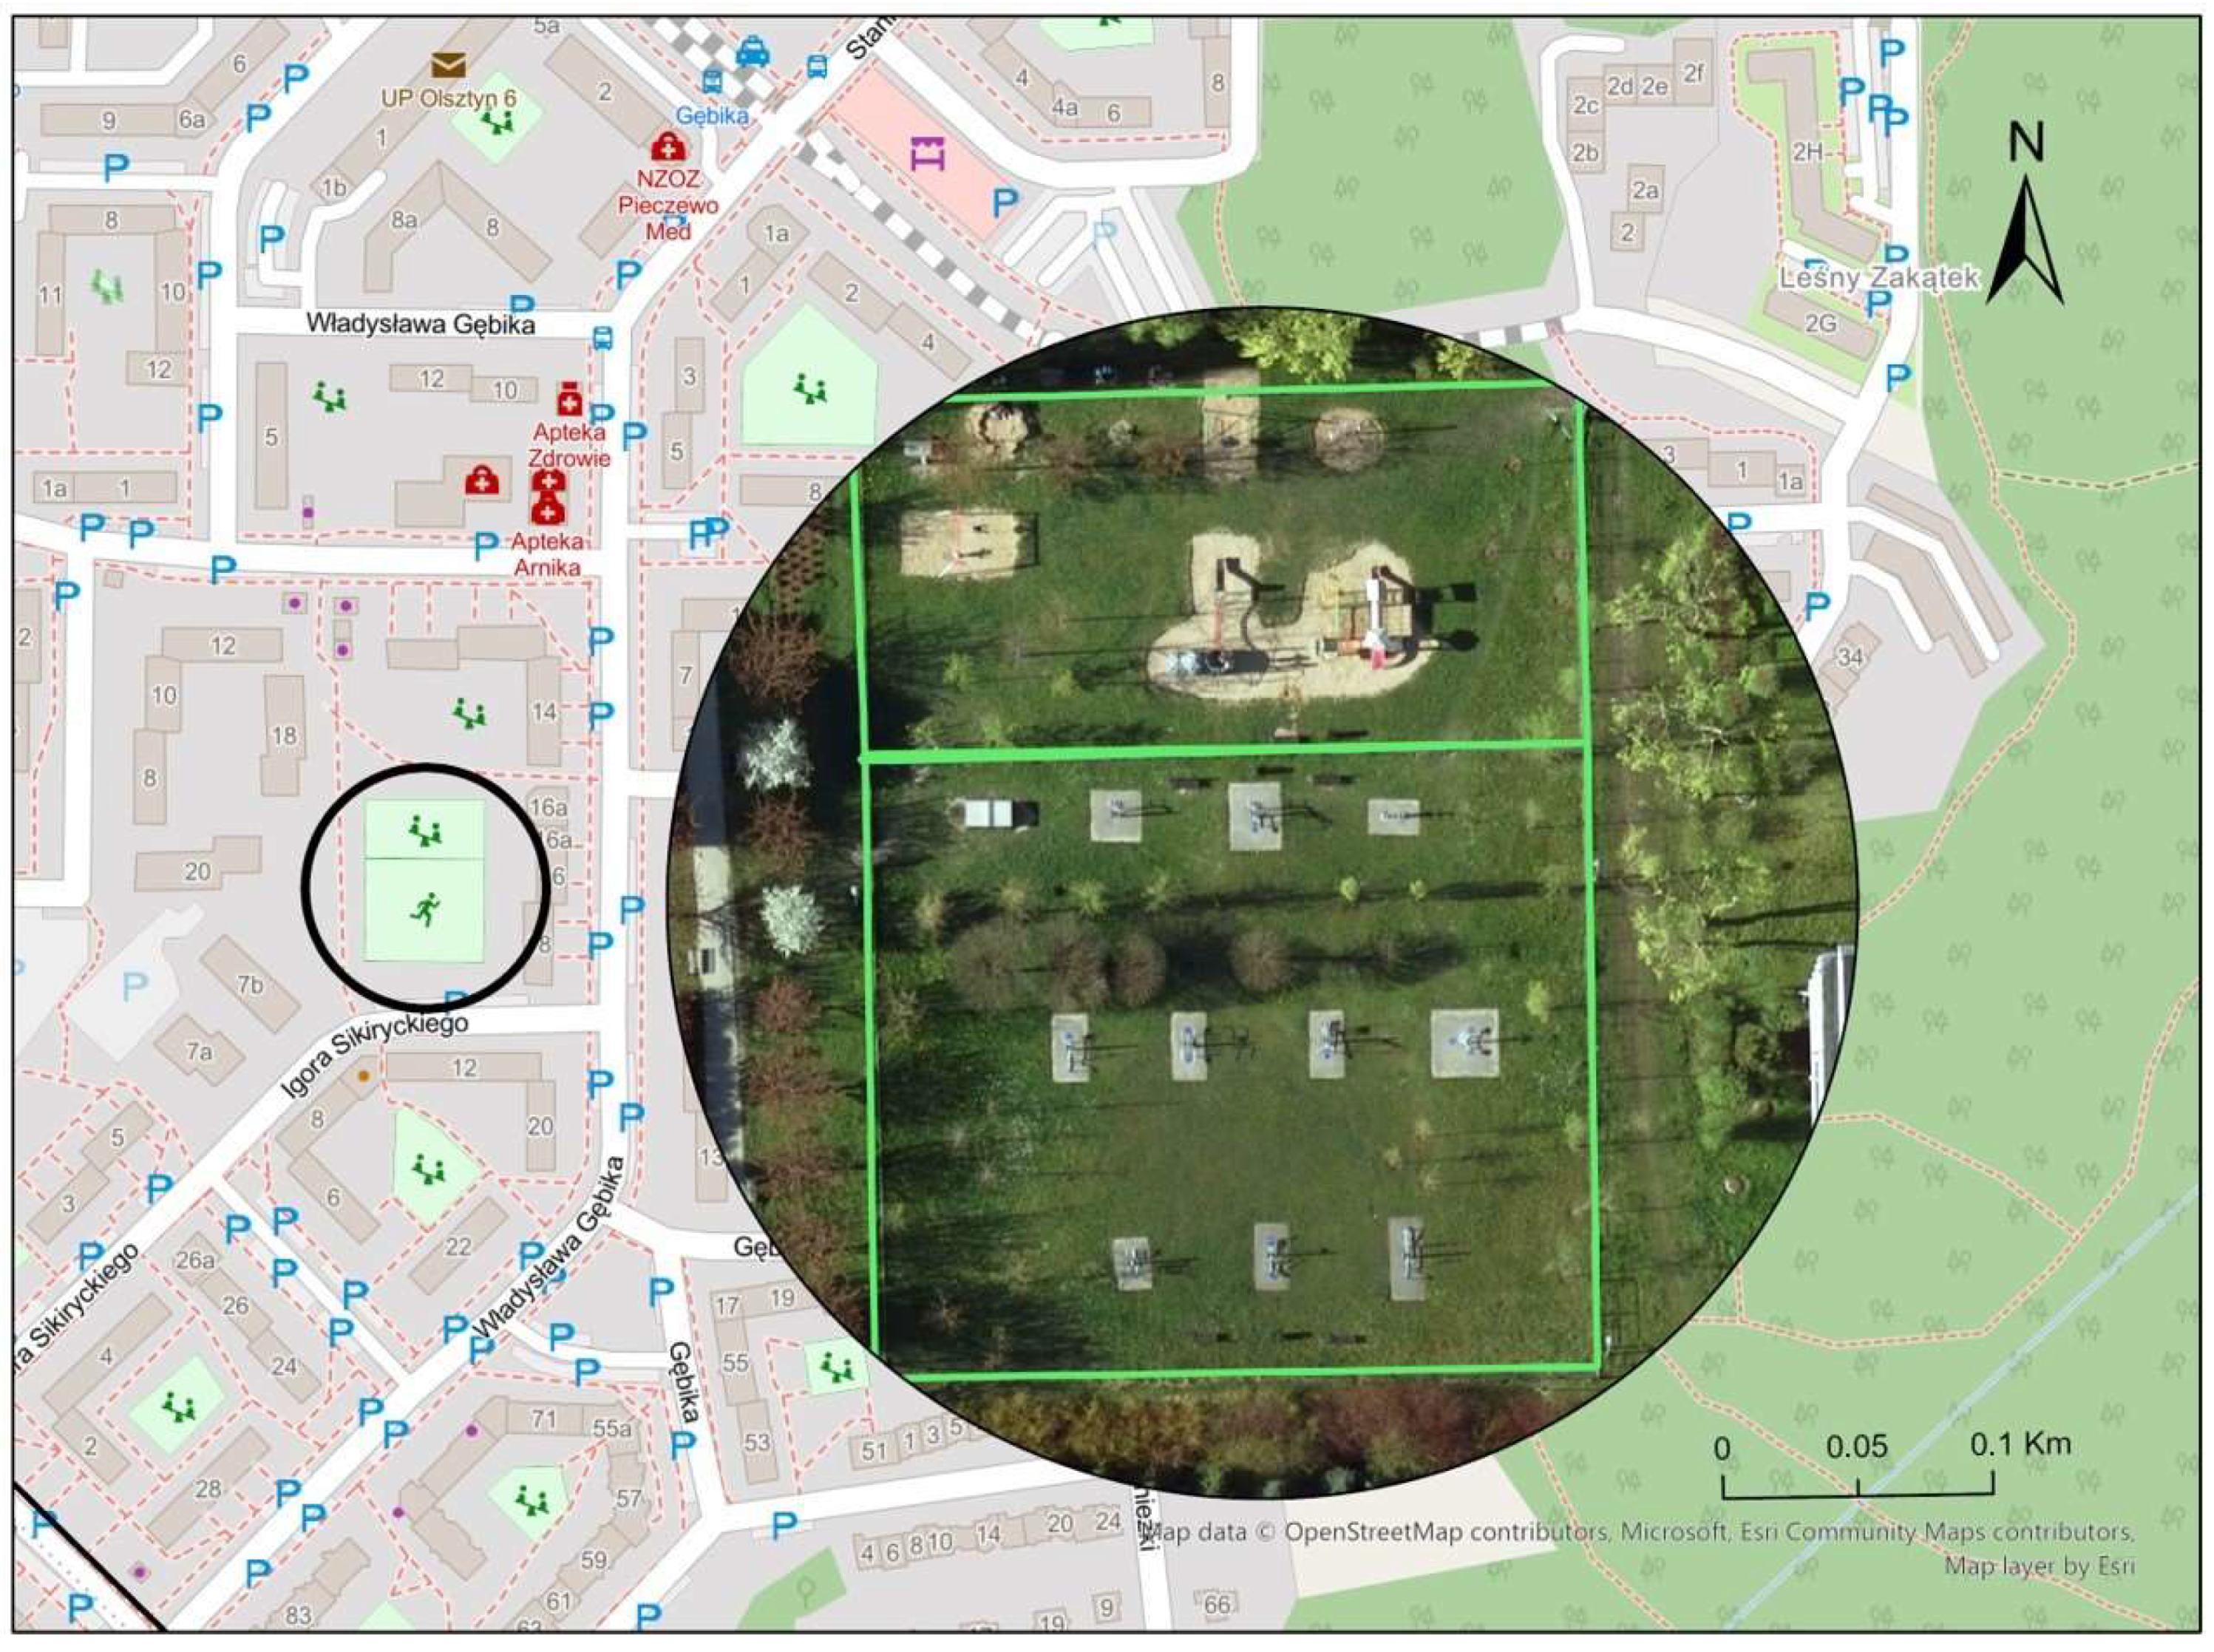
- playgrounds and active recreation sites.
- Daily needs:
- (a)
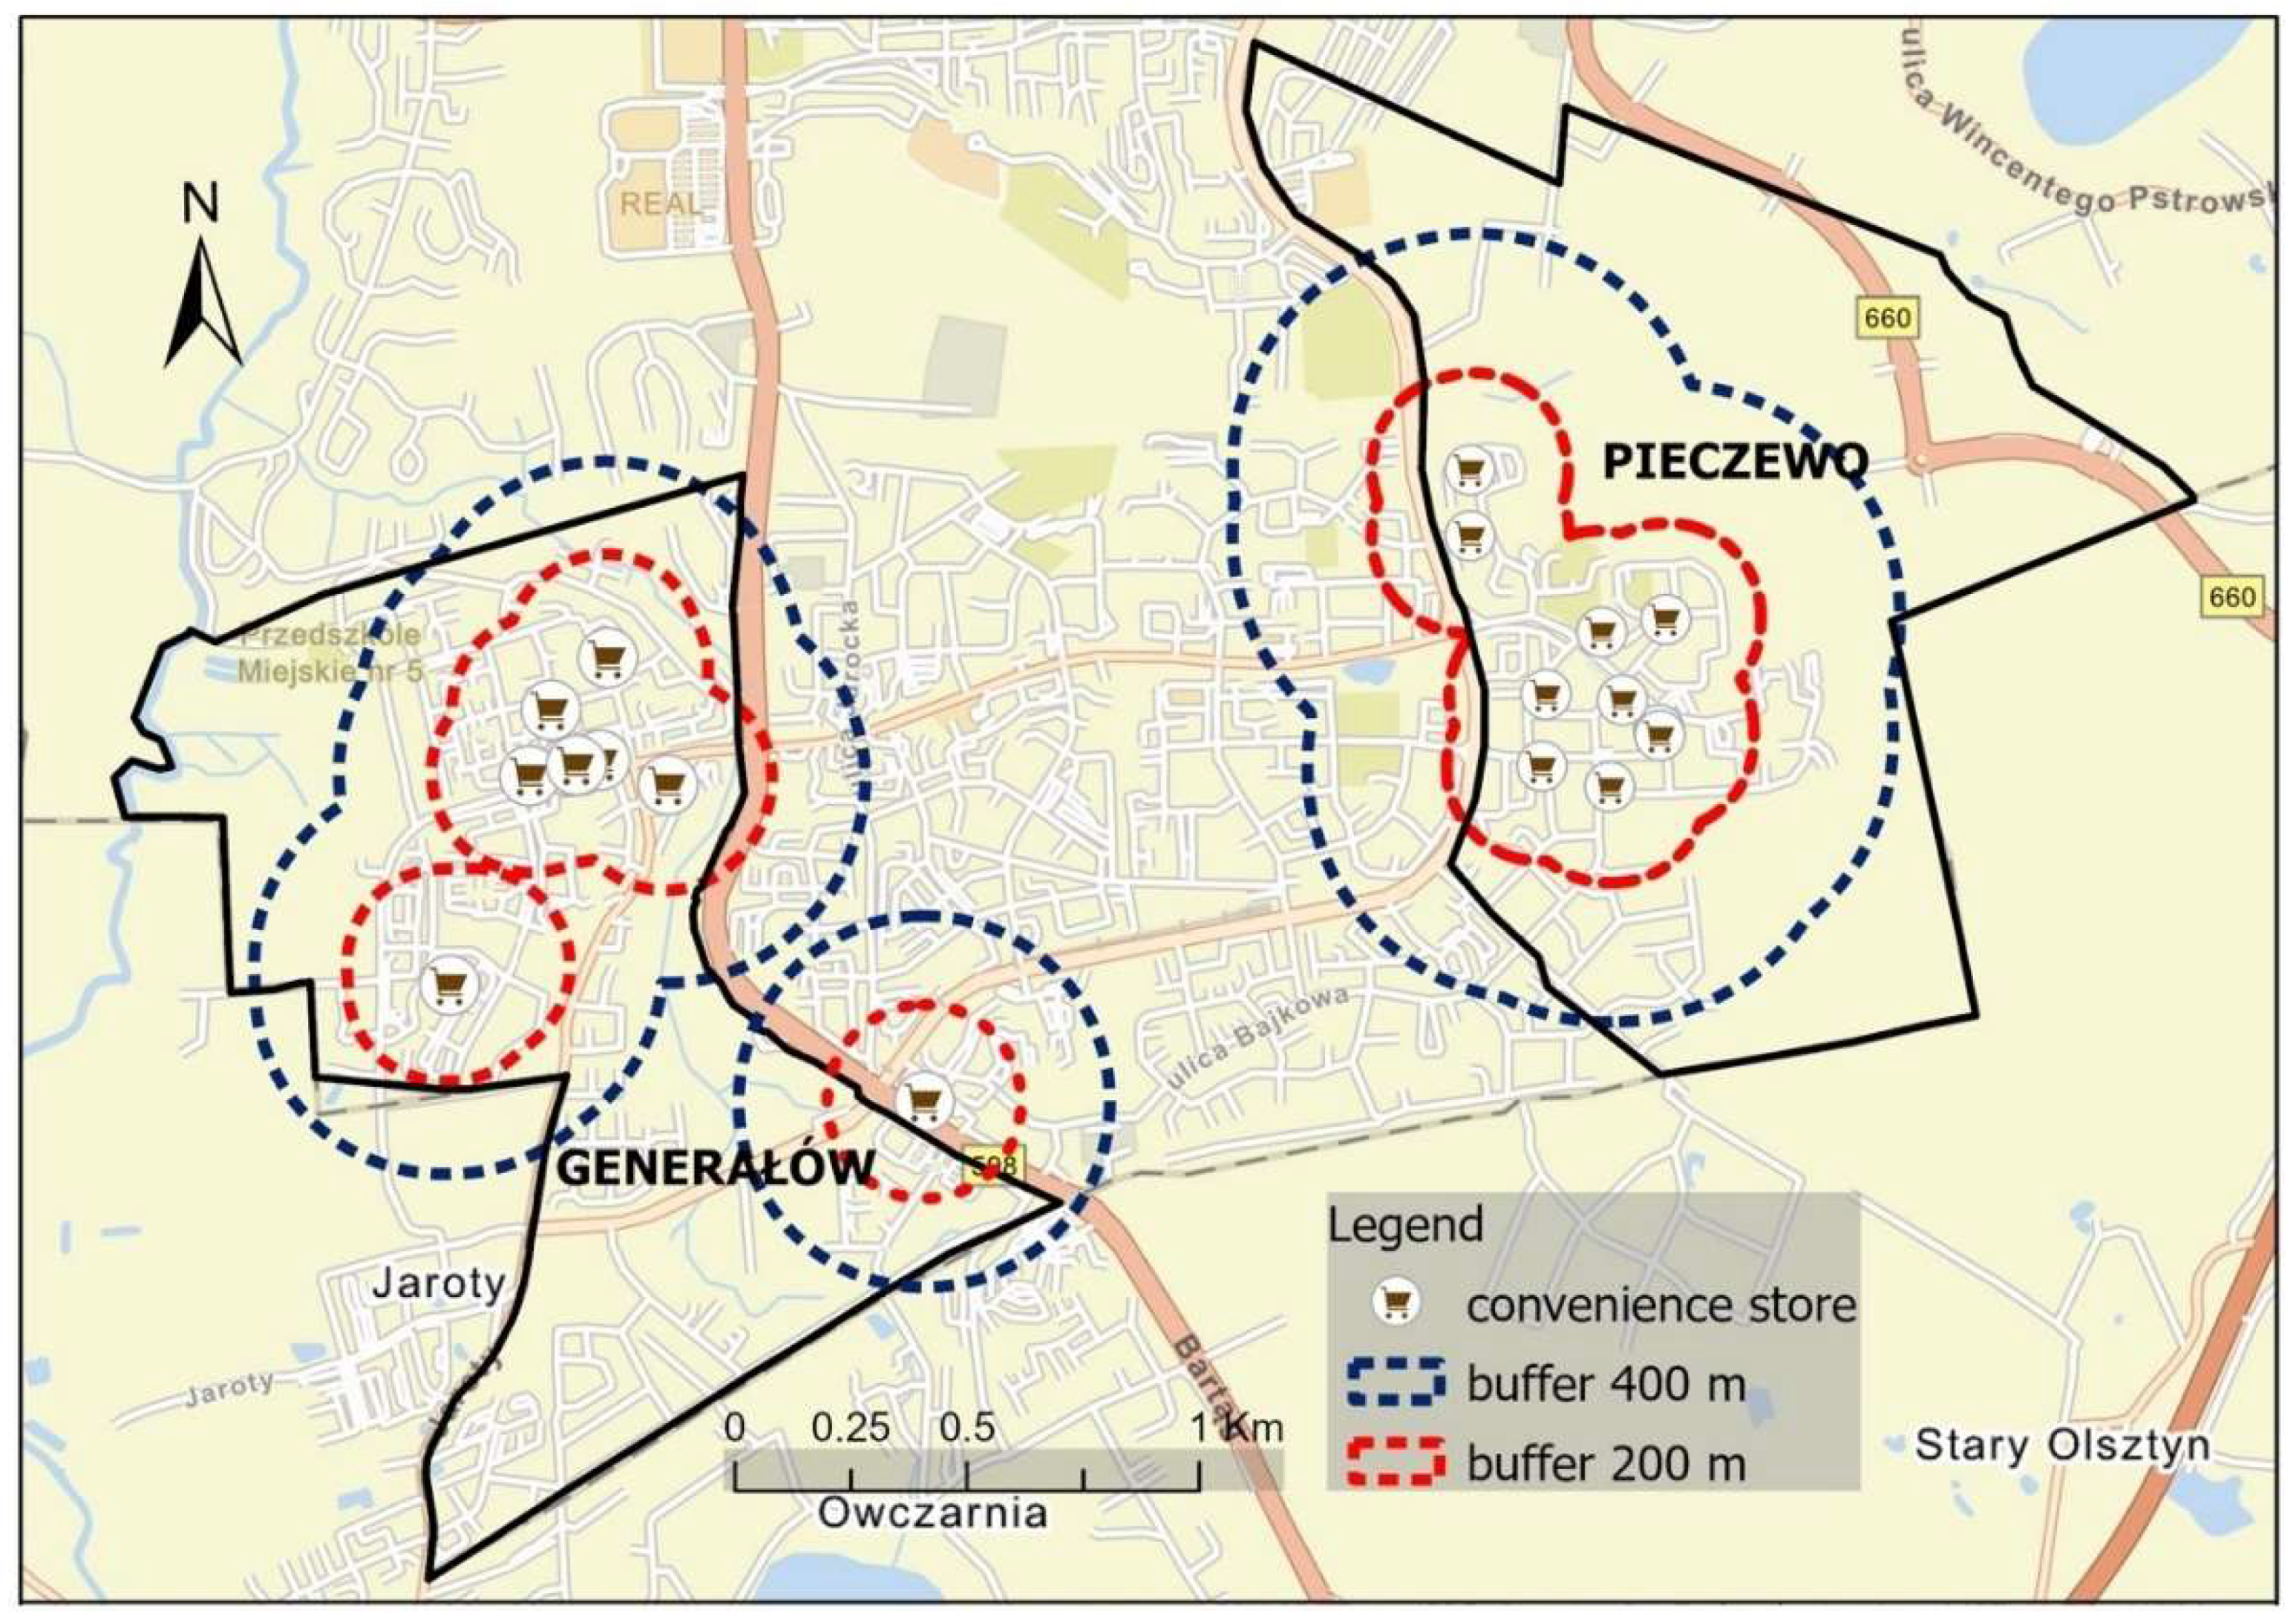
- proximity of grocery stores, fruit and vegetable stores, bakeries,
- (b)
- proximity to pharmacies.
- Education and child care:
- (a)
- proximity of kindergartens,
- (b)
- proximity of primary schools.
4.2. Survey of Residents’ Needs Regarding SFS
4.3. SFS Indicators
- One disabled parking bay in a parking lot with 6–15 spaces,
- Two disabled parking bays in a parking lot with 16–40 spaces,
- Three disabled parking bays in a parking lot with 41–100 spaces,
- 4% in parking lots with more than 100 spaces.
4.4. Test of GIS Tools for Diagnosing SFS in Selected MFREs
4.5. Assessment of SFS in Multi-Family Residential Estates
5. Conclusions
Author Contributions
Funding
Institutional Review Board Statement
Informed Consent Statement
Data Availability Statement
Conflicts of Interest
References
- Desa, U.N. Transforming Our World: The 2030 Agenda for Sustainable Development. A/RES/70/1 United Nation Publication. 2016. Available online: https://stg-wedocs.unep.org/bitstream/handle/20.500.11822/11125/unepswiosm1inf7sdg.pdf?sequence=1 (accessed on 12 January 2022).
- World Health Organization. Global Age-Friendly Cities: A Guide; World Health Organization: Geneva, Switzerland, 2007.
- Bradecki, T.; Twardoch, A. Contemporary Directions of Residential Development; Wydawnictwo Politechniki Śląskiej: Gliwice, Poland, 2013. (In Polish) [Google Scholar]
- EUROSTAT. 2020. Available online: https://ec.europa.eu/eurostat/statistics-explained/index.php?title=Housing_statistics/ pl&oldid=498750 (accessed on 24 August 2020).
- Kabisch, S.; Grossmann, K. Challenges for large housing estates in light of population decline and ageing: Results of a long-term survey in East Germany. Habitat Int. 2013, 39, 232–239. [Google Scholar] [CrossRef]
- Chmielewski, J.M. Urban Planning Theory: Selected Issues; Oficyna Wydawnicza Politechniki Warszawskiej: Gliwice, Poland, 1996. (In Polish) [Google Scholar]
- Faron, A. Selected factors of the city’s functional-spatial structure, the shaping of which may affect the transport behavior of residents. Logistyka 2014, 3, 1666–1675. (In Polish) [Google Scholar]
- McCoy, A.P.; Koebel, C.T.; Sanderford, A.R.; Franck, C.T.; Keefe, M.J. Adoption of high-performance housing technologies among US homebuilding firms, 2000 through 2010. Cityscape 2015, 17, 167–188. [Google Scholar]
- Gusmao Brissi, S.; Debs, L.; Elwakil, E. A Review on the Factors Affecting the Use of Offsite Construction in Multifamily Housing in the United States. Buildings 2020, 11, 5. [Google Scholar] [CrossRef]
- Lee, H.-J.; Carucci Goss, R.; Beamish, J.O. Influence of lifestyle on housing preferences of multifamily housing residents. Hous. Soc. 2007, 34, 11–30. [Google Scholar] [CrossRef][Green Version]
- Roldan, H. Multifamily Housing. In Independent for Life: Homes and Neighborhoods for an Aging America; Henry, C., Margaret, D.-C., Jane, H., Eds.; University of Texas Press: Austin, TX, USA, 2021; pp. 133–138. [Google Scholar]
- Wolny, A.; Dawidowicz, A.; Zróbek, R. Identification of the spatial causes of urban sprawl with the use of land information systems and GIS tools. Bull. Geogr. Socio-Econ. Ser. 2017, 35, 111. [Google Scholar] [CrossRef]
- Raczyński, M. The development process of multi-family housing and the influence of sustainable development theory. Przestrz. Forma 2019, 109–130. [Google Scholar] [CrossRef]
- Podciborski, T.; Orzoł, R. Development of a method for assessing the state of the spatial order of multifamily housing estate. Acta Sci. Pol. Adm. Locorum 2012, 11, 4. (In Polish) [Google Scholar]
- Winston, N. Multifamily housing and resident life satisfaction in Europe: An exploratory analysis. Hous. Stud. 2017, 32, 887–911. [Google Scholar] [CrossRef]
- Zwierzchowska, I.; Haase, D.; Dushkova, D. Discovering the environmental potential of multi-family residential areas for nature-based solutions. A Central European cities perspective. Landsc. Urban Plan. 2021, 206, 103975. [Google Scholar] [CrossRef]
- Lis, A. Exploring social space features in residential settings. Methodological proposals. Archit. Kraj. 2010, 3, 4–13. (In Polish) [Google Scholar]
- Karcz, S. Trends in the formation of newly built housing estates in Europe, Poland and Lodz. Space Soc. Econ. 2018, 26, 117–137. (In Polish) [Google Scholar] [CrossRef][Green Version]
- Kondić, S.; Živković, M.; Tanić, M.; Kostić, I. Sustainability of post-socialist urban design treatment of public open spaces in multi-family housing areas: Case study of Niš, Serbia. Facta Univ. Ser. Archit. Civ. Eng. 2021, 19, 155–169. [Google Scholar] [CrossRef]
- Vela, I.Y. The contribution of greenery in multi-family houses as a factor of well-being. In Landscape, Well-Being and Environment; Routledge: Abingdon-on-Thames, UK, 2013; pp. 101–122. [Google Scholar]
- Brown, F.; Neary, S.; Symes, M. Reading the residential landscape. In The Urban Experience; Routledge: Abingdon-on-Thames, UK, 2003; pp. 188–216. [Google Scholar]
- Shan, X.; Wang, Y.; Dong, M.; Xia, J. Application Research and Analysis of Geographic Information System in Intelligent City Surveying and Mappinge. J. Phys. Conf. Ser. 2021, 1881, 042071. [Google Scholar] [CrossRef]
- Dawidowicz, A.; Muczynski, A.; Pacholczyk, M.E. The use of GIS tools for sustainable management of municipal housing stock in Poland. Surv. Rev. 2019, 51, 431–441. [Google Scholar] [CrossRef]
- Grigsby, W.G.; Rosenburg, L. Urban Housing Policy; Routledge: Abingdon-on-Thames, UK, 2017. [Google Scholar]
- Directive INSPIRE. Directive 2007/2/EC of the European Parliament and of the Council of 14 March 2007 establishing an Infrastructure for Spatial Information in the European Community (INSPIRE). Off. J. 2007, 43, 233. Available online: https://inspire.ec.europa.eu/documents/Data_Specifications/INSPIRE_DataSpecification_US_v3.0rc3.pdf (accessed on 20 March 2022).
- Temelova, J.; Novak, J.; Ourednicek, M.; Puldova, P. Housing Estates in the Czech Republic after Socialism: Various Trajectories and Inner Differentiation. Urban Stud. 2011, 48, 1811–1834. [Google Scholar] [CrossRef]
- Vasilevska, L.; Vranic, P.; Marinkovic, A. The effects of changes to the post-socialist urban planning framework on public open spaces in multi-story housing areas: A view from Nis, Serbia. Cities 2014, 36, 83–92. [Google Scholar] [CrossRef]
- Kovács, Z.; Herfert, G. Development pathways of large housing estates in post-socialist cities: An international comparison. Hous. Stud. 2012, 27, 324–342. [Google Scholar] [CrossRef]
- Kolisz, K.; Kłosak, A.K.; Bucka, A.; Ziarko, B. Possibilities of revitalizing the spatial system of a housing complex with large-panel buildings on the example of the “Ruczaj-Zaborze” housing estate in Kraków. Przegląd Bud. 2015, 86, 43–47. (In Polish) [Google Scholar]
- Szafrańska, E. Transformations of large housing estates in post-socialist city: The case of Łódź, Poland. Przegląd Bud. 2015, 86, 77–93. [Google Scholar] [CrossRef]
- Kotus, J. Changes in the spatial structure of a large Polish city–The case of Poznań. Cities 2006, 23, 364–381. [Google Scholar] [CrossRef]
- Warchalska-Troll, A. How to measure susceptibility to degradation in large post-socialist housing estates? Prace Geogr. 2012, 130, 55–71. [Google Scholar] [CrossRef]
- Warchalska-Troll, A. Progress of rehabilitation of large housing estates in Katowice (Poland). Hung. Geogr. Bull. 2013, 62, 102–112. [Google Scholar]
- Łodziński, P. Selected problems of modernization of large-panel residential buildings on the example of Hellersdorf in Berlin. Archit. Artibus 2009, 1, 39–43. (In Polish) [Google Scholar]
- Vasilevska, L.; Zivkovic, J.; Vasilevska, M.; Lalovic, K. Revealing the relationship between city size and spatial transformation of large housing estates in post-socialist Serbia. J. Hous. Built Environ. 2020, 35, 1099–1121. [Google Scholar] [CrossRef]
- Kährik, A.; Tammaru, T. Soviet prefabricated panel housing estates: Areas of continued social mix or decline? The case of Tallinn. Hous. Stud. 2010, 25, 201–219. [Google Scholar] [CrossRef]
- Bouzarovski, S.; Salukvadze, J.; Gentile, M. A socially resilient urban transition? The contested landscapes of apartment building extensions in two post-communist cities. Urban Stud. 2011, 48, 2689–2714. [Google Scholar] [CrossRef]
- Hirt, S. Belgrade, Serbia. Cities 2009, 26, 293–303. [Google Scholar] [CrossRef]
- Hess, D.B.; Tammaru, T.; van Ham, M. Housing Estates in Europe Poverty, Ethnic Segregation and Policy Challenges Preface. In Housing Estates in Europe: Poverty, Ethnic Segregation and Policy Challenges; Hess, D.B., Tammaru, T., VanHam, M., Eds.; Urban Book Series; Springer Nature: Berlin/Heidelberg, Germany, 2018; p. 429. [Google Scholar]
- Jura, J. Improvement of energy and ecological parameters of a multi-family building in order to meet WT 2021 requirements. Bud. Zoptymalizowanym Potencjale Energetycznym 2018, 7, 15–22. (In Polish) [Google Scholar] [CrossRef]
- Goczyńska, E. Repetition versus individuality in architecture. Tech. Issues 2016, 3, 29–35. (In Polish) [Google Scholar]
- van Kempen, R.; Murie, A.; Knorr-Siedow, T.; Tosics, I. Regenerating Large Housing Estates in Europe: A Guide to Better Practice; Urban and Regional Research Centre: Utrecht, The Netherlands, 2006. [Google Scholar]
- Chaberko, T.; Kretowicz, P. New multi-family housing in the area of large housing estates on the example of Nowa Huta. Space Soc. Econ. 2012, 11, 197–209. (In Polish) [Google Scholar]
- Śleszyński, P. Socio-economic effects of spatial chaos on settlement and the functional structure of land. Studia KPZK 2018, 182, 1–52. (In Polish) [Google Scholar]
- Kuźnik, F.; Klasik, A. Spatial management in urban areas. Analysis of spatial chaos phenomena. Studia KPZK 2017, 174, 1–22. (In Polish) [Google Scholar]
- Gwiazdzinska-Goraj, M.; Pawlewicz, K.; Jezierska-Thole, A. Differences in the Quantitative Demographic Potential-A Comparative Study of Polish-German and Polish-Lithuanian Transborder Regions. Sustainability 2020, 12, 9414. [Google Scholar] [CrossRef]
- Gwiaździńska-Goraj, M.; Jezierska-Thöle, A.; Dudzińska, M. Assessment of the Living Conditions in Polish and German Transborder Regions in the Context of Strengthening Territorial Cohesion in the European Union: Competitiveness or Complementation? Soc. Indic. Res. 2022, 1–31. [Google Scholar] [CrossRef]
- Bradecki, T. Planning a compact city on the examples of competition urban designs: The case of Stargard Szczeciński Giżynek district. Studia Miej. 2015, 19, 47–57. (In Polish) [Google Scholar]
- Benkő, M. Evaluating factors in the image of housing estates. Period. Polytech. Archit. 2012, 43, 33–36. [Google Scholar] [CrossRef]
- Lis, C.; Woźniak, M. The use of taxonomic methods in assessing housing attractiveness of Szczecin’s housing estates. Zesz. Nauk. Uniw. Szczecińskiego. Studia Pr. Wydziału Nauk. Ekon. Zarządzania 2014, 36, 331–345. (In Polish) [Google Scholar]
- Garcia-Perez, S.; Oliveira, V.; Monclus, J.; Medina, C.D. UR-Hesp: A methodological approach for a diagnosis on the quality of open spaces in mass housing estates. Cities 2020, 103, 102657. [Google Scholar] [CrossRef]
- Kim, S.-S.; Yang, I.-H.; Yeo, M.-S.; Kim, K.-W. Development of a housing performance evaluation model for multi-family residential buildings in Korea. Build. Environ. 2005, 40, 1103–1116. [Google Scholar] [CrossRef]
- Majerska-Pałubicka, B. Attempts to optimize methods of sustainable architectural design. Architectus 2014, 2, 15–27. [Google Scholar]
- Johnson, T.P. Snowball sampling: Introduction. In Wiley StatsRef: Statistics Reference Online; Wiley: Hoboken, NJ, USA, 2014. [Google Scholar]
- Dijkstra, L.; Poelman, H.; Veneri, P. The EU-OECD Definition of a Functional Urban Area. 2019. Available online: https://www.oecd-ilibrary.org/docserver/d58cb34d-en.pdf?expires=1653683343&id=id&accname=guest&checksum=F311B377D86BDE615D84B6AE966F5A04 (accessed on 10 March 2022).
- GUS. BDL. Central Statistical Office. Local Data Bank. Available online: https://bdl.stat.gov.pl/bdl/start (accessed on 20 January 2022).
- MPRO Olsztyn, 2020. Olsztyn Urban Revitalization Program to 2020 (In Polish: Miejski Program Rewitalizacji Olsztyna do 2020 r.). Available online: http://bip.olsztyn.eu/bip/dokument/321755/xxiv_345_16_w_sprawie_przyjecia_miejskiego_programu_rewitalizacji_olsztyna_2020_r_//&cspg_page=1 (accessed on 20 January 2022).
- Act. 2003. Act of 27 March 2003 on Spatial Planning and Development. Polish Chancellery of the Sejm, (In Polish: Ustawa z Dnia 27 Marca 2003 Roku o Planowaniu i Zagospodarowaniu Przestrzennym Dz. U. z 2021 r. Poz. 741 z Późn. zm.) 2003. Available online: https://isap.sejm.gov.pl/isap.nsf/download.xsp/WDU20030800717/U/D20030717Lj.pdf (accessed on 15 February 2022).
- Act of July 7, 1994, Construction Law. (J. Laws 2021.2351), Polish Chancellery of the Sejm, (In Polish: Ustawa z Dnia 7 Lipca 2007 roku Prawo Budowlane), 1994. Available online: https://isap.sejm.gov.pl/isap.nsf/download.xsp/WDU19940890414/U/D19940414Lj.pdf (accessed on 15 February 2022).
- CSO—Central Statistical Office. Poland in Numbers 2020 (In Polish: Polska w Liczbach 2020), Warszawa, 2020. Available online: https://stat.gov.pl/obszary-tematyczne/inne-opracowania/inne-opracowania-zbiorcze/polska-w-liczbach-2020,14,13.html (accessed on 14 February 2022).
- Bradecki, T. Spatial models of optimal residence. Pr. Nauk./Uniw. Ekon. w Katowicach 2019, 54–67. Available online: http://bazekon.icm.edu.pl/bazekon/element/bwmeta1.element.ekon-element-000171564595 (accessed on 15 February 2022).
- Dawidowicz, A.; Zysk, E.; Figurska, M.; Zrobek, S.; Kotnarowska, M. The methodology of identifying active aging places in the city—Practical application. Cities 2020, 98, 102575. [Google Scholar] [CrossRef]
- Prague Food Exchange. Why Do Poles Choose to Shop in Neighbourhood Stores? Available online: https://www.praskagieldaspozywcza.pl/dlaczego_polacy_wybieraja_zakupy_w_sklepach_osiedlowych/ (accessed on 5 February 2022). (In Polish).
- Hui, E.C.M.; Chau, C.K.; Pun, L.L.; Law, M.Y. Measuring the neighboring and environmental effects on residential property value: Using spatial weighting matrix. Build. Environ. 2007, 42, 2333–2343. [Google Scholar] [CrossRef]
- Cellmer, R.; Cichulska, A.B.; Bełej, M. The regional spatial diversity of housing prices and market activity–evidence from Poland. Acta Sci. Pol. Adm. Locorum 2021, 20, 5–18. [Google Scholar] [CrossRef]
- D’Acci, L. Quality of urban area, distance from city centre, and housing value. Case study on real estate values in Turin. Cities 2019, 91, 71–92. [Google Scholar] [CrossRef]
- Glaesener, M.-L.; Caruso, G. Neighborhood green and services diversity effects on land prices: Evidence from a multilevel hedonic analysis in Luxembourg. Landsc. Urban Plan. 2015, 143, 100–111. [Google Scholar] [CrossRef]
- PN-ISO 9836:2015-12; Building Characteristics in Construction. Determination and Calculation of Area and Volume Indices. ISO: Geneva, Switzerland, 2015. (In Polish)
- Faron, A. The effect of development intensity on public transport trip share-a modeling analysis. Zesz. Nauk. -Tech. Stowarzyszenia Inżynierów Tech. Komun. Krakowie. Ser. Mater. Konf. 2012, 1, 64–75. (In Polish) [Google Scholar]
- Vasilevska, L.; Vranić, P.; Vasilevska, M. Evaluating the Relationship between Urban Redevelopment of Large Housing Estates and Urban Green Space Based on GIS–MCDM Approach: Empirical Experience from Niš, Serbia. J. Urban Plan. Dev. 2022, 148, 5022005. [Google Scholar] [CrossRef]
- Joachimowicz, A.; Nieścioruk, K. Analiza rozkładu hałasu w przestrzeni osiedla im. A. Mickiewicza w Lublinie. Bud. I Archit. 2018, 17, 181–192. [Google Scholar] [CrossRef]
- Xue, C.; Ju, Y.; Li, S.; Zhou, Q.; Liu, Q. Research on accurate house price analysis by using GIS technology and transport accessibility: A case study of Xi’an, China. Symmetry 2020, 12, 1329. [Google Scholar] [CrossRef]
- Ike, F.; Esther, N. Health-Care Facilities Accessibility Analysis Using GIS: A case Study of Uyo Municipal South–Eastern Nigeria. Eur. J. Appl. Sci. 2022, 10, 313–323. [Google Scholar]
- Chung, Y.S.; Seo, D.; Kim, J. Price determinants and GIS analysis of the housing market in Vietnam: The cases of Ho Chi Minh City and Hanoi. Sustainability 2018, 10, 4720. [Google Scholar] [CrossRef]
- Dawidowicz, A.; Nowak, M.; Gross, M. Land administration system and geoportal service for the need of a fit-for-purpose national urban greenery management system (UGMS). The concept for the EU member state of Poland. Acta Sci. Pol. Adm. Locorum 2022, 21, 53–81. [Google Scholar] [CrossRef]
- Dawidowicz, A.; Skorupska, N. The development of chosen web mapping local service of land information infrastructure in the direction of Land Administration System Construction - a case study. Acta Sci. Pol. Adm. Locorum 2016, 15, 27–45. [Google Scholar]
- Kulawiak, M.; Dawidowicz, A.; Pacholczyk, M.E. Analysis of server-side and client-side Web-GIS data processing methods on the example of JTS and JSTS using open data from OSM and geoportal. Comput. Geosci. 2019, 129, 26–37. [Google Scholar] [CrossRef]
- European Automobile Manufacturers’ Association. ACEA Report. In Vehicles in Use Europe; 2022; Available online: https://www.acea.auto/publication/report-vehicles-in-use-europe-2022/ (accessed on 10 March 2022).
- Act of March 21, 1985 on Public Roads. J. Laws 2021. Item 1376, Polish Chancellery of the Sejm. (In Polish: Ustawa z Dnia 21 Marca 1985 o Drogach Publicznych). Available online: https://isap.sejm.gov.pl/isap.nsf/download.xsp/WDU19850140060/U/D19850060Lj.pdf (accessed on 15 March 2022).
- Regulation of the Minister of Infrastructure of 12 April 2002 on the Technical Conditions Technical Conditions to Be Met by Buildings and Their Location (In Polish: Rozporzadzenie Ministra Infrastrukturyz Dnia 12 Kwietnia 2002 r. w Sprawie Warunków Technicznych, Jakim Powinny Odpowiadać Budynki i Ich Usytuowanie. Dz. U. 2002, Nr 75, Poz. 690 z Późn. zm.). Available online: https://lexlege.pl/rozporzadzenie-ministra-infrastruktury-w-sprawie-warunkow-technicznych-jakim-powinny-odpowiadac-budynki-i-ich-usytuowanie/ (accessed on 15 March 2022).
- WebEwid Olsztyn Portal. Available online: https://webewid.olsztyn.eu/e-uslugi/portal-mapowy (accessed on 15 March 2022).
- OpenStreetMap. Available online: https://www.openstreetmap.org/#map=16/53.7414/20.5088 (accessed on 21 March 2022).
- MSIPMO Portal. Map Portal of the Olsztyn Spatial Information System. Available online: https://msipmo.olsztyn.eu/imap/ (accessed on 15 March 2022).
- NSDI Geoportal (Poland). National Spatial Data Infrastructure. Available online: https://mapy.geoportal.gov.pl/imap/Imgp_2.html?gpmap=gp0 (accessed on 16 January 2022).
- Passenger Information System—Bus Online Mobile Timetable of Administration of Roads, Greenery and Transport in Olsztyn. Available online: http://sip.zdzit.olsztyn.eu/ (accessed on 5 February 2022).
- Directive on energy efficiency. Directive 2012/27/EU of the European Parliament and of the Council of 25 October 2012 on energy efficiency, amending Directives 2009/125/EC and 2010/30/EU and repealing Directives 2004/8/EC and 2006/32. Off. J. L 2012, 315, 1–56. Available online: http://data.europa.eu/eli/dir/2012/27/oj (accessed on 10 February 2022).


| No. | Core Approaches | Indicators/Parameters | Data Sources | Case Study | Key Authors and References |
|---|---|---|---|---|---|
| 1 | Planning structure | Features of settlement development including: spatial composition, development intensity ratio, basic spatial objects serving human mobility, communication solutions, and ecological solutions in spatial planning. | Urban planning materials, cartographic materials, data from field survey. | Dublin/Ireland (Marianella Housing); Kolonia/Germany (Physikersiedlung); Madrid/Spain (Nuevo Retiro Torres Cañaveral); Poland/Katowice (Francuska Park); Kraków (Bagry Park); Warsaw (Nowy Targówek) | Bradecki T. [48]; Karcz S. [18] |
| 2 | Revitalization/modernization parameters |
| Data from field survey. | Katowice/Poland (Housing Estates: Witosa, Paderewskiego, Tysiąclecia) | Warchalska-Troll A. [32,33] |
| 3 | Esthetics (image) of the housing estate | Aesthetics of housing estate elements, visual assessment: facade color, decorative details, the composition of green areas around buildings, green terraces, distance from park areas, presence of recreational and leisure space. | Data from field survey, public opinion research, field research. | Manchester/England (Islington); Budapest/Hungary (Kelenfold and Havanna Housing Estates); Grenoble/France (Villeneuve Housing Estate); Rotterdam/The Netherlands (Lijnbaan Housing Estate) | Benkő M. [49] |
| 4 | Functionality of space | The function of a building or public space is related to daily use: transportation, housing, education, social infrastructure, retail, and services. | Cartographic materials; data from field surveys. | All housing estates in Szczecin/Poland | Lis C., Woźniak M. [50] |
| Diversification of the functional structure: green areas, activity space, neighborhood space (community space), building entrances and exits, traffic and parking management spaces, and senior-friendly spaces. | Cartographic materials; data from field surveys. | Research project RESTATE, an acronym for: "Restructuring Large-scale Housing Estates in European Cities: Good Practices and New Visions for Sustainable Neighbourhoods and Cities" (France, Germany, Hungary, Italy, the Netherlands, Poland, Slovenia, Spain, Sweden, and the UK), in 16 cities, and 29 estates in the period November 2002 to October 2005 | K. Dekker, S. Hall, R. van Kempen, and I. Tosics [42] | ||
| 5 | Environmental values |
| Cartographic materials; data from field surveys. | Berlin/Germany (Karl-Marx-Allee, Mehrower Allee, Marzahn); Poznań/Poland (B. Śmiałego, Piątkowo, Oświecenia, Rataje) | Zwierzchowska I., Haase D., Dushkova D. [16] |
| 6 | Public open spaces |
| Cartographic materials; data from field surveys. | Zurich/Switzerland (Pflegi Areal, Hegianwandweg) | Vela I.Y. [27] |
| Integration, permeability, local choice, functional mix, typology of in-between space, plot structures, density, building diversity, "eye-level" design. | Cartographic materials, data from field survey, public opinion research, field research. | Madrid, Barcelona, and Zaragoza/Spain (selected housing estates built in the post-war period, between 1960 and 1975—the boom years for European cities, where housing estates fulfilled the ideas of seriation and standardization) | Garcia-Perez S., Oliveira, V., Monclus J. [51] | ||
The indicators of POS quality are identified and analyzed as relevant:
| Cartographic materials, data from field surveys, field research. | Niš/Serbia (Josifa Pancica area, Dositeja Obradovica Area, Stanka Vlasotincanina Area, Stara zeleznicka kolonija–Rasadnik Area) | Kondić S., Živković M., Tanić M., Kostić I. [19] | ||
| 7 | Spatial order | Indicators of spatial order, i.e., sidewalks, children’s play facilities, internal roads, lawns, educational centers, trash garbage cans, lampposts, dumpsters, neighborhood stores, and building facades. | Cartographic materials; data from field surveys; field research. | Ostrów Mazowiecka/Poland (Selected housing estates) | Podciborski T., Orzoł R. [14] |
| 8 | Life quality indicators | Housing environment: Public transportation; amenities; green areas; pollution resource; possibility of natural disaster; land use landscaping. Housing function: Parking plan; dwelling unit plan; safety; convenience; security; adaptability. housing comfort: temperature and humidity; thermal insulation; noise; sound insulation; daylighting; artificial lighting; view; indoor air quality; ventilation. | Cartographic materials; sensor data; data from field surveys; field research. | The southern part of Seoul/Korea | Kim S.-S., Yang I.-H., Yeo M.-S., Kim K.-W. [52] |
| 9 | Sustainable development of multi-family housing estates | The basic design criteria resulting from a sustainable development paradigm include: CONTEXT OF PLACE:
| Provisions of applicable law regarding spatial planning, construction, technical conditions; urban planning, and architectural materials; data from field surveys. | Szczecin/Poland (Housing Estates: Nautica, Chabrowe, Pogodno) | Raczyński M. [13], Majerska-Pałubicka B. [53] |
| Statistics | Olsztyn | |
|---|---|---|
| Pieczewo (OWP) | Generałów | |
| Area (km2) | 2.24 | 1.95 |
| Population density per km2 | 4558 | 5217 |
| Population | 10,209 | 10,174 |
| Disabled persons per 1000 population | 2.05 | 2.44 |
| Category | Criteria | Indicator | Data Sources | Stages of Implementation |
|---|---|---|---|---|
| SFS outside the settlement (general location) | Distance to public facilities | City center | Google hybrid map | Viewing maps in QGIS 3.22.1, plug-in QuickMapServices determining distance buffers. Vectorization of analyzed objects. Completion in 3 h (hours). |
| Train station/airport | Google map | |||
| Cultural facilities (i.e., theater, philharmonic, museum) | Google map | |||
| Specialized health care facilities (i.e., hospitals, specialized health centers) | Google hybrid map | |||
| City/commune office, public administration | Google map, Municipal Spatial Information System of the City of Olsztyn (MSIPO—https://msipmo.olsztyn.eu/imap/ (accessed on 15 March 2022)) | Viewing maps in QGIS 3.22.1, plug-in QuickMapServices. Map generation from MSIPO portal (raster), map calibration, determination of distance buffers. Realization up to 5 h. | ||
| Recreational facilities with infrastructure (i.e., parks, water bodies, forests) | MSIPO (https://msipmo.olsztyn.eu/imap/ (accessed on 15 March 2022)) | |||
| Neighborhood function (function of land use adjacent to the housing estate) | Type of function | Database of topographic objects (BDOT10k—Geoportal) | Vector data downloaded from the geoportal (separately for city and county, 2 packages zipped) SHP format, buffering. Implementation up to 4 h. | |
| Planning parameters | Built-up area of residential buildings | BDOT10k—Geoportal, MSIPO, WebEWID, OSM | Analysis of SHP vector data from OSM obtained with Quick OSM plug-in for QGIS, verification of building location data with map generation from WebEWID (raster), map calibration. Realization 6 h. | |
| SFS inside the settlement (detailed location) | Planning parameters Communication | Building intensity including storeys | BDOT10k—Geoportal, MSIPO, WebEWID | Analysis of SHP data from point above, building floors obtained from BDOT 10 k layer description. Implementation 3 h. |
| View opening of the buildings | Geoportal 3D, high-resolution orthophoto map (Geoportal) | Analysis on SHP vector data from OSM and 3D building model data downloaded from geoportal, GML data format. Implementation 5 h. | ||
| Clarity of communication areas | High-resolution orthophoto map (Geoportal), OpenStreetMap (OSM—bike), CyclOSM | Viewing maps in QGIS 3.22.1, plug-in QuickMapServices and WMS database plug-in (high-resolution orthophoto map). Implementation 3 h. | ||
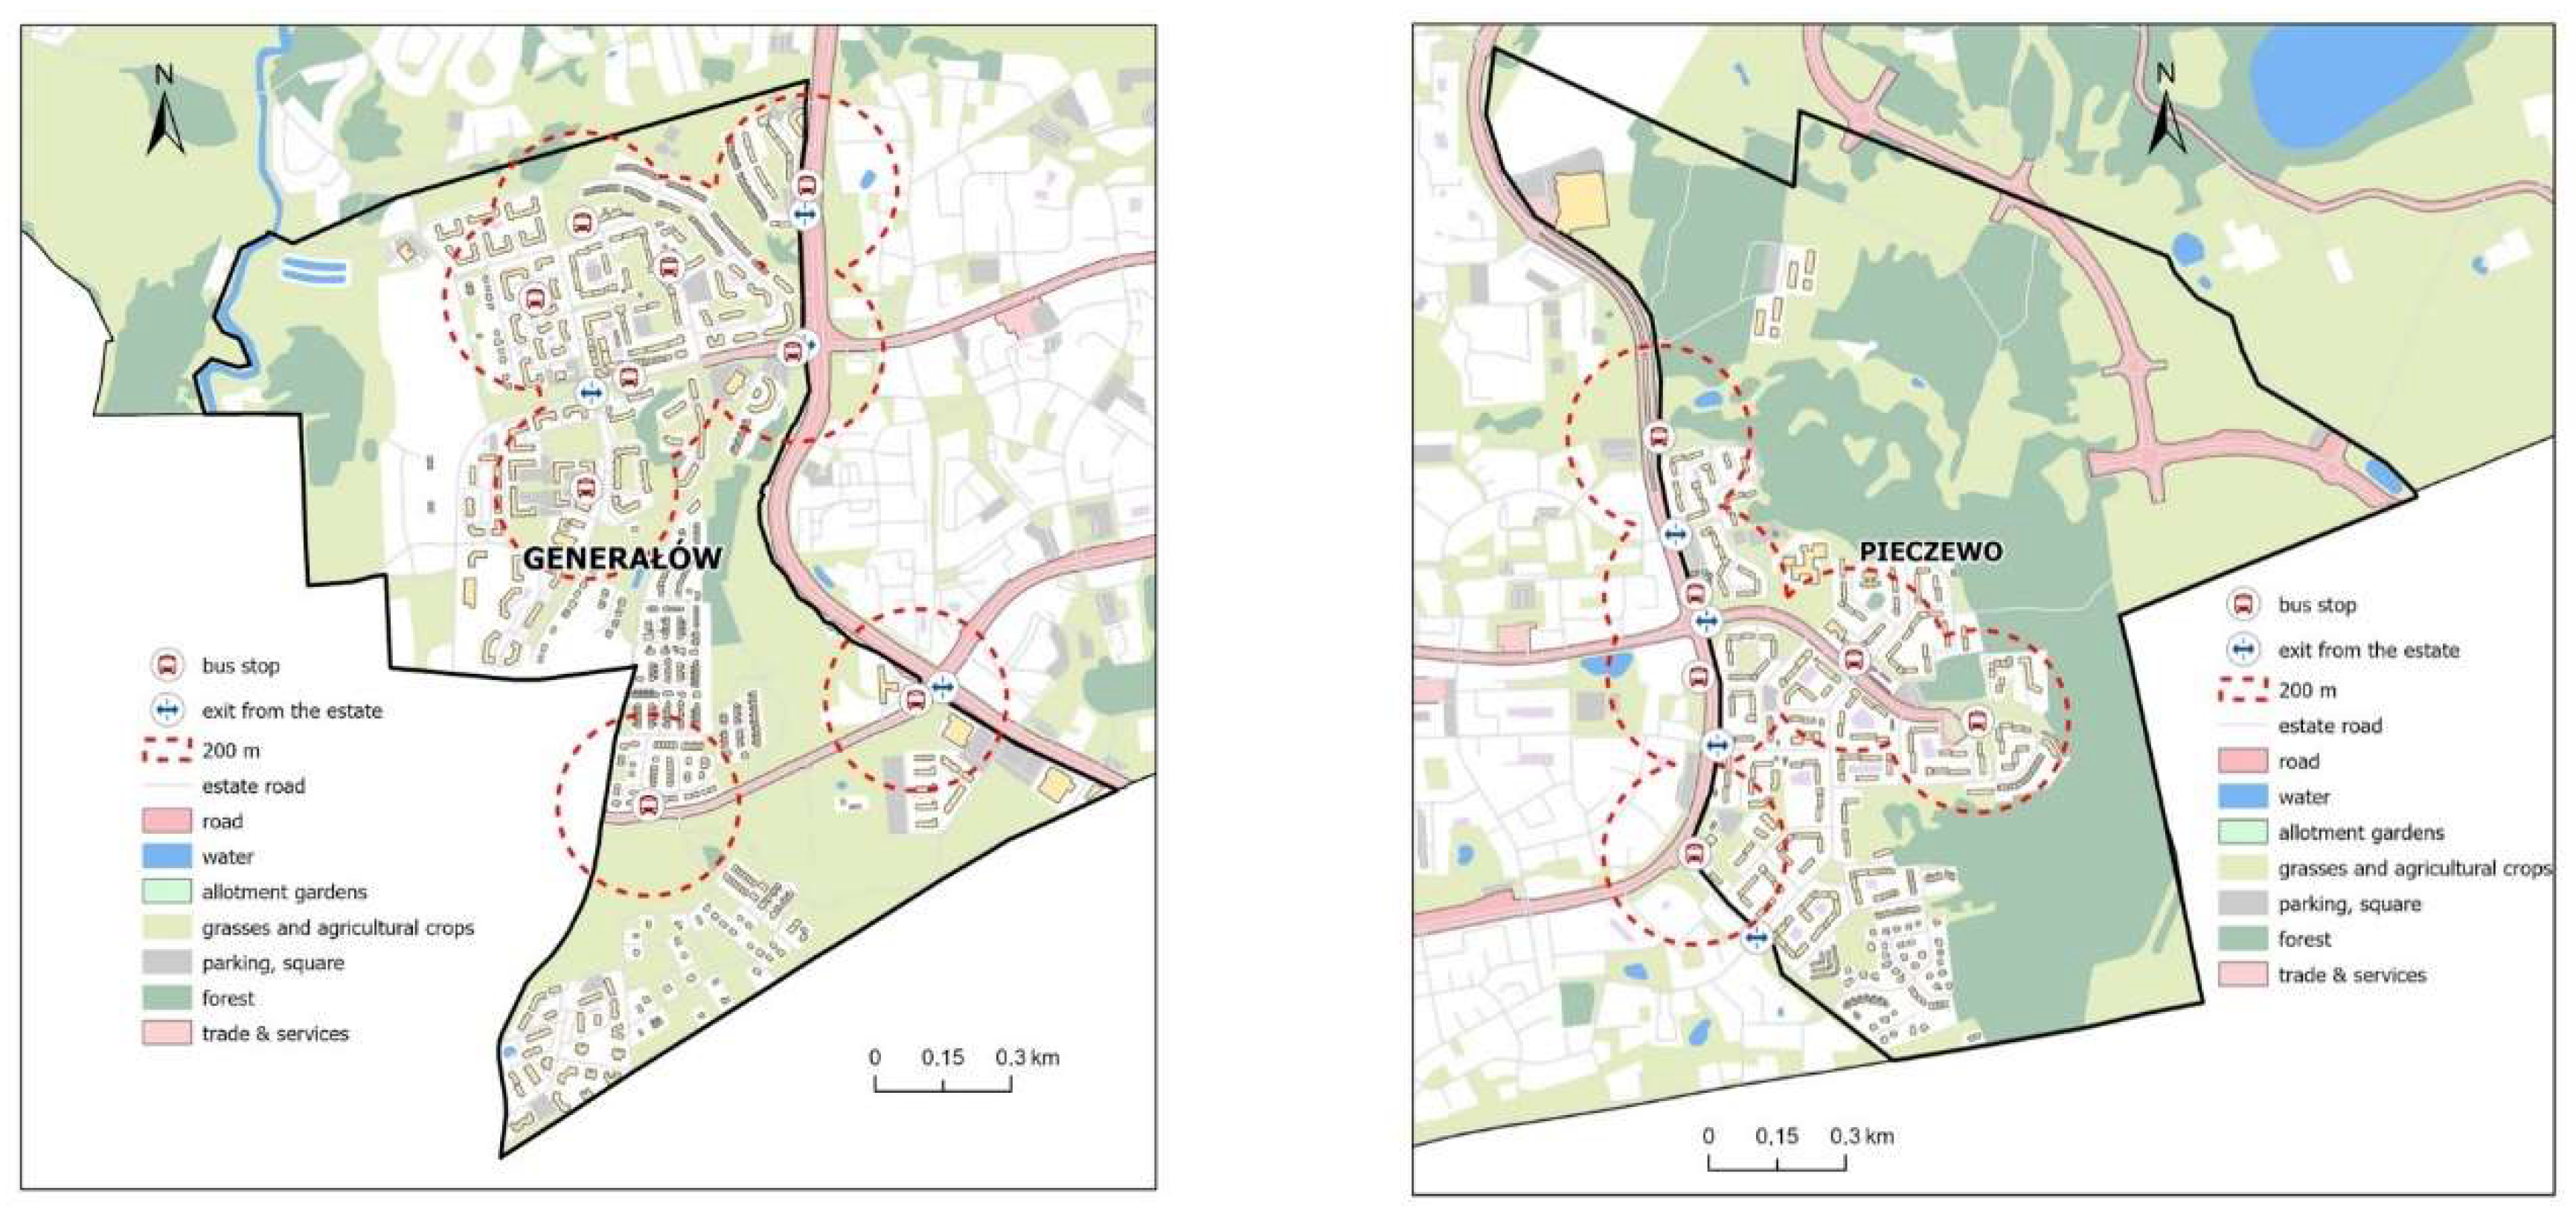
| Accessibility to public transport stops within 200 m | OSM (public transport); Mobile Passenger Information System—Bus Online | Viewing maps in QGIS 3.22.1, plug-in QuickMapServices, map generation from Bus Online (raster), map calibration, definition of distance buffers. Implementation up to 3 h. | ||
| Communication Parking lots | Number of public transport lines | OSM (public transport); high-resolution orthophoto map (Geoportal) | ||
| Number of exits from the estate | OSM (standard and public transport) | Viewing maps in QGIS 3.22.1, plug-in QuickMapServices and WMS database plug-in (high-resolution orthophoto map), vectorization, identification of number of exits from the housing estate. Implementation 1 h. | ||
| Access to bicycle paths | High-resolution orthophoto map (Geoportal); OSM (bike); CyclOSM) | Viewing maps in QGIS 3.22.1, plug-in QuickMapServices and WMS database plug-in (High-resolution orthophoto map) Implementation 2 h. | ||
| Percentage of parking lots and garages per dwelling unit | High-resolution orthophoto map (Geoportal); Olsztyn City Map Portal—WebEWID (https://webewid.olsztyn.eu (accessed on 10 March 2022)); OSM (bike); CyclOSM | Analysis of SHP layer from OSM, comparing it with base map from WebEWID, viewing maps in Qgis 3.22.1, plug-in QuickMapServices and WMS database plug-in (High-resolution orthophoto map). Implementation 5 h. | ||
| Parking lots Biologically active space—Green areas | Percentage of parking lots and garages for the disabled per dwelling | High-resolution orthophoto map (Geoportal), WebEWID, BDOT10k—Geoportal | ||
| Percentage share of biologically active areas—potential for green areas | WebEWID, OSM, BDOT10k—Geoportal, high-resolution orthophoto map (Geoportal) | Map analysis in QGIS 3.22.1, plug-in QuickMapServices and WMS database plug-in (high-resolution orthophoto map), maps generation from WebEWID (raster) and calibration to QGIS analysis of SHP layer from BDOT10k. Implementation 4 h. | ||
| Biologically active space—Green areas Recreational area | Percentage share of greenery in the total area of biologically active land | WebEWID, OSM, High-resolution orthophoto map (Geoportal) | ||
| Active recreation areas (i.e., gym, playground, ice rink) | WebEWID, OSM, BDOT10k—Geoportal, High-resolution orthophoto map (Geoportal) | Map analysis in QGIS 3.22.1, QuickMapServices plug-in, and WMS database plug-in (high-resolution orthophoto map), maps generation from WebEWID and calibration to QGIS analysis of SHP layer from BDOT10 k, calculation of geomertia playgrounds in ArcGIS Pro 2.9.1. Implementation 4 h. | ||
| Recreational area Educational facilities | Number of attractive playgrounds (over 400 m2) | WebEWID, OSM, BDOT10k—Geoportal, high-resolution orthophoto map (Geoportal) | ||
| Kindergarten | Google map, BDOT10k—Geoportal, MSIPO | |||
| Educational facilities Trade and services facilities (accessibility within 200 m) | Primary school | MSIPO | Map generation from MSIPO (raster), map calibration, definition of distance buffers. Implementation up to 3 h. | |
| Primary medical care | Google hybrid map | Viewing maps in Qgis 3.22.1, plug-in QuickMapServices, definition of distance buffers. Vectorization of analyzed objects. Implementation up to 4 h. | ||
| Trade and services facilities (accessibility within 200 m) | Primary shopping facilities | Google map | ||
| Catering/restaurants | Google hybrid map |
| Category | Criteria | Indicator | Indicator Value | ||
|---|---|---|---|---|---|
| Unfavorable—Rank 0 | Medium—Rank 1 | Favorable—Rank 2 | |||
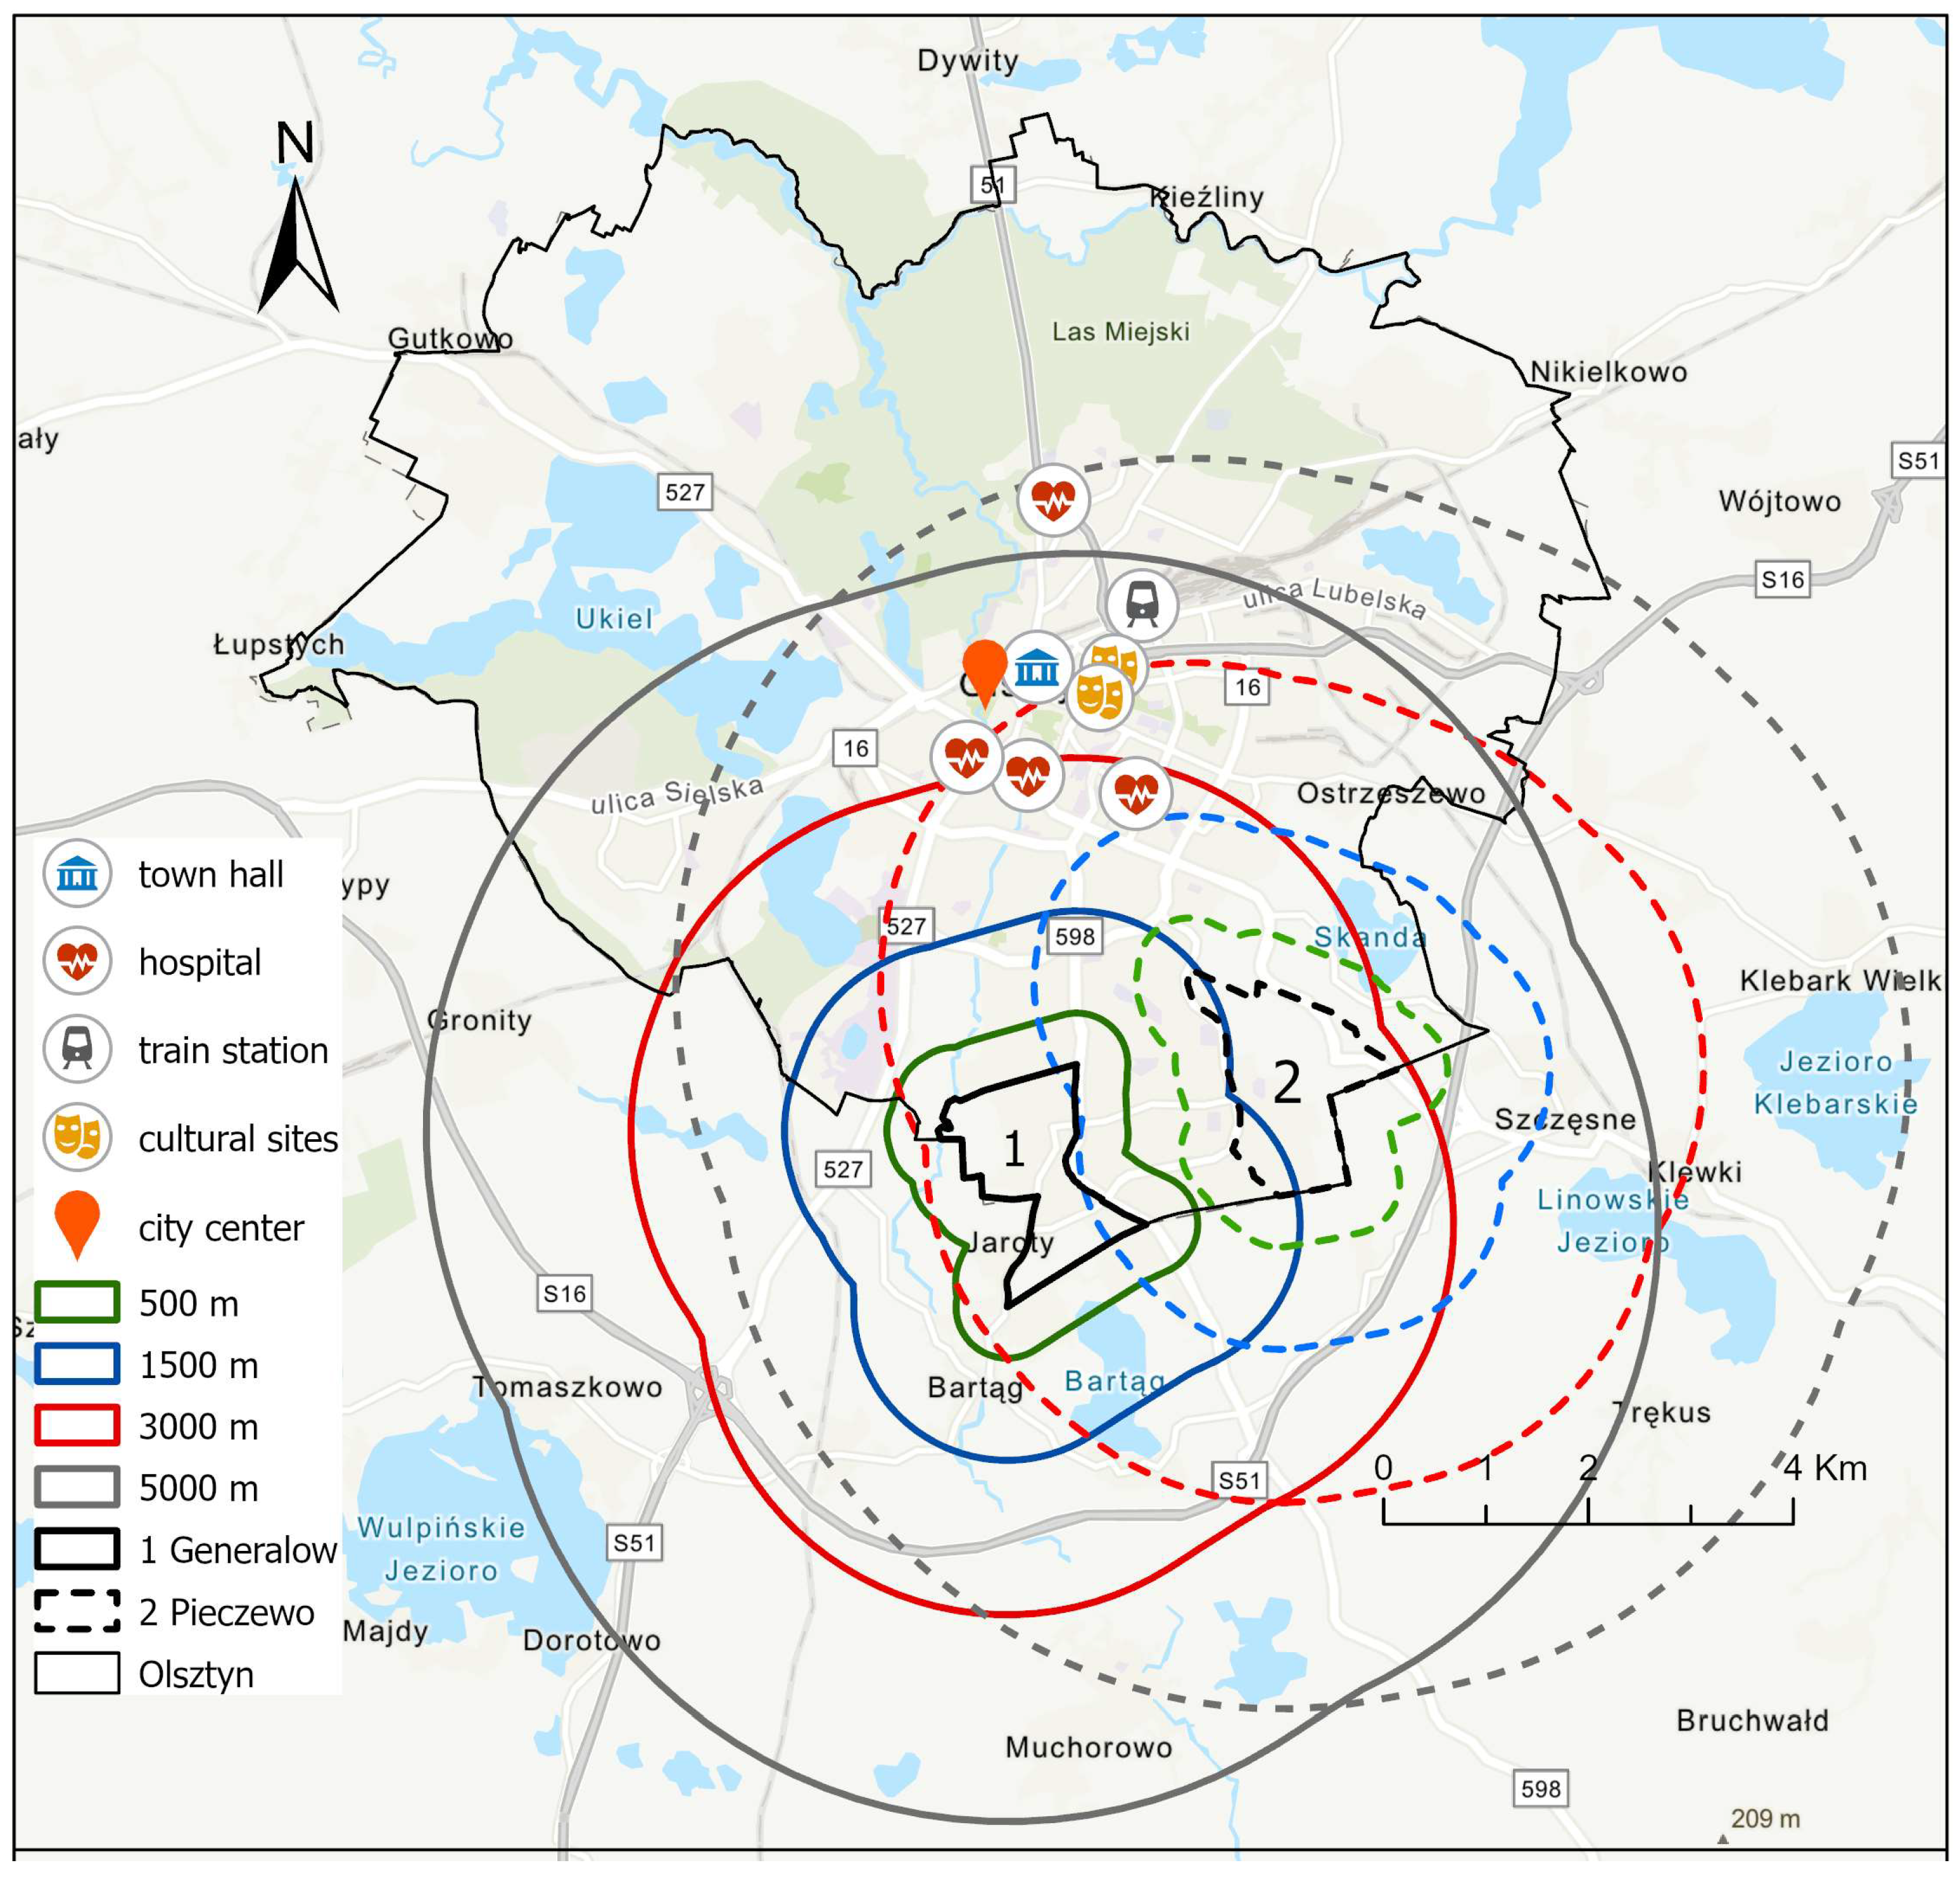
| SFS outside the settlement (general location) | Distance to public facilities | City center | Up to 500 m and more than 5000 m from the settlement boundaries | From 1501 to 5000 m from the settlement boundaries | From 501 to 1500 m from the settlement boundaries |
| Train station/airport | Up to 500 m and more than 5000 m from the settlement boundaries | From 501 to 1500 m from the settlement boundaries | From 1501 to 5000 m from the settlement boundaries | ||
| City/commune office, public administration | Up to 500 m and more than 5000 m from the settlement boundaries | From 1501 to 5000 m from the settlement boundaries | From 501 to 1500 m from the settlement boundaries | ||
| Recreational facilities with infrastructure (i.e., parks, water bodies, forests) | More than1501 m from the settlement boundaries | From 501 to 1500 m from the settlement boundaries | Up to 500 from the settlement boundaries | ||
| Specialized health care facilities (i.e., hospitals, specialized health centers) | Up to 500 m and more than 5000 m from the settlement boundaries | From 501 to 1500 m from the settlement boundaries | From 1501 to 5000 m from the settlement boundaries | ||
| Cultural facilities (i.e., theater, philharmonic, museum) | Up to 500 m and more than 5000 m from the settlement boundaries | From 501 to 1500 m from the settlement boundaries | From 1501 to 5000 m from the settlement boundaries | ||
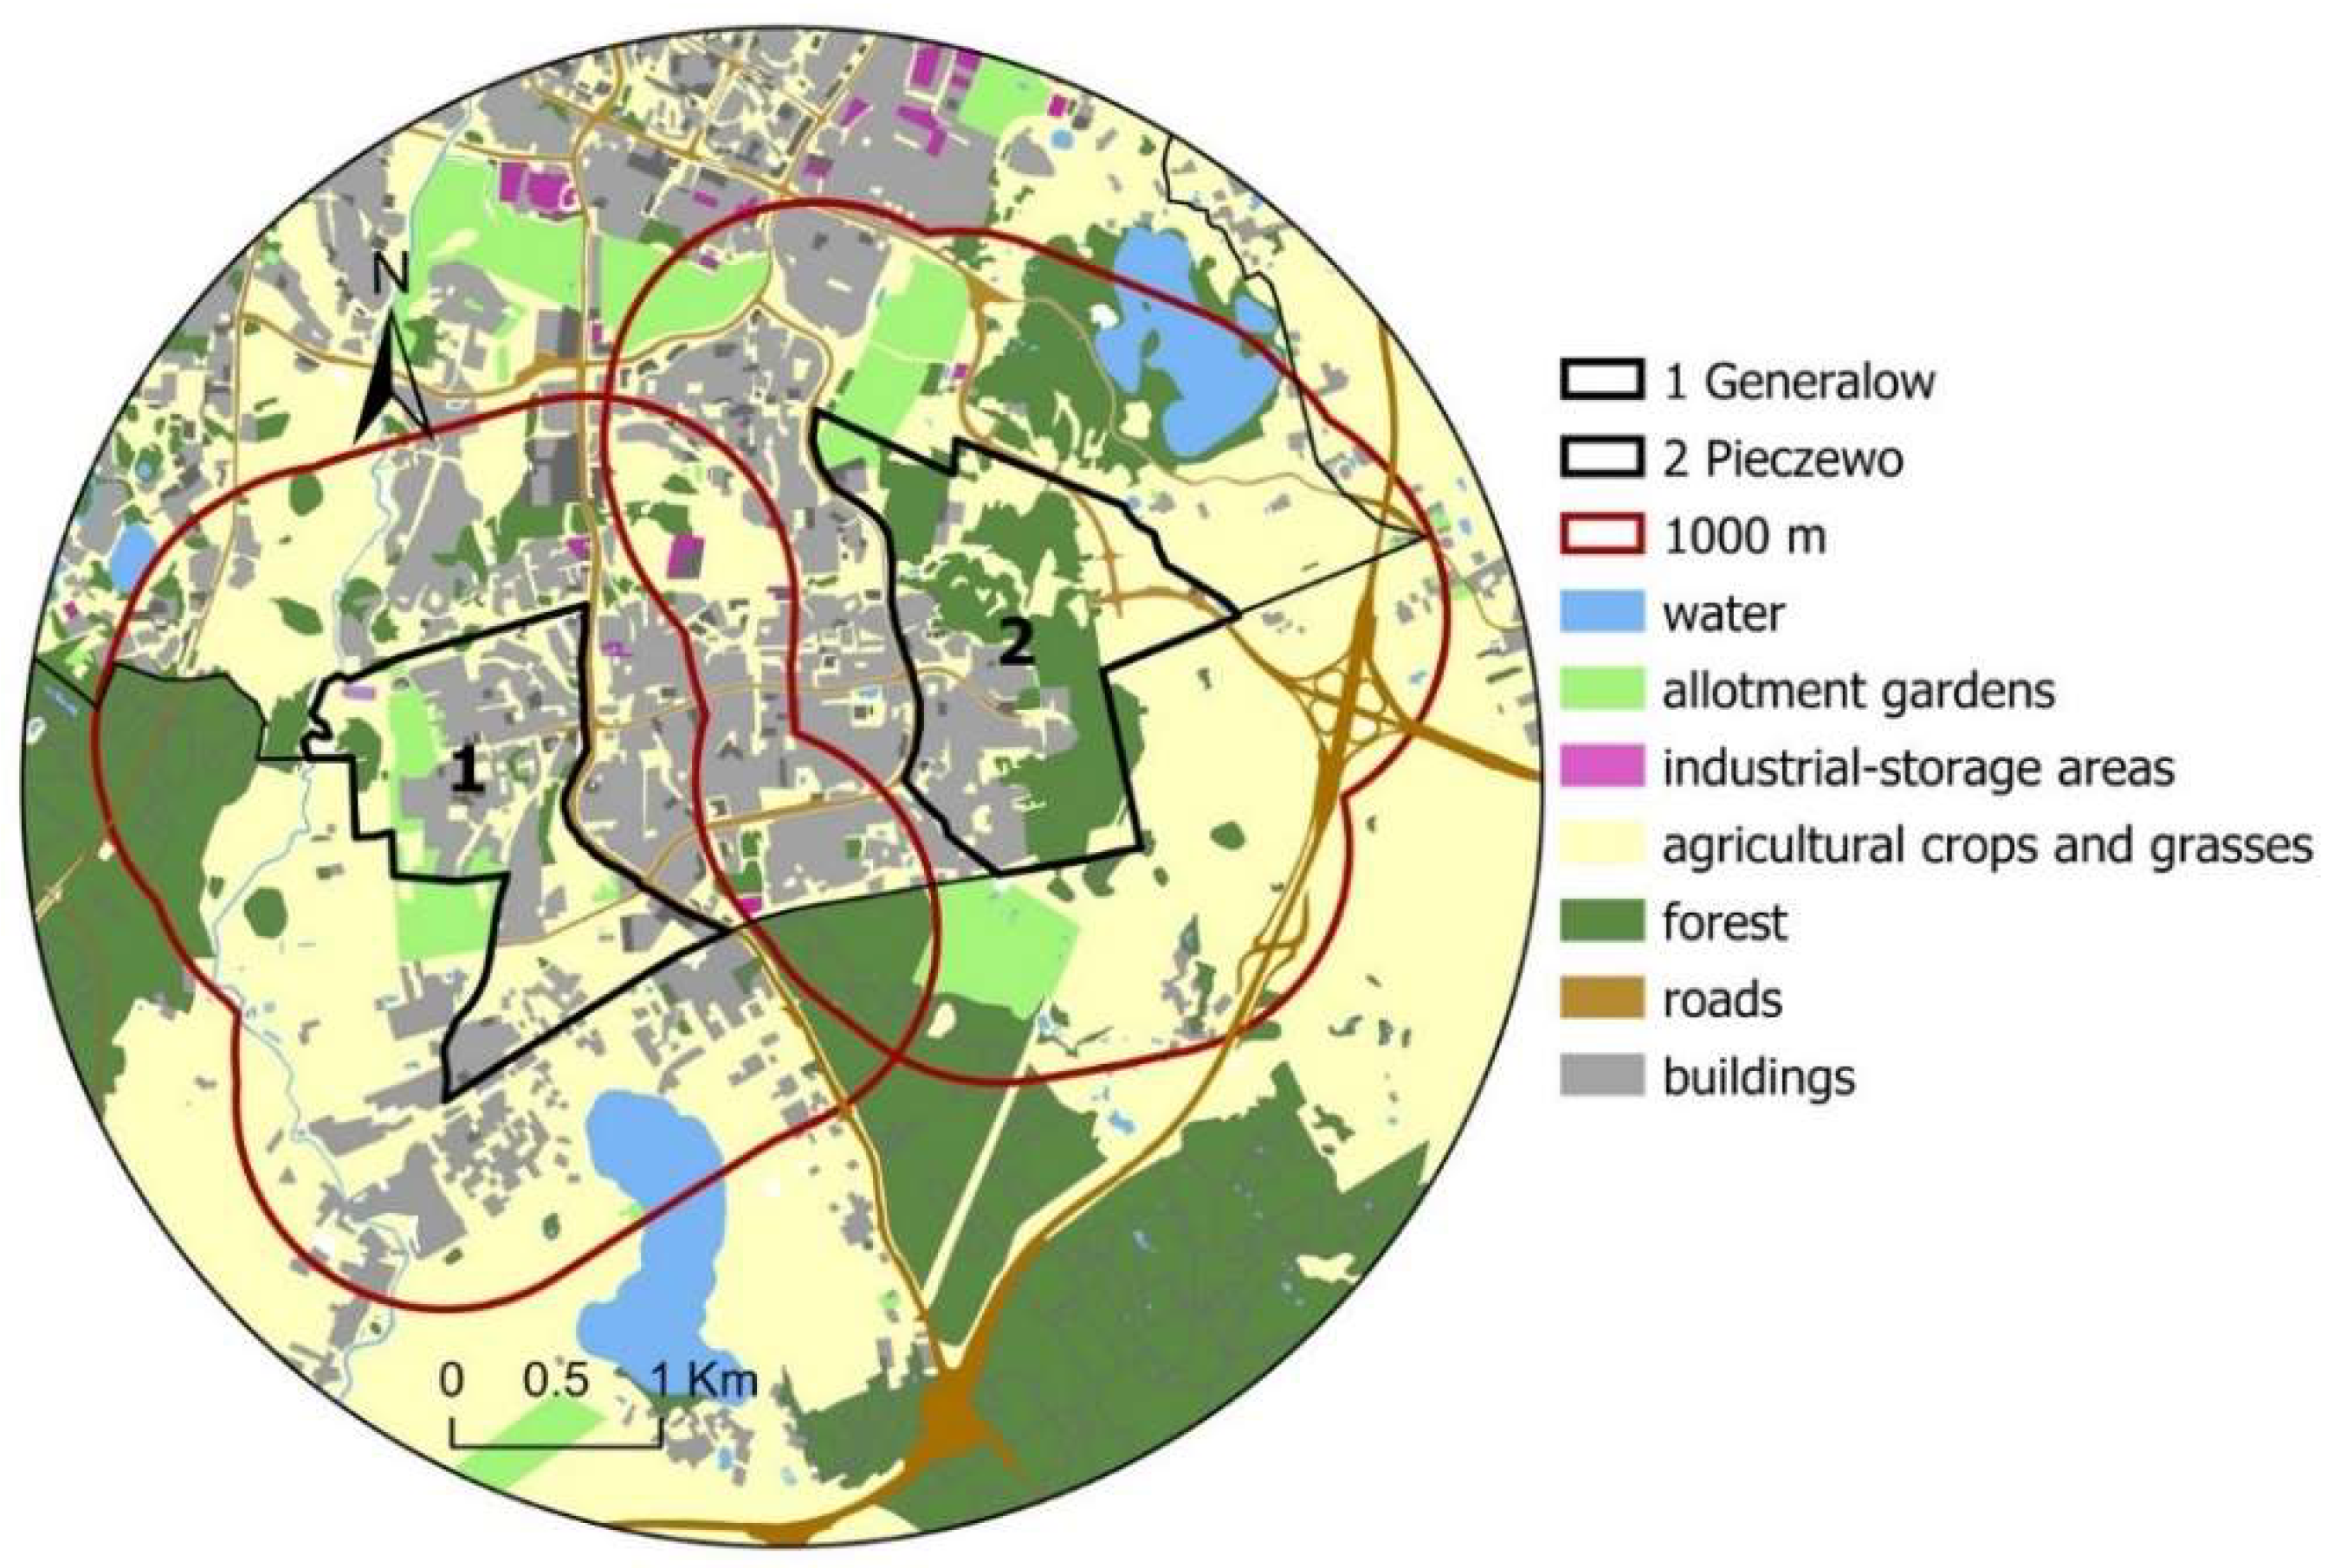
| Neighborhood function (function of land use adjacent to the housing estate) | Type of function | Industry function; services and commerce that are burdensome and generate heavy traffic (e.g., train station, rail traffic, hypermarkets); mines; gravel pits; wastelands (e.g., swamps, moors, dunes, landfills, etc.) | Agriculture | Residential function; non-intrusive services and trade; forests and wooded areas; recreation (flowing and standing waters); green areas including allotments. | |
| SFS inside the settlement (detailed location) | Planning parameters | Built-up area of residential buildings | Above (>) 15% of the settlement area | Between 10 and 15% of the settlement area | Less than (<) 10% of the settlement area |
| Building intensity including storeys | >1.5 | 1–1.5 | <1 | ||
| View opening of the buildings | <40% of the settlement area | 40–70% of the settlement area | >71% of the settlement area | ||
| Clarity of communication areas | Undifferentiated traffic for vehicles and people | Delineated four-wheeled, pedestrian traffic | Delineated four-wheeled, two-wheeled, pedestrian traffic | ||
| Communication | Accessibility to public transport stops within 200 m | <50% of the settlement area | 50–79% of the settlement area | >80% of the settlement area | |
| Number of public transport lines | 0–1 | 2 | 3 and more | ||
| Number of exits from the estate | 1 and more than 5 | 2 | 3–4 | ||
| Access to bicycle paths | The cycle path does not reach the settlement boundary | The bicycle path reaches the settlement boundary | Access to bicycle paths inside the settlement | ||
| Parking lots | Percentage of parking lots and garages per dwelling unit | 1 parking space per dwelling | 1–1.5 parking space per dwelling | More than 1.5 parking spaces per dwelling | |
| Percentage of parking lots and garages for the disabled per dwelling | <4% the total area of parking spaces | 4–5% of the total area of parking spaces | >5% of the total area of parking spaces | ||
| Biologically active space–green areas | Percentage share of biologically active areas, potential for green areas | <25% of the settlement area | 26–35% of the settlement area | >36% of the settlement area | |
| Percentage share of greenery in the total area of biologically active land | <40% of the total area of biologically active land | 41–60% of the total area of biologically active land | >61% of the total area of biologically active land | ||
| Recreational area | Active recreation areas (i.e., gym, playground, ice rink) | None within the settlement boundaries | 1–2 places | >2 places | |
| Number of attractive playgrounds (over 400 m2) | <25% | 26–50% | >50% | ||
| Educational facilities | Kindergarten | None within the settlement boundaries | 1 within the settlement boundaries | >1 within the settlement boundaries | |
| Primary school | >500 m from the settlement boundary | <500 m from the settlement boundary | It is located within the boundaries of the settlement | ||
| Trade and services facilities (accessibility within 200 m) | Primary medical care | <40% of the settlement area | 40–70% of the settlement area | >71% of the settlement area | |
| Primary shopping facilities | <40% of the settlement area | 40–70% of the settlement area | >71% of the settlement area | ||
| Catering/restaurants | <40% of the settlement area | 40–70% of the settlement area | >71% of the settlement area | ||
| Area Parameters | Values | ||
|---|---|---|---|
| Pieczewo | Generałów | ||
| Housing area | 561,013.99 m2 | 483,373.91 m2 | |
| Building area | 14.43% | 15.63% | |
| Total building intensity | 0.607 | 0.664 | |
| Residential building intensity | 0.543 | 0.639 | |
| Percentage share of housing estate development area by function: | Residential | 10.82% | 13.82% |
| Greenery | 36.43% | 32.11% | |
| Recreational | 3.25% | 3.41% | |
| Parking lots | 8.24% | 8.51% | |
| Educational | 4.93% | 0.17% | |
| Health | 0.75% | 0.03% | |
| Commercial | 1.67% | 1.70% | |
| Garages | 0.77% | 0.14% | |
| Category | Criteria | Indicator | Generałów Housing Estate | Pieczewo Housing Estate | ||
|---|---|---|---|---|---|---|
| Value | Rank | Value | Rank | |||
| SFS outside the settlement (general location) | Distance to public facilities | City center | 3600 m | 1 | 3200 m | 1 |
| Train station/airport | 5440 m | 0 | 5470 m | 0 | ||
| City/commune office, public administration | 3100 | 1 | 3350 | 1 | ||
| Recreational facilities with infrastructure (i.e., parks, water bodies, forests) | Park—750 m, (Lake—2400 m) | 1 | Forest—50 m (lake 4500 m) | 2 | ||
| Specialized health care facilities (i.e., hospitals, specialized health centers) | 2742 m | 2 | 1845 m | 2 | ||
| Cultural facilities (i.e., theater, philharmonic, museum) | 3832 m | 2 | 2850 m | 2 | ||
| Neighborhood function (Function of land use adjacent to the housing estate) | Type of function | Residential, agriculture, other green areas | 1 | Residential, forest and wooded areas, other green areas | 2 | |
| SFS inside the settlement (detailed location) | Planning parameters | Built-up area of residential buildings | 13.82% | 1 | 10.82% | 1 |
| Building intensity including storeys | 0.664 | 2 | 0.607 | 2 | ||
| View opening of the buildings | 26.2% | 0 | 33.7% | 0 | ||
| Clarity of communication areas | Delineated four-wheeled, pedestrian traffic | 1 | Delineated four-wheeled, pedestrian traffic | 1 | ||
| Communication | Accessibility to public transport stops within 200 m | 69.8% | 1 | 71.8% | 1 | |
| Number of public transport lines | 7 | 2 | 9 | 2 | ||
| Number of exits from the estate | 4 | 2 | 4 | 2 | ||
| Access to bicycle paths | The bicycle path reaches the borders of the estate | 1 | The bicycle path reaches the borders of the estate | 1 | ||
| Parking lots | Percentage of parking lots and garages per dwelling unit | 1.41 | 1 | 1.47 | 1 | |
| Percentage of parking lots and garages for the disabled per dwelling | 3.1% | 0 | 2.6% | 0 | ||
| Biologically active space—green areas | Percentage share of biologically active areas, potential for green areas | 32.1% | 1 | 36.4% | 2 | |
| Percentage share of greenery in the total area of biologically active land | 52.3% | 1 | 68.5% | 2 | ||
| Recreational area | Active recreation areas (i.e., gym, playground, ice rink) | 2 | 2 | 3 | 2 | |
| Number of attractive playgrounds (over 400 m2) | 3/30 (30.68%) | 1 | 11/28 (87.7%) | 2 | ||
| Educational facilities | Kindergarten | 1 in the settlement area | 1 | 3 in the settlement area | 2 | |
| Primary School | At a distance of 1800 m | 0 | 1 large in the settlement area | 2 | ||
| Trade and services facilities (accessibility within 200 m) | Primary medical care | 56.2% | 1 | 78.4% | 2 | |
| Primary shopping facilities | 72.8% | 2 | 81.2% | 2 | ||
| Catering/restaurants | 58.3% | 1 | 63.1% | 1 | ||
| Sum | 29 | 38 | ||||
| % of maximum value | 55.8% | III deg. SFS moderately user-friendly | 73.1% | IV deg. SFS user-friendly | ||
Publisher’s Note: MDPI stays neutral with regard to jurisdictional claims in published maps and institutional affiliations. |
© 2022 by the authors. Licensee MDPI, Basel, Switzerland. This article is an open access article distributed under the terms and conditions of the Creative Commons Attribution (CC BY) license (https://creativecommons.org/licenses/by/4.0/).
Share and Cite
Dawidowicz, A.; Dudzińska, M. The Potential of GIS Tools for Diagnosing the SFS of Multi-Family Housing towards Friendly Cities—A Case Study of the EU Member State of Poland. Sustainability 2022, 14, 6642. https://doi.org/10.3390/su14116642
Dawidowicz A, Dudzińska M. The Potential of GIS Tools for Diagnosing the SFS of Multi-Family Housing towards Friendly Cities—A Case Study of the EU Member State of Poland. Sustainability. 2022; 14(11):6642. https://doi.org/10.3390/su14116642
Chicago/Turabian StyleDawidowicz, Agnieszka, and Małgorzata Dudzińska. 2022. "The Potential of GIS Tools for Diagnosing the SFS of Multi-Family Housing towards Friendly Cities—A Case Study of the EU Member State of Poland" Sustainability 14, no. 11: 6642. https://doi.org/10.3390/su14116642
APA StyleDawidowicz, A., & Dudzińska, M. (2022). The Potential of GIS Tools for Diagnosing the SFS of Multi-Family Housing towards Friendly Cities—A Case Study of the EU Member State of Poland. Sustainability, 14(11), 6642. https://doi.org/10.3390/su14116642