Next Article in Journal
Adolescents’ Emotions in Spanish Education: Development and Validation of the Social and Emotional Learning Scale
Next Article in Special Issue
The Potential of GIS Tools for Diagnosing the SFS of Multi-Family Housing towards Friendly Cities—A Case Study of the EU Member State of Poland
Previous Article in Journal
Impact of Self-Perceived Employability on Sustainable Career Development in Times of COVID-19: Two Mediating Paths
Previous Article in Special Issue
Performance Evaluation of Hospital Site Suitability Using Multilayer Perceptron (MLP) and Analytical Hierarchy Process (AHP) Models in Malacca, Malaysia
 
 
Correction published on 18 July 2022, see Sustainability 2022, 14(14), 8750.
Article

Estimating the Total Volume of Running Water Bodies Using Geographic Information System (GIS): A Case Study of Peshawar Basin (Pakistan)

1
Department of Earth and Environmental Sciences, Bahria University, Islamabad 44000, Pakistan
2
Department of Mechanical Engineering, King Fahd University of Petroleum and Minerals, Dhahran 31261, Saudi Arabia
3
Department of Geophysics, Bacha Khan University, Charsadda 24631, Pakistan
4
Department of Geosciences, King Fahd University of Petroleum and Minerals, Dhahran 31261, Saudi Arabia
*
Author to whom correspondence should be addressed.
Sustainability 2022, 14(7), 3754; https://doi.org/10.3390/su14073754
Submission received: 5 January 2022 / Revised: 16 March 2022 / Accepted: 17 March 2022 / Published: 22 March 2022 / Corrected: 18 July 2022

Abstract

:
The main objective of this study is to estimate the changes in land use and land cover in the Peshawar basin, Pakistan, from 2000 to 2020. This will greatly improve the selection of areas designated as the agricultural, industrial, and/or urban sectors of the region and will help in overcoming future problems. With the help of an advanced geographic information system (GIS), land-use and topographic changes were identified. Based on data of the 20 years from 2000 to 2020, the total runoff volume in the Peshawar basin from 2000 to 2010 was calculated to be 13.9 km3 and from 2010 to 2020 was 19.4 km3. This volume estimation will assist in quantifying the total infiltration rate. We inferred that the built-up area increased the most from 2010 to 2020 as compared to other classes. Results showed that from 2000 to 2020, there was a significant increase in urbanization and a significant decrease in vegetation. This study will help the farmer community and environmentalists to manage range land, agricultural land, populations, and water bodies.

1. Introduction

The population of Pakistan is increasing exponentially, accompanied by a rapid increase in the proposed study area of Peshawar [1,2]. The economy of Pakistan is based on agriculture, and this is the main reason for extensive research in the area of water preservation [3], even though every year a large quantity of rainfall as well as surface and sub-surface water sources convert into floods and destroy all agriculture products [4,5]. Still, the soft cover of vegetation provides an excellent means for infiltration [6,7]. However, the rate of infiltration for settled (covered) areas is different. Most rainfall received by the settled/covered area hardly penetrates, and most of this water becomes running water. Calculation of the total area covered by settlement within the basin boundaries along with rainfall data will help in quantifying the total volume of running water. The running water from settled areas is the actual contribution to the Kabul River, which ultimately contributes to the Indus at Attock [8].
The human-induced change in the activities on the surface of the earth is known as land-use/land-cover (LULC) change. In the past few decades, the rate of LULC change has excessively increased. Regional and global changes in the environment are directly affected by the LULC change. Studying LULC changes is very important to predict and mitigate the various ecological and environmental changes on regional and global levels [9,10,11,12]. It is useful in various applications like agriculture, forestry, geology, hydrology, etc. The focus in these applications is mainly on issues like loss of cropland, degradation of soil, urban expansion, the variation in the quality of water, etc. Various techniques have been used by the researchers to monitor changes in the natural resources and the urban expansion. These techniques quantitatively analyze the particular distributions of the population of interest [13].
In order to mitigate the global environmental issues, it is essential to have the most reliable and latest LULC change information [14]. The LULC changes are commonly detected and mapped using satellite remote sensing and GIS techniques because these techniques employ a reliable geo-referencing methodology, and their digital format is more suitable for computer processing [15]. The digital change detection methodology, based on the multi-temporal remotely sensed data, can also be used for the detection of the LULC changes. This methodology allows the identification of change between two or more dates [16]. In a study by Gao and Liu [17], two Landsat images were digitally analyzed for detecting the land degradation trends in northeast China due to the salinization of soil over a period of 10 years. Various techniques, such as post-classification comparison (PCC), vegetation index differencing, principal components analysis (PCA), etc., have been used in the literature for monitoring the LULC changes. Of these techniques, many studies in the literature have mentioned the PCC technique as a more accurate procedure for representing the nature of the changes by comparing the classifications of images on different dates [18].
The majority of freshwater research is conducted worldwide to assess and quantify the groundwater resource. The amount of water retained inside aquifers is used to quantify the volume of water. The stored water in aquifers results from more precipitation, low evaporation, and gentile slop that will facilitate the infiltration process, and ultimately, fresh surface water becomes part of the groundwater. The unmanaged and unplanned use of groundwater (GW) by the public as well as private industry, e.g., marble, and lack of adequate infrastructure will cause water scarcity in the region. Rapid population growth causes urbanization and industrialization, which causes the depletion of the GW table worldwide and in the study area. GW is considered a major source of fresh water in the study area (the Peshawar basin). The storage of GW will ultimately affect the daily life of the settled population. The research area is a densely populated and economic hub, and most of the rural population of Khyber Pakhtunkhwa has migrated to Peshawar city [19,20].
The shortage of GW occurs during dry periods due to the drawdown of the water table, which increases the pumping cost. In addition, previous studies and electronic media reports indicate that in Khyber Pakhtunkhwa, untreated waste and garbage mix with the Kabul River. Over-pumping, which induces recharging in the Kabul River catchment area’s shallow aquifers, is the main reason for reduced water quality [19,21]. Along the Kabul River, the waterlogging problem in Mardan, Charsadda, and sections of the Peshawar district prompted regional groundwater studies in the early 1960s. As a result, the Water and Power Development Authority (WAPDA) launched a detailed investigation to cater to the water logging issue and a hydrogeological investigation to evaluate GW. This study analyzed borehole data of drilled water wells for agriculture and domestic applications. This report is very informative, as it describes different groundwater levels, different water storage volumes, and the per annum recharge of the particular area. Malik [23] thoroughly examined the groundwater level records for the entire Peshawar valley, including the study area.
GIS plays a significant role in modeling and identification of optimum locations for water garnering or recharging structures. GIS can also be used for hydrological modeling as well as for estimating underground and running water [24,25,26,27]. Earlier research studies have been carried out by applying GIS and remote sensing to rainwater collection and storage [28,29]. Rainwater flows and drains in a specific area via a surface channel after nourishing the surface and sub-surface losses [30]. Rainwater in arid and semi-arid areas acts as a water source for miscellaneous purposes once the auxiliary sources such as wells, springs, and stream flow water dry up [28,31]. The ability of GIS to process large amounts of spatial and attribute data makes it an important tool for hydrological modeling. Certain functions (such as map overlay and analysis) can extract and add hydrological parameters from various sources (such as soil, land-cover, and precipitation data) [25]. The Digital Elevation Model (DEM) is also one of the tools used for the digital representation of the land surface elevation with respect to any reference datum. The DEM is frequently used to refer to any digital representation of a topographic surface [32]. In a study by Abdulwahd et al. [33], analysis of the spatial data and DEM data was conducted using GIS to estimate the hydrological properties for the watershed valley with a 158.5 km2 surface area. Alcaras et al. [34] analyzed the possibility of rapidly producing smart maps from remotely sensed image classification. Amano and Iwasaki [35] used GIS data and SPOT 6/7 satellite images to classify the Kumamoto area into nine categories. A land-cover map was developed using GIS to estimate the groundwater recharge in the Kumamoto area in Japan.
Odekunle et al. [36] used the GIS technique to examine the impacts of the change in rainfall quantity on the availability of water for maize yield. It was concluded that the maize yield changes with the change in the water availability caused by the variations in the rainfall quantity. A flood hazard map was prepared by Bandi et al. [37] for the Telangana State, India, and various factors like surface slope and roughness, rainfall variability, density of drainage, soil type, and LULC were discussed in their study. Schumann et al. [38] presented a hydrological model with feedback components between the flow from surface and the rate of infiltration. Dewan et al. [39] assessed the flood hazard in Dhaka using the Synthetic Aperture Radar (SAR) data with GIS data. The hydrologic parameters used in their study were the flood frequency and flood depth. Liu et al. [40] used a diffusive transport approach based on GIS for calculating the rainfall runoff response and routing of floods. The watershed was represented by a grid cell mesh, and for the routing of the runoff from the grid cells to the basin outlet the first passage time response function was used. A sensitivity study was also performed that concluded that the threshold of drainage area is highly dependent on the flood frequency and the channel roughness coefficient. In another study by Kumar et al. [41], both the SCS-CN and GIS techniques were used to estimate the surface runoff estimation of the Sind River basin. The excessive emission of CO2 has caused global climatic changes like global warming. The excessive CO2 should be captured from the point sources and should be converted to useful products or stored for long time period in underground sedimentary reservoirs. GIS is a useful tool for analyzing the CO2 capture sites and its storage possibilities [42,43,44,45].
The main objective of the current study is to estimate the total volume of running water by applying GIS in Peshawar basin, which will eventually contribute to the Indus River. In particular, we aim to calculate the area covered by settlements, water bodies, range land, and agriculture area to find the total runoff water volume in the Peshawar basin and finally to estimate the total recharge to the Peshawar basin aquifer.

2. Materials and Methods
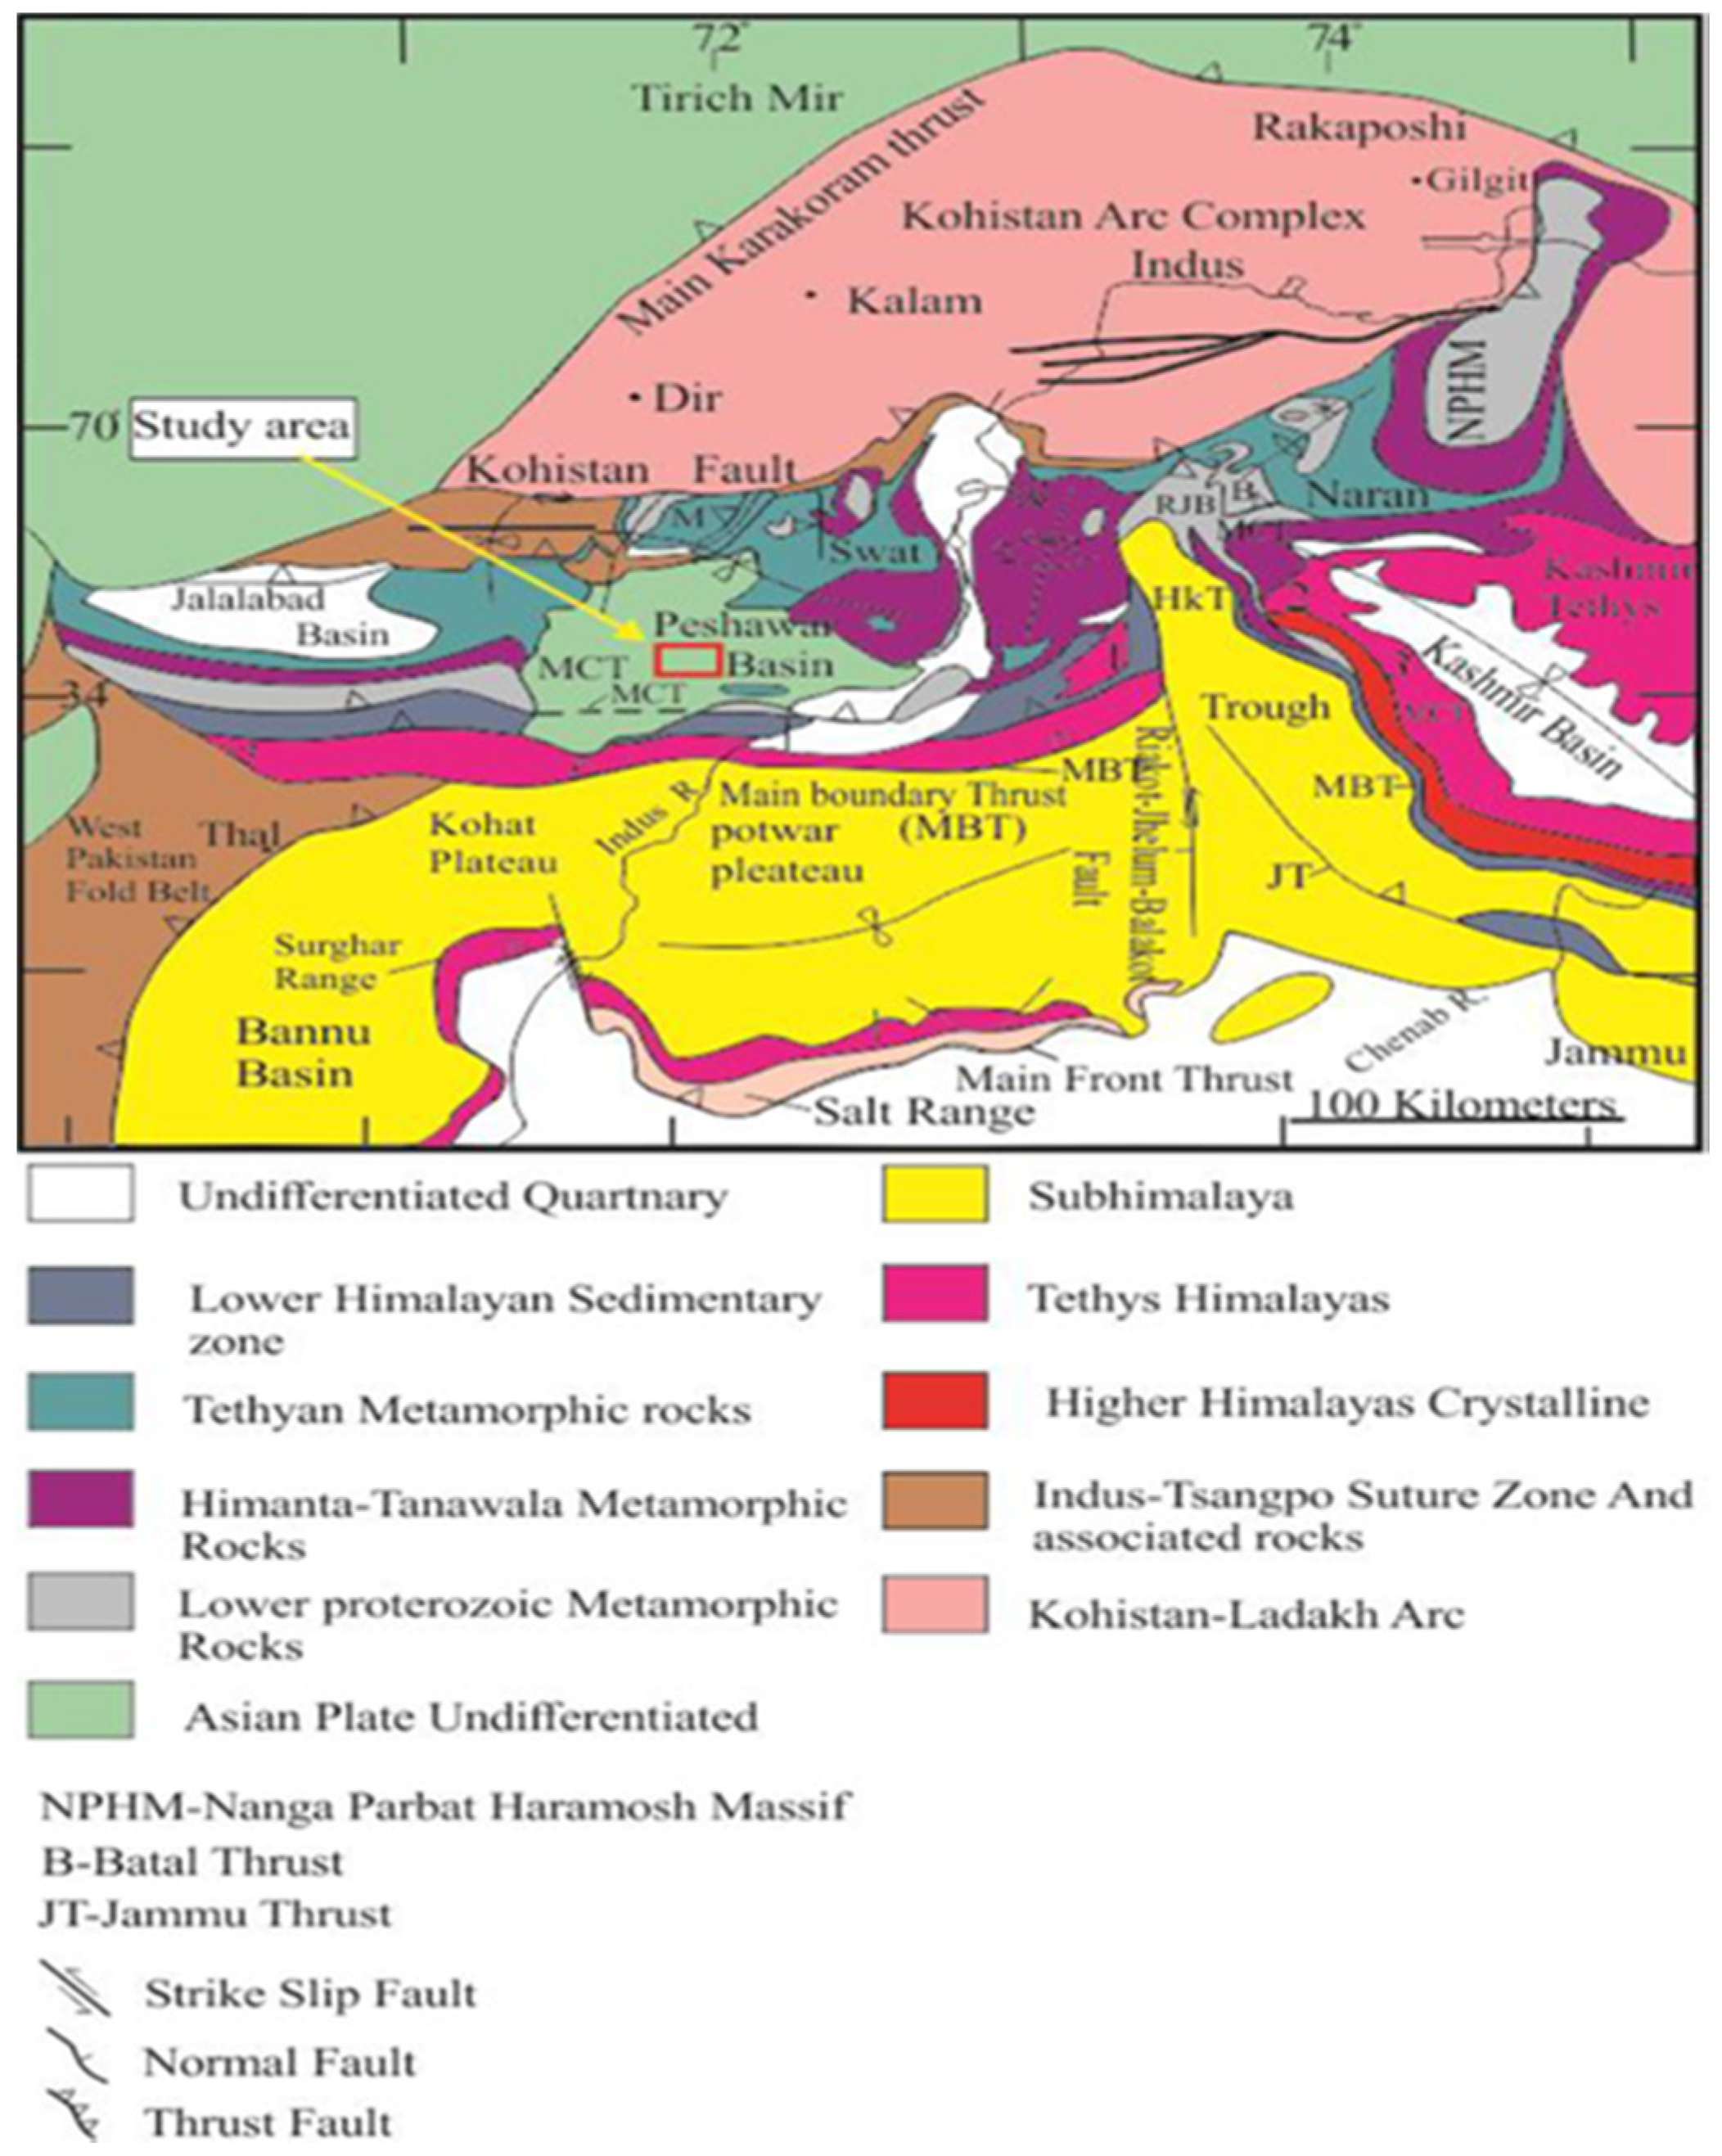
2.1. Study Area

The location of the study area is shown in Figure 1. Peshawar basin is situated at the southern foothills of Himalaya between latitudes 32° N–37° N and longitudes 70° E–74° E of Khyber Pakhtunkhwa province in Pakistan. Within Khyber Pakhtunkhwa, the major districts of the Peshawar basin are Peshawar, Mardan, Charsadda, Swabi, and Nowshera. Peshawar basin is surrounded by the mountain ranges of Khyber from the west and north, Attock-Cherat in the south and Swat in the east and northeast. Toward the north and northwest sides, the Peshawar basin is comprised of strata that meet sediments intervened by the granitic rocks belonging to the marginal mass of the Indian plate. The volume of water runoff in the settled areas in the Peshawar basin is 0.419 km3, while the total runoff volume in the Peshawar basin is 5.1 km3. The total study area of the current research work is 7168 km2. The average running water body volume in Peshawar basin is 0.53 km3, which is quite high because of its stratigraphy [46,47,48].

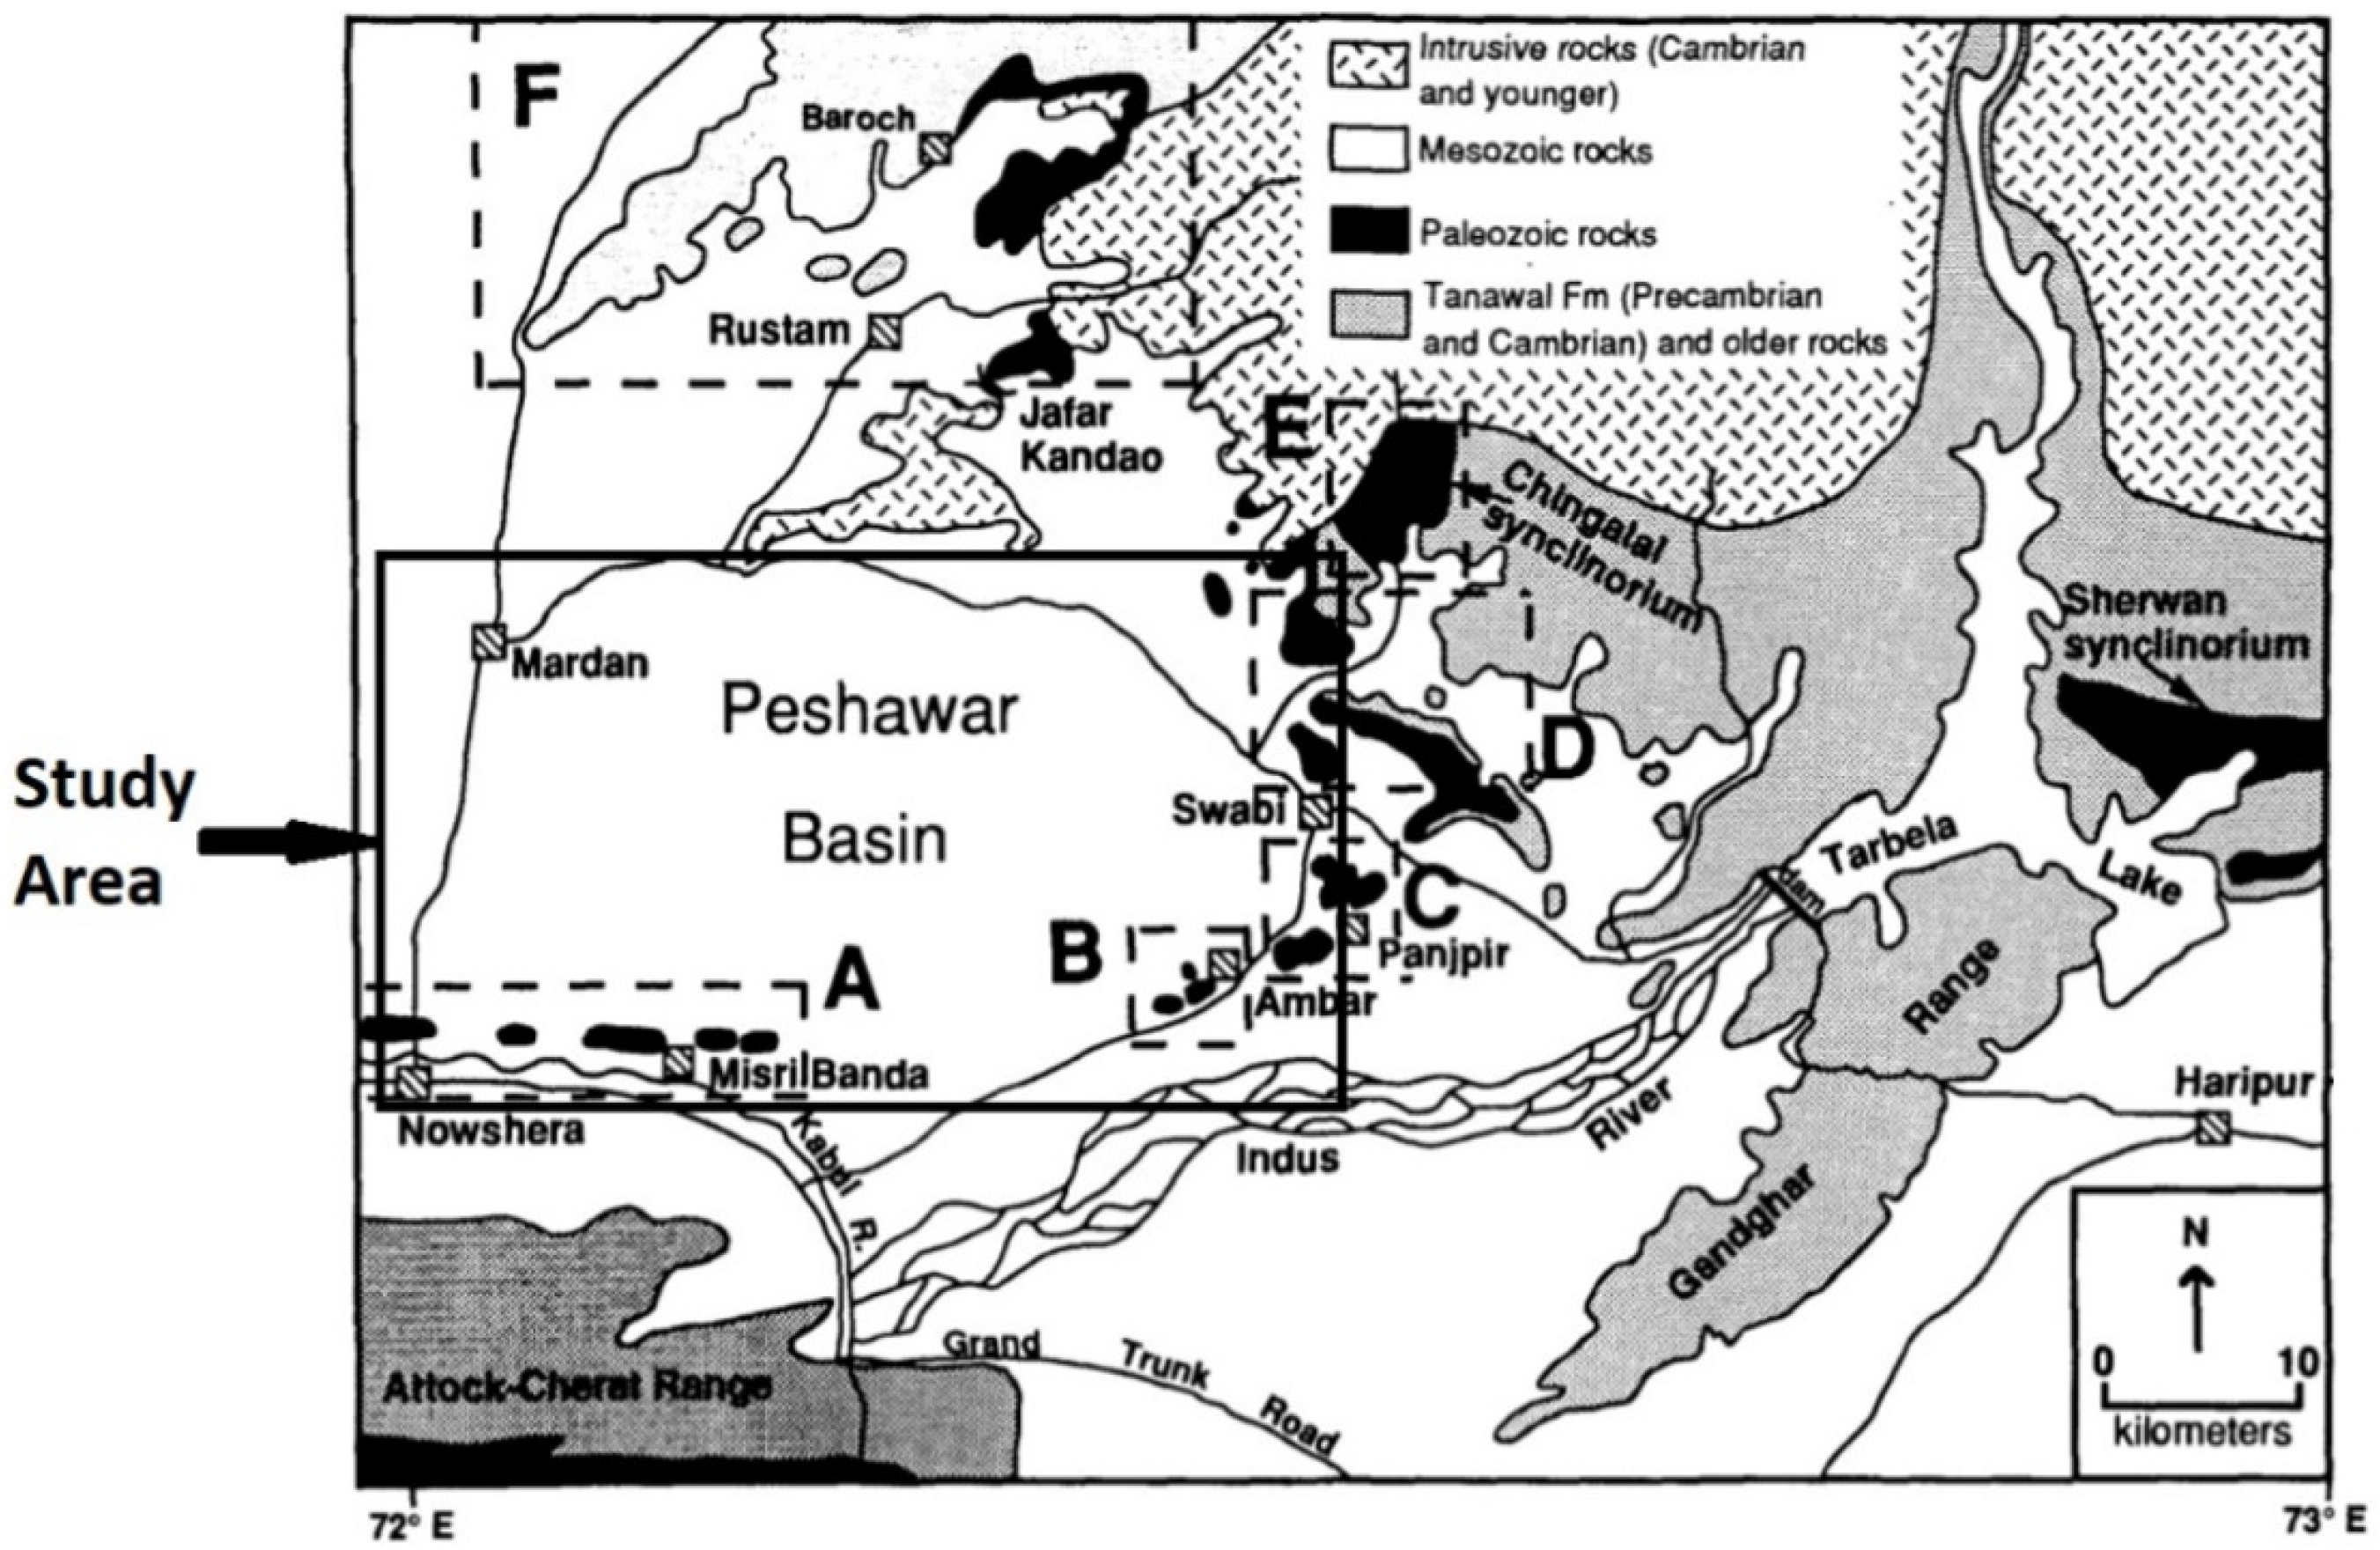
2.1.1. Tectonic Setting of Peshawar Basin

The tectonic setting of the Peshawar basin is transitional between a sedimentary fold–thrust belt to the south and a metamorphic terrene to the north. The Peshawar basin is a well-known example of the middle Paleozoic lithological succession and the site of two tectonic thrusts named the Main Mantle Thrust (MMT) and Main Boundary Thrust (MBT). The un-lithified sediments of Peshawar basin are largely lacustrine silt with fluvial sand and gravel. The basin originated in the Pleistocene when more than 300 m of sediment was dumped in the comeback of ponding of drainage from the rising of the Attock-Cherat, limited to small outcrops within the basin [46,47]. The Attock-Cherat range is at the southern boundary of the Peshawar basin, which includes meta sediments of Lesser Himalaya and foreland basin strata of Kala Chatta range. This range contains primarily slate and limestone of the Precambrian to Paleozoic age [49]. The structural events that are close to the Peshawar basin are of Pre-Paleocene, Pre-Pliocene, and Late Quaternary eras. The faulting of the Kala Chatta range on the MBT pushed the Siwalik foreland basin southward, which formed the Peshawar basin [46]. The tectonic map of the study area is given in Figure 2.

2.1.2. Geology of Peshawar Basin

Rivers in the Peshawar basin are the Kabul, Swat, and Indus. The Kabul River is 700 km long, emerging in Mardan from the Wardak province in the Saglak range of the Hindu Kush Mountains in Afghanistan. Its elevation is 2400 m, and it meets with the Indus River at Attock, Punjab, Pakistan. The Swat River is located in the northern region of Khyber Pakhtunkhwa province, Pakistan. The Hindu Kush mountains are the source of Swat River and are 240 km long. The Indus River is the longest river in Asia. It flows through China, India, and Pakistan. The Indus River begins in the Tibetan plateau. Its elevation is 4255 m, and its length is 2880 km. It meets with the Kabul River near Attock and flows about 30 km north of the Khyber Pass, Nowshera. This river plays the greatest role in the recharge of Peshawar basin [51].

2.1.3. Stratigraphy of the Study Area

Stratigraphy deals with studying the various rock layers. It can be concluded based on the review of the various studies in the literature that it is necessary to understand the stratigraphy of the study area before performing any detail study of the area [52,53,54,55]. The study area in the current study was divided into four units. The oldest rocks are Landikotal slates overlaid by Shagai limestone. The Shagai limestone is overlaid by Ali Masjid formation, and finally the topmost formation is Khyber limestone. The stratigraphic column of the study area is shown in Figure 3 [56].

Landikotal Formation

This unit is known as “Landikotal slates” since a thick succession was exposed at Landikotal town. The formation is an accumulation of limestone, slates, phyllite, and quartzite. The formation is mainly composed of greenish gray to yellowish gray phyllite and slates with abundant basic igneous dykes. The slate is clearly calcareous in some places. The upper contact is faulted with the Khyber limestone. The formation has been dated to the Ordovician to Silurian age [57].

Shagai Formation

This formation is known as “Shagai limestone.” The name “Shagai limestone” was given to this unit owing to the presence of the Shagai Fort on Khyber Pass Highway. The dominant lithology is massively bedded micritic limestone. In the Missri Khel area, the lower contact of Shagai formation is confirmable with Landikotal formation and the upper contact with Ali Masjid formation. The Shagai unit is in thrust contact with Landikotal slates at the Khyber Pass area. The lower part is 5 m of limestone, light gray weathering to brown, platy to thin-bedded and medium- to fine-grained, decorated with many calcite veins and totally recrystallized. A dolomitic overlay on this unit is 16 m dolomitic limestone of light brown color. The topmost unit of the Shagai formation is dolomitic limestone, which is fine- to medium-grained with calcite veins. This formation has been assigned Silurian to early Devonian age [58].

Ali Masjid Formation

The name Ali Masjid formation was given to this unit owing to the presence of a village of this name on the Khyber Pass Highway. The Ali Masjid unit consists of sandstone at the lower portion with siltstone, quartzite, and volcanic ash and conglomeritic beds at the different stratigraphic levels in the unit. The lower part of the unit is slightly calcareous. A 4.5-m thick conglomeritic bed lies at the top of the unit. At Khyber Pass, the formation is faulted, which is why its thickness is uncertain. On the Khyber Pass Highway, this section has no fossils whereas fossils have been discovered along the Missri Khel and Makhshwani sections [59].

Khyber Limestone

The Khyber limestone formation is predominantly composed of limestone that grades into marble and dolomite, with minor argillaceous and arenaceous partings. The limestone is thick-bedded, medium–fine-grained and completely recrystallized. Its fresh surface is a gray color while the weathered surface has grayish-yellow shades. The marble is interbedded with the limestone, and in one place, a bed of marble reaches 30 m thickness. The unit is penetrated by many basic diorite dykes and sills with 5–6 m thickness north of the Khyber Pass section. The Eastern Khyber limestone unit is devoid of fossils and is located near Ali Masjid village, Khyber Pass. No fossils have been reported found in the Khyber limestone unit exposed at the Khyber Pass area, whereas along the Gandah Galla Mountains, the limestone unit is highly fossiliferous, containing several species of products and foraminifera. The Khyber limestone has a maximum thickness of about 1000 m with several highly fossiliferous beds [60].

2.2. Data and Software

The rainfall precipitation data were taken from the Regional Meteorological Department of Peshawar from 2000 to 2020 [61]. ArcGIS 10.7 software 2019 version [62] was used for generating, handling, and production of maps for the five districts in the current study. GIS is an important software tool for hydrological modeling because of its potential to leverage the huge quantity of spatial and attribute data. Its features, such as map overlay and analysis support, help in deriving and aggregating the hydrologic parameters from diverse sources like soil, land-cover, and rainfall data [24,26,27,29,30,31]. Land-use and land-cover (LULC) mapping was used in the current study as a tool for planning and management of urbanization, agricultural practices, and other human activities [63]. The data used in the current study were in raster format, uniform throughout the study area. The spatial resolution of the current research work was 250 m, meaning that one pixel represented a ground area of 250 × 250 m. The post-classification change detection technique, performed in ArcGIS 10.7, was employed in the current study. The following were the various steps followed in the current study:
  • Estimated the recharge of the study area.
  • Calculated the LULC of the Peshawar basin.
  • Calculated the total runoff water volume in the Peshawar basin.

2.2.1. Methodology for Calculating the Volume of Running Water Body

The total volume of water was calculated using GIS for the selected locations in the study area. Microsoft Excel sheets were used to analyze and develop graphs with mathematical computations for running water estimates with precise weights based on the output data from GIS. In order to study the LULC changes in the Peshawar basin, two multispectral satellite images of the basin were acquired in two periods, i.e., 2010 and 2020. The 2010 and 2020 (LANDSAT) images were taken from the SUPARCO data interfaces of the United States Geological Survey (USGS) [64]. The land-cover changes were investigated for four categories, i.e., built-up area, agriculture land, range land, and water body, using maximum likelihood classification (MLC). The temporal and spatial dynamic measurement of land-use/land-cover change used two satellite images, classified them through a supervised classification algorithm, and finally applied post-classification technology to detect changes in GIS. The post-classification technique was used in the current study because of its accuracy in the detection of location and rate of change. Finally, the results for the volume of water in the study area were derived.

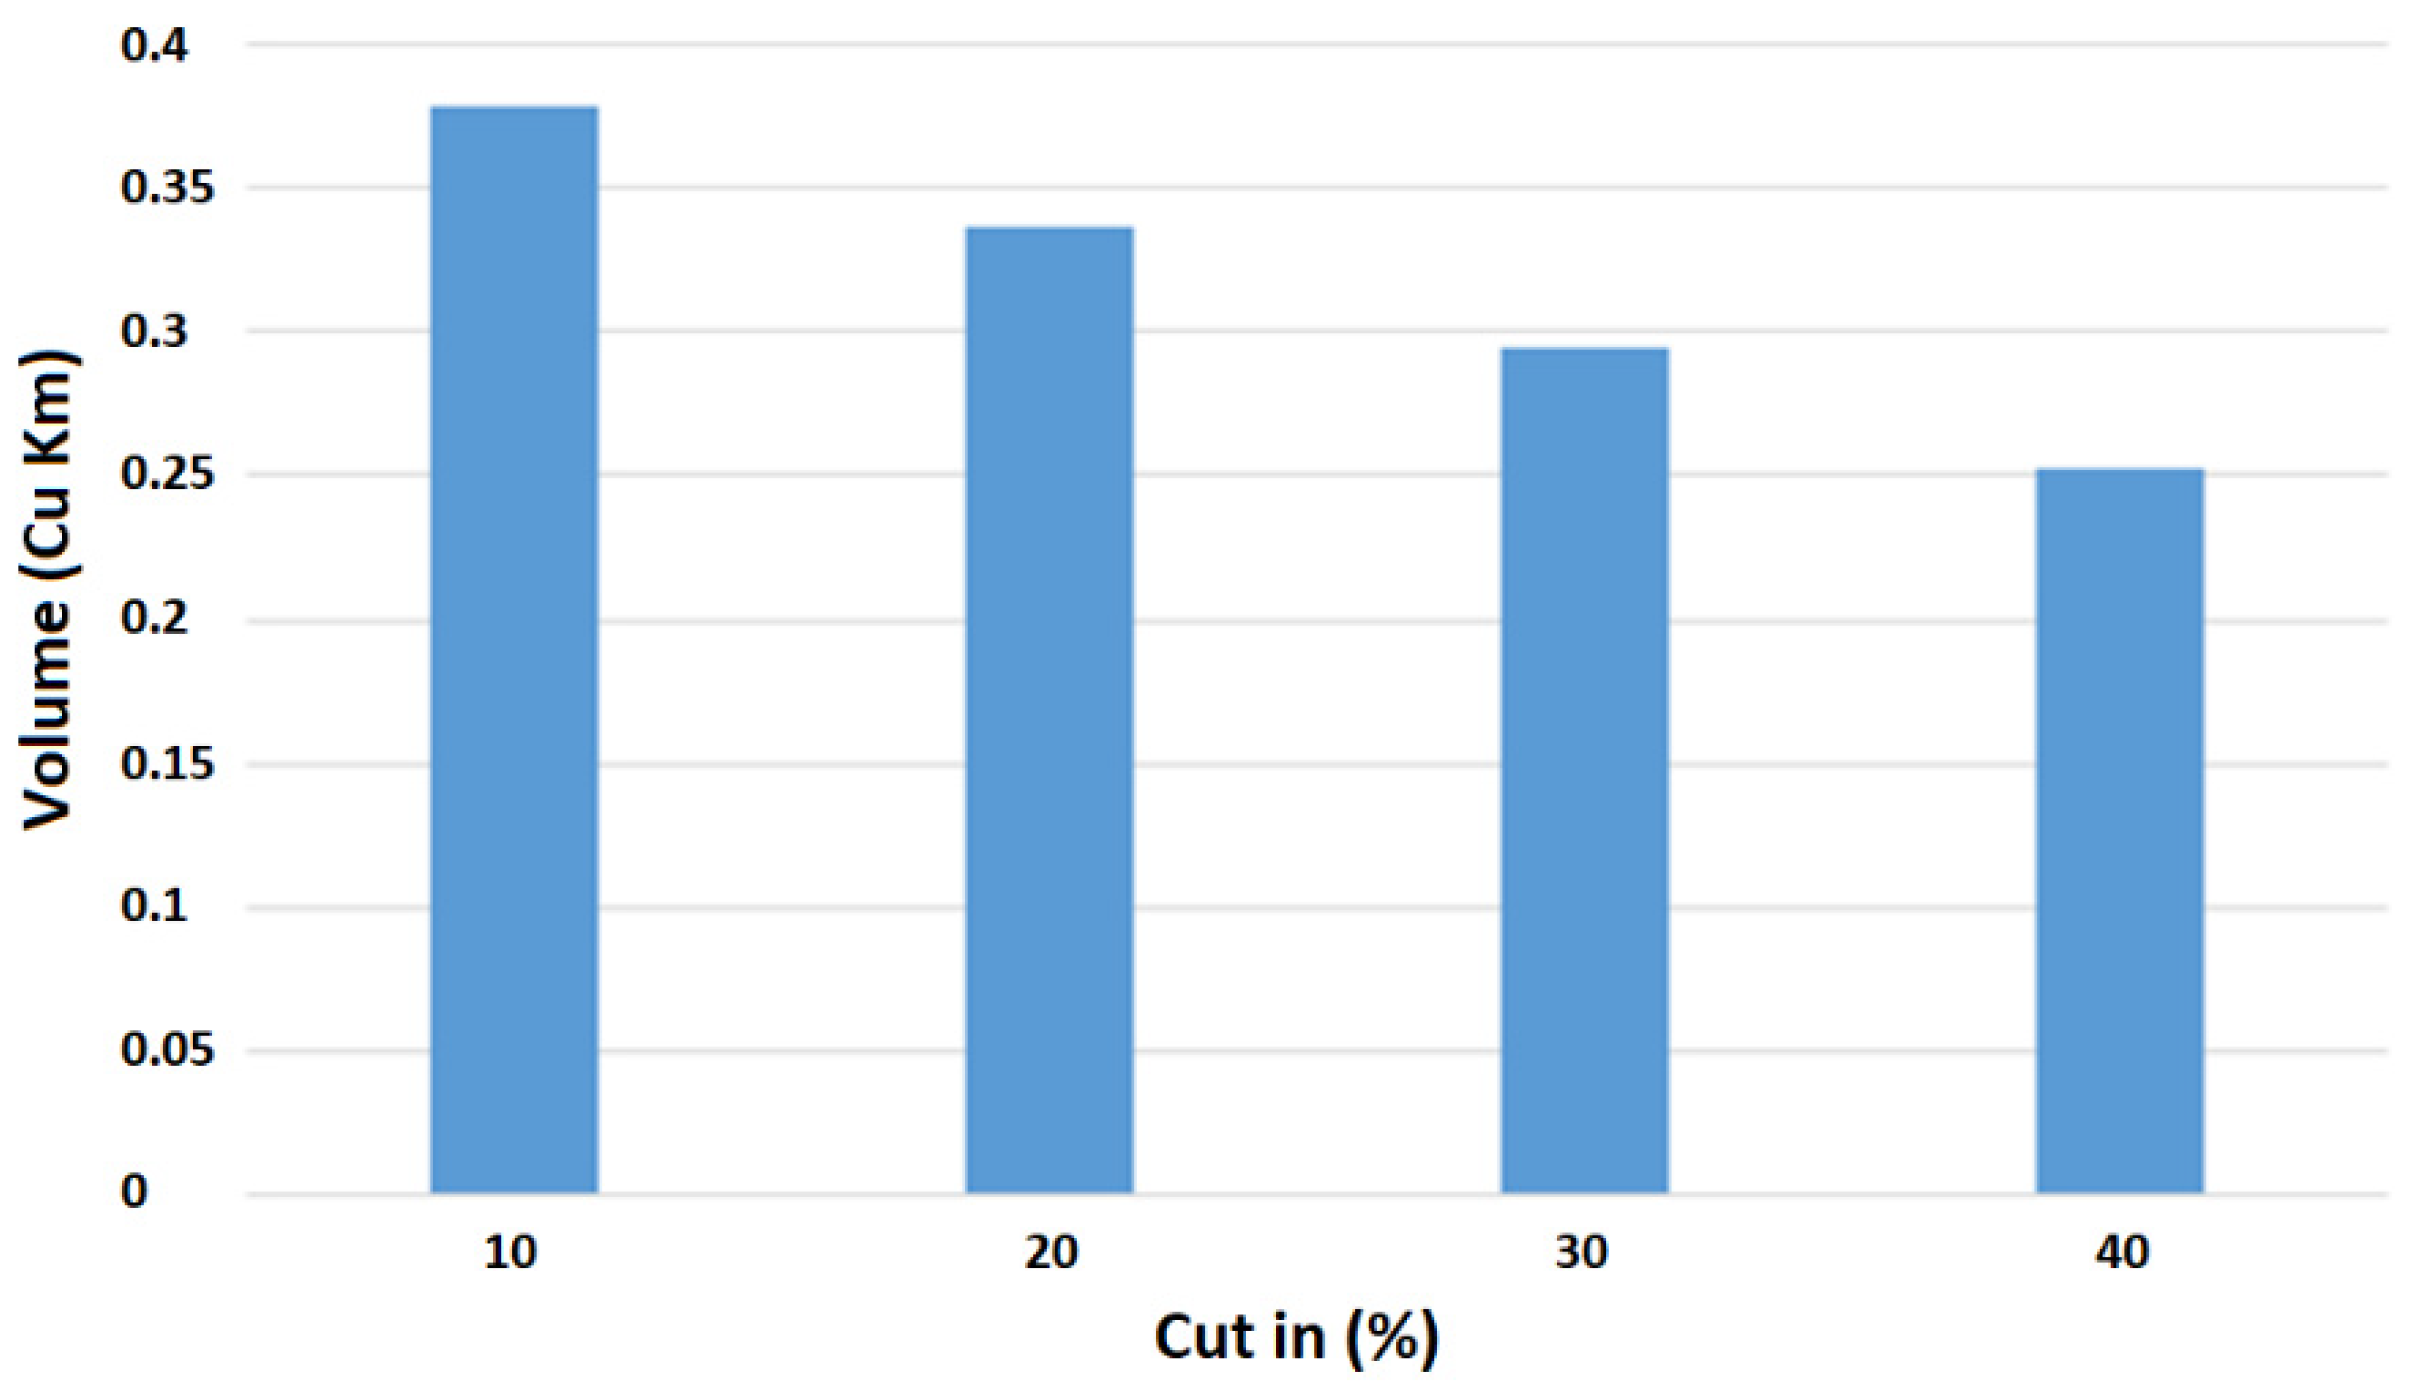
2.2.2. Applying Cuts

Applying cuts means that some water is infiltrated from running water. In the current study, we applied cuts because we had data for four different areas, i.e., range land, barren land, population, and agriculture. All four areas are main causes of the excessive water loss, so we applied cuts to calculate the possible volume of running water. In this study, we applied the following cuts:
Cuts for the years 2000–2020,
  • 10% cut leaves 1.609 km3 of running water.
  • 20% cut leaves 0.804 km3 of running water.
  • 30% cut leaves 0.536 km3 of running water.
  • 40% cut leaves 0.402 km3 of running water.
The total volume of running water in the Peshawar basin without cuts from 2000 to 2020 was 20.9 km3.

3. Results and Discussion

3.1. Volume Estimation of Peshawar Basin

The rain precipitation in the Peshawar basin from 2000 to 2010 is shown in Figure 4 and from 2011 to 2020 in Figure 5. It can be seen that the maximum rain precipitation for the duration 2000 to 2010 was for the months of February, July, and August. For the duration 2011 to 2020, the maximum precipitation was in the months of March and August. The total volume of running water bodies was highly dependent on the rain precipitation.

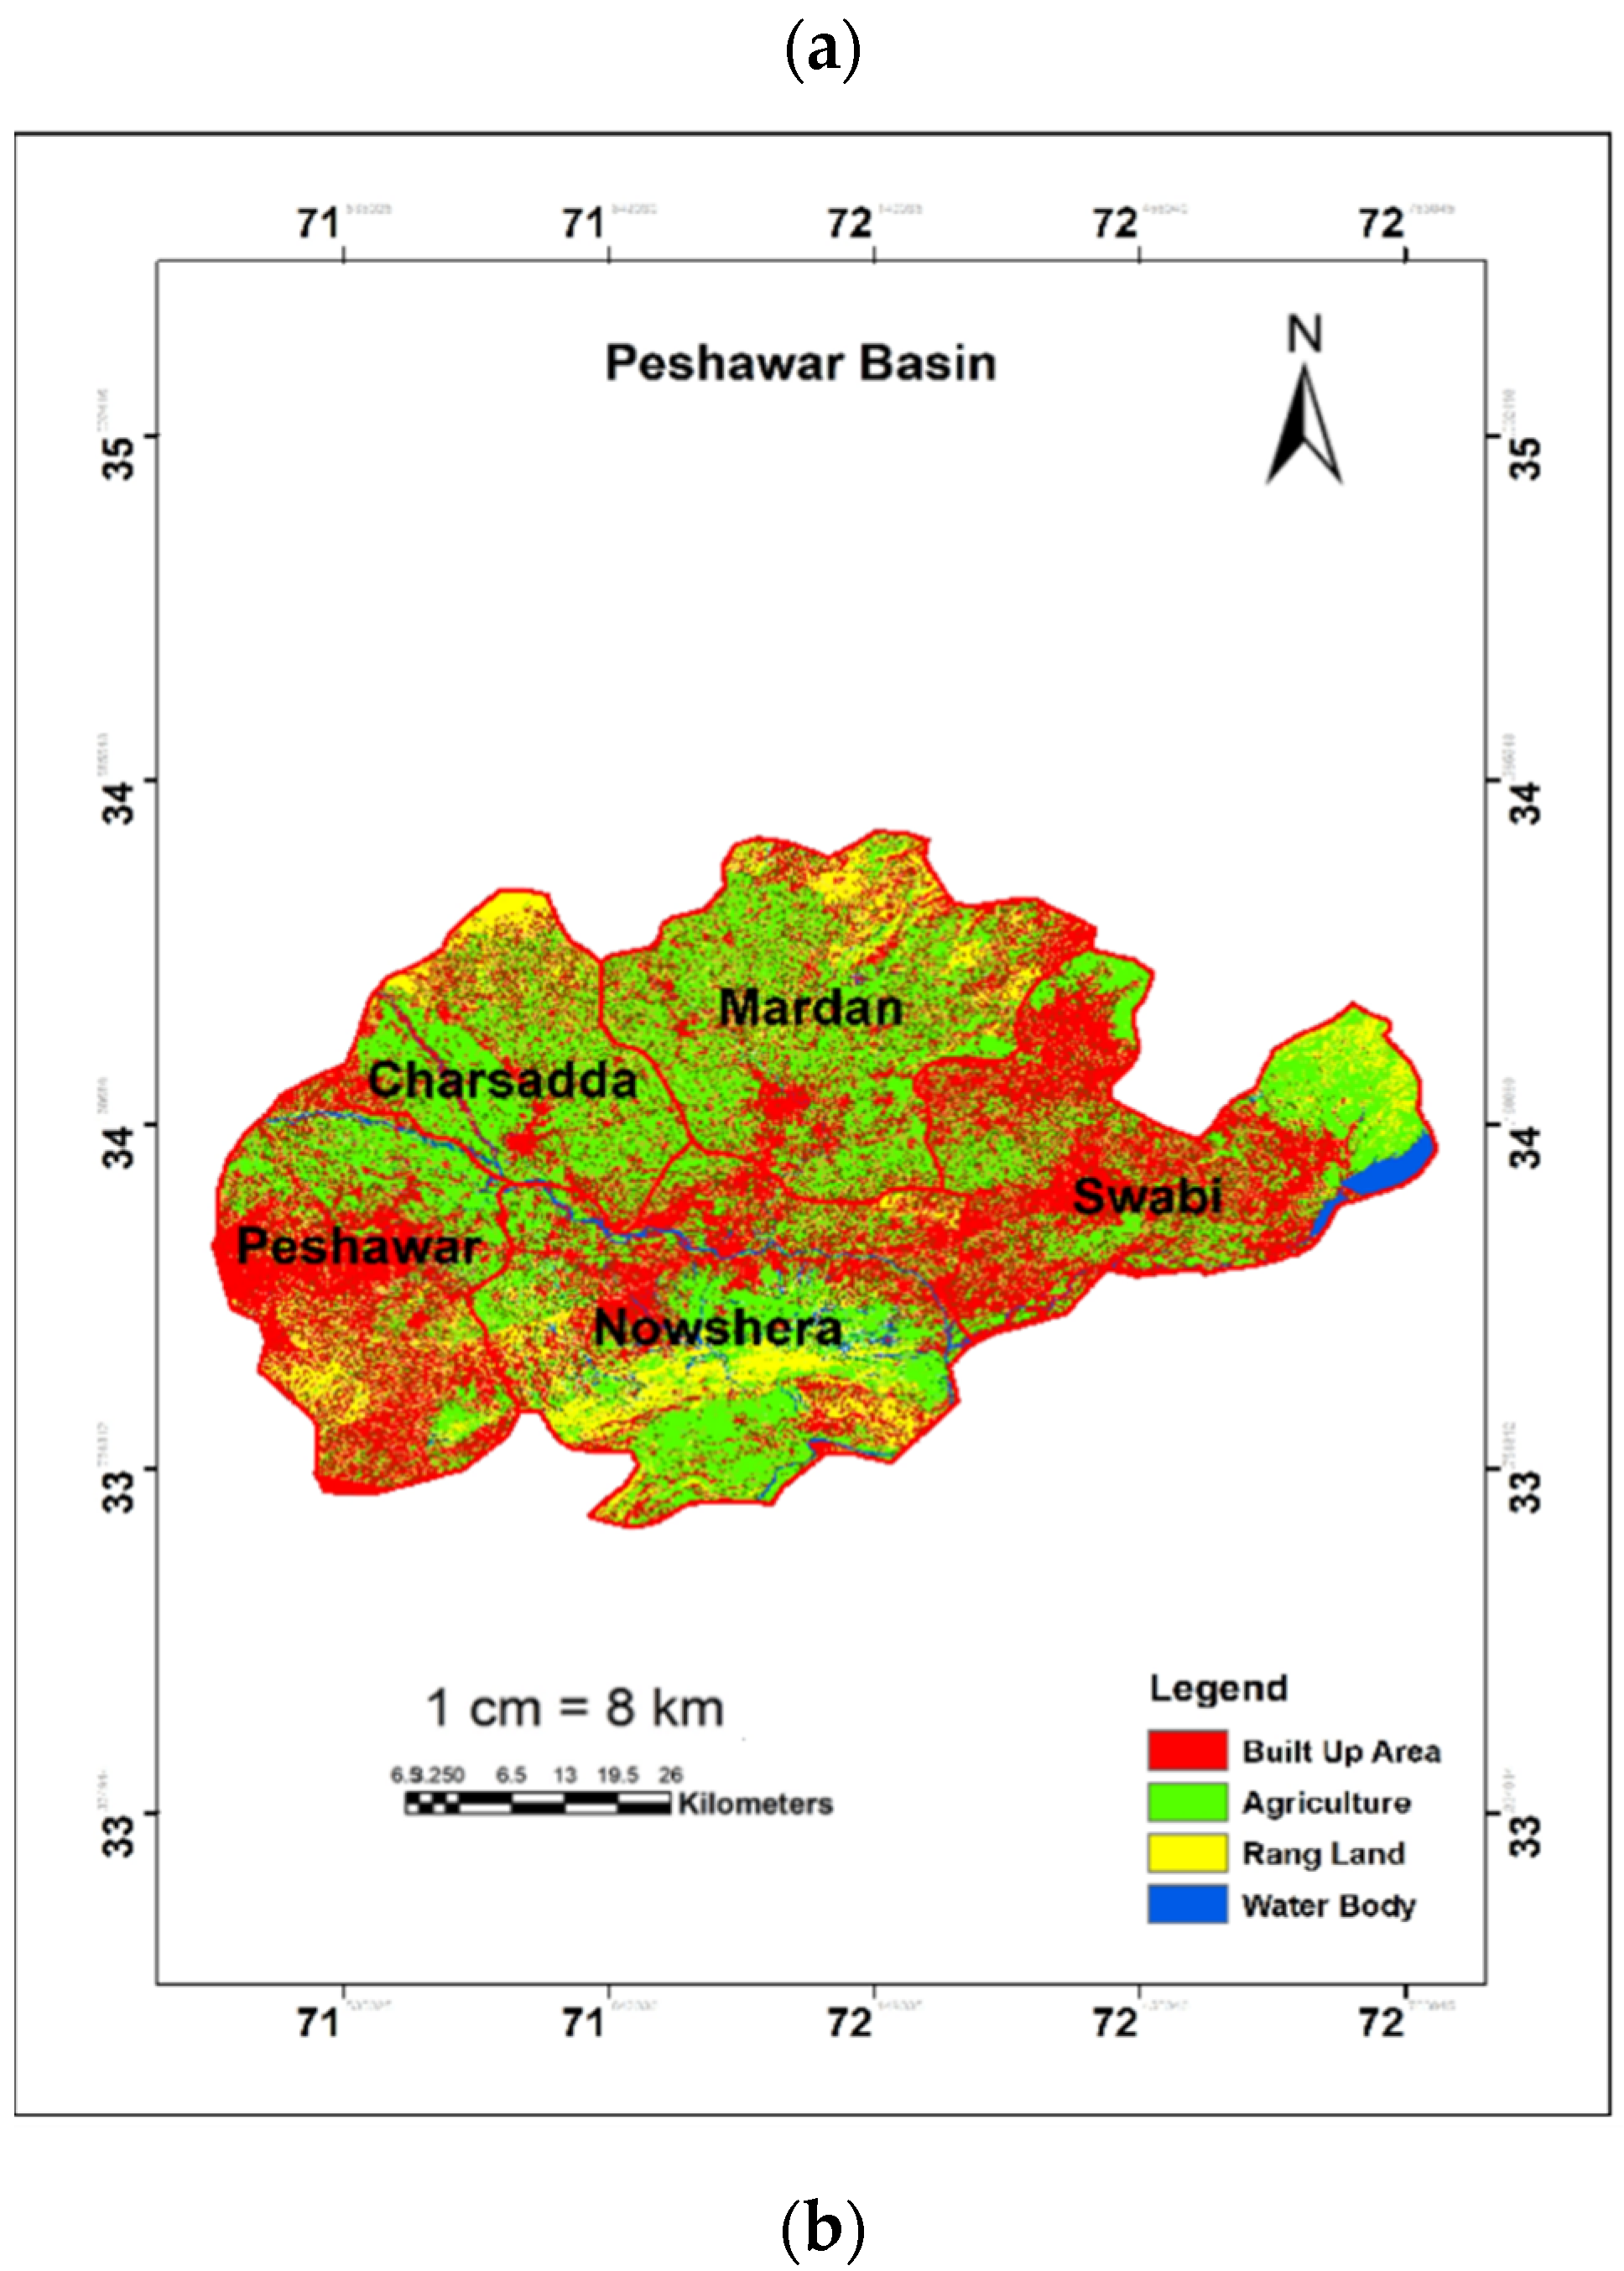
3.2. Map of Peshawar Basin

Peshawar basin is bordered by mountains at its western and southwestern edges. The central and eastern parts of the Peshawar basin are flat. Referring to Figure 6a,b, the gentle slope can be seen from the south moving west and from the north moving east. The Bara River and all the streams originating from the southern and the western parts slope toward the northeast and drain into the Kabul River, which flows on the eastern edges of the Peshawar basin. The maps in Figure 6a,b show the Peshawar basin with an area of 7168 km2. The classes used in the current study were built-up area, agricultural area, range land, and water body. The built-up area, agricultural area, range land and water body shown in Figure 6 are described in Table 1. Table 1 lists the percentages of the areas of the various classes in 2010 and 2020. The difference in the area percentages of the various classes is also given in Table 1.
The details of Figure 6a,b are given in Table 1. It can be seen in Figure 6 that a large portion of the total area of the region was agricultural land. The settled area was comparatively less, and this factor will help in recharging the Peshawar basin.

3.3. Total Area of Peshawar Basin

The Peshawar basin is a broad valley situated in the central part of the Khyber Pakhtunkhwa province of Pakistan. The valley is 7168 km2 in area and traversed by the Kabul River. It has a mean elevation of 345 m (1132 ft). The five most populous cities in the valley are Peshawar, Mardan, Swabi, Charsadda, and Nowshera. As shown in Figure 7, the total area of Peshawar basin is 7168 km2, including five districts: Peshawar, Charsadda, Mardan, Swabi, and Nowshera. The Nowshera district is largest with an area of 1853 km2, and Swabi and Mardan are nearly equal in area, having 1540 and 1558 km2, respectively. On the other hand, Peshawar has an area of 1270 km2, and finally, Charsadda is the smallest, having only 947 km2.
According to the settlement estimation of the Peshawar basin with its five districts as shown in Figure 8, Peshawar district is at the top, having more than one-fourth weightage. Mardan is in second place, having 22% of the total settlement area. The remaining three districts, Nowshera, Swabi and Charsadda, have approximately the same percentages.
Figure 9 shows the total volumes of running water bodies in the settlement areas of the Peshawar basin as 13.9 and 19.4 km3 for 20 years, and it decreases from left to right owing to cuts.

3.4. Map of Charsadda District

The map of the Charsadda region is shown in Figure 10a,b. The area of Charsadda district is 947 km2. It can be seen in Figure 10a,b that a large portion of the total area of the Charsadda region is agricultural land. The settled area is comparatively less, and this factor helps in recharging the Peshawar basin. The details of Figure 10a,b are given in the Table 2. Table 2 lists the area percentages of the various classes in 2010 and 2020. The difference in the percentages of the areas of the various classes is also given in Table 2 for the Charsadda region. Figure 11 shows the total volume of running water bodies in settlement areas of the Charsadda district.

3.5. Map of Peshawar District

The map of the Peshawar district is shown in Figure 12a,b. The area of the Peshawar district is 1270 km2. It can be seen in Figure 12a,b that a large portion of the total area of the Peshawar region was agricultural land in 2010, but in 2020 the built-up area grew in comparison because of the excessive increase in the city population. The details of Figure 12a,b are given in Table 3. Table 3 lists the percentages of the areas of the various classes in 2010 and 2020. The difference in the percentages of the areas of the various classes is also given in Table 3 for the Peshawar district. Figure 13 shows the total volume of running water bodies in settlement areas of the Peshawar district.

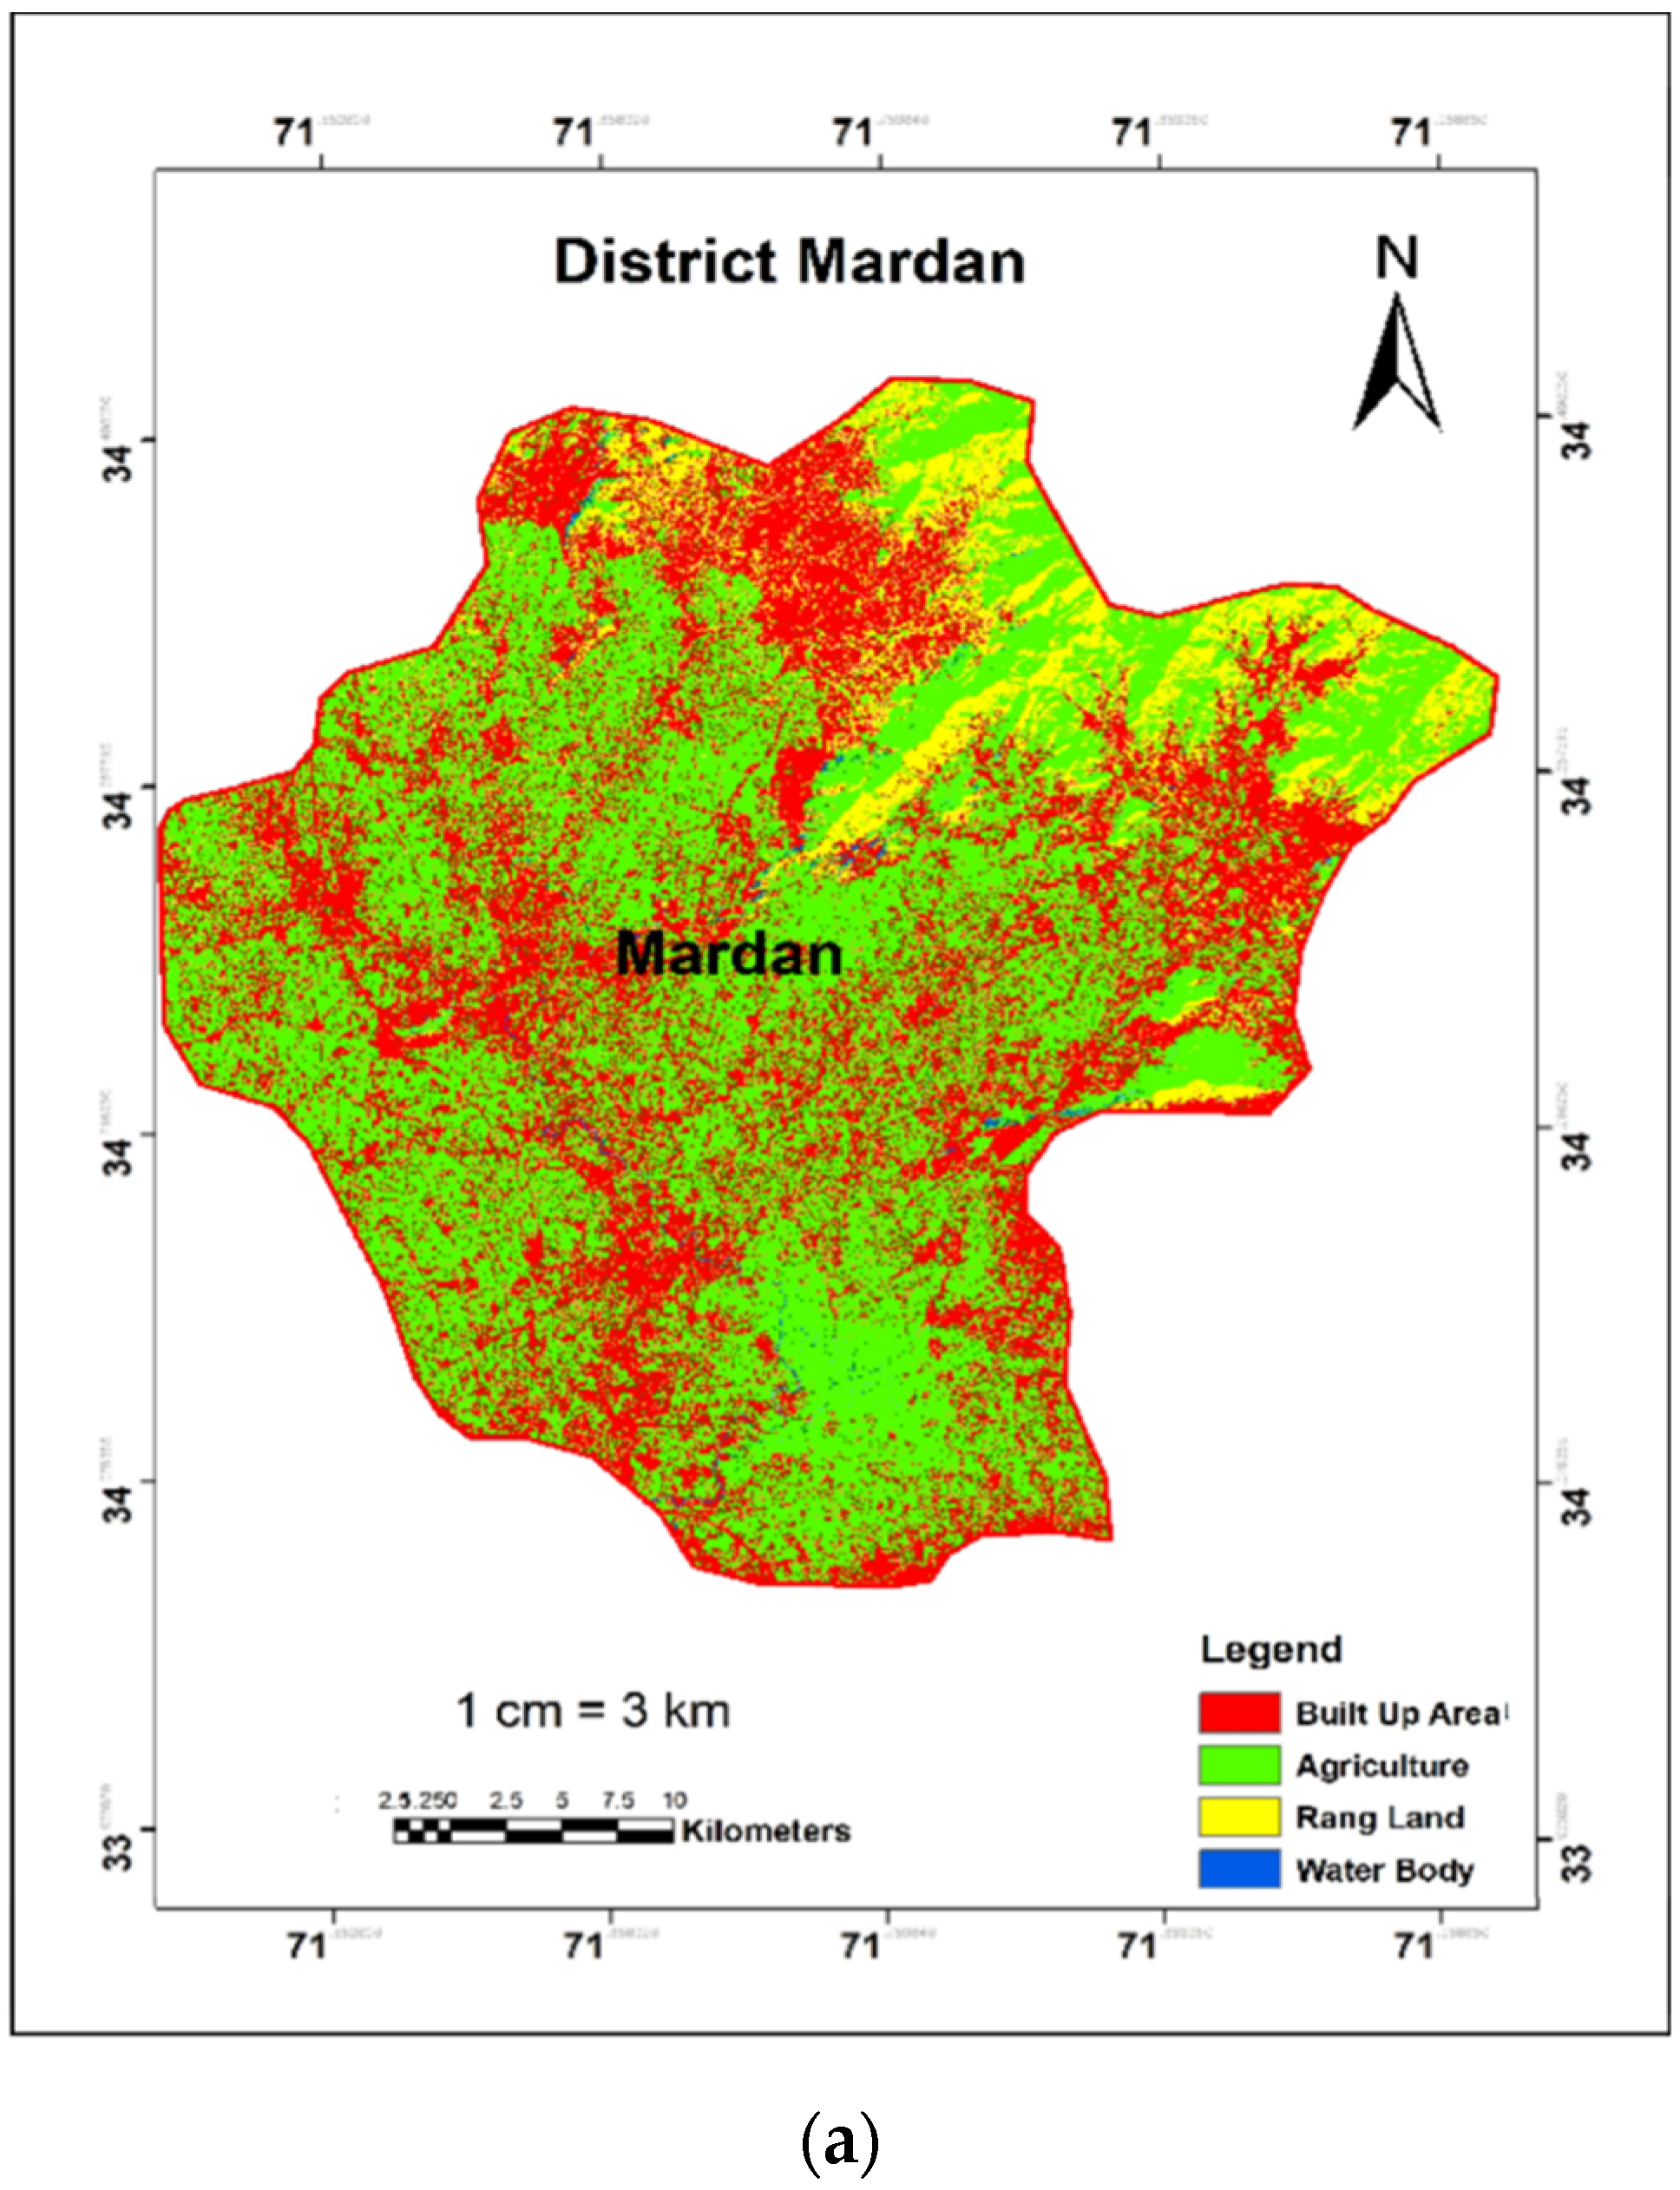
3.6. Map of Mardan District

The map of the Mardan region is shown in Figure 14a,b. The area of the Mardan district 1558 km2. It can be seen in Figure 14a,b that a large portion of the total area of the Mardan region was agricultural land in 2010, but in 2020 the built-up area grew excessively owing to the rapid increase in the city population. The details of Figure 14a,b are given in Table 4. Table 4 lists the percentages of the areas of the various classes in 2010 and 2020. The difference in the percentages of the areas of the various classes is also given in Table 4 for the Mardan district. Figure 15 shows the total volume of running water bodies in settlement areas of the Mardan district.

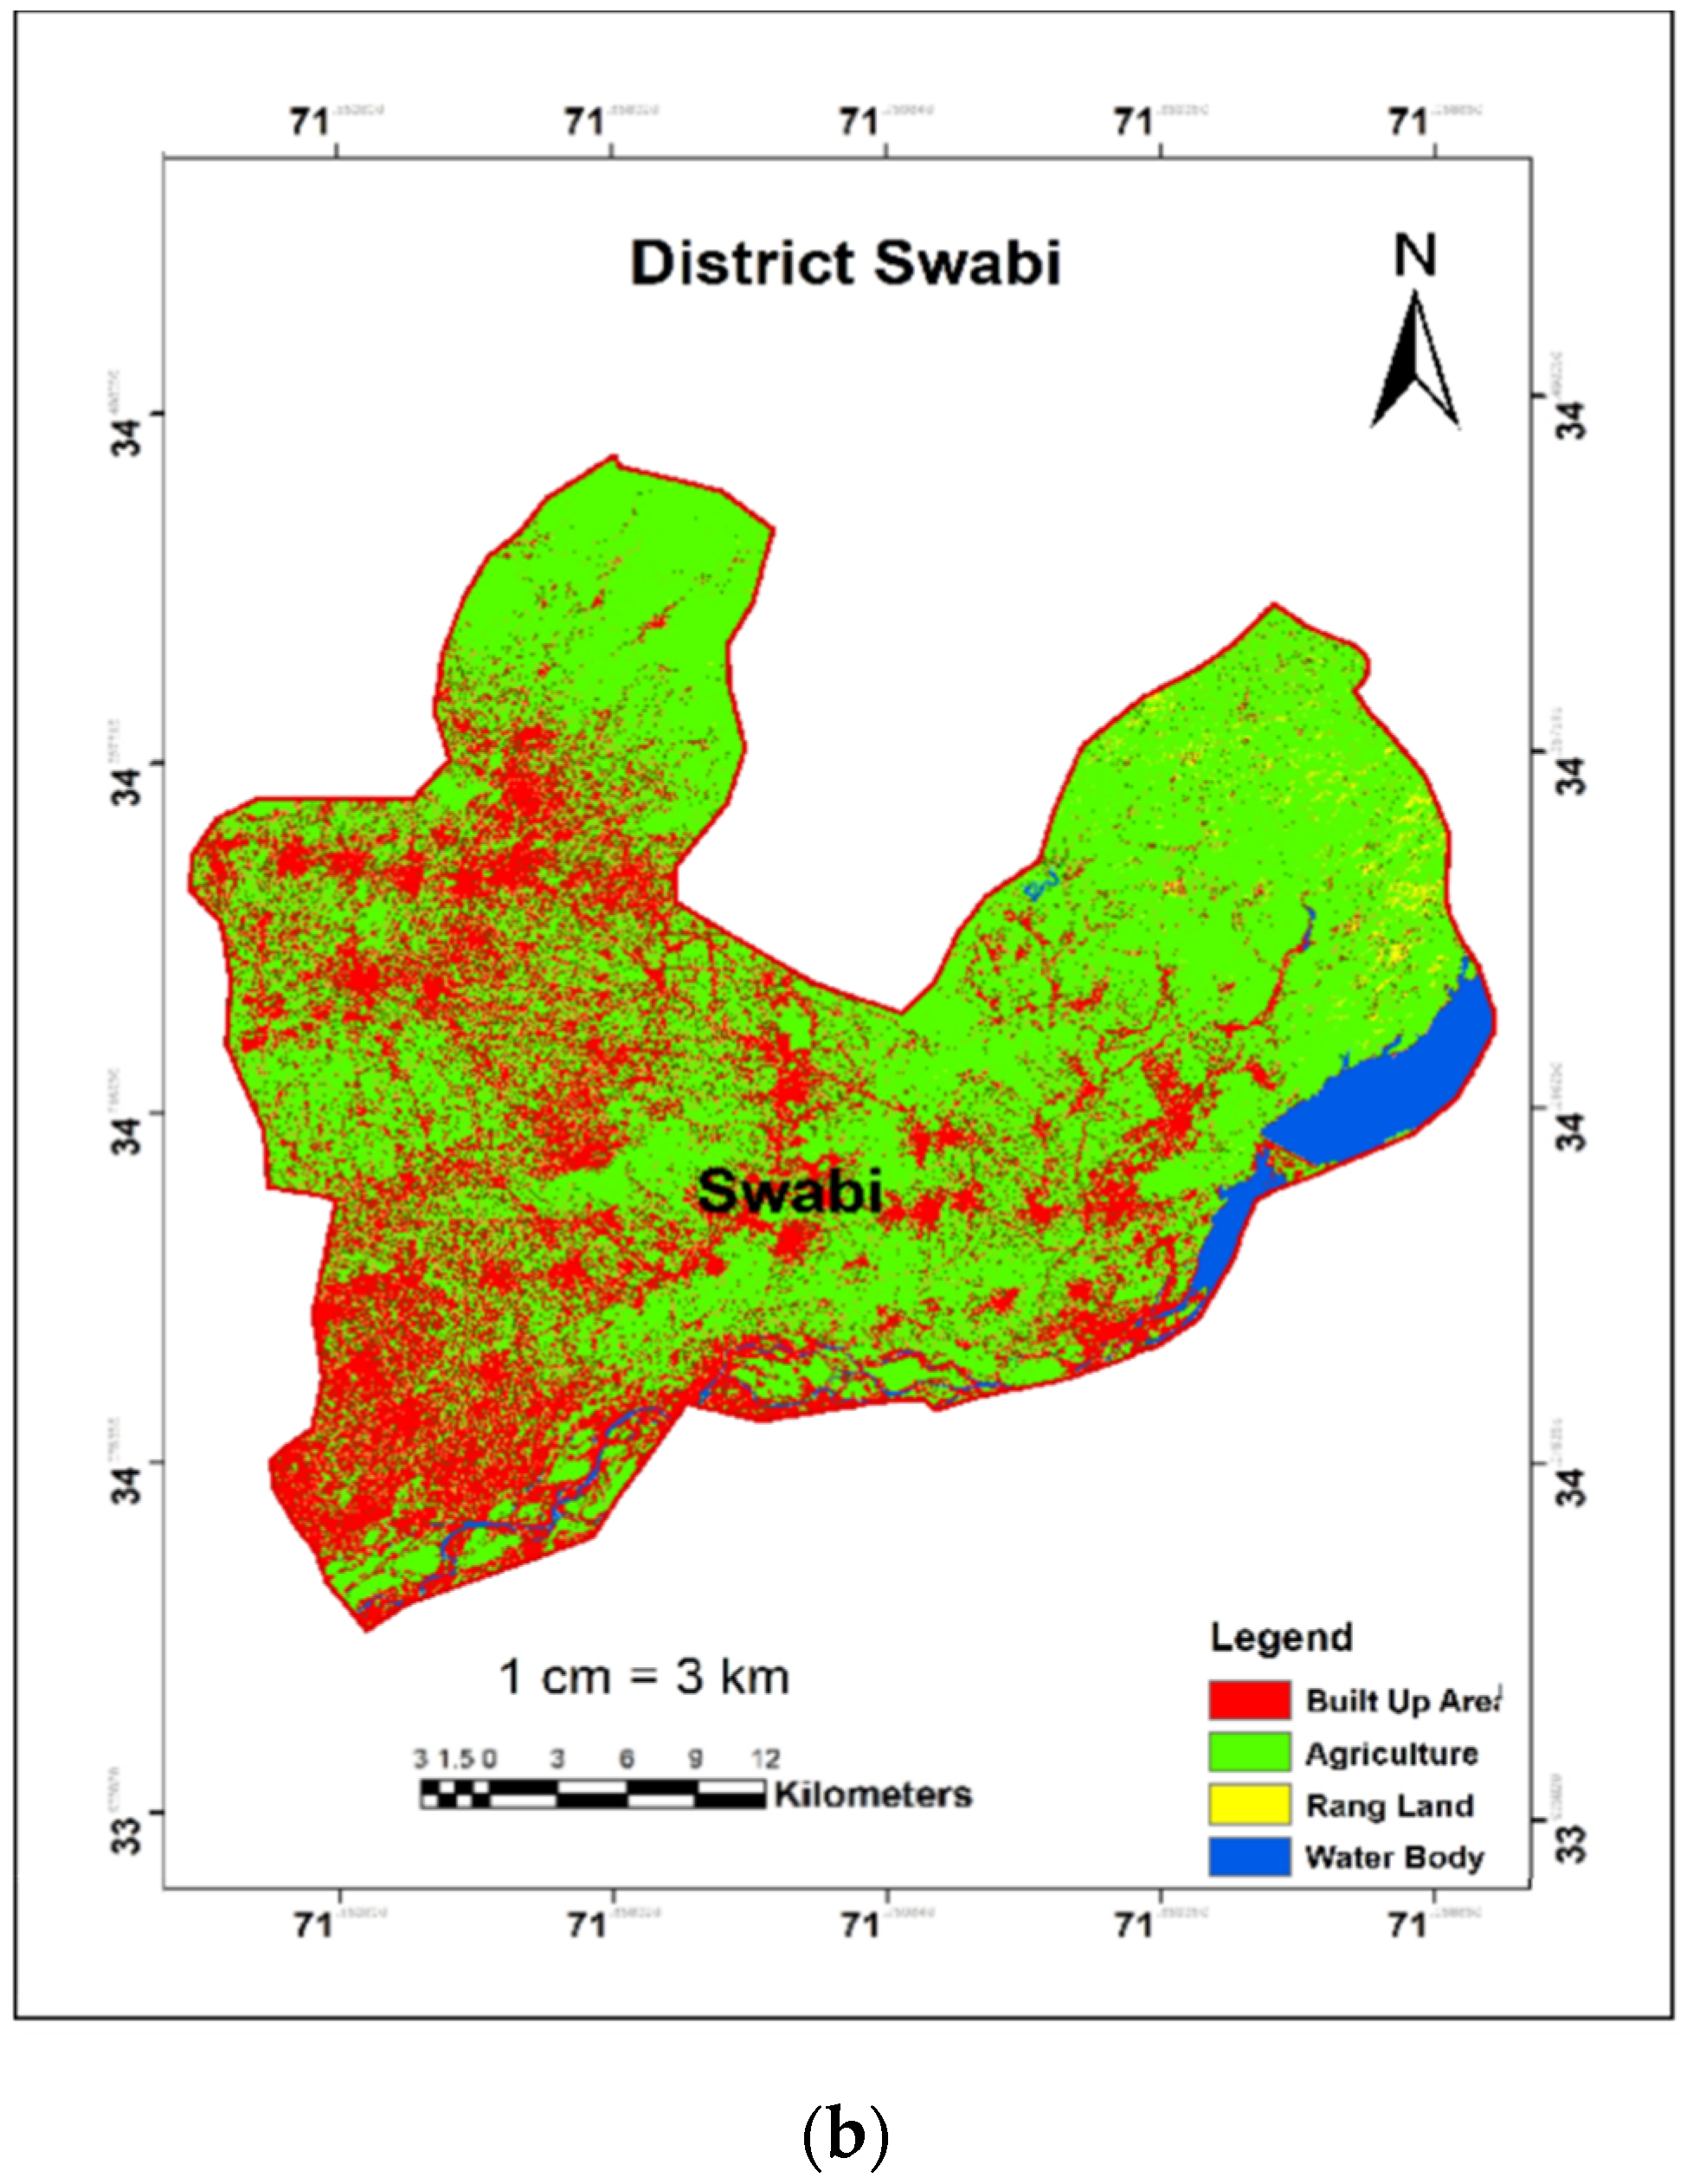
3.7. Map of the Swabi District

The map of the Swabi region is shown in Figure 16a,b. The area of the Swabi district is 1540 km2. It can be seen in Figure 16a,b that a large portion of the total area of the Swabi region is agricultural land. The settlement area is comparatively less, and this factor will be helpful in recharging the Peshawar basin. The details of Figure 16a,b are given in Table 5. Table 5 lists the percentages of the areas of the various classes in 2010 and 2020. The difference in the percentages of the areas of the various classes is also given in Table 5 for the Swabi district. Figure 17 shows the total volume of running water bodies in settlement areas of the Swabi district.

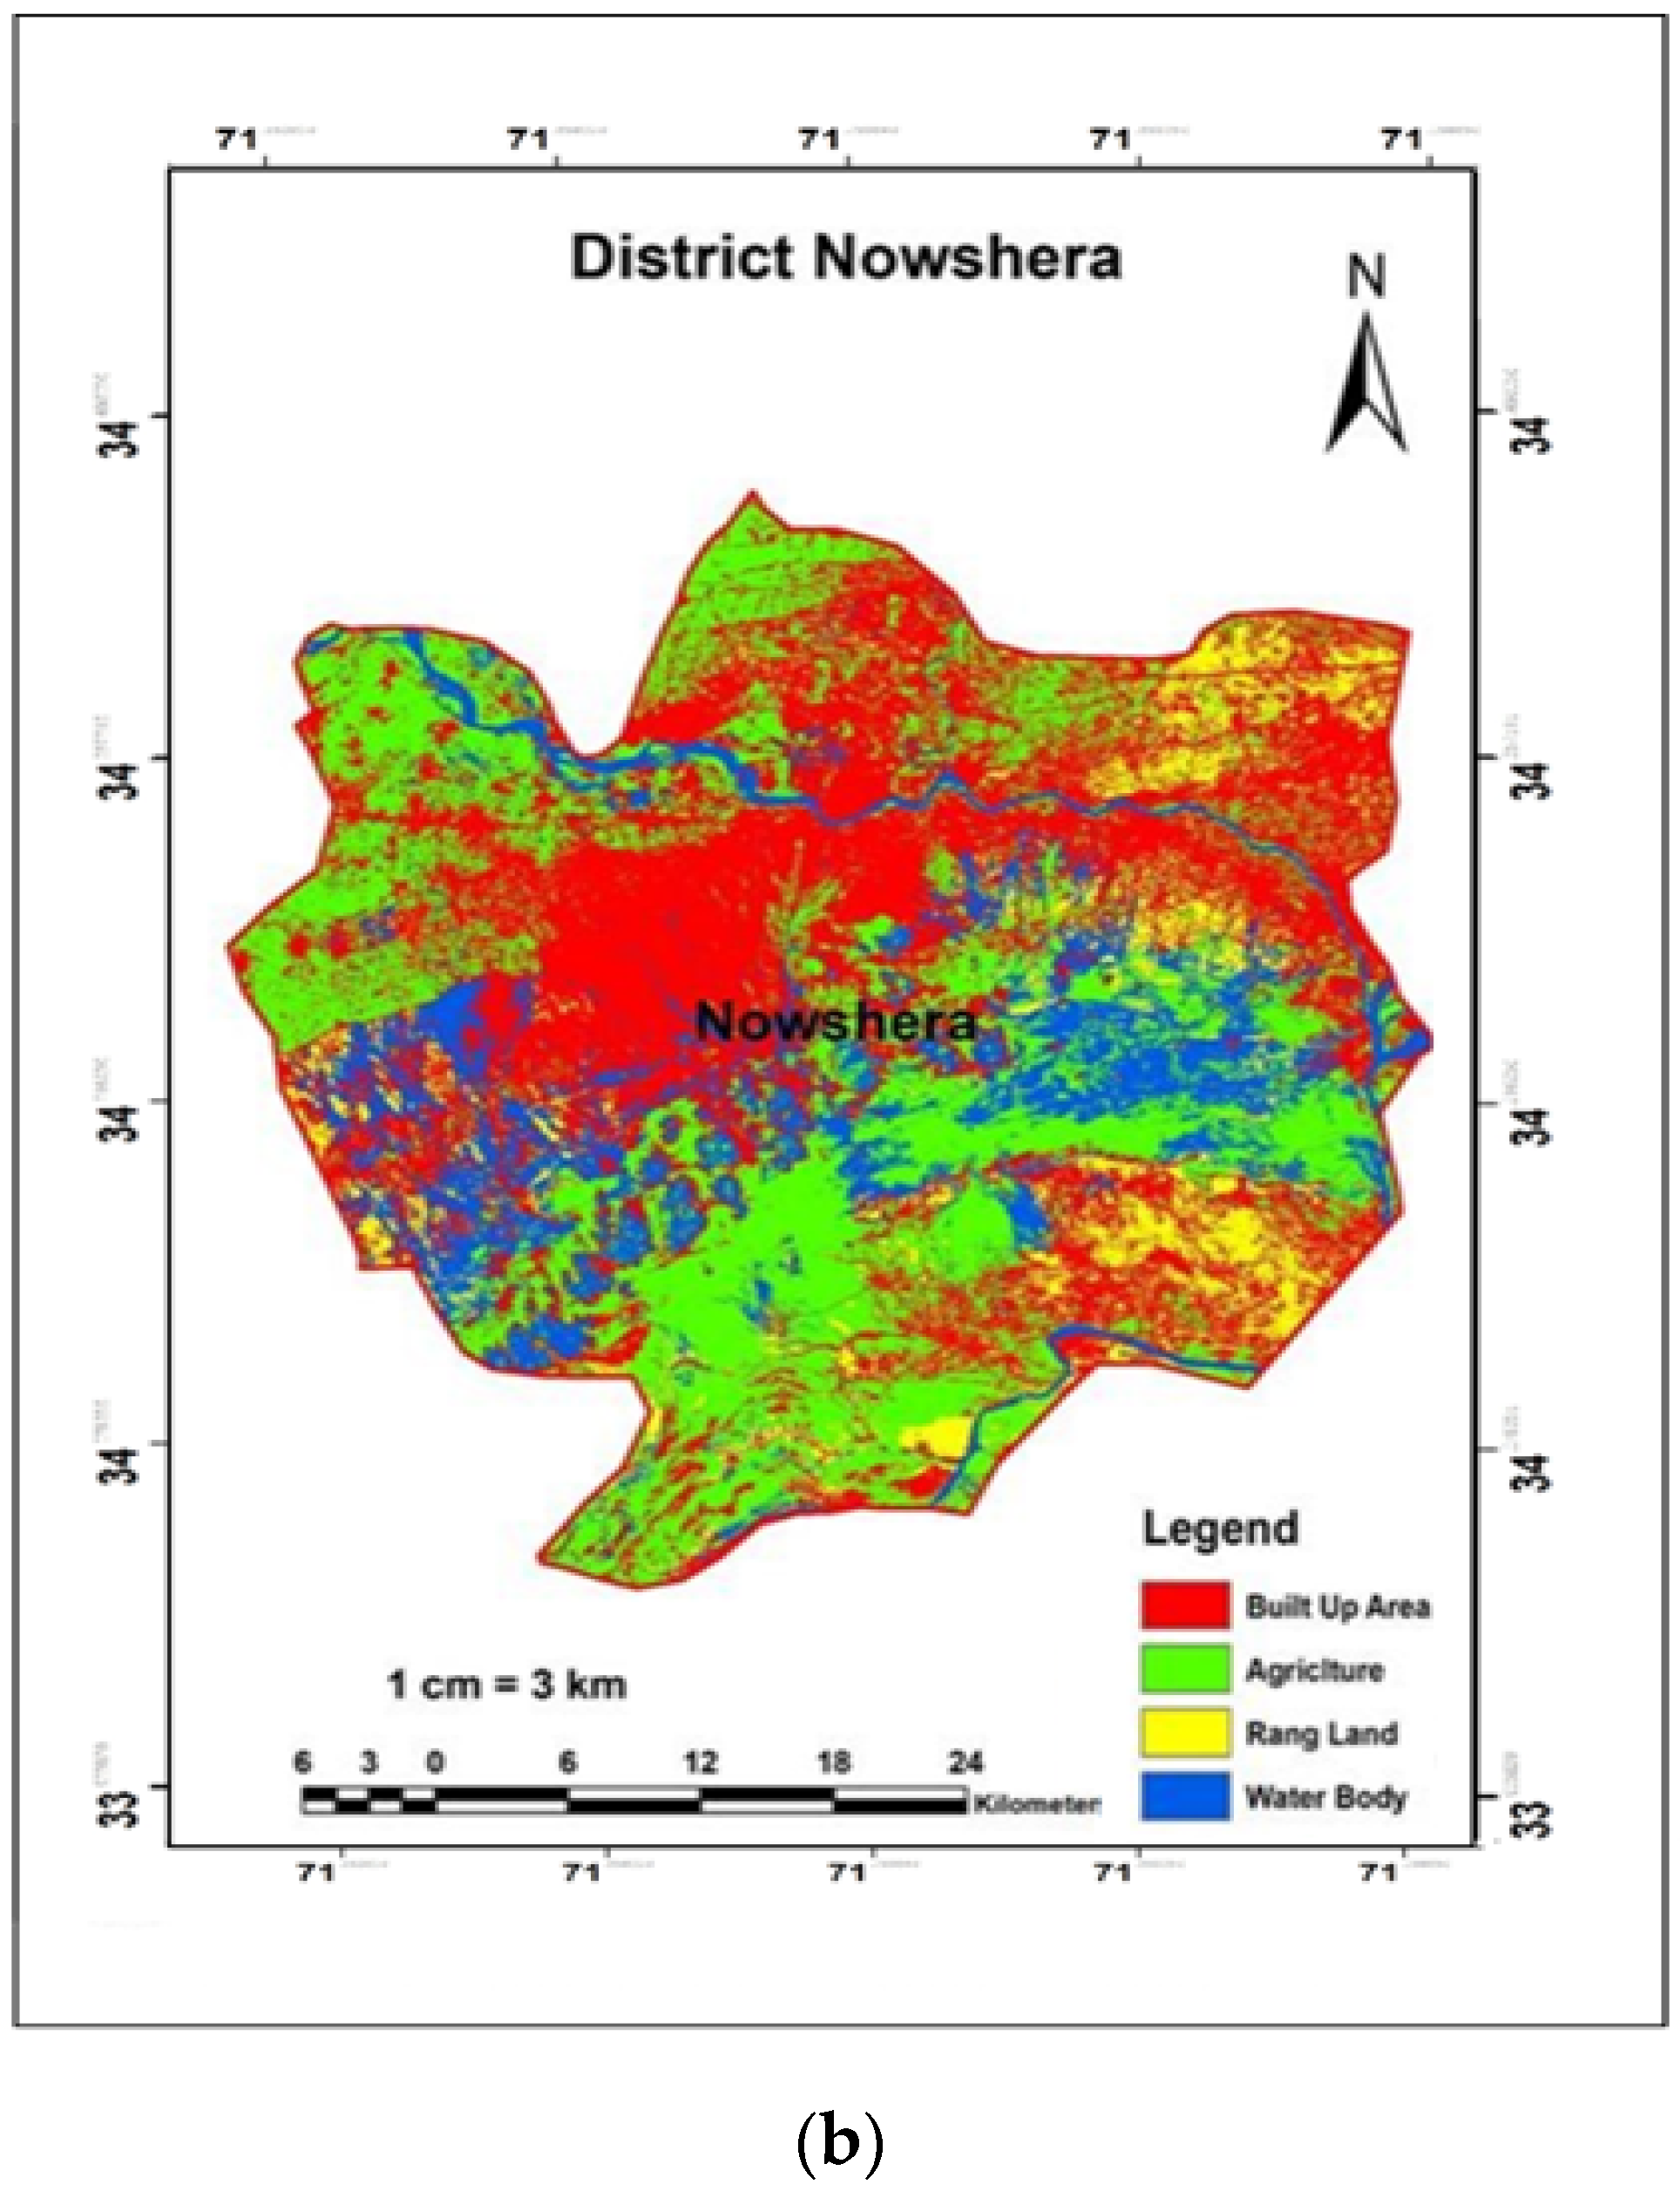
3.8. Map of the Nowshera District

The map of the Nowshera region is shown in Figure 18a,b. The area of Nowshera district is 1853 km2. It can be seen in Figure 18a,b that a large portion of the total area of the Nowshera region is agricultural land, and this factor will be helpful in recharging the Peshawar basin. The details of Figure 18a,b are given in Table 6. Table 6 lists the percentages of the areas of the various classes in 2010 and 2020. The difference in the percentages of the areas of the various classes is also given in Table 6 for the Nowshera district. Figure 19 shows the total volume of running water bodies in settlement areas of the Nowshera district.

4. Discussion

The Peshawar basin is the main basin of the Khyber Pakhtunkhwa (KP) province, but its major parts still have rural characteristics. Urbanization is rapidly stretching in all directions, as can be seen in Table 1, Table 2, Table 3, Table 4, Table 5 and Table 6 and Figure 7, Figure 8, Figure 9, Figure 10, Figure 11, Figure 12, Figure 13, Figure 14, Figure 15, Figure 16, Figure 17, Figure 18 and Figure 19. Of the 7168 km2 total area in 2010, 43.657% was used for agriculture, 13.657% for range land, 41.023% for the built-up area, and the area covered by water bodies was 1.623%. In 2020, the total area used for agriculture was 33.193%; within 20 years, the agriculture land decreased up to 10.464%. Total range land was 8.004%, having decreased up to 5.650%. The total built-up area was 57.503%, having increased up to +16.480. The total land covered by water bodies was 1.306%, having decreased up to 0.317%. The total volume of running water bodies is highly dependent on the rain precipitation. It can be seen in Figure 4 and Figure 5 that the maximum rain precipitation occurred in the months of February, March, July, and August.
In a nutshell, we concluded that the agricultural component contributes a major role in water table recharging based on our study and the previous literature. In Pakistan, most surface water is used for agricultural purposes. Through infiltration, irrigation water indirectly raises the water table in the command area. It has been observed based on LULC analysis that the buildup area increases, which reduces the GW recharge zone as a result of water table drawdown in the project area. The published literature on the study area also supports our findings and results. For example, in a 1960 WAPDA study, waterlogging in the Peshawar basin was reported due to rapid and unplanned urbanization.

5. Conclusions

In the current research study, the total area of Peshawar basin was calculated using ArcGIS 10.7 software at the scale 1:50,000. Based on the modeling results, the total area of the Peshawar basin was determined to be 7168 km2. Using the rainfall data, the total rainfall precipitation data for the Peshawar basin was evaluated to be 10,282 mm. Using the total area and rainfall precipitation, the total volume of running water in the Peshawar basin was calculated. The total volume of running water over 20 years in the Peshawar basin was 72,611,484 km3. By applying cuts at 10%, 20%, 30% and 40%, the volume of water runoff of the settlement area was calculated to be 0.419 km3. The maps of the Peshawar basin and the various districts showed that a large portion of the total area was population/built-up area. The settled area was comparatively large. The settlement area of the Peshawar basin from 2000 to 2010 was 2944 km2. The settlement area of the Peshawar basin from 2010 to 2020 was 4118 km2. Results showed that from 2000 to 2020, there was a significant increase in urbanization and a significant decrease in vegetation. These results can be useful for future planning and development.

Author Contributions

Conceptualization, N.A., S.K., M.E., F.U.R. and A.A.-S.; methodology, N.A., S.K., M.E., F.U.R. and A.A.-S.; software, N.A., S.K., M.E., F.U.R. and A.A.-S.; validation, N.A., S.K., M.E., F.U.R. and A.A.-S.; formal analysis, N.A., S.K., M.E., F.U.R. and A.A.-S.; investigation, N.A., S.K., M.E., F.U.R. and A.A.-S.; resources, N.A., S.K. and A.A.-S.; data curation, N.A., S.K., M.E., F.U.R. and A.A.-S.; writing—original draft preparation, N.A., S.K., M.E., F.U.R. and A.A.-S.; writing—review and editing, N.A., S.K., M.E., F.U.R. and A.A.-S.; visualization, N.A., S.K., M.E. and A.A.-S. All authors have read and agreed to the published version of the manuscript.

Funding

This research received funding from the College of Petroleum Engineering and Geosciences of KFUPM through Startup Fund Grant number SF 18060.

Institutional Review Board Statement

Not applicable.

Informed Consent Statement

Not applicable.

Data Availability Statement

The data presented in this study are available upon request from the corresponding author.

Acknowledgments

The authors appreciate and acknowledge the support provided by King Fahd University of Petroleum and Minerals (KFUPM) by providing all the essential resources to conduct this study.

Conflicts of Interest

The authors declare no conflict of interest.

References

  1. Jessani, S.; Levey, A.S.; Bux, R.; Inker, L.A.; Islam, M.; Chaturvedi, N.; Mariat, C.; Schmid, C.H.; Jafar, T.H. Estimation of GFR in South Asians: A Study from the General Population in Pakistan. Am. J. Kidney Dis. 2014, 63, 49–58. [Google Scholar] [CrossRef] [PubMed]
  2. World Population Review. Available online: https://worldpopulationreview.com/countries/pakistan-population (accessed on 4 September 2021).
  3. Rehman, A.; Jingdong, L.; Shahzad, B.; Chandio, A.A.; Hussain, I.; Nabi, G.; Iqbal, M.S. Economic perspectives of major field crops of Pakistan: An empirical study. Pac. Sci. Rev. B Humanit. Soc. Sci. 2015, 1, 145–158. [Google Scholar] [CrossRef]
  4. Rehman, A.; Jingdong, L.; Du, Y.; Khatoon, R.; Wagan, S.A.; Nisar, S.K. Flood Disaster in Pakistan and its Impact on Agriculture Growth (A Review). J. Econ. Sustain. Dev. 2015, 6, 39–42. [Google Scholar]
  5. Khan, N.; Shah, S.J.; Rauf, T.; Zada, M.; Yukun, C.; Harbi, J. Zada Socioeconomic Impacts of the Billion Trees Afforestation Program in Khyber Pakhtunkhwa Province (KPK), Pakistan. Forests 2019, 10, 703. [Google Scholar] [CrossRef]
  6. Regüés, D.; Badía, D.; Echeverría, M.; Gispert, M.; Lana-Renault, N.; León, J.; Nadal, M.; Pardini, G.; Serrano-Muela, P.; Muñoz, D.R. Analysing the effect of land use and vegetation cover on soil infiltration in three contrasting environments in northeast Spain. Geogr. Res. Lett. 2017, 43, 141–169. [Google Scholar] [CrossRef]
  7. Mustafa, A.; Mustafa, U.; Khalid, M. Rooftop Rain Water Harvesting Technology and Women Time Allocation in District Bagh and Battagram Pakistan. Pak. Dev. Rev. 2011, 50, 459–470. [Google Scholar] [CrossRef]
  8. Iqbal, M.S.; Dahri, Z.H.; Querner, E.P.; Khan, A.; Hofstra, N. Impact of Climate Change on Flood Frequency and Intensity in the Kabul River Basin. Geosciences 2018, 8, 114. [Google Scholar] [CrossRef]
  9. Zhao, G.X.; Lin, G.; Warner, T. Using Thematic Mapper data for change detection and sustainable use of cultivated land: A case study in the Yellow River delta, China. Int. J. Remote Sens. 2004, 25, 2509–2522. [Google Scholar] [CrossRef]
  10. Dwivedi, R.; Sreenivas, S.K.; Ramana, K.V. Land-use/land-cover change analysis in part of Ethiopia using Landsat Thematic Mapper data. Int. J. Remote Sens. 2005, 26, 1285–1287. [Google Scholar] [CrossRef]
  11. Erle, E.; Pontius, R. Land-use and land-cover change. In Encyclopaedia of Earth Environmental Information; Cleveland, C.J., Ed.; Coalition: Washington, DC, USA, 2007. [Google Scholar]
  12. Fan, F.; Weng, Q.; Wang, Y. Land use land cover change in Guangzhou, China, from 1998 to 2003, based on Landsat TM/ETM+ imagery. Sensors 2007, 7, 1323–1342. [Google Scholar] [CrossRef]
  13. Lu, D.; Weng, Q. A survey of image classification methods and techniques for improving classification performance. Int. J. Remote Sens. 2007, 28, 823–870. [Google Scholar] [CrossRef]
  14. Yuan, D.; Elvidge, C.D.; Lunetta, R.S. Survey of multi-spectral methods for land cover change analysis. In Remote Sensing Change Detection: Environmental Monitoring Methods and Applications; Lunetta, R.S., Elvidge, C.D., Eds.; Taylor & Francis: London, UK, 1999; pp. 21–39. [Google Scholar]
  15. Attri, P.; Chaudhry, S.; Sharma, S. Remote sensing & GIS based approaches for LULC change detection–A review. Int. J. Curr. Eng. Technol. 2015, 5, 3126–3137. [Google Scholar]
  16. Chen, X.; Vierling, L.; Deering, D. A simple and effective radiometric correction method to improve landscape change detection across sensors and across time. Remote Sens. Environ. 2005, 98, 63–79. [Google Scholar] [CrossRef]
  17. Gao, J.; Liu, Y. Determination of land degradation causes in Tongyu County, Northeast China via land cover change detection. Int. J. Appl. Earth Obs. Geoinf. 2010, 12, 9–16. [Google Scholar] [CrossRef]
  18. Lu, D.; Mausel, P.; Brondizio, E.; Moran, E. Change detection techniques. Int. J. Remote Sens. 2004, 25, 2365–2407. [Google Scholar] [CrossRef]
  19. Ali, N. Groundwater Assessment of the Peshawar District and Its Potential for Future Demand; College of Science and Engineering, Flinders University: Adelaide, Australia, 2018. [Google Scholar]
  20. Geological Map of North-West Frontier Province Pakistan 2006, Geological Survey of Pakistan. Available online: https://gsp.gov.pk/ (accessed on 13 March 2022).
  21. Farid, A.; Jadoon, K.; Akhter, G.; Iqbal, M.A. Hydrostratigraphy and hydrogeology of the western part of Maira area, Khyber Pakhtunkhwa, Pakistan: A case study by using electrical resistivity. Environ. Monit. Assess. 2013, 185, 2407–2422. [Google Scholar] [CrossRef]
  22. Khan, G.D.; Ali, M.; Akbar, F. Over exploitation of groundwater resources and their influence on groundwater in Peshawar Valley. Civ. Environ. Res. 2014, 6, 85–90. [Google Scholar]
  23. Malik, M.S. Records of groundwater levels of Peshawar Vale, West Pakistan. WASID/WAPDA 1967, 12, 18–40. [Google Scholar]
  24. Padmavathy, A.; Raj, K.G.; Yogarajan, N.; Thangavel, P.; Chandrasekhar, M. Checkdam site selection using GIS approach. Adv. Space Res. 1993, 13, 123–127. [Google Scholar] [CrossRef]
  25. El-Awar, F.A.; Makke, M.; Zurayk, R.A.; Mohtar, R.H. A hydro-spatial hierarchical methodology for siting water har-vesting reservoirs in dry areas. In Proceedings of the 2000 ASAE Annual International Meeting, Milwaukee, WI, USA, 9–12 July 2000; pp. 1–33. [Google Scholar]
  26. Shankar, M.R.; Mohan, G. A GIS based hydrogeomorphic approach for identification of site-specific ar-tifi-cial-recharge techniques in the Deccan Volcanic Province. J. Earth Syst. Sci. 2005, 114, 505–514. [Google Scholar] [CrossRef]
  27. De Winnaar, G.; Jewitt, G.; Horan, M. A GIS-based approach for identifying potential runoff harvesting sites in the Thukela River basin, South Africa. Phys. Chem. Earth Parts A/B/C 2007, 32, 1058–1067. [Google Scholar] [CrossRef]
  28. Ammar, A.; Riksen, M.; Ouessar, M.; Ritsema, C. Identification of suitable sites for rainwater harvesting structures in arid and semi-arid regions: A review. Int. Soil Water Conserv. Res. 2016, 4, 108–120. [Google Scholar] [CrossRef]
  29. Bakir, M.; Xingnan, Z. GIS and Remote Sensing applications for rainwater harvesting in the Syrian Desert (Al-Badia). In Proceedings of the Twelfth International Water Technology Conference, IWTC12 2008, Alexandria, Egypt, 1 January 2008. [Google Scholar]
  30. Rammal, M.; Berthier, E. Runoff Losses on Urban Surfaces during Frequent Rainfall Events: A Review of Observations and Modeling Attempts. Water 2020, 12, 2777. [Google Scholar] [CrossRef]
  31. Hari, D.; Reddy, K.R.; Vikas, K.; Srinivas, N.; Vikas, G. Assessment of rainwater harvesting potential using GIS. In Proceedings of the IOP Conference Series: Materials Science and Engineering, Hyderabad, India, 1–2 June 2017; Volume 330, pp. 1–9. [Google Scholar]
  32. Balasubramanian, A. Digital Elevation Model (DEM) in GIS; University of Mysore: Karnataka, India, 2017. [Google Scholar]
  33. Abdulwahd, A.K.; Liejy, M.C.; Sulaiman, M.A.; Al-Ansari, N. Water Runoff Estimation Using Geographical Information System (GIS) for Alrakhmah Basin Valley Northeast of Iraq. Engineering 2020, 12, 315–324. [Google Scholar] [CrossRef]
  34. Alcaras, E.; Amoroso, P.P.; Parente, C.; Prezioso, G. Remotely sensed image fast classification and smart thematic map production. ISPRS Int. Arch. Photogramm. Remote Sens. Spat. Inf. Sci. 2021, 46, 43–50. [Google Scholar] [CrossRef]
  35. Amano, H.; Iwasaki, Y. Estimation of groundwater recharge in Kumamoto area, Japan in 2016 by mapping land cover using GIS data and SPOT 6/7 satellite images. Sustainability 2022, 14, 545. [Google Scholar] [CrossRef]
  36. Odekunle, T.O.; Orinmoogunje, I.O.O.; Ayanlade, A. Application of GIS to assess rainfall variability impacts on crop yield in Guinean Savanna part of Nigeria. Afr. J. Biotechnol. 2007, 6, 2100–2113. [Google Scholar] [CrossRef]
  37. Bandi, A.S.; Meshapam, S.; Deva, P. A geospatial approach to flash flood hazard mapping in the city of Warangal, Telangana, India. Environ. Socio-Econ. Stud. 2019, 7, 1–13. [Google Scholar] [CrossRef]
  38. Schumann, A.; Funke, R.; Schultz, G. Application of a geographic information system for conceptual rainfall–runoff modeling. J. Hydrol. 2000, 240, 45–61. [Google Scholar] [CrossRef]
  39. Dewan, A.M.; Islam, M.M.; Kumamoto, T.; Nishigaki, M. Evaluating flood hazard for land-use planning in greater Dhaka of Bangladesh using remote sensing and GIS techniques. Water Resour. Manag. 2007, 21, 1601–1612. [Google Scholar] [CrossRef]
  40. Liu, Y.; Gebremeskel, S.; De Smedt, F.; Hoffmann, L.; Pfister, L. A diffusive transport approach for flow routing in GIS-based flood modeling. J. Hydrol. 2003, 283, 91–106. [Google Scholar] [CrossRef]
  41. Kumar, A.; Kanga, S.; Taloor, A.K.; Singh, S.K.; Đurin, B. Surface runoff estimation of Sind river basin using integrated SCS-CN and GIS techniques. HydroResearch 2021, 4, 61–74. [Google Scholar] [CrossRef]
  42. Garba, M.D.; Muhammad, U.; Khan, S.; Farrukh, K.; Ahmad, S.; Muhamad, G.; Akram, F.E.; Muhammad, H. CO2 towards fuels: A review of catalytic conversion of carbon dioxide to hydrocarbons. J. Environ. Chem. Eng. 2021, 9, 104756. [Google Scholar] [CrossRef]
  43. Khan, S.; Khulief, Y.A.; and Al-Shuhail, A.A. Effects of reservoir size and boundary conditions on pore-pressure buildup and fault reactivation during CO2 injection in deep geological reservoirs. Environ. Earth Sci. 2020, 79, 1–23. [Google Scholar] [CrossRef]
  44. Israf, U.D.; Usman, M.; Khan, S.; Aasif, H.; Alotaibi, M.A.; Alharthi, A.I.; Centi, G. Prospects for a green methanol thermo-catalytic process from CO2 by using MOFs based materials: A mini-review. J. CO2 Util. 2021, 43, 101361. [Google Scholar] [CrossRef]
  45. Khan, S.; Khulief, Y.A.; and Al-Shuhail, A.A. The geomechanical and fault activation modeling during CO2 injection into deep Minjur reservoir, eastern Saudi Arabia. Sustainability 2020, 12, 9800. [Google Scholar] [CrossRef]
  46. Hussain, A.; Dipietro, J.A.; Pogue, K.R. Stratigraphy and structure of the Peshawar basin, Pakistan. J. Nepal Geol. Soc. 1998, 18, 25–35. [Google Scholar] [CrossRef]
  47. Pogue, K.R.; Wardlaw, B.R.; Harris, A.G.; Hussain, A. Paleozoic and Mesozoic stratigraphy of the Peshawar basin, Pakistan: Correlations and implications. Geol. Soc. Am. Bull. 1992, 104, 915–927. [Google Scholar] [CrossRef]
  48. Hussain, A.; Pogue, K.E.V.I.N.; Khan, S.R.; Ahmad, I.M.T.I.A.Z. Paleozoic stratigraphy of the Peshawar basin, Pakistan. Geol. Bull. Univ. Peshawar 1991, 24, 85–97. [Google Scholar]
  49. Hussain, A.; Yeats, R.S.; Pogue, K. Stratigraphy and structural events around the southern margin of Peshawar basin, Pakistan. Geol. Bull. Univ. Peshawar 1989, 22, 45–54. [Google Scholar]
  50. Magsi, H.Z. Seismogeodynamics of the Hazara-Kashmir transverse trough, Pakistan. New Concepts Glob. Tecton. J. 2015, 3, 477–490. [Google Scholar]
  51. Taraky, Y.; Liu, Y.; McBean, E.; Daggupati, P.; Gharabaghi, B. Flood Risk Management with Transboundary Conflict and Cooperation Dynamics in the Kabul River Basin. Water 2021, 13, 1513. [Google Scholar] [CrossRef]
  52. Al-Shuhail, A.A.; Alshuhail, A.A.; Khulief, Y.A.; Salam, S.A.; Chan, S.A.; Ashadi, A.L.; Al-Lehyani, A.F.; Almubarak, A.M.; Khan, M.Z.U.; Abdulrahman, K.A.; et al. KFUPM Ghawar digital viscoelastic seismic model. Arab. J. Geosci. 2019, 12, 245. [Google Scholar] [CrossRef]
  53. Ahmad, N.; Khan, S.; Al-Shuhail, A. Seismic data interpretation and petrophysical analysis of Kabirwala area Tola (01) well, Central Indus Basin, Pakistan. Appl. Sci. 2021, 11, 2911. [Google Scholar] [CrossRef]
  54. Khan, A.M.; Al-Juhani, S.G.; Abdul, S.Y.E.D. Digital viscoelastic seismic models and data sets of central Saudi Arabia in the presence of near-surface karst features. J. Seism. Explor. 2020, 29, 15–28. [Google Scholar]
  55. Chan, S.A.; Edigbue, P.; Khan, S.; Ashadi, A.L.; Al-Shuhail, A.A. Viscoelastic model and synthetic seismic data of eastern Rub’Al-Khali. Appl. Sci. 2021, 11, 1401. [Google Scholar] [CrossRef]
  56. Shah, M.M.; Afridi, S.; Khan, E.U.; Rahim, H.U.; Mustafa, M.R. Diagenetic Modifications and Reservoir Heterogeneity Associated with Magmatic Intrusions in the Devonian Khyber Limestone, Peshawar Basin, NW Pakistan. Geofluids 2021, 2021, 1–18. [Google Scholar] [CrossRef]
  57. Hasany, S.T.; Khan, F. Paleozoic Sequences as Potential Source Rocks for Petroleum in Northwestern Pakistan, with Particular Reference to the Silurian System, a Major Petroleum Source in the Middle East and North Africa. Available online: https://www.searchanddiscovery.com/pdfz/documents/2012/30263hasany/ndx_hasany.pdf.html (accessed on 16 March 2022).
  58. Ashraf, M.; Khattak, W.; Khan, M.A. Bara thrust zone, southern khyber agency, northern pakistan: Insight for the tec-tonic boundary between the attock-cherat-khyber and the kalachitta-samana hill ranges. J. Himal. Earth Sci. 2012, 45, 28–29. [Google Scholar]
  59. Hylland, M.D.; Robert, S.Y. Stratigraphic and structural framework of Himalayan foothills. In Himalaya and Tibet: Mountain Roots to Mountain Tops; The Geological Society of America: Boulder, CO, USA, 1999; Volume 328, p. 257. [Google Scholar]
  60. Anjum, M.N.; Ali, N.; Rehman, Z.U.; Ghayas, M.; Ahmad, W. Rock aggregate potential of limestone units in the Khyber Formation, Pakistan. Int. J. Econ. Environ. Geol. 2018, 9, 26–33. [Google Scholar]
  61. Regional Meteorological Center (RMC) Peshawar. Available online: http://www.pmd.gov.pk/rmc/KP-about.html (accessed on 5 February 2022).
  62. ArcGIS Desktop 10.7.x System Requirements—System Requirements|Documentation. Available online: https://desktop.arcgis.com/en/system-requirements/10.7/arcgis-desktop-system-requirements.htm (accessed on 5 February 2022).
  63. Hütt, C.; Koppe, W.; Miao, Y.; Bareth, G. Best Accuracy Land Use/Land Cover (LULC) Classification to Derive Crop Types Using Multitemporal, Multisensor, and Multi-Polarization SAR Satellite Images. Remote Sens. 2016, 8, 684. [Google Scholar] [CrossRef]
  64. United States Geological Survey. Available online: https://www.usgs.gov/ (accessed on 5 February 2022).
Figure 1. Location of the study area (after Hussain et al., 1991 [48]).
Sustainability 14 03754 g001
Figure 2. Tectonic map of the study area (modified from Haleem Zaman [50]).
Sustainability 14 03754 g002
Figure 3. Stratigraphic column showing lithological successions of formations exposed in the current study area [56].
Sustainability 14 03754 g003
Figure 4. The rainfall precipitation in Peshawar basin from 2000 to 2010.
Sustainability 14 03754 g004
Figure 5. The rainfall precipitation in the Peshawar basin from 2011 to 2020.
Sustainability 14 03754 g005
Figure 6. (a) Map of the Peshawar basin in 2010. (b) Map of the Peshawar basin in 2020.
Sustainability 14 03754 g006aSustainability 14 03754 g006b
Figure 7. Total area of the Peshawar basin.
Sustainability 14 03754 g007
Figure 8. Settlement areas of the entire five districts in the Peshawar basin.
Sustainability 14 03754 g008
Figure 9. Total volume of running water bodies in settlement areas of the Peshawar basin.
Sustainability 14 03754 g009
Figure 10. (a) Map of the Charsadda district in 2010. (b) Map of the Charsadda district in 2020.
Sustainability 14 03754 g010aSustainability 14 03754 g010b
Figure 11. Total volume of running water in the settlement area of the Charsadda district.
Sustainability 14 03754 g011
Figure 12. (a) Map of the Peshawar district in 2010. (b) Map of the Peshawar district in 2020.
Sustainability 14 03754 g012aSustainability 14 03754 g012b
Figure 13. Total volume of running water in settlement areas of the Peshawar district.
Sustainability 14 03754 g013
Figure 14. (a) Map of the Mardan district in 2010. (b) Map of the Mardan district in 2020.
Sustainability 14 03754 g014aSustainability 14 03754 g014b
Figure 15. Total volume of running water in the settlement area of the Mardan district.
Sustainability 14 03754 g015
Figure 16. (a) Map of the Swabi district in 2010. (b) Map of the Swabi district in 2020.
Sustainability 14 03754 g016aSustainability 14 03754 g016b
Figure 17. Total volume of running water in the settlement area of the Swabi district.
Sustainability 14 03754 g017
Figure 18. (a) Map of the Nowshera district in 2010. (b) Map of the Nowshera district in 2020.
Sustainability 14 03754 g018aSustainability 14 03754 g018b
Figure 19. Total volume of running water in the settlement area of the Nowshera district.
Sustainability 14 03754 g019
Table 1. The built-up area, agriculture area, range land, and water body in the Peshawar basin.
Categories20102020Changed Area (%)
Area (km2)Area (%)Area (km2)Area (%)
Water body116.4941.62393.5761.306−0.317
Built-up area2943.86541.0234117.80557.503+16.480
Range Land980.09513.657573.1908.004−5.650
Agricultural area3132.88943.6572376.92933.193−10.464
Table 2. The built-up area, agriculture area, range land, and water body in the Charsadda district.
Categories20102020Changed Area (%)
Area (km2)Area (%)Area (km2)Area (%)
Water body6.7990.6823.8450.386−0.296
Built-up area335.41233.675445.078 44.686+11.011
Range land88.3498.87055.0475.526−3.340
Agricultural area566.19856.847492.79449.472−7.375
Table 3. The built-up area, agriculture area, range land, and water body in the Peshawar district.
Categories20102020Changed Area (%)
Area (km2)Area (%)Area (km2)Area (%)
Water body30.4552.42222.6071.798−0.624
Built-up area687.35456.682902.199 71.773+15.091
Range land238.32618.959150.74511.992−6.967
Agricultural area301.13332.956181.31814.424−18.532
Table 4. The built-up area, agriculture area, range land, and water body in the Mardan district.
Categories20102020Changed Area (%)
Area (km2)Area (%)Area (km2)Area (%)
Water body5.5141.3373.5761.219−0.118
Built-up area660.18540.452863.32052.899+12.447
Range land143.2298.77693.5707.733−1.043
Agricultural area823.50050.459673.00841.238−9.221
Table 5. The built-up area, agriculture area, range land, and water body in the Swabi district.
Categories20102020Changed Area (%)
Area (km2)Area (%)Area (km2)Area (%)
Water body48.2783.12844.3452.873−0.255
Built-up area516.79933.493993.60464.381+30.888
Range land242.64815.725108.0577.003−8.722
Agricultural area730.27147.327398.96725.856−21.471
Table 6. The built-up area, agriculture area, range land and water body in the Nowshera district.
Categories20102020Changed Area (%)
Area (km2)Area (%)Area (km2)Area (%)
Water body25.4481.45519.2031.104−0.351
Built-up area744.11542.569931.604 53.295+10.726
Range land267.54315.305165.3489.459−5.846
Agricultural area712.28740.748631.20536.110−4.638
Publisher’s Note: MDPI stays neutral with regard to jurisdictional claims in published maps and institutional affiliations.

