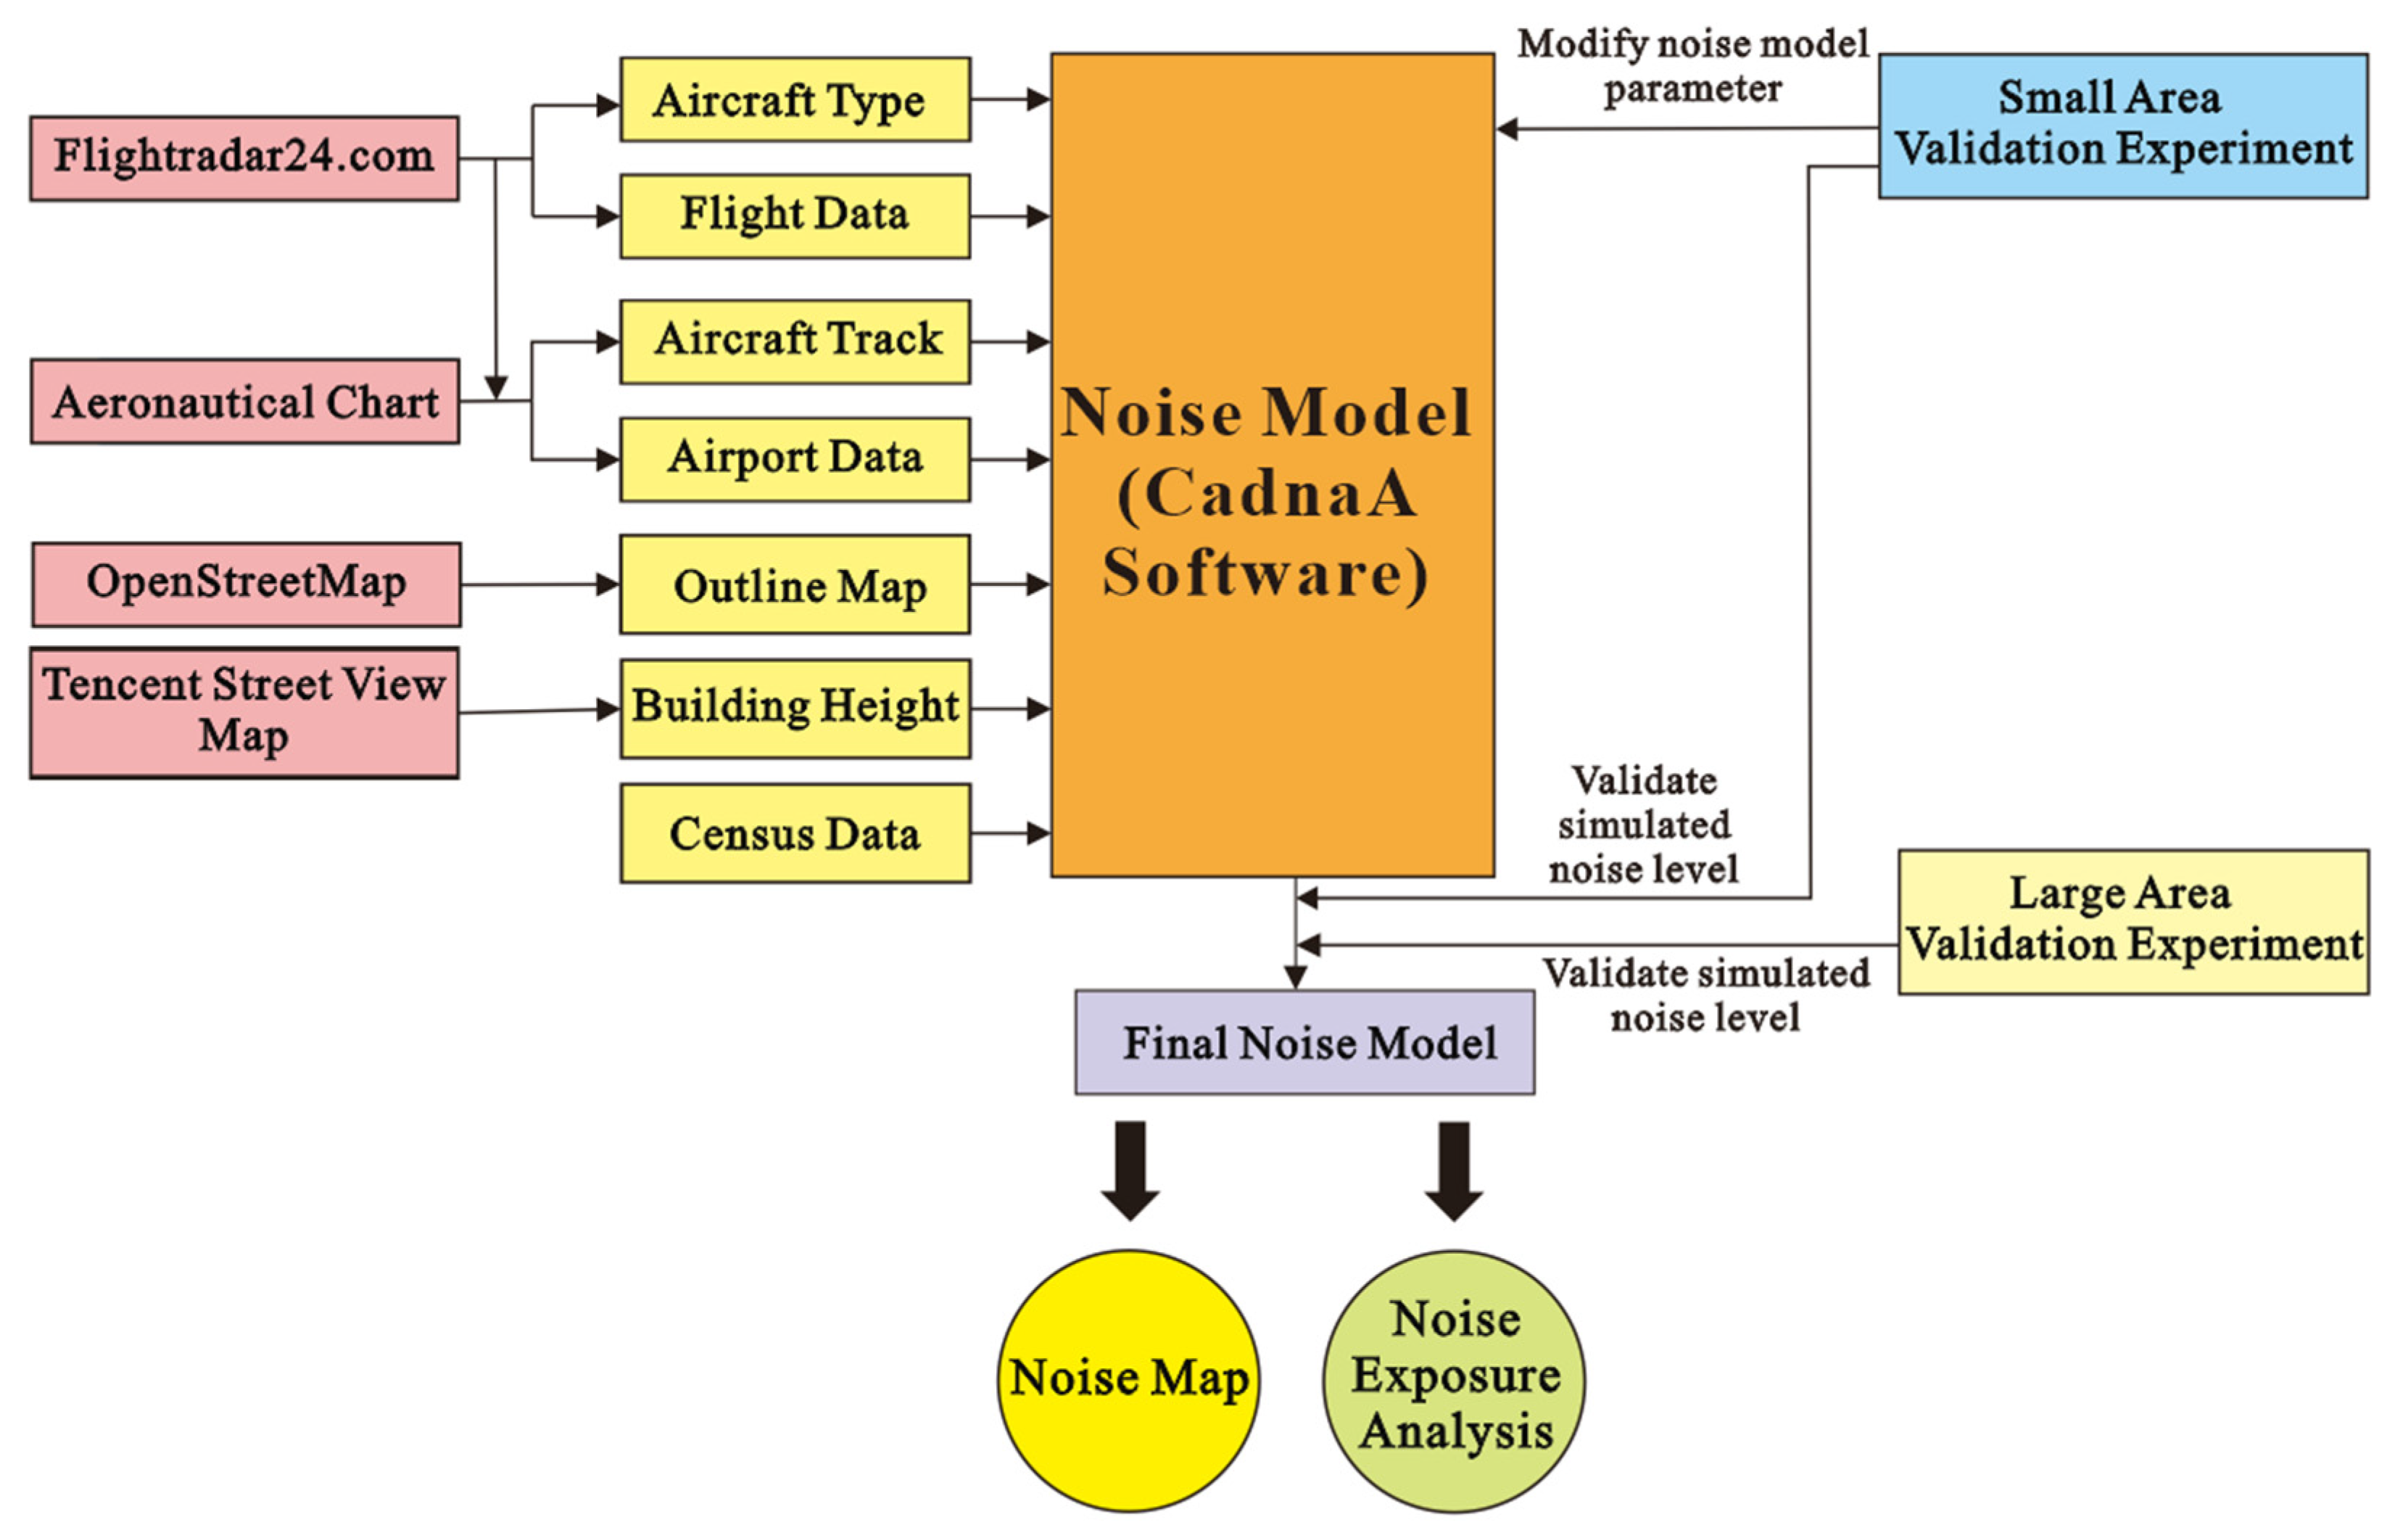
Figure 1.
Methodologies in the present study.
Figure 1.
Methodologies in the present study.
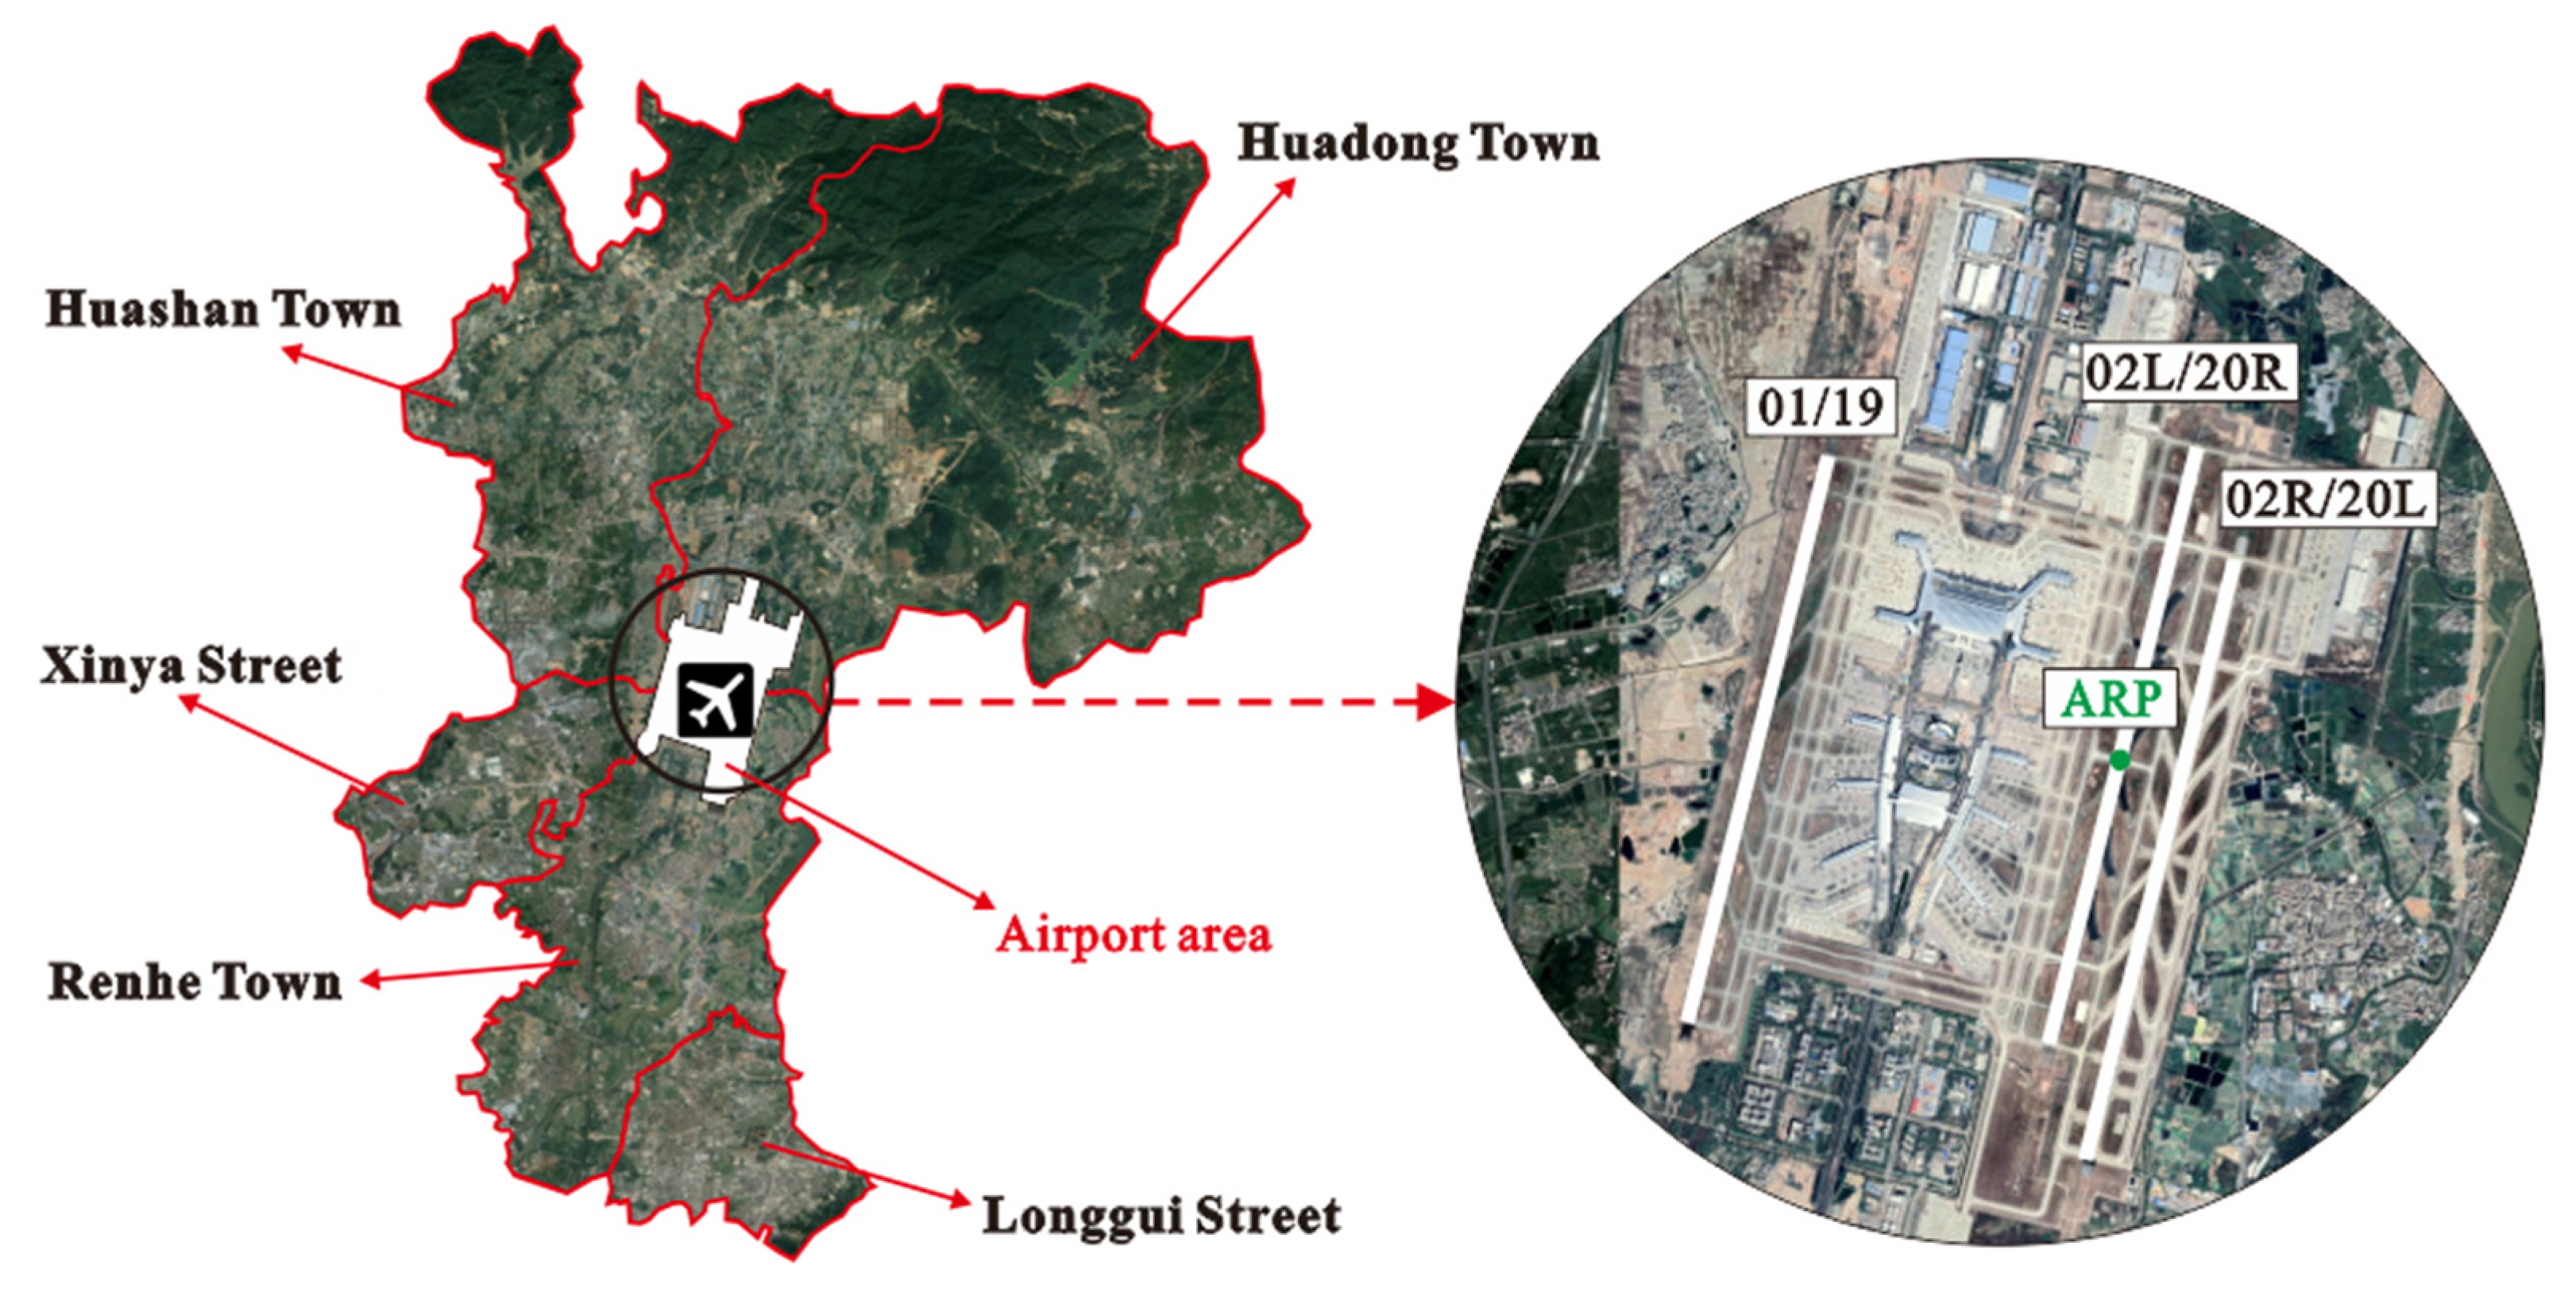
Figure 2.
Studied area in the present study.
Figure 2.
Studied area in the present study.
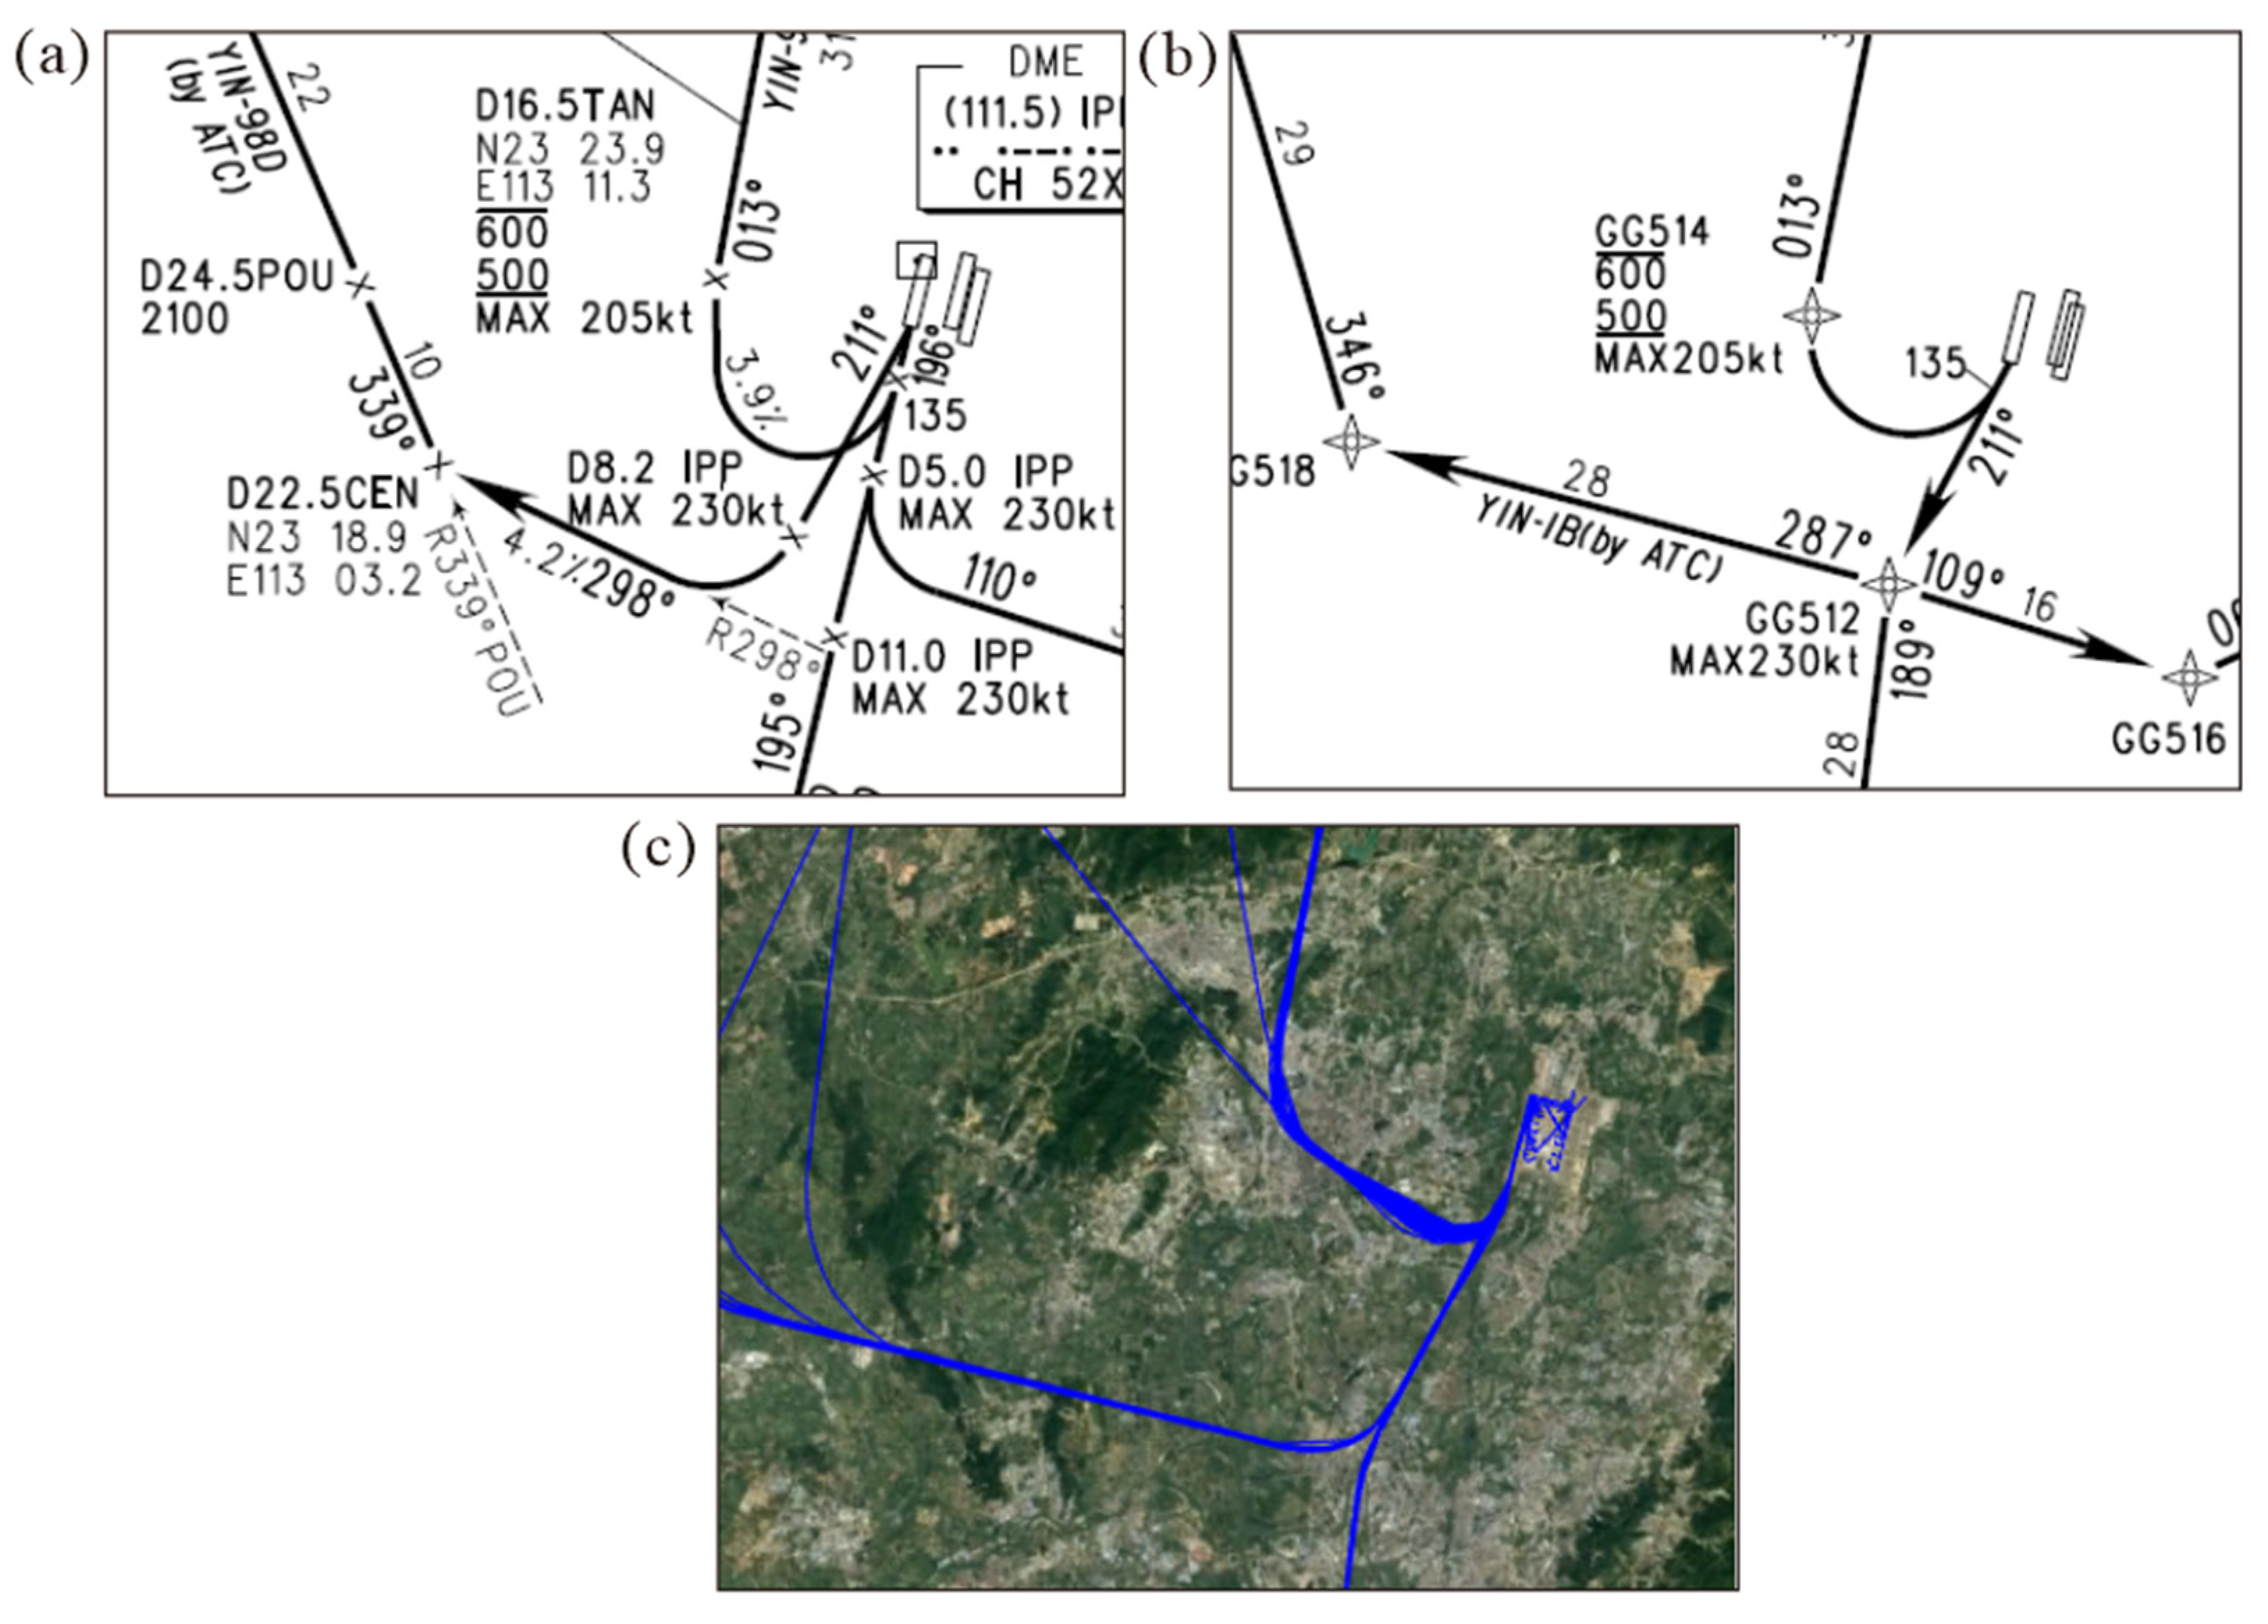
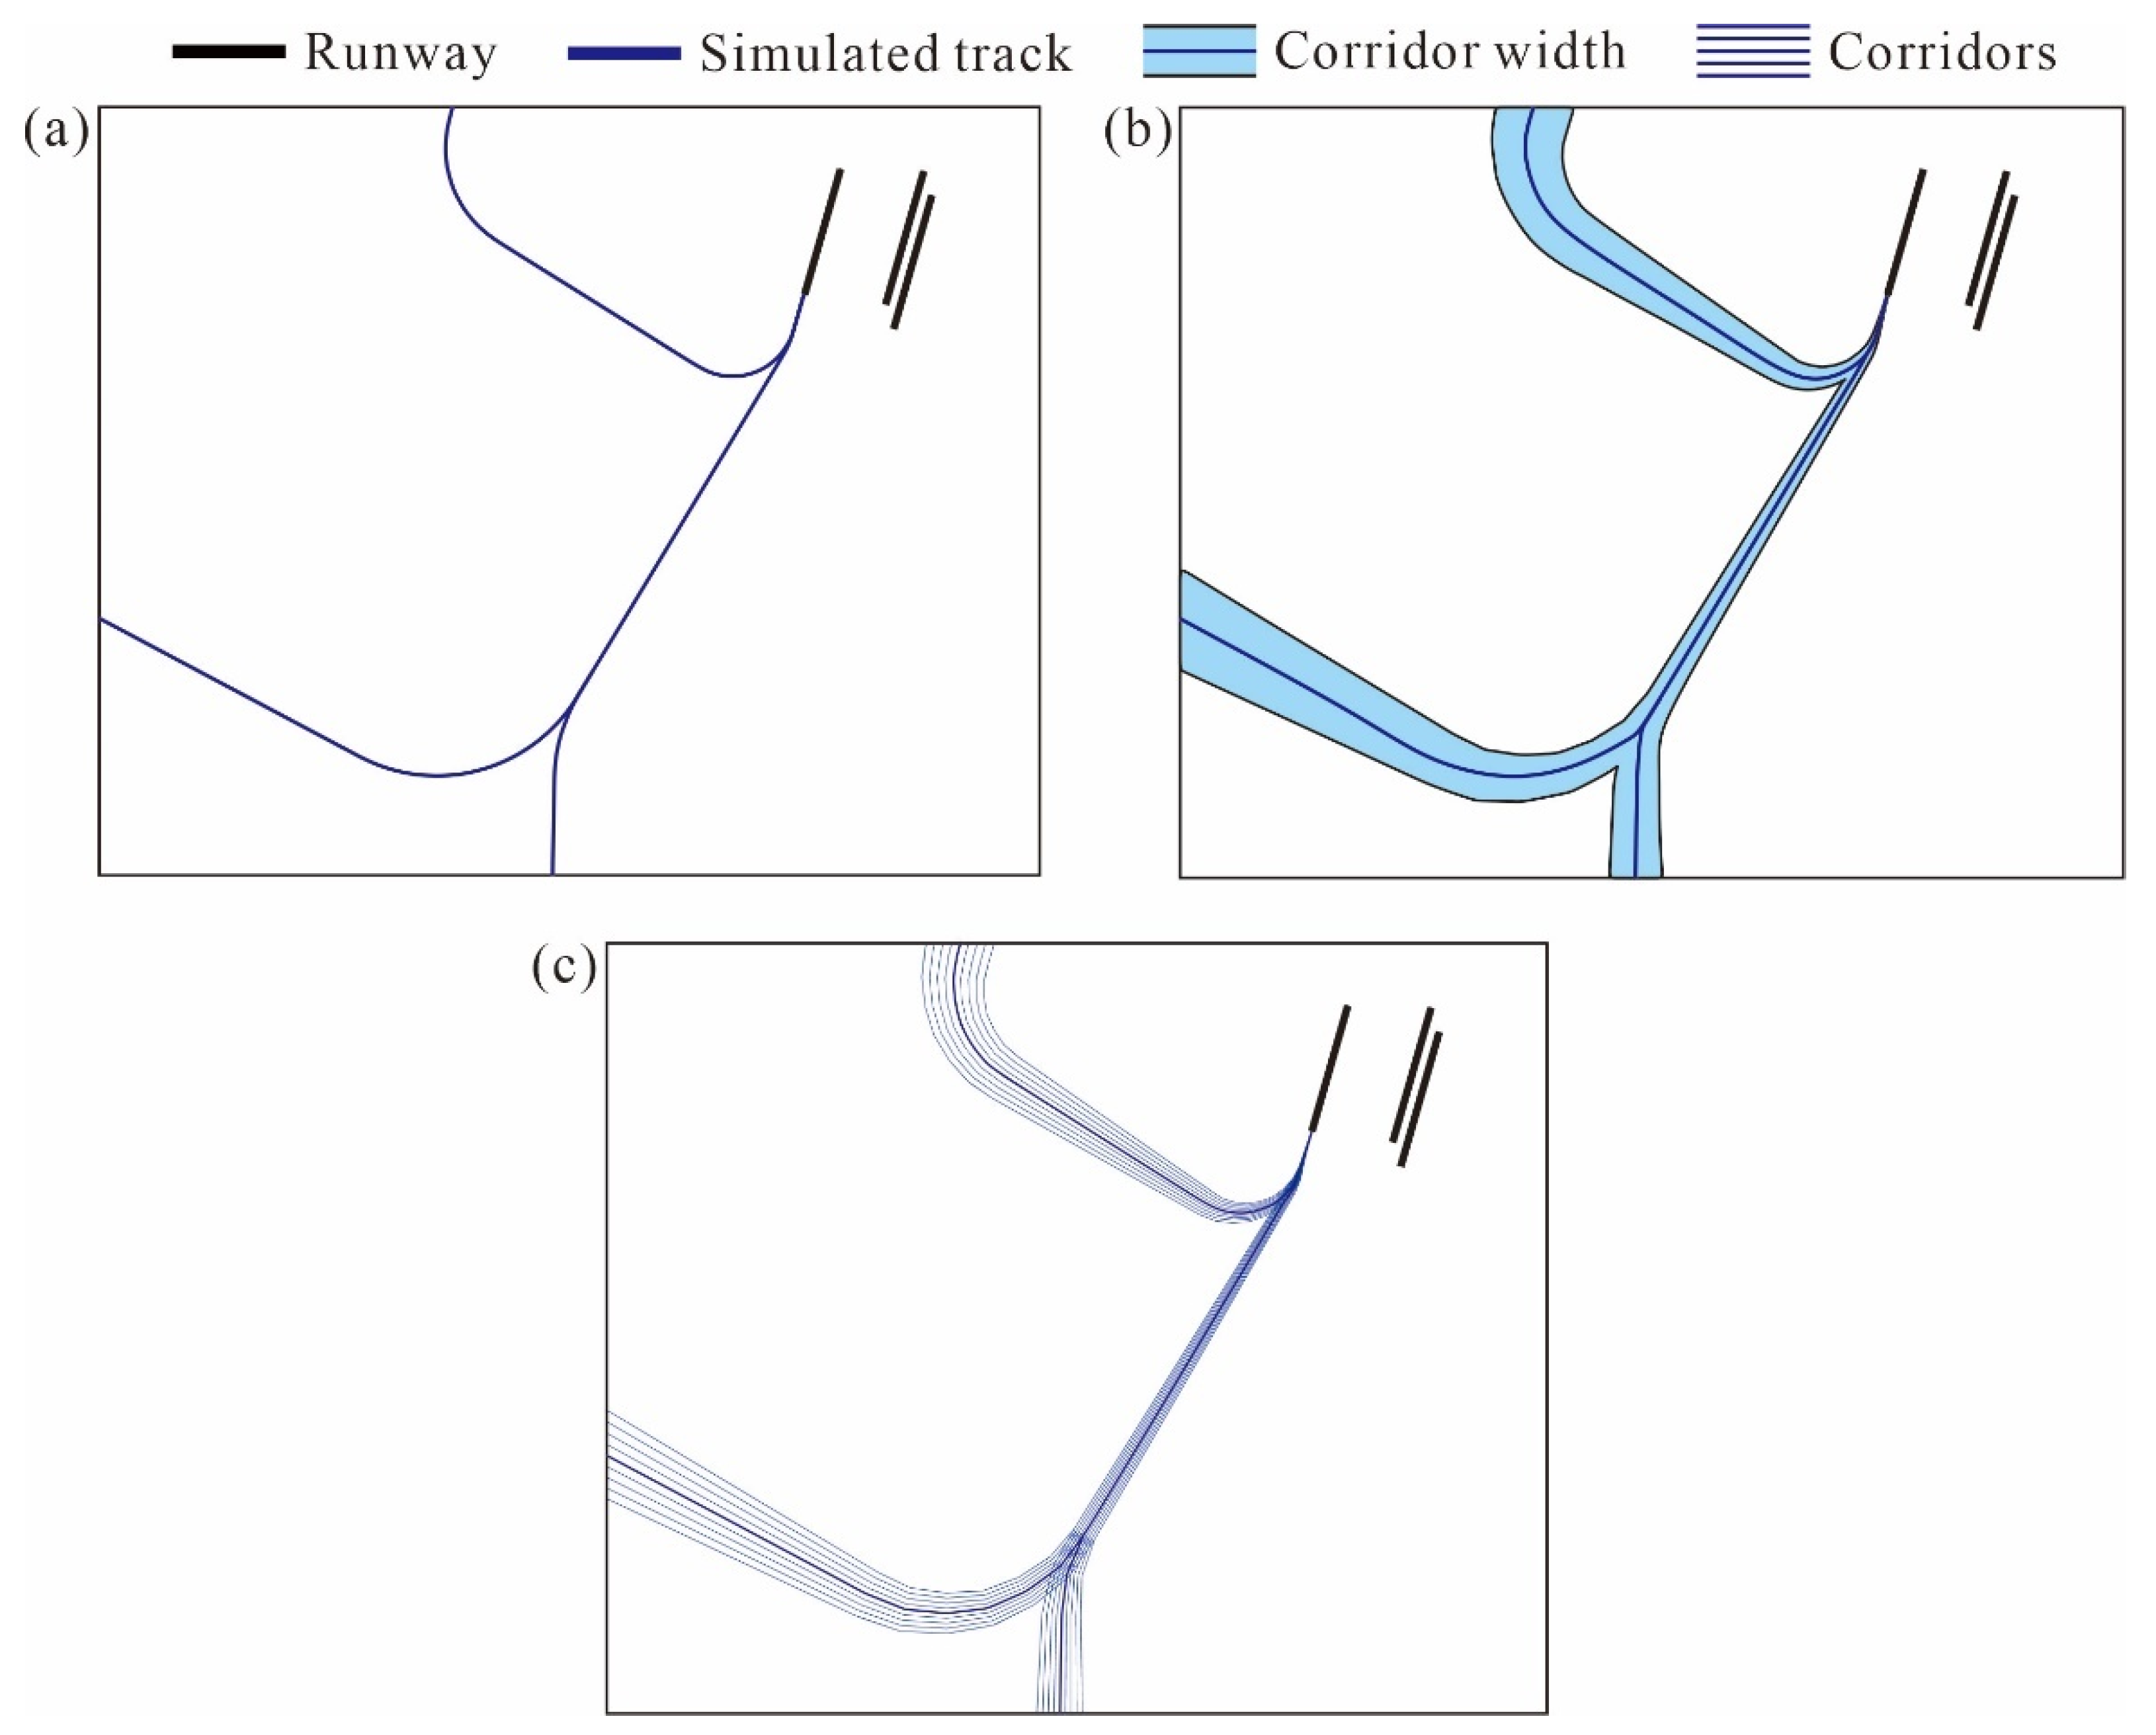
Figure 3.
Comparison between the tracks from (
a) standard instrument, (
b) RNAV takeoff charts [
14] and (
c) actual aircraft ADS-B track.
Figure 3.
Comparison between the tracks from (
a) standard instrument, (
b) RNAV takeoff charts [
14] and (
c) actual aircraft ADS-B track.
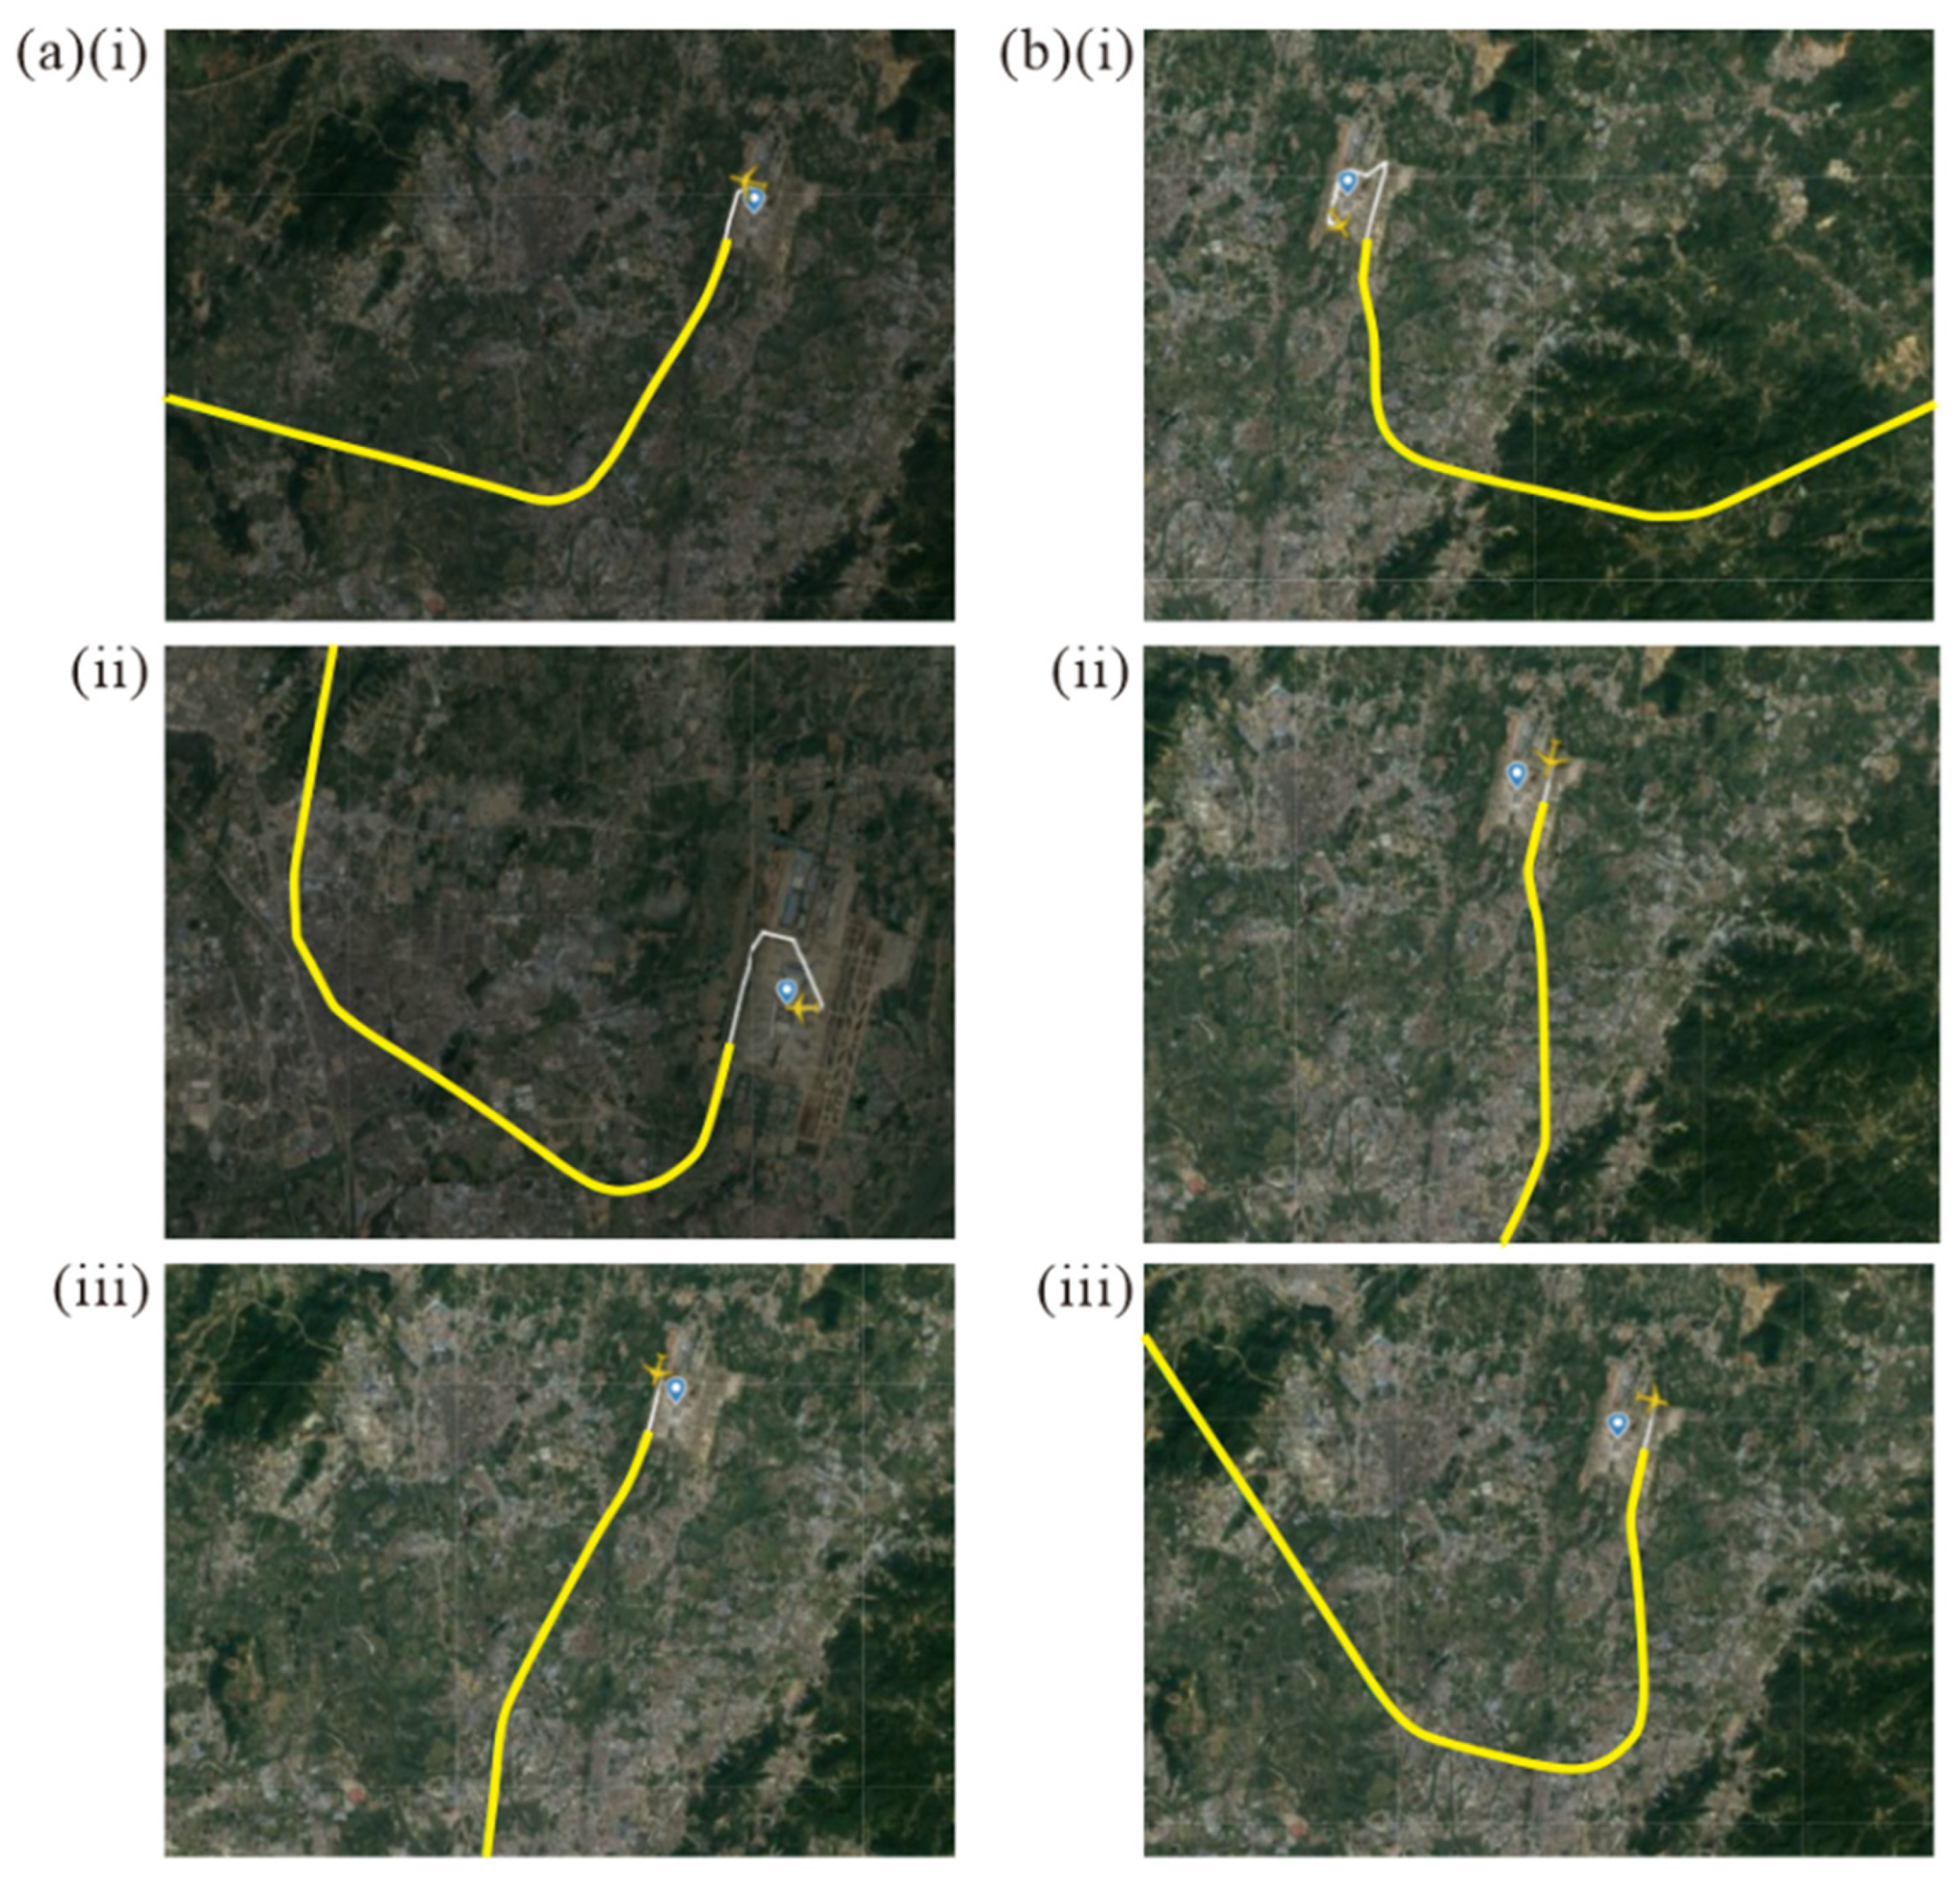
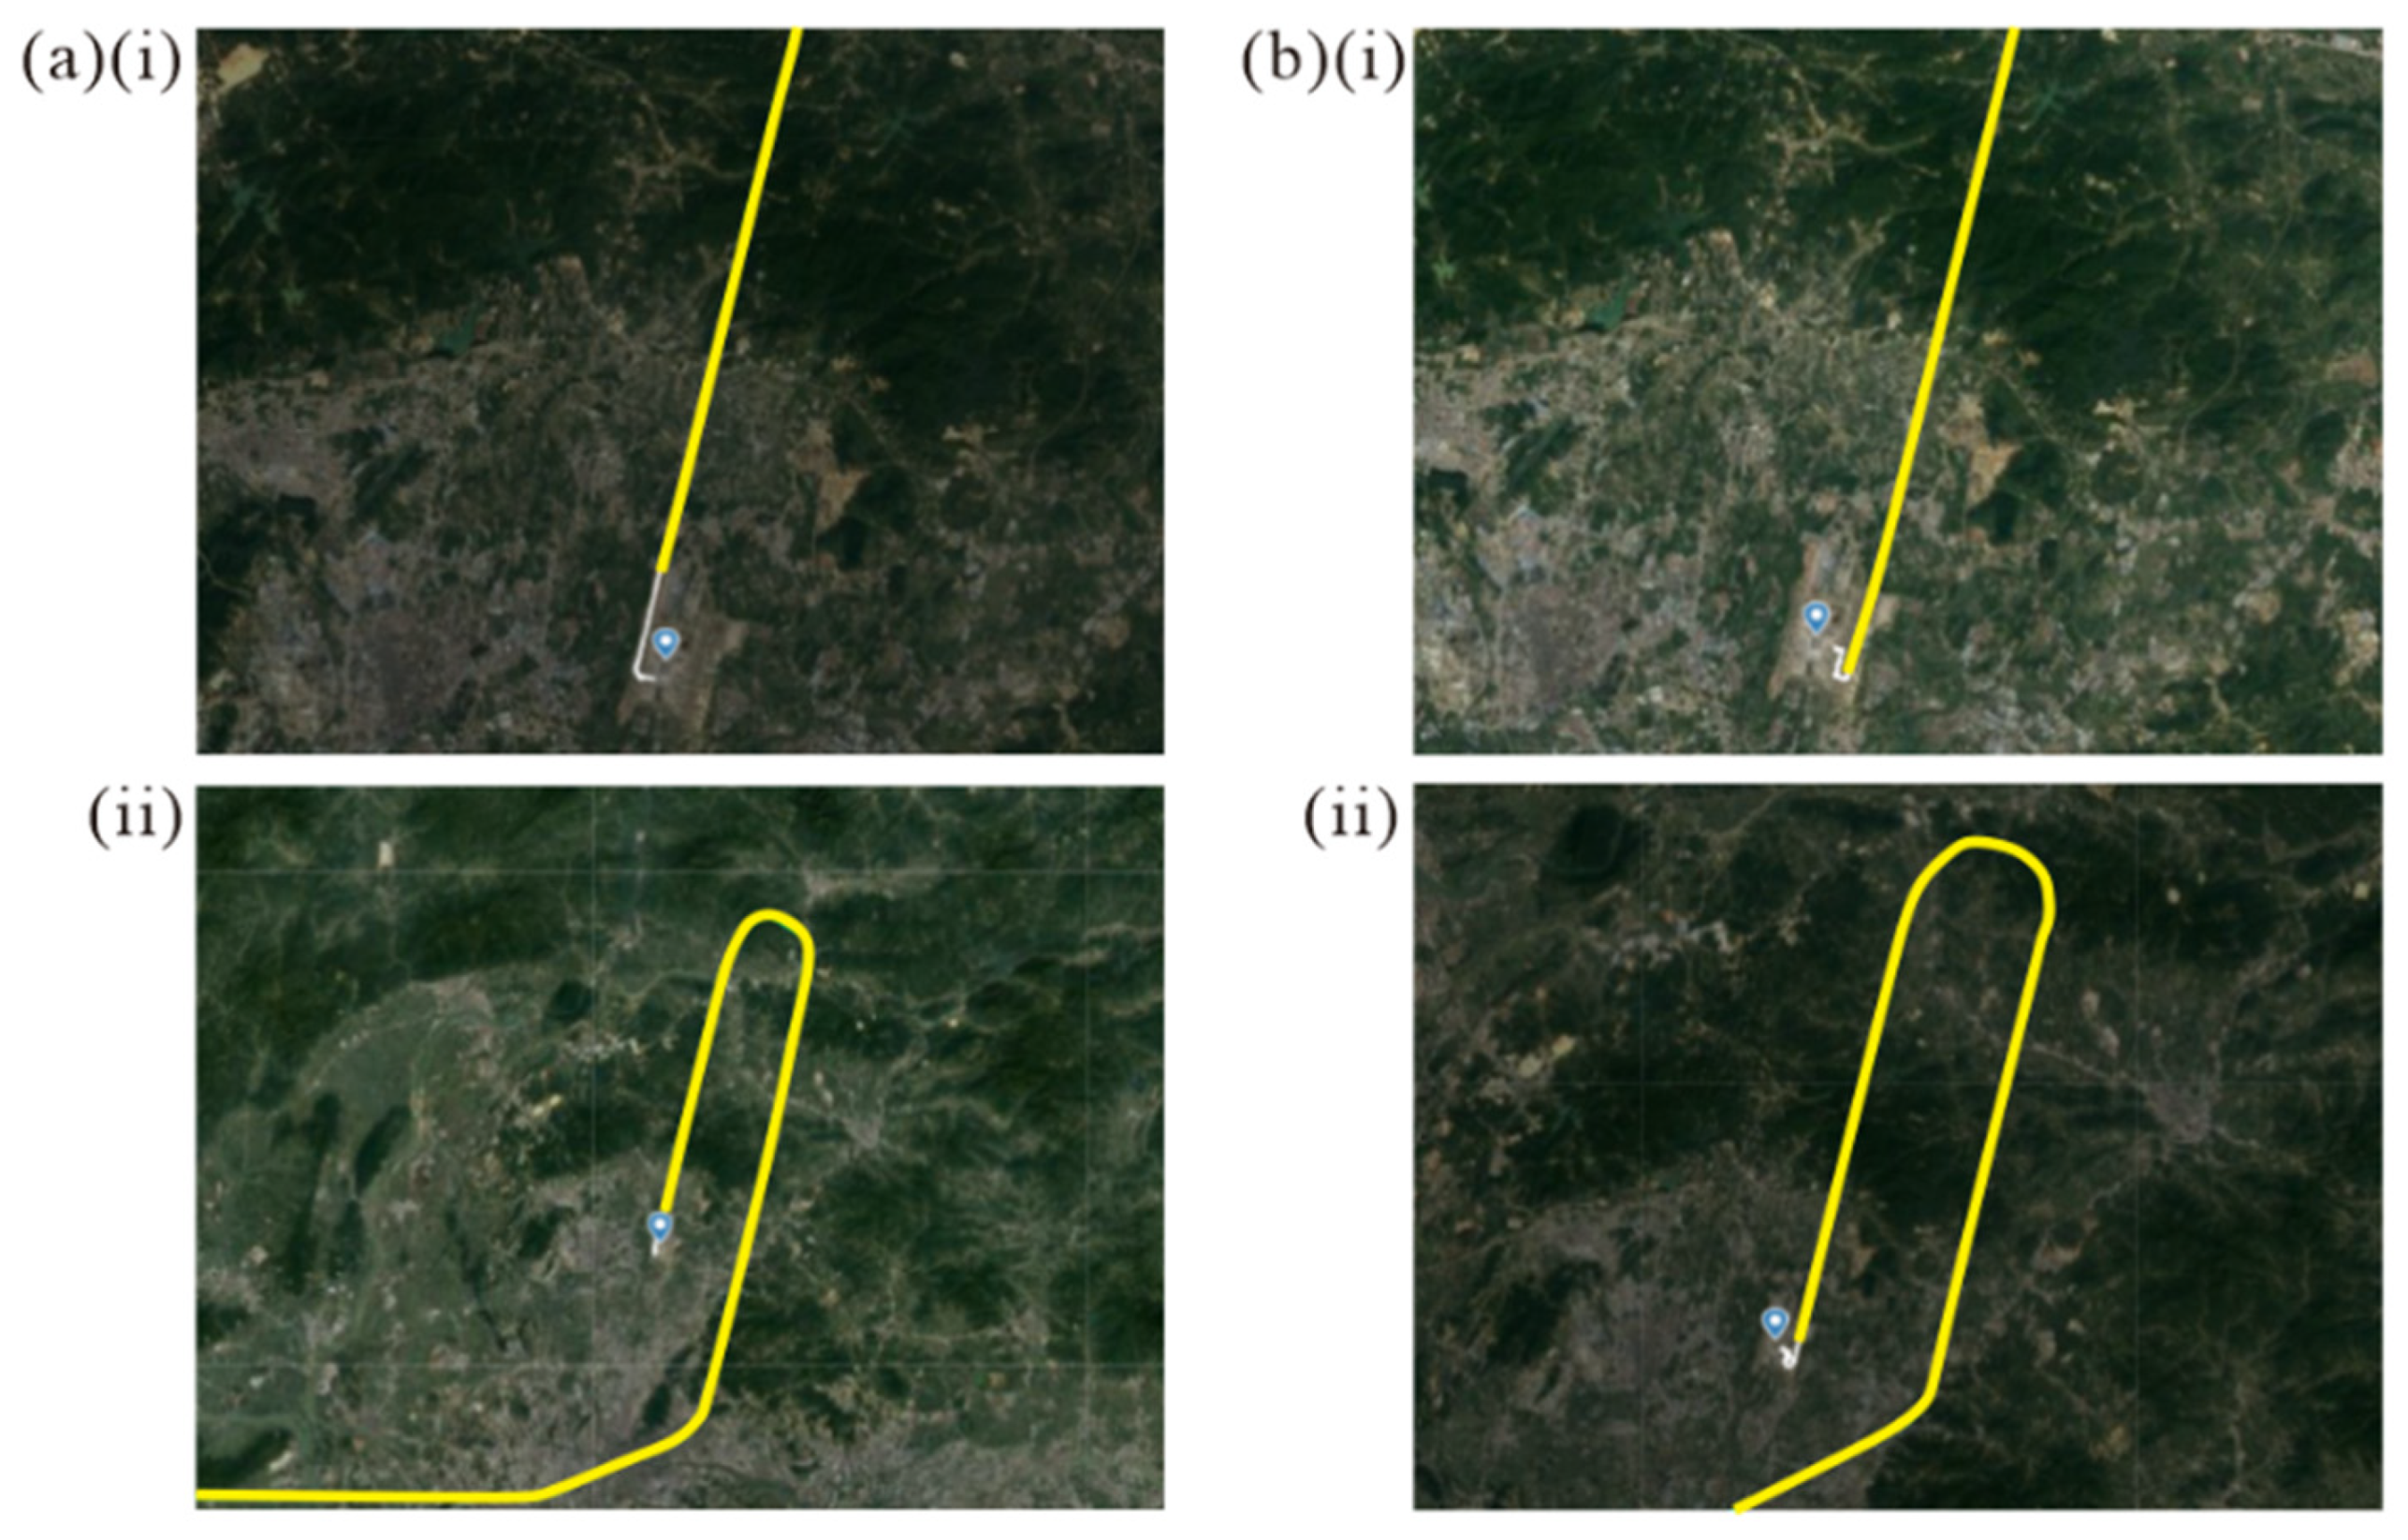
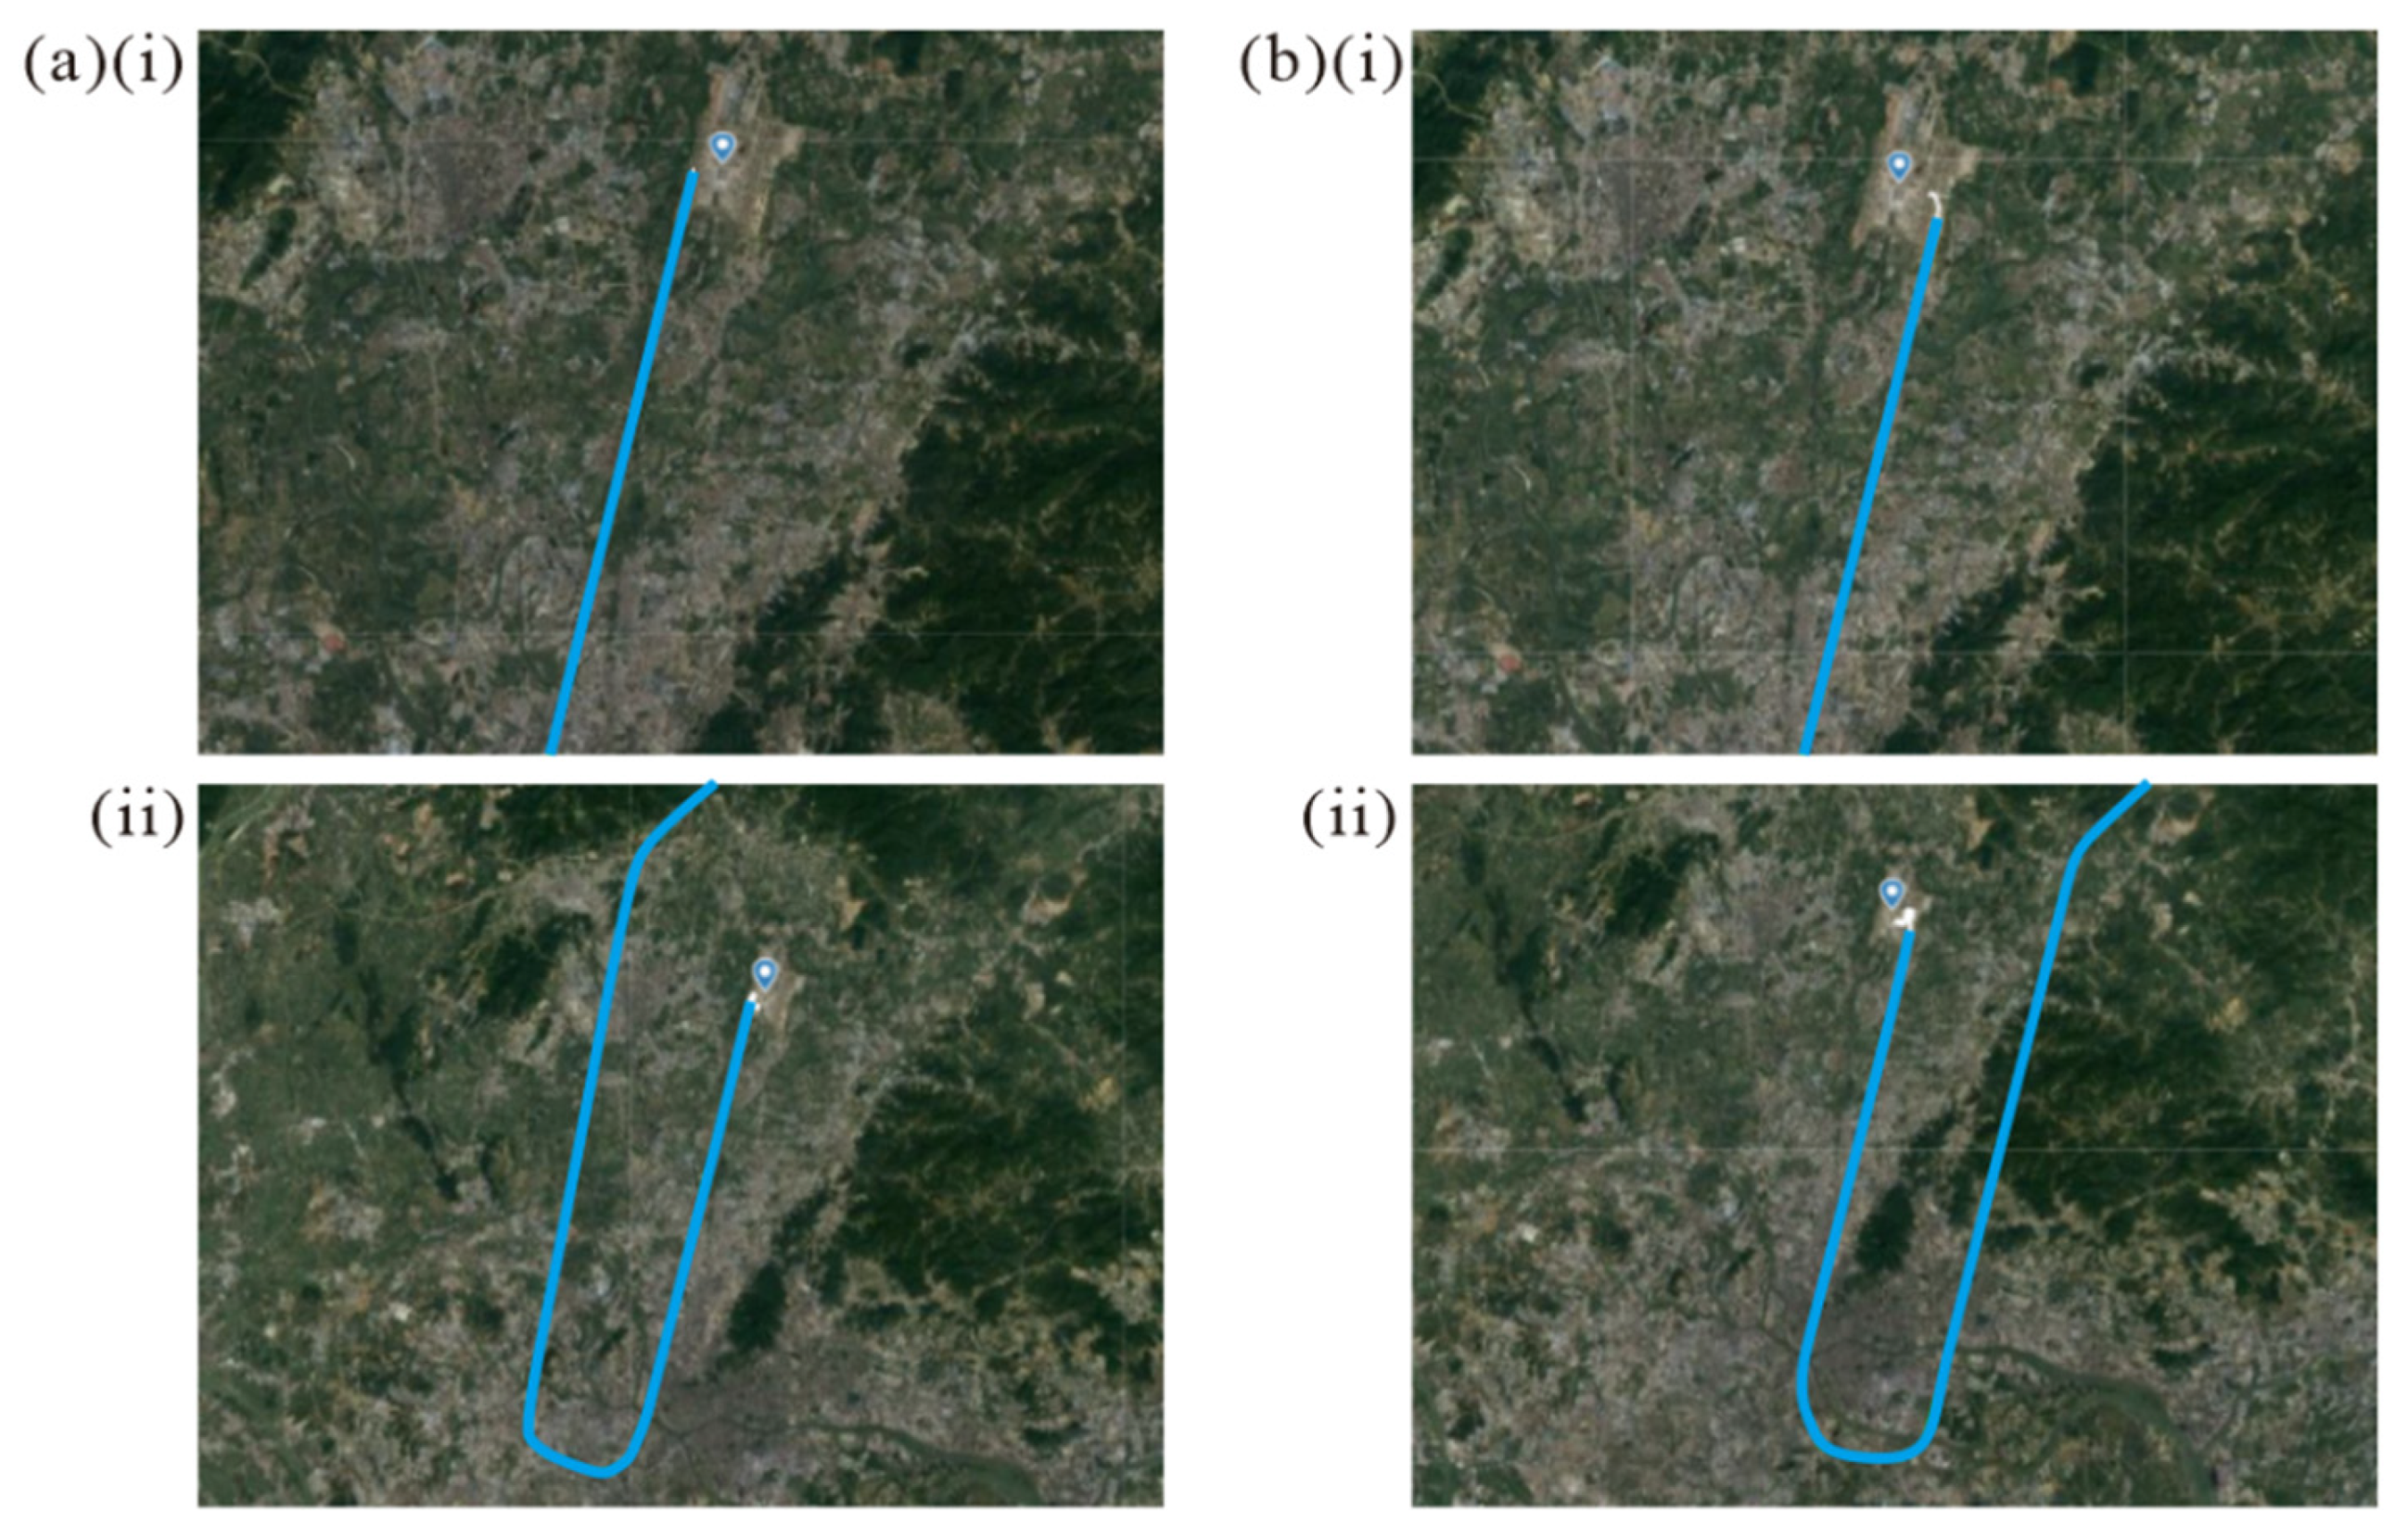
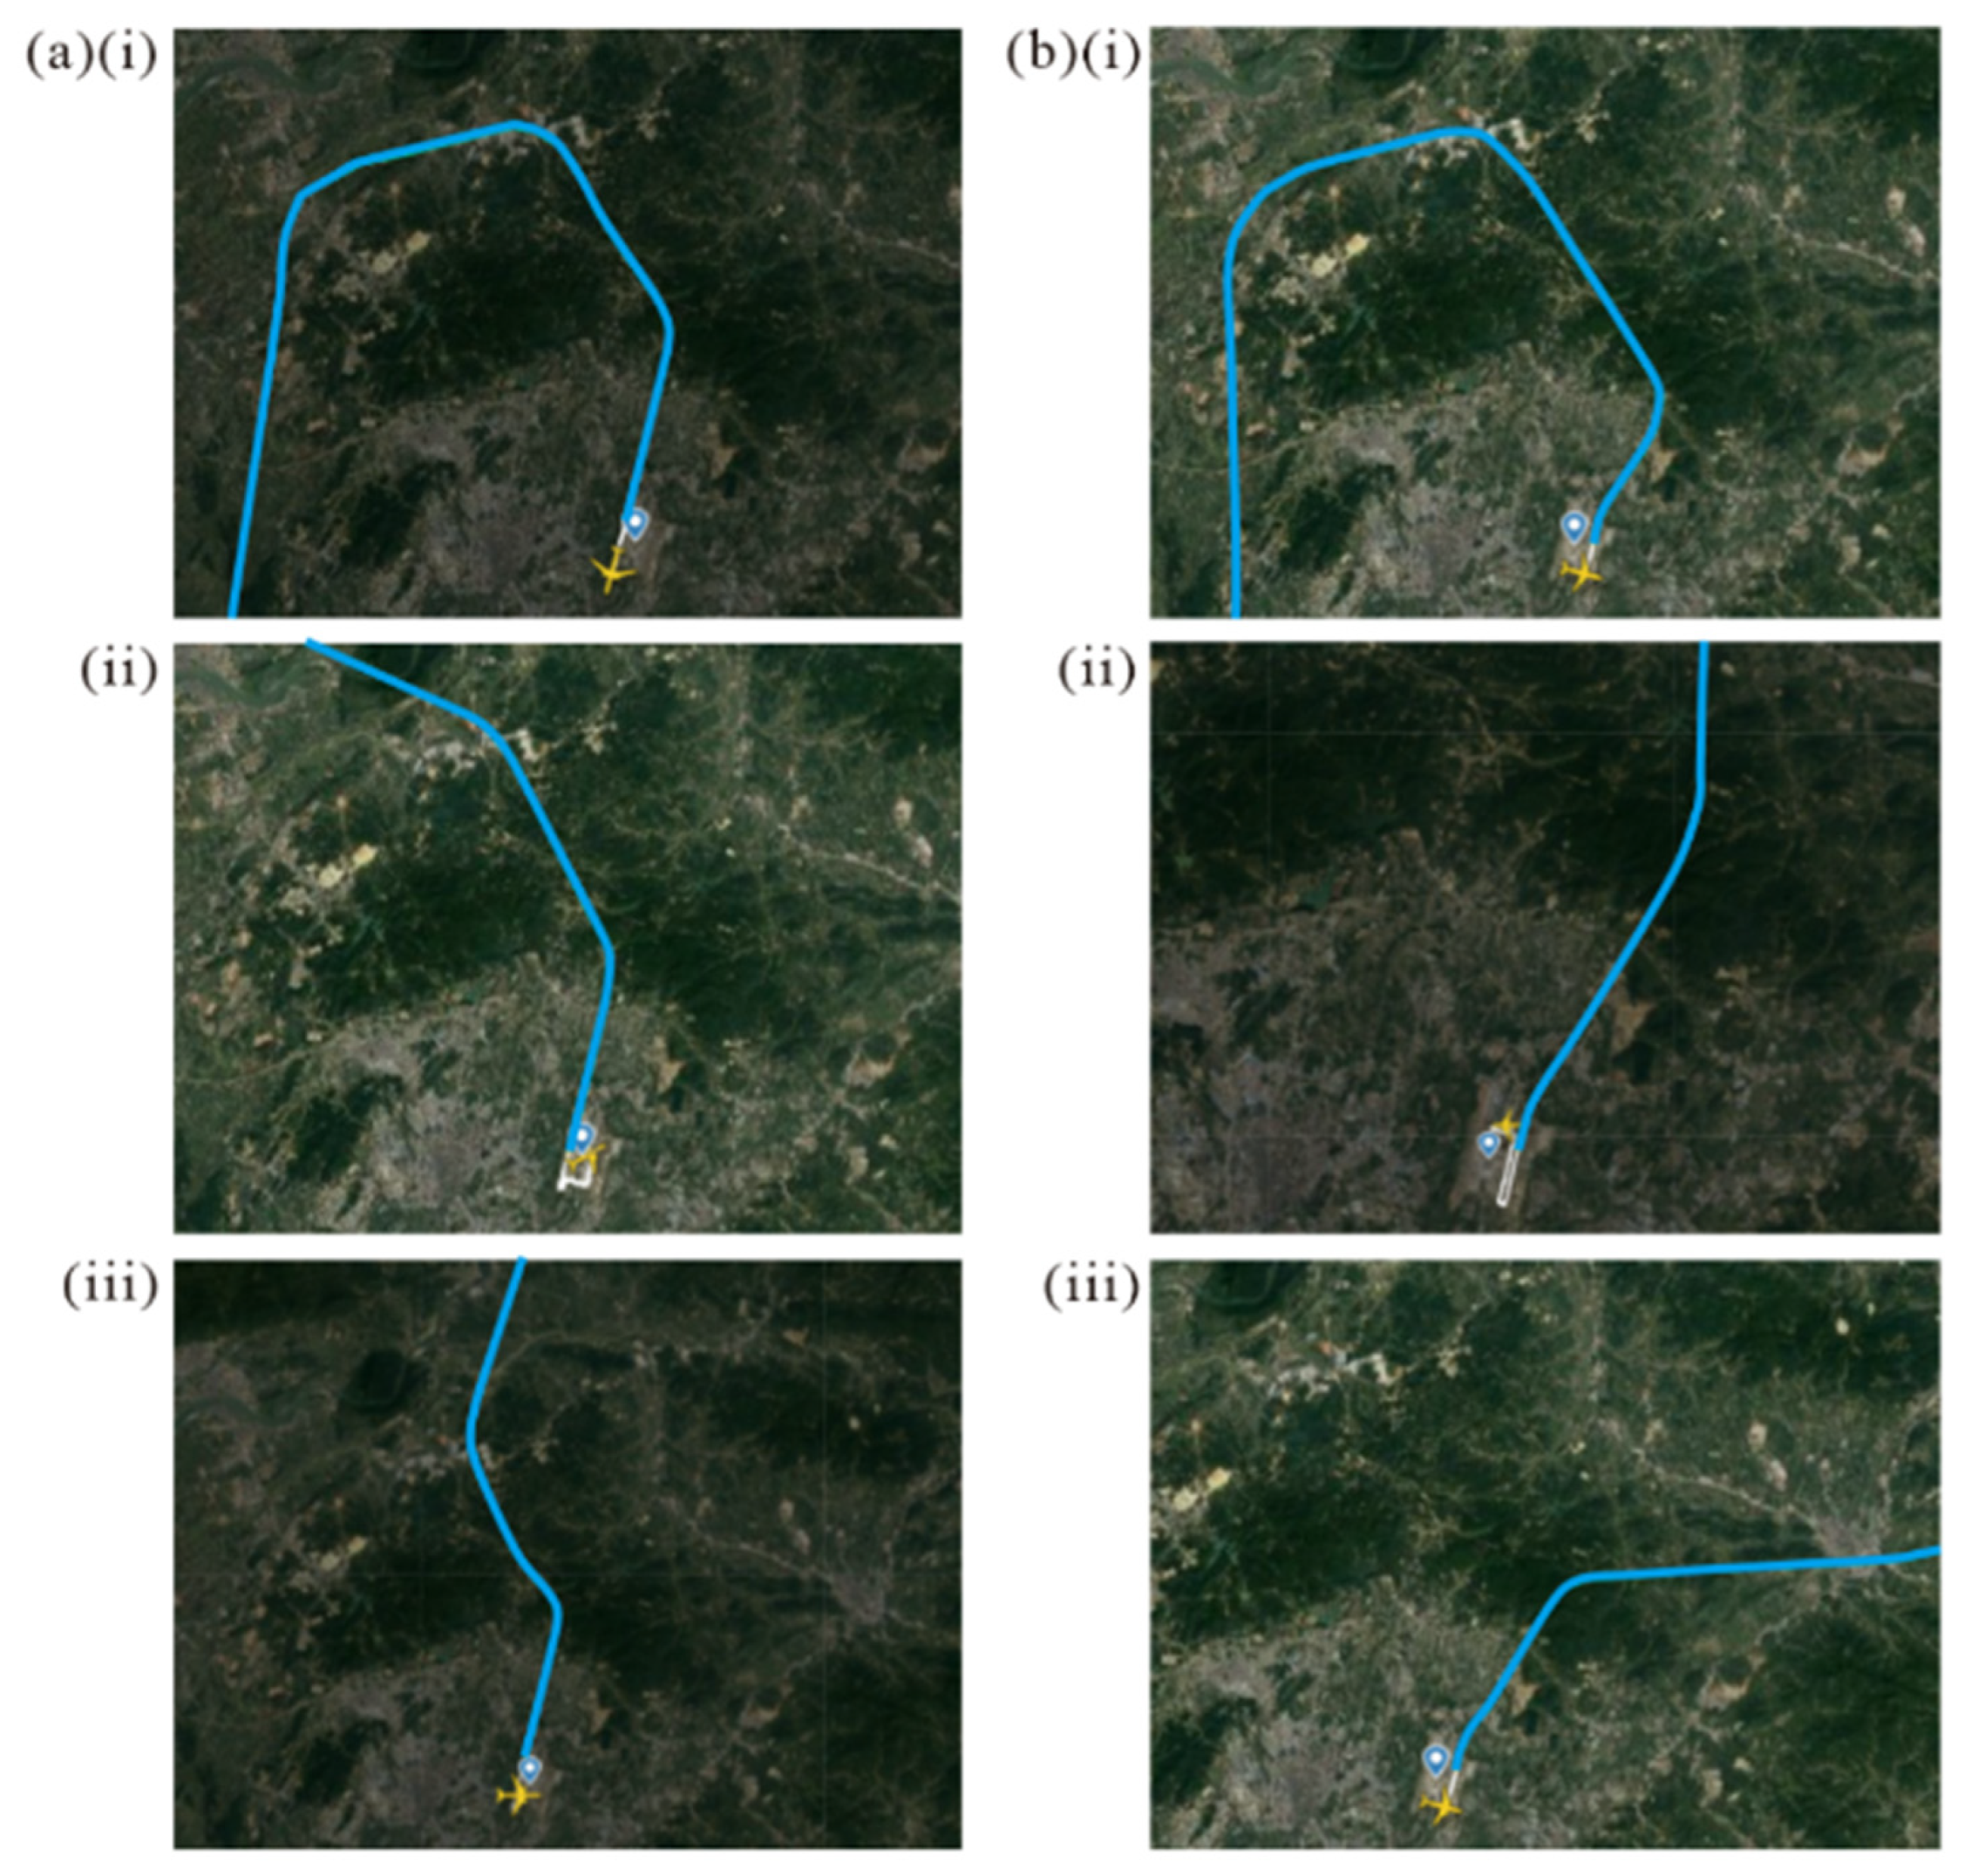
Figure 4.
Categorization of takeoff tracks of aircrafts in BIA during summer. (a) Runway 19 ((i) T-19-A, (ii) T-19-B, (iii) T-19-C); (b) Runway 20R ((i) T-20R-A, (ii) T-20R-B, (iii) T-20R-C).
Figure 4.
Categorization of takeoff tracks of aircrafts in BIA during summer. (a) Runway 19 ((i) T-19-A, (ii) T-19-B, (iii) T-19-C); (b) Runway 20R ((i) T-20R-A, (ii) T-20R-B, (iii) T-20R-C).
Figure 5.
Categorization of landing tracks of aircrafts in BIA during summer. (a) Runway 19 ((i) L-19-A, (ii) L-19-B) (b) Runway 20R ((i) L-20R-A (ii), L-20R-B).
Figure 5.
Categorization of landing tracks of aircrafts in BIA during summer. (a) Runway 19 ((i) L-19-A, (ii) L-19-B) (b) Runway 20R ((i) L-20R-A (ii), L-20R-B).
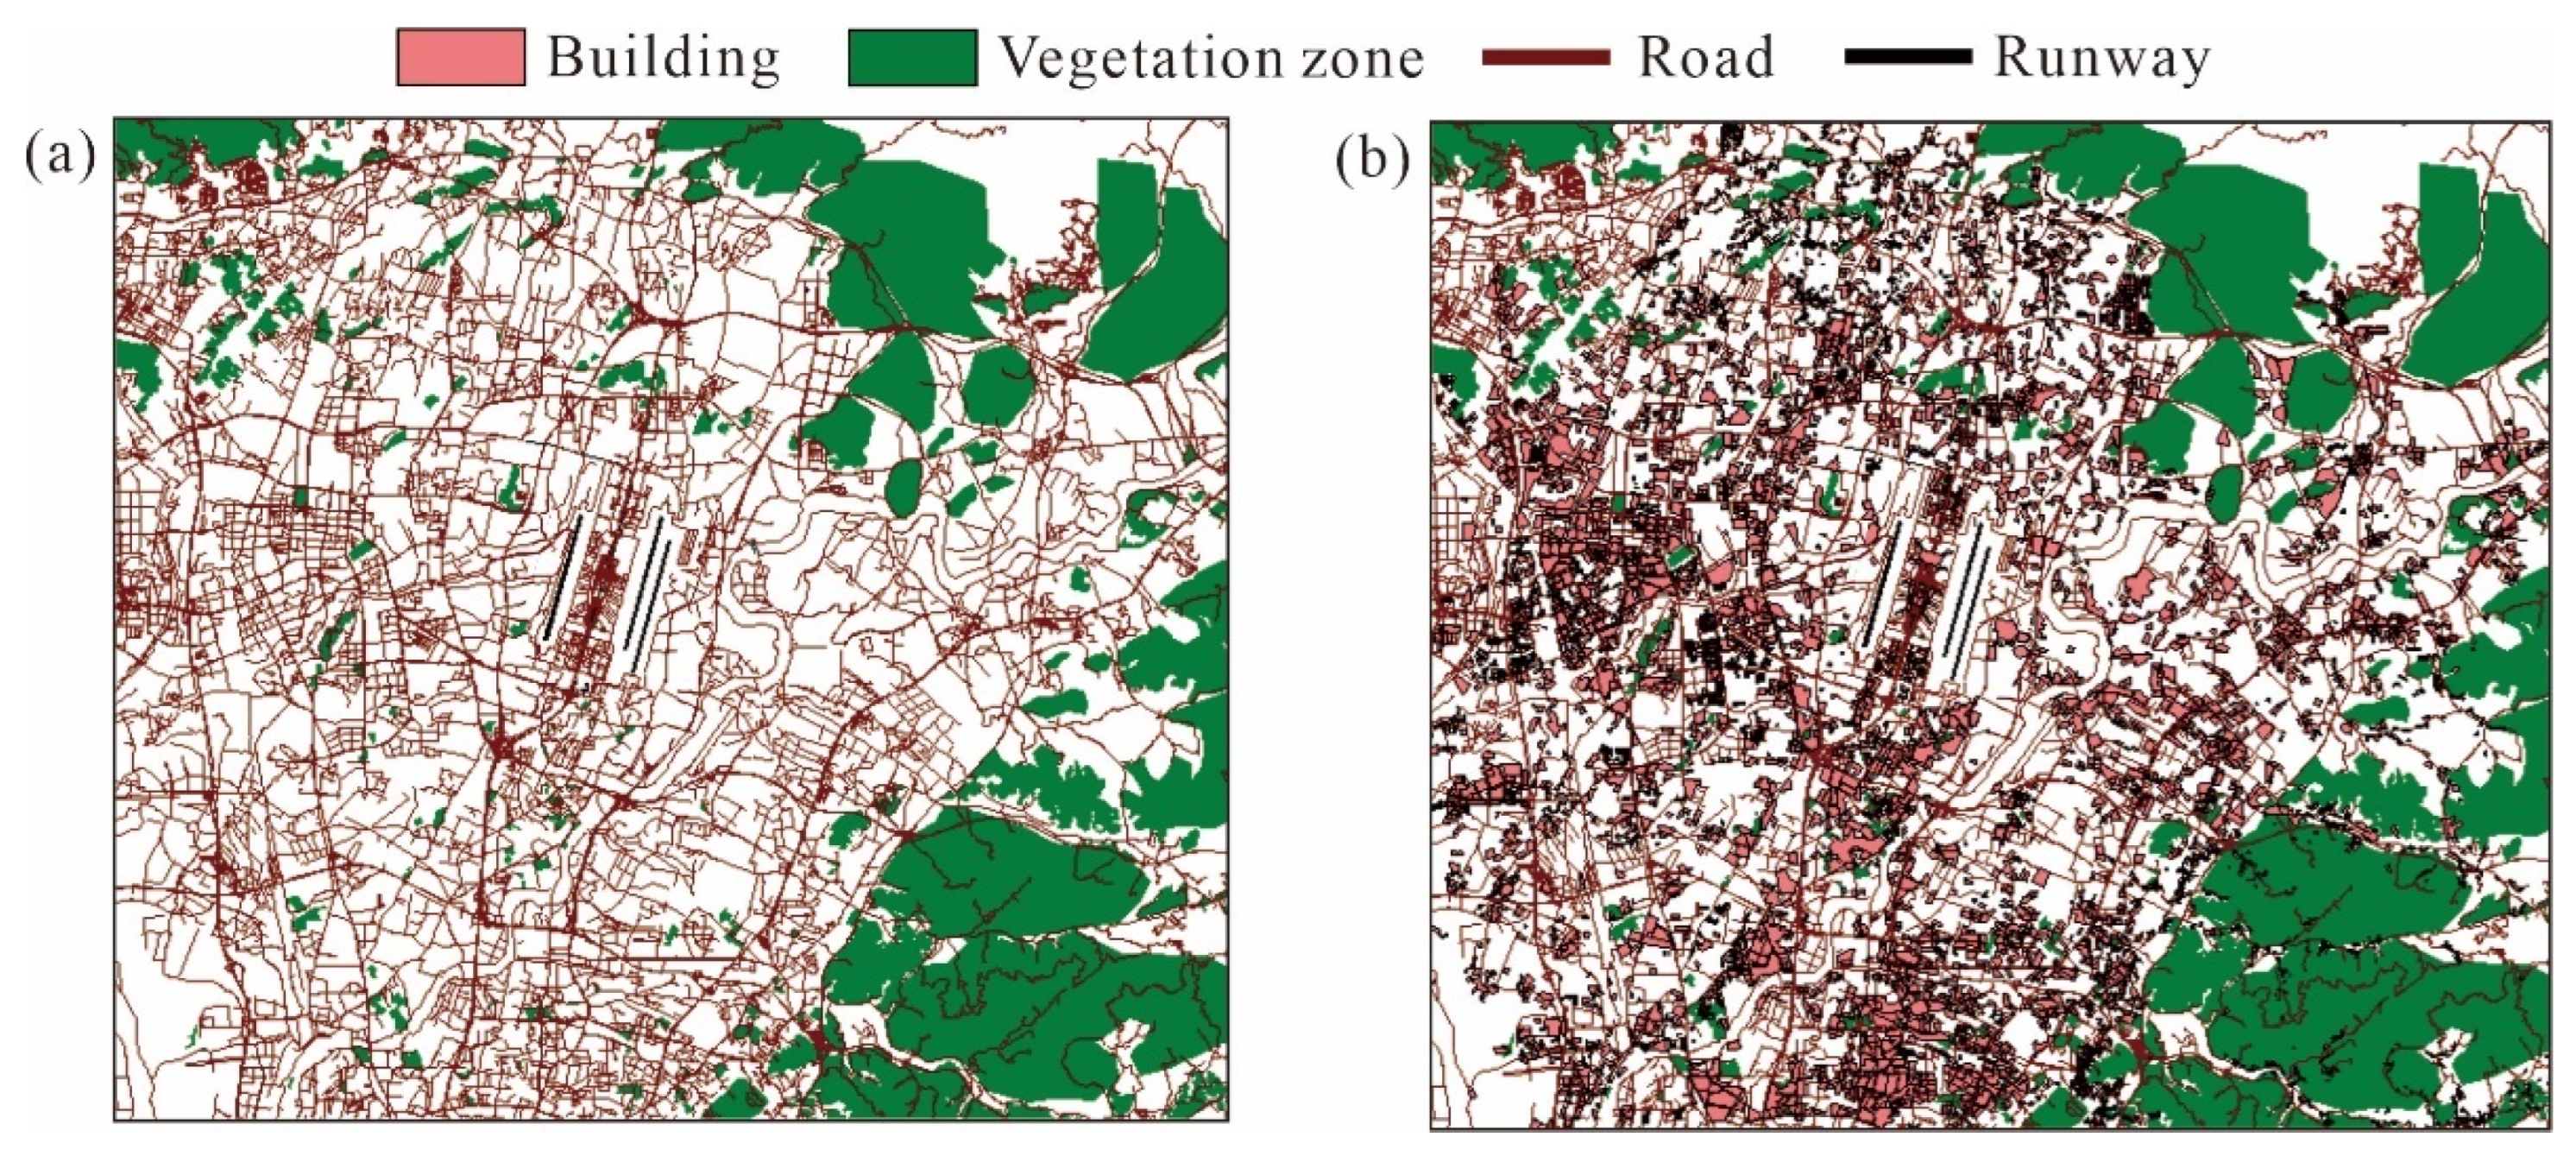
Figure 6.
(a) Incomplete airport area outline map; (b) complete airport area outline map.
Figure 6.
(a) Incomplete airport area outline map; (b) complete airport area outline map.
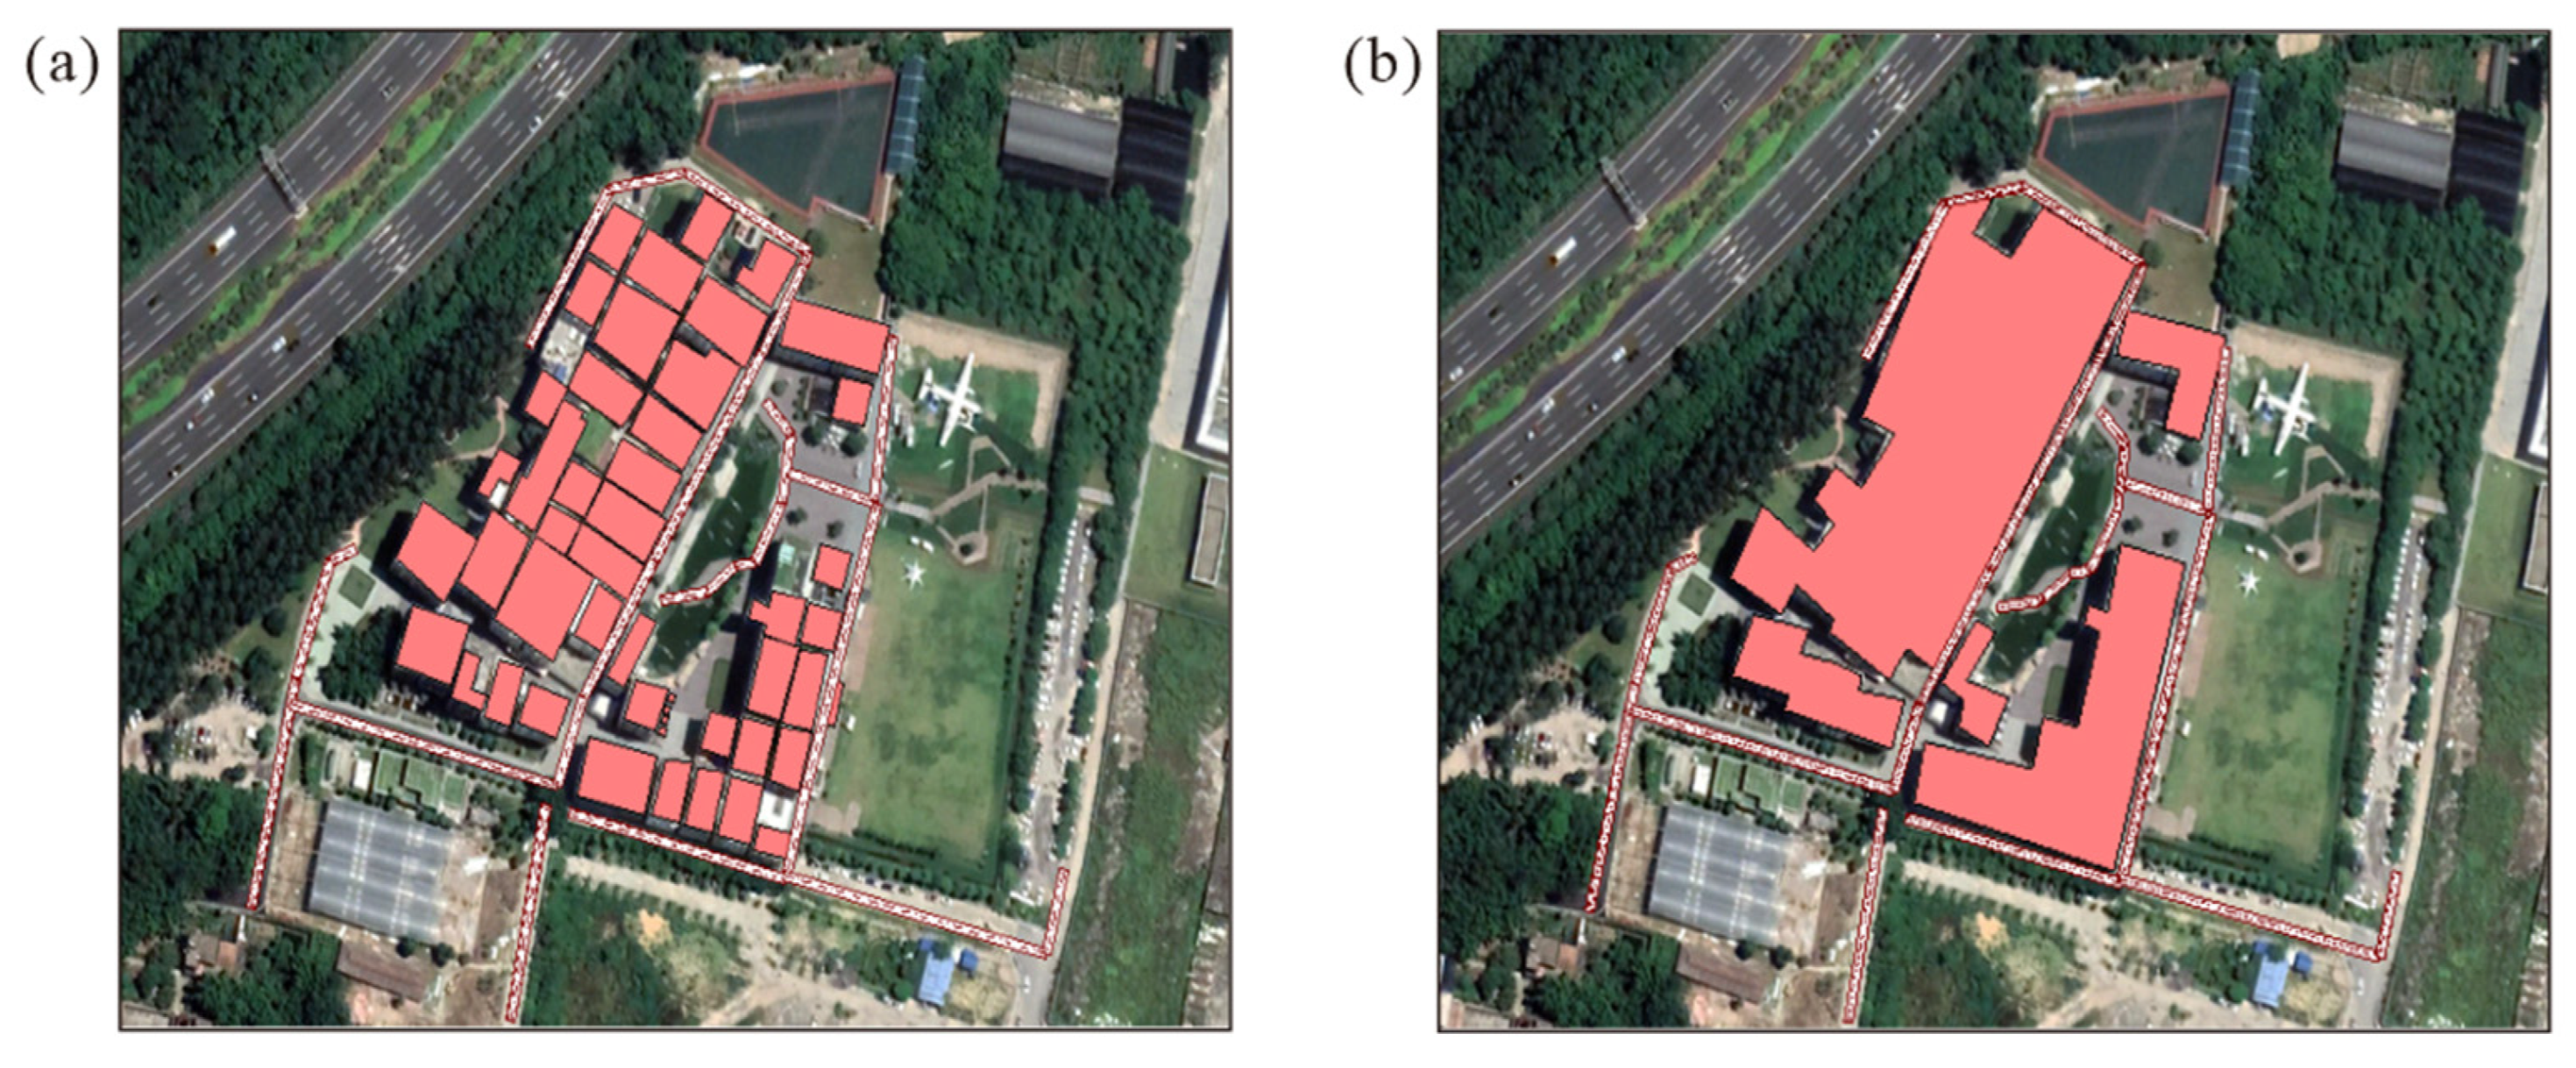
Figure 7.
(a) Buildings before merge; (b) buildings after merge.
Figure 7.
(a) Buildings before merge; (b) buildings after merge.
Figure 8.
(a) Simulated track in noise model; (b) corridor width; (c) number of corridors.
Figure 8.
(a) Simulated track in noise model; (b) corridor width; (c) number of corridors.
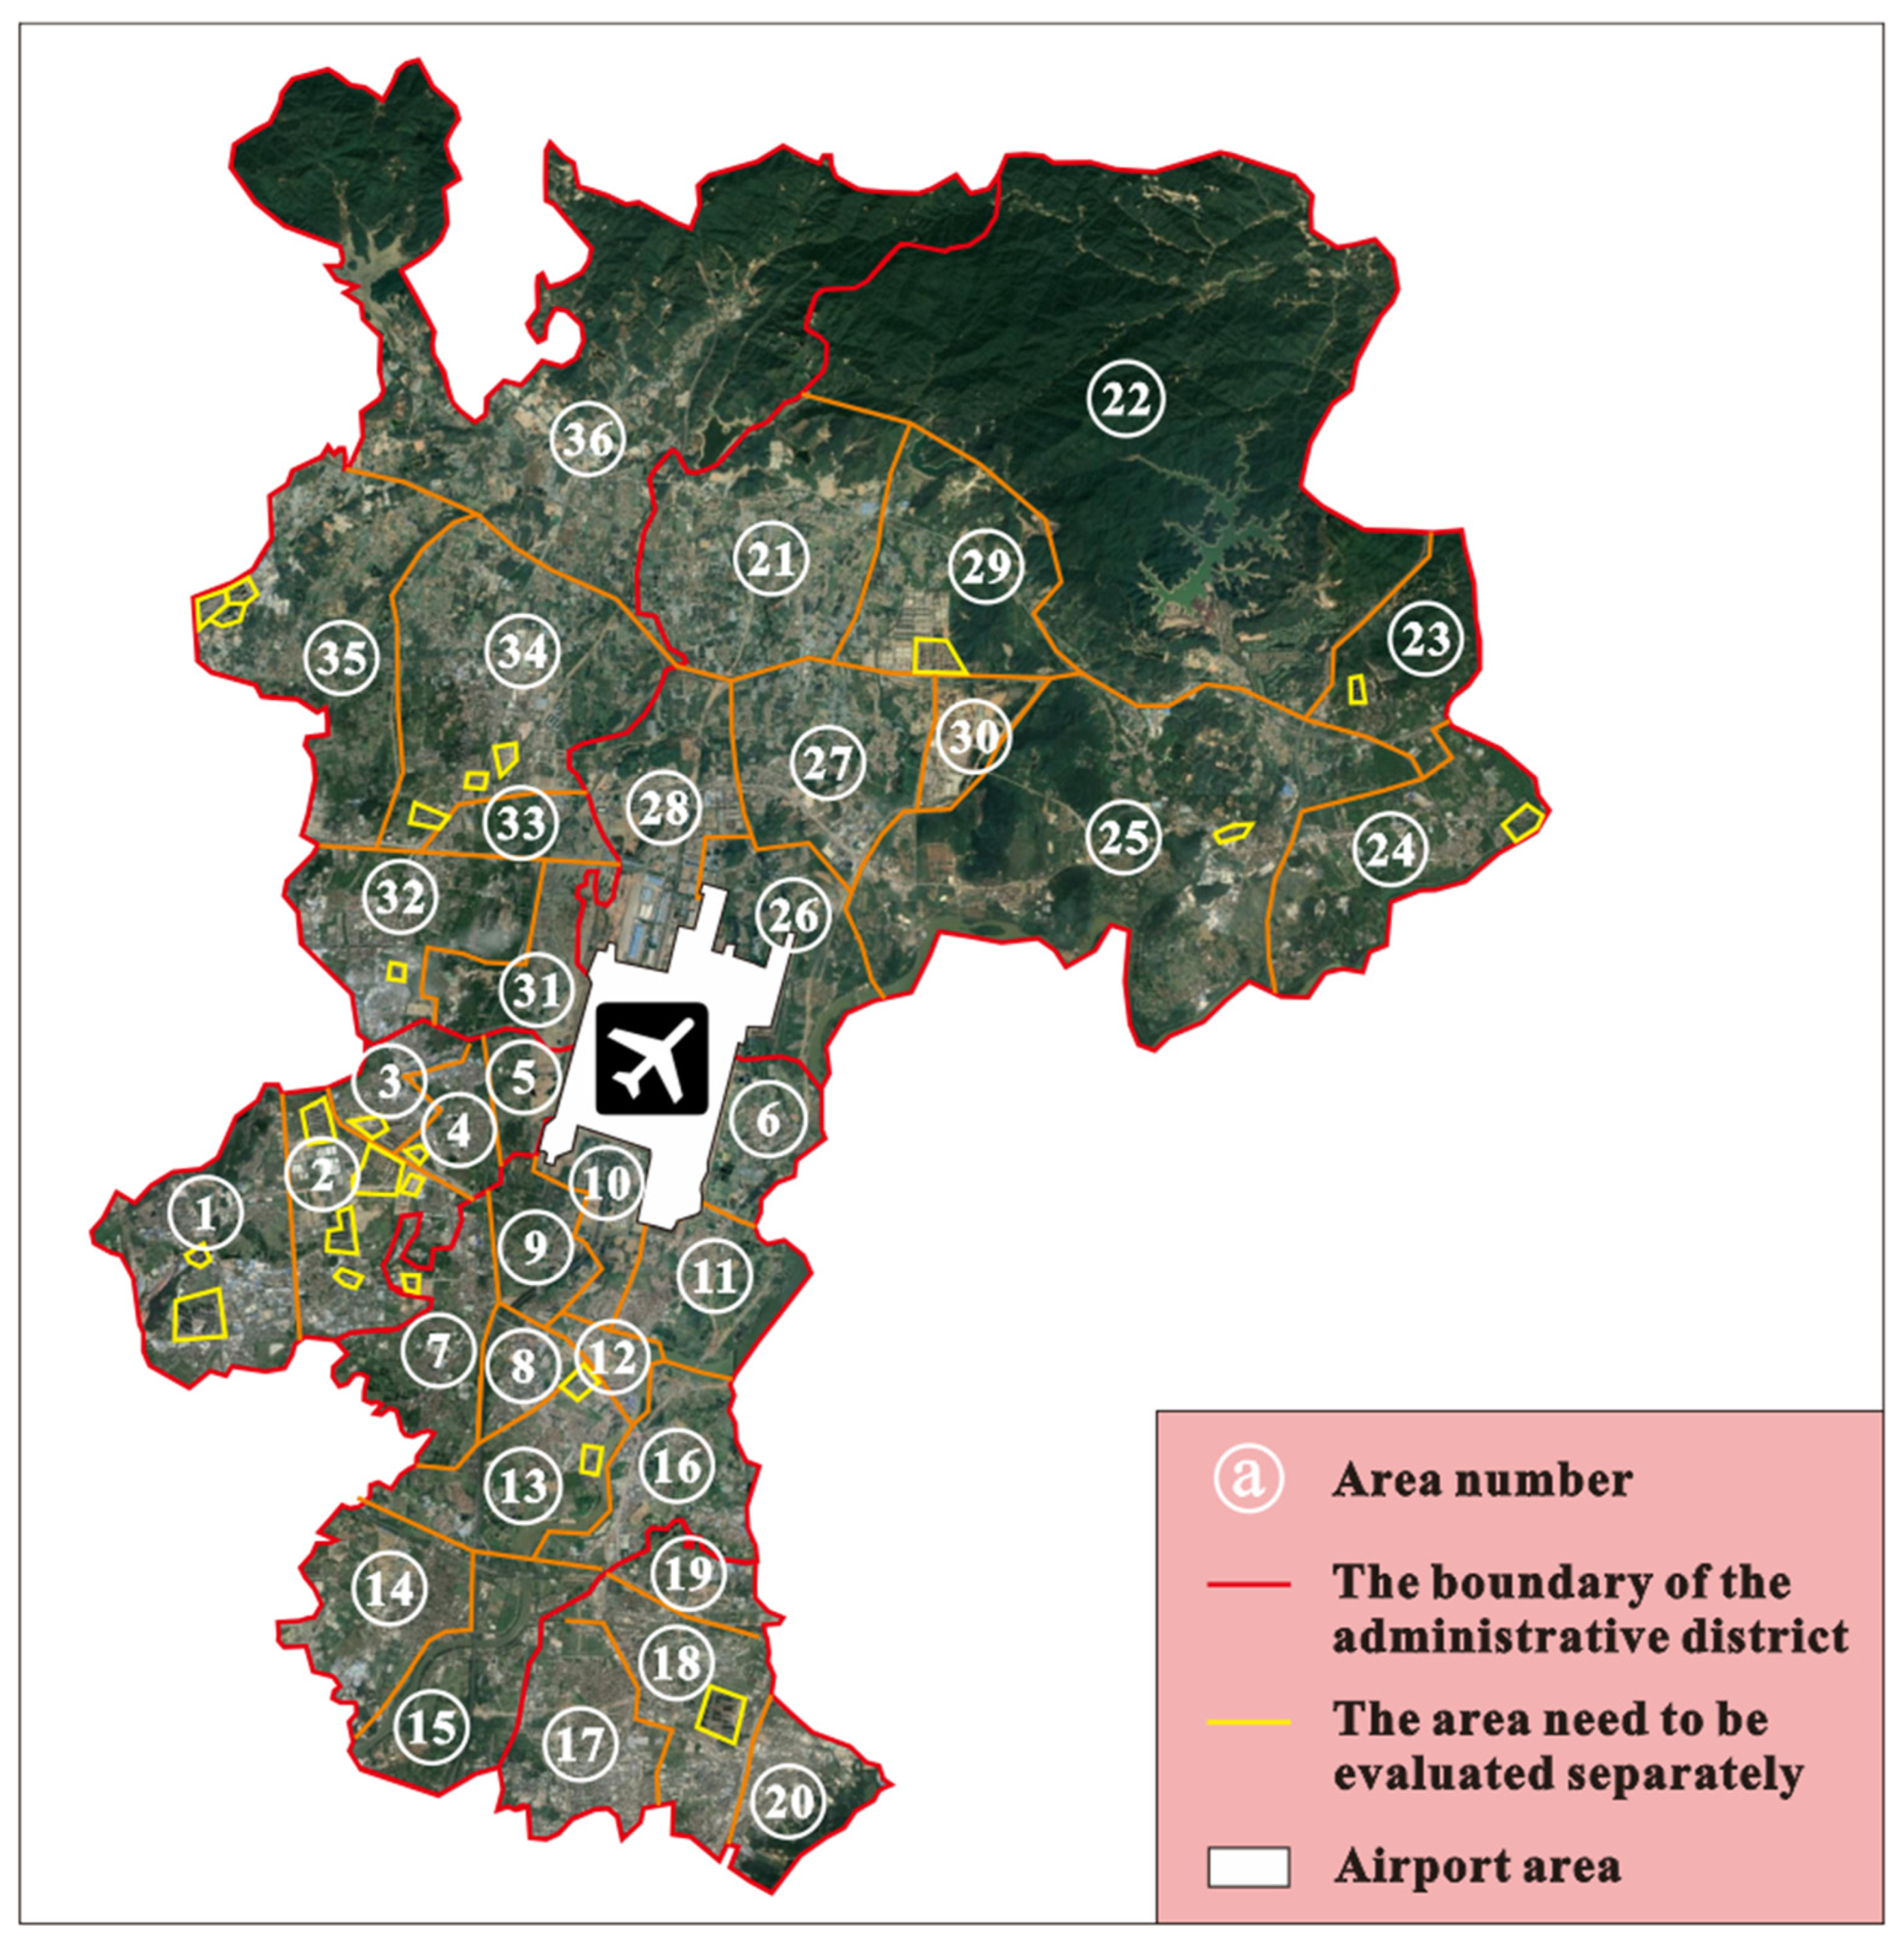
Figure 9.
Thirty-six small areas with basically the same building height.
Figure 9.
Thirty-six small areas with basically the same building height.
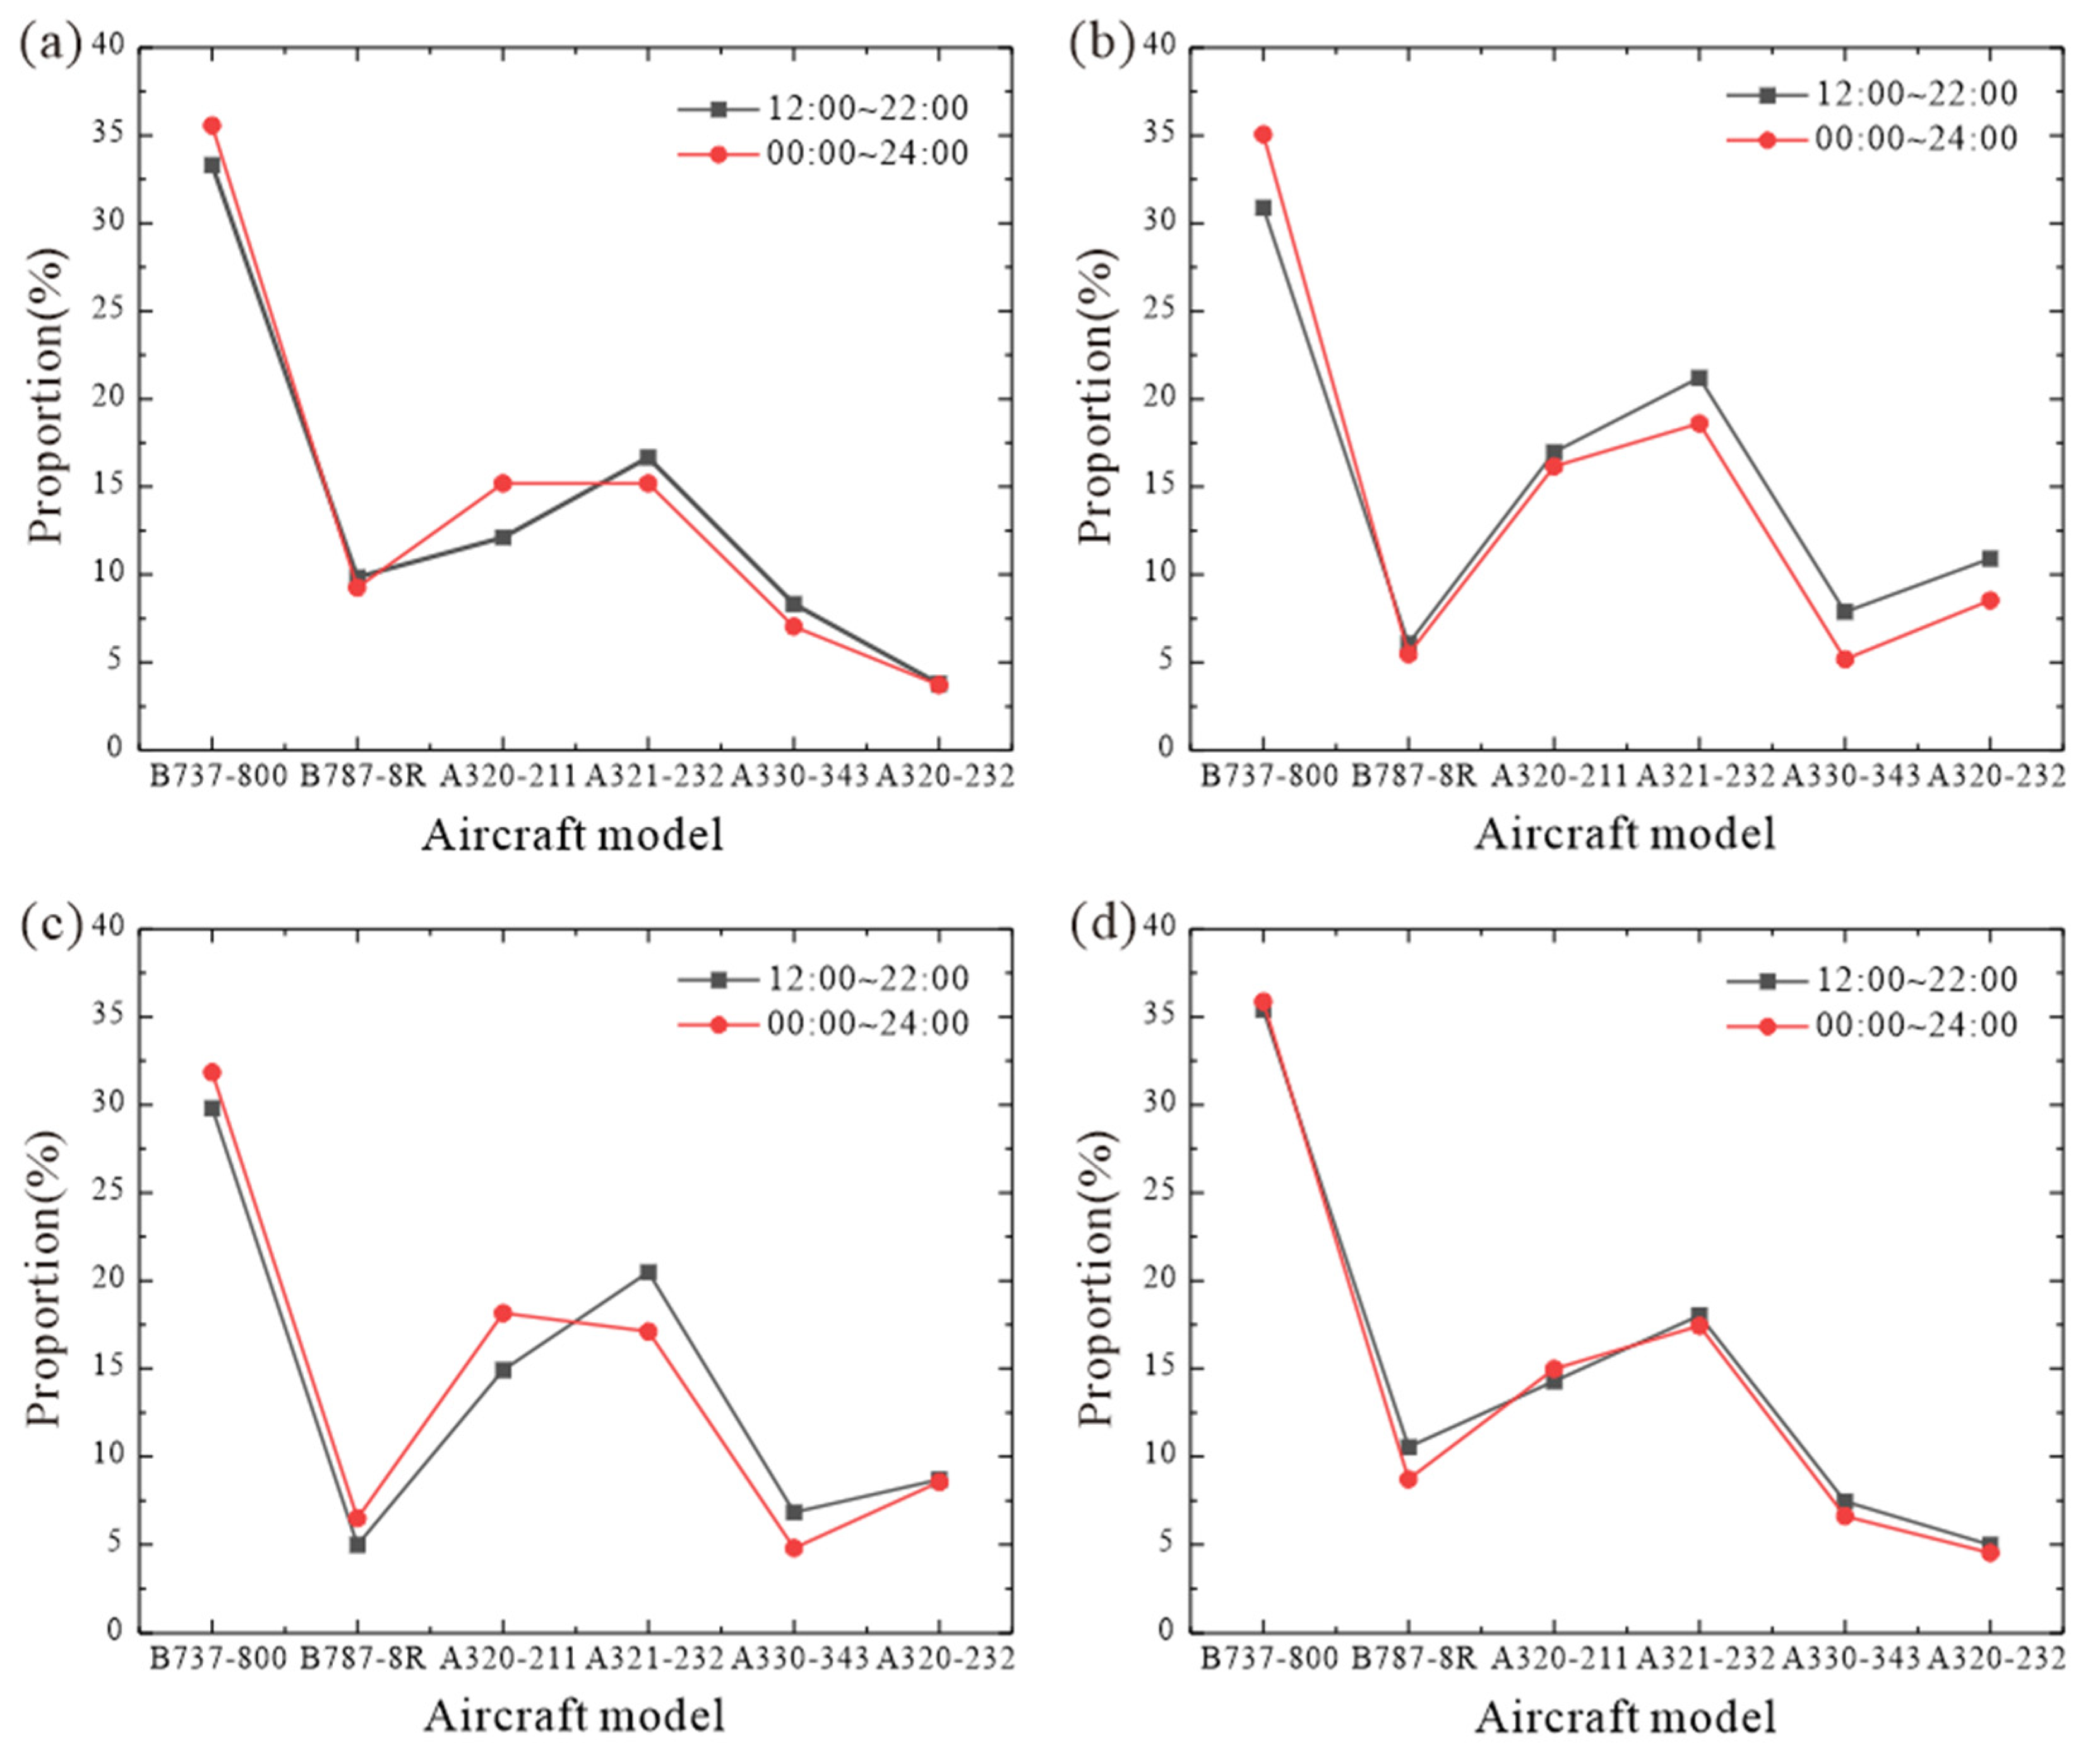
Figure 10.
Proportion of aircraft types during taking off and landing at different runways of BIA (main aircraft types). (a) Takeoff from runway 19, (b) takeoff from runway 20R, (c) landing from runway 19, (d) landing from runway 20L.
Figure 10.
Proportion of aircraft types during taking off and landing at different runways of BIA (main aircraft types). (a) Takeoff from runway 19, (b) takeoff from runway 20R, (c) landing from runway 19, (d) landing from runway 20L.
Figure 11.
Location of the measurement points on different date of 2021; (a) 15 March, (b) 30 March (S4, S5), and 24 April (S4).
Figure 11.
Location of the measurement points on different date of 2021; (a) 15 March, (b) 30 March (S4, S5), and 24 April (S4).
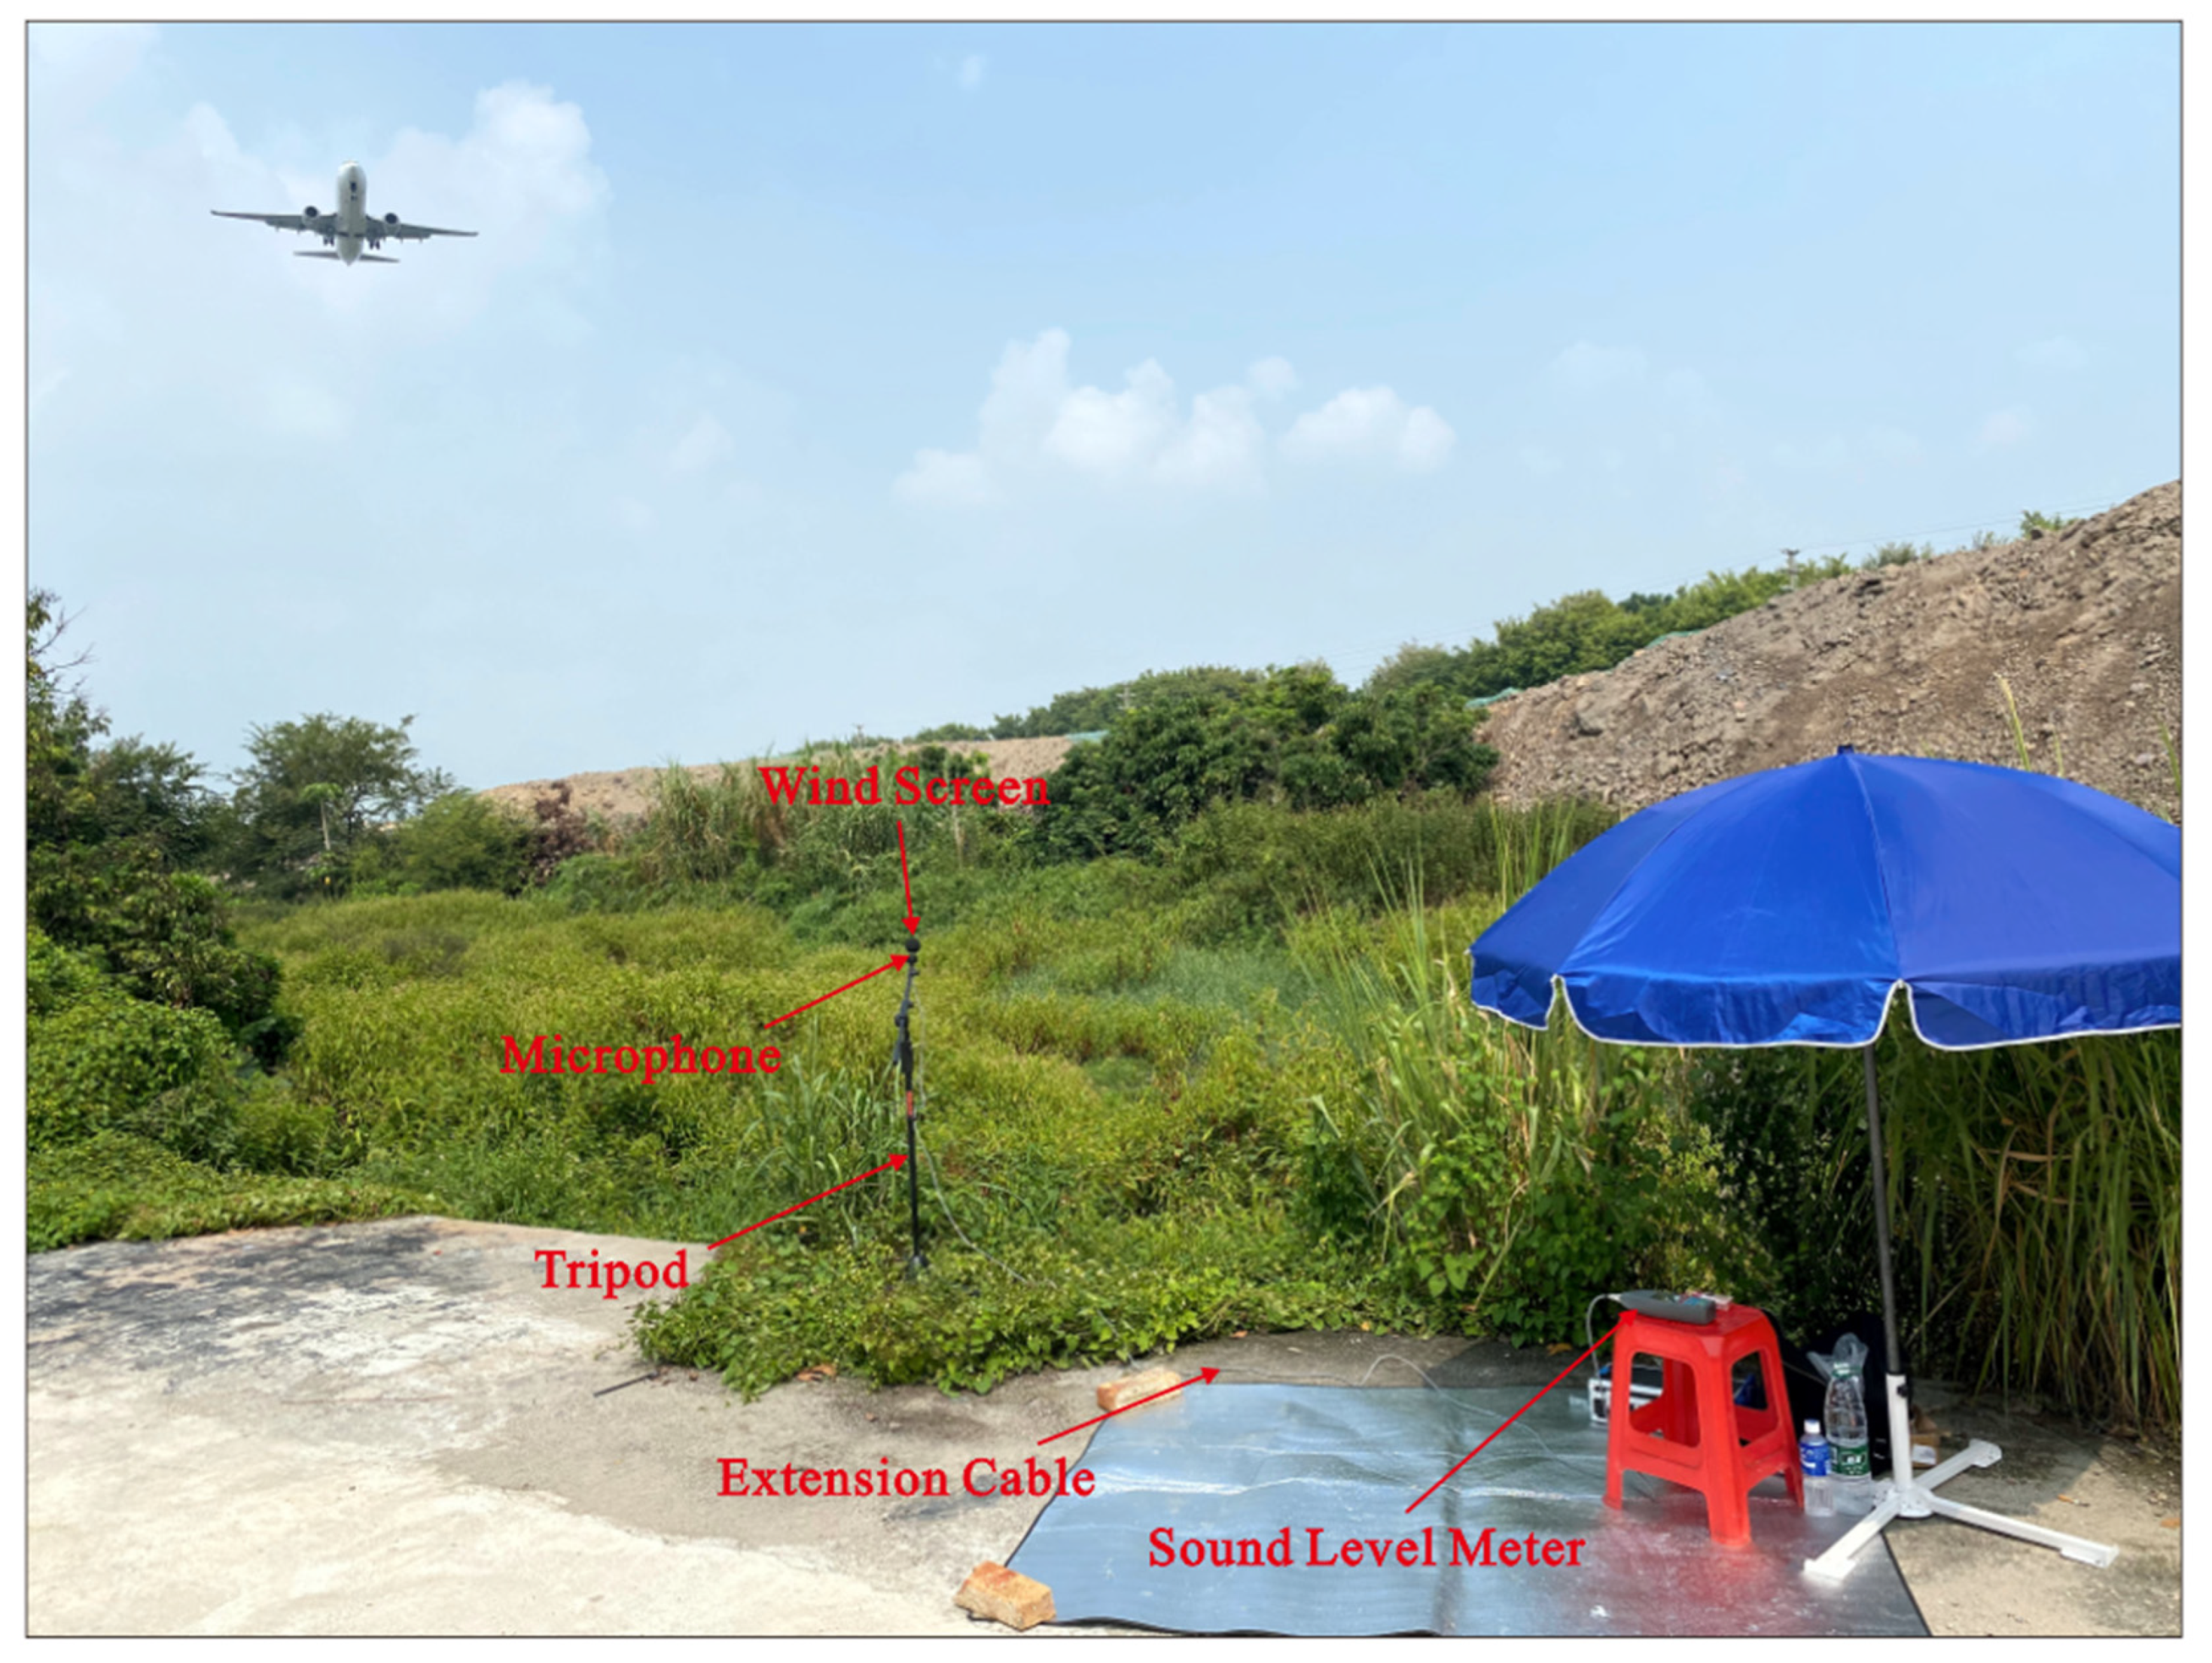
Figure 12.
Measurement of aircraft noise.
Figure 12.
Measurement of aircraft noise.
Figure 13.
Correction process of the airport noise model.
Figure 13.
Correction process of the airport noise model.
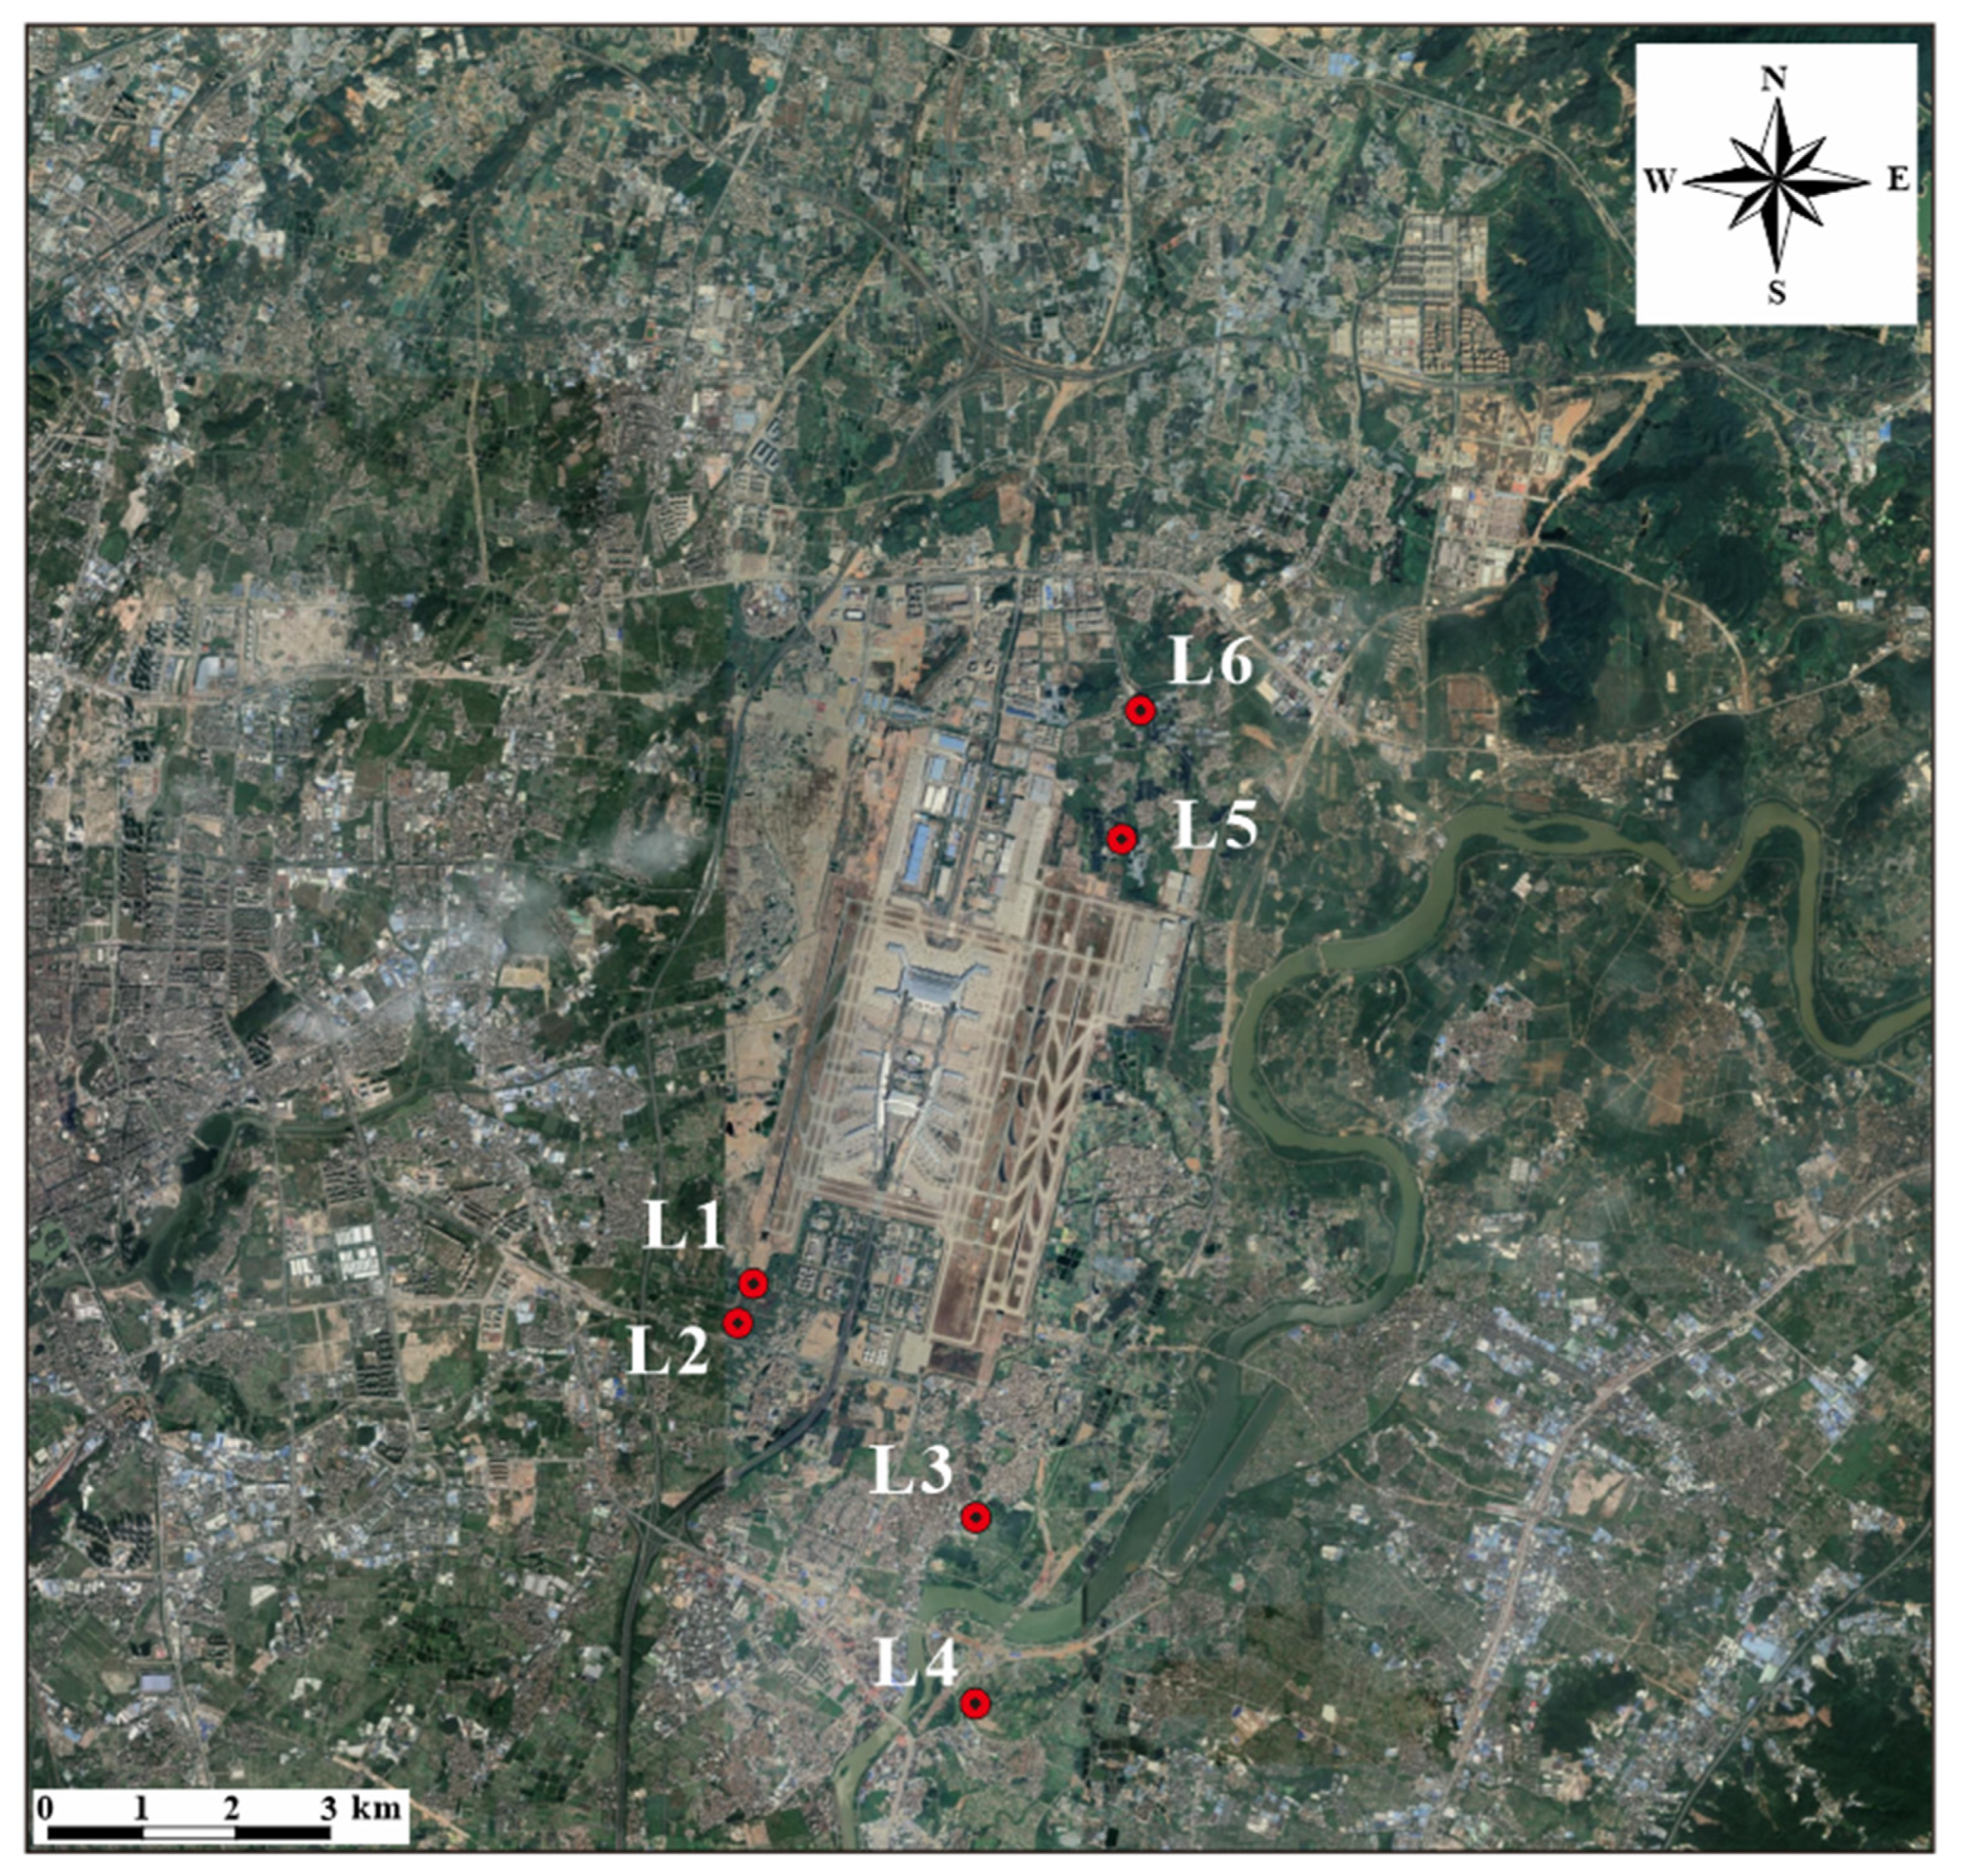
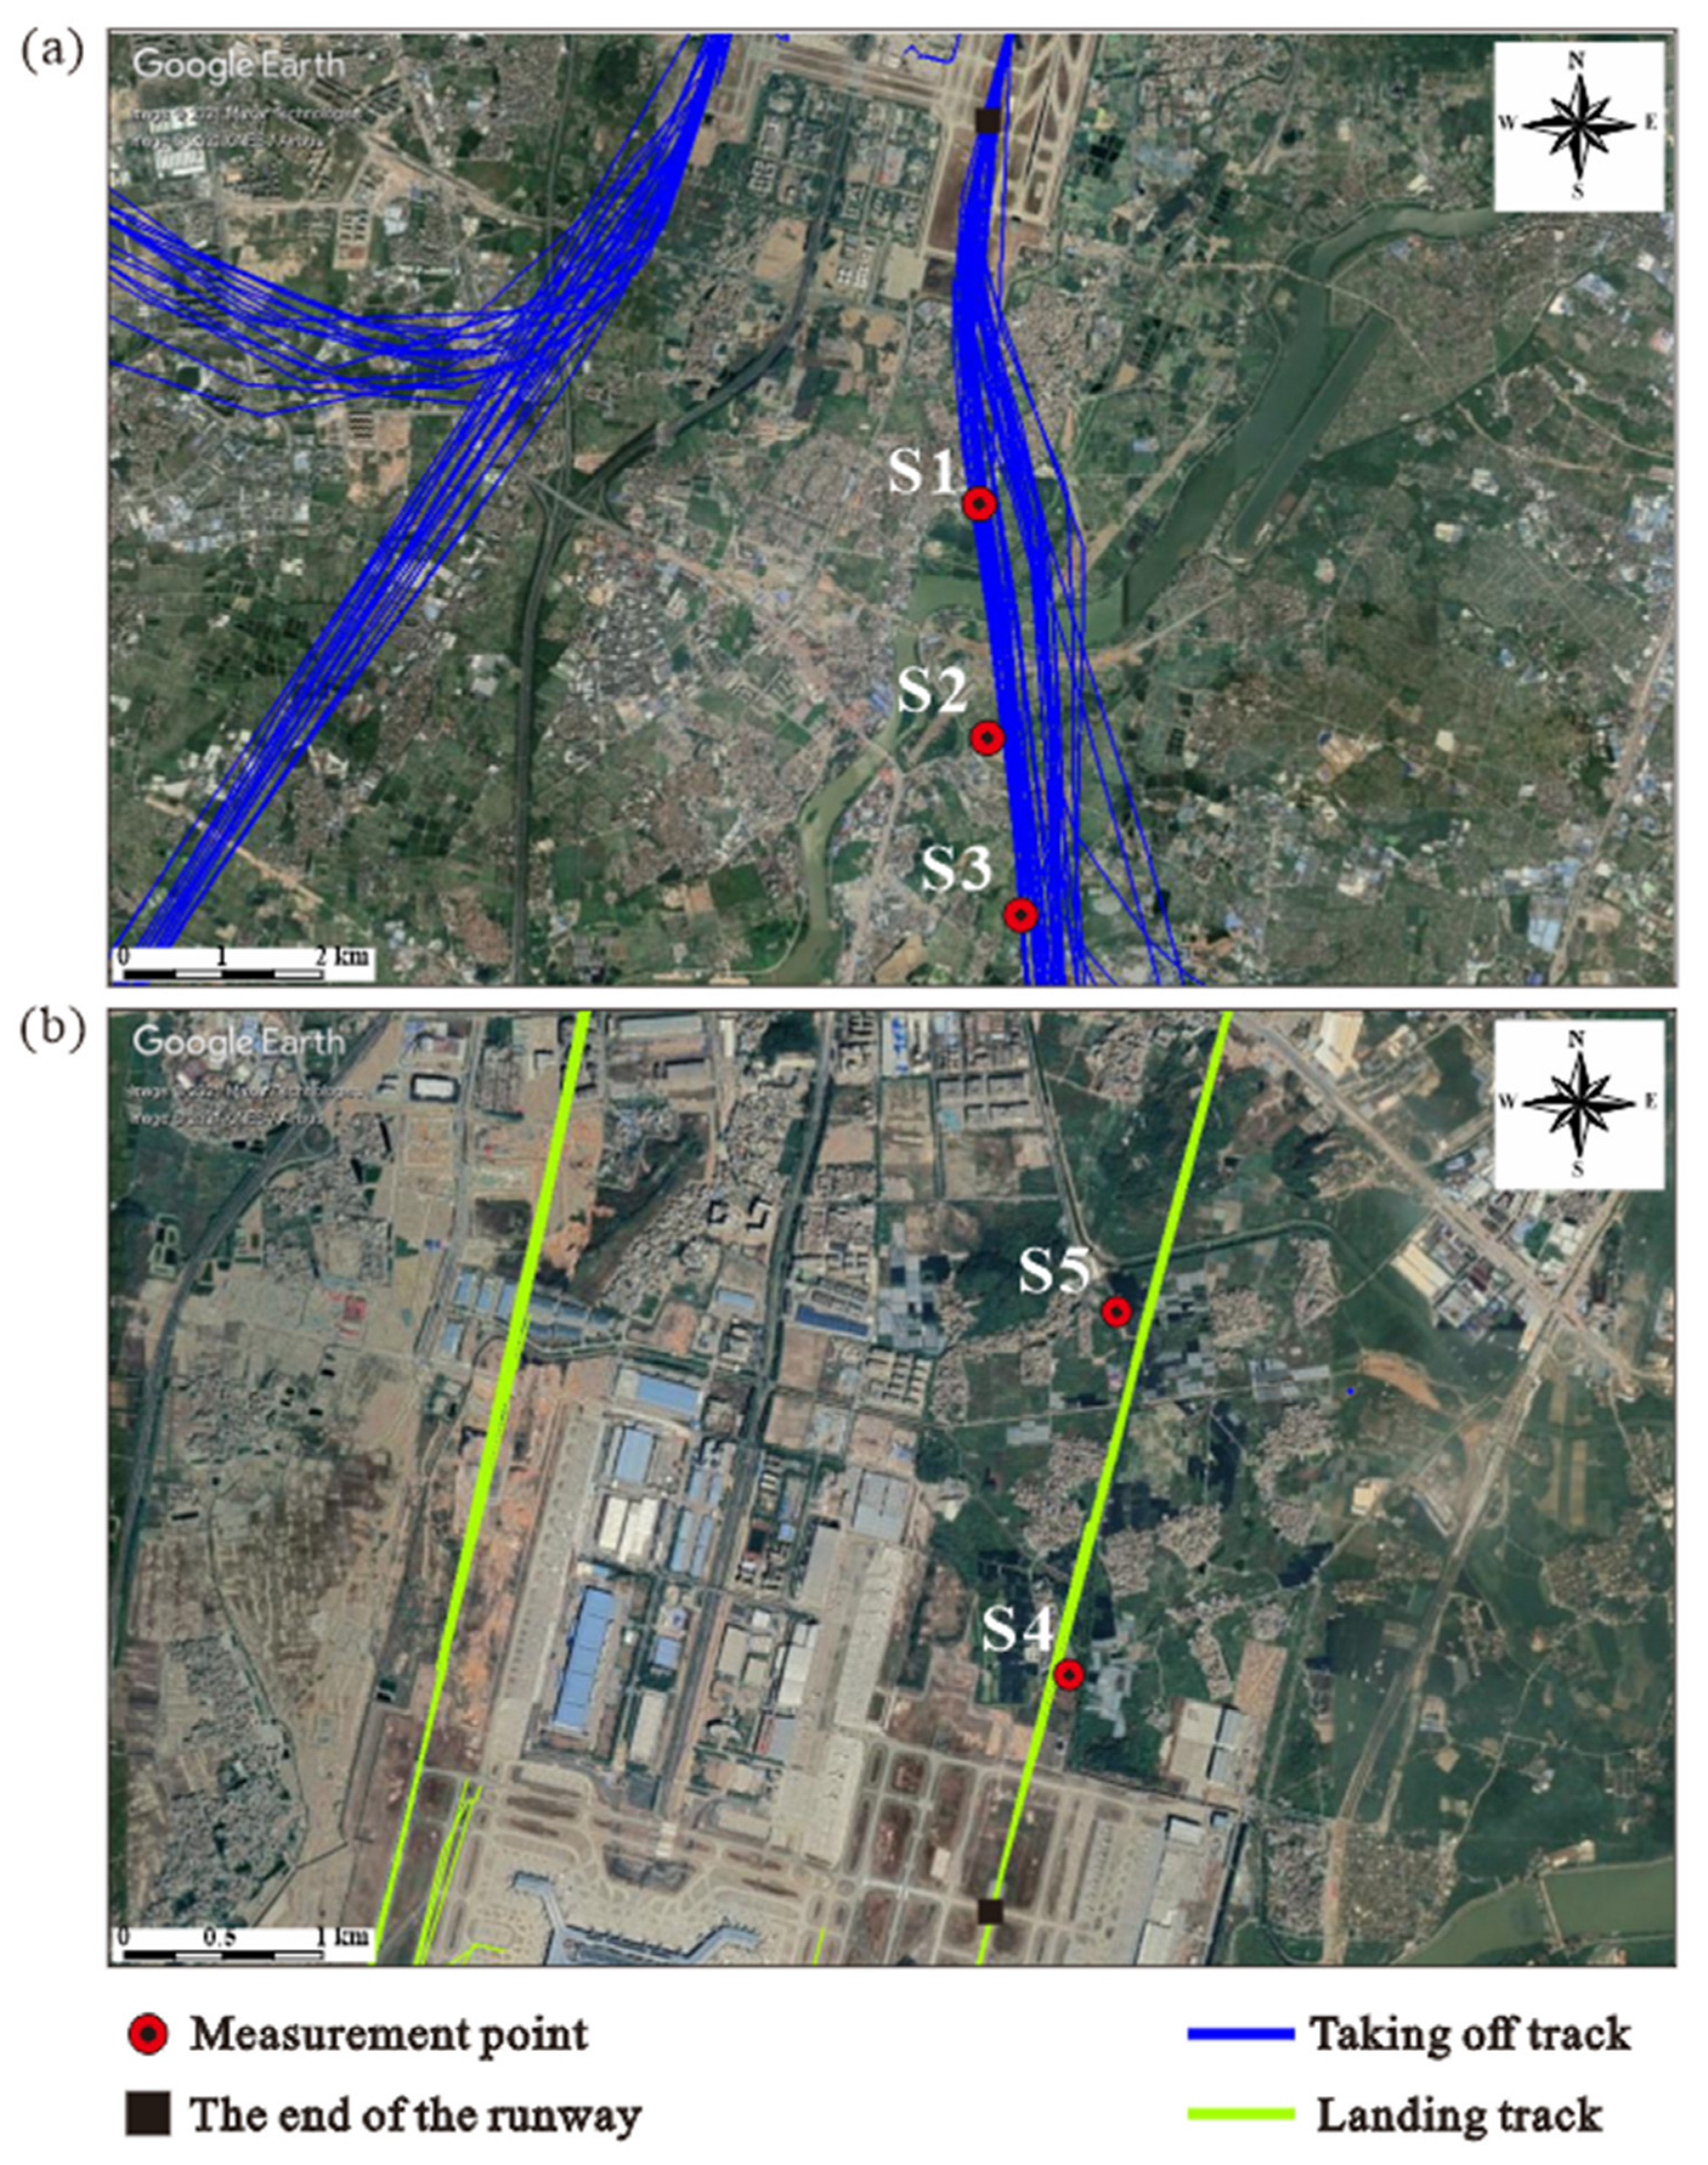
Figure 14.
Location of the measurement points for large area validation field experiment.
Figure 14.
Location of the measurement points for large area validation field experiment.
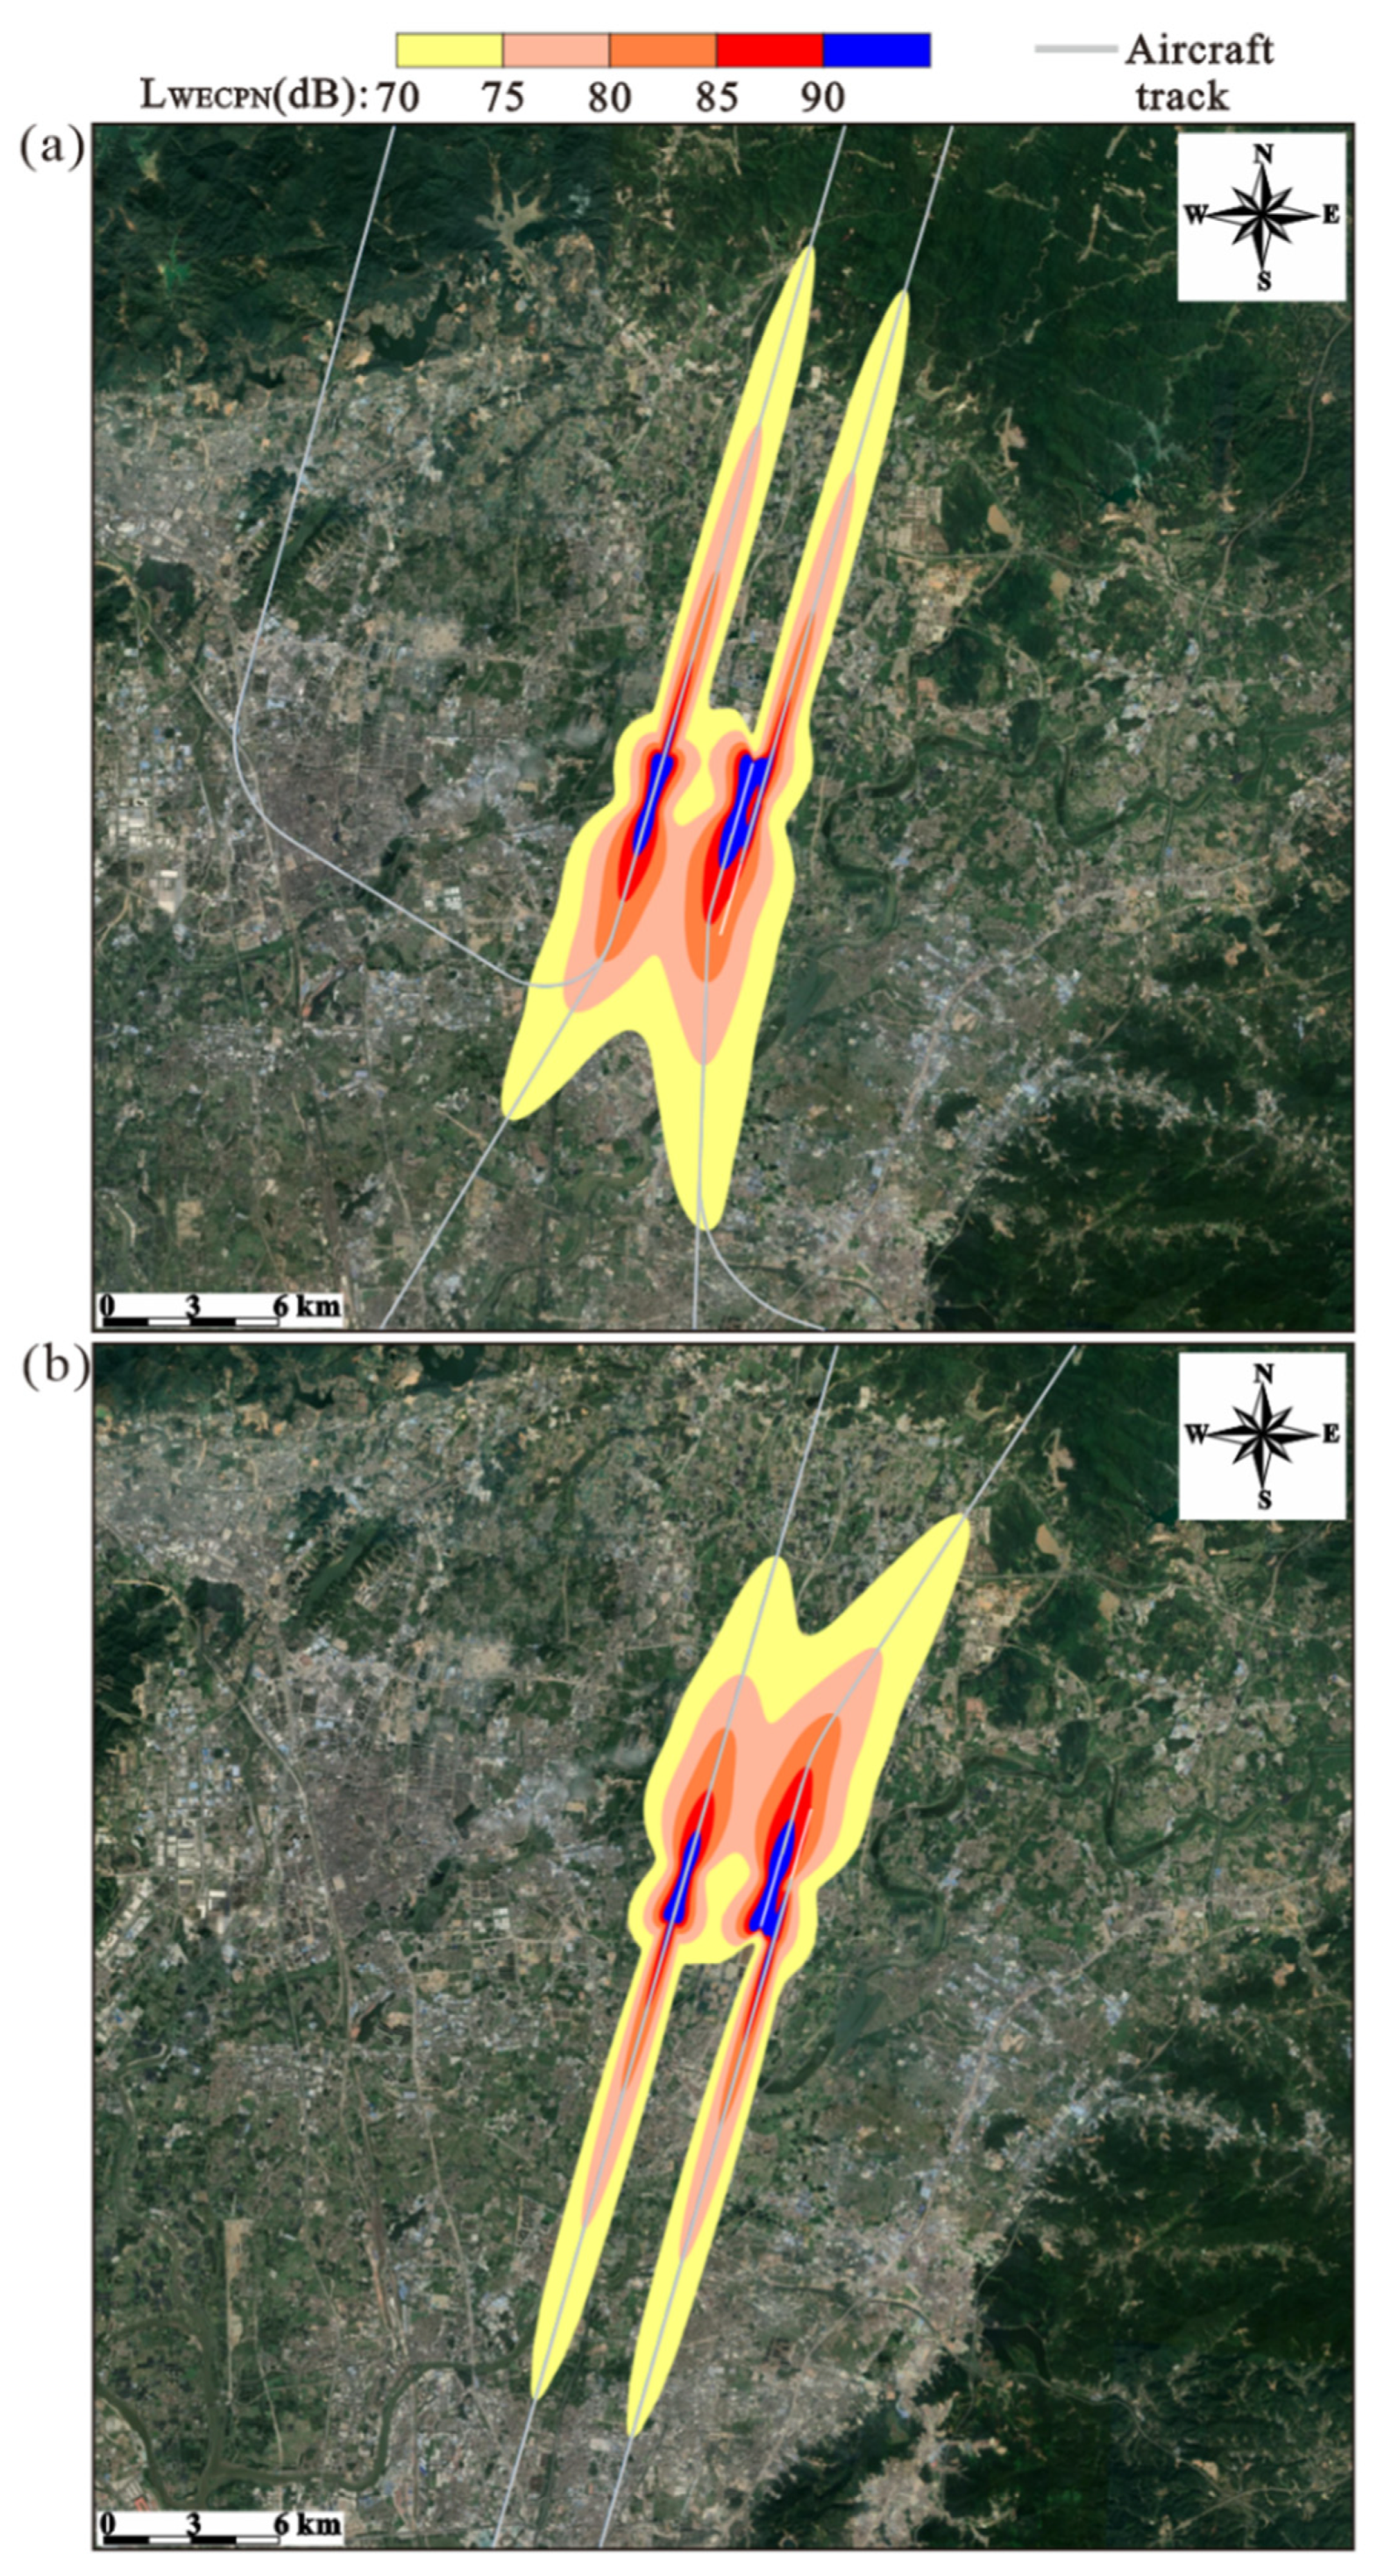
Figure 15.
Noise maps of BIA during (a) summer and (b) winter (not all aircraft tracks are shown for brevity).
Figure 15.
Noise maps of BIA during (a) summer and (b) winter (not all aircraft tracks are shown for brevity).
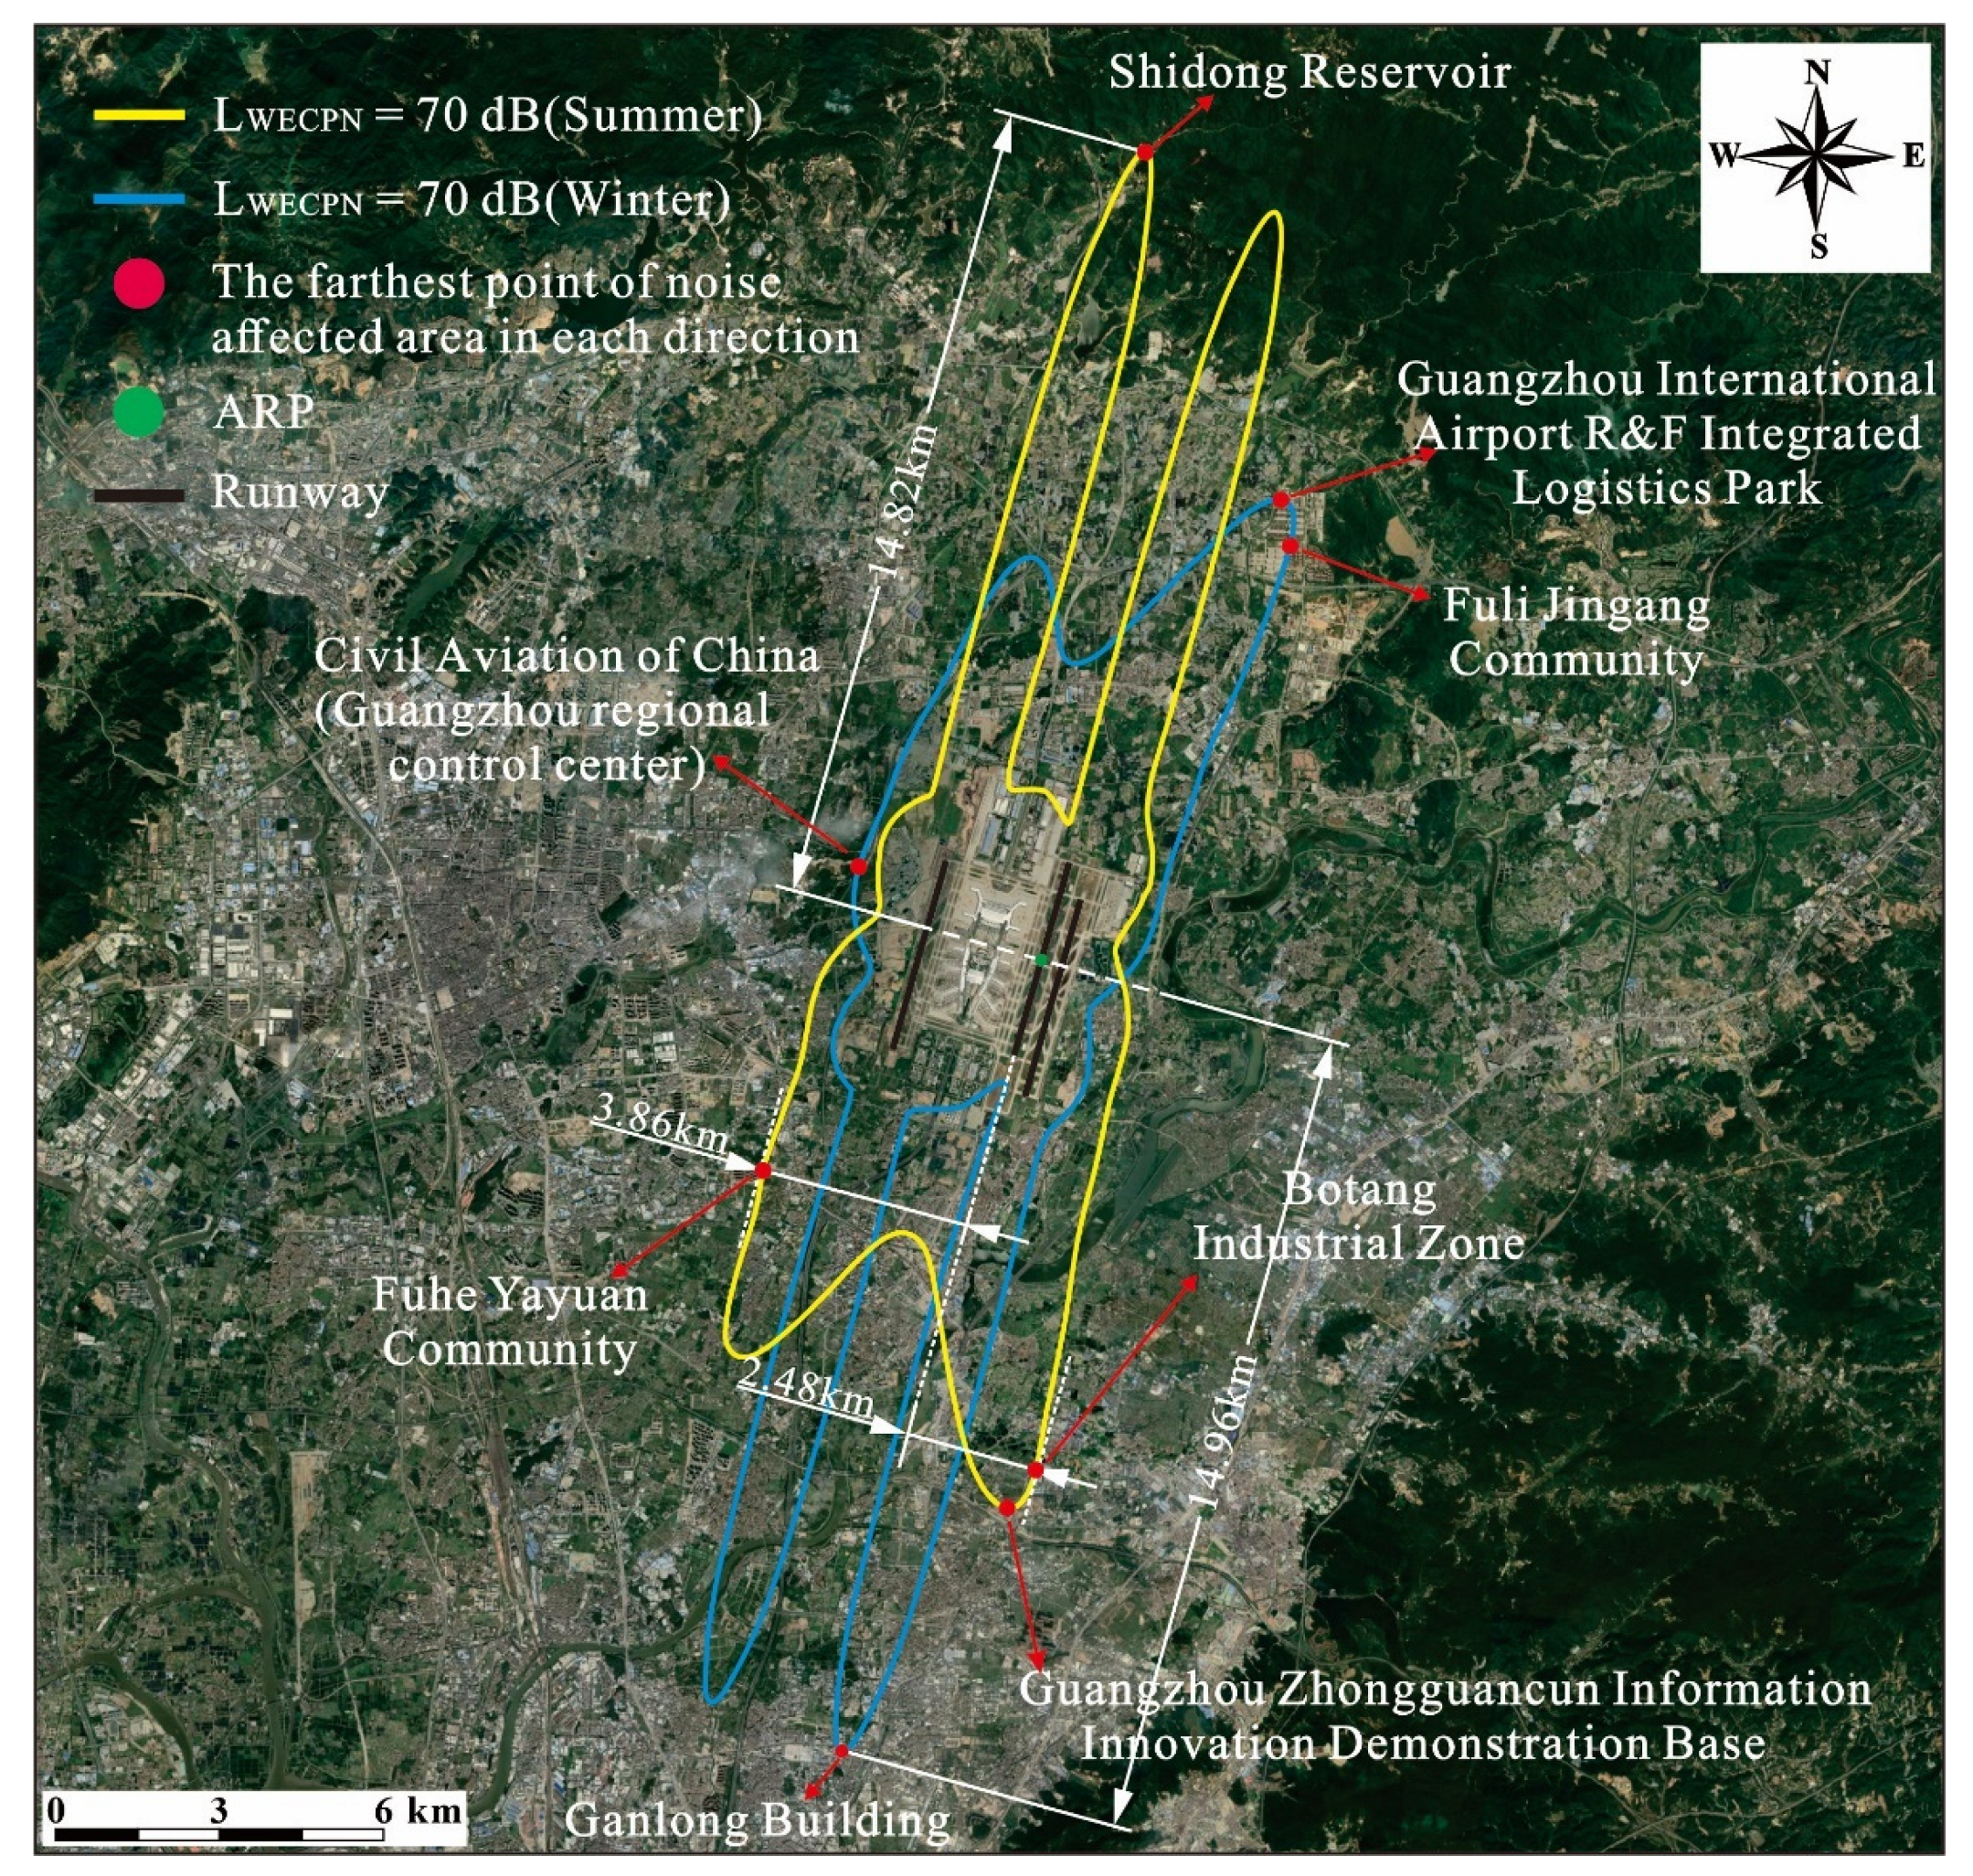
Figure 16.
Noise-affected areas surrounding BIA.
Figure 16.
Noise-affected areas surrounding BIA.
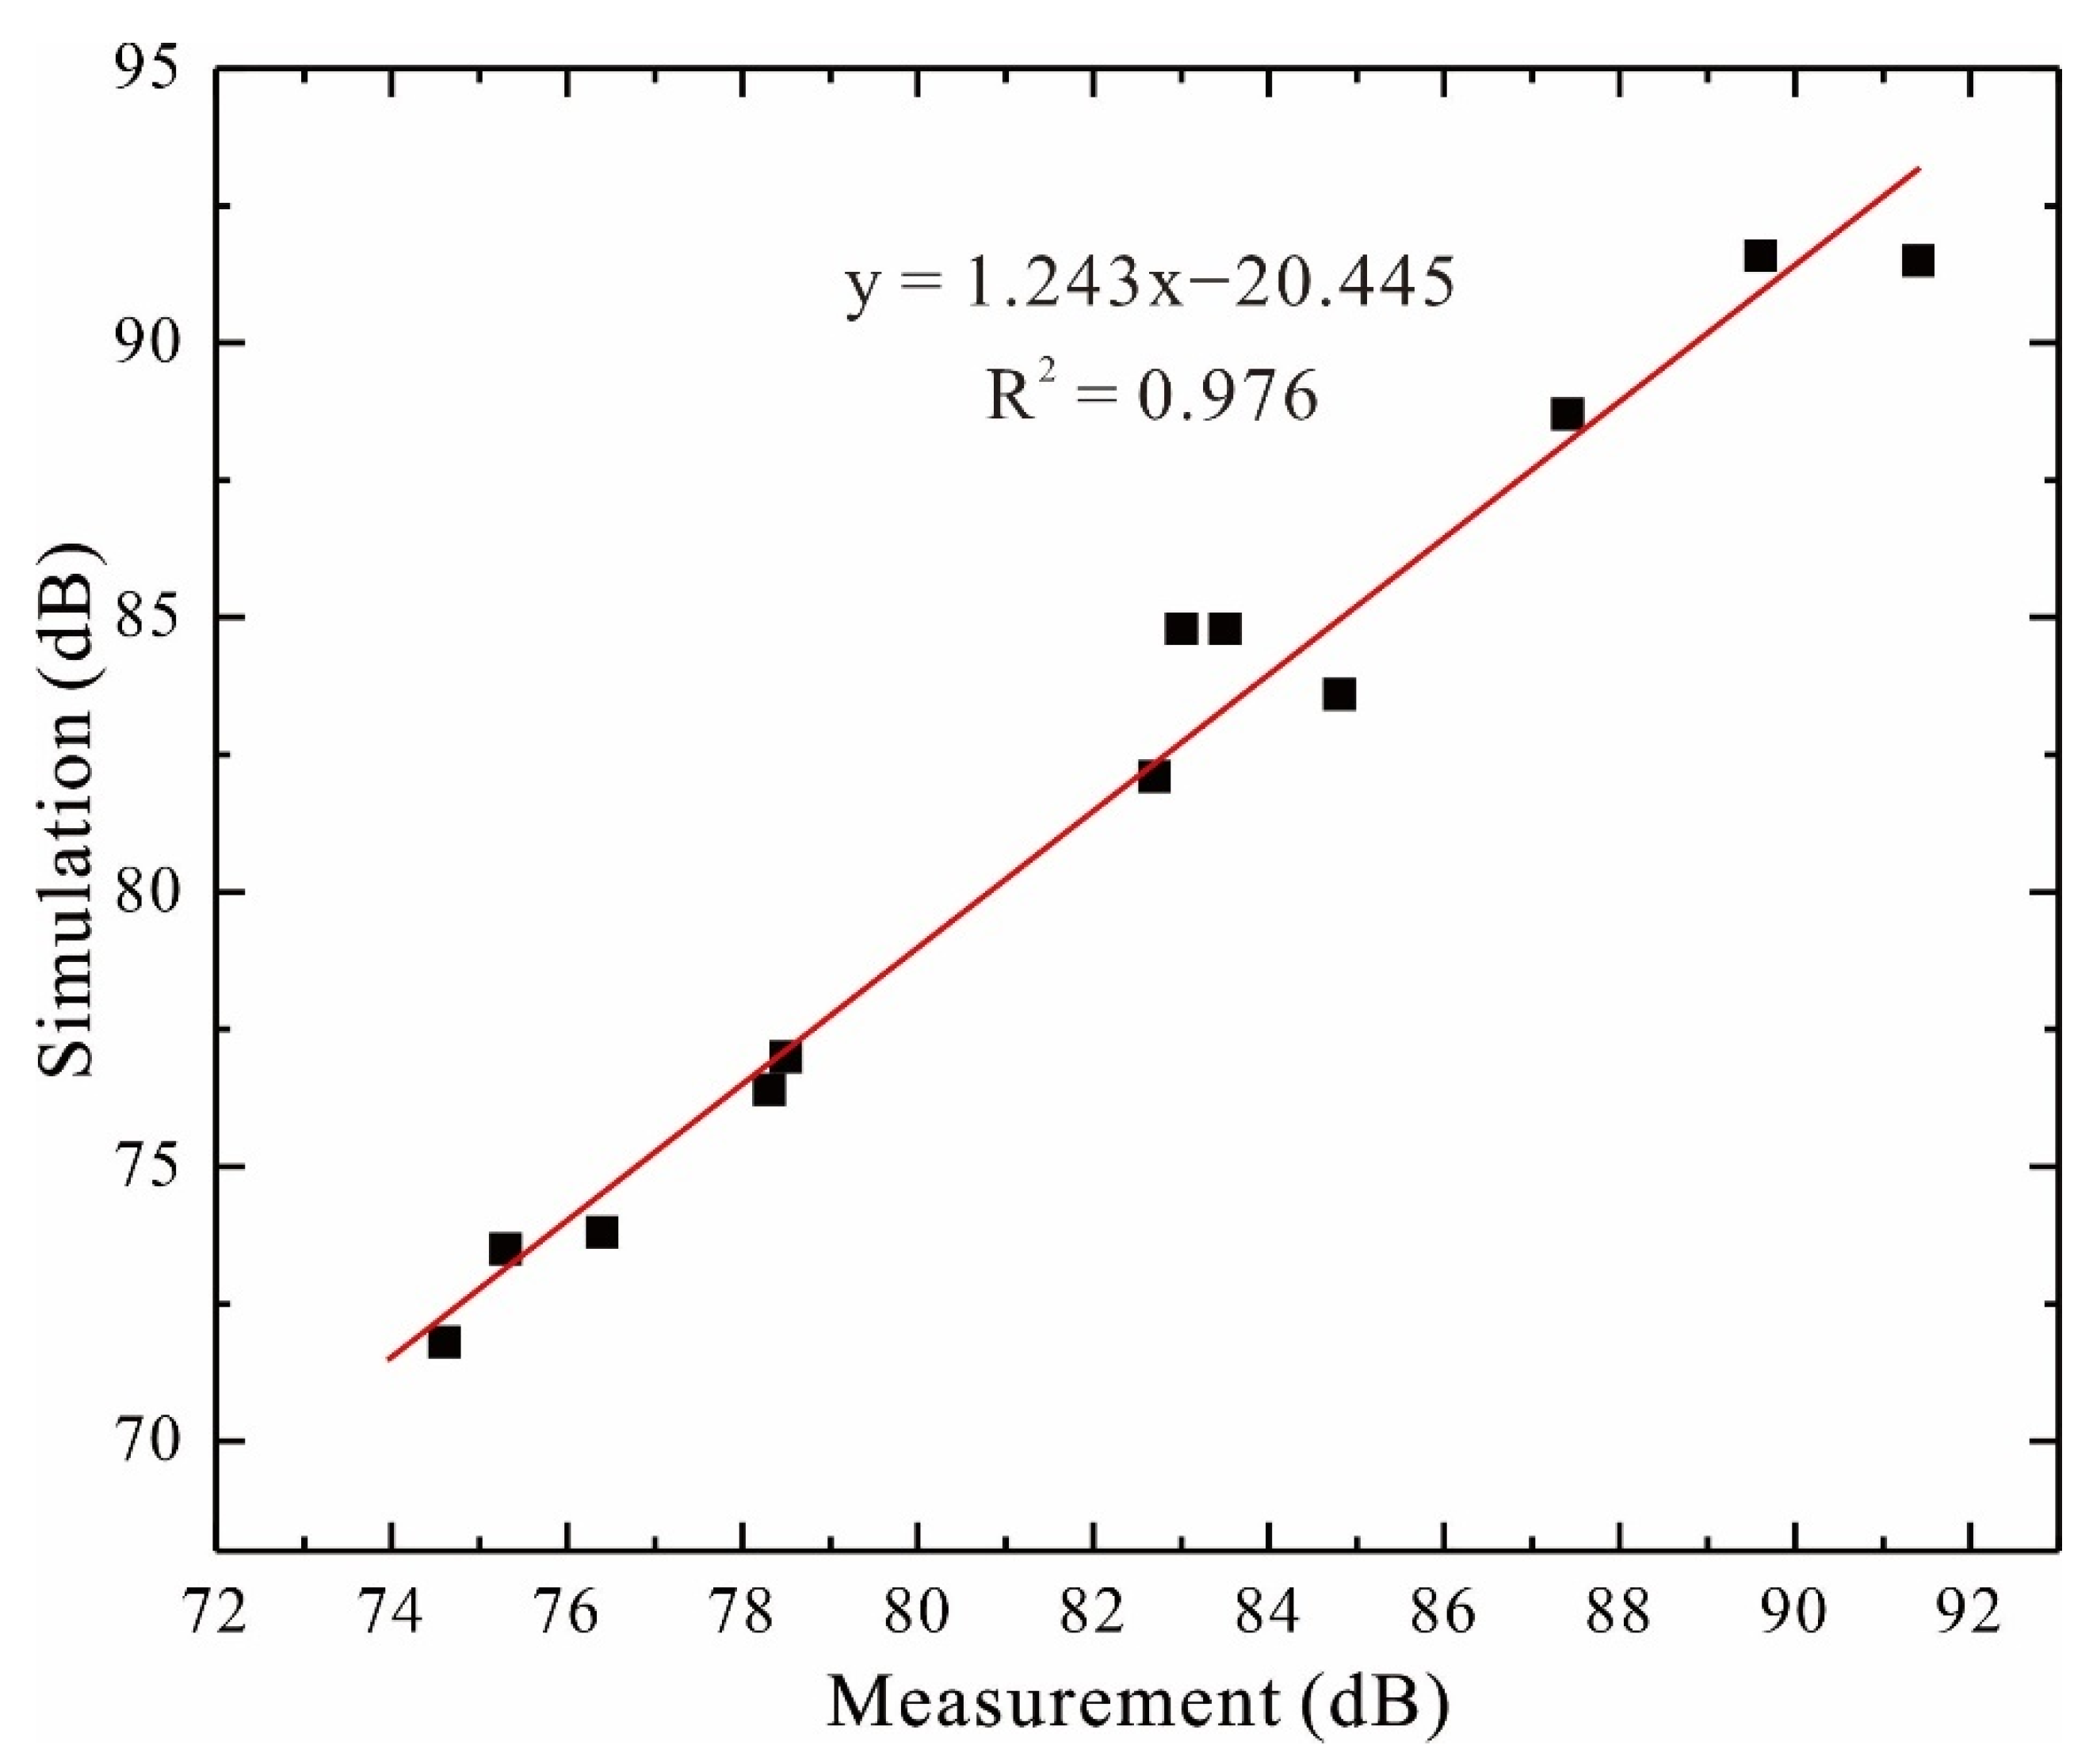
Figure 17.
Correlation between the measured and simulated results.
Figure 17.
Correlation between the measured and simulated results.
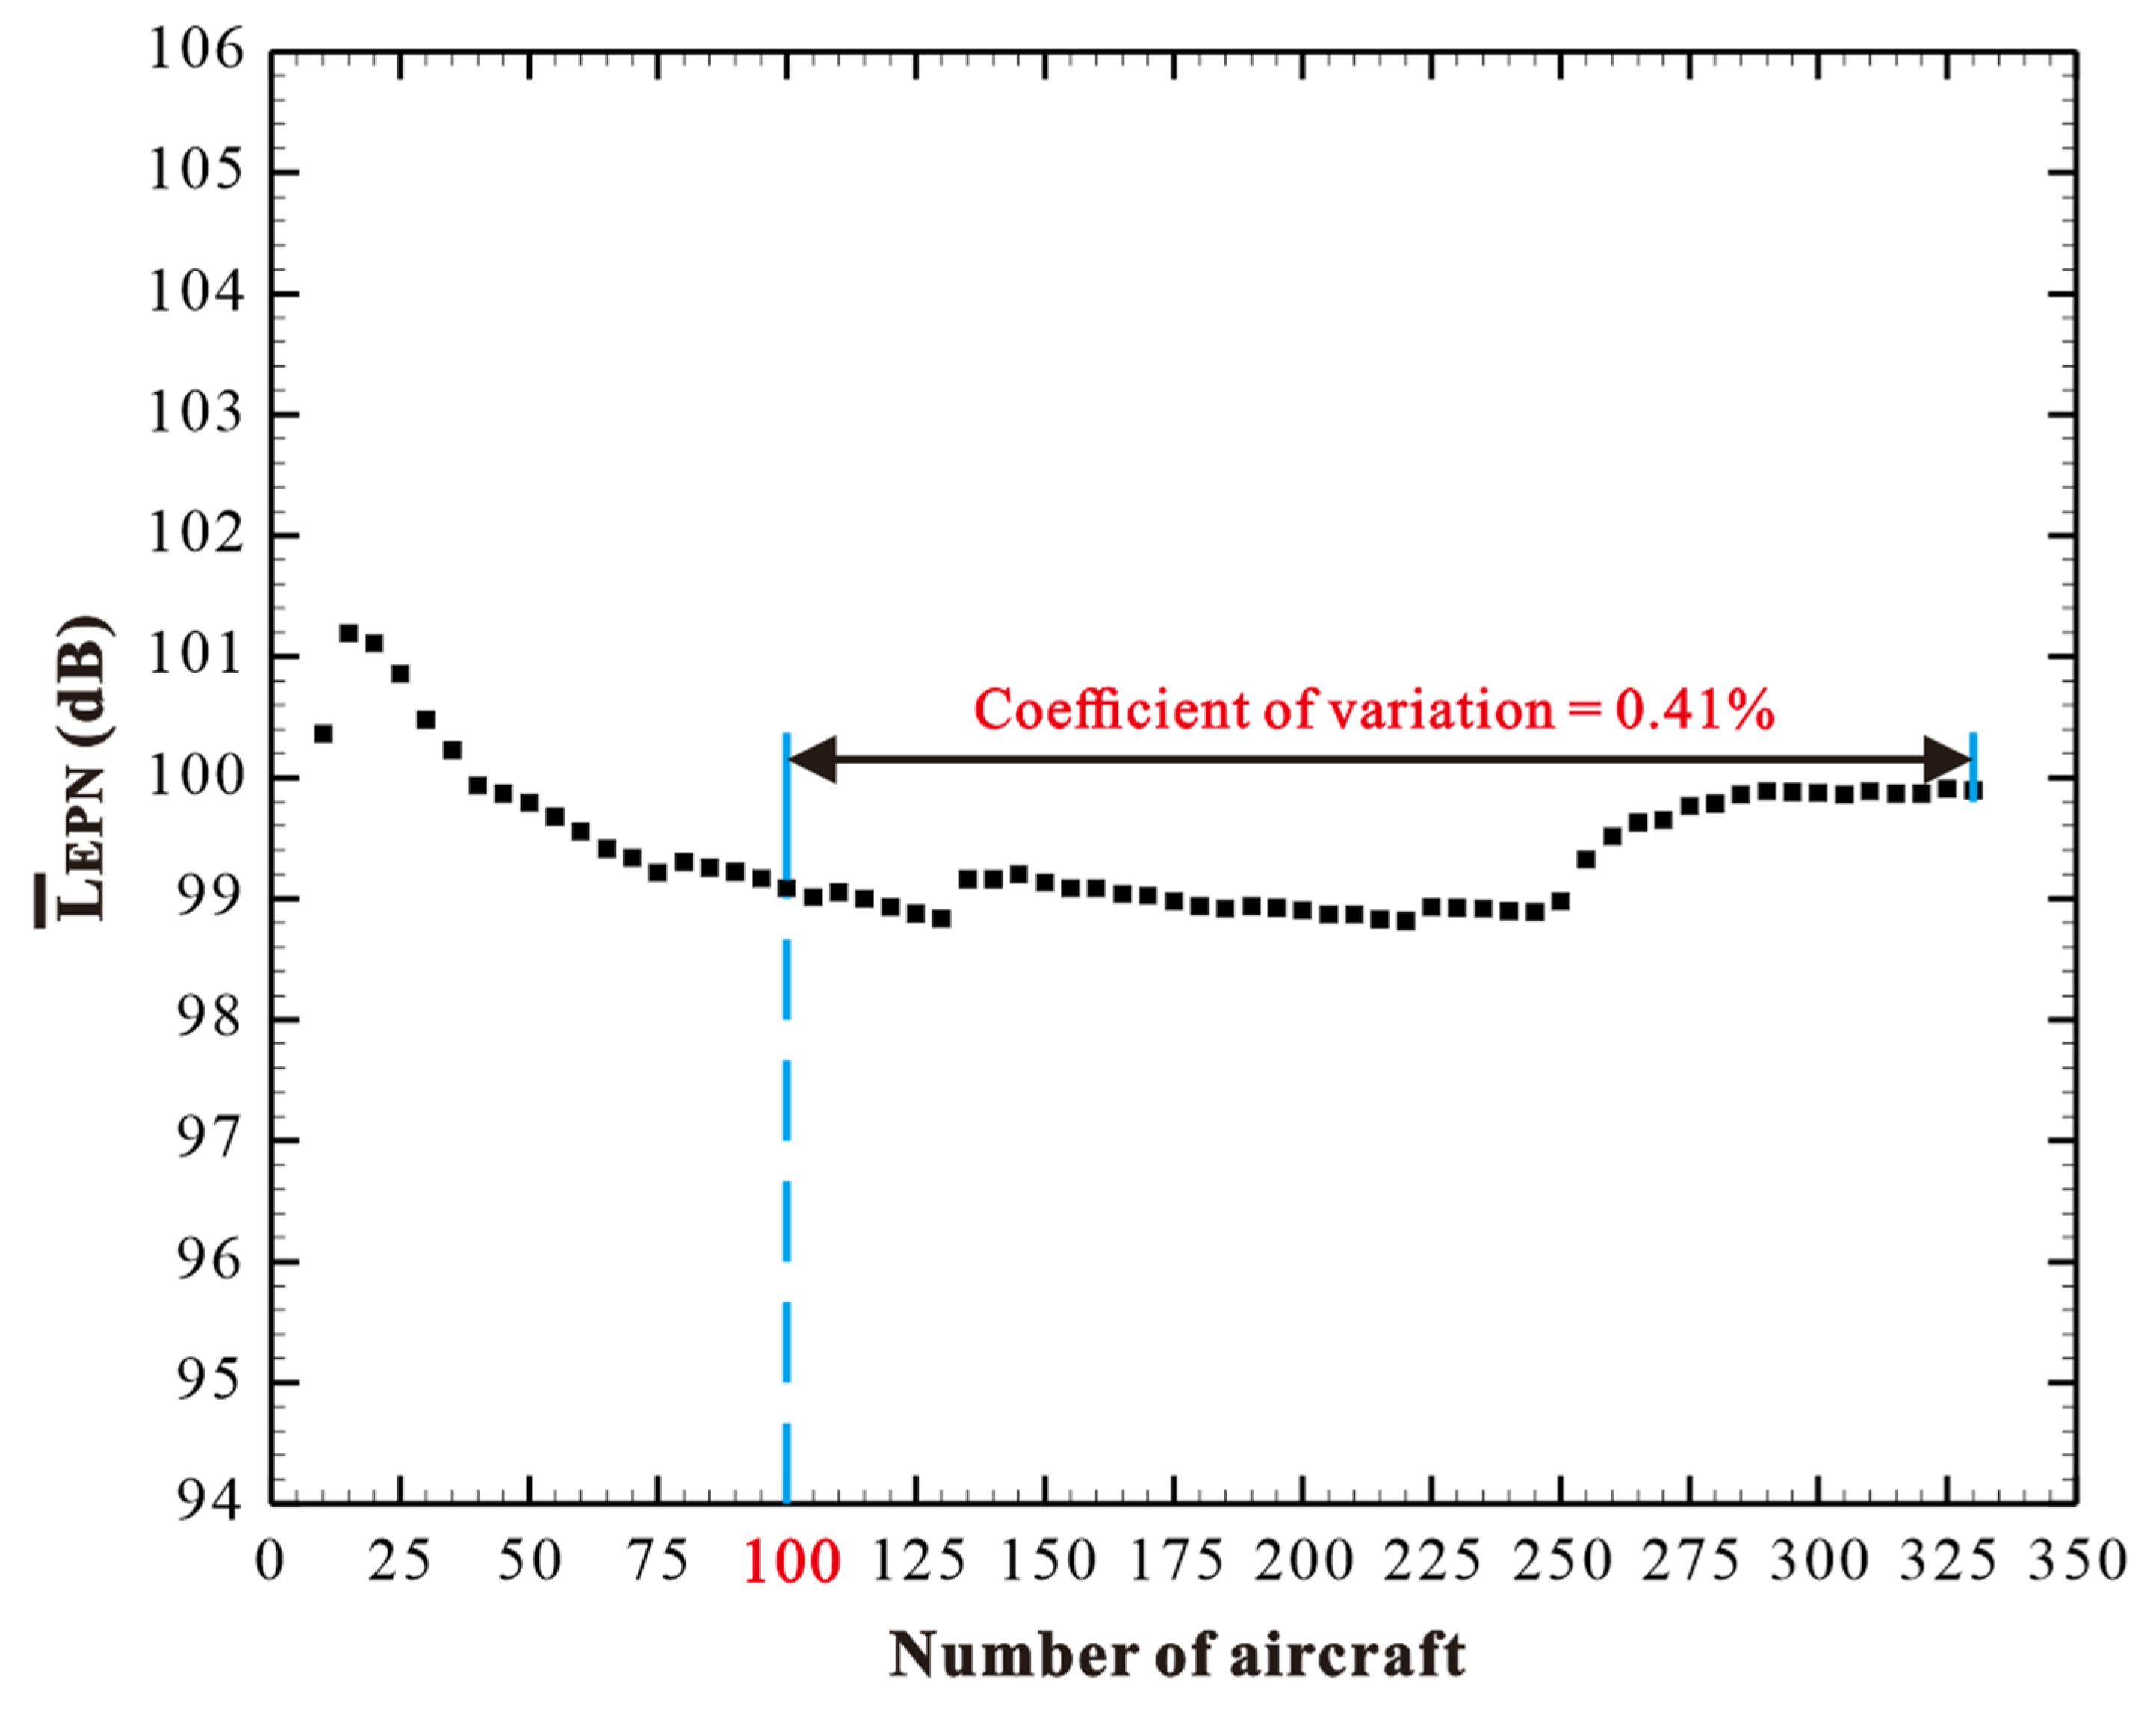
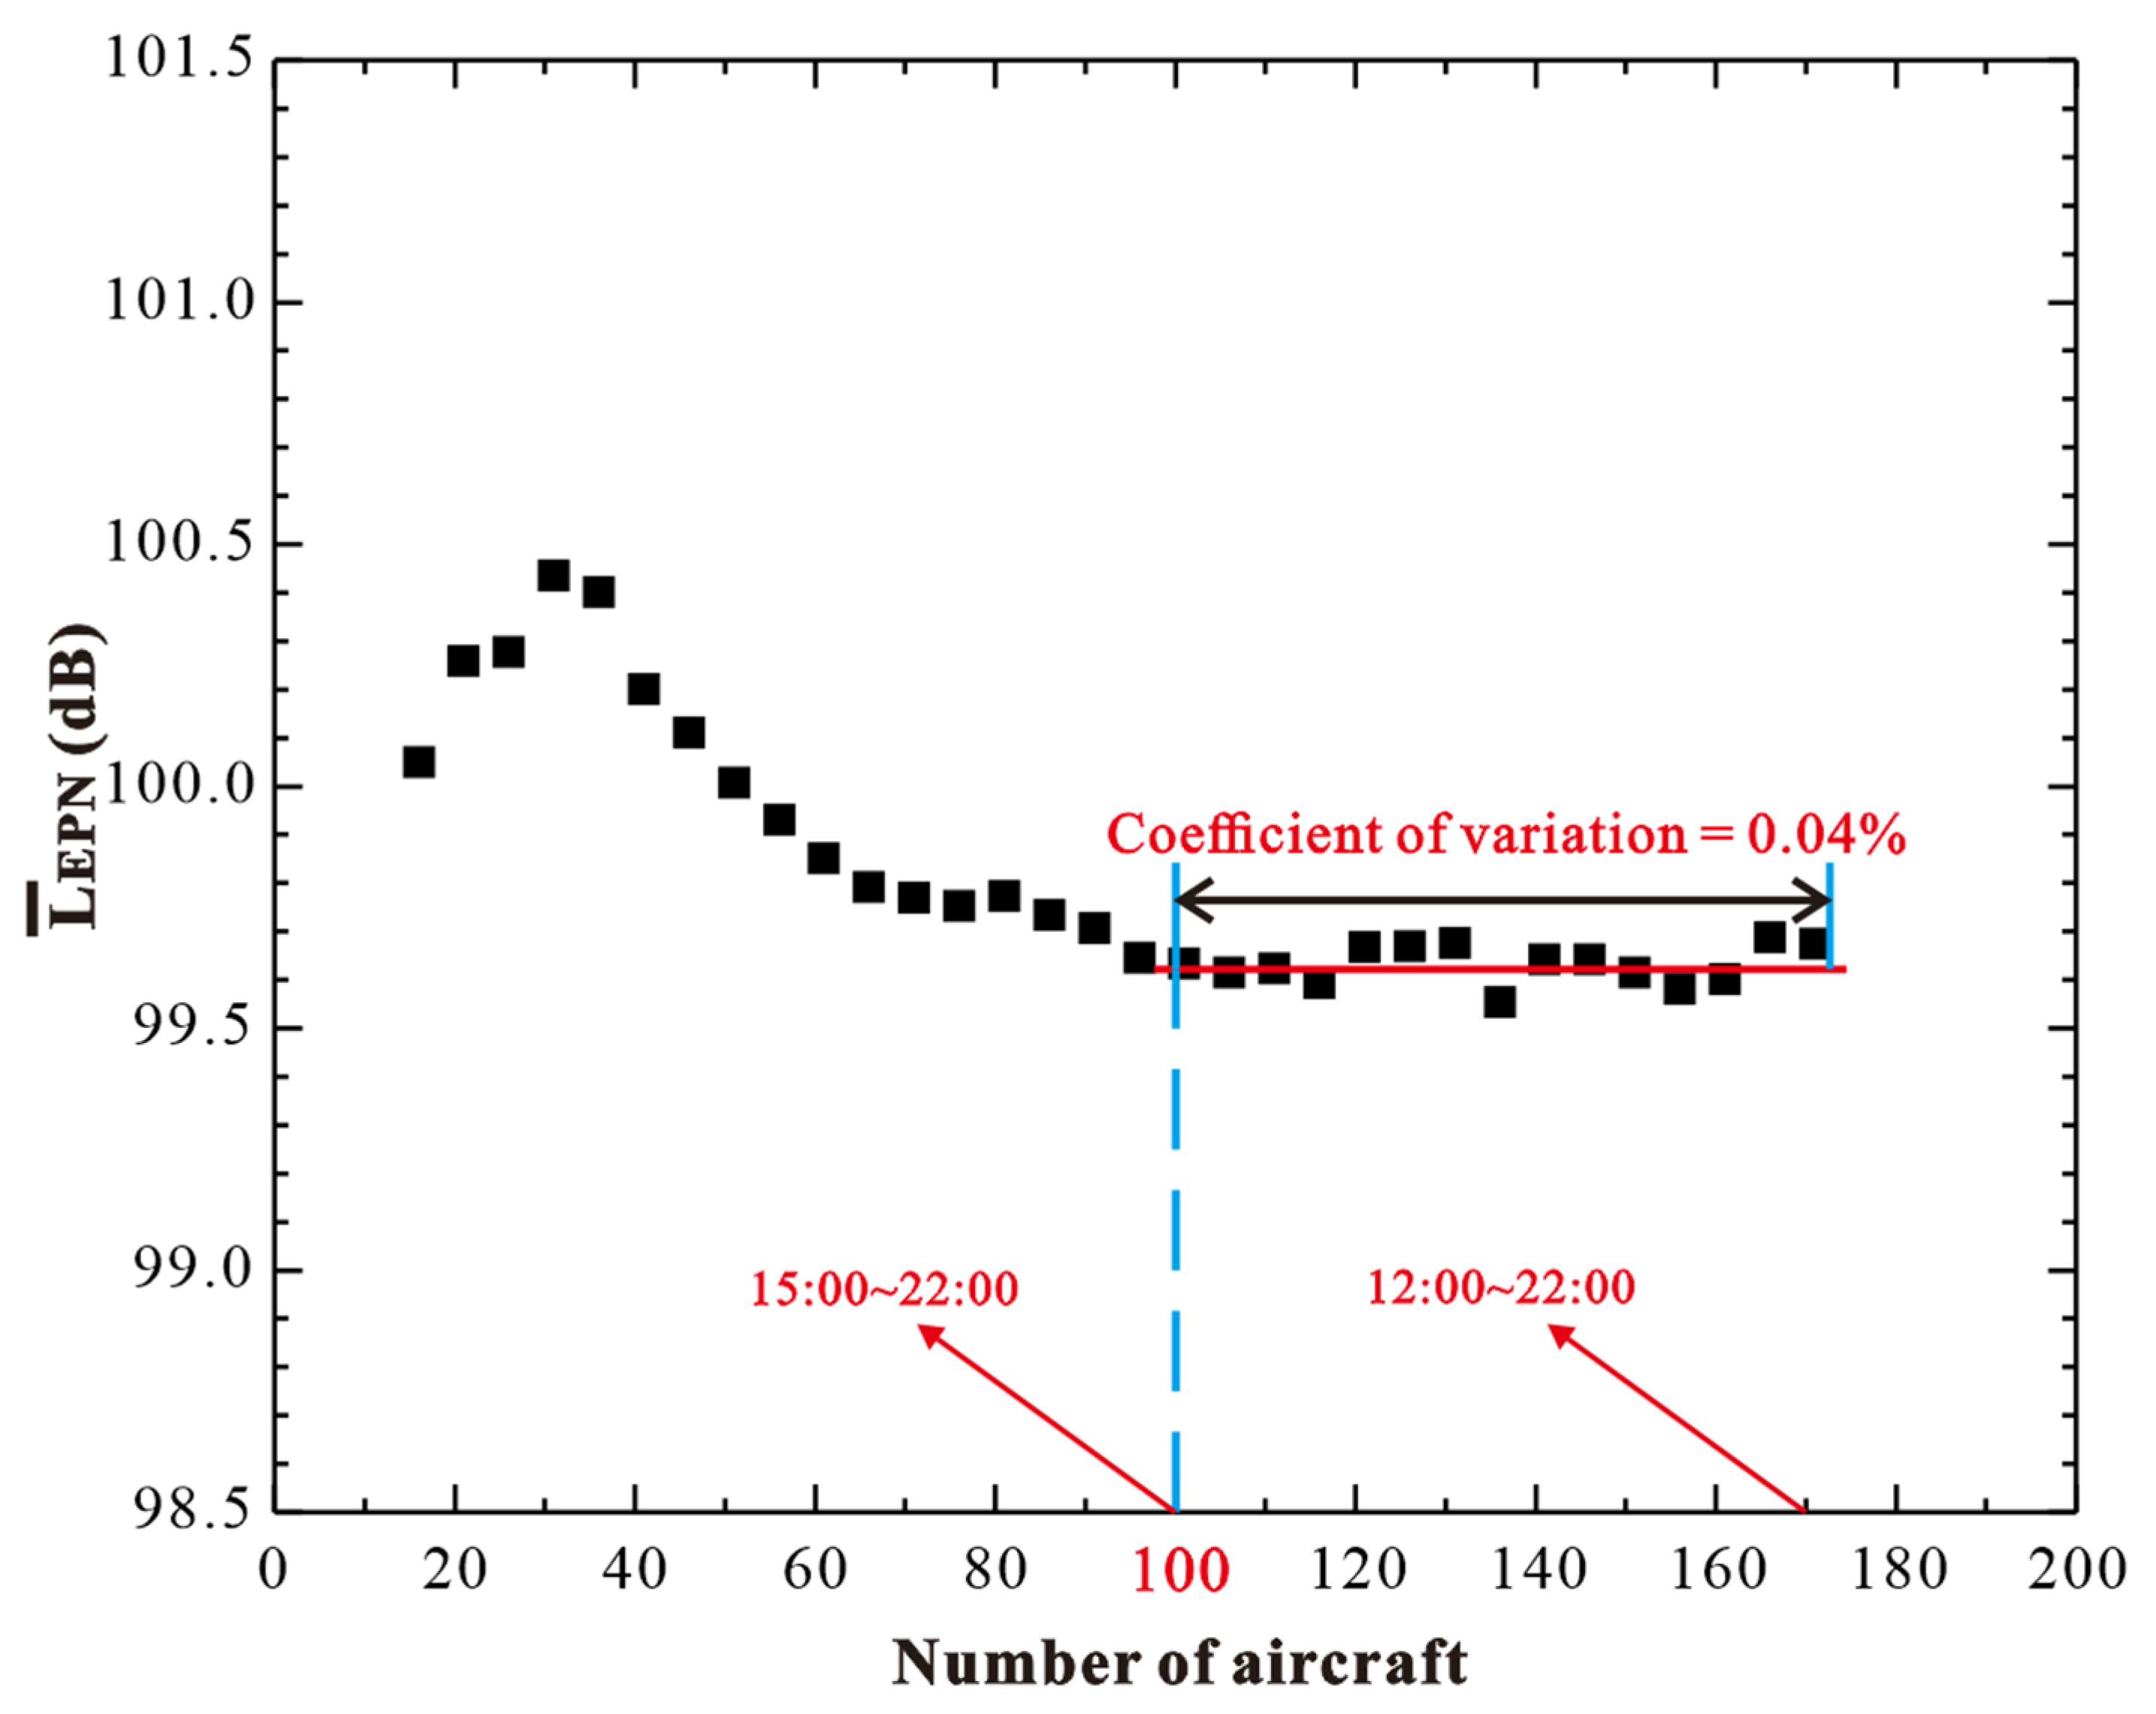
Figure 18.
Relationship between the number of aircraft and (12:00∼22:00).
Figure 18.
Relationship between the number of aircraft and (12:00∼22:00).
Figure 19.
Relationship between the number of aircraft and (24 h).
Figure 19.
Relationship between the number of aircraft and (24 h).
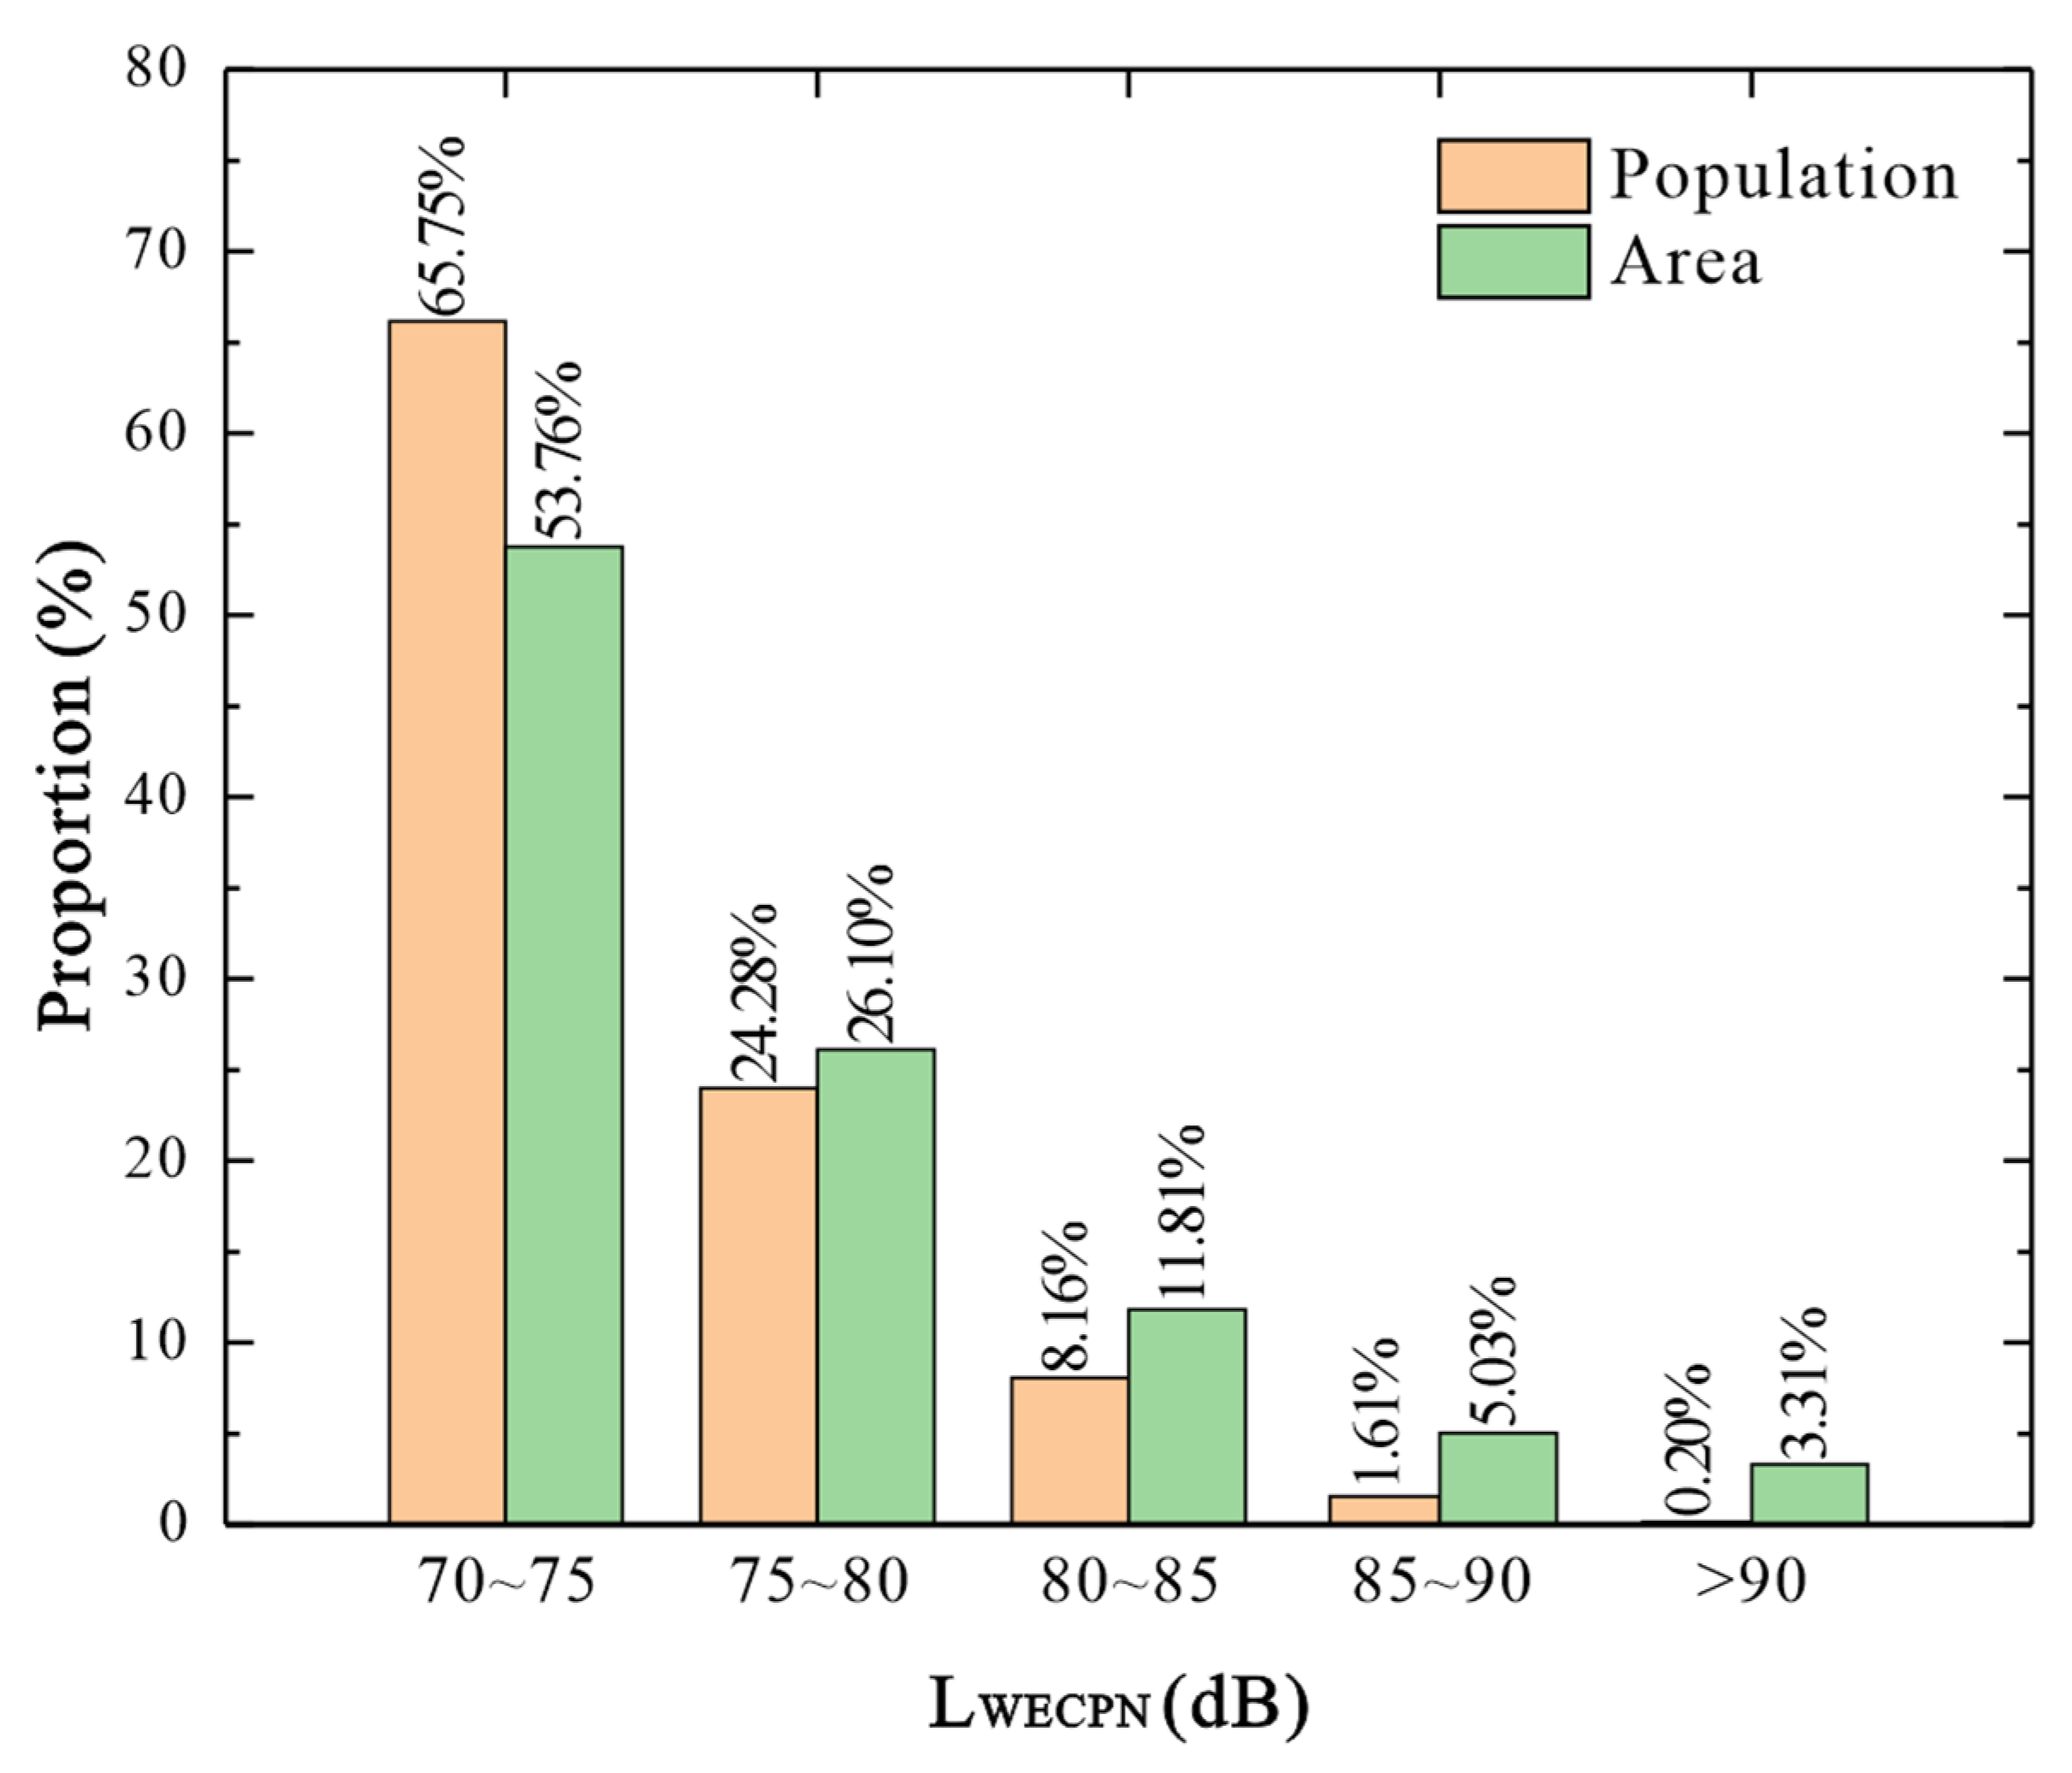
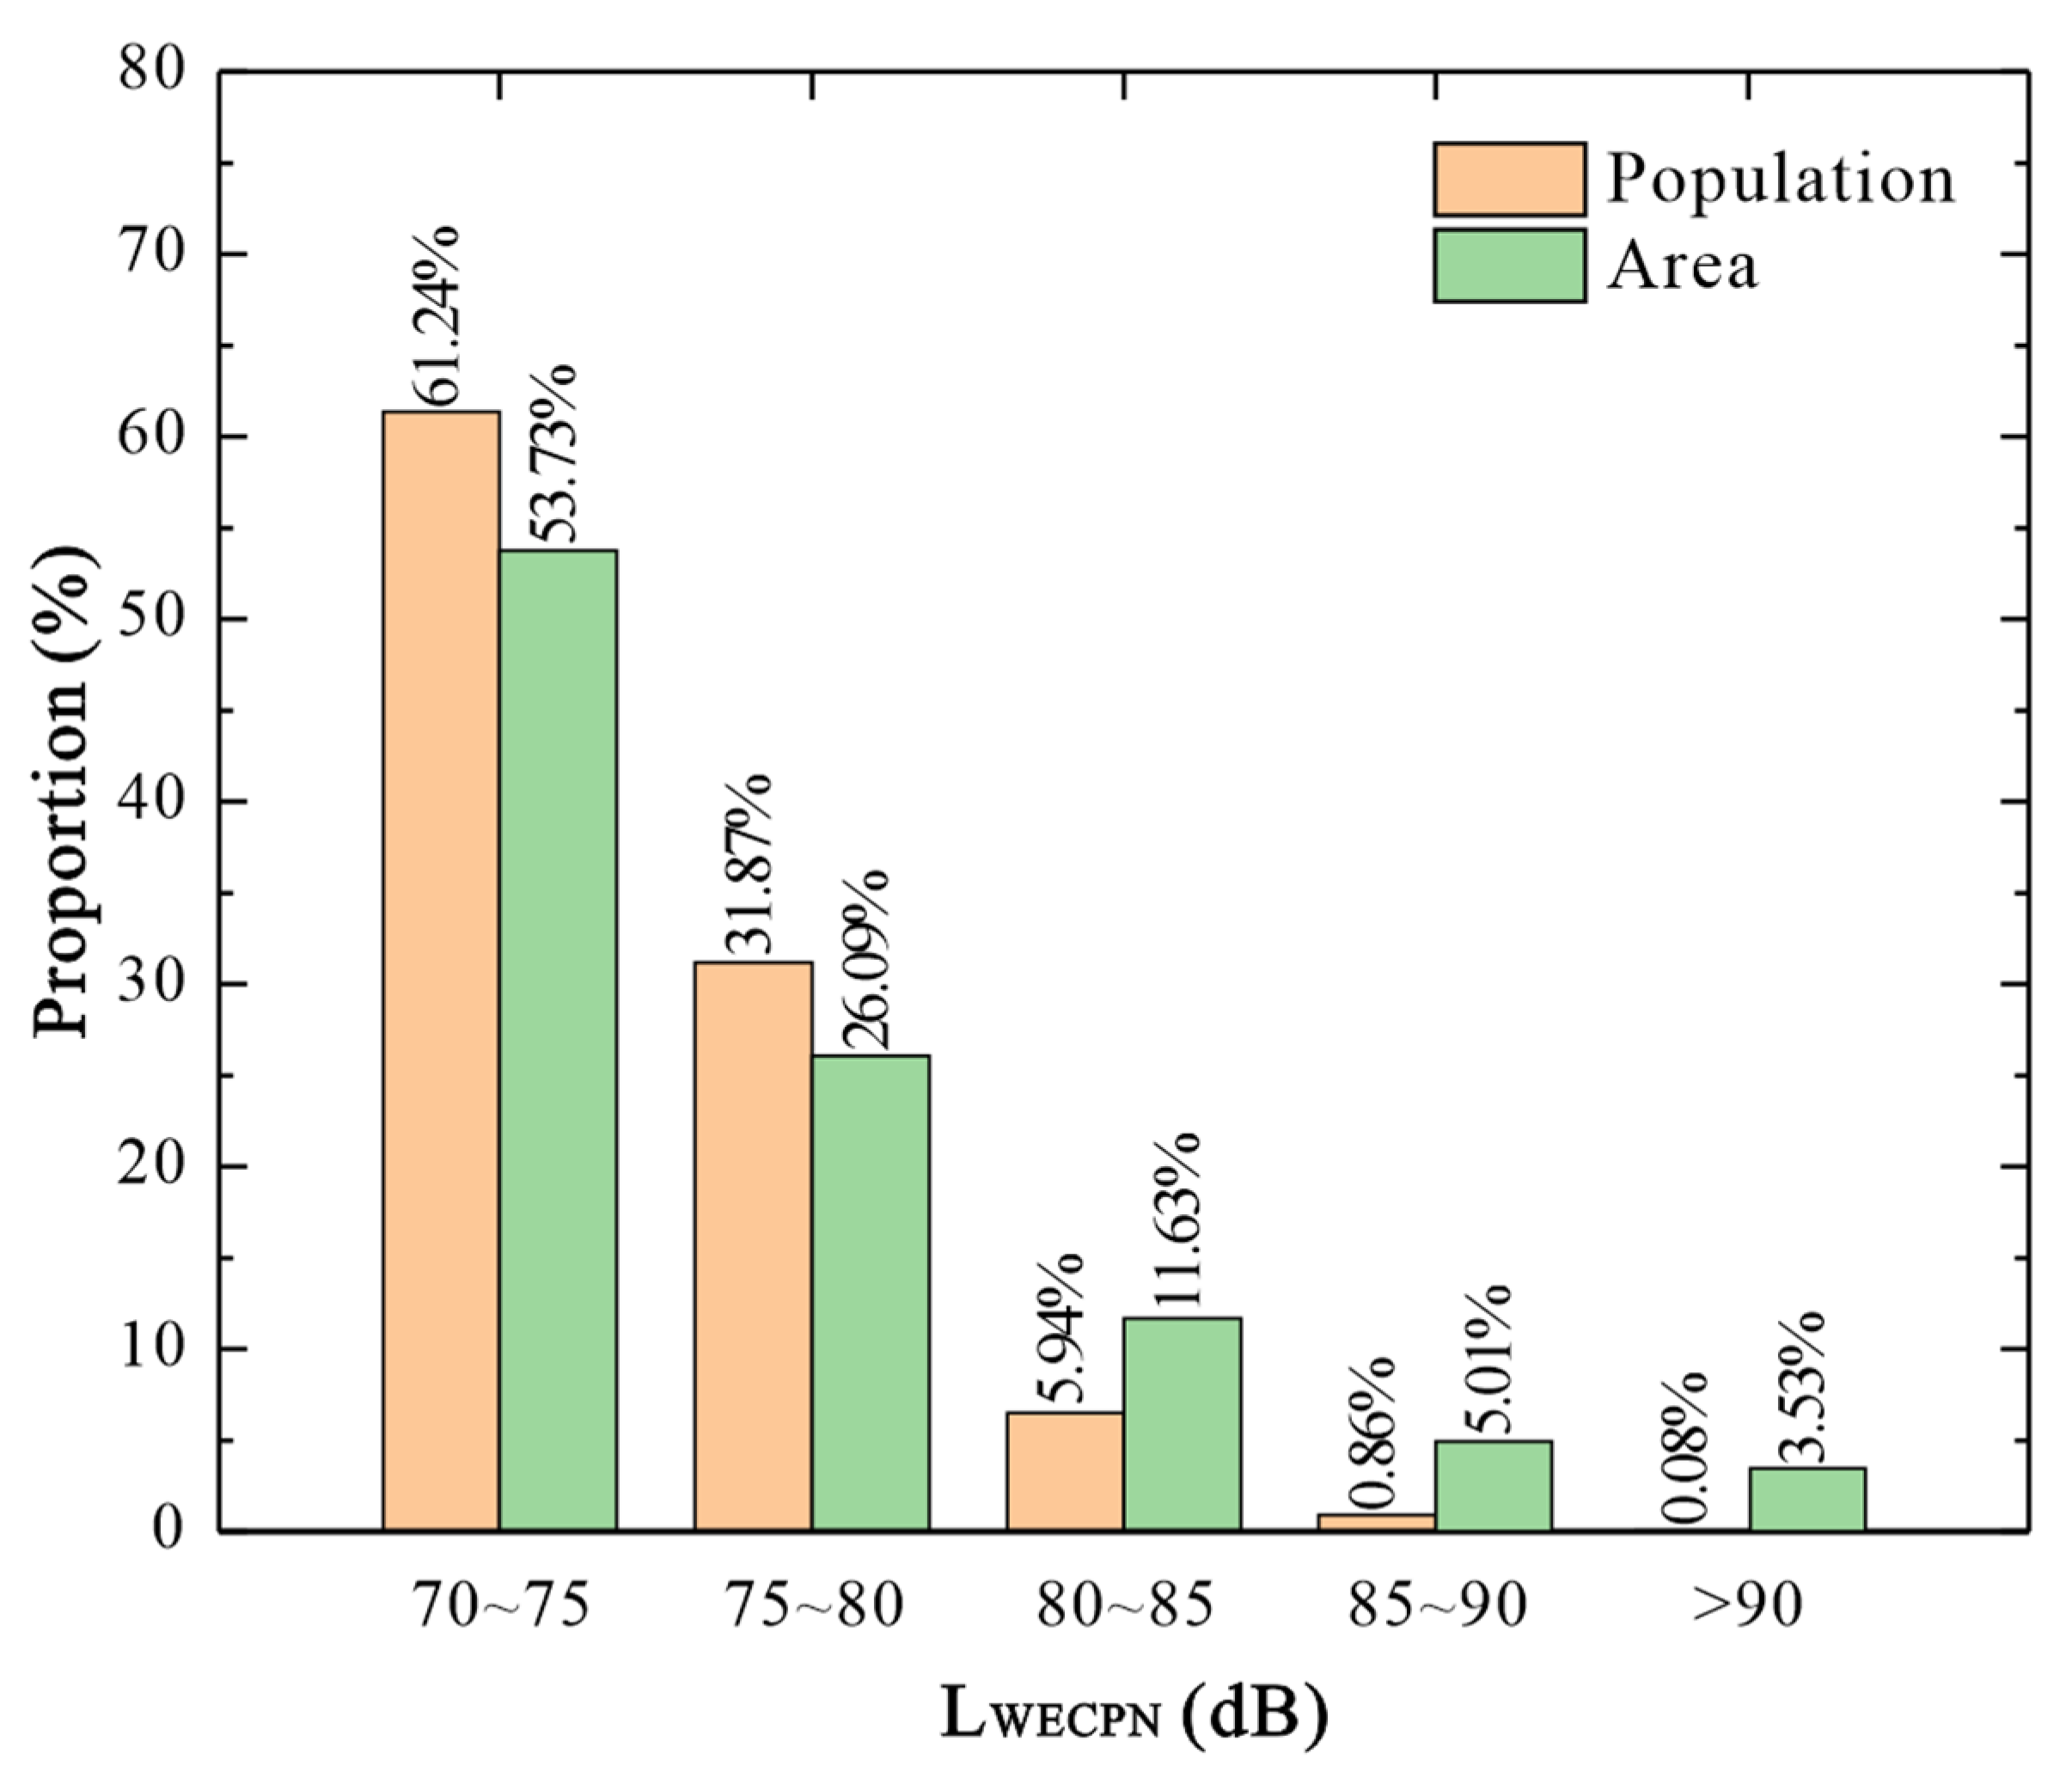
Figure 20.
Proportion of the population and area under different noise levels during summer (only consider the noise-affected area).
Figure 20.
Proportion of the population and area under different noise levels during summer (only consider the noise-affected area).
Figure 21.
Proportion of the population and area under different noise levels during winter (only consider the noise-affected area).
Figure 21.
Proportion of the population and area under different noise levels during winter (only consider the noise-affected area).
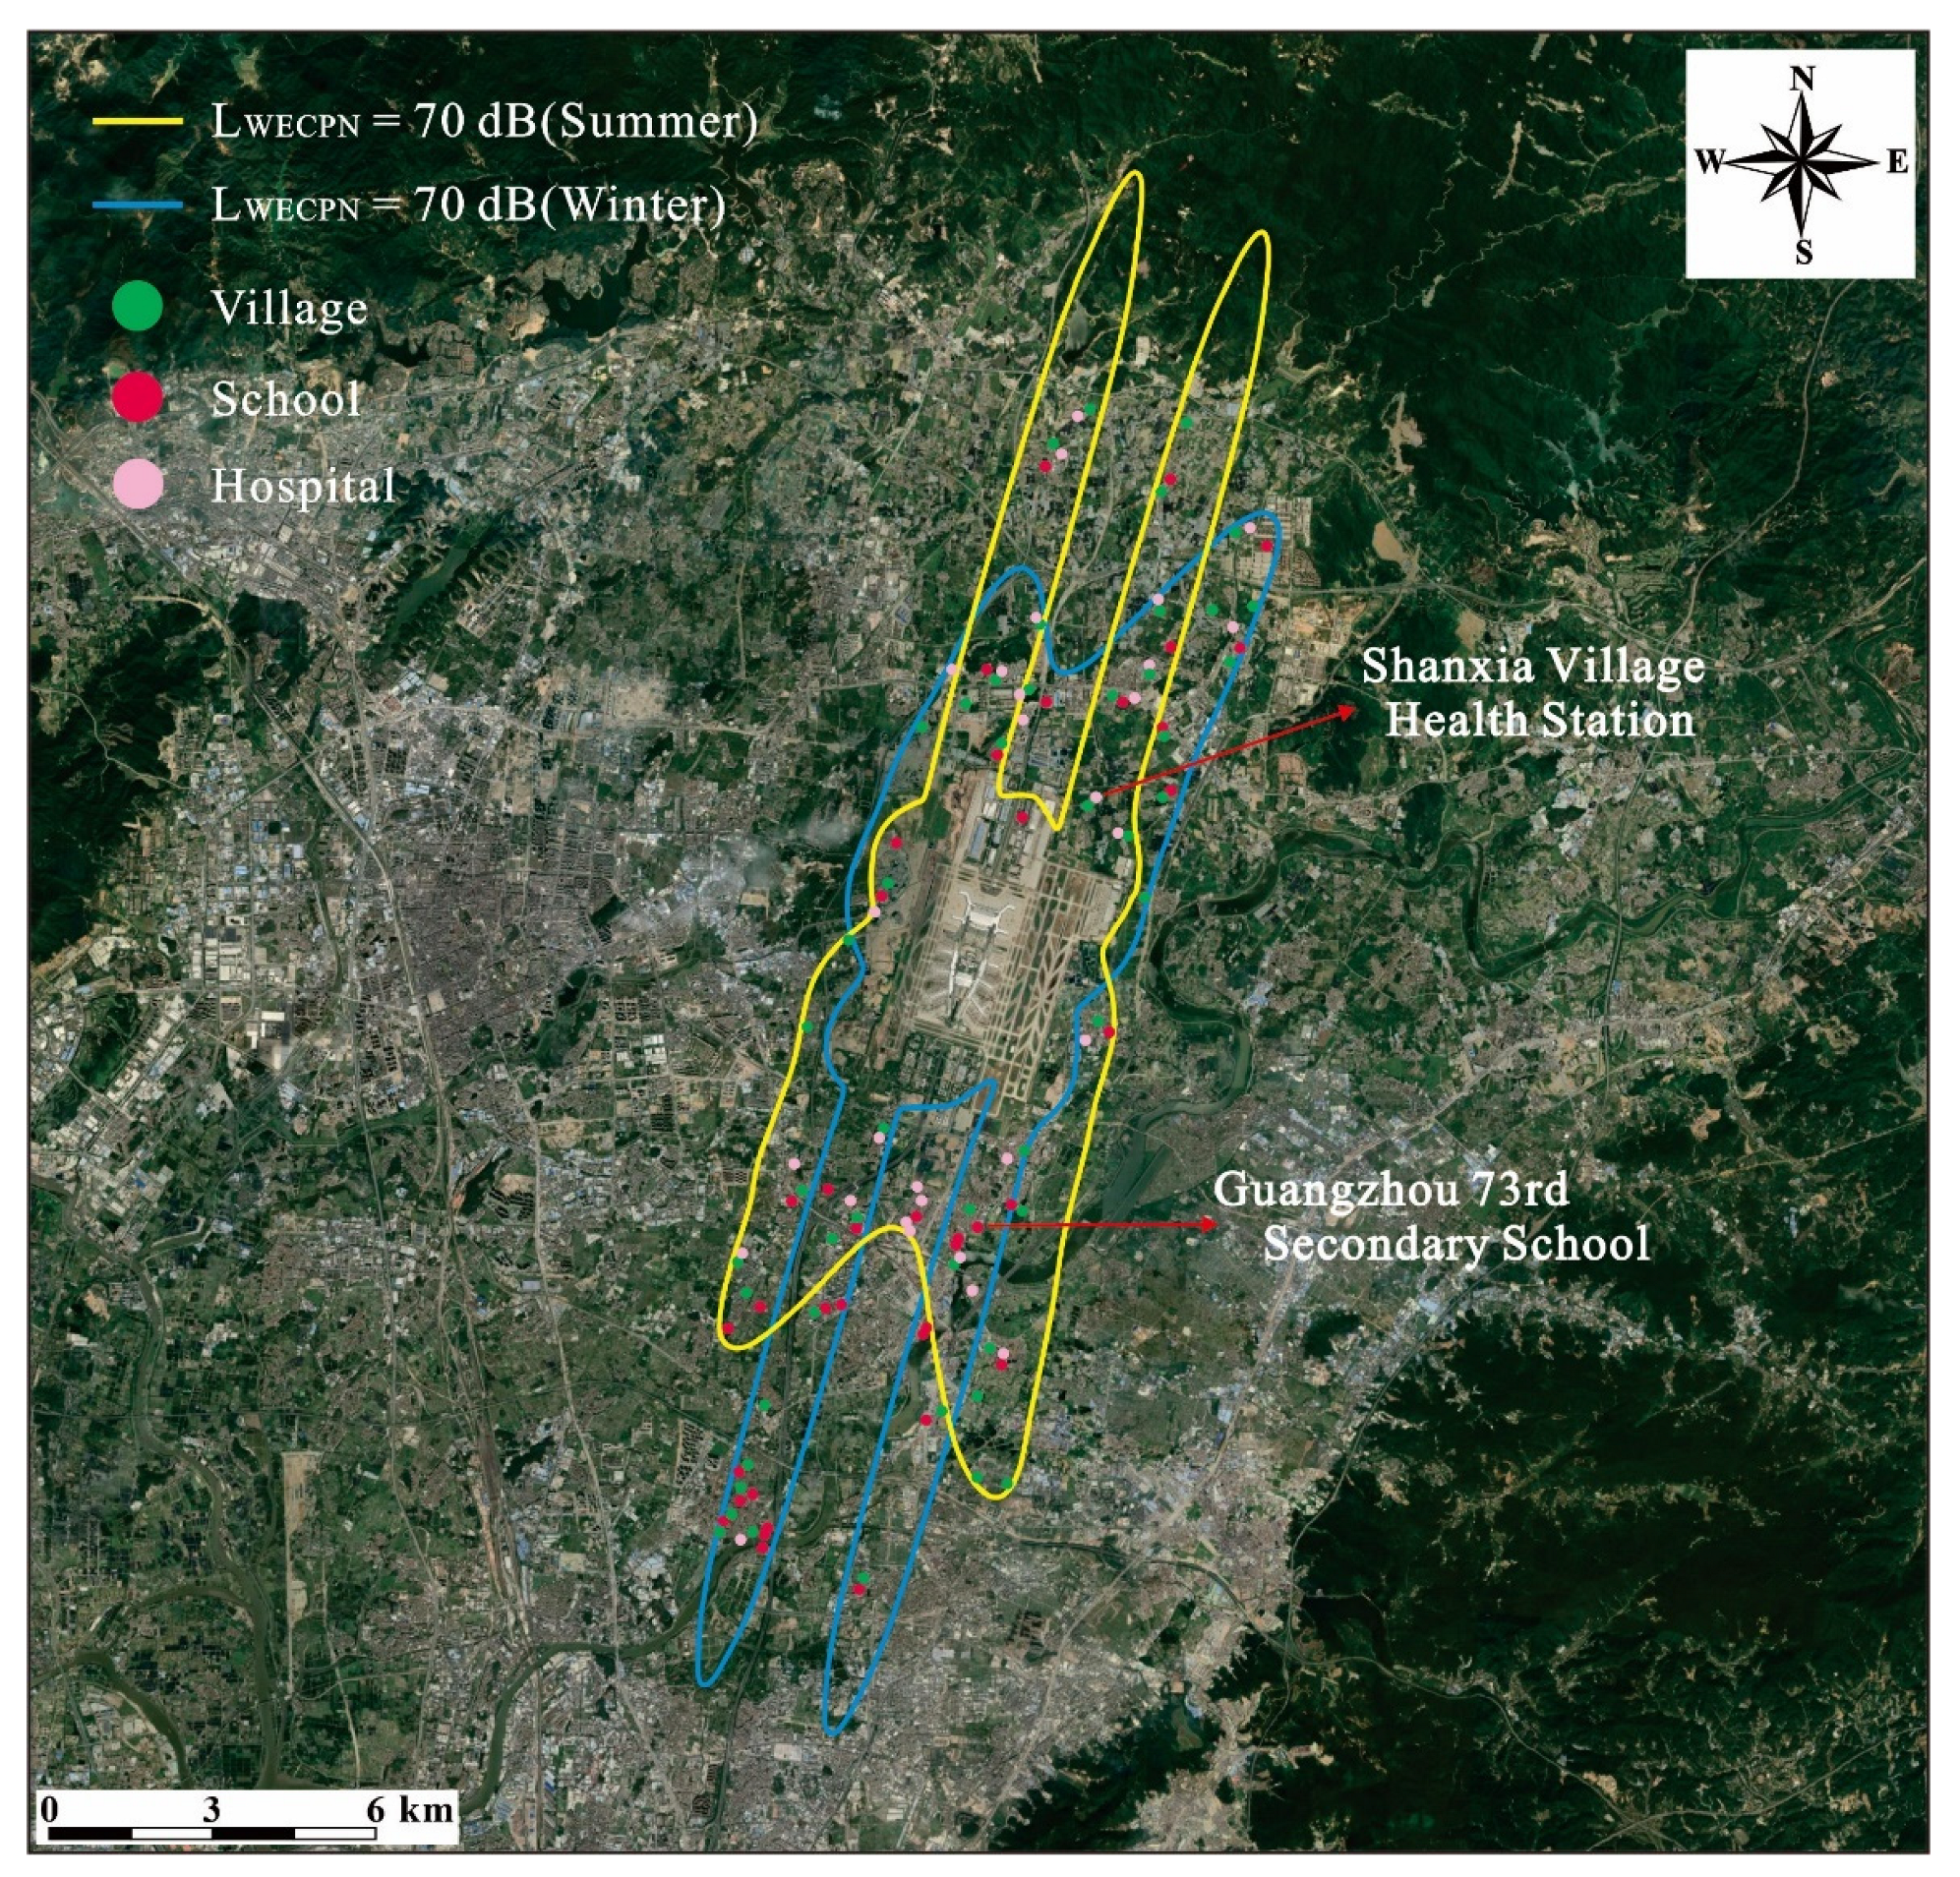
Figure 22.
Distribution of noise sensitive points around BIA.
Figure 22.
Distribution of noise sensitive points around BIA.
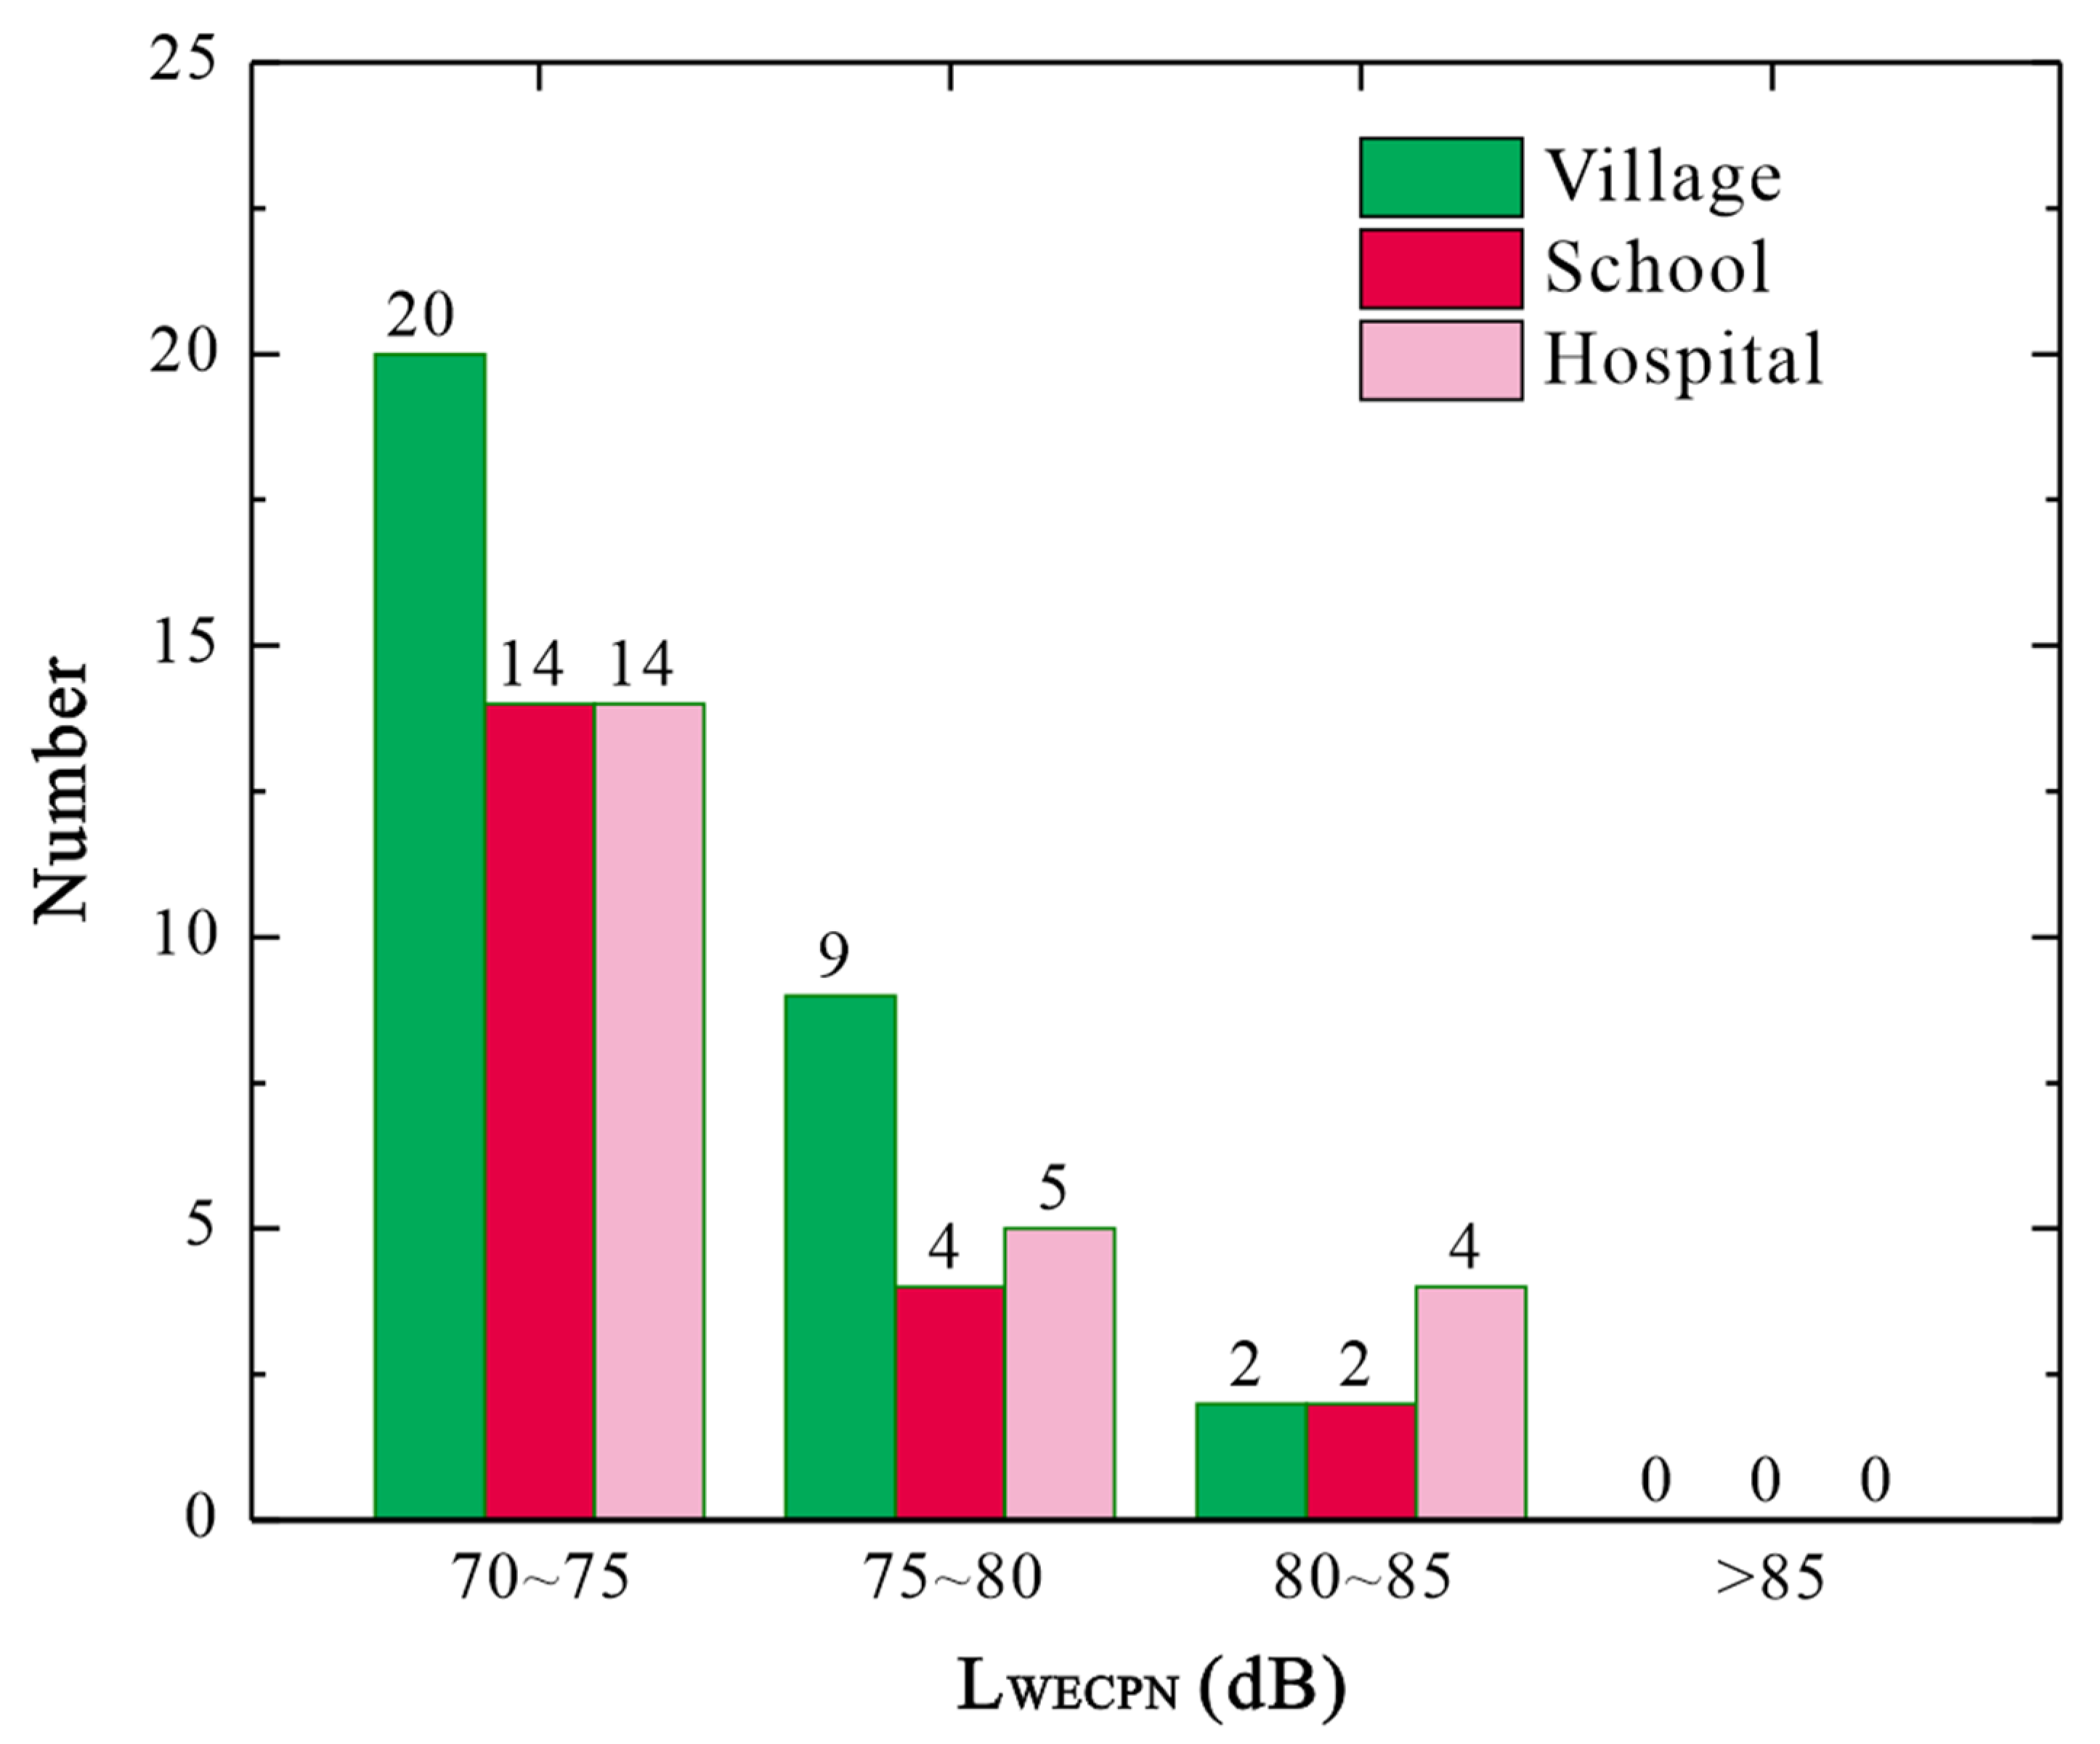
Figure 23.
Number of sensitive points under different noise levels during summer.
Figure 23.
Number of sensitive points under different noise levels during summer.
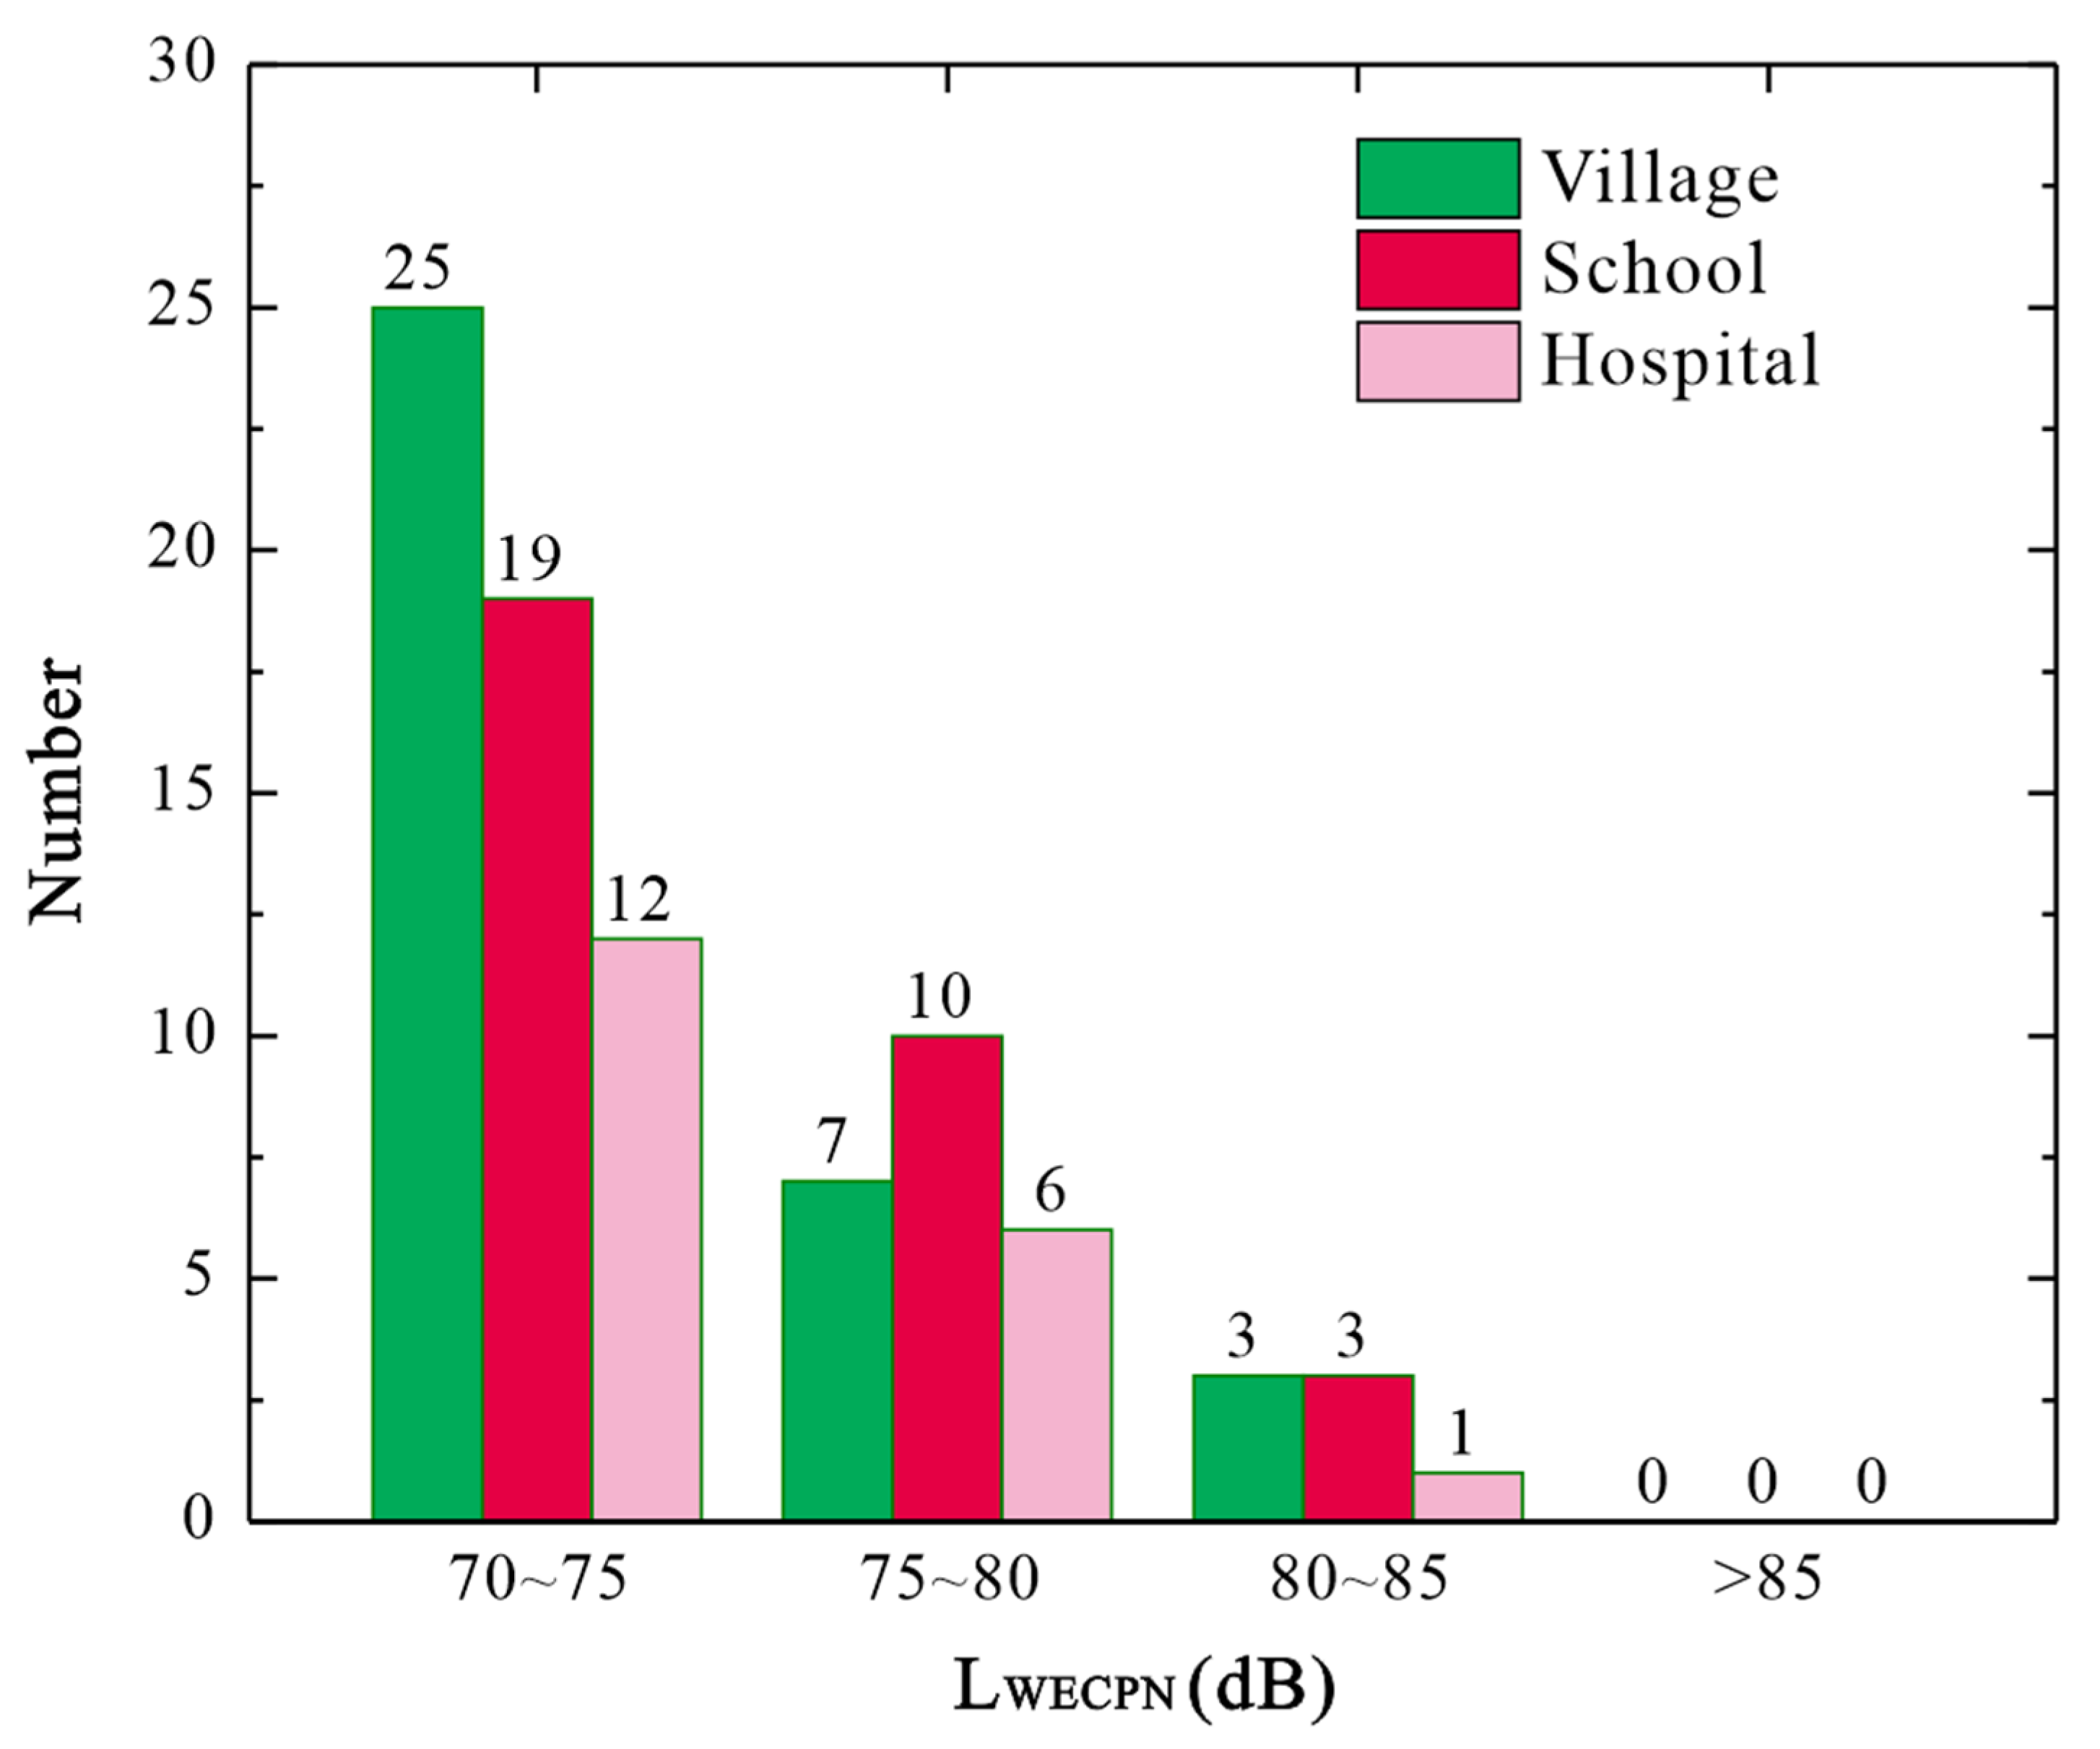
Figure 24.
Number of sensitive points under different noise levels during winter.
Figure 24.
Number of sensitive points under different noise levels during winter.
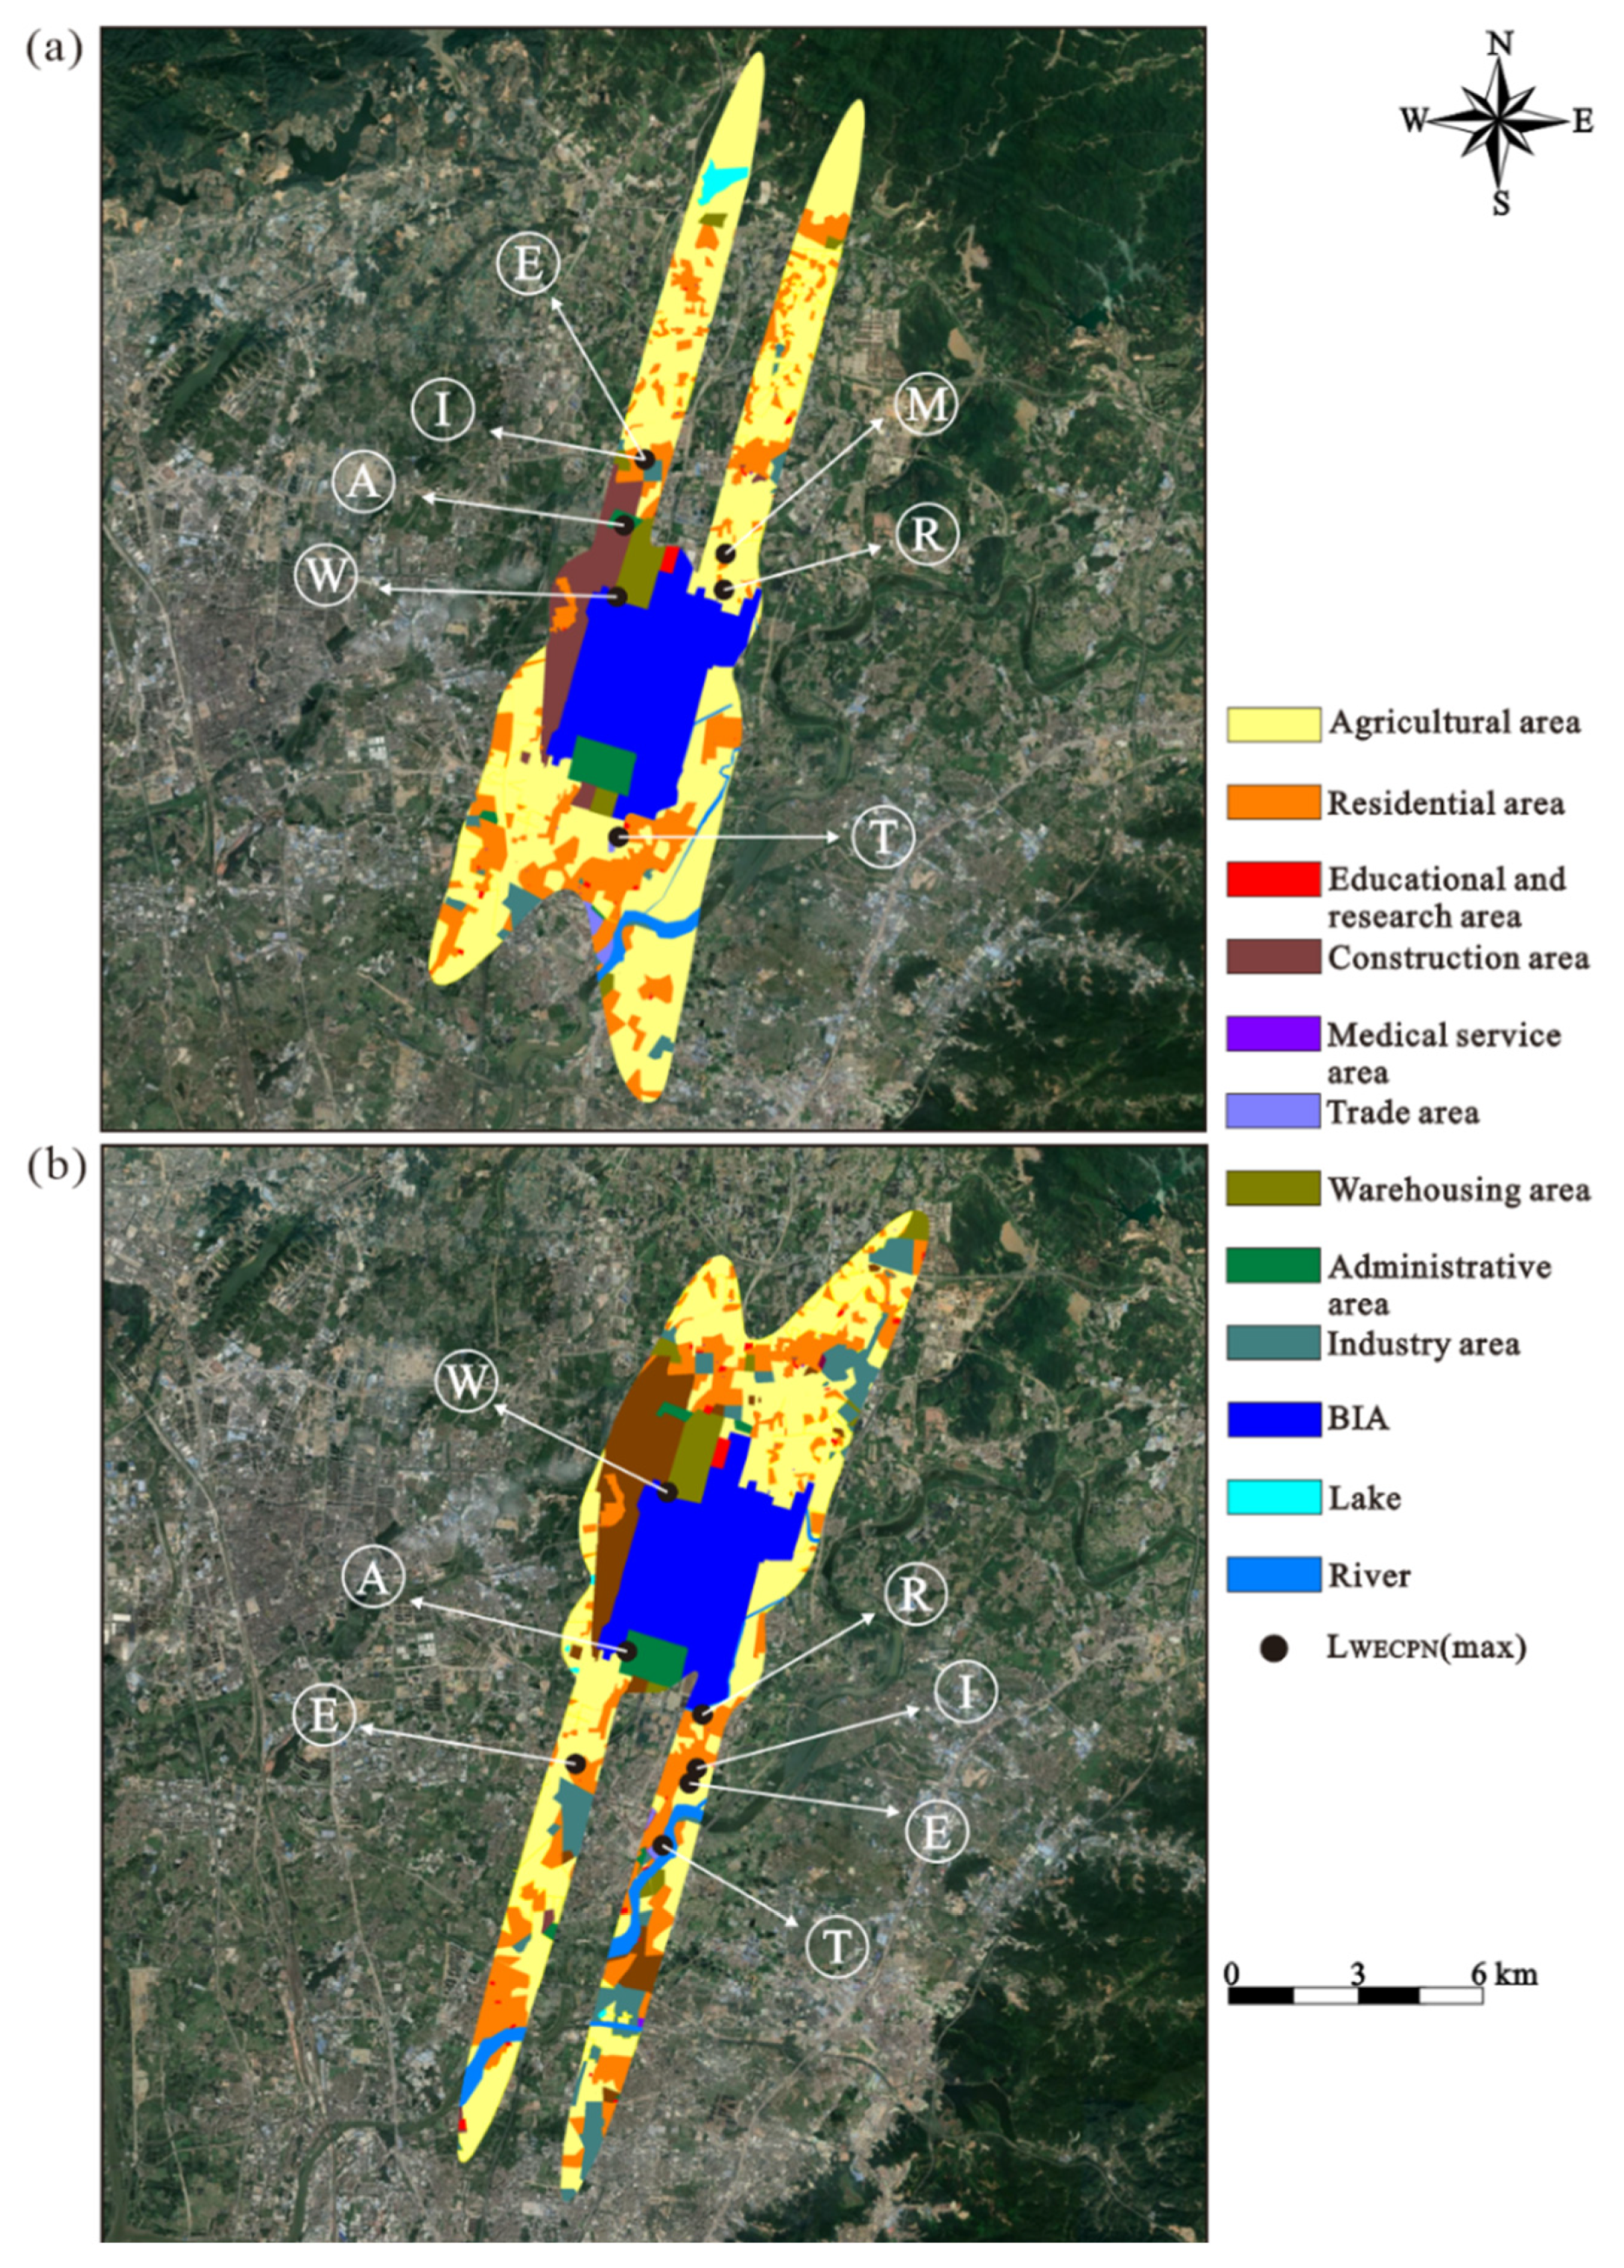
Figure 25.
Land functional area map within the noise-affected areas during (a) summer and (b) winter. For example, “E” represents the location of the of educational and research area.
Figure 25.
Land functional area map within the noise-affected areas during (a) summer and (b) winter. For example, “E” represents the location of the of educational and research area.
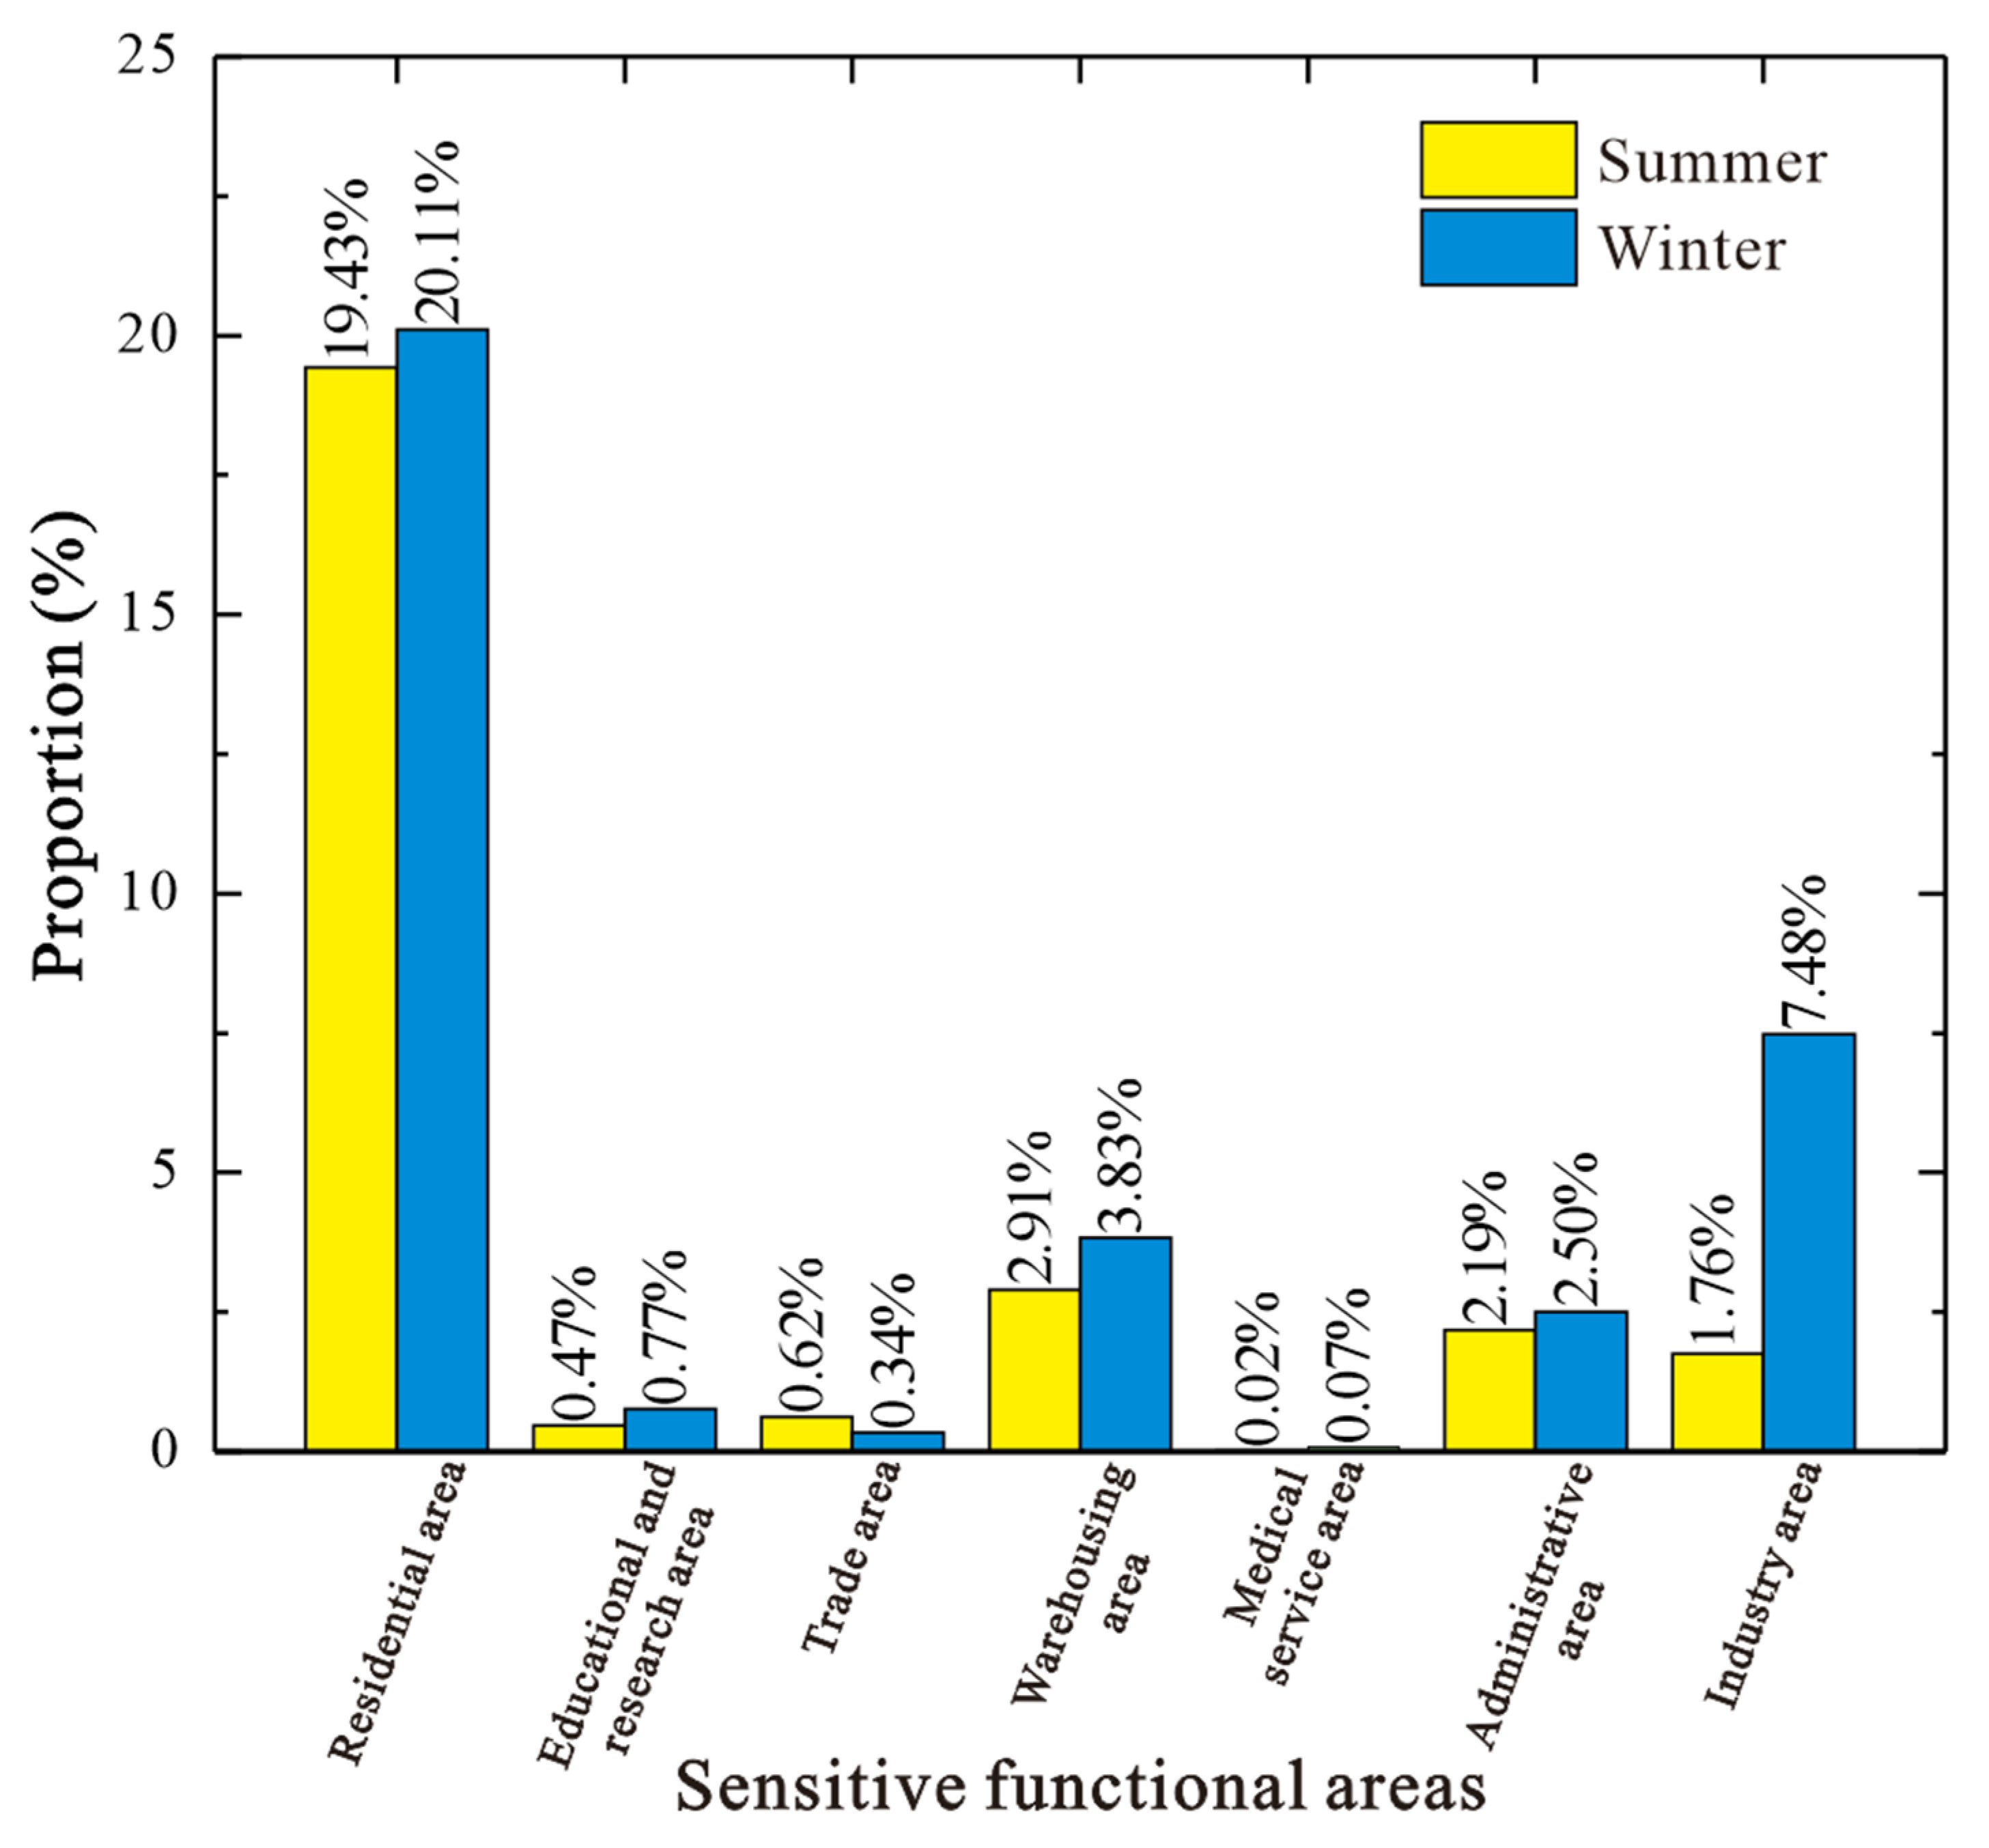
Figure 26.
Area proportion of all sensitive functional areas during summer and winter (only consider the noise-affected area).
Figure 26.
Area proportion of all sensitive functional areas during summer and winter (only consider the noise-affected area).
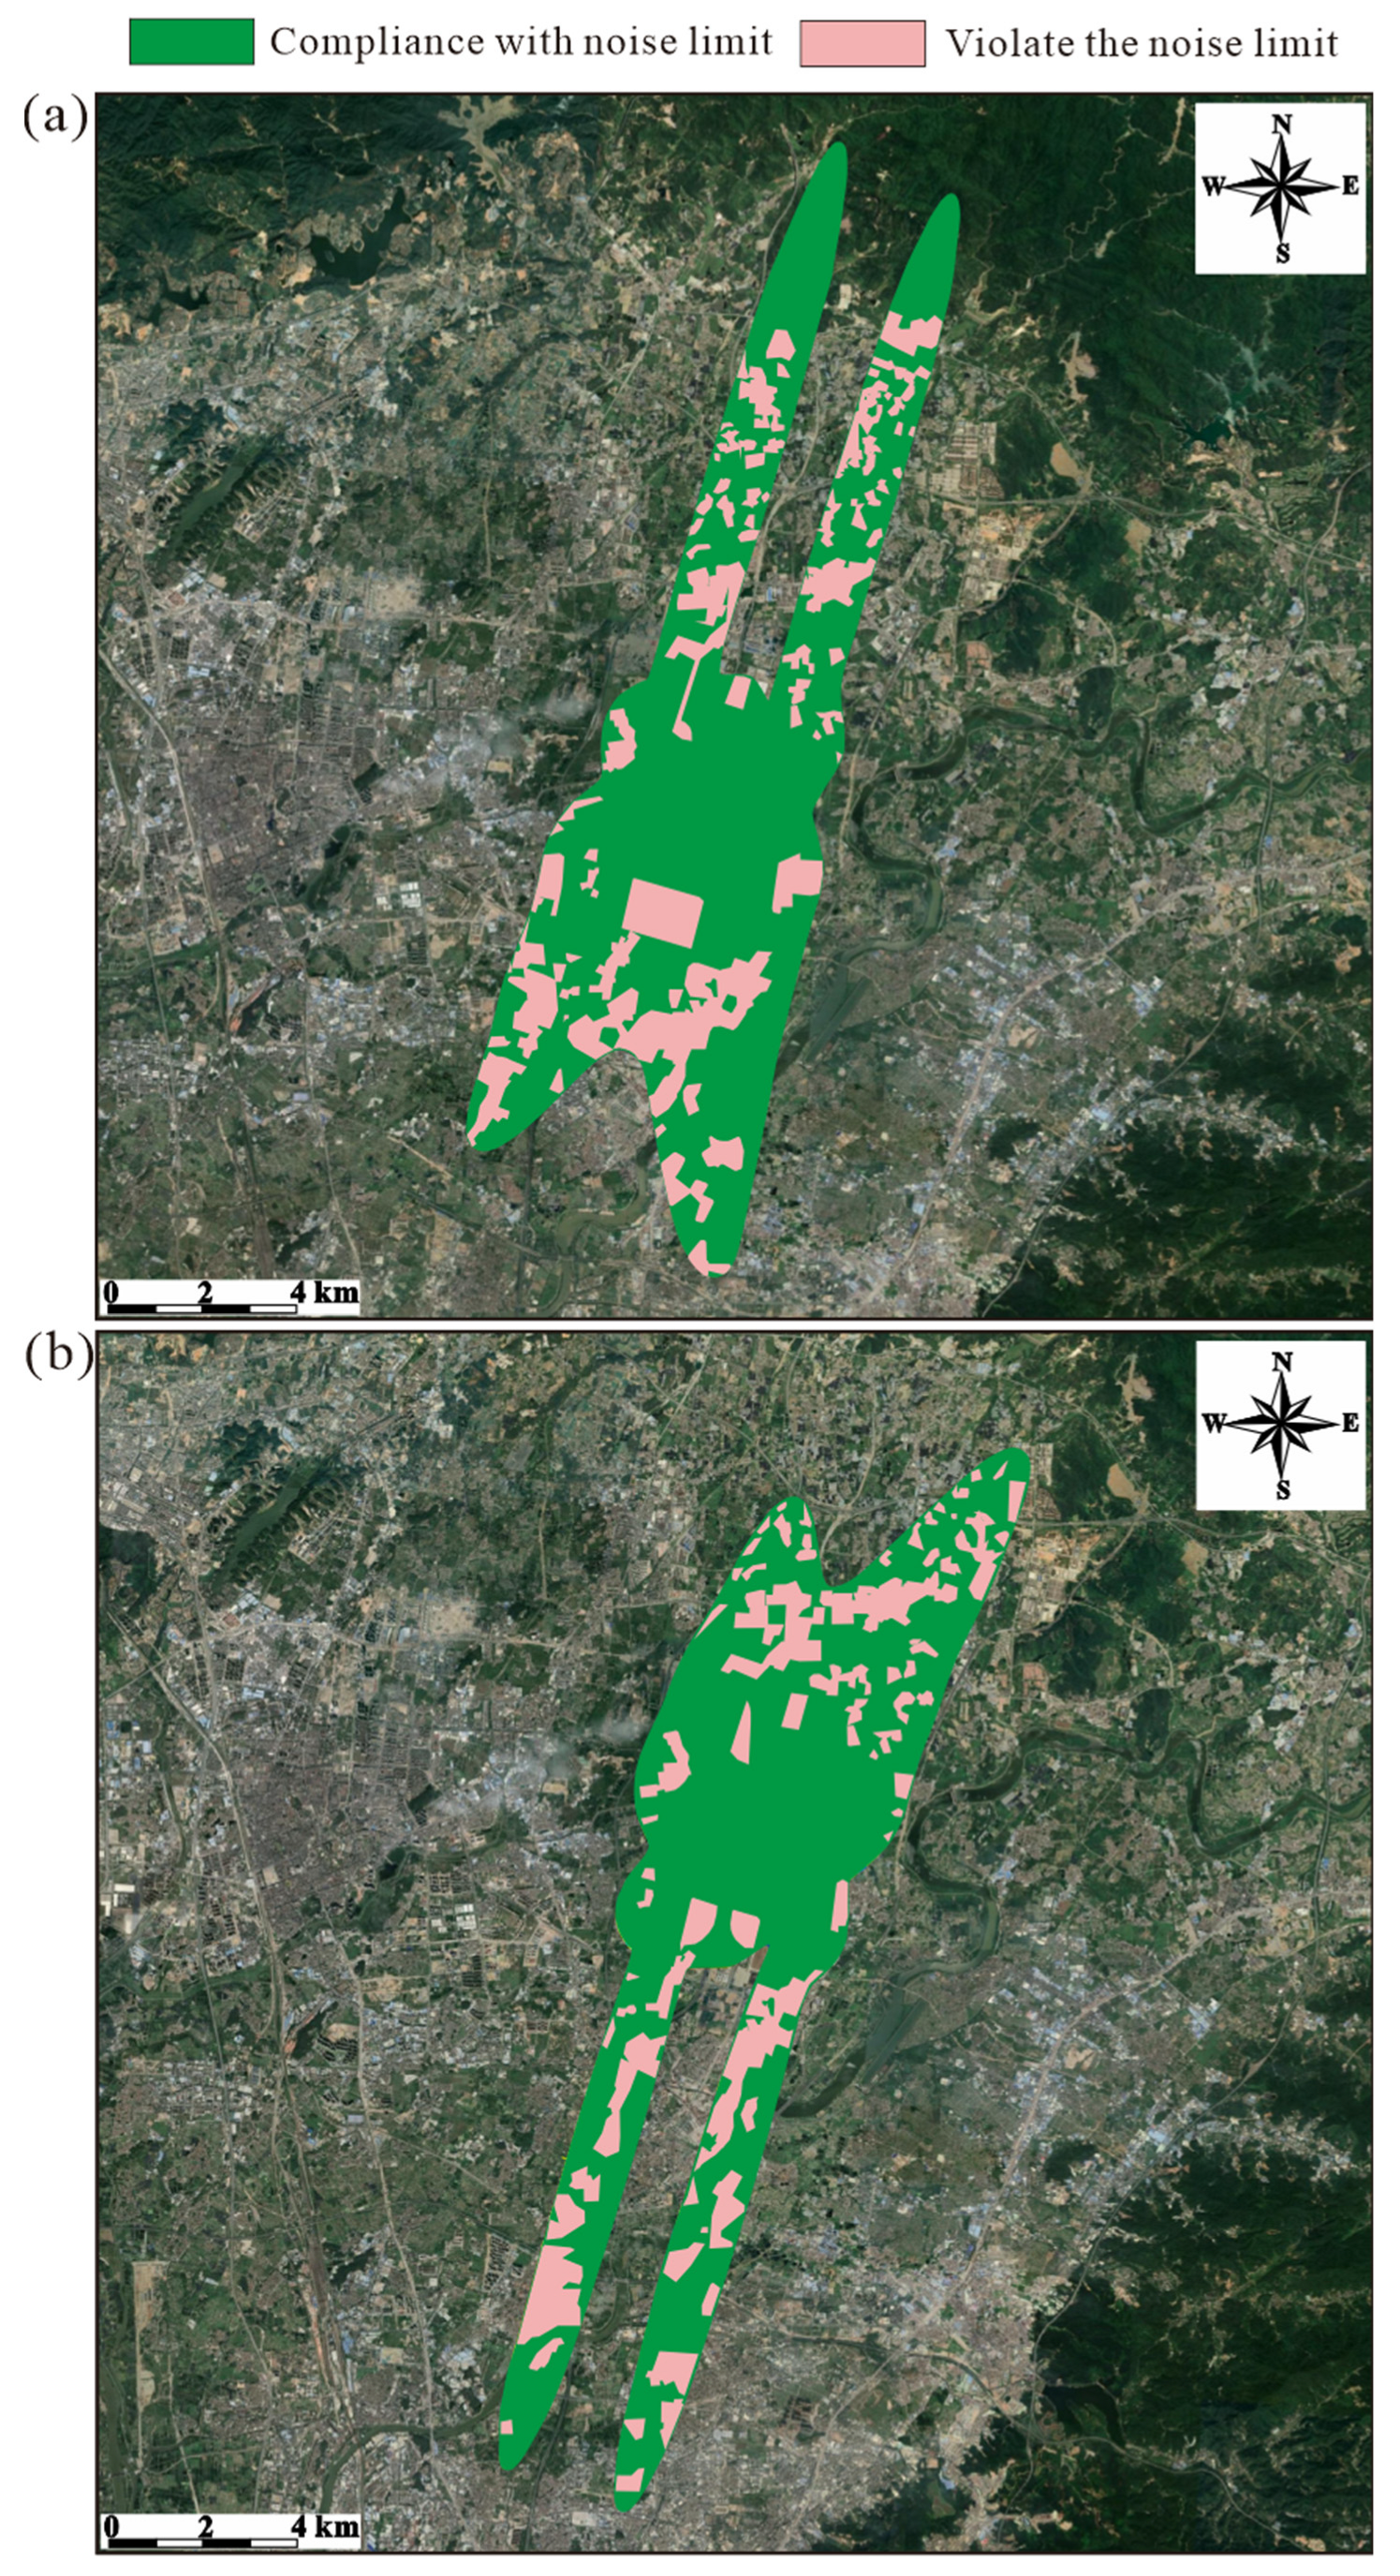
Figure 27.
Aircraft noise level compliance map of BIA during (a) summer and (b) winter.
Figure 27.
Aircraft noise level compliance map of BIA during (a) summer and (b) winter.
Table 1.
Flight procedures of BIA during summer.
Table 1.
Flight procedures of BIA during summer.
| Type | Track | Flight Procedures |
|---|
| Takeoff | T-19-A | After taking off from runway 19, turn right at 15° (turning radius = 2.5 km), then fly straightly for 11.0 km, then turn right at 87° (turning radius = 4.5 km) and finally fly straightly. |
| T-19-B | After taking off from runway 19, turn right at 106° (turning radius = 1.8 km), then fly straightly for 8.0 km, then turn right at 73° (turning radius = 3.0 km) and finally fly straightly. |
| T-19-C | After taking off from runway 19, turn right at 15° (turning radius = 2.5 km), then fly straightly for 11.0 km, then turn right at 30° (turning radius = 4.5 km) and finally fly straightly. |
| T-20R-A | After taking off from runway 20R, turn left at 15° (turning radius = 2.5 km), then fly straightly for 6.3 km, then turn right at 75° (turning radius = 3.7 km) and finally fly straightly. |
| T-20R-B | After taking off from runway 20R, turn left at 15° (turning radius = 2.0 km), then fly straightly for 11.2 km, then turn right at 26° (turning radius = 2.5 km) and finally fly straightly. |
| T-20R-C | After taking off from runway 20R, turn right at 15° (turning radius = 2.0 km), then fly straightly for 9.2 km, then turn right at 148° (turning radius = 4.2 km) and finally fly straightly. |
| Landing | L-19-A | After a 40.4 km straight-in approach, land from the end of runway 19. |
| L-19-B | After a 66 km straight-in approach, turn left at 180° (turning radius = 6.5 km), then align with runway 19 and finally land from the end of runway 19 after a 40.4 km straight-in approach. |
| L-20L-A | After a 40.4 km straight-in approach, land from the end of runway 20L. |
| L-20L-B | After a 66 km straight-in approach, turn left at 180° (turning radius = 5.0 km), then align with runway 20L and land from the end of runway 20L after a 40.4 km straight-in approach. |
Table 2.
Runway information of BIA (all runways are fabricated of concrete).
Table 2.
Runway information of BIA (all runways are fabricated of concrete).
| Runway | Direction (°) | Length (km) × Width (km) |
|---|
| 01 | 16 | 3.6 × 0.045 |
| 19 | 196 | 3.6 × 0.045 |
| 02L | 16 | 3.8 × 0.06 |
| 20R | 196 | 3.8 × 0.06 |
| 02R | 16 | 3.8 × 0.06 |
| 20L | 196 | 3.8 × 0.06 |
Table 3.
Flight data of aircraft 737-800 in BIA (not all aircraft flight data are shown for brevity).
Table 3.
Flight data of aircraft 737-800 in BIA (not all aircraft flight data are shown for brevity).
| Runway | Track | Time | Number |
|---|
| 19 | L-19-A | Day, Evening, Night | 61, 15, 25 |
| 20L | L-20L-A | Day, Evening, Night | 46, 12, 28 |
Table 4.
Information of the measurement points for small area field experiment ( is the distance between the measurement point and the end of the runway. is the altitude difference between the measurement point and runway).
Table 4.
Information of the measurement points for small area field experiment ( is the distance between the measurement point and the end of the runway. is the altitude difference between the measurement point and runway).
| Point | Coordinate | | |
|---|
| S1 | 23°20′57.58″ N 113°18′19.16″ E | 2.8 | −4 |
| S2 | 23°19′55.40″ N 113°18′18.81″ E | 4.8 | −4 |
| S3 | 23°19′6.97″ N 113°18′27.09″ E | 6.3 | −6 |
| S4 | 23°24′40.26″ N 113°19′8.39″ E | 1.0 | 0 |
| S5 | 23°25′32.08″ N 113°19′20.62″ E | 2.6 | 3 |
Table 5.
The error between and . Error = | − |.
Table 5.
The error between and . Error = | − |.
| Date | Point | | | Error (dB) |
|---|
| 15 March | S1 | 78.3 | 76.0 | 2.3 |
| S2 | 75.3 | 72.8 | 2.5 |
| S3 | 74.5 | 70.9 | 3.6 |
| 30 March | S4 | 89.6 | 91.4 | 1.8 |
| S5 | 83.5 | 84.5 | 1.0 |
Table 6.
Takeoff and landing flight numbers of BIA during summer of 2021 [
44].
Table 6.
Takeoff and landing flight numbers of BIA during summer of 2021 [
44].
| Month | Monthly Number | Average Daily Number |
|---|
| March | 39,777 | 1283 |
| April | 39,175 | 1306 |
| May | 36,457 | 1176 |
| June | 12,456 | 415 |
| July | 31,653 | 1021 |
| August | 24,474 | 789 |
Table 7.
Information of the measurement points for large area validation field experiment.
Table 7.
Information of the measurement points for large area validation field experiment.
| Date | Point | Coordinate | | |
|---|
| 9–11 May | L1 | 23°22′18.44″ N 113°16′55.74″ E | 0.6 | 0 |
| L2 | 23°22′03.04″ N 113°16′53.63″ E | 1.0 | −1 |
| 21–23 May | L3 | 23°20′57.58″ N 113°18′19.16″ E | 2.8 | −4 |
| L4 | 23°19′55.40″ N 113°18′18.81″ E | 4.8 | −4 |
| 4–6 September | L5 | 23°24′50.11″ N 113°19′11.69″ E | 1.3 | 0 |
| L6 | 23°25′32.08″ N 113°19′20.62″ E | 2.6 | +3 |
Table 8.
Comparison between and of BIA during summer. Error = | − |.
Table 8.
Comparison between and of BIA during summer. Error = | − |.
| Point | | | Error (dB) |
|---|
| L1 | 84.8 | 83.6 | 1.2 |
| L2 | 82.7 | 82.1 | 0.6 |
| L3 | 78.5 | 77.0 | 1.5 |
| L4 | 76.4 | 73.8 | 2.6 |
| L5 | 87.4 | 88.7 | 1.3 |
| L6 | 83.0 | 84.8 | 1.8 |
| S1 | 78.3 | 76.4 | 1.9 |
| S2 | 75.3 | 73.5 | 1.8 |
| S3 | 74.5 | 71.8 | 2.7 |
| S4 | 89.6 | 91.6 | 2.0 |
| S5 | 83.5 | 84.8 | 1.3 |
| S4 (24 h) | 91.4 | 91.5 | 0.1 |
Table 9.
Population and area under different noise levels around BIA.
Table 9.
Population and area under different noise levels around BIA.
| Season | | Population | |
|---|
| Summer | >70 | 194,842 | 83.885 |
| >75 | 75,514 | 38.813 |
| >80 | 13,414 | 16.925 |
| >85 | 1831 | 7.165 |
| >90 | 155 | 2.960 |
| Winter | >70 | 223,261 | 78.386 |
| >75 | 76,473 | 36.249 |
| >80 | 22,260 | 15.790 |
| >85 | 4033 | 6.536 |
| >90 | 436 | 2.594 |
Table 10.
Number of noise sensitive points under different noise levels.
Table 10.
Number of noise sensitive points under different noise levels.
| Season | | Village | School | Hospital |
|---|
| Summer | >70 | 31 | 20 | 23 |
| >75 | 11 | 6 | 9 |
| >80 | 2 | 2 | 4 |
| >85 | 0 | 0 | 0 |
| Winter | >70 | 35 | 32 | 19 |
| >75 | 10 | 13 | 7 |
| >80 | 3 | 3 | 1 |
| >85 | 0 | 0 | 0 |
Table 11.
Classification and proportion of the noise sensitivity level for land functional areas within the noise-affected areas.
Table 11.
Classification and proportion of the noise sensitivity level for land functional areas within the noise-affected areas.
| Functional Area | Noise Limit | Sensitivity | Summer (%) | Winter (%) |
|---|
| Residential area | = 70 dB | Sensitive | 19.92 | 20.95 |
| Education and research area |
| Medical service area |
| Trade area | = 75 dB | Quite sensitive | 2.81 | 2.84 |
| Administrative area |
| Warehousing area | = 80 dB | Less sensitive | 4.67 | 11.31 |
| Industry area |
| Agricultural area | - | Insensitive | 72.60 | 64.90 |
| Construction area |
| BIA |
| River |
| Lake |
Table 12.
Noise exposure level of the sensitive functional areas within the noise-affected areas.
Table 12.
Noise exposure level of the sensitive functional areas within the noise-affected areas.
| | Residential | Education
and
Research | Trade | Warehousing | Medical
Service | Administrative | Industry |
|---|
| Summer | ) | 16.302 | 0.398 | 0.516 | 2.437 | 0.016 | 1.833 | 1.477 |
| Area proportion (%) | 19.43 | 0.47 | 0.62 | 2.91 | 0.02 | 2.19 | 1.76 |
| ) | 16.302 | 0.398 | 0.058 | 0.072 | 0.016 | 1.833 | 0.063 |
| Violation rate (%) | 100 | 100 | 11.24 | 2.95 | 100 | 100 | 4.27 |
| (dB) | 90.4 | 83.0 | 76.7 | 87.2 | 84.4 | 87.5 | 83.0 |
| Winter | ) | 15.762 | 0.602 | 0.266 | 3.001 | 0.055 | 1.962 | 5.867 |
| Area proportion (%) | 20.11 | 0.77 | 0.34 | 3.83 | 0.07 | 2.50 | 7.48 |
| ) | 15.762 | 0.602 | 0.138 | 0.183 | 0.055 | 1.093 | 0.276 |
| Violation rate (%) | 100 | 100 | 51.88 | 6.10 | 100 | 55.71 | 4.70 |
| (dB) | 91.8 | 85.0 | 80.9 | 82.2 | 83.4 | 86.9 | 84.1 |


