Article

Urban Traffic Noise Mapping Using Building Simplification in the Panyu District of Guangzhou City, China

1
School of Mechanical and Electrical Engineering, Guangzhou University, 230 Wai Huan Xi Road, Guangzhou 510006, China
2
Department of Mechanical Engineering, National University of Singapore, 9 Engineering Drive 1, Singapore 117575, Singapore
*
Author to whom correspondence should be addressed.
Sustainability 2022, 14(8), 4465; https://doi.org/10.3390/su14084465
Submission received: 7 March 2022 / Revised: 2 April 2022 / Accepted: 4 April 2022 / Published: 8 April 2022
(This article belongs to the Special Issue Sustainable Living Environments: Holistic Noise Pollution Management)

Abstract

:
This study constructed an urban traffic noise map (including road and railway traffic noises) of the Panyu District in Guangzhou City by combining field measurement and numerical modeling methods. This noise map was then used to identify the area covered by different noise quality levels and the compliance rate of traffic noise in various acoustic environment functional areas throughout the day, night and day–night. The results showed that traffic noise pollution along the traffic arteries was severe. The area with heavy noise pollution was as large as 157.5 km 2 (29.72%) and 146.2 km 2 (27.59%) in the day and night, respectively. The total area of the Panyu District that complied with the noise limit in the day and night was 326.5 km 2 (61.62%) and 87.2 km 2 (16.46%), respectively. The outcomes of the current efforts can provide new technical guidelines for novel construction and analysis methods for large scale urban traffic noise mapping.

1. Introduction

The research into noise mapping in European countries is the most advanced in the world. In 2002, the European Parliament and the Council of the European Union issued a directive on environmental noise assessment and management (2002/49/EC) [1], which resulted in member states reaching a consensus on noise mapping and noise reduction planning, promoting the improvement of the European Union noise policy. In recent years, many significant outcomes from noise mapping have been published, and the methods used can be categorized into three groups. The first method produces a noise map using a full field measurement and geographic information systems (GIS) through global positioning systems (GPS). The second method produces a noise map using numerical software with the input of partial field measurement data. The third method (dynamic noise mapping) produces a noise map using partial field measurement data, simulation, and statistics.

1.1. First Method

Banerjee et al. [2] collected noise data from 35 locations (including industrial, commercial, and residential areas) and used GIS to generate a road traffic noise map of Asansol City (area = 326.48 km 2 ) in West Bengal, India, to study noise pollution. The research showed that the maximum noise level of the city during the day and night reached 89.0 dBA and 81.9 dBA, respectively, levels that exceeded the limit stipulated by the state. Eldien [3] combined the noise data from 400 main roads within the city center with GIS to generate a road traffic noise map of Suez, Egypt (area = 250.4 km 2 ). The results showed that greater building height could reduce indoor noise pollution. Das et al. [4] collected noise data from 227 points at different times and combined them with ERDAS Imagine software to generate an environmental noise map of Bazar (in India, area = 5465.43 km 2 ). During these periods, they also conducted questionnaire surveys of 2312 pedestrians, and the results showed that traffic (58.65%) and construction (21.15%) were the main noise sources. Peak hour (around 10 a.m.) was the noisiest time because traffic and population flows were the greatest. During this period, the noise level in 39.21% of the study area exceeded 70 dBA.

1.2. Second Method

De Noronha Castro Pinto and Moreno Mardones [5] used CadnaA software to simulate the road traffic noise in Copacabana (in Brazil, area = 7.84 km 2 ) with a population density of 20,400/km 2 . The simulation results showed that the noise level in a large area of Copacabana exceeded the maximum noise level stipulated by the state. Trombetta Zannin and de Sant’Ana [6] used predictor BK 7810 software to produce a road traffic noise map near BR-116 federal highway (with a total length of 14 km) in an urban area of Curitiba, southern Brazil. After comparing the noise level from the map with the noise pollution limit (<65 dBA) set by the local government, it was concluded that there was noise pollution in all areas near the federal highway. Suárez and Barros [7] used CadnaA software to produce the road traffic noise map of Santiago, the capital of Chile (area = 1000 km 2 ), the largest noise map of Chile produced to date. The simulation results showed that the area of Santiago with noise levels greater than 65 dBA covered 17.35% of the total city area. Bastián-Monarca et al. [8] mapped the road traffic noise of Valdivia, Chile (area = 1016 km 2 ) based on the mixed methods of road design, prediction modeling using CadnaA software, and the simplification of traffic flow and map information. Lokhande et al. [9] used Predictor LimA software to map the industrial noise near the northern Keonjhar mining area in India (area = 1831 km 2 ). The results showed that the noise level in 60% of the residential area exceeded the limit set by the Central Pollution Control Board of India.

1.3. Third Method

De Coensel et al. [10] proposed a method to dynamically update noise maps based on mobile and fixed measurements. The accuracy of the proposed method was validated with a case study of the 13th district of Paris, France. Wei et al. [11] also proposed a model to dynamically update a noise map based on measurements and which relied on reasonably good source data and a not-very-dense measurement network. Bellucci et al. [12] implemented the DYNAMAP system in the pilot area of Rome. They validated the system through two field measuring campaigns. Their results showed a mean systematic error of 1 dB and an average overall prediction error of ∼1.5 dB. For the field traffic flow measurement acquired in the second and third methods, there are recently some advanced measuring technologies reported [13,14], which are supposed to be conducive in the development of precise noise map using these two methods.
From the existing literature database, it can be concluded that there are still some deficiencies in the research of traffic noise mapping. No studies have constructed a “high precision” large scale urban traffic noise map, where “high precision” means the noise map included all roads, railways, vegetation areas and buildings of different heights in the study area. Most available noise maps either only consider road traffic noise or ignore the sub-arterial and access roads, or assume all buildings have the constant height. Therefore, the present study will:
  • Combine the methods of field measurement and numerical modeling (CadnaA software) to produce a traffic noise map of Panyu District that includes road and railway traffic with all vegetation areas and buildings of different heights.
  • Investigate the traffic noise compliance rate in various acoustic environment functional regions, given that noise limits differ considerably between night and day in some areas.
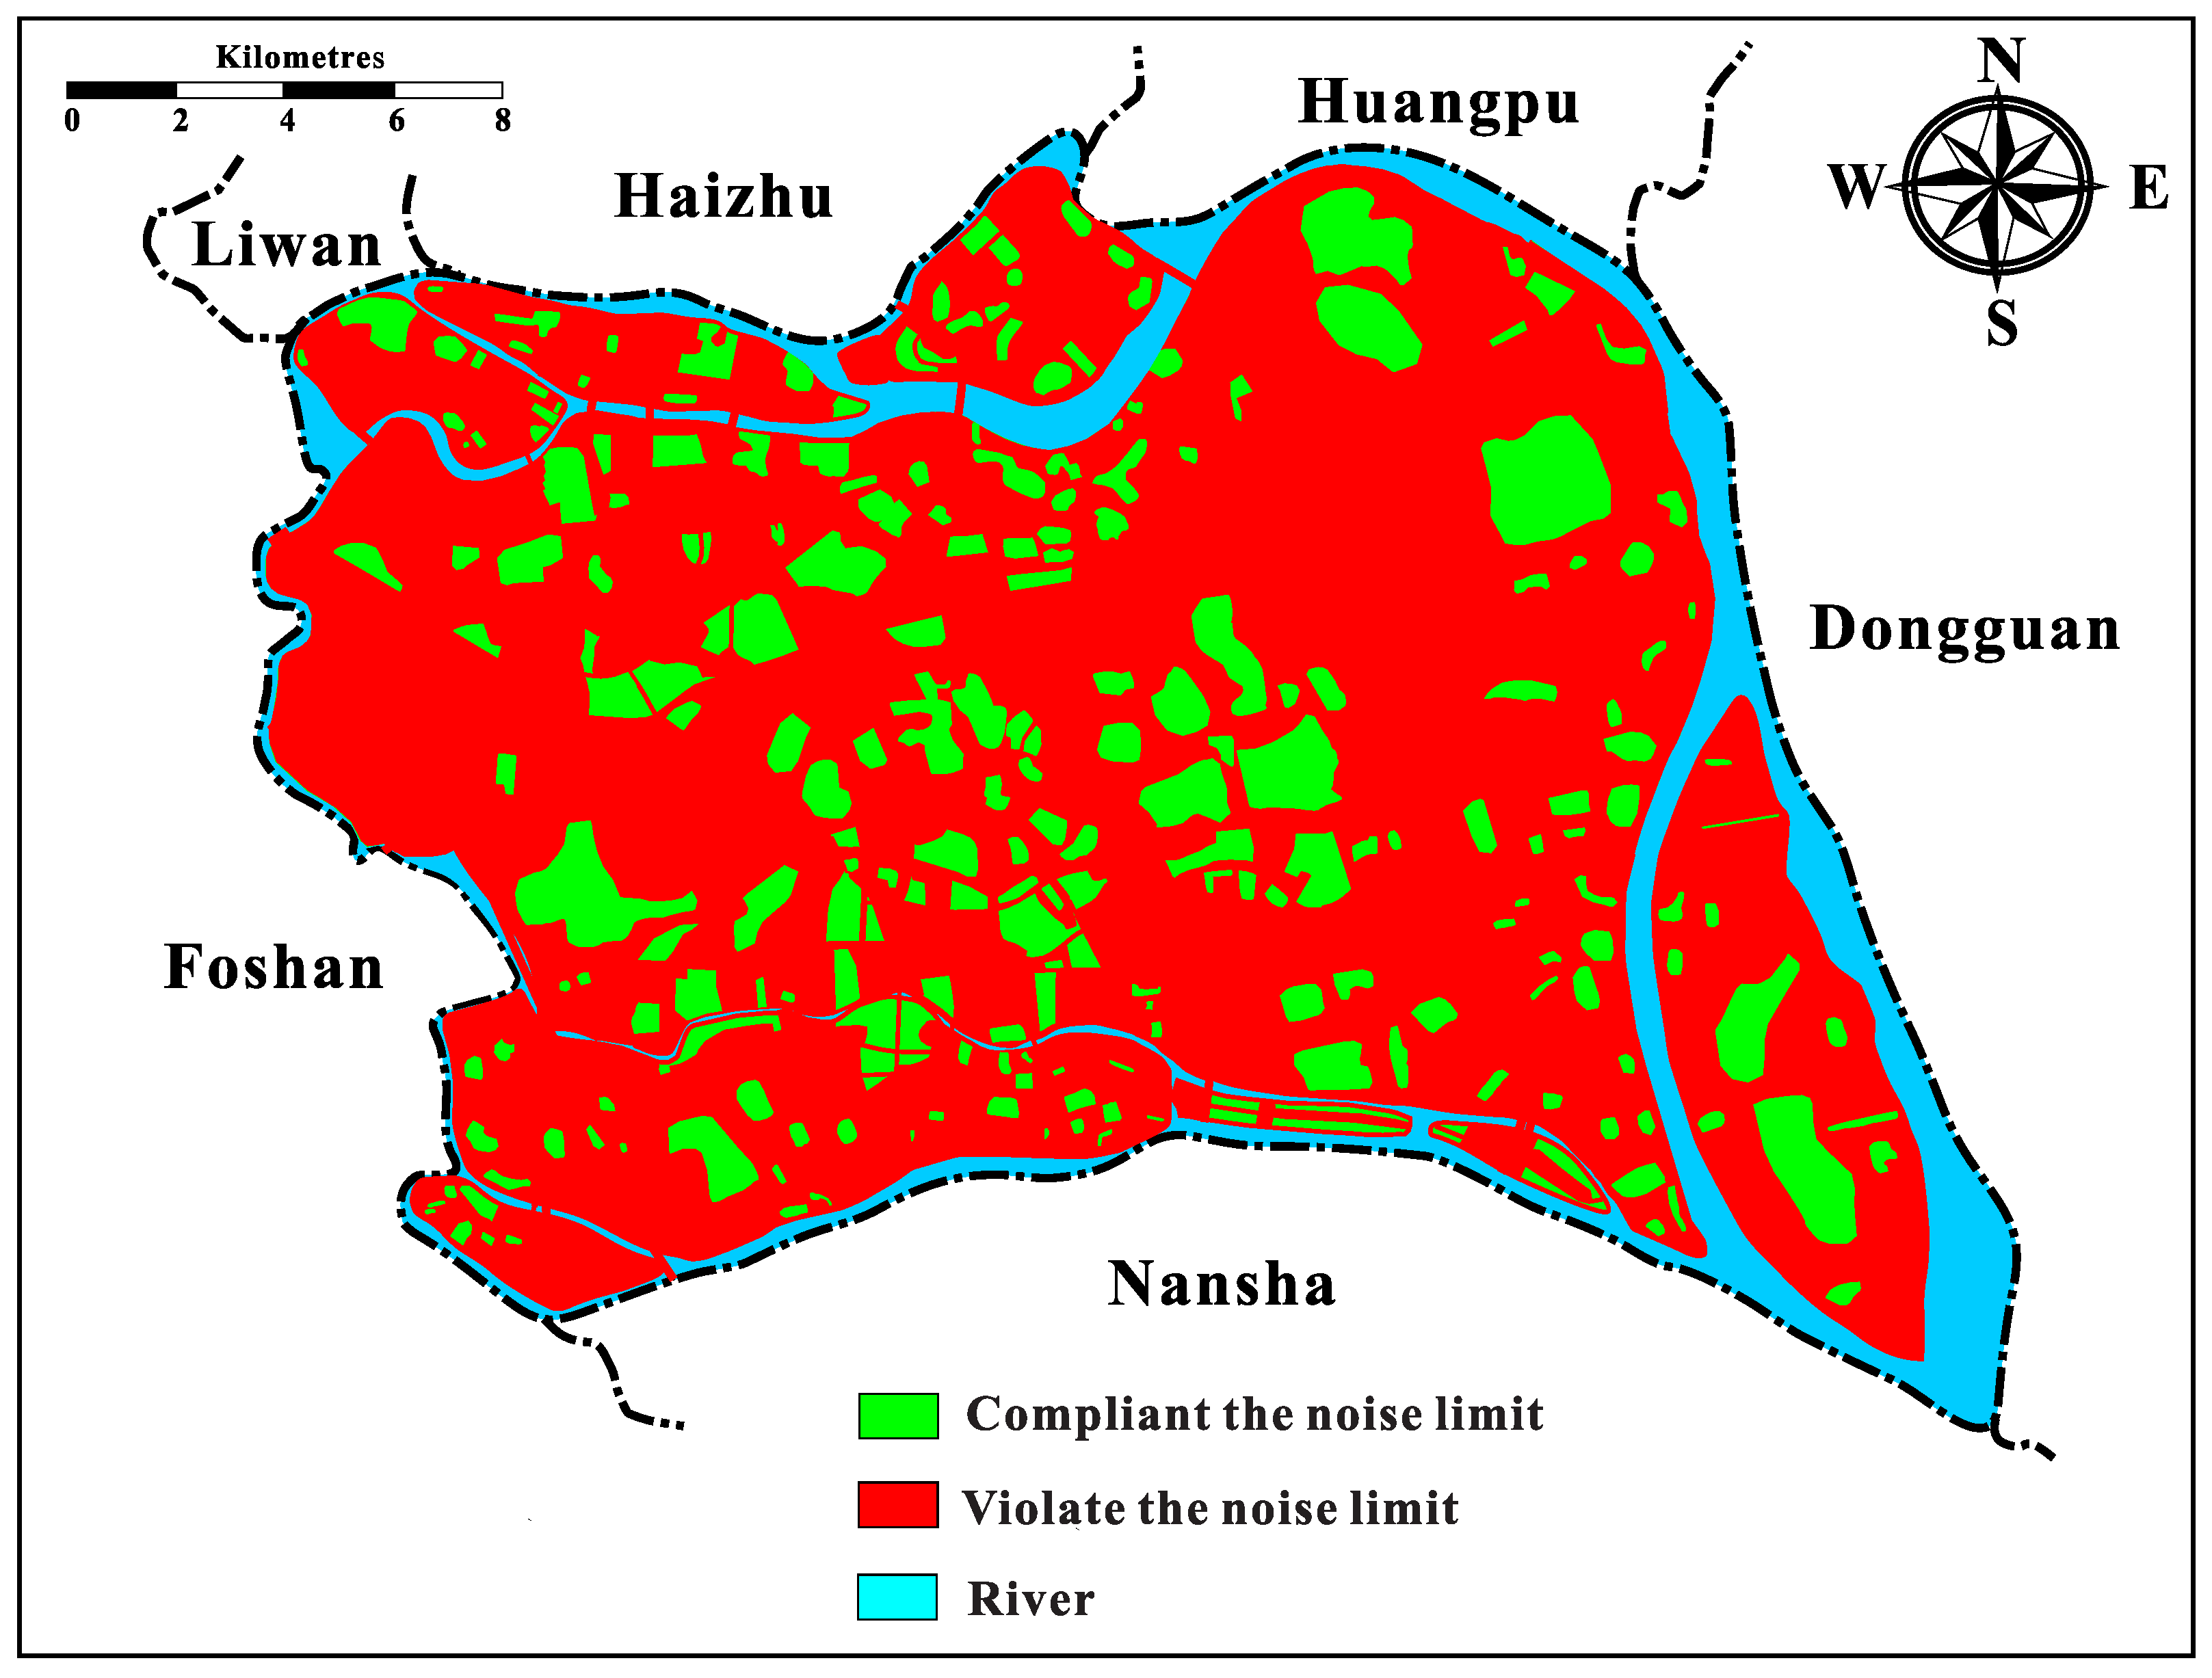
  • Identify the areas with serious traffic noise pollution.
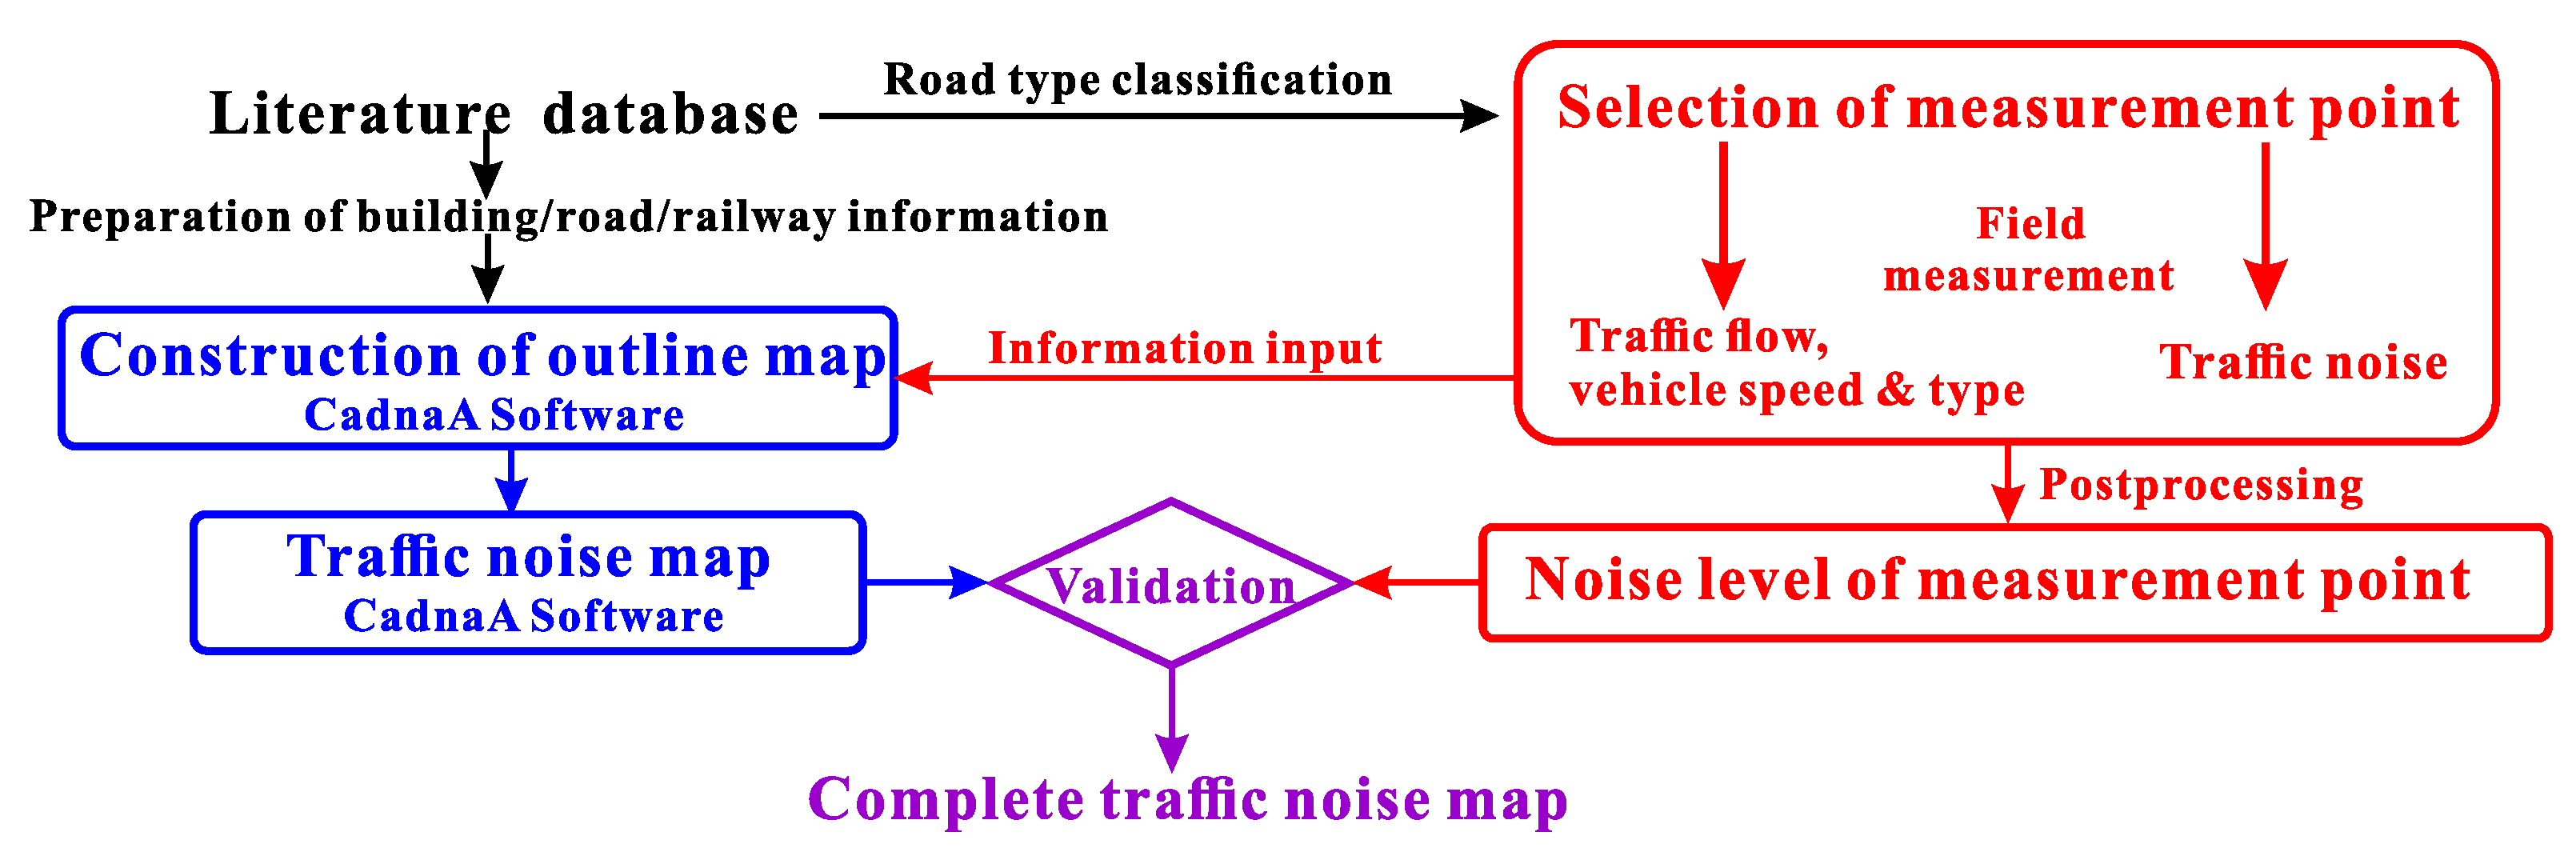
The outcomes from this study will provide new technical guidelines for novel construction (building height stratification) and analysis (noise compliance rate) methods for large scale urban traffic noise mapping. Section 1 of this work includes the literature reviews, objectives and novelty of this study. Section 2 introduces the steps of numerical simulation and field measurement. Section 3 analyzes the noise map of Panyu District which includes noise quality level, compliance rate, traffic flow, etc. Conclusions of this study are given in Section 4.

2. Methods

The technical route of the urban traffic noise map construction process is shown in Figure 1. The steps of the construction process are:
  • Obtain road, building and railway information from literature databases. This information is used to produce an outline map of Panyu District.
  • Classify all roads based on China’s national standard and then select field measurement points on different road types.
  • Conduct field measurement on the selected measurement points in order to measure traffic flow, vehicle speed, vehicle type and traffic noise.
  • Traffic flow, vehicle speed and vehicle type are the inputs for CadnaA software to construct noise map.
  • The map’s noise levels that computed by CadnaA software are compared with the measured traffic noise levels in order to validate the noise map.
  • Various studies can be performed based on the validated noise map.

2.1. Numerical Methods

2.1.1. Modeling Information

In this study, 6:00 to 22:00 and 22:00 to 6:00 were defined as day and night, respectively, as defined by the “Law of the People’s Republic of China On the Prevention and Control of Environmental Noise Pollution” [15]. The modeling standards used for the railway and road traffic noise followed Schall03(2014) [16] and Hj2.4-2009 [17], respectively. For example, the calculation of L d a y (A-weighted equivalent noise level over the 16 h day period, dBA) (see Equation (1) [18]):
L d a y = 10 l g ( 1 16 i = 1 n t 10 0.1 L e q , i ) ,
where t is the duration of the measurement (h) and L e q , i is the ith A-weighted equivalent sound pressure level (dBA). For road traffic noise, Hj2.4-2009 [17] defines L e q as:
L e q = 10 l g ( s = 1 3 10 0.1 L e q , s ) ,
where L e q , s is the L e q of different vehicle types (small car (s = 1), mid-size car (s = 2), large car (s = 3)). For railway noise, Schall03(2014) [16] define L e q as:
L e q = 10 l g [ x 10 0.1 ( 51 + D F Z + D D + D l + D V + D A e ) ] + D F b + D B r + D B u ¨ + D R a ,
where x is the total number of trains, D F Z is the correction for the type of train, D D is the correction for the type of brakes, D l is the correction for train length, D V is the correction for the speed, D A e is the correction for aerodynamics, D F b is the correction for track type, D B r is the correction for bridges, D B u ¨ is the correction for level/grade crossings and D R a is the correction for curves.

2.1.2. Outline Map

Panyu is the municipal district of Guangzhou City, Guangdong Province, China. located in the central and southern part of Guangzhou. The total area of the Panyu District is 529.94 km 2 . The outline map of the Panyu District was obtained from OpenStreetMap (an open-source map) [19]. However, this outline map did not include most buildings, vegetation zones, railways and roads, as shown in Figure 2a. Therefore, the missing buildings, vegetation zones, railways and roads were supplemented into the outline map with the information provided by a satellite map from Amap [20], as shown in Figure 2b.

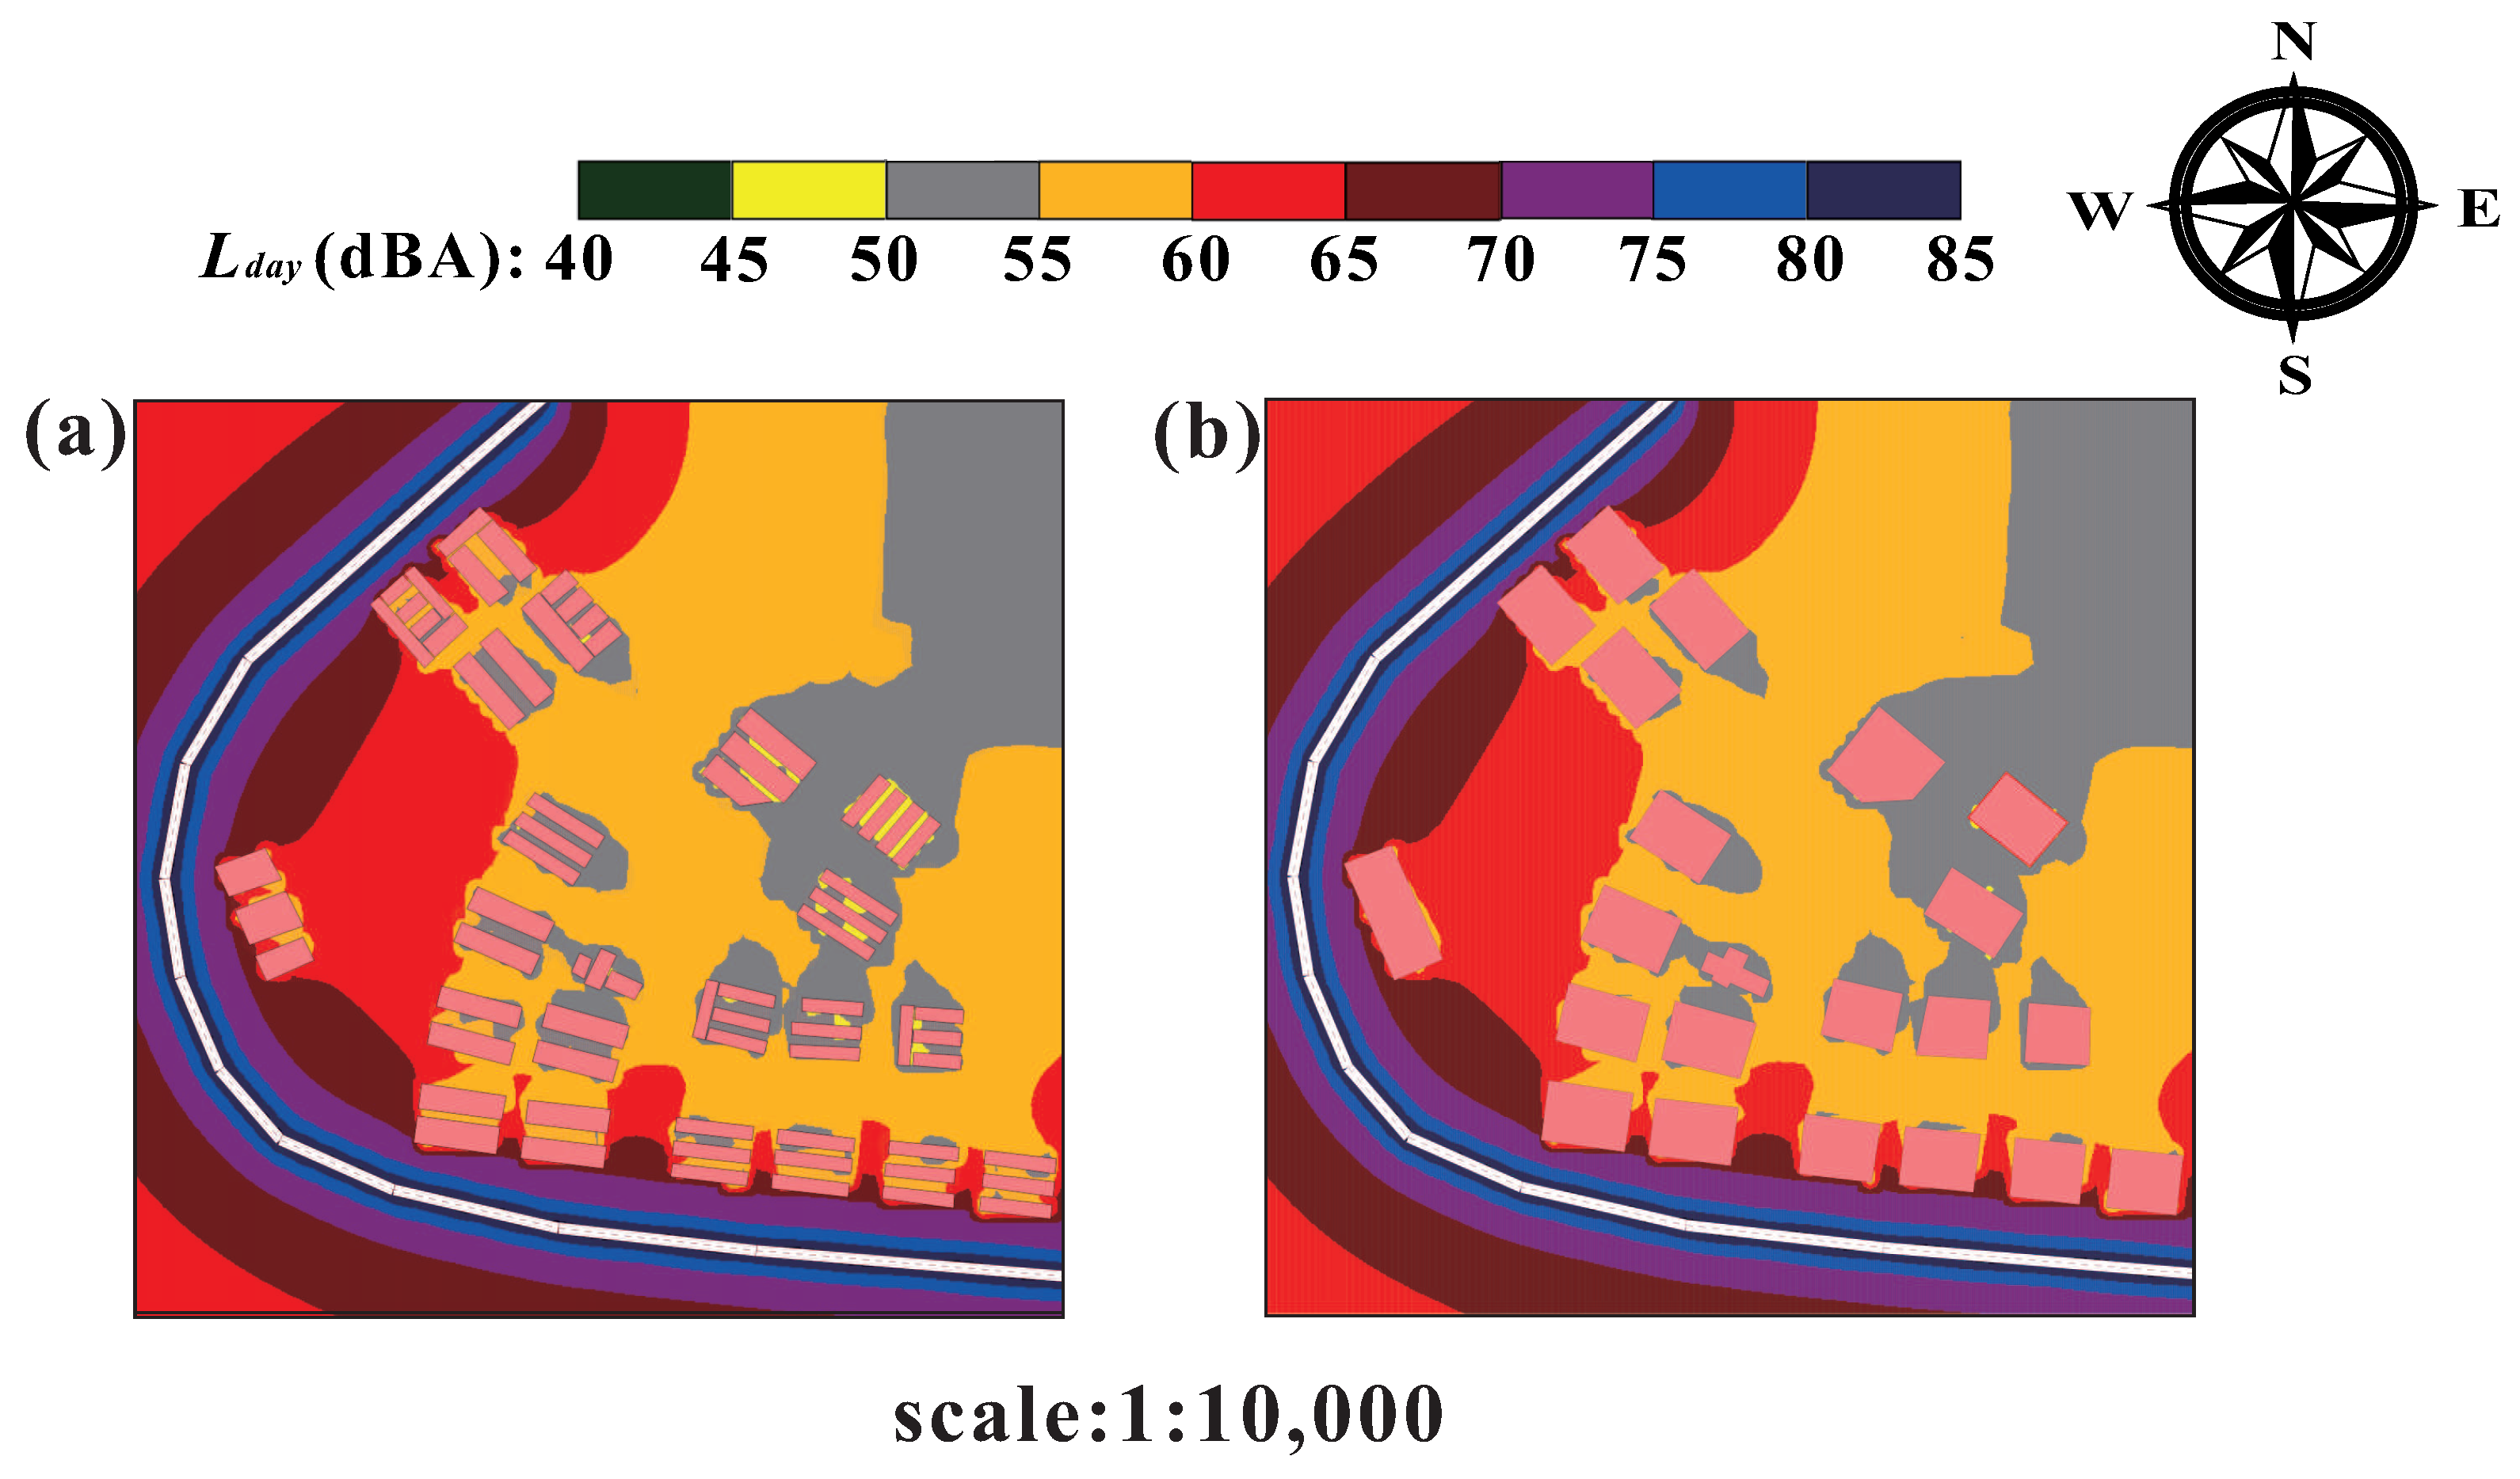
2.1.3. Building Simplification

By the end of 2019, Panyu District had 1.827 millions permanent residents [21]. Given this population size, the buildings are many and the spaces between them are small. In order to study the effect of building simplification on the simulation results, two noise maps of a small area of Guangzhou University (area = 0.42 km 2 ) were produced using CadnaA software as shown in Figure 3 (before and after simplification). One hundred points with equal spacing from bottom to top in the middle region of the small area were then selected for comparison as shown in Figure 4. It was found that the trends of both grids were similar, with an average error of about 0.4 dBA. Thus, to shorten the modeling time, this study merged the adjacent buildings in the same community or street into one, as shown in Figure 5.

2.1.4. Building Height Simplification

Suarez and Barros [7] simplified the heights of all buildings in Santiago de Chile to a single height (4 m). Although this simplification can shorten the modeling time, may also degrade the accuracy of the simulation results. To study the effect of building height on the simulation results, a noise map of Guangzhou University Town (area = 34.4 km 2 ) was produced using CadnaA software. Two noise maps were produced with building heights of 4 m and 21 m, as shown in Figure 6. A building height of 21 m was selected because most buildings in Guangzhou University Town are seven-storey teaching buildings, with total heights of 21 m. Simulated noise levels from six locations in the dense building areas (see Figure 6) were selected for comparison with the field measurement data, and the results are shown in Table 1. The results show that the average errors from the six locations for 4 m and 21 m building heights were 2.74 dBA and 1.84 dBA, respectively.
From Table 1, it can be concluded that the single height of 4 m is not applicable to all buildings in Panyu District because Error 1 were much higher than Error 2 at all locations. Thus, in order to increase the accuracy of the simulation results without consuming too much modeling time, the Panyu District was stratified into 53 small areas as shown in Figure 7 and Table A1 (see Appendix A). The criteria for the area division was, the percentage of the predominant building height had to account for 80% of the height of all buildings. This stratification was completed using the panoramic function of Baidu map [22], where the number of floors of the buildings could be viewed and determined using the map. After that, the building heights could be calculated as each floor height in Panyu District is about 3 m.

2.1.5. Receivers’ Height

According to the literature on noise mapping, the receivers’ heights for most noise maps are set at 1.5 m above the ground [7,8] due to the safety and ease of field measurement, since 1.5 m is the maximum height of a tripod supporting a microphone or sound level meter. Thus, the simulation results and the measurement results could be compared at the same height from the ground. Therefore, the height of 1.5 m was also selected as the receivers’ heights in the present study.

2.1.6. Grid Independency Study

A simulation was carried out in Guangzhou University Town to study the effects of 3 × 3 m and 10 × 10 m grids on the simulation results where only the size of the grid was changed in the two simulation models. The computational time for 3 × 3 m and 10 × 10 m grids were 50 min and 5 min, respectively. After that, 100 points with equal spacing from the bottom to the top of the middle area of the Guangzhou University Town were selected for comparison, as shown in Figure 8. It was found that the trends for both grids were similar, with an average error of about 0.6 dBA. Thus, the 10 × 10 m grid was selected in the present study to produce the noise map of Panyu District since its accuracy was similar to 3 × 3 m grid, but with a considerably shorter computational time. Finally, simulation was performed on a workstation with two 14-core Intel(R) Xeon(R) Gold 6132 processors at 2.6 GHz and 112 GB memory. It typically took 7 h to obtain a complete noise map for Panyu District.

2.1.7. Road Type Classification

According to the definition of a road given by “Technical Standard for Highway Engineering” (JTGB01-2014) [23] and “Specification for Design of Urban Road Engineering” (CJJ37-2012) [24], the roads in Panyu District were classified into five types: expressway, highway, arterial road, sub-arterial road and access road. From the information provided by “Division of Acoustic Environment Functional Area in Guangzhou” [25] (see Figure A1 in Appendix A) and the satellite map from Amap [20], it was found that there are four expressways in Panyu District: Dongsha-Xinlian Expressway, Guangzhou-Macao Expressway, Guangzhou-Taishan Expressway and Guangzhou-Longchuan Expressway (a small section of which passes through Gull Island), and four highways: Xinguang Highway, Xinhua Highway, Nansha Harbour Highway and South China Highway (a small section passes through Shajiao Middle School). The “Planning Standard of Urban Comprehensive Transportation System” (GBT 51328-2018) [26] defines the widths of arterial roads, sub-arterial roads and access roads as 40 m∼50 m, 20 m∼35 m and 14 m∼20 m, respectively. Based on these definitions, 69 arterial roads and 91 sub-arterial roads were identified in Panyu District, while the remaining roads were categorized as access roads.

2.1.8. Railway Information

There are two kinds of railway tracks in Panyu District: one is the high-speed railway track passing through Guangzhou South Railway Station and the other is the track of Metro Line 4 ground section (from the south of Xinzao Station to Dichong Station). The schedules for all trains that pass through Guangzhou South Railway Station were collected from the official website of China Railway 12306 [27]. Thereafter, the number of all trains running during day and night times, and their running speeds (the average speed of all trains during day and night) were obtained as shown in Table 2:
The train operation information of Guangzhou Metro Line 4 was obtained through the official website of Guangzhou Metro [28], as shown in Table 3.

2.2. Experimental Methods

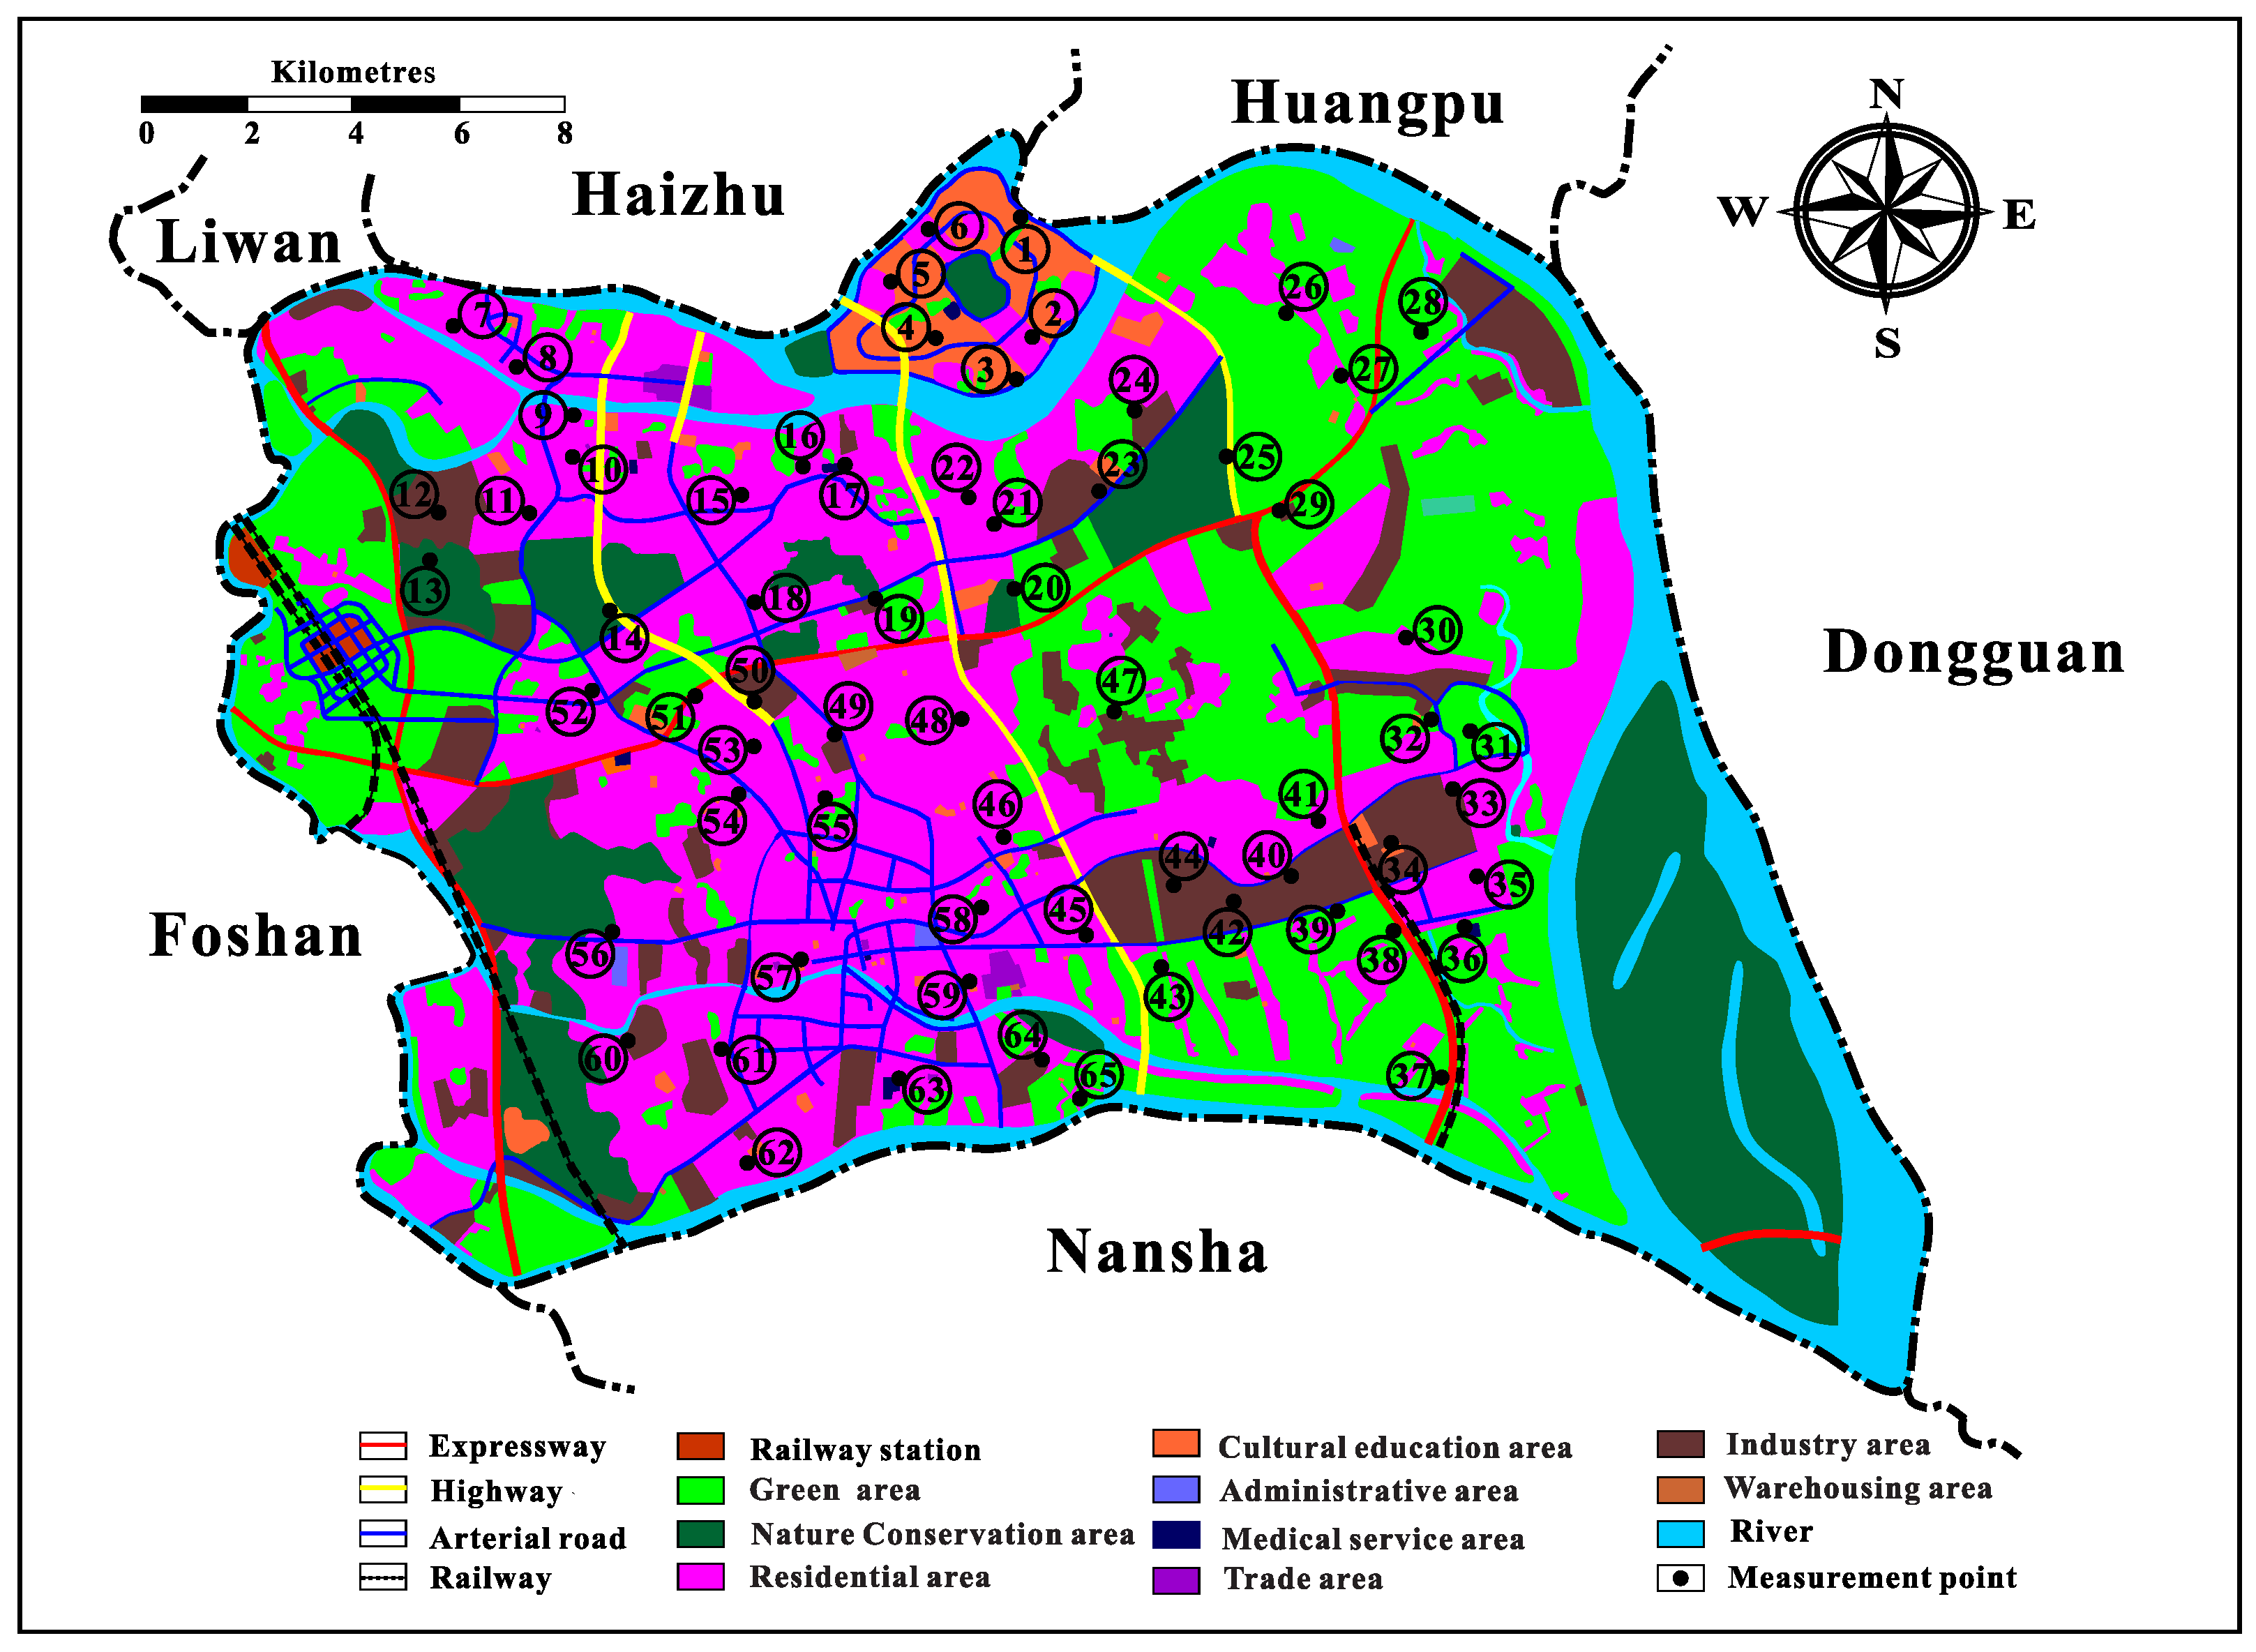
2.2.1. Measurement Point

For field measurement in the present study, there were 65 field measurement points as shown in Figure 9. These points were distributed in 58 roads (2, 2, 9, 24 and 21 roads from expressways, highways, arterial roads, sub-arterial roads and access roads, respectively) as shown in Table 4. The distances between different measurement points for expressway, highway, arterial road, sub arterial road and access road are 10 km, 10 km, 5 km, 2 km and 1 km, respectively.

2.2.2. Field Measurement

The field measurement equipment included a microphone (model: BSWA MA231), a portable power source (model: SK9), a data acquisition system (model: BSWA MC3642), a microphone calibrator (model: BSWA CA111), a hand-held vehicle velocimeter (model: Bushell 101921) and a tripod (model: WD-122), as shown in Figure 10.

Road Traffic Noise Measurement

All noise measurements were conducted 1.5 m above the ground [29], as shown in Figure 10a. The sampling duration at each measurement point was about ten minutes [6,8,30,31,32,33]. The microphone was calibrated at each measurement point before the start of the measurement. During the noise measurements, the climatic conditions of the measurement points needed to meet two requirements: (1) good weather conditions with no rain, snow or lightning, and (2) a wind speed less than 5 m/s, to ensure the accuracy of noise measurement data [34]. If other loud background noises (e.g., construction noise) around the measurement point were detected, the measurement was stopped and only resumed when the background noise ceased. If the noise did not cease, a new measurement point without background noise was identified. For all noise measurements, the distance between the microphone and the surrounding reflectors (except the ground) was greater than 3.5 m [34]. At each measurement point, various distances were recorded to accurately locate its position on the software to compare numerical and experimental results (noise level) in the next step. These distances could be, for example, the distance between the measurement point and the outermost edge of the road, the straight distance between the measurement point and the nearest building, etc.

Vehicle Speed Measurement

At each measurement point, traffic flow, vehicle type and vehicle speed were also recorded while simultaneously measuring the traffic noise. This data was used as the input to CadnaA software for noise mapping simulation, while the measured noise data were compared with those computed by CadnaA software. The handheld velocimeter was directed at the passing vehicles during each measurement, as shown in Figure 10b. The speeds of ten trucks and ten cars were recorded separately and were averaged at each measurement point, as shown in Table 5. Point 1 was located at an arterial road with a speed limit of 40 km/h∼60 km/h [24] (see Table A2 in Appendix A). Thus, by comparing Table 5 and Table A2, it can be verified that the data from the vehicle speed measurement is realistic, as is all data in Table 5 ranging between 40 km/h∼60 km/h.

Traffic Flow and Vehicle Type Measurements

The sampling time for measurements of traffic flow and vehicle types were also 10 min. All vehicles were categorized into small, mid-size and large cars in the present study, as shown in Table A3 [23] in the appendix. Finally, data like hourly traffic flow could be computed, as shown in Table 6. The measurements of noise, traffic flow and vehicle types were conducted simultaneously.

Overpass Height Measurement

In order to ensure the accuracy of the numerical simulation, a distance measuring application was used to measure the heights of some overpasses. Three overpasses were identified along the same expressway, highway, etc., and were averaged, as shown in Table 7. Thereafter, the average heights shown in Table 7 were used to define the heights of the roads with overpasses since CadnaA software did not allow directly modeling roads on top of overpasses.

3. Results and Discussion

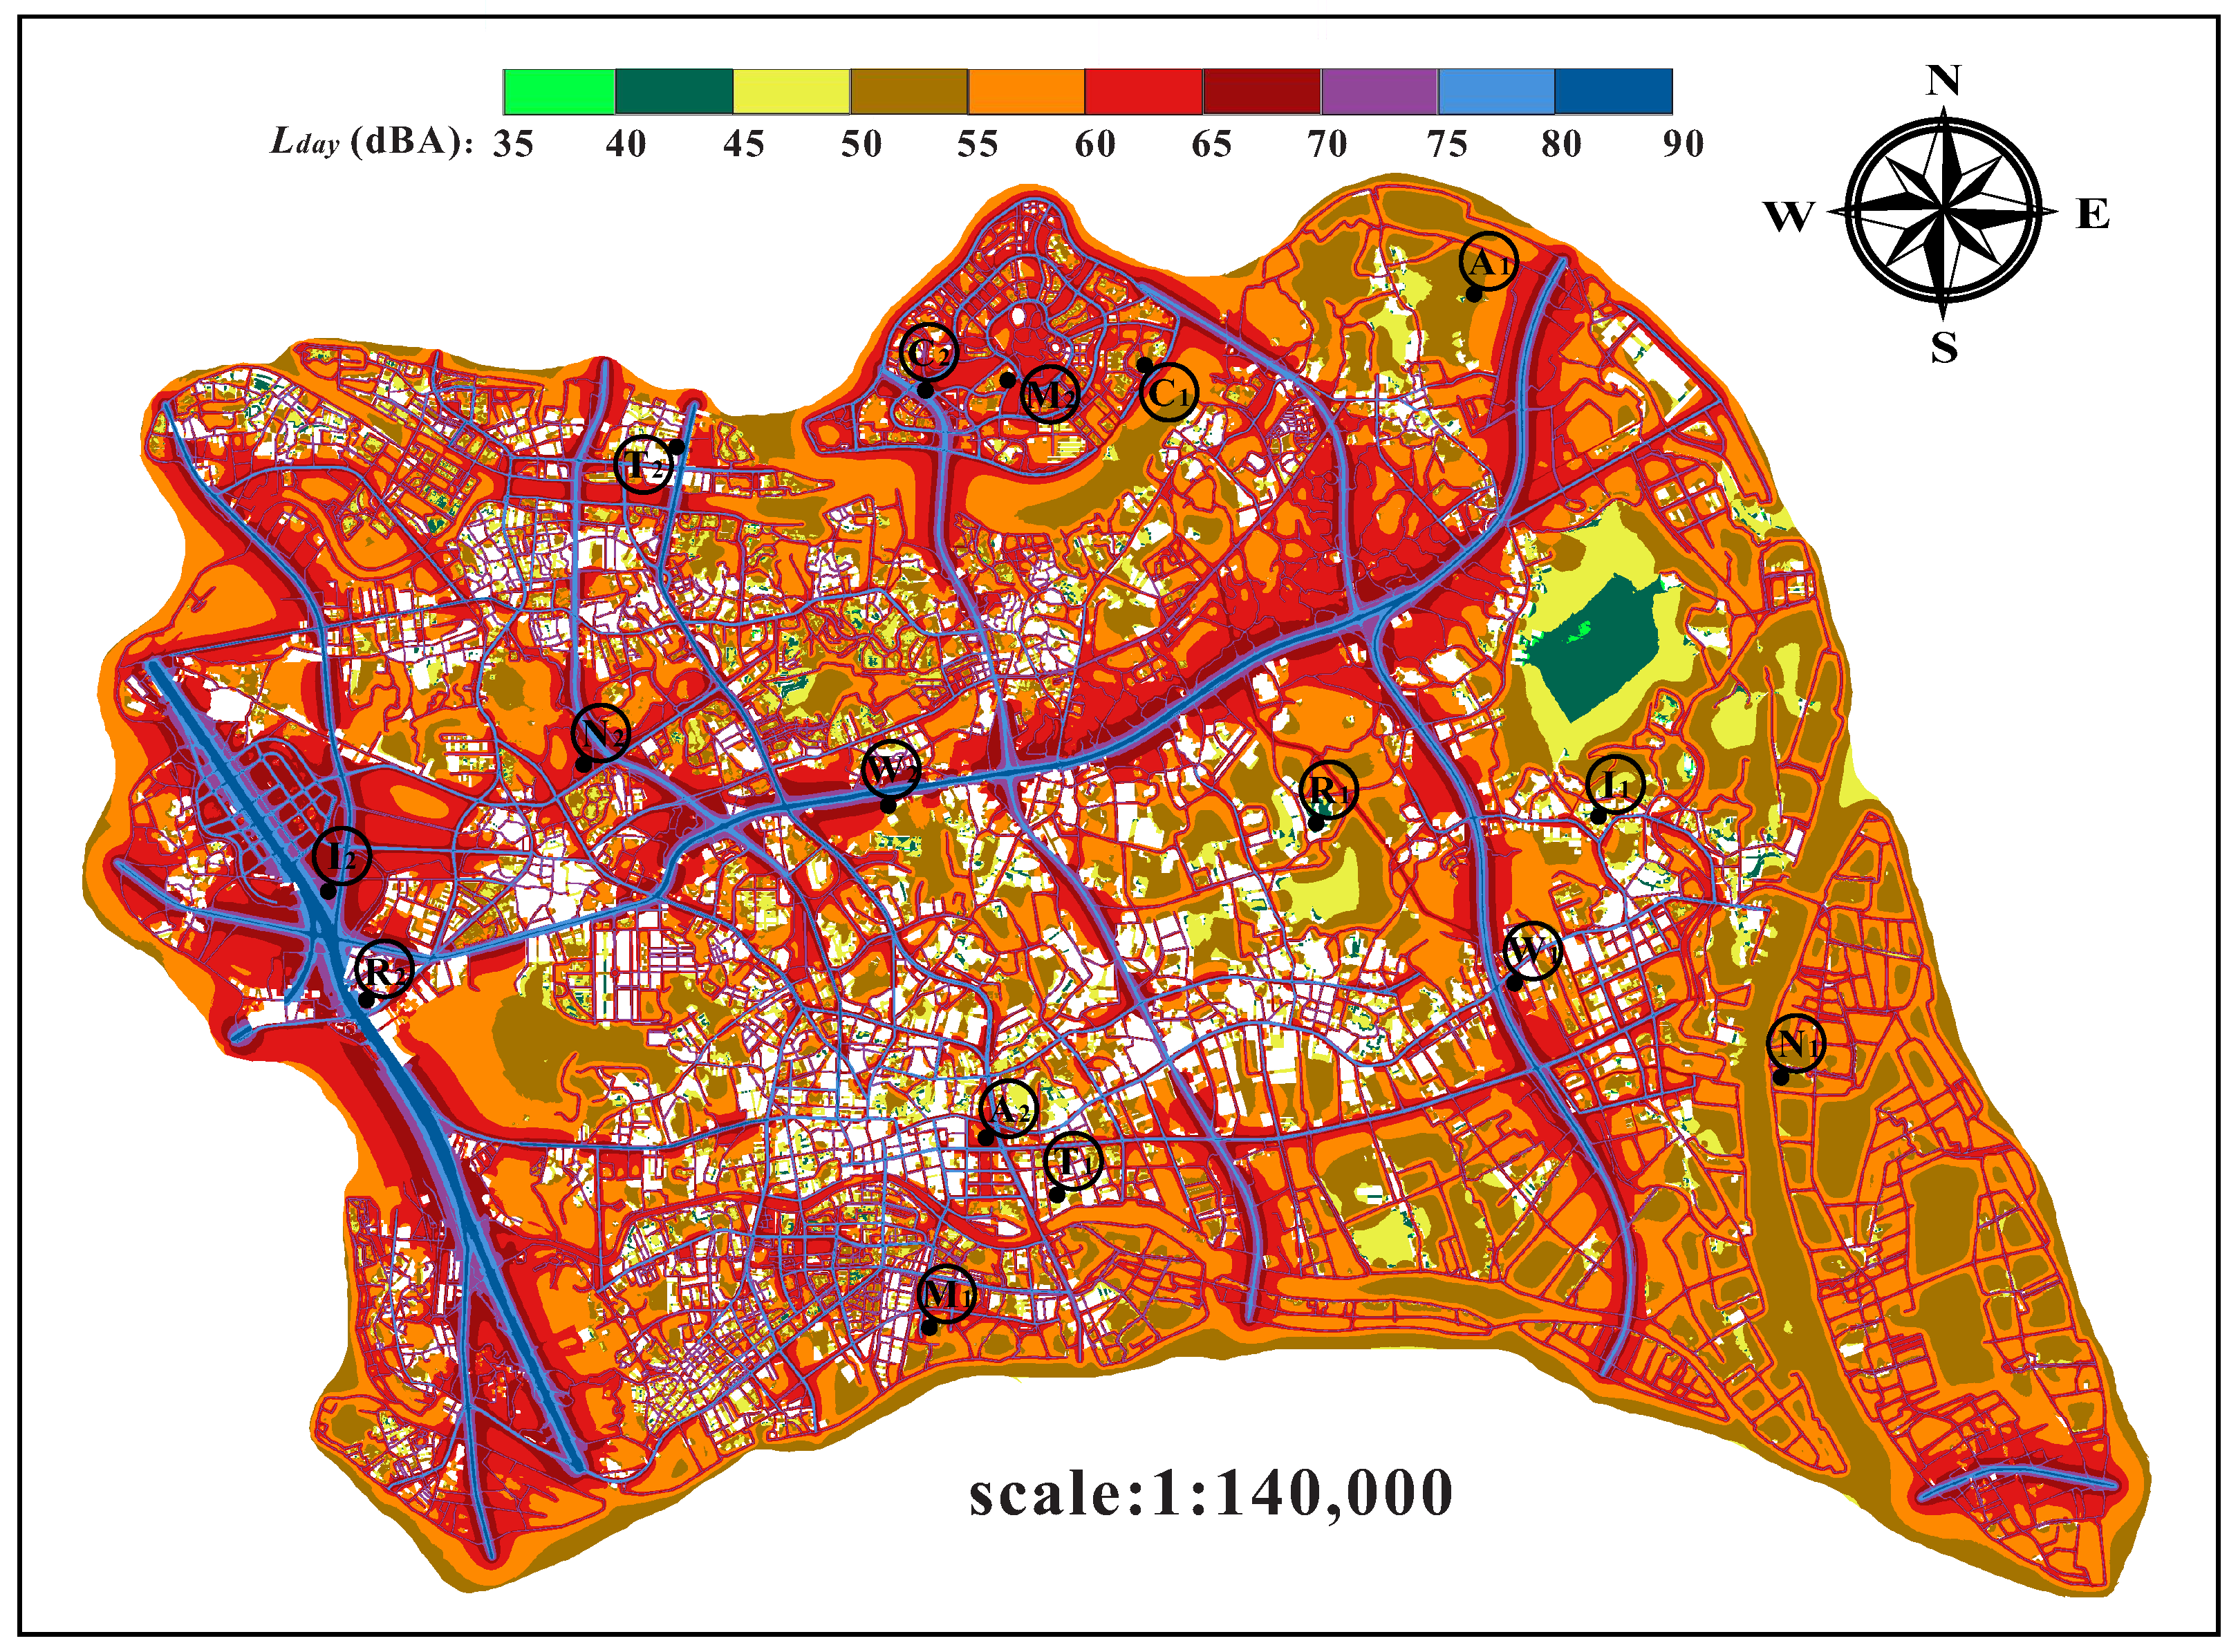
3.1. Noise Map of Panyu District

In the day (see Figure 11), the traffic noise levels of the areas along the expressways, highways and arterial roads in Panyu District were very high (>65 dBA). The area, coverage and noise limit of the acoustic environment functional areas are shown in Table 8. The noise level of the area along the railway was also high (>70 dBA). The minimum and maximum noise levels during the day were 39.9 dBA and 85.3 dBA, respectively, as shown in Table 9. The minimum and maximum noise levels of different functional areas in the Panyu District are shown in Table 10 (see Figure 9 for distribution of functional areas). It can be seen from Table 10 that the minimum and maximum day noise levels in industry area were the highest among all functional areas where its maximum day level could reach 71.0 dBA.
At night (see Figure 12), the traffic noise level was still very high along the traffic arteries, and the traffic noise pollution was more serious than during the day. Table 10 shows that minimum noise levels in the administrative area and medical service area at night are 52.6 dBA and 48.3 dBA, respectively. These values were greater than 45 dBA (the noise limit of class 1 acoustic environment functional area at night, see Table 8). Therefore, it can be concluded that the traffic noise pollution in these two functional areas are very serious at night, especially in the administrative area where its minimum noise level is 7.6 dBA higher than that of the noise limit.
Figure 13 shows the traffic noise level in the northwest area of the Panyu District was the highest from day-night, especially in the area near Guangzhou South Railway Station, which was higher than in other areas. This is because the traffic and transportation in this area are busy, and the traffic arteries are dense. By comparing Figure 11, Figure 12 and Figure 13, it was found that when the traffic noise level was higher than 70 dBA, the area covered by this noise level from day-night was much larger than that in either the day or night. Table 9 shows that the minimum and maximum day-night traffic noise levels were 42.5 dBA and 89.1 dBA, respectively.

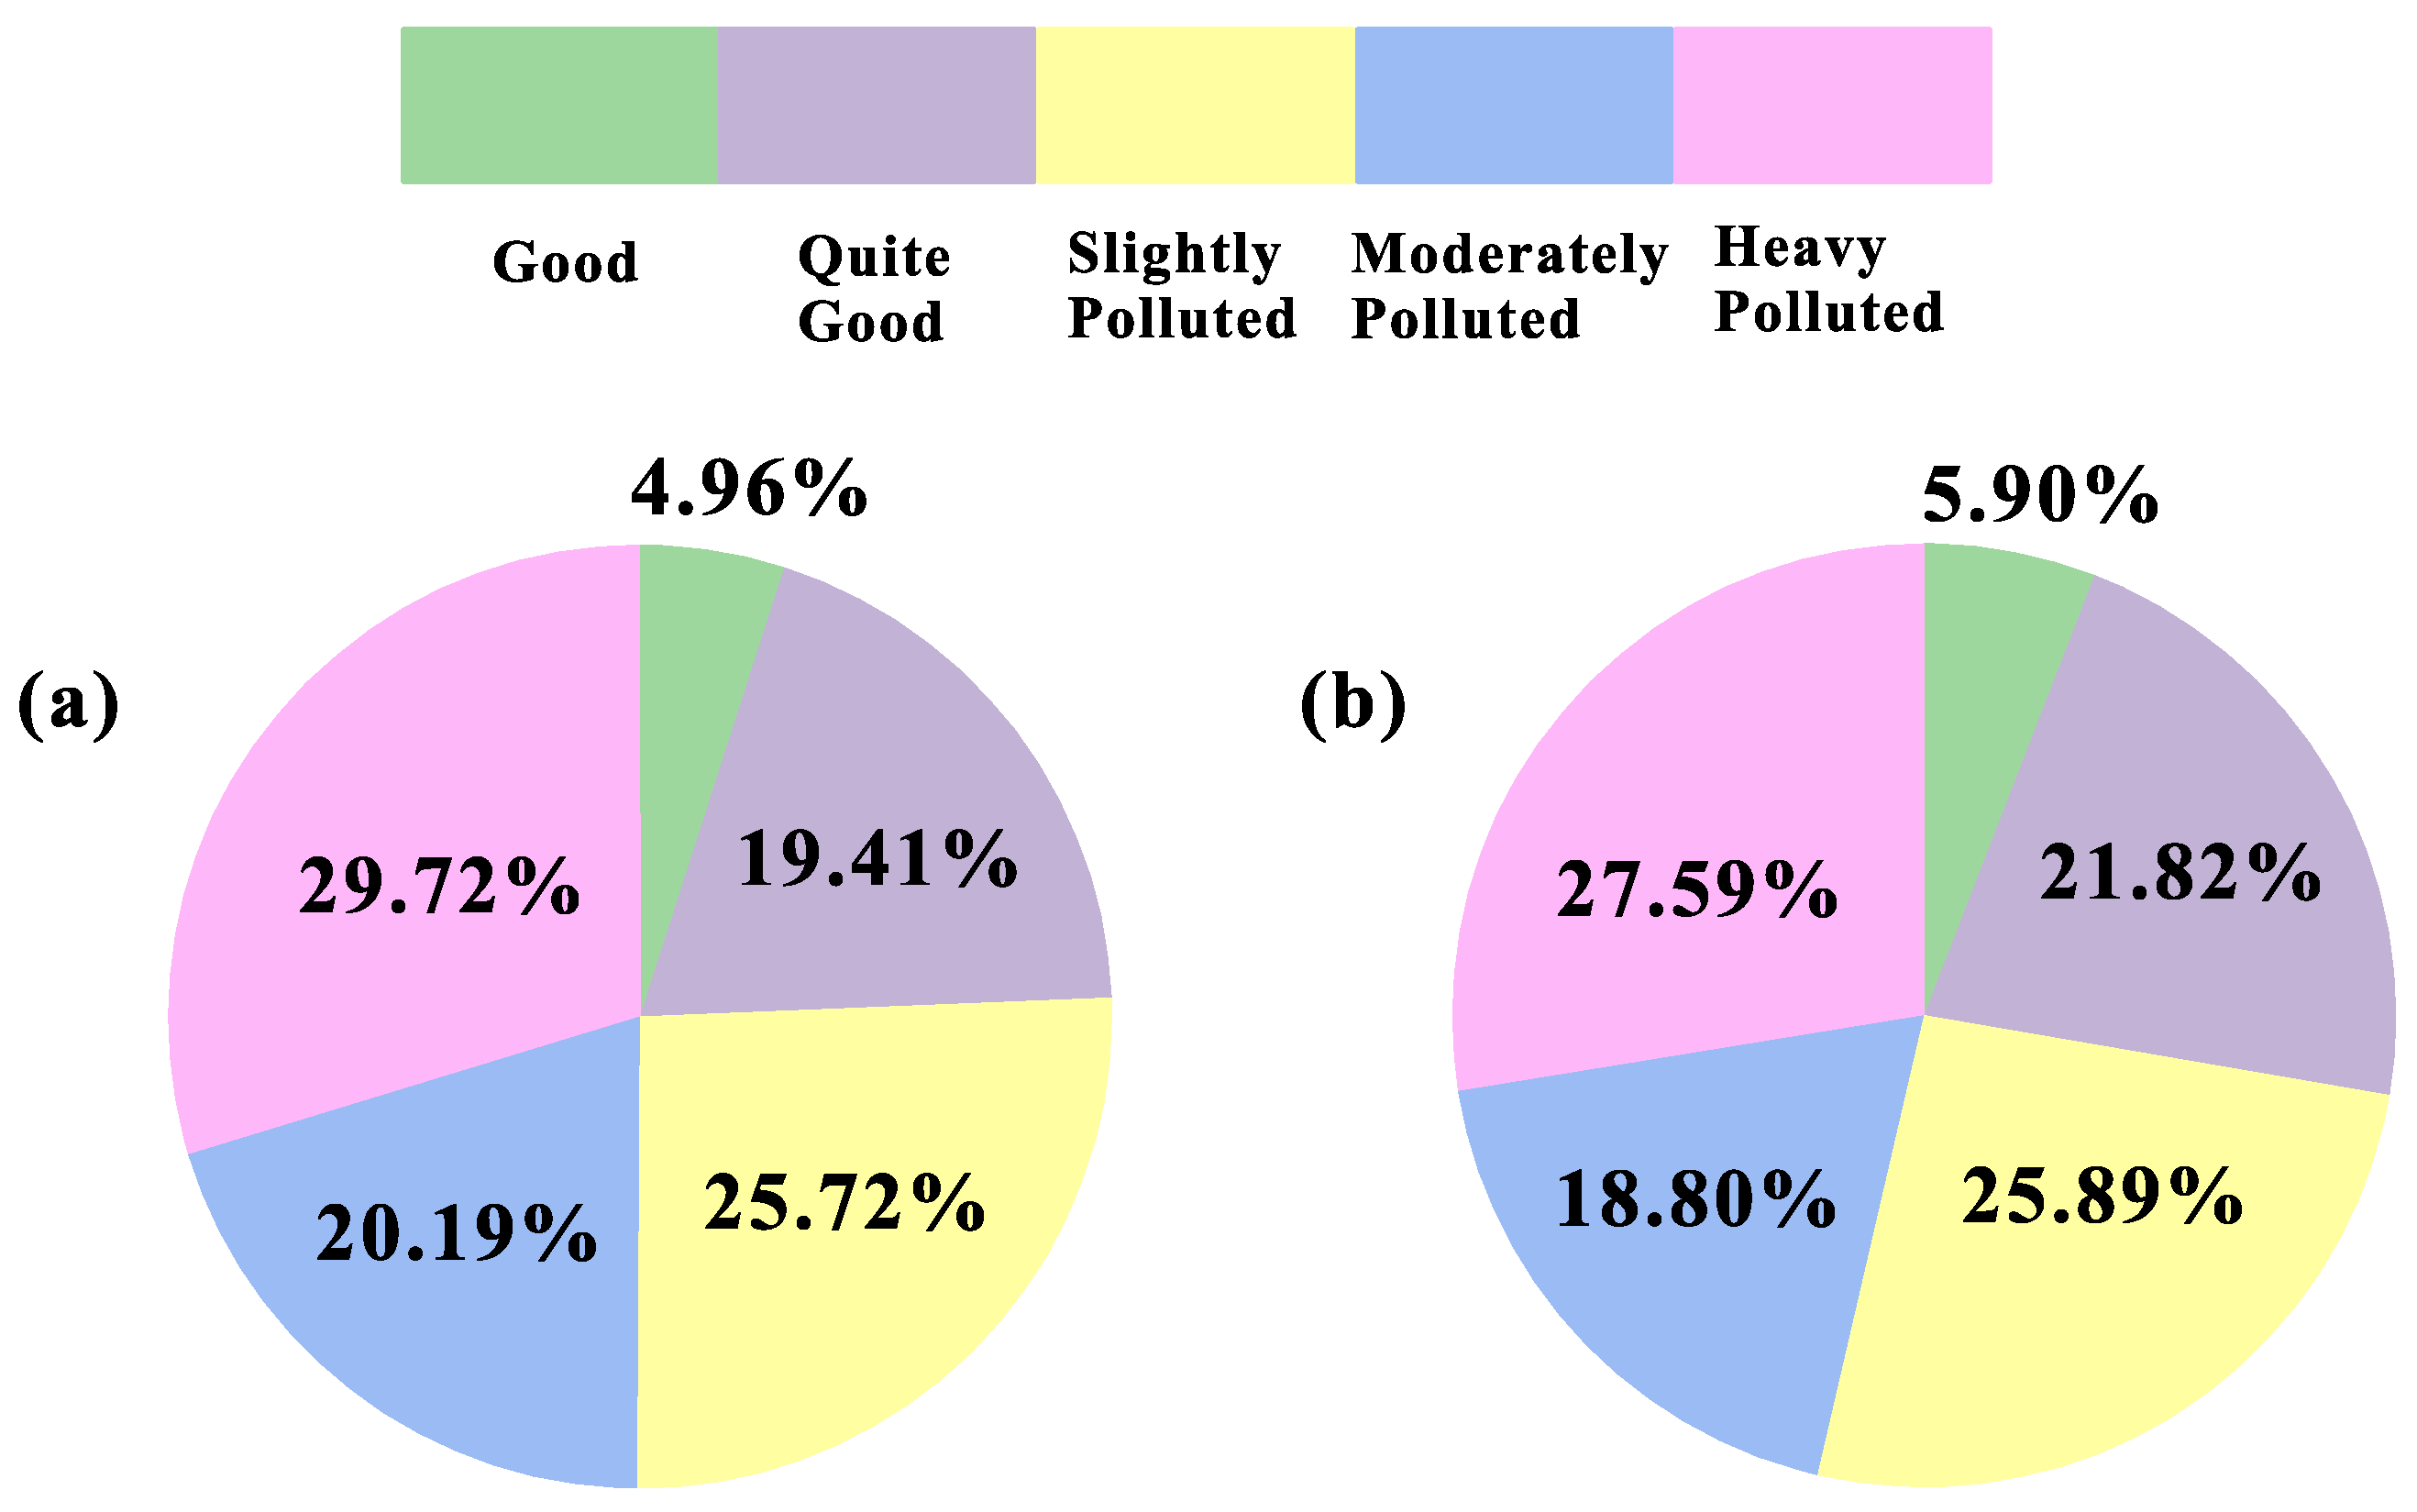
3.2. Noise Quality Levels in Panyu District

Figure 14 shows the area covered by different noise quality levels in Panyu District. The definition of the noise quality level is given in Table A4 in the Appendix A. It can be seen from Figure 14 that the total areas of about 129.1 km 2 (24.37%) and 146.9 km 2 (27.72%) in Panyu District have good and quite good noise quality levels in day and night, respectively. However, large areas suffer from noise pollution (light, moderate and heavy) in the day and night, equaling about 400.8 km 2 (75.63%) and 383.0 km 2 (72.28%), respectively. The percentage of the area with heavy noise pollution is the largest at 29.72% and 27.59% in the day and night, respectively.

3.3. Noise Level Compliance Map in Panyu District

Figure 15 and Figure 16 show the compliance maps of day and night noise levels in the Panyu District, respectively. Table 11 shows that the total noise level compliance rate in the day is considerably higher than that at night, at 61.62% and 16.46%, respectively. However, there is little difference in the area covered by different noise quality levels between day and night (see Figure 14). This is because the noise limit at night in China is more stringent than during the day, which leads to more serious violations of the noise limit at night. In addition, the day compliance rate of class 4 acoustic environment functional areas is considerably less than that of the other three classes. The night compliance rate is also as low at 7.14% (similar to that of class 1, 6.76%), which is also lower than classes 2 and 3. This finding is consistent with the results from noise maps (see Figure 11 and Figure 12), where the areas with high levels of traffic noise were concentrated along the traffic arteries. This finding is also consistent with the areas with excessive traffic noise pollution shown in Figure 15 and Figure 16.

3.4. Comparison between Measurement and Simulation Results

The measurement results from the 65 measurement points ware compared with the simulation results, as shown in Table A5 in the Appendix A. The average error between the measurement and simulation results was computed, as shown in Table 12. It can be seen from Table A5 that almost all measurement values are less than the simulation values because during the actual measurement, about 20% of the measured vehicles were new energy vehicles where the noise generated was less than those of ordinary internal combustion engine automobiles. Thus, the measurement values were lower than predicted using CadnaA software. In addition, the error at night was generally larger than in the day. Table 12 shows that the overall E A d a y and E A n i g h t were 1.3 dBA and 1.7 dBA, respectively. The error values of all road types at night were also greater than in the day because the traffic flow of all roads at night was less than during the day. Smaller road traffic flow corresponded to greater error since the statistical error can be reduced by including more data (see next section for more detailed explanation). The average errors between the measurement and simulation results from other noise mapping works [7,8,35] are generally in the range of 2 dBA to 3 dBA, and the overall E A of all roads in the present study was 1.5 dBA. Thus, it can be concluded that the current noise map of Panyu District is precise enough to represent the actual traffic noise level.

3.5. Road Traffic Flow Analysis

The average hourly traffic flow of different vehicle types from all measuring points was obtained as shown in Table 13. It was found that the average traffic flow of all vehicle types in the day were greater than at night. Greater traffic flow corresponds to a higher traffic noise level. Thus, the overall traffic noise level in Panyu District in the day should be higher than at night, which was confirmed and shown in Figure 14 (area covered by different noise quality levels).
Figure 17 shows the average hourly traffic flow of different road types in the day and night. It was found that the average traffic flow of small vehicles is much greater than that of mid-size and large vehicles in both the day and night. Thus, it can be concluded that the traffic noise in Panyu District is mostly attributed to small vehicles. In addition, the average hourly traffic flow of small vehicles decreased with the order of highway, expressway, arterial road, sub-arterial road and access road, which matches the descending order of traffic capacity from highway to access road, as shown in Table A2. By comparing the results from Figure 17 and Table 12, it can be concluded that the average error between the measurement results and the simulation results of roads with larger traffic flow is small (arterial road < sub-arterial road < access road), except for expressway and highway. This is because there are overpasses along both expressways and highways in Panyu District, but CadnaA software does not allow directly modeling of these overpasses during the simulation. Thus, the reflection effect of these overpasses on traffic noise is ignored in the simulation results. Therefore, the average errors for expressways and highways can not be compared with the other three types of roads. However, the average error of highways with larger traffic flow is still smaller than that of expressways with smaller traffic flow (highway < expressway).

4. Conclusions

A traffic noise map of the Panyu District in Guangzhou city, with a regional area of 529.9 km 2 , was constructed to include road and railway traffic noises. This study constructed the urban traffic noise map by combining field measurement, modelling and investigative methods. The average error between the measured and simulated results of all roads was found to be 1.5 dBA. This error was lower than those reported in other studies. Therefore, the authors are confident that the noise map constructed in the present study accurately reflects the true urban traffic noise level of the Panyu District.
The results showed that the traffic noise pollution in the area near the traffic arteries, especially the railway area, was more severe than that of other areas. Therefore, this study investigated the level of traffic noise from two different aspects, including noise quality level and noise level compliance rates of different acoustic environmental functional areas. For the noise quality level, the difference between day and night for the area that was not polluted by traffic noise was not significant and had a total area of 17.8 km 2 . However, for noise level compliance rate, all environmental functional areas were quieter at night than in the day, with a difference of 239.3 km 2 . This is because the noise limits at night were stricter than during the day. In addition, the analysis of traffic noise level from different aspects accurately reflected the traffic noise in Panyu District and revealed the degree and location of pollution from traffic noise. Finally, for future works, a proper noise reduction scheme that includes a noise barrier will be designed using the methods described in this study and directed by the degree of pollution identified throughout the Panyu District.

Author Contributions

Conceptualization, H.M.L.; methodology, H.M.L.; software, W.L. and H.P.L.; validation, W.L.; formal analysis, W.L.; investigation, W.L.; resources, H.M.L. and J.X.; data curation, W.L.; writing—original draft preparation, H.M.L.; writing—review and editing, H.M.L.; visualization, H.P.L.; supervision, H.M.L. and J.X.; project administration, H.M.L.; funding acquisition, H.M.L. and J.X. All authors have read and agreed to the published version of the manuscript.

Funding

This research was funded by National Natural Science Foundation of China [51908142], Natural Science Foundation of Guangdong Province [2019A1515012223, 2021A1515012269] and Guangzhou Basic Research Program—City School (College) Joint Funding Project [202102010384, 202102010410].

Institutional Review Board Statement

Not applicable.

Informed Consent Statement

Not applicable.

Data Availability Statement

Data available on request from the authors.

Conflicts of Interest

The authors declare no conflict of interest. The funders had no role in the design of the study; in the collection, analyses, or interpretation of data; in the writing of the manuscript, or in the decision to publish the results.

Appendix A

Table A1. Building heights of 53 areas in Panyu District.
NumberNumber of FloorBuilding Height (m)NumberNumber of FloorBuilding Height (m)
172128515
282429515
3721301236
451531618
53932721
6278133412
7515341236
83935515
961836618
102163371236
1151538618
12824391854
1341240515
142575411854
1551542515
16185443412
17216344412
1851545515
192163462884
2061847515
212163482163
221236492884
23515502163
24618511854
25278152515
2661853412
273296
Table A2. Speed limit and traffic capacity standards of different road types [23,24].
TypeSpeed Limit (km/h)Traffic Capacity (pcu/h)
Expressway80∼1201100∼2200
Highway60∼1001400∼2000
Arterial road40∼601300∼1400
Sub-arterial road30∼501300∼1350
Access road20∼401100∼1300
Table A3. Classification standard of vehicle type [23].
TypeVehicle Mass (t)
Small car<5
Mid-size car3.5∼12
Large car>12
Table A4. Classification of environmental noise quality level in urban area [36].
Quality LevelRange (dBA)
Good≤50
Quite good50.1–55.0
Slightly polluted55.1–60.0
Moderately polluted60.1–65.0
Heavy polluted>65
Figure A1. Acoustic environment functional areas in Panyu District of Guangzhou City [25].
Sustainability 14 04465 g0a1
Table A5. Comparison between measurement and simulation results in Panyu District of Guangzhou City. M and S are the measurement and simulation results, respectively. E is the error which obtained through M-S. All units in dBA.
TypeMeasurement PointM day M night S day S night E day E night
Expressway2971.171.272.272.0−1.1−0.8
3765.765.368.568.7−2.8−3.4
3868.768.170.669.9−1.9−1.8
5170.070.772.173.3−2.1−2.6
Highway1473.473.075.275.4−1.8−2.4
2576.576.375.374.81.21.5
5075.675.575.975.7−0.3−0.2
Arterial road168.465.969.767.3−1.3−1.4
557.457.559.959.6−2.5−2.1
1171.770.372.571.4−0.8−1.1
1873.073.073.773.4−0.7−0.4
1971.571.071.971.8−0.4−0.8
2368.968.368.168.50.8−0.2
3266.462.067.363.6−0.9−1.6
3967.367.267.567.4−0.2−0.2
4568.769.068.369.60.4−0.6
4975.573.073.873.51.7−0.5
5263.763.564.964.7−1.2−1.2
5467.167.068.767.6−1.6−0.6
5670.770.271.170.6−0.4−0.4
5969.267.569.768.6−0.5−1.1
Sub-arterial road362.560.663.161.9−0.6−1.3
462.960.064.056.6−1.13.4
866.266.368.568.8−2.3−2.5
967.768.968.067.3−0.31.6
1273.274.274.374.4−1.1−0.2
1564.364.865.966.1−1.6−1.3
1666.762.667.166.2−0.4−3.6
2068.368.669.969.1−1.6−0.5
2167.767.868.869.1−1.1−1.3
2467.866.968.068.3−0.2−1.4
2767.868.468.469.1−0.6−0.7
3357.456.658.658.7−1.2−2.1
3456.055.758.758.3−2.7−2.6
3555.657.459.059.3−3.4−1.9
4264.865.264.666.10.2−0.9
4470.270.070.569.5−0.30.5
4660.763.462.561.6−1.81.8
4765.165.365.865.6−0.7−0.3
5361.462.361.662.7−0.2−0.4
5567.468.767.767.5−0.31.2
6063.061.963.962.1−0.9−0.2
6167.466.168.968.5−1.5−2.4
6461.158.260.460.20.7−2.0
Access road262.259.263.463.3−1.2−4.1
653.952.057.756.7−3.8−4.7
761.464.761.762.2−0.32.5
1066.365.367.267.4−0.9−2.1
1360.364.563.962.7−3.61.8
1758.658.359.558.5−0.9−0.2
2264.464.765.265.0−0.8−0.3
2666.158.567.561.8−1.4−3.3
2859.157.057.357.71.8−0.7
3057.855.258.858.0−1.0−2.8
3165.467.166.767.0−1.30.1
3665.562.062.862.92.7−0.9
4059.063.759.960.3−0.93.4
4162.861.863.464.9−0.6−3.1
4368.267.268.568.7−0.3−1.5
4864.564.267.467.6−2.9−3.4
5763.362.463.163.50.2−1.1
5858.855.658.557.80.3−2.2
6259.157.362.358.9−3.2−1.6
6362.760.863.265.5−0.5−4.7
6563.362.866.064.4−2.7−1.6

References

  1. Assessment and Management of Environmental Noise; Technical Report Directive 2002/49/EC; The European Parliament and The Council of The European Union: Luxembourg, 2002.
  2. Banerjee, D.; Chakraborty, S.K.; Bhattacharyya, S.; Gangopadhyay, A. Appraisal and mapping the spatial-temporal distribution of urban road traffic noise. Int. J. Environ. Sci. Technol. 2009, 6, 325–335. [Google Scholar] [CrossRef] [Green Version]
  3. Hossam Eldien, H. Noise mapping in urban environments: Application at Suez city center. In Proceedings of the 2009 International Conference on Computers Industrial Engineering, Troyes, France, 6–9 July 2009; pp. 1722–1727. [Google Scholar] [CrossRef]
  4. Das, P.; Talukdar, S.; Ziaul, S.; Das, S.; Pal, S. Noise mapping and assessing vulnerability in meso level urban environment of Eastern India. Sustain. Cities Soc. 2019, 46, 101416. [Google Scholar] [CrossRef]
  5. de Noronha Castro Pinto, F.A.; Moreno Mardones, M.D. Noise mapping of densely populated neighborhoods-example of Copacabana, Rio de Janeiro-Brazil. Environ. Monit. Assess. 2009, 155, 309–318. [Google Scholar] [CrossRef] [PubMed]
  6. Zannin, P.H.T.; de Sant’Ana, D.Q. Noise mapping at different stages of a freeway redevelopment project—A case study in Brazil. Appl. Acoust. 2011, 72, 479–486. [Google Scholar] [CrossRef]
  7. Suarez, E.; Barros, J. Traffic noise mapping of the city of Santiago de Chile. Sci. Total. Environ. 2014, 466–467, 539–546. [Google Scholar] [CrossRef] [PubMed]
  8. Bastian-Monarca, N.A.; Suarez, E.; Arenas, J.P. Assessment of methods for simplified traffic noise mapping of small cities: Casework of the city of Valdivia, Chile. Sci. Total. Environ. 2016, 550, 439–448. [Google Scholar] [CrossRef] [PubMed]
  9. Lokhande, S.; Dhawale, S.; Pathak, S.; Gautam, R.; Jain, M.; Bodhe, G. Appraisal of Noise Level Dissemination Surrounding Mining and Industrial Areas of Keonjhar, Odisha: A Comprehensive Approach Using Noise Mapping. Arch. Acoust. 2017, 42, 423–432. [Google Scholar] [CrossRef] [Green Version]
  10. De Coensel, B.; Sun, K.; Wei, W.; Van Renterghem, T.; Sineau, M.; Ribeiro, C.; Can, A.; Aumond, P.; Lavandier, C.; Botteldooren, D. Dynamic noise mapping based on fixed and mobile sound measurements. In Proceedings of the 10th European Congress and Exposition on Noise Control Engineering (Euronoise 2015), Maastricht, The Netherlands, 31 May–3 June 2015; pp. 2339–2344. [Google Scholar]
  11. Wei, W.; Van Renterghem, T.; De Coensel, B.; Botteldooren, D. Dynamic noise mapping: A map-based interpolation between noise measurements with high temporal resolution. Appl. Acoust. 2016, 101, 127–140. [Google Scholar] [CrossRef] [Green Version]
  12. Benocci, R.; Bellucci, P.; Peruzzi, L.; Bisceglie, A.; Angelini, F.; Confalonieri, C.; Zambon, G. Dynamic Noise Mapping in the Suburban Area of Rome (Italy). Environments 2019, 6, 79. [Google Scholar] [CrossRef] [Green Version]
  13. Carli, R.; Dotoli, M.; Epicoco, N.; Angelico, B.; Vinciullo, A. Automated evaluation of urban traffic congestion using bus as a probe. In Proceedings of the 2015 IEEE International Conference on Automation Science and Engineering (CASE), Gothenburg, Sweden, 24–28 August 2015; pp. 967–972. [Google Scholar] [CrossRef]
  14. Fredianelli, L.; Carpita, S.; Bernardini, M.; Del Pizzo, L.G.; Brocchi, F.; Bianco, F.; Licitra, G. Traffic Flow Detection Using Camera Images and Machine Learning Methods in ITS for Noise Map and Action Plan Optimization. Sensors 2022, 22, 1929. [Google Scholar] [CrossRef] [PubMed]
  15. Law of the People’s Republic of China on the Prevention and Control of Environmental Noise Pollution. Technical Report, Ministry of Ecology and Environment of the People’s Republic of China. 2021. Available online: https://www.mee.gov.cn/ywgz/fgbz/fl/202112/t20211225-965275.shtml (accessed on 6 March 2022).
  16. Bundesbahn, D. Guideline for the Calculation of Sound Immissions of Railways; Deutsche Bahn: Berlin, Germany, 1990. [Google Scholar]
  17. Technical Guidelines for Noise Impact Assessment; Technical Report HJ2.4-2009; Ministry of Environmental Protection of the People’s Republic of China: Beijing, China, 2009.
  18. Barron, R.F. Industrial Noise Control and Acoustics; CRC Press: Boca Raton, FL, USA, 2002. [Google Scholar]
  19. OpenStreetMap. Available online: https://www.openstreetmap.org/#map=17/22.92421/113.35678 (accessed on 6 March 2022).
  20. Amap. Available online: https://ditu.amap.com/?amapexchange=%2F (accessed on 6 March 2022).
  21. Statistical Bulletin of National Economic and Social Development in Panyu District of Guangzhou City; Technical Report; People’s Government of Panyu District: Guangzhou, China, 2019.
  22. Baidu Maps. Available online: https://map.baidu.com/@12609384.2,2631450.58,12z (accessed on 6 March 2022).
  23. Technical Standard for Expressway Engineering; Technical Report JTG B01-2014; Ministry of Transport of the People’s Republic of China: Beijing, China, 2014.
  24. Specification for Design of Urban Road Engineering; Technical Report CJJ37-2012; Ministry of Housing and Urban/Rural Development of the People’s Republic of China: Beijing, China, 2012.
  25. Division of Acoustic Environment Functional Area in Guangzhou; Technical Report; Environmental Protection Bureau of Guangzhou: Guangzhou, China, 2018.
  26. Planning Standard of Urban Comprehensive Transportation System; Technical Report GBT 51328-2018; Ministry of Housing and Urban/Rural Development of the People’s Republic of China: Beijing, China, 2018.
  27. 12306 China Railway. Available online: https://www.12306.cn/index/ (accessed on 6 March 2022).
  28. Guangzhou Metro. Available online: https://www.gzmtr.com/ (accessed on 6 March 2022).
  29. Barrigon Morillas, J.M.; Montes Gonzalez, D.; Rey Gozalo, G. A review of the measurement procedure of the ISO 1996 standard. Relationship with the European Noise Directive. Sci. Total. Environ. 2016, 565, 595–606. [Google Scholar] [CrossRef] [PubMed] [Green Version]
  30. Guedes, I.C.M.; Bertoli, S.R.; Zannin, P.H. Influence of urban shapes on environmental noise: A case study in Aracaju-Brazil. Sci. Total. Environ. 2011, 412–413, 66–76. [Google Scholar] [CrossRef] [PubMed]
  31. Romeu, J.; Genesca, M.; Pamies, T.; Jimenez, S. Street categorization for the estimation of day levels using short-term measurements. Appl. Acoust. 2011, 72, 569–577. [Google Scholar] [CrossRef]
  32. Zannin, P.H.T.; Engel, M.S.; Fiedler, P.E.K.; Bunn, F. Characterization of environmental noise based on noise measurements, noise mapping and interviews: A case study at a university campus in Brazil. Cities 2013, 31, 317–327. [Google Scholar] [CrossRef]
  33. Fiedler, P.E.K.; Zannin, P.H.T. Evaluation of noise pollution in urban traffic hubs-noise maps and measurements. Environ. Impact Assess. Rev. 2015, 51, 1–9. [Google Scholar] [CrossRef]
  34. Quality Standard of Acoustic Environment; Technical Report GB3096-2008; Ministry of Environmental Protection of the People’s Republic of China: Beijing, China, 2008.
  35. King, E.; Rice, H. The development of a practical framework for strategic noise mapping. Appl. Acoust. 2009, 70, 1116–1127. [Google Scholar] [CrossRef]
  36. Technical Specification for Acoustic Environment Quality Evaluation; Technical Report; Ministry of Environmental Protection of the People’s Republic of China: Beijing, China, 2010.
Figure 1. Technical route of the urban traffic noise map construction process.
Sustainability 14 04465 g001
Figure 2. (a) Incomplete outline map of Panyu District from OpenStreetMap [19]. (b) Complete outline map of Panyu District with the information provided by satellite map from Amap [20].
Sustainability 14 04465 g002
Figure 3. Noise map of small area of Guangzhou University. (a) Before simplification (b) after simplification.
Sustainability 14 04465 g003
Figure 4. Comparison between the results of before and after building simplification.
Sustainability 14 04465 g004
Figure 5. Example of buildings in Panyu District. (a) Before simplification (b) after simplification.
Sustainability 14 04465 g005
Figure 6. Noise map of Guangzhou University Town with different building heights. (a) 4 m (b) 21 m.
Sustainability 14 04465 g006
Figure 7. Area division of building height.
Sustainability 14 04465 g007
Figure 8. Comparison between 3 × 3 m and 10 × 10 m grids simulation results.
Sustainability 14 04465 g008
Figure 9. Sixty-five field measurement points in Panyu District of Guangzhou City.
Sustainability 14 04465 g009
Figure 10. (a) Measurement of road traffic noise. (b) Measurement of vehicle speed.
Sustainability 14 04465 g010
Figure 11. Day urban traffic noise map of Panyu District, Guangzhou City. L d a y is the A-weighted equivalent noise level over the 16 h day period (6:00 to 22:00). X 1 and X 2 represent the minimum and maximum noise levels of the particular functional area in day (see Table 10), respectively. For example, N 1 is the minimum noise level in the day of the nature conservation area.
Sustainability 14 04465 g011
Figure 12. Night urban traffic noise map of Panyu District, Guangzhou City. L n i g h t is the A-weighted equivalent noise level over the 8 h night period (22:00 to 6:00). X 1 and X 2 represent the minimum and maximum noise levels of the particular functional area in night (see Table 10), respectively. For example, N 1 is the minimum noise level in the night of the nature conservation area.
Sustainability 14 04465 g012
Figure 13. Day–night urban traffic noise map of Panyu District, Guangzhou City. L d n is the A-weighted equivalent noise level over a 24 h period.
Sustainability 14 04465 g013
Figure 14. Area covered by different noise quality levels in Panyu District of Guangzhou City. (a) Day and (b) night.
Sustainability 14 04465 g014
Figure 15. Day noise level compliance map in Panyu District of Guangzhou City.
Sustainability 14 04465 g015
Figure 16. Night noise level compliance map in Panyu District of Guangzhou City.
Sustainability 14 04465 g016
Figure 17. Average hourly traffic flow of different road types in Panyu District of Guangzhou City. (a) Day and (b) night.
Sustainability 14 04465 g017
Table 1. Comparison between simulation results and measurement results (all units in dBA). Error 1 and Error 2 are the errors for 4 m and 21 m building heights, respectively.
Location4 m21 mMeasurementError 1 Error 2
170.270.168.41.81.7
258.056.853.94.12.9
360.459.957.43.02.5
466.164.062.93.21.1
563.962.962.51.40.4
664.964.462.22.72.2
Table 2. The number and speed of trains running in the day and night in Guangzhou South Railway Station.
TypeNumber day Number night Speed day (km/h)Speed night (km/h)
G-series high-speed train27722219204
D-series high-speed Train21917173165
Inter-city rail service10812124123
Table 3. The number and speed of trains running in day and night for Guangzhou Metro Line 4.
TimingNumberSpeed (km/h)
Day31690
Night3790
Table 4. The number of measurement points, the distance between measurement points and the number of measuring roads of different road types.
TypeNumber of PointsDistance (km)Number of Roads
Expressway4102
Highway3102
Arterial road1459
Sub-arterial road23224
Access road21121
Table 5. Average speeds of car and truck at measurement point 1 (only data at point 1 is shown for brevity).
TypeSpeed day (km/h)Speed night (km/h)
Car4746
Truck4542
Table 6. Hourly traffic flow and vehicle type ratio. Only point 1 is shown for brevity. n is the number of the particular vehicle type.
TypeTraffic Flow day (n/h)Traffic Flow night (n/h)
Small car756 (81.81%)258 (72.88%)
Mid-size car42 (4.55%)0 (0%)
Large car126 (13.64%)96 (27.12%)
Table 7. The average heights of expressways, highways, etc., from ground in Panyu District of Guangzhou City.
Road/RailwayAverage Height (m)
Guangzhou-Taishan Expressway15.6
Guangzhou-Macao Expressway13.7
Guangzhou-Longchuan Expressway12.2
Dongsha-Xinlian Expressway8.5
Nansha Harbour Highway25.1
Xinguang Highway17.5
Xinhua Highway23.3
South China Highway12.6
Guangzhou Metro Line 4 (ground section)8.5
High-speed railway25.7
Table 8. Area, coverage and noise limit of acoustic environment functional areas in Panyu District of Guangzhou City [25].
ClassCoverageArea (km 2 )Limit day (dBA)Limit night (dBA)
1Nature conservation area, cultural education area, administrative area and medical service area69.55545
2Residential area and Trade area331.56050
3Warehouse & logistics area and industry area49.16555
4a, 4bAreas on both side of traffic artery79.87055, 60
Table 9. Minimum and maximum noise levels of Panyu District in Guangzhou City.
Noise indicatorMinimum (dBA)Maximum (dBA)
L d a y 39.985.3
L n i g h t 39.478.1
L d n 42.589.1
Table 10. Minimum and maximum noise levels of different functional areas in Panyu District of Guangzhou City (all units in dBA). 1 and 2 refer to minimum and maximum noise levels, respectively.
Functional Area L day 1 L night 1 L day 2 L night 2
Nature conservation area42.842.163.263.1
Residential area43.443.170.569.1
Cultural education area44.744.268.868.5
Administrative area53.052.663.262.6
Medical service area48.748.363.462.5
Trade area45.944.167.066.3
Industry area44.843.871.070.6
Warehousing area54.354.568.467.8
Table 11. Noise level compliance rate of various acoustic environment functional areas in Panyu District of Guangzhou City.
ClassDay (km 2 )Night (km 2 )
149.0 (70.50%)4.7 (6.76%)
2215.9 (65.13%)64.9 (19.58%)
334.9 (71.08%)12.0 (24.44%)
426.7 (33.46%)5.7 (7.14%)
Total326.5 (61.62%)87.2 (16.46%)
Table 12. The average error (E A ) between the measurement and simulation results of different road types in Panyu District of Guangzhou City. All units in dBA.
TypeNumber of Measurement PointE Aday E Anight E A
Expressway42.02.22.1
Highway31.11.41.3
Arterial road141.00.90.9
Sub-arterial road231.11.51.3
Access road211.62.31.9
Overall651.31.71.5
Table 13. The average hourly traffic flow (n/h) of different vehicle types that measured in Panyu District of Guangzhou City. σ is the standard deviation.
TimingTypeAverage  ± σ MinimumMaximum
DaySmall car712 ± 913374050
Mid-size car39 ± 530216
Large car48 ± 740378
NightSmall car682 ± 912363930
Mid-size car37 ± 560216
Large car45 ± 690342
Publisher’s Note: MDPI stays neutral with regard to jurisdictional claims in published maps and institutional affiliations.

