Article

Performance of Alkali-Activated Self-Compacting Concrete with Incorporation of Nanosilica and Metakaolin

by
Alaa Mohammedameen
1,2
1
Department of Highways and Bridges, Duhok Polytechnic University, Duhok 42002, Iraq
2
Department of Civil Engineering, Nawroz University, Duhok P.O. Box 77, Iraq
Sustainability 2022, 14(11), 6572; https://doi.org/10.3390/su14116572
Submission received: 28 April 2022 / Revised: 23 May 2022 / Accepted: 24 May 2022 / Published: 27 May 2022
(This article belongs to the Special Issue Towards Advanced Sustainable Recycled Materials and Technology)

Abstract

:
This study aims to analyze the influence of nano-silica (NS) and metakaolin (MK) as binder replacement materials on the fresh and hardened performance of alkali-activated self-compacting concretes (A-ASCC). Therefore, nine A-ASCC mixes with and without metakaolin were prepared, as well as mixes with and without NS inclusion. Slump flow, v-funnel, L-box, and T50 value tests were used to investigate the fresh properties of A-ASCC. While the hardened performance was examined using compressive strength, bonding strength (pullout test), fracture toughness and flexural tensile strength tests. A relationship analysis was also conducted on the A-ASCC experimental data. The experimental results showed that the addition of NS and MK had a negative influence on the fresh characteristics of fly ash-based A-ASCC mixtures, while the addition of metakaolin had a higher effect. The addition of 1% and 2% NS, on the other hand, significantly enhanced the mechanical performance of the A-ASCC specimens. The use of more than 2% of NS had a negative influence on the mechanical properties of A-ASCC. The mechanical properties of A-ASCC were improved significantly by metakaolin replacement ratios. The A-ASCC bond strength showed the highest improvement. Furthermore, using NS and/or MK significantly increased the A-ASCC setting time and may be used to produce A-ASCC at ambient environment.

1. Introduction

One of the most serious environmental issues today is the disposal of industrial waste products. Some industrial wastes, such as ground granulated blast furnace GGBS (GGBS), silica fume, and fly ash (FA), can be recycled using the applications of concrete technology. For many decades, several investigators have utilized industrial minerals waste as a cement substitute material. However, because of the decarbonization of limestone and the use of fossil fuels, the cement manufacturing process discharges a substantial amount of greenhouse gases (CO2, etc.) into the environment. Furthermore, ordinary Portland cement is well-known as the most energy-intensive material, behind only steel and aluminum in terms of energy consumption [1,2]. As a result, the large amount of energy required, as well as the harmful effect of CO2 on the environment, are significant concerns for both humanity’s future and the cement industry. As a result, instead of using regular Portland cement, new environmentally sustainable materials should be used to overcome environmental concerns [3,4]. Nowadays, more innovative and sustainable concrete has been developed as a replacement for conventional Portland cement concrete [5,6]. Alkali-activated concretes (AAC) have received substantial attention because of their ability to significantly reduce both the demand for natural resources and the quantity of carbon dioxide emitted. Furthermore, AAC is used to develop improved building materials by utilizing a by-product alumino–silicate composition [7,8]. Alkali-activated concrete, in addition to its environmental friendliness compared to conventional Portland cement concrete, exhibits high early strength, good resistance to acid and sulfate attacks, low creep, and low shrinkage [7,9].
Self-compacting concrete (SCC) is a novel form of concrete that can be easily compacted into deep and narrow sections with heavy reinforcing without any internal or external mechanical vibration [10]. In addition, one of the most important goals in SCC practice is the ability to achieve homogeneity without losing stability, as well as resistance to segregation. Since the 1990s, researchers have been focusing on the fresh and hardened characteristics of SCC, when it was utilized in the structure industry [11,12,13]. It has been reported that a powder (binder) dosage of 500–600 kg/m3 is necessary to fulfill the requirement of SCC [14]. Furthermore, excessive cement use is uneconomical, especially when environmental factors are considered. By-product cementitious materials or mineral fillers such as FA, silica fume, and GGBS among others, have been used as alternative sustainable powder materials. These compounds are used in concrete to increase workability and flowability, minimize costs, and improve mechanical performance [15,16,17,18]. FA and GGBS have a favorable effect on the mechanical properties of concrete, as well as the economics and environmental friendliness of the materials [19,20,21]. Although there has been much research on SCC, there have been few or limited investigations on A-ASCC. Further study, similar to that of SCC, is required to specify the hardened and fresh characteristics of A-ASCC.
Recently, investigators have shown that the use of nano-silica (NS) can enhance the properties of concrete, based on current developments in nanotechnology [22,23,24,25]. The concrete’s quality is significantly influenced by the characteristics of the transition zone (TZ) between the cement paste and the aggregate. Many studies found that the densified microstructure and hydrated phases (C–S–H) improved by the inclusion of NS through the anti-Ca(OH)2 leaching and nano-fillers improved cement paste because of the high pozzolanic characteristics of NS [25,26]. Furthermore, the use of nano-silica enhanced and lowered the total permeability of hardened concrete, improving its overall qualities (mechanical and durability characteristics) [23,27,28,29,30]. Researchers studied the effect of NS on the performance of AAC and/or A-ASCC; however, NS was used as one or two ratios with a combined binder ratio [31,32]. Another researcher examined the influence of NS on the shrinkage and durability of alkali-activated mortar; it was noted that the addition of NS improved the shrinkage and durability performance [33,34]. Furthermore, the inclusion of NS increased the chemical durability of fly ash-based AAC [25]. Adak et al. [35] found that adding 6% NS to AAC improved the compressive strength of fly-ash-based GPC. Furthermore, Gao et al. [36] found that NS increased the compressive strength of GGBS-based AAC.
Despite extensive research on alkali-activated concrete (AAC) as a building material, most studies have been on FA-based AAC [37,38,39], GGBS [40,41], rice-husk ash (RHA) [42,43], or meta-kaolin (MK) [44,45]. The mortar/paste experiments on MK-based AAC were performed to investigate the interface between the alkaline solutions and the polymerization process [46,47,48,49] considering the influence of curing techniques on mechanical characteristics such as temperature and/or time [50,51,52,53]. The effects of the alkaline solution ratio on the properties (flexural tensile strength, compressive strength, electrical resistivity, and water absorption) of MK-based AAC with polypropylene fiber additions at 0.3%, 0.5% and 1% have been investigated [54]. The fracture characteristics of MK-based AAC mixed with a range of source materials were investigated by Pires et al. [55]. Pouhet and Cyr investigated the workability, compressive strength, porosity, and density of MK-based AAC as a function of the molar ratio (H2O/Na2O) (14.5, 17, and 20) and three types of aggregate with two proportions; the compressive strength of AAC was found to be strongly dependent on the water content of the mixture, considerably much more than the compressive strength of standard Portland cement concrete. This indicates that a given increase in water content (e.g., 0.40 to 0.55) will have a greater impact on a geopolymer concrete (65 to 20 MPa) than on Portland cement concrete (62 to 40 MPa) [56]. Xie et al. [57] investigated the influence of GGBS and MK proportions, as well as recycled aggregate content, on fresh properties, Poisson’s ratio, compressive strength, and toughness of GGBS-MK based AAC. A researcher studied the freeze–thaw performance of MK-based AAC mixes with aluminate silicate cement and/or GGBS [58]. The effect of heating rate, concrete strength, temperature level, and moisture content on spalling probable at high temperatures in AAC mixes produced from an MK/FA composition have also been investigated [59].
Although several studies on SCC have been conducted, there have been few or limited investigations on the hardened and fresh properties of A-ASCC. As a result, this research aims to clarify the effect of nano-silica and metakaolin on the fresh, bond strength, and mechanical properties of FA-based A-ASCC. As a result, two series of A-ASCC mixtures were developed: with metakaolin but no nano-silica and with nano-silica but no metakaolin. FA was replaced with NS by weight at a rate of 0%, 1%, 2%, 3% and 4%, respectively. Nine SCAAC mixes were produced, each with a total binder of 500 kg/m3 and a constant alkaline/binder ratio of 0.50. The workability and flowability of A-ASCC mixes were evaluated through the L-box ratio, v-funnel, slump flow, and T50 time tests. The compressive strength, bonding strength, flexural tensile strength, and fracture toughness of A-ASCC mixtures were determined while investigating their mechanical properties. All experimental test results were statistically evaluated, and a correlation connection analysis was shown to establish the significant effect of nano-silica and/or metakaolin on A-ASCC characteristics.

2. Experimental Procedure
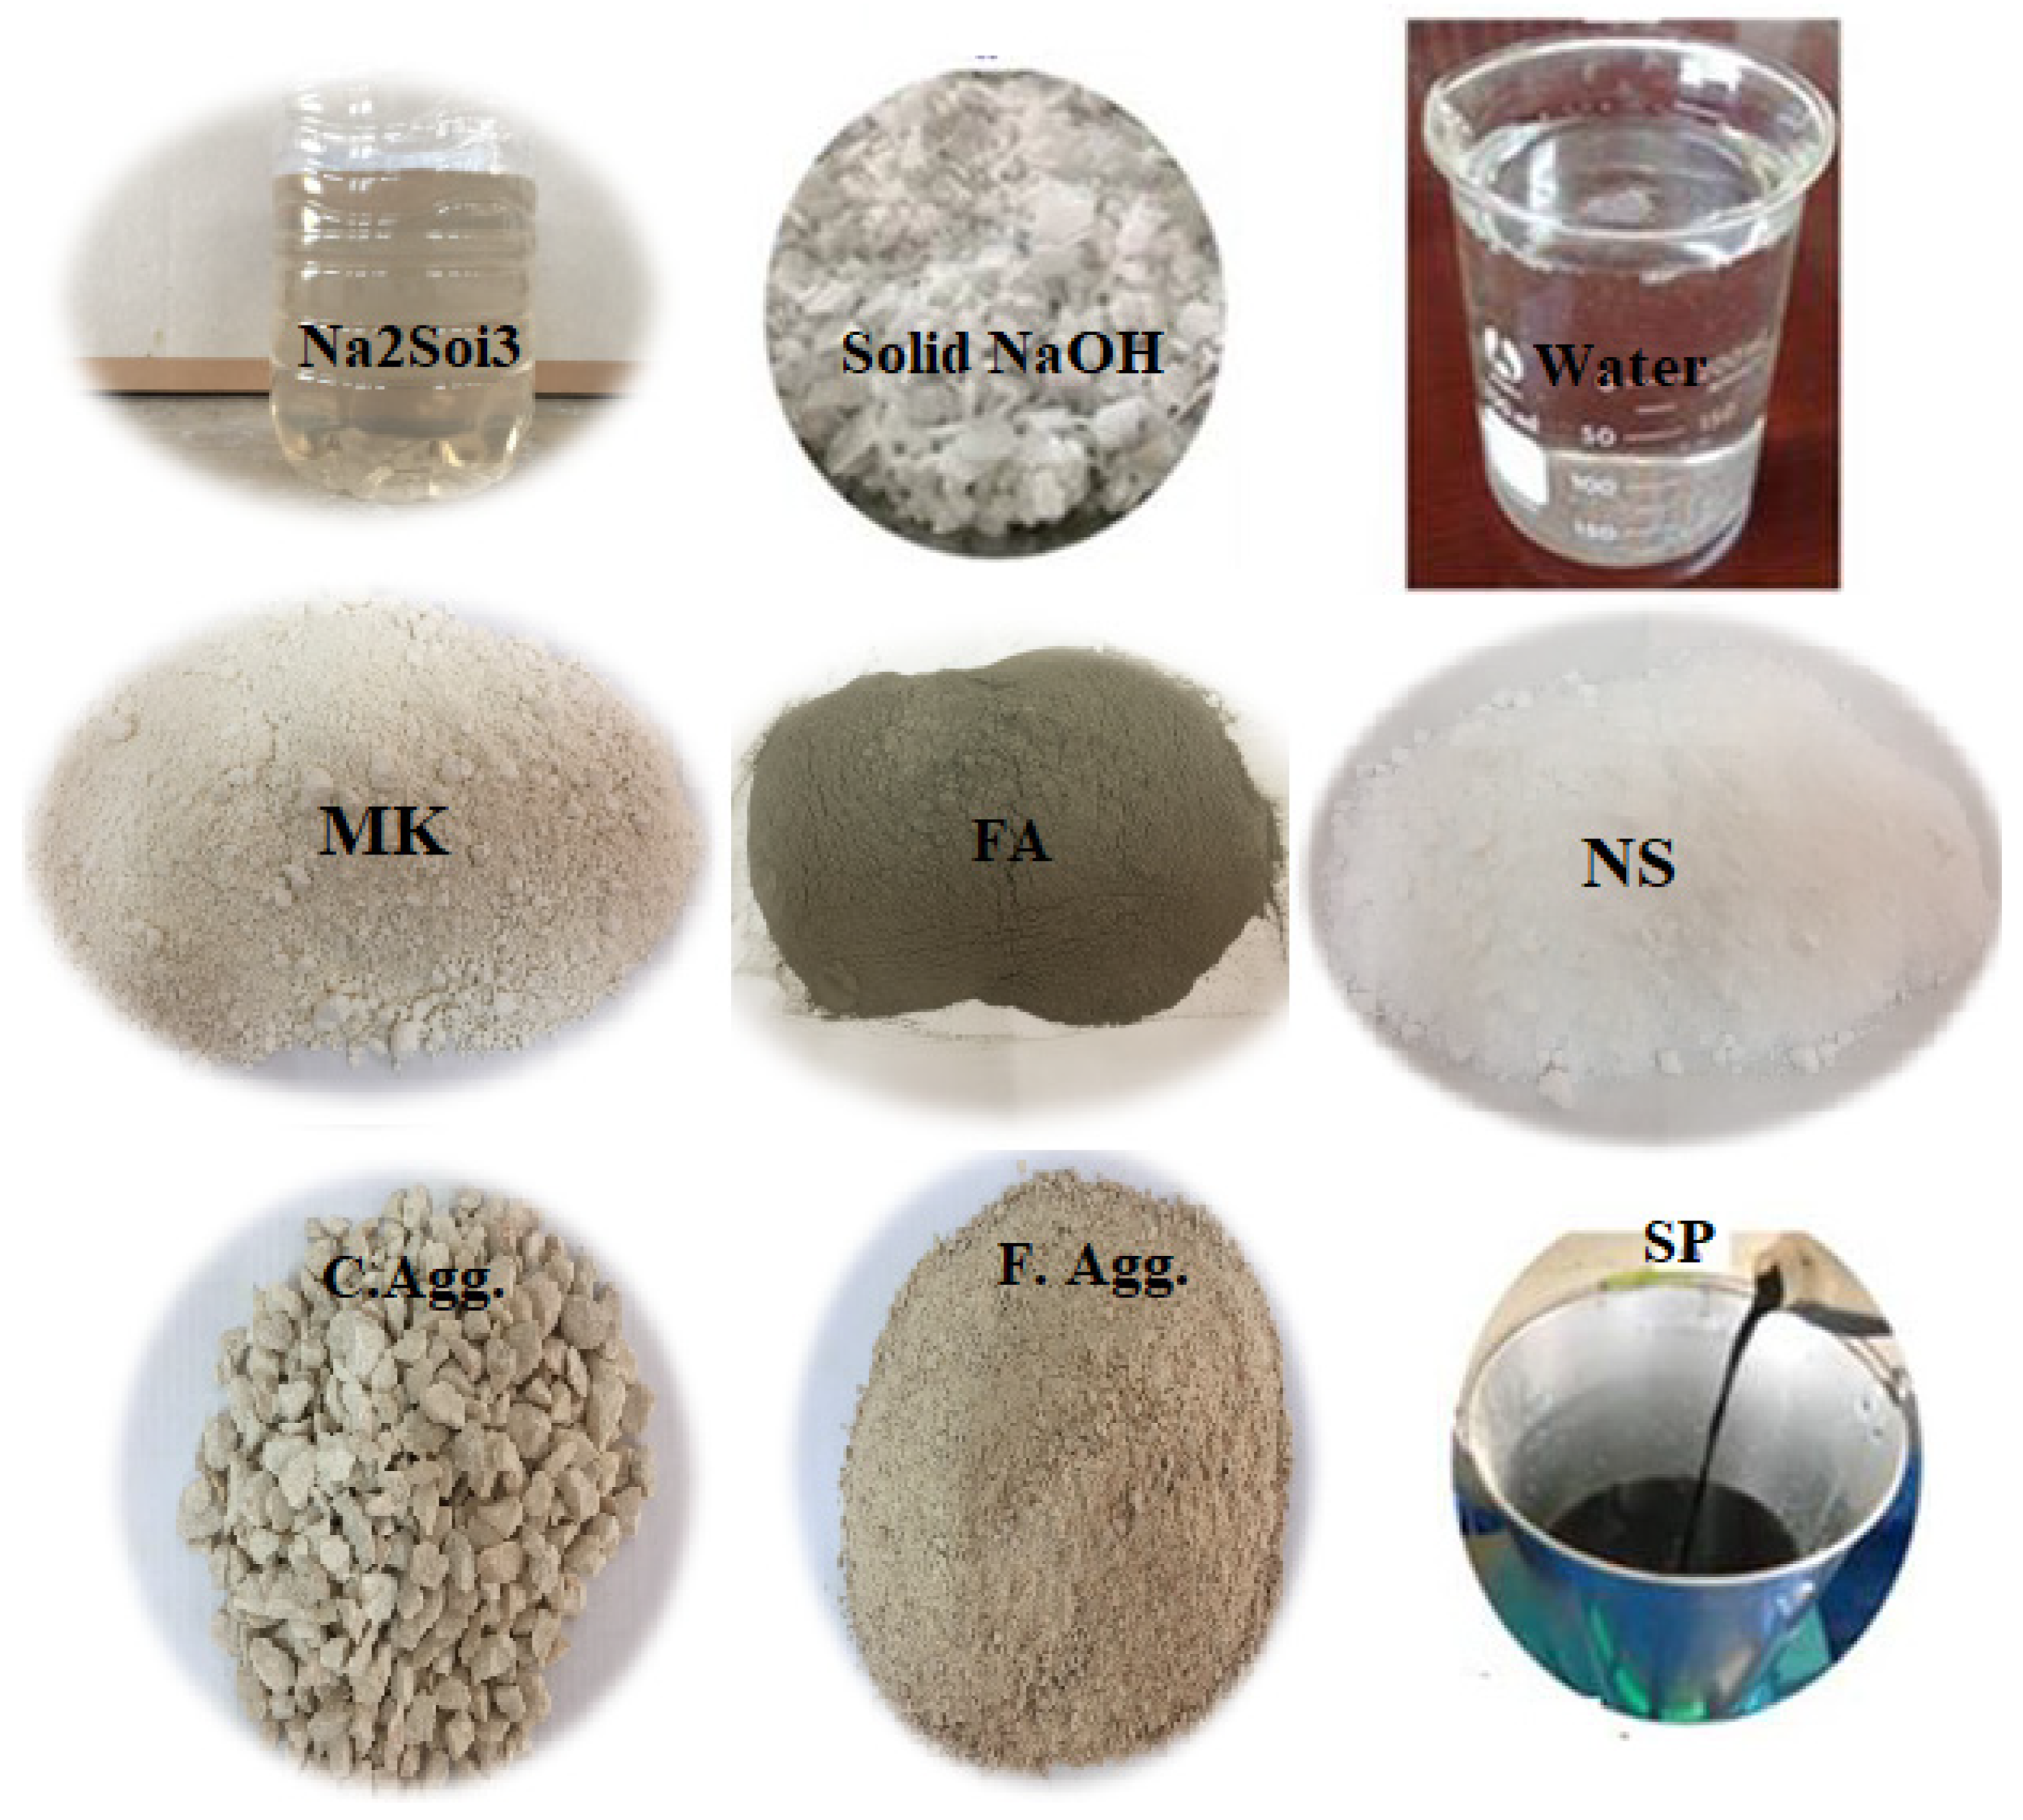
2.1. Materials

Nano-silica (NS), metakaolin (MK), and fly ash were used to produce the A-ASCCs mixtures. NS, MK, and FA have specific surface areas of 15,000, 18,000, and 379 m2/kg, respectively, and specific gravity values of 2.20, 2.54, and 2.27. The pH of NS in a 4% dispersion varied from 3.7 to 4.7, and the particle size was 14 nm. The FA was supplied by thermal power plant placed in Mediterranean area of Turkey. Nano-silica was obtained from Norway. The metakaolin used in this study is a white powder with a whiteness value of 87 according to Dr. Lange. The MK originated in the Czech Republic. Table 1 illustrates the chemical compositions and physical properties of the NS, MK, and FA. To achieve the desired workability and flowability, a commercially available Master Glenium 51-based superplasticizer (SP) with specific gravity 1.07 kg/m3 was used. The crushed limestone fine and coarse aggregates were obtained from the same source. Table 2 shows aggregate physical characteristics as well as sieve analysis. The alkali activator utilized in the production of A-ASCC was a mix of NaOH solutions and Na2SiO3. The component ratio of Na2SiO3 was found to be commercially available (water: 55.9%, SiO2: 29.4%, and Na2O: 13.7%, by mass). The NaOH purity ranged between 97 and 98%. In the current investigation, the molarity of NaOH was defined as 12 M, which has been recommended by numerous studies to achieve optimum mechanical and durability performance for A-ASCC [60]. Figure 1 presents the materials used to produce the A-ASCC mixtures.

2.2. Mix Proportions

Two series of A-ASCC mixes were prepared using a constant 100% FA binder with (1, 2, 3, 4%) nano-silica and (5, 10, 15, 20%) MK replacement ratio by weight of FA. The total binder content is 500 kg/m3. Table 3 shows the quantity of each component of A-ASCCs mixes (weight/m3 concrete). For mixture designations, NS represents nano-silica, the number next to NS (0-4) represents the nano-silica replacement ratio, and the number in front of MK (0-5-10-15-15-20) represents the quantity of MK utilized in the production of A-ASCCs mixes.
The amount and kind of binder, the amount and ratio of alkaline, aggregates, and maximum grain size (Dmax) all have a substantial influence on the mechanical and fresh performance of A-ASCC specimens. According to prior research, the ratio of Na2SiO3/NaOH for economic reasons is suggested to be in the range of 1.5 to 2.5 [61]. As a result, in the current investigation, this ratio was designed as 2.5.
The mixing procedure was started by mixing the binder materials and the aggregates in dry condition for 2.5 min. After 1 min, the alkali activator, extra water, and SP were slowly added to the dry mix and mixed for another 2.0 min. The mixture was then mixed for a further 3.0 min to ensure uniformity and homogeneity of A-ASCCs mixes.

2.3. The Fresh Properties Tests of A-ASCCs

The test apparatus sketching to achieve the fresh characteristics of A-ASCC is indicated by the L-box height ratio, v-funnel flow time, T50 slump flow duration, and slump flow diameter shown in Figure 2. All fresh properties’ testing was performed in agreement with the Europe standard EFNARC committee for the manufacturing of conventional SCC [62]. Slump flow is a sensitive test for describing the flowability of a fresh mix in free-flow conditions. Therefore, it is proposed to be stated for all SCC mixes. T50 time is the time required for the concrete mix to flow to a set diameter of 50 cm on the flow slump table [62]. T50 provided details on bleeding, homogeneity, and segregation resistance of concrete mix, which may be obtained via T50 time measurement and/or visual observations during the test. The EFNARC divided the average slump flow into three types; these classes indicate the SCC uses. Table 4 shows the usual application regions in addition to the top and lower limitations for these classes. The A-ASCC’s viscosity is specified using the v-funnel flow duration and the T50 slump flow duration. These tests, however, cannot indicate the actual viscosity; instead, the flow rate in terms of viscosity is specified. The time assessed by the v-funnel test, which is the time elapsed almost mixed-flow via the v-funnel opening, is referred to as the time of v-funnel flow. EFNARC viscosity classifications are illustrated in Table 4 [62]. The L-box test determines the flow capacity of fresh concrete through tight openings and restricted places, such as semi-full reinforcement places, without loss of homogeneity and segregation. The L-box ratio classification is presented in Table 4.

2.4. Curing Condition of the A-ASCC Specimens

The A-ASCC specimens were covered with a protective sheet to keep the alkaline solution from evaporation. After the casting procedure, the specimens were placed in plastic bags to keep the alkaline solution from evaporation. As the strength improvement was found to be limited after 48 h, the specimens and molds were put in an oven at 70 °C for 48 h to start the polymerization process [7,63]. A-ASCC specimens were placed in the laboratory environment at 23 °C for 28 days after the oven-curing process. For each experimental test, a typical 3-specimens were prepared, and the average value of the corresponding investigative outcome was calculated.

2.5. The Hardened Properties Tests for A-ASCC

2.5.1. Compressive Strength

A-ASCC hardened tests were performed to assess the influence of MK and NS on the mechanical performance of A-ASCC. Cubic specimens (100 × 100 × 100 mm) created with the ASTM C39 specification were used to specify the compressive strength values of A-ASCC specimens [64].

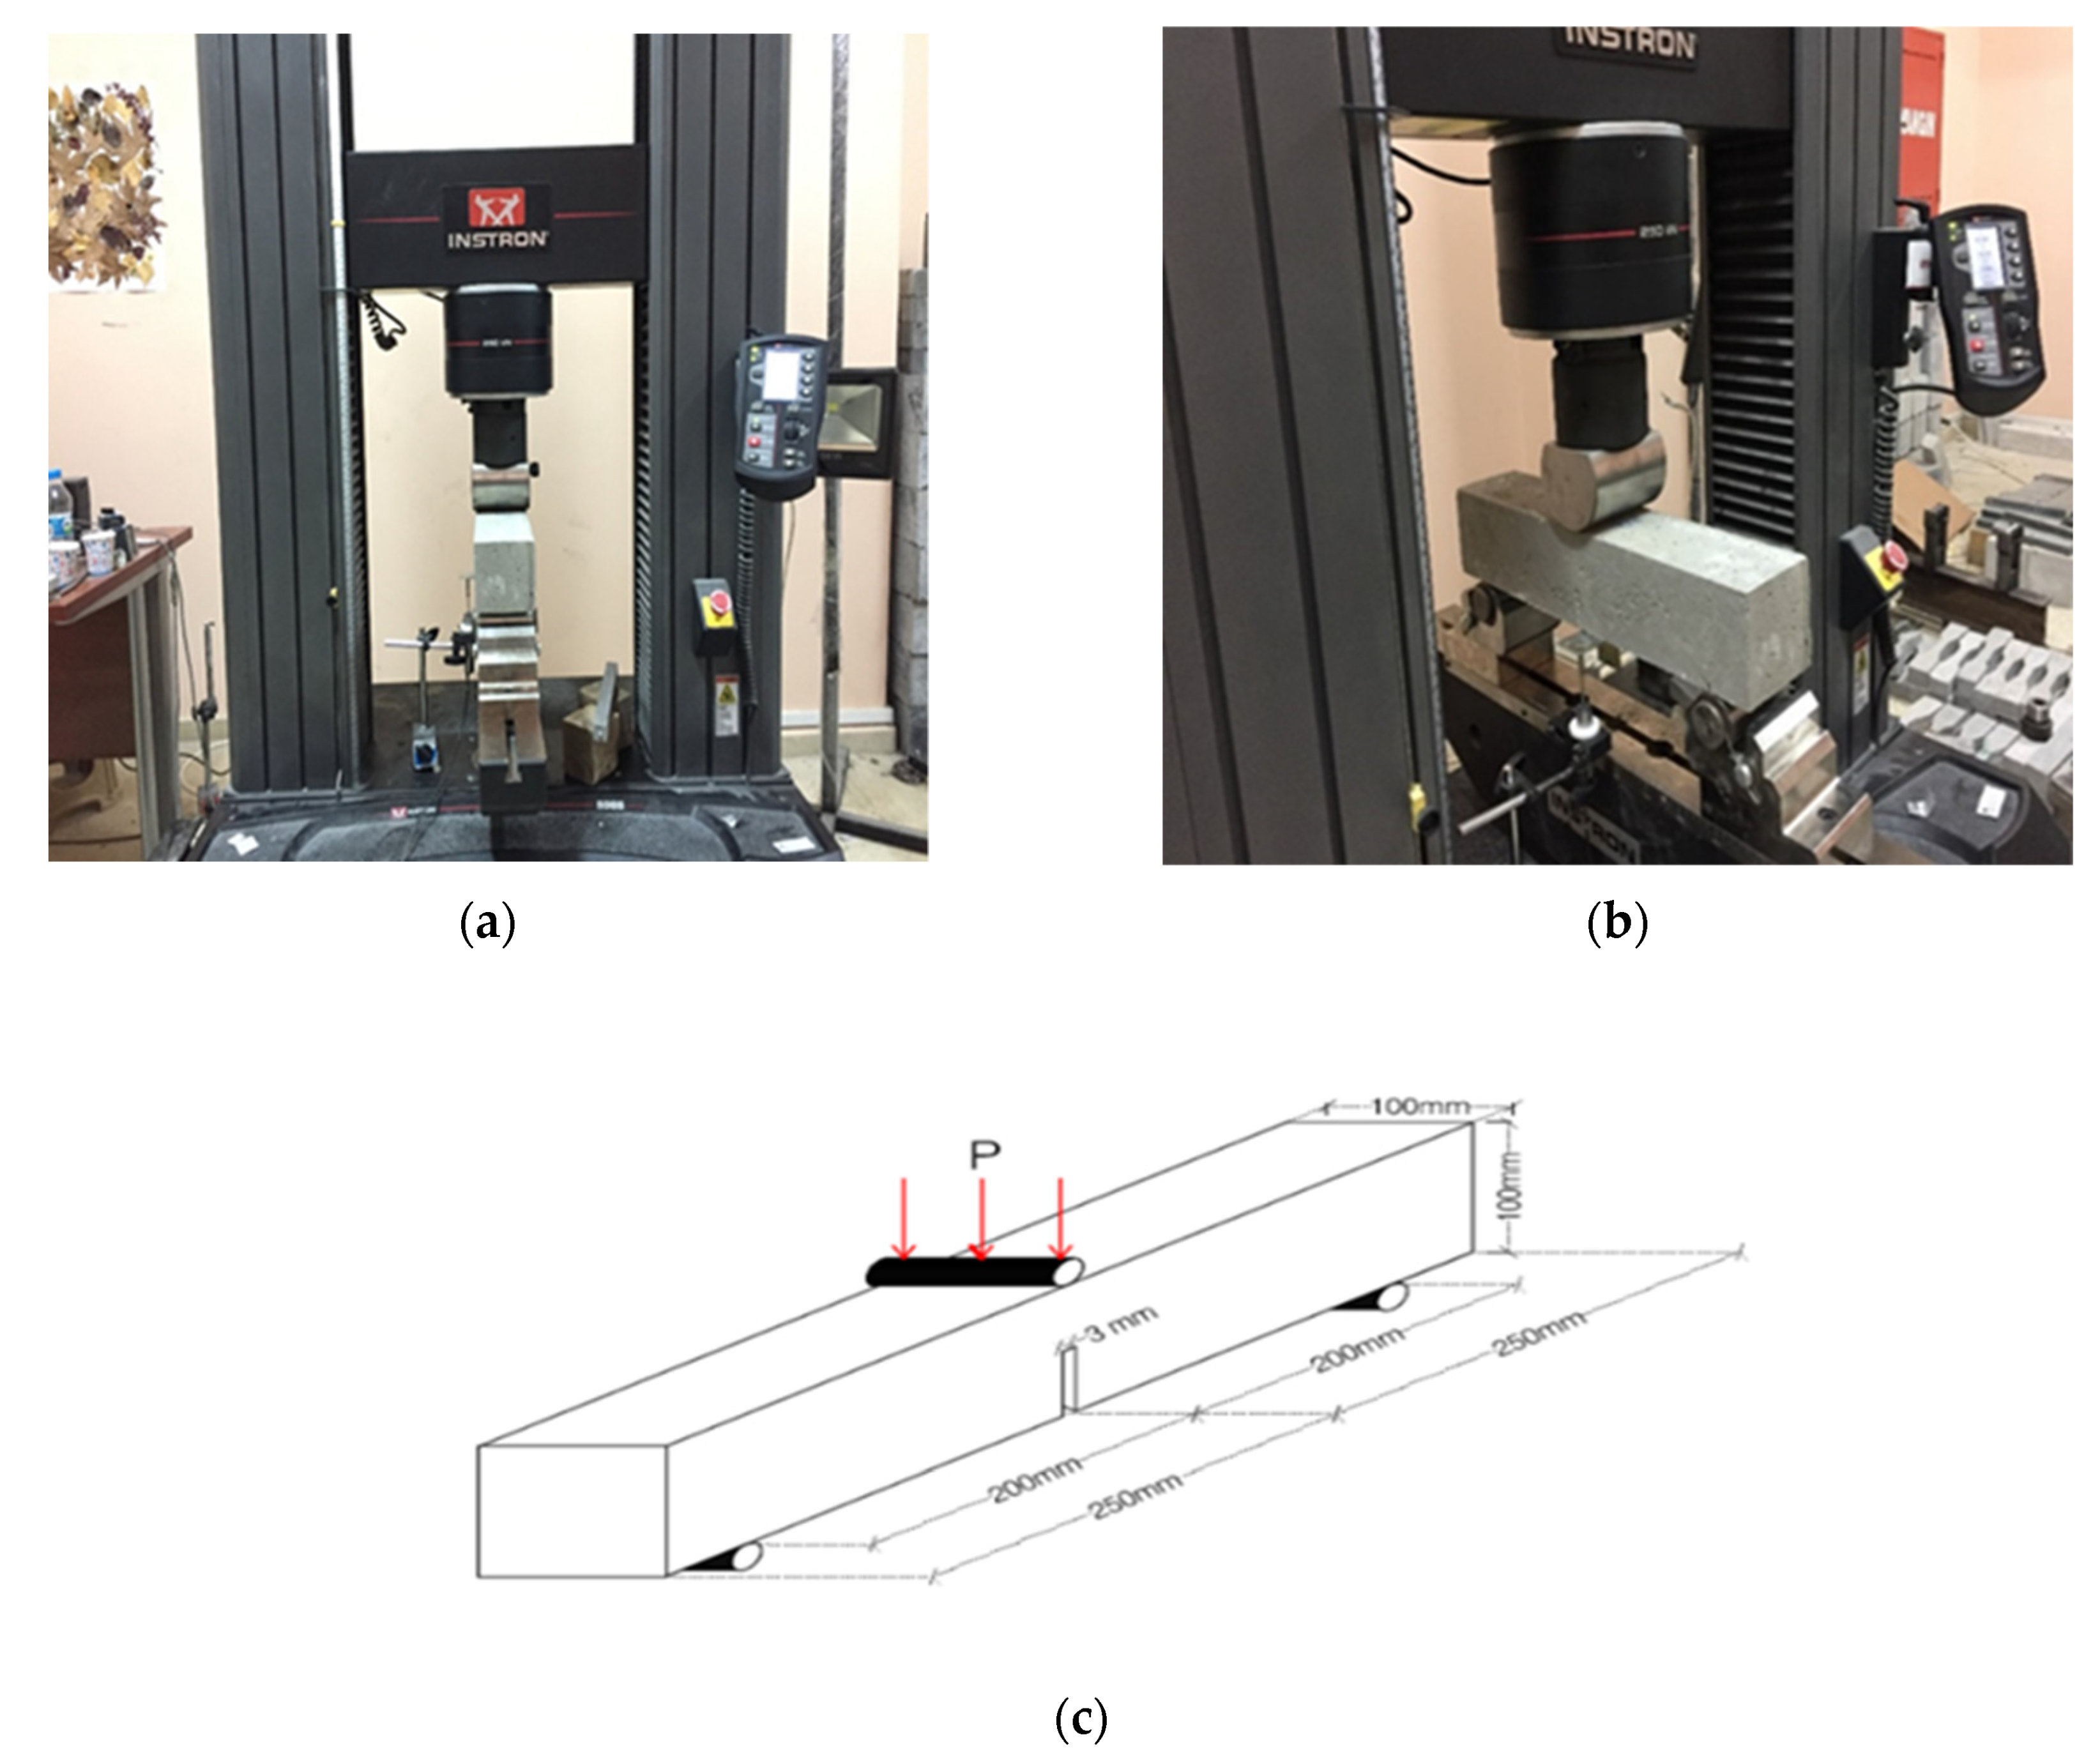
2.5.2. Flexural Tensile Strength

RILEM 50-FMC/198 Committee three-point flexural tensile strength tests were carried outon notched prismatic specimens having dimensions 100 × 100 × 500 mm [65]. The closed-loop displacement-controlled (Instron 5500R) machine was used to measure the flexural tensile strength. The deflection of the notched prismatic specimens was measured using a linear variable displacement transducer (LVDT). Notches with a width of 3 mm and a height of 40 mm were made (notch/depth: 0.4) at the specimens’ bottom mid-point. Specimens were tested under displacement control at a rate of 0.02 mm/min. The first equation was utilized to compute the flexural tensile strength of A-ASCC specimens [65].
f f l e x = 3 P max L 2 b ( d a ) 2
where L, Pmax, b, d, and a represent the span length (mm), peak load (N), specimen width (mm), specimen depth (mm), and notch depth (mm), respectively. Figure 3 illustrates the 3-point bending test setup as well as the specimens that were tested. In addition, fflex is flexural tensile strength of notched prism specimen obtained from a linear slope observed up to the first crack in the pre-peak zone, and then strain-softening was observed in the postpeak zone during bending tests.
The fracture energy (Gf) of A-ASCC prismatic specimens was computed using the RILEM formula under three-point bending stresses, as illustrated below [65]:
G f = ( w o + m g δ s ) A l i g
where Alig, δs, g, m, and wo are the area of the ligament (m2), specific displacement (m), acceleration resulting from gravity (9.81 m/s2), the mass of the beam (kg), and the area below the curve deducted by load-displacement relation (N-m), respectively.
Using the fourth equation below, the KIC (critical-stress-intensity factor) was also determined [66]:
K I C = 3 P max l 2 b d 2 a 0 ( 1.93 3.07 A + 14.53 A 2 25.11 A 3 + 25 A 4 )
where l, Pmax, b, d, a0, and A represent the span length, peak load, specimen width, specimen depth, notch depth, and notch depth to specimen depth, respectively.

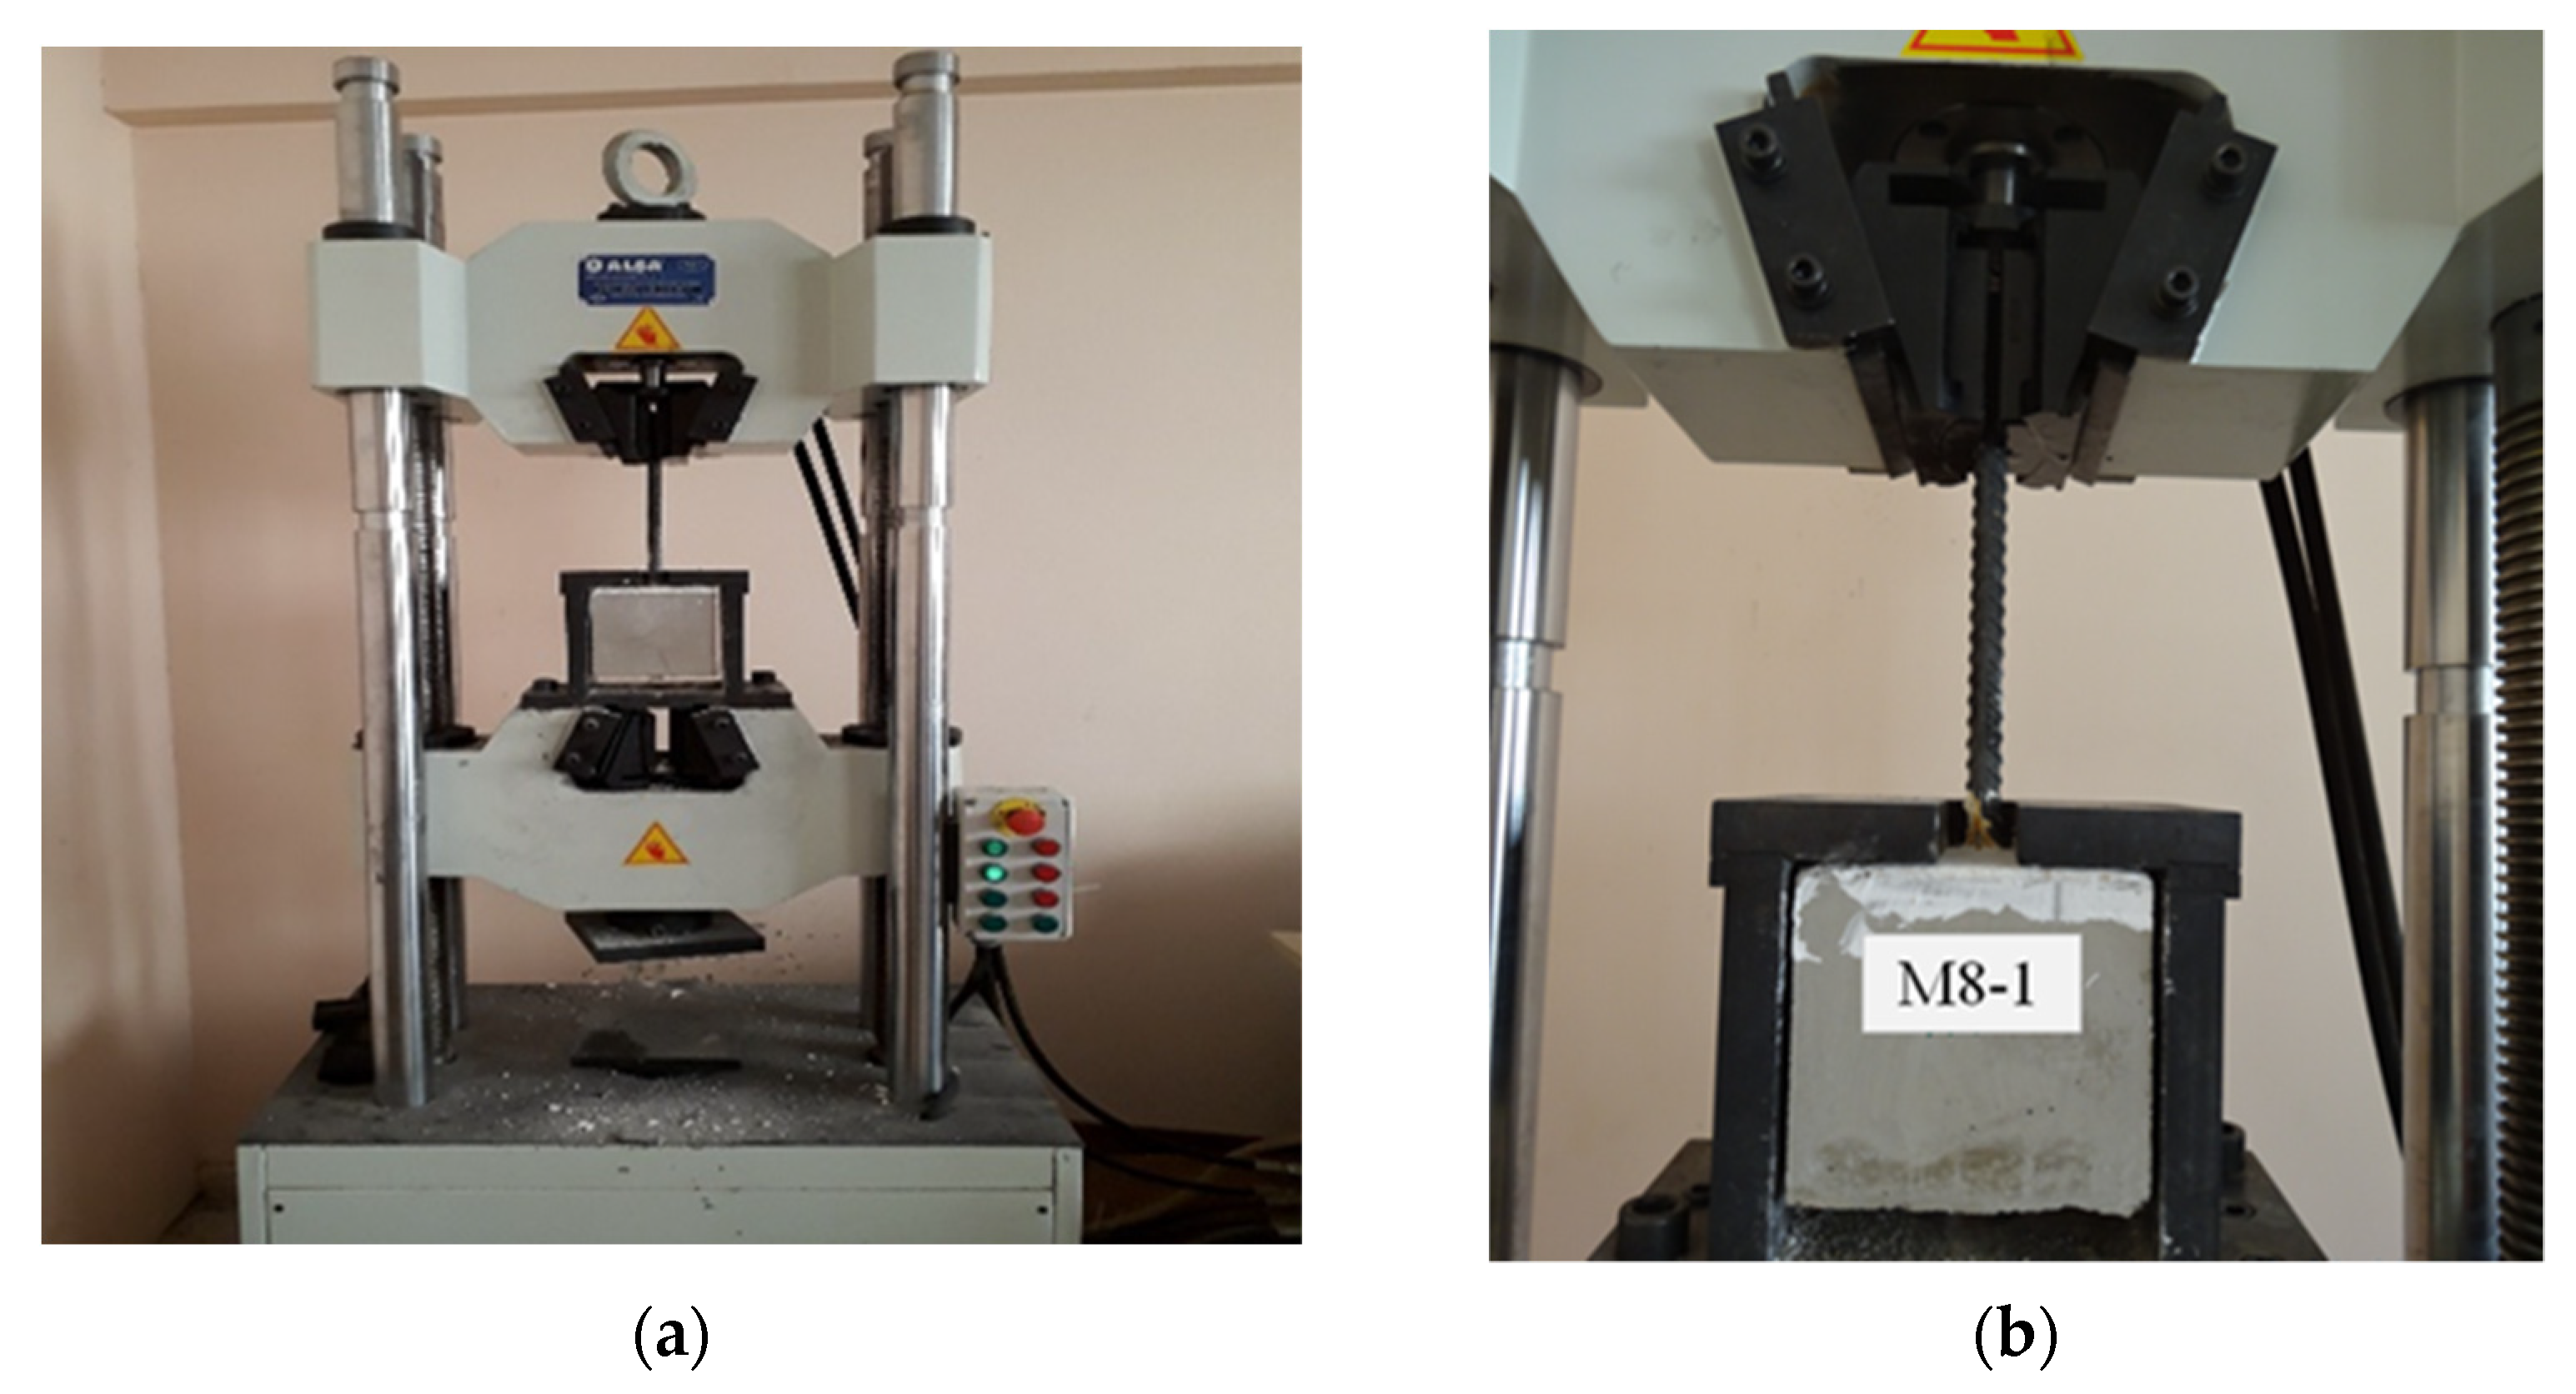
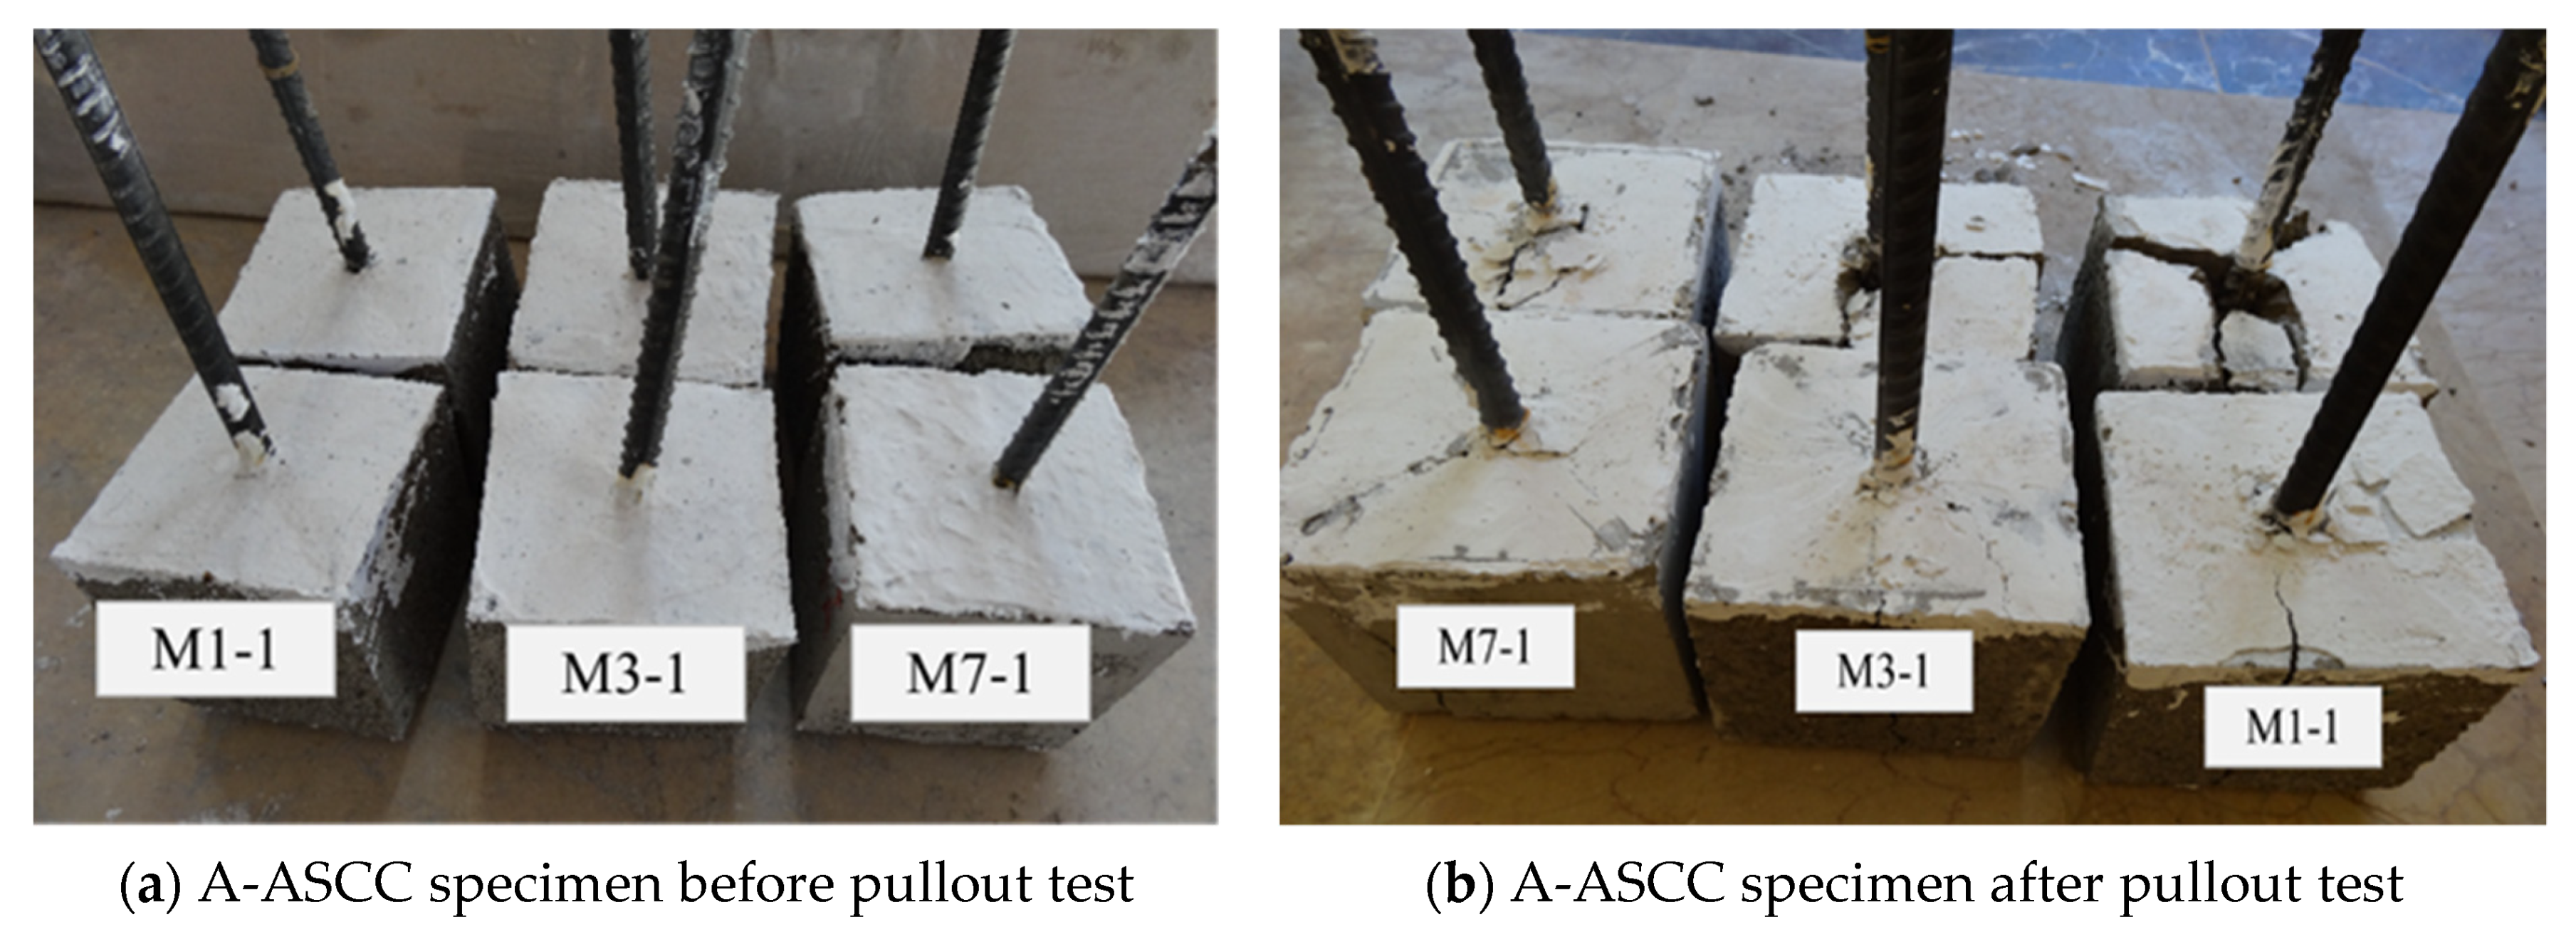
2.5.3. Pullout Test and Bond Strength of A-ASCC

RILEM RC6 was conducted to measure the strength of the bond between steel reinforcing bar and concrete [67]. The upper surface of the pullout specimens was covered with gypsum to produce a flat surface for homogenous load distribution. Figure 4 illustrates the characteristics and measurements of the pullout test specimen.
Figure 5 shows the pull-out test setup as well as the specimens tested under the pull-out test. The bonding strength of A-ASCC is estimated using the 4th equation via the tensile force divided by the surface area of the embedded steel rebar inside the concrete:
τ = F π d L
where d is the diameter (mm), F is the failure tensile load (N), and L is the embedment length (mm) of the reinforcement steel bar. L and d in this investigation are 150 mm and 16 mm, respectively.

3. Result and Discussions

3.1. The Fresh Properties of A-ASCC

The fresh properties of the A-ASCC mix results represented by flowability and passing-ability tests confirmed the EFNARC standard for SCC [62]. The slump-flow results were noted to be within the range of EFNARC values, with the minimum value being 665 mm, which is more than the lowest slump flow of 550 mm stated in the EFNARC requirement. There was no segregation or bleeding in the A-ASCC mixtures. Furthermore, the slump-flow values of A-ASCC matched those stated in the EN 12350-8 standard [68]. This standard specifies a minimum slump flow value of 600 mm, which is smaller than the current study’s minimum values. The effect of MK and NS on the fresh, flowability and passing ability of A-ASCC was studied for each fresh test characteristic separately, and the results are presented in the following sections.
On the other hand, the setting time and the hardening for all mixes were substantially decreased with the replacement of NS and/or MK. Researchers have studied the use of alkali-activated concrete in ambient environments [31,32]. It can be noted that the replacement of NS and/or MK increases the probability of the use of A-ASCC under an ambient environment. Researchers found that the surface charge in an FA particle influences the initial AAM mix setting time [69]. The early setting times of the FA-based A-ASCC containing 1%, 2%, 3% and 4% NS were 11 h, 7 h, 3 h, and 2 h, respectively. The ultimate setting times for these mixes were 18 h, 16 h, and 13 h and 10 h, respectively. Blending the fly ash with MK resulted in even greater reductions in setting time. The initial setting times of the FA-based A-ASCC containing 5%, 10%, 15%, and 20% MK were 6 h, 4 h, and 1.5 h and 0.5 h, respectively. The ultimate setting times for these mixes were 12 h, 8 h, 5 h, and 3 h, respectively.

3.1.1. Slump Flow Test

The influences of MK and NS on the slump-flow values of A-ASCC are presented in Figure 6. The presence of NS reduced the slump flow of A-ASCC mixes. The maximum slump flow value (721 mm) was deducted from the mix including FA without NS and MK. However, the addition of MK alone without NS decreased the flow values of the A-ASCC mixes from 721 mm without MK to 695 mm with 5% MK, 681 mm with 10% MK, 666 mm with 15% MK, and 654 mm with 20% MK, respectively. Moreover, the addition of NS also decreased the flow values of A-ASCC and the reduction ratio was approximately similar to the addition of MK; whereas the influence of MK was more than NS. For the mixes containing 1% NS, 2% NS, 3% NS, and 4% NS, the decrease ratio of flow values was 5%, 10%, 15%, and 20%, respectively. Furthermore, the addition of additional NS and/or MK to the A-ASCC mixture increased resistance to bleeding and segregation, and NS or MK-containing mixtures were shown to be more cohesive than non-NS or MK-containing mixtures.
Furthermore, it was shown that the results of slump flow tests for all A-ASCC mixes were in the range of SF2 in the classification of EFNARC. According to the EFNARC specifications, this class is compatible with several structural applications (slabs, beams, and columns) [62]. Meanwhile, the A-ASCC mixes in the current study are suitable for structural applications such as beams, slabs, and columns. Previous research on conventional SCC found that using NS reduced the slump-flow value when compared to the FA-mix (control mixes). This is because NS with high surface-area particles absorbed some of the mixing water and decreased the flow values. Water molecules are drawn to NS particles because of their high reactivity and higher surface area. Consequently, the free water required to improve the flowability of the mix reduces [70]. Researchers have investigated the influence of MK on the fresh and hardened characteristics of conventional SCC and revealed that SCC with MK can reach satisfactory workability [71].
Furthermore, the setting time and/or the hardening for all mixes were decreased with the increase in the replacement ratios of NS and/or MK. Researchers have studied the use of alkali-activated concrete in ambient environments [31,32]. The addition of NS and/or MK increases the probability of the use of A-ASCC under an ambient environment.

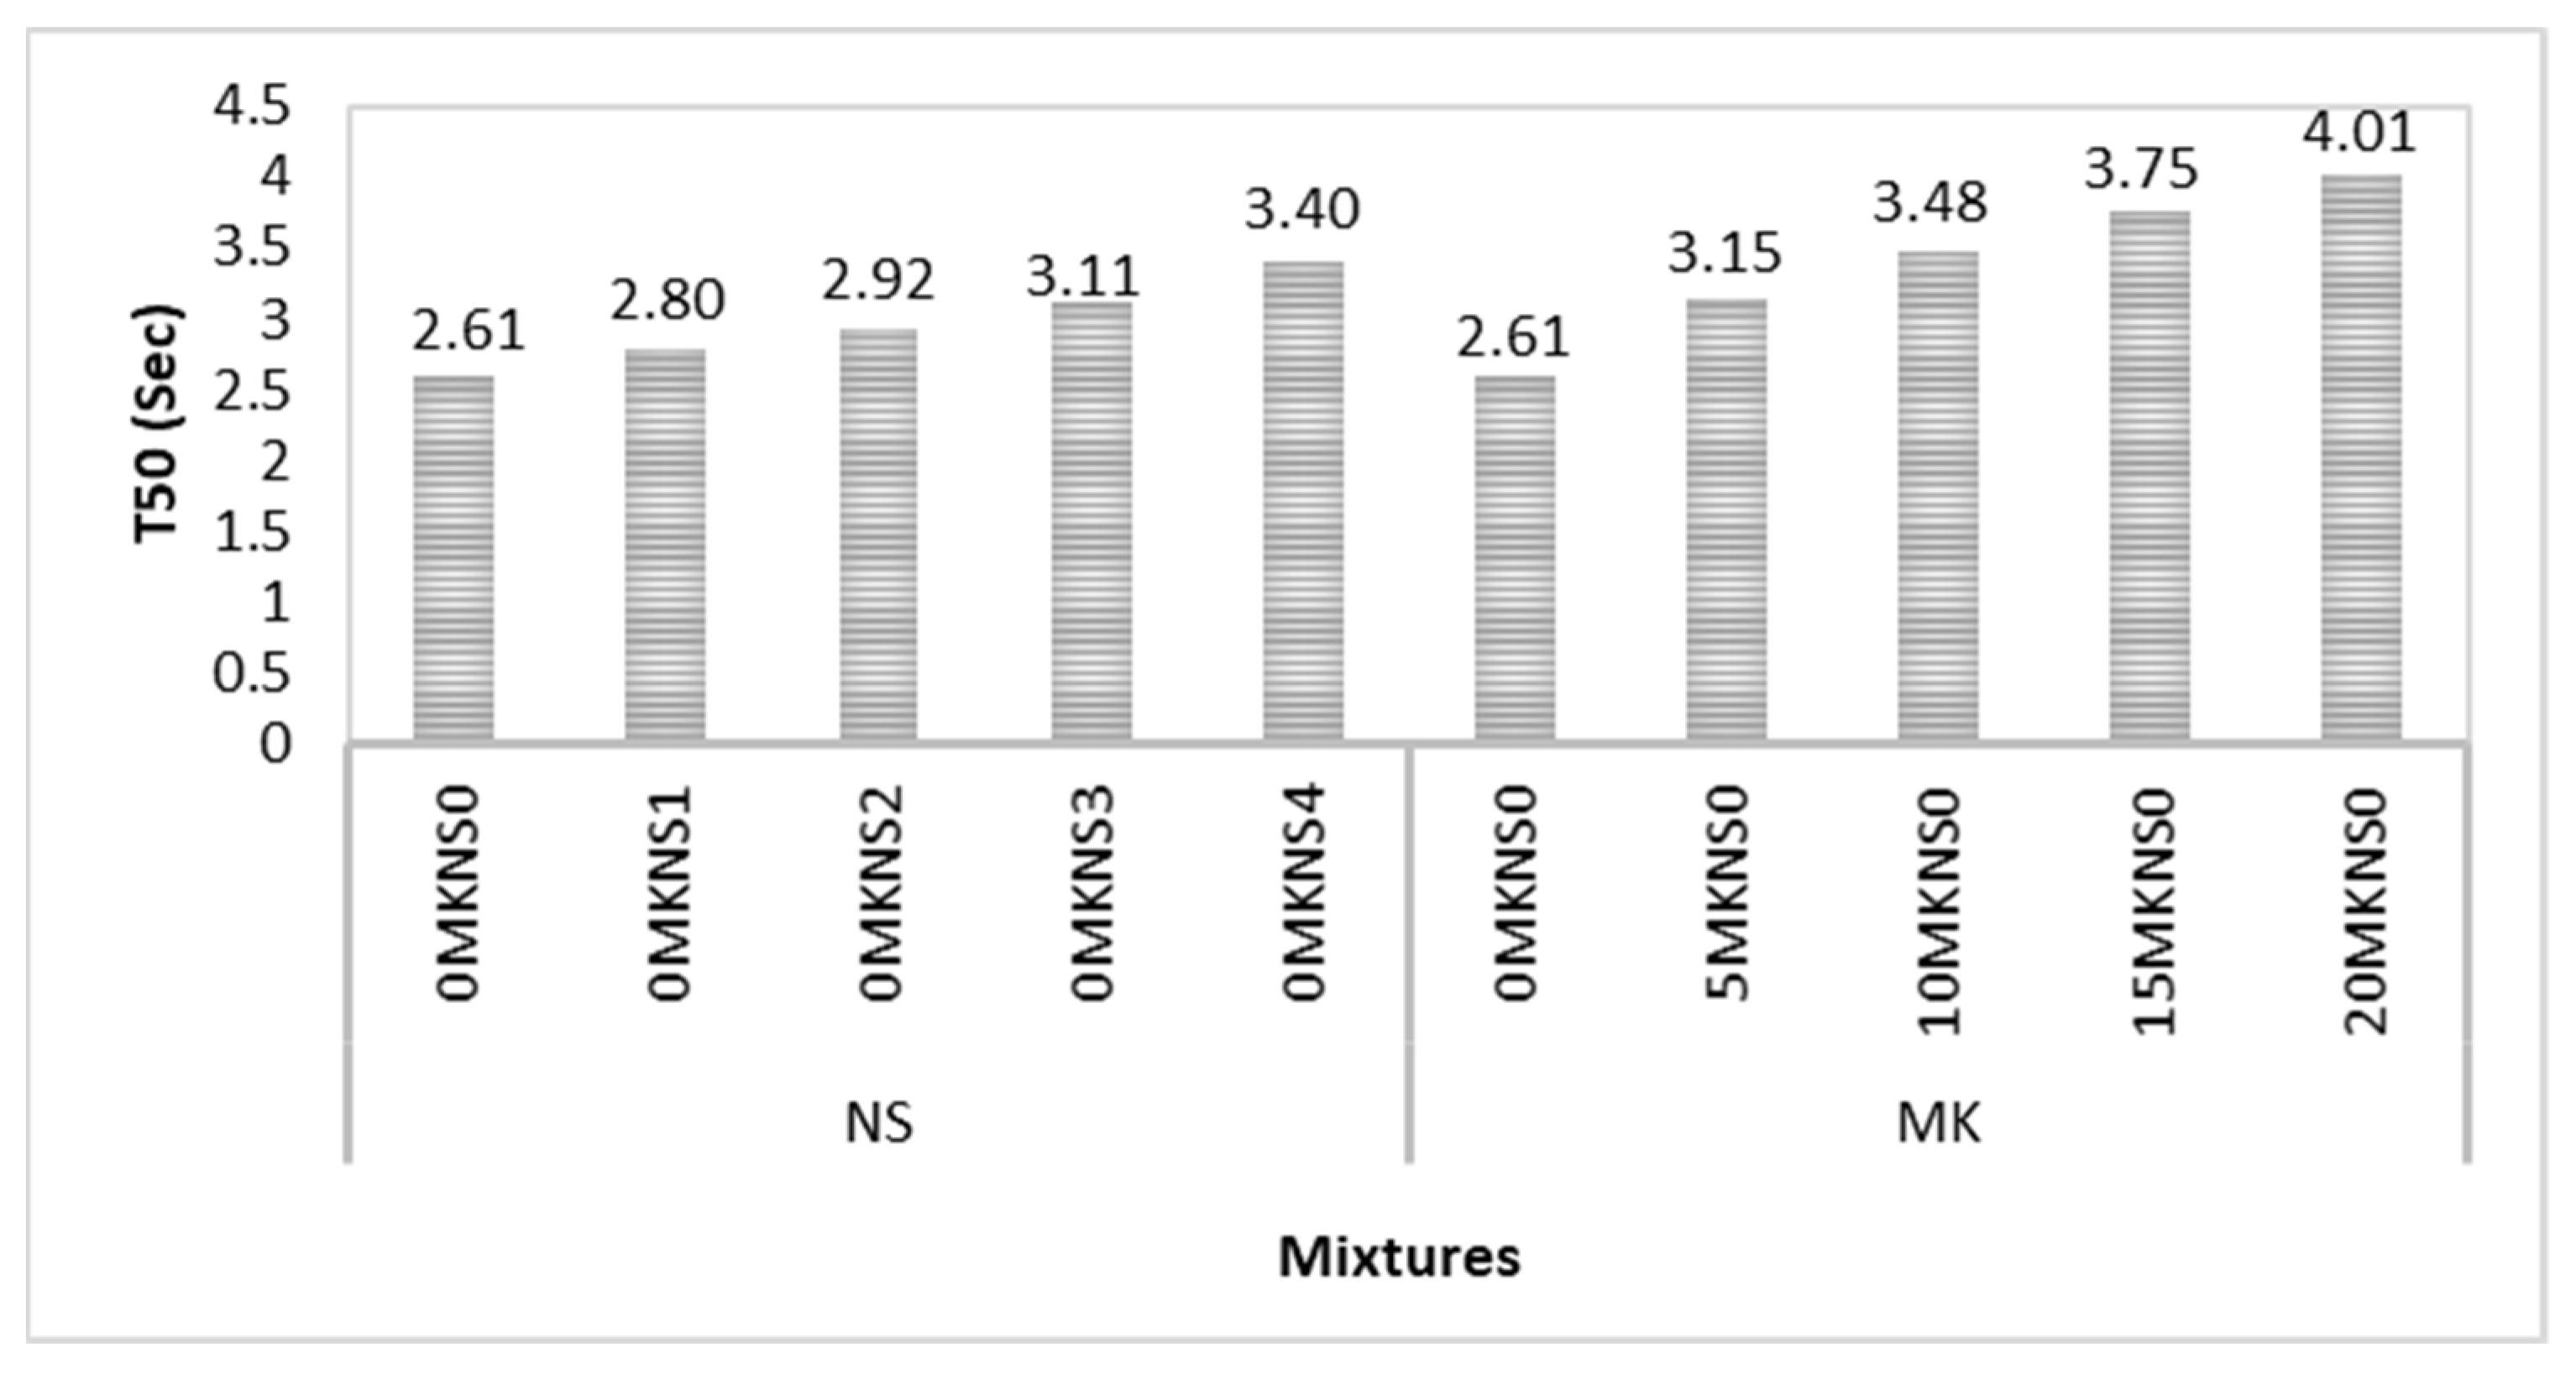
3.1.2. T50 Time Test

The combined effect of NS and MK on the T50 times is presented in Figure 7. T50 represents the time measured until the fresh A-ASCC touches the 500 mm. T50 durations of the mixes without NS including MK with replacement ratio of 0%, 5%, 10%, 15% and 20% were evaluated as 2.6 s, 3.3 s, 3.8 s, 4.1 s and 4.7 s, respectively; and 2.6 s, 2.8 s, 2.9 s, 3.1 and 3.4 s, respectively, for the mixes including 0%, 1%, 2%, 3% and 4% NS. The increment in the values of T50 due to the addition of NS and MK may be to the NS’s and MK’s high surface area. Moreover, the T50 duration in the current study was less than 6 s, which is compatible with the EN 12350-8 standard [68]. Meanwhile, according to the EN 12350-8 standard [68] and EFNARC specification [62], all T50 values in the current study were considered acceptable. In addition, the results of T50 duration shows that the flowability of A-ASCC was negatively affected by the amount of MK and/or NS; lower T50 duration was detected in the mixes containing FA without MK and NS.

3.1.3. V-Funnel Flow Time of A-ASCC Mixes

The reflection and viscosity for the flowability of A-ASCC are represented by the v-funnel flow duration. Similar to the T50 duration, and slump flow, the discharge time from the v-funnel opening showed the best relationship with the replacement ratio of NS. The v-funnel flow durations of the mixes without NS including MK were evaluated as 12.02 s, 14.53 s, 17.03 s, 19.50 s, and 24.05 s for the mixes including 0%, 5%, 10%, 15%, and 20% MK, respectively. However, the v-funnel flow durations for the mixes incorporating NS without MK were 12.02 s (0% NS) and 13.01 s (1% NS), 14.51 s (2% NS), 16.02 s (3% NS), and 18.60 s (4% NS). As a result, the influence of MK on the flow time was found to be more than the influence of NS. Similarly, the minimum and maximum flow times were detected for the mix including 4% NS and the mix including 20% MK, respectively, as indicated in Figure 8a. Furthermore, Table 4 and Figure 8b show the viscosity classes depending on the T50 slump flow duration values and v-funnel time stated by EFNARC specifications [62]. On the other hand, the amount of MK significantly affects the mix flow time; Figure 8 indicates that the flowability times increased with an increase in the amount of NS and MK replacement ratios.
Based on the T50 duration and V-funnel discharge time measurements, all A-ASCC mixtures in the current investigation were classified as VS2/VF2. According to the EFNARC standard, the VS1/VF1 viscosity classification indicates a sufficient flow even for high-reinforcing structures. This class, however, has insufficient resistance to segregation and bleeding. Meanwhile, the VS2/VF2 class has minimal formwork pressure and excellent resistance to bleeding and segregation. As a result, the surface finish property of the VS2/VF2 class is insufficient, and it may degrade as a result of the cessation of A-ASCC mix flow. According to the v-funnel results, the presence of NS enhanced discharge flow duration and improved bleeding and segregation resistance. Furthermore, according to the EN 12350-9 standard [72], the flow time of the v-funnel of any A-ASCC mix should be less than 15 s to display excellent filling ability. Except for the mixes containing 3% NS, 4% NS, 10% MK, 15% MK, and 20% MK, the flow duration of the mixes with and without NS was less than 15 s (the normal limit value). Moreover, the flow duration of all A-ASCC mixes including NS was greater than the values of the mixes containing MK. Furthermore, higher concentrations of NS enhanced the resistance of A-ASCC mixtures to bleeding and segregation, and the mixes containing MK and/or NS were shown to be more cohesive than the control mix (without MK and NS). The results revealed that, as the MK and NS ratios increased, so did the fresh state properties of the A-ASCC mixtures. To produce FA-based A-ASCC mixes with superior flowability and passing ability, the proportion of both MK and NS should be controlled to obtain excellent fresh-state performance.

3.1.4. The L-Box Height Ratio of A-ASCC Mixtures

The L-box test measures the flowability of A-ASCC mixes through a narrow open channel with three bars (411 mm) by calculating the ratio of H2/H1 (the height of A-ASCC in the horizontal part/the height of A-ASCC in the vertical part) after the mix has fully flowed. The EN12350-10 standard and EFNARC specification state that the passing ability ratio (H2/H1) via the L-box test should be more than or equal to 0.8 to achieve satisfactory requirements for the passing ability of SCC mixtures [73]. Figure 9 represents the results for passing ability through the L-box test in the current study. As seen from the figure, all A-ASCC mixes exhibit an acceptable passing ability (passing ability ≥0.8). The mixes without MK with and without NS have the highest passing ability (1.0). However, as expected, the passing ability of A-ASCC decreased with the addition of MK; the passing ability for the fibrous mixes with MK was 1.0, 0.97, 0.95, 0.93, and 0.90 for the mixes including 0%, 1%, 2%, 3% and 4% NS, respectively. In addition, it was indicated that the incorporation of MK decreased the passing ability values for A-ASCC mixes. It should be noted that the passing ability of A-ASCC was reduced with an increase in the amount of MK (from 5% to 20%). Furthermore, it was noted that the replacement of NS reduced the passing ability of FA-based A-ASCC mixes.
However, it was indicated that all mixes in the current study satisfied the passing ability and flowability criteria requirements according to TS EN 12,350 standards and EFNARC specifications even for the presence of the highest volume fraction (1%) for both additive NS and/or MK. Furthermore, it was noticed that the incorporation of NS and MK improved the fresh quality of FA-based A-ASCC mixes by improving the resistance to bleeding and segregation and enhancing the finishing surface and uniformity. Therefore, it is recommended to use NS and MK for the better fresh properties (the passing ability and flowability) of A-ASCC.

3.2. Hardened Performance of A-ASCC

3.2.1. Compressive Strength

Table 5 and Figure 10 illustrate the values of compressive strength for A-ASCC specimens in the current study. The results showed that incorporating NS had no substantial influence on the compressive strength results of the A-ASCC specimen. Therefore, the compressive strength of the A-ASCC specimen containing NS was close to the corresponding compressive strength of the specimen without NS; the compressive strength of FA-based A-ASCC was slightly improved by the addition of 1% and 2% of NS and reduced with an increase in the replacement of NS. These may be owing to a severe self-dehydration of the specimens with the presence of NS as a result of unreacted partial NS particles, which promote crack development (weakening the microstructure) and hence the deterioration of compressive strength [25,74]. The improvement ratio was 0.48% and 1.85%, respectively, for the specimens including 1% and 2% NS. Whereas the reduction amounts were 7.4% and 12.9% for the specimens including 3% and 4% NS, respectively. The loss in compressive strength was associated with the increase in the ratio of unreacted silica in the mixture, which increased the ratio of silicate-to-aluminate. As a result, the optimal NS ratio for the FA-based A-ASCC is 2%. Furthermore, the inclusion of MK was shown to improve compressive strength substantially. The compressive strength enhancement was greater than 10.4%, 12.2%, 24.3% and 26.5% for specimens containing 5%, 10%, 15% and 20% MK, respectively. Previous studies have shown that the incorporation of MK improved the compressive strength of conventional concrete [75,76].
On the other hand, it was noted that the compressive strength of A-ASCC was enhanced with an increase in the time (from 7 days to 28 days). The compressive strength improvement for the specimens that include MK was much more than for the specimens without MK. However, the improvement in the compressive strength for the specimens that include NS was close to the improvement values for the control specimens (specimens without NS and MK).
Saini and Vattipalli [77] studied the A-ASCC performance with NS. According to their findings, including 2% NS caused a considerable development in compressive strength. Researchers have shown that the NS densified the matrix structure of tetrahedral aluminosilicate, and, therefore, the addition of NS to A-ASCC mixtures enhanced their strength [78]. Nanomaterials have been shown to improve the behavior of cementitious composites [79,80]. However, researchers investigated that the influence of NS on the compressive strength of AAC and/or A-ASCC was very low compared to the tensile and bond strength behavior regardless of the type of binder materials and curing environment [20,25,69].

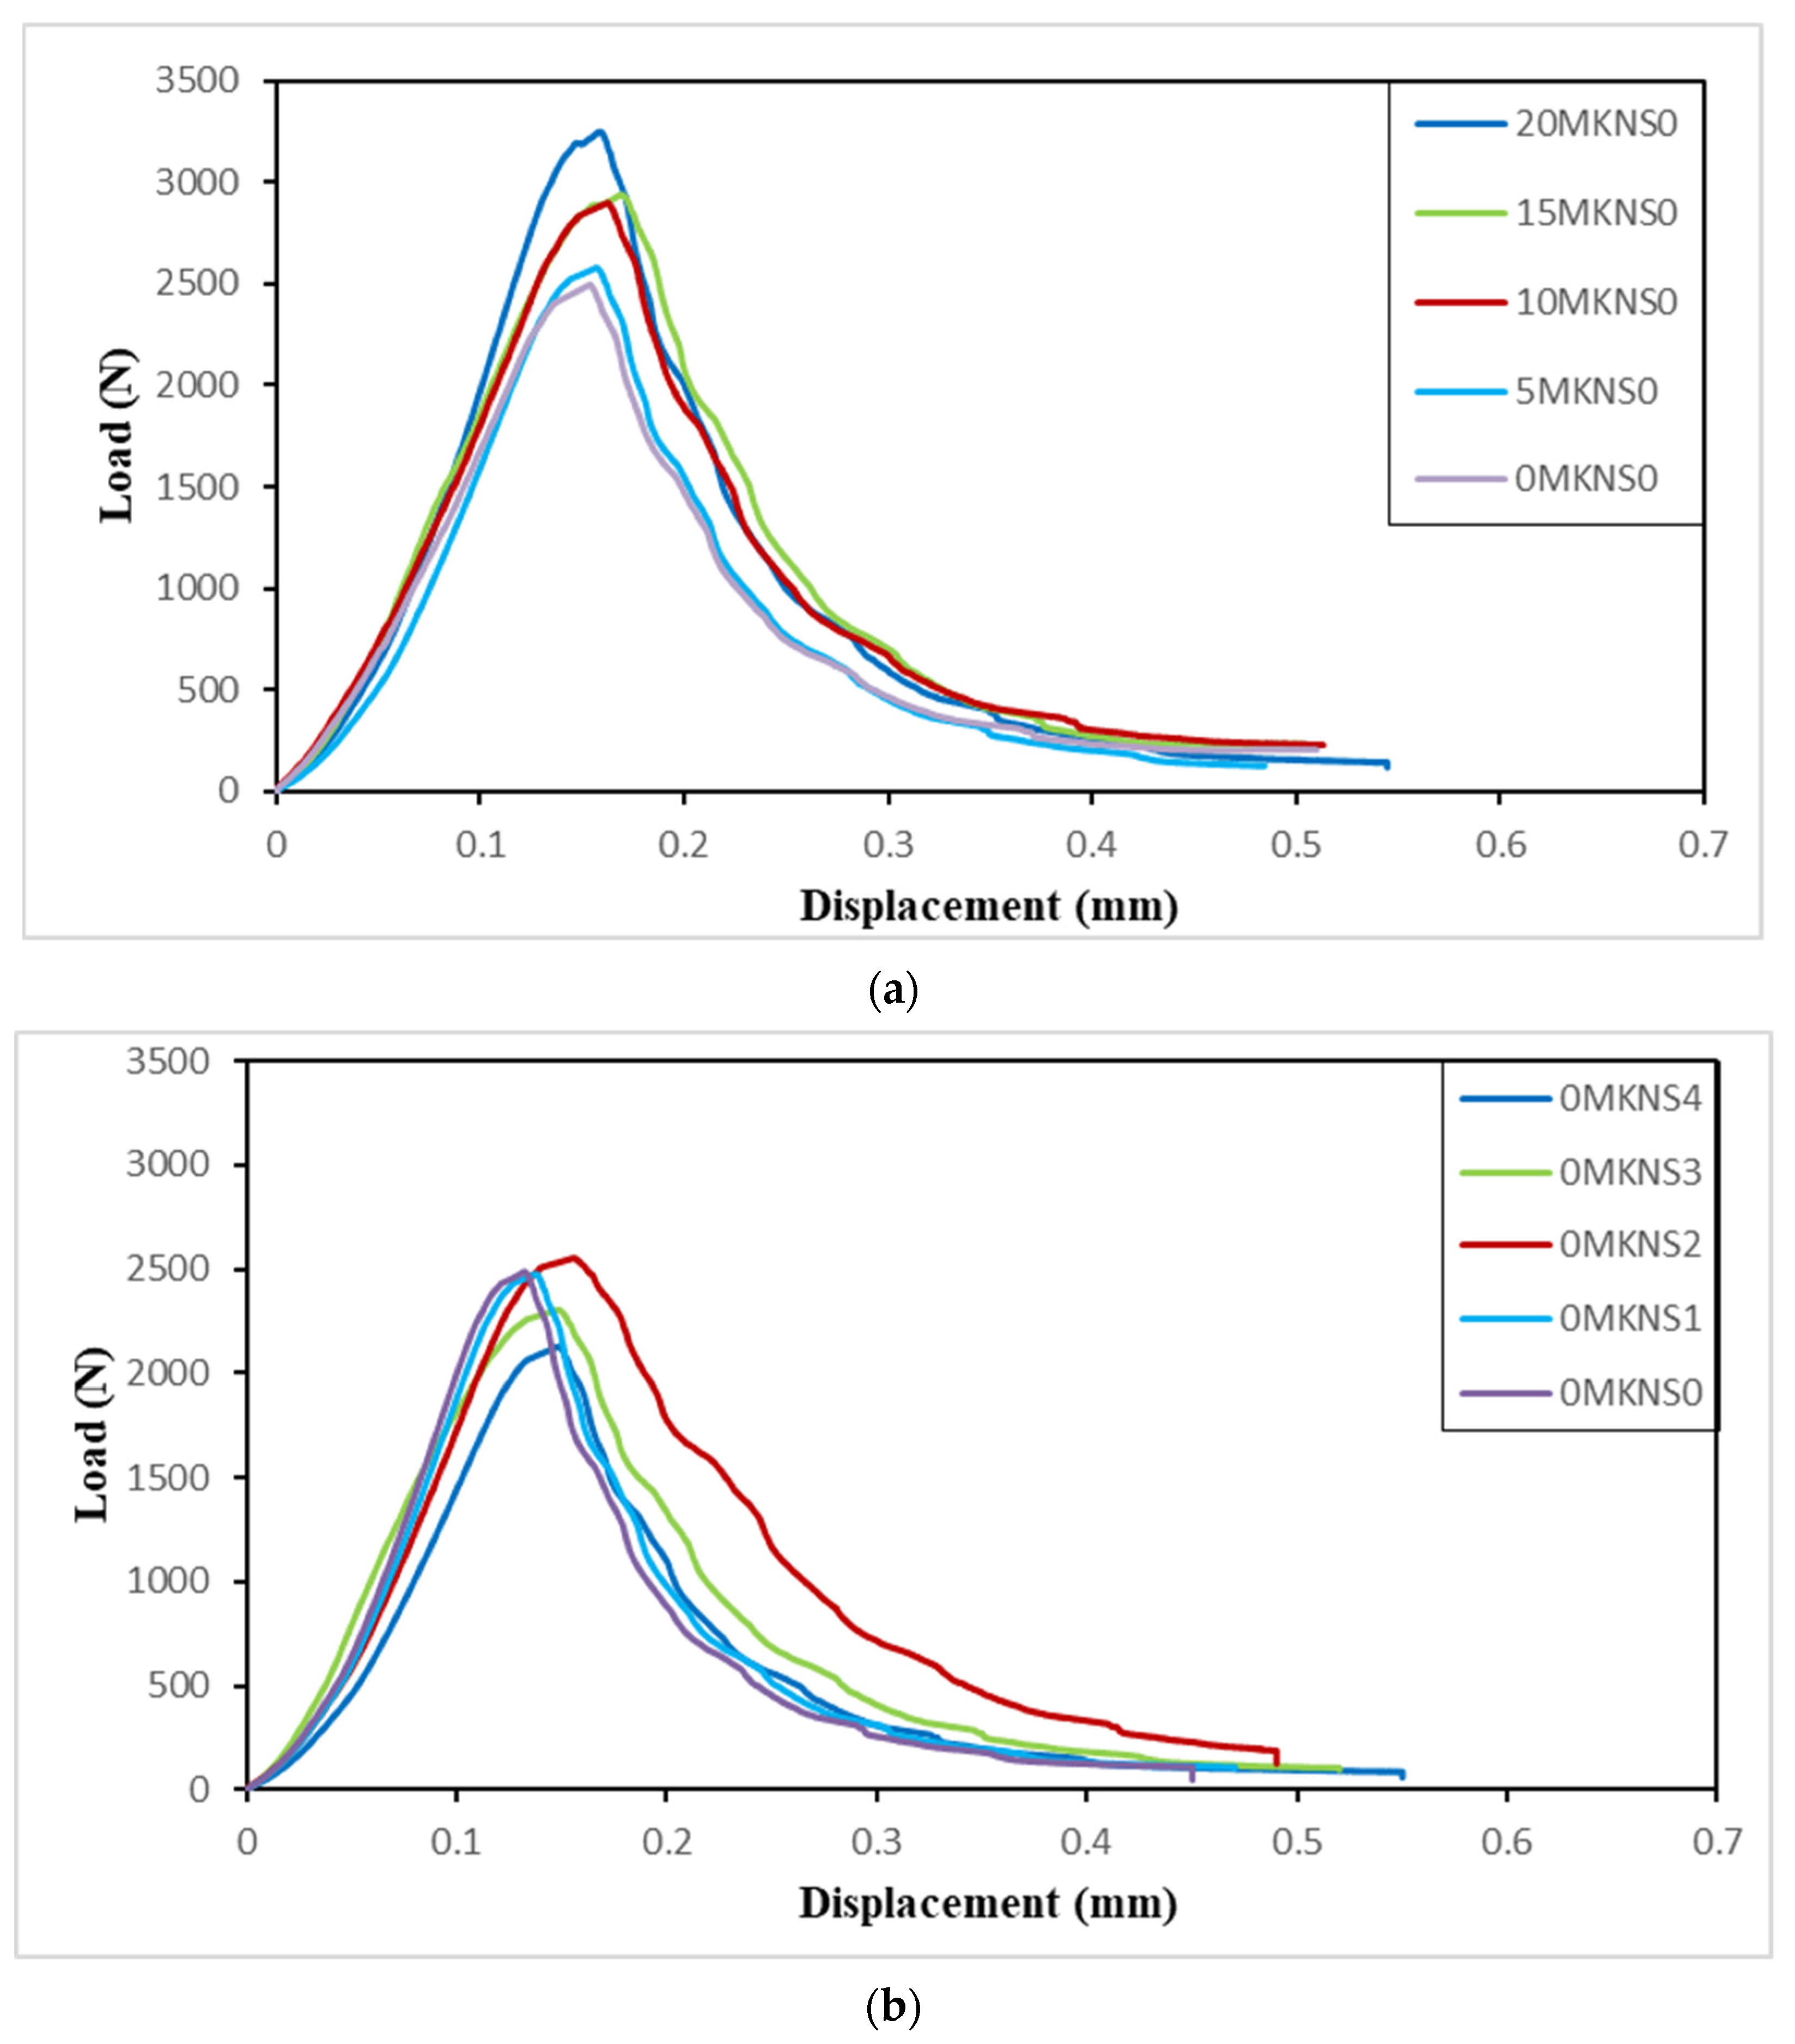
3.2.2. Bond Strength

Figure 11 shows the difference in bond strength caused by the addition of NS and MK calculated using the fourth equation. The bonding strength increased dramatically as the MK replacement increased. Furthermore, NS and MK significantly enhanced the bond strength of the A-ASCC specimens, with the maximum bond-strength improvement reported to be 22.2% for specimens containing 20% MK when compared to control A-ASCC specimens. The favorable impact of MK on bond strength was found to be larger than the effect of NS. The improvement ratios were 7.27%, 8.8%, and 6.1% for the specimens that included 1%, 2%, and 3% NS, respectively.
Metakaolin-based AAM has demonstrated greater bond strength when compared to comparable repair products on the market [81]. It does, however, need a curing period of more than 24 h and is not authorized for applications requiring an early traffic opening. As a result, additional research is required to attain a shorter curing period and a greater early strength. Any silica- and alumina-rich material, such as FA or MK, can be utilized as alkaline molecules. The alkaline particles are dissolved in a highly alkaline solution, resulting in amorphous polymeric Si–O–Al–O bonds. The geopolymer forms quickly and is a good contender for early strength applications [82,83]. In the current study, the bond strength of A-ASCC was significantly improved with the replacement of MK and NS, as shown in Figure 12. However, the improvement achieved by the MK replacement ratio was much more than the improvement due to the NS replacement ratio.

3.2.3. Net Flexural Tensile Strength

The load-displacement curves of A-ASCC specimens under three-point bending stress calculated using the first equation are presented in Figure 13. In general, all A-ASCC curves displayed a linear increasing trend until strain-softening behavior for the specimens and initial cracking was seen. The load-displacement curves of A-ASCC specimens exhibited comparable behavior, and flexural strength values were obtained with and without MK and/or NS (up to 2%). As illustrated in Figure 14, when MK was added, the flexural tensile strength was significantly enhanced with an increase in the concentration of MK. Furthermore, specimens with higher NS had higher residual flexural strengths and lower load relaxations than specimens without NS. This might be owing to the higher bonding strength between the NS particles and the matrix due to the NS addition. However, the addition of MK resulted in the greatest bond strength and the maximum flexural strength for specimens containing 20% MK.

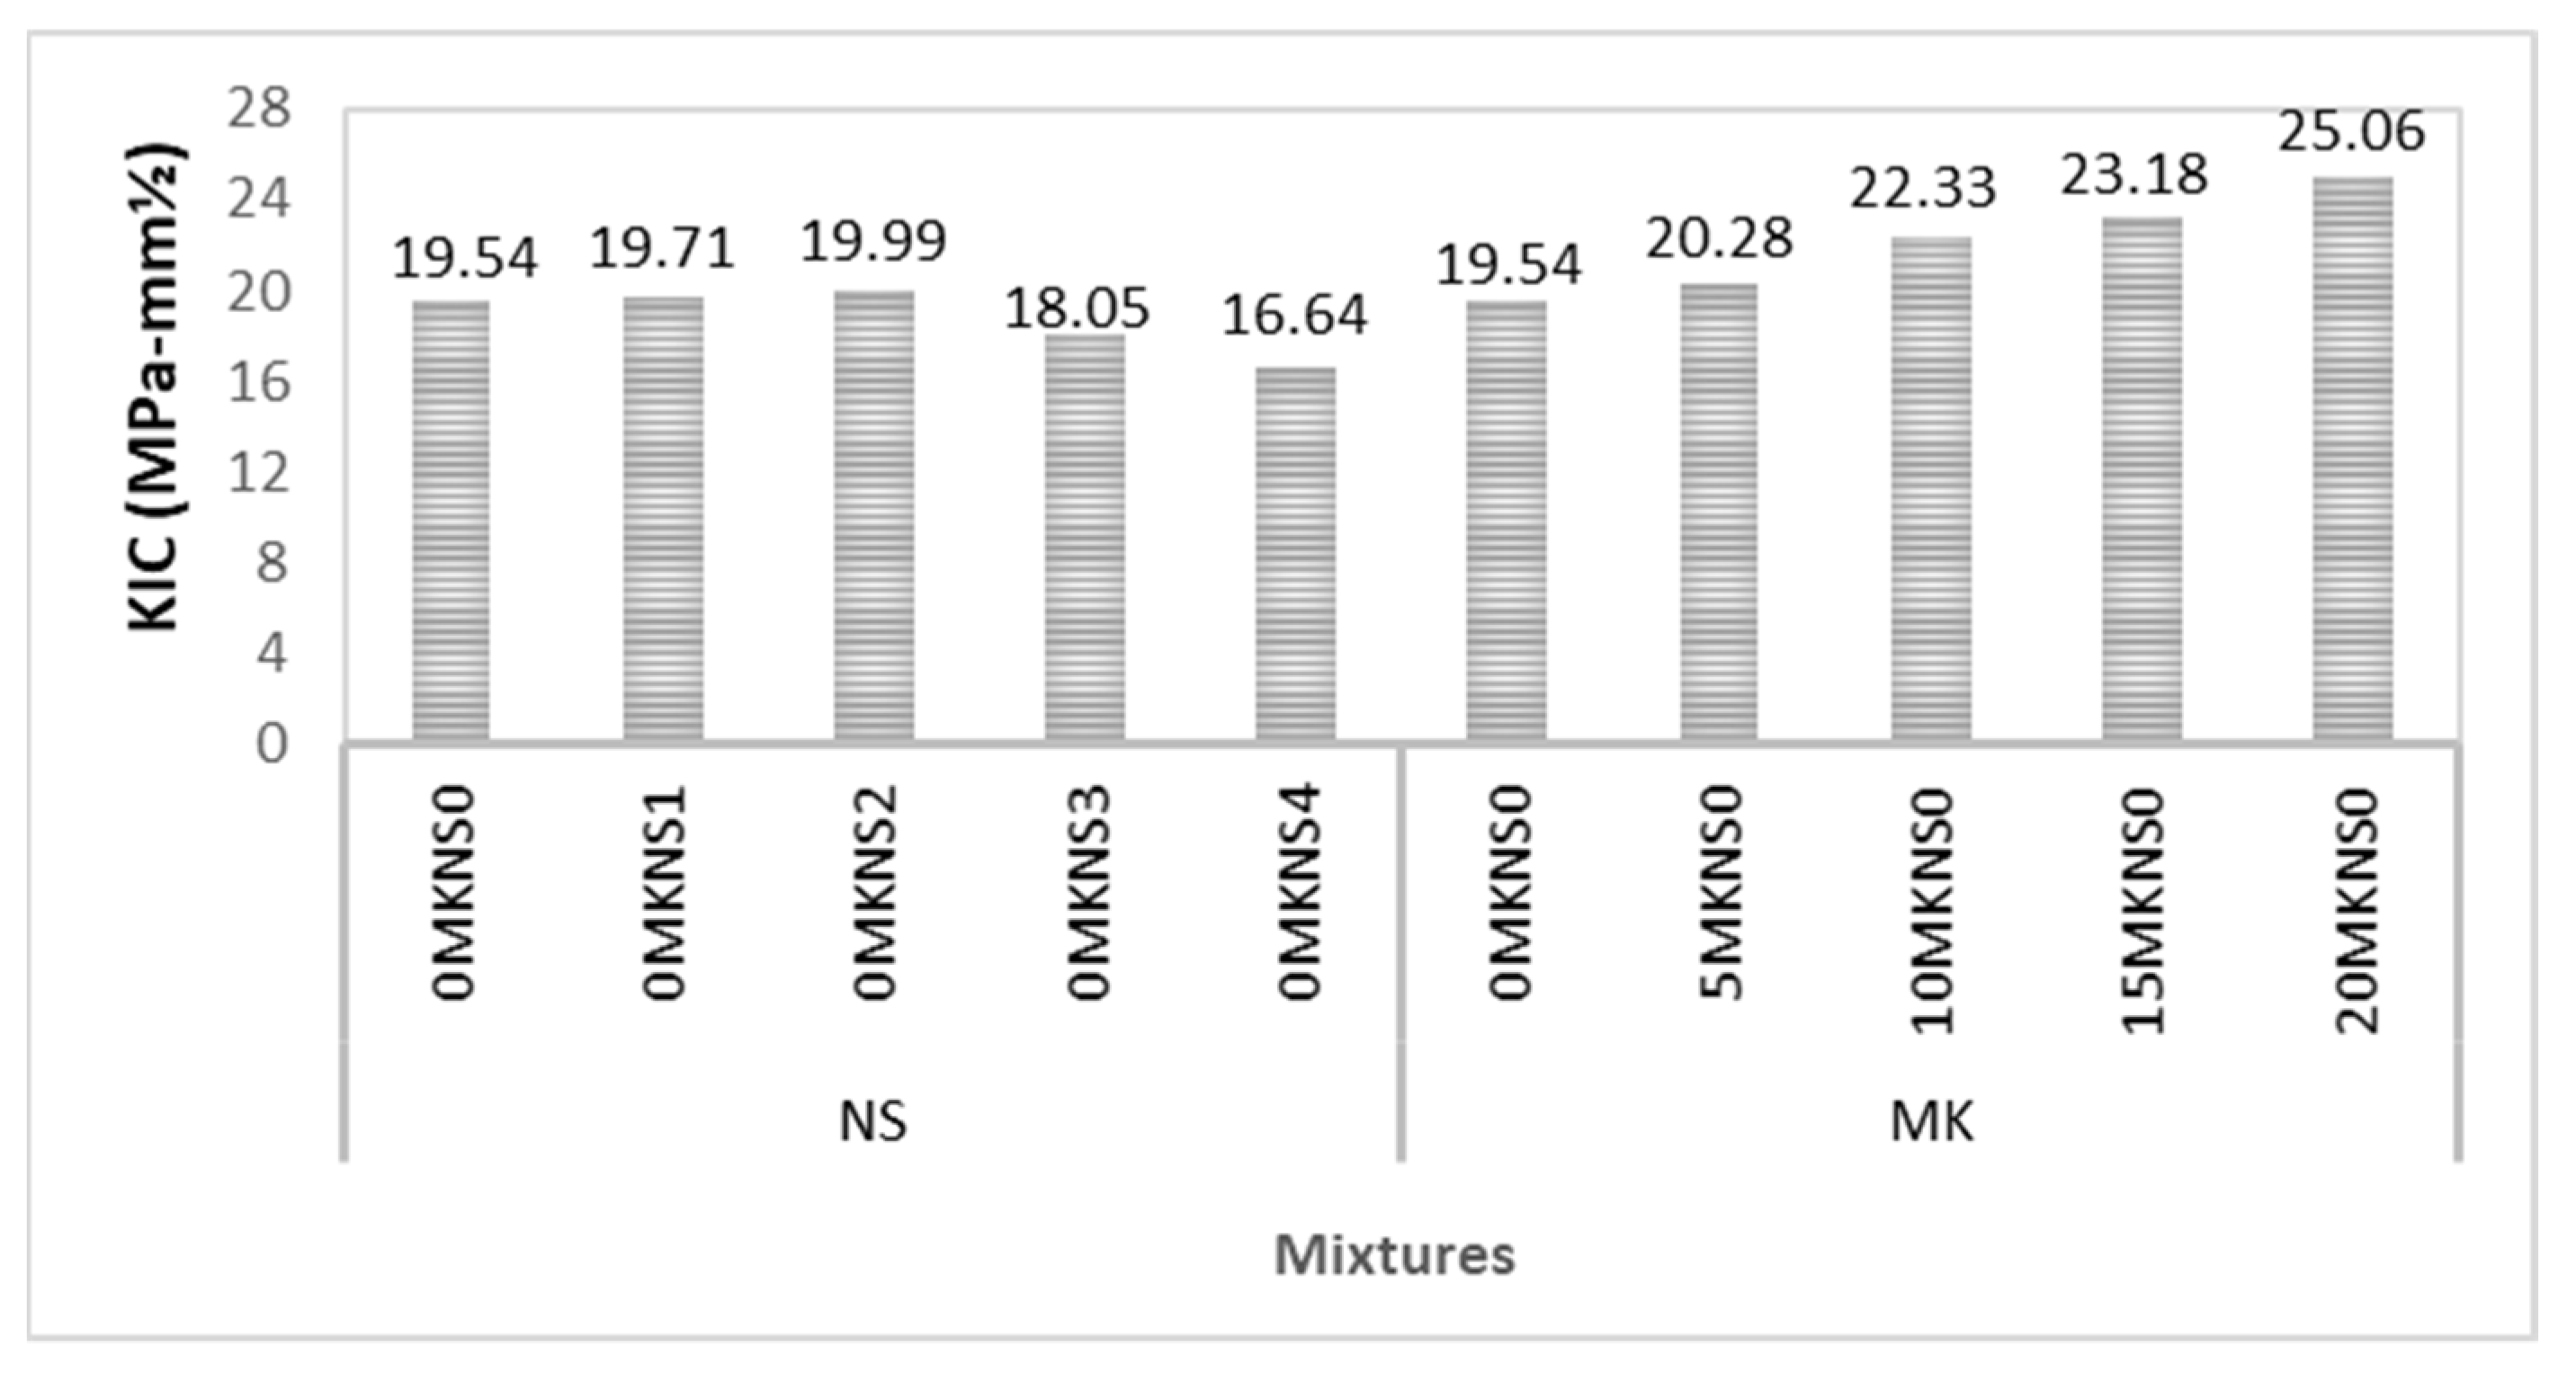
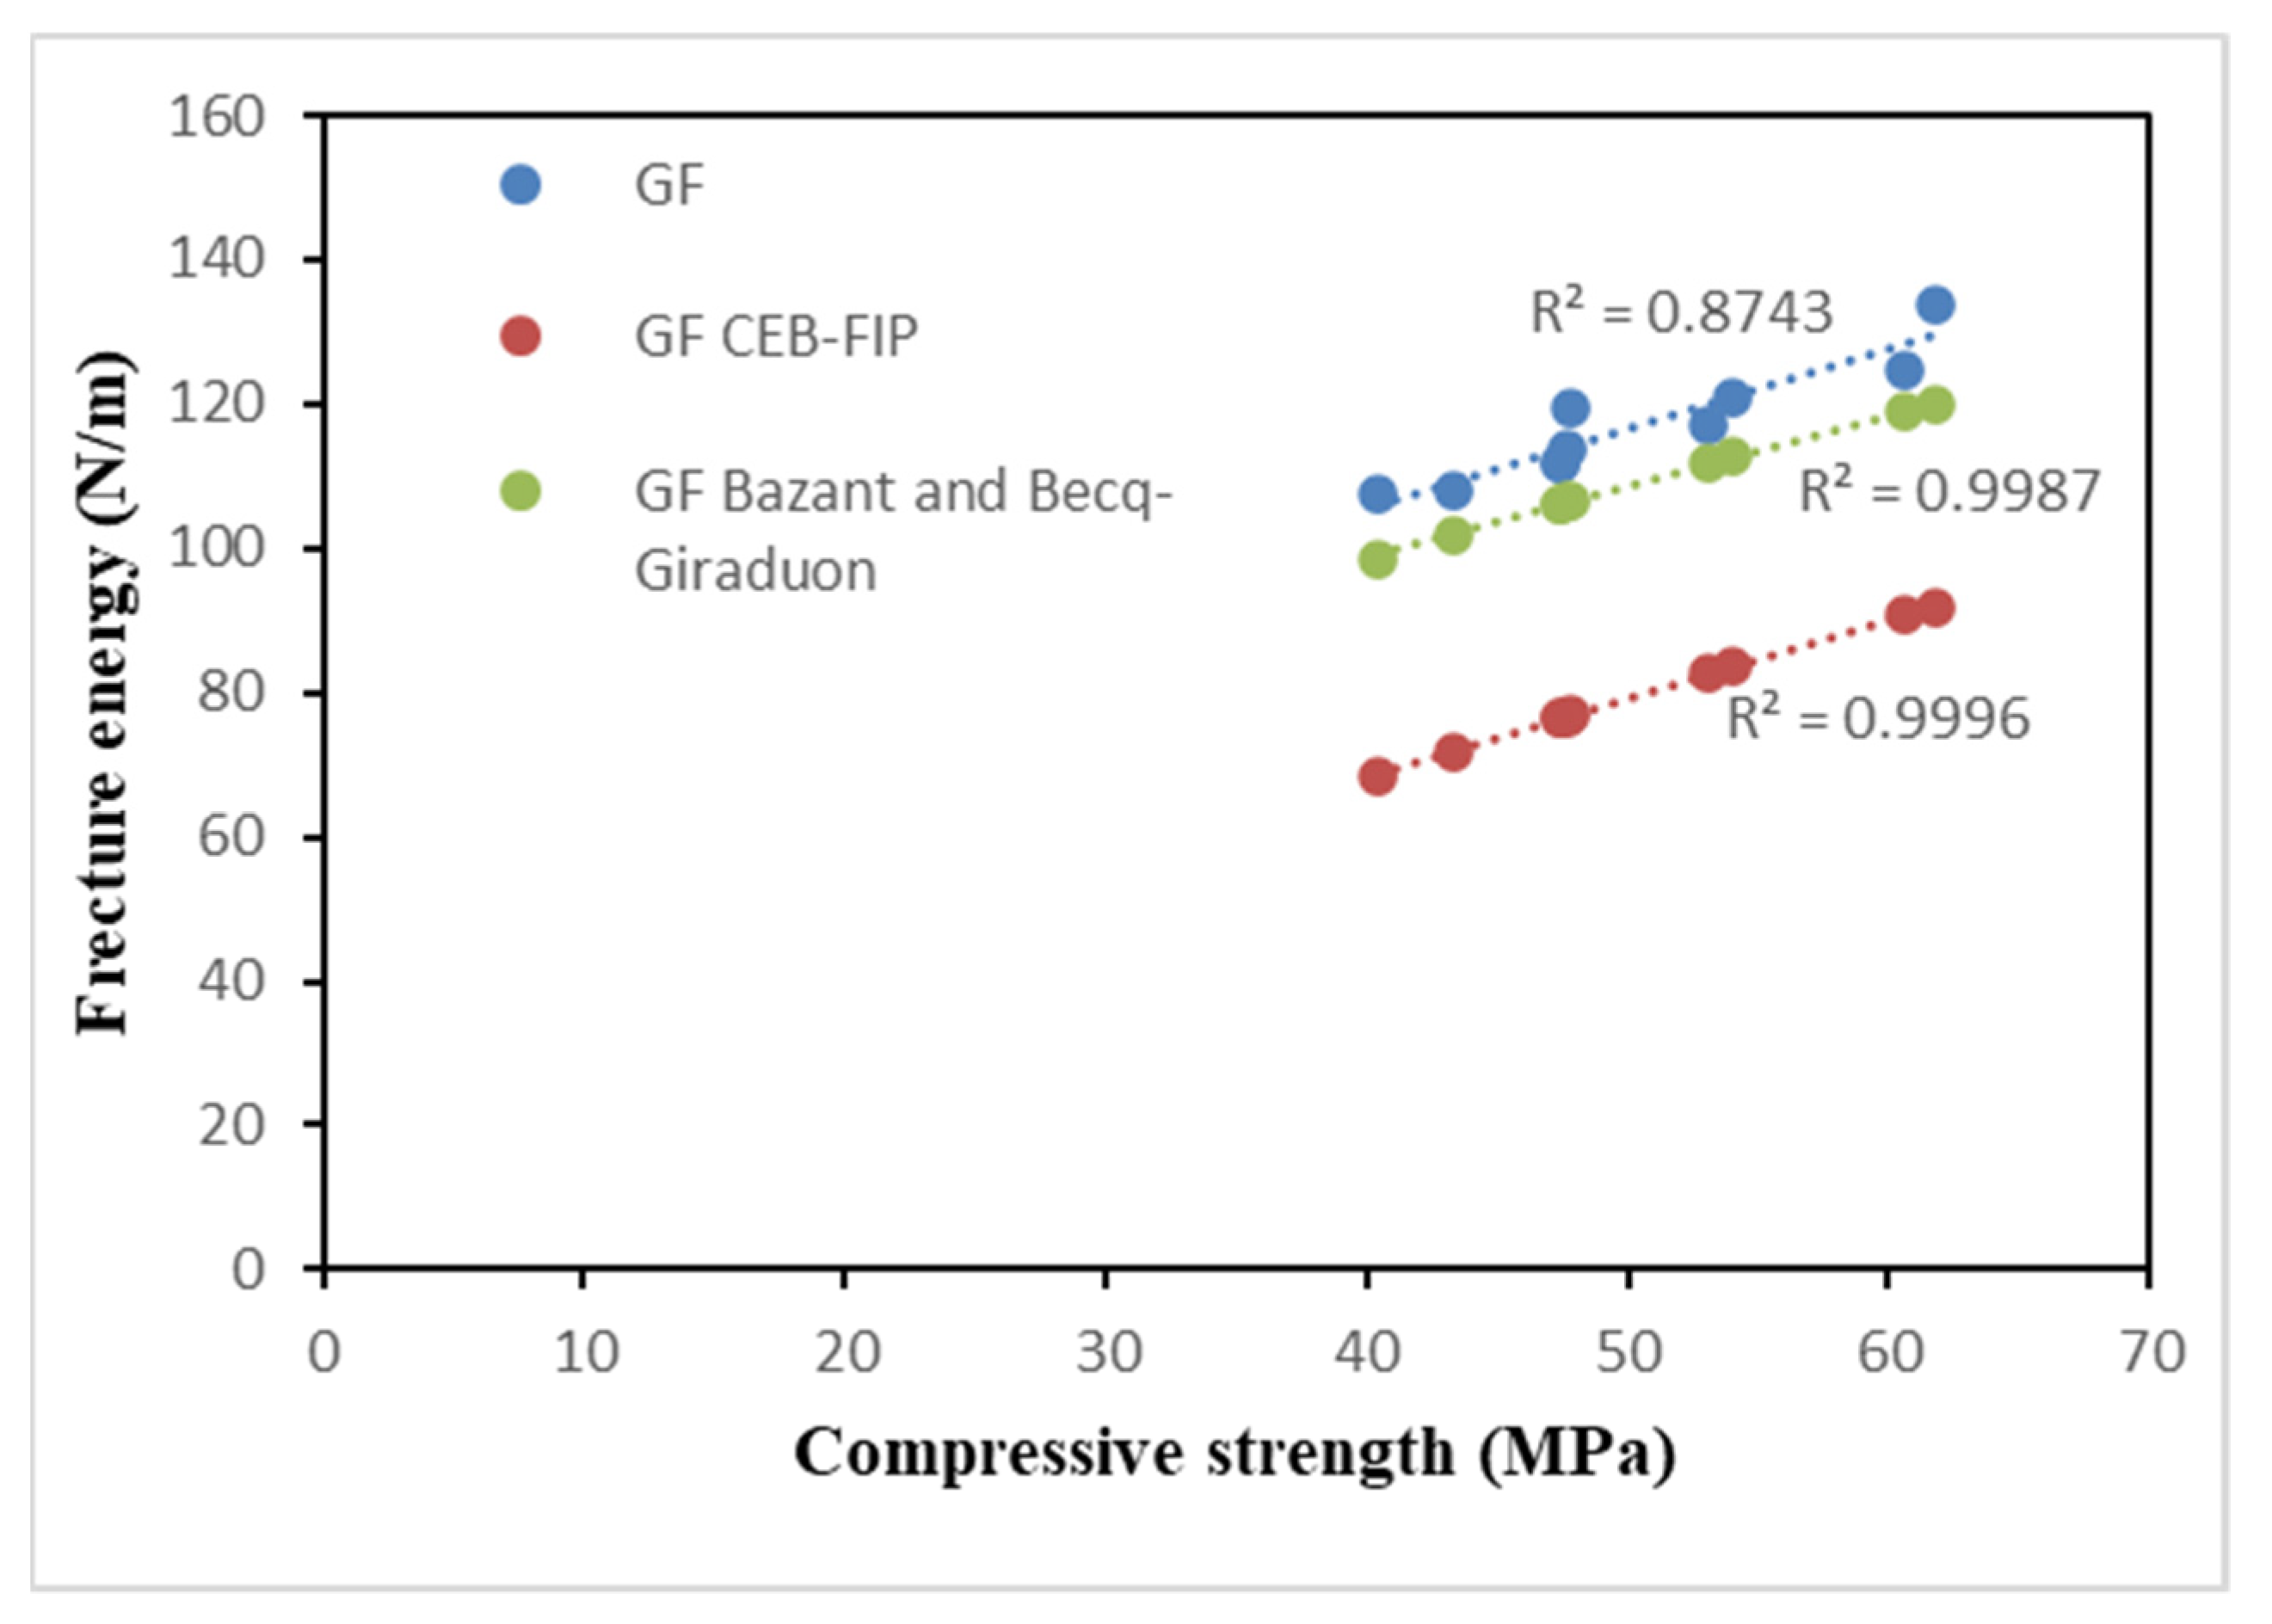
3.2.4. Fracture Performance

Figure 15 shows the fracture energy results from measuring the area under the load-displacement curve using the second equation. For the control specimens, similar fracture-energy findings were found (without MK and NS). When the influence of MK and NS on fracture energy was investigated, the fracture energy was enhanced by increasing the amount of MK and/or NS (up to 2%), while it decreased with an increase in the ratio of NS (3% and 4%). The unfavorable influence of NS might be due to an incomplete NS reactive and a lack of calcium to reactivate the particle NS.
The influence of MK was attributed to an increase in bonding strength, which prevents fractures from emerging and allows for greater displacement in the A-ASCC specimens. Meanwhile, MK may strengthen bonds and improve adhesion between matrix components. Another cause for the greater fracture energy values may be related to the specimens’ compressive strength increase, as seen in Figure 16. The fracture energy of the heat-cured FA-based AAC has been researched by previous researchers, who determined that the fracture energy was enhanced with an increase in the compressive strength [84].
The third equation was used to measure the KIC (critical stress intensity factor) of A-ASCC specimens after 28 days, and the outcomes are given in Figure 16. The KIC indicates how much stress is necessary to propagate the fracture. The KIC values for A-ASCC specimens with and without MK and/or NS were similar. As seen in Figure 16, when the MK content was improved to 20%, the KIC values increased as well. When the large MK (20%) was used, more stress was required to form the existing cracks in the specimens.
One of the study’s goals for structural design codes and specifications of FA-based A-ASCC was to see if the current formula suggested for conventional concrete could be used for alkali-activated concrete. For this purpose, the Bazant and Becq-Giraduon [85] and CEB-FIP [86] proposed conventional concrete formula (5th and 6th) relating compressive strength vs. fracture energy were investigated and compared with the current study’s fracture energy results.
G f = 4.575 ( f c 0.051 ) 0.46
G f = 25.69 ( f c 10 ) 0.7
As demonstrated, the suggested formulae matched the experimental outcomes with an average error of 3.52% for the Bazant and Becq-Giraduon models and 6.61% for the CEB-FIP model (Figure 17). Furthermore, the experimental results and suggested formulae matched up to 68 MPa. As a result, these formulae may be used to design the structural components of standard and high-strength FA-based A-ACC.

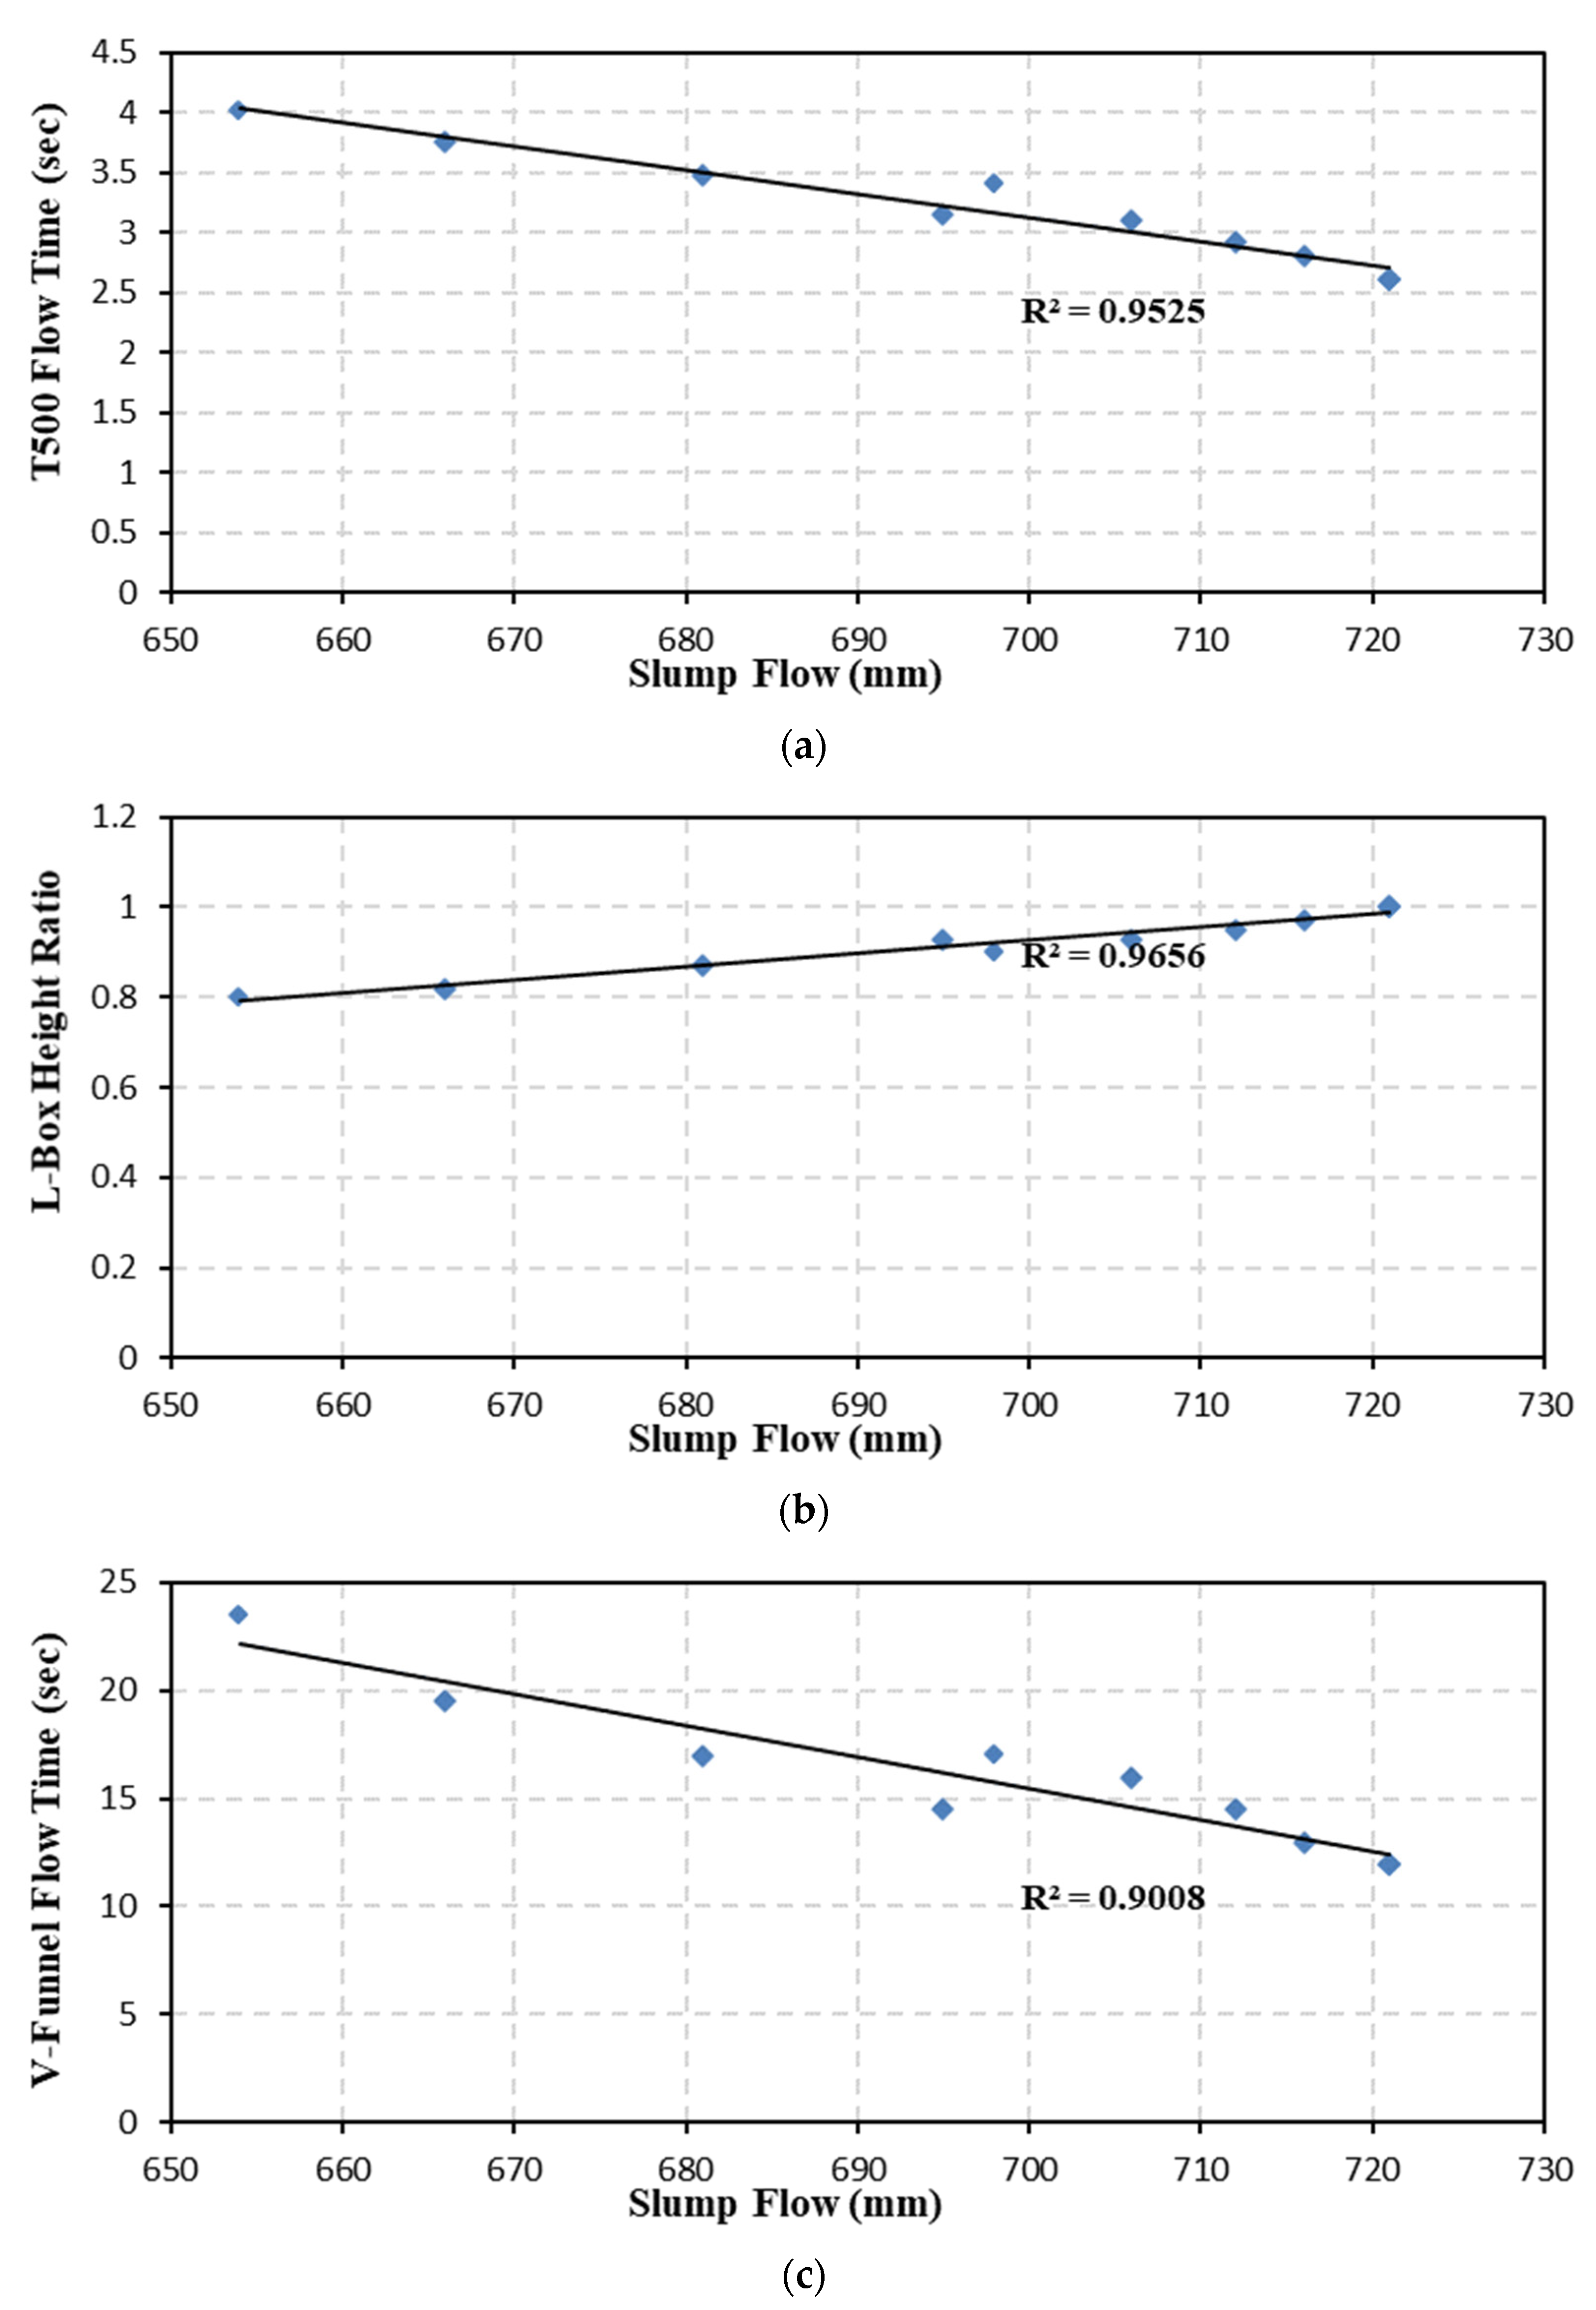
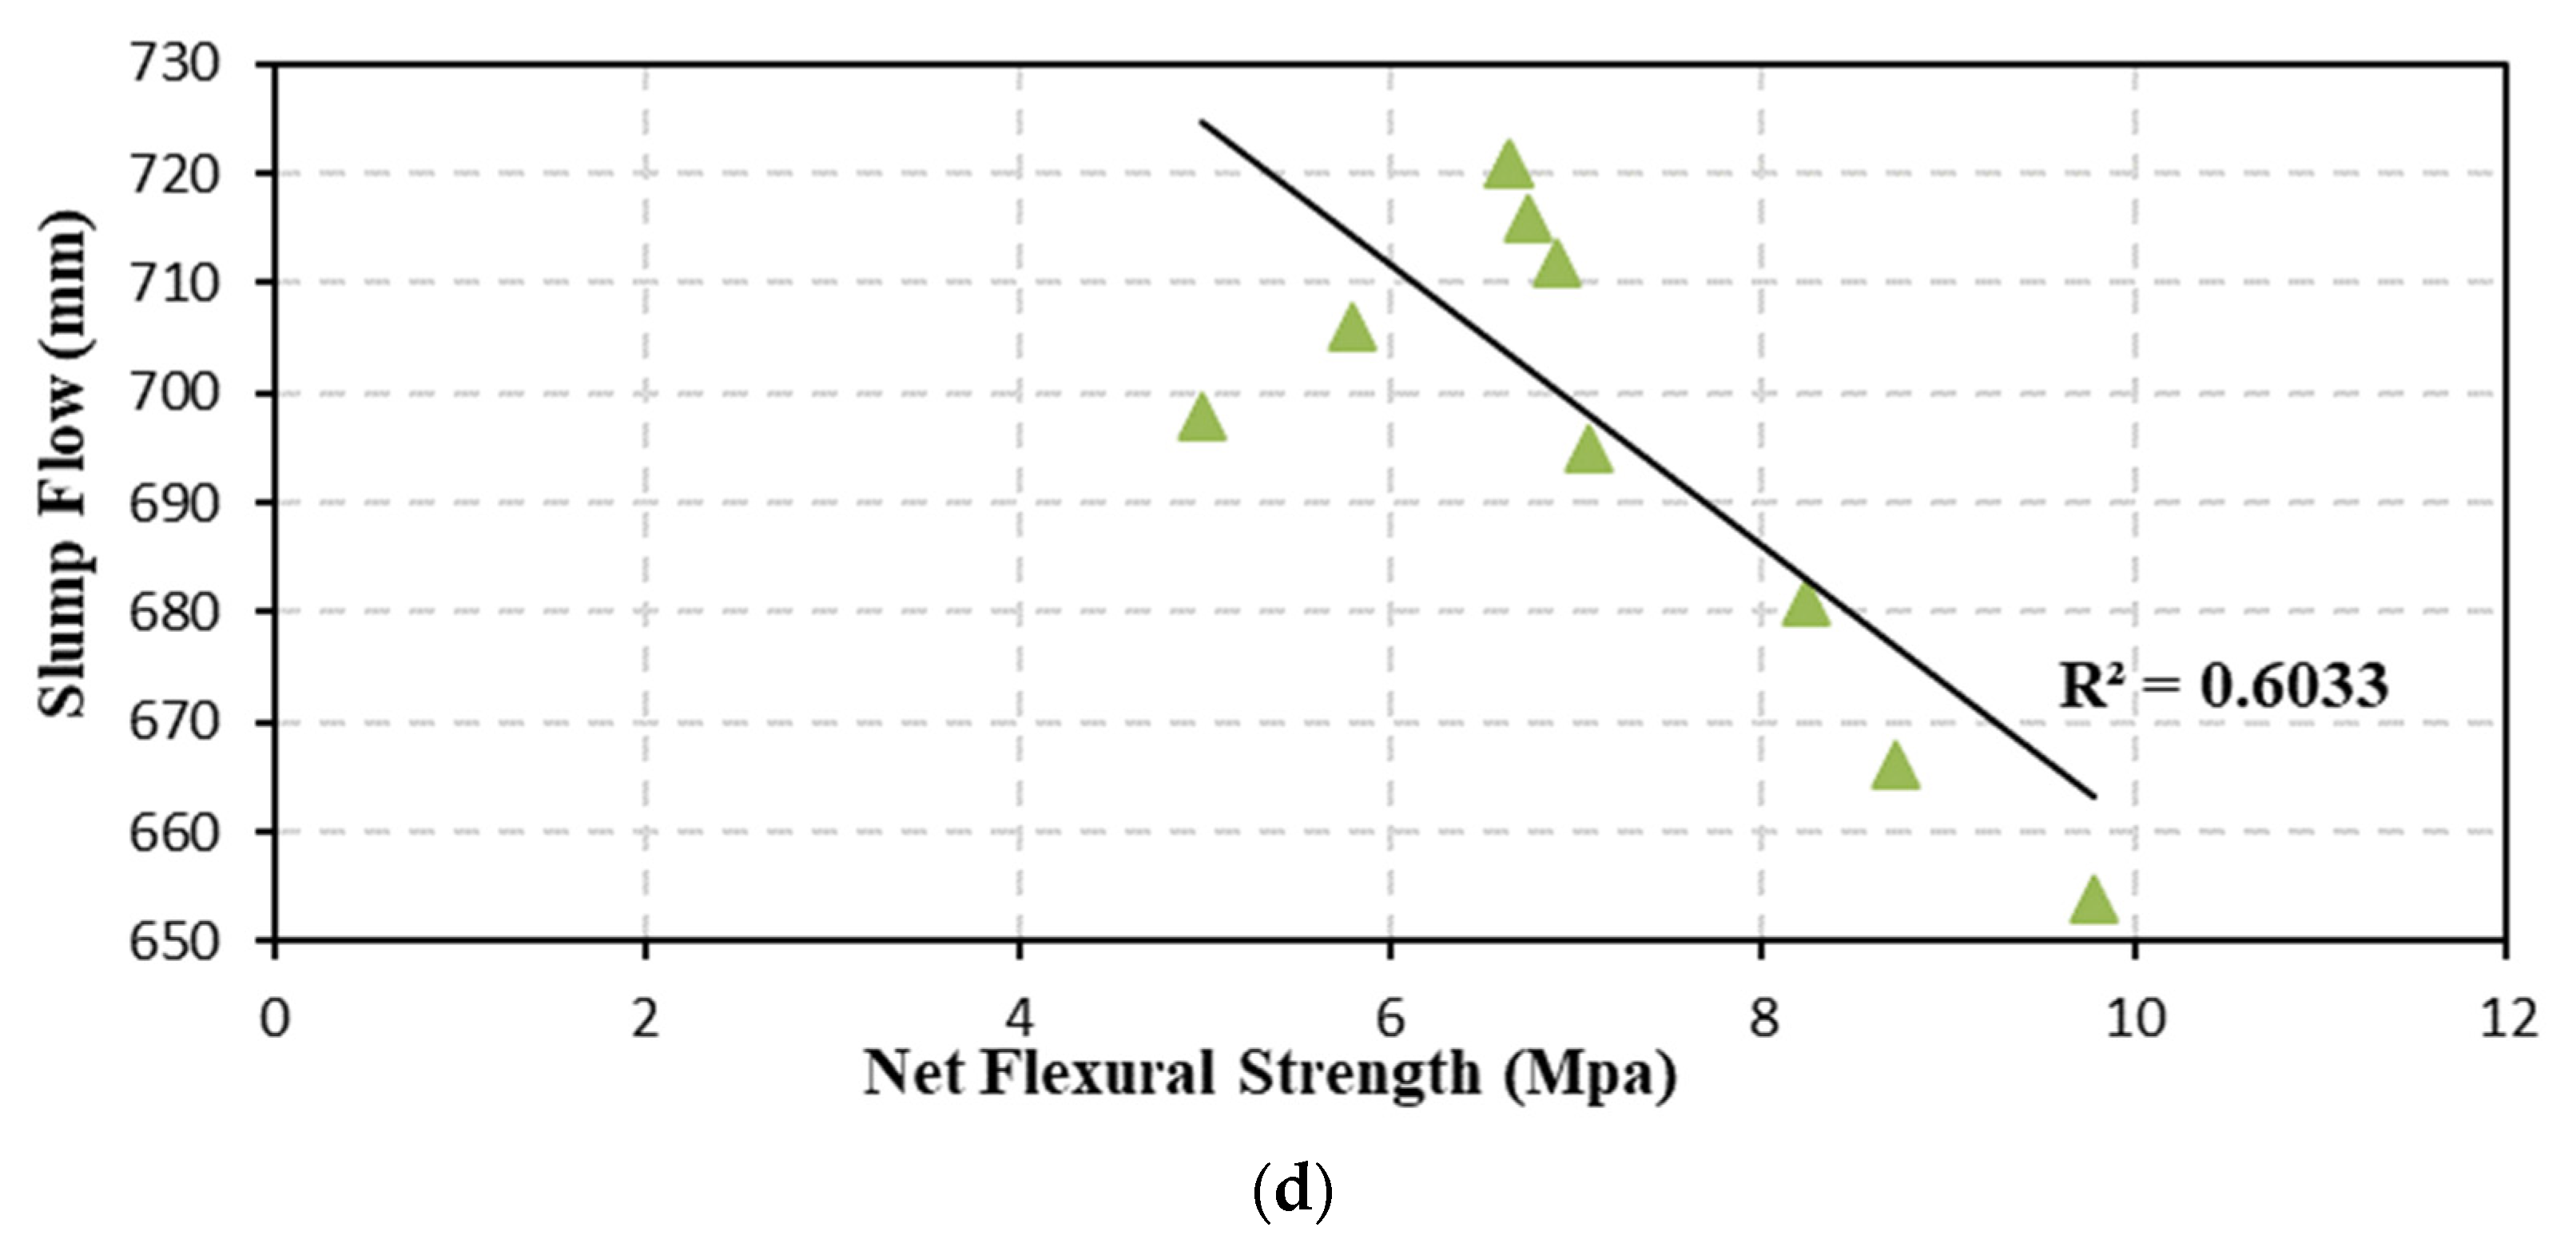
3.3. Relationship and Correlation among the Properties of A-ASCC

Researchers must determine the correlation of experimental data to assess the experimental outcomes. In theory, the key elements influencing the fresh and mechanical properties of concretes are aggregate, w/b, and cementitious binder content. As previously specified, the compressive strength values of concrete have a substantial effect on the mechanical properties of the concrete. The effect of MK and NS incorporation on the characteristics of A-ASCC was investigated in this study. As a result, the fresh and hardened characteristics of A-ASCC based on this parameter, as well as the correlation and relationship between the experimental data, were investigated. As presented in Figure 18, close relationships were found between v-funnel and slump flow (R2: 0.9008), L-box and slump flow (R2: 0.9565), and slump flow and T50 time (R2: 0.9525). Based on the R2 values, it is possible to conclude that there is a strong relationship between slump flow and other properties, even in the presence of both MK and NS.
The results, on the other hand, showed a notable strong correlation between the mechanical characteristics and slump flow of A-ASCC, as seen in Figure 19. The excellent correlation has high coefficient (R2) values, indicating that slump-flow values had a considerable influence on the mechanical properties of A-ASCC despite the existence of MK and NS. Furthermore, there are good relationships between the hardened performances of A-ASCC. As illustrated in Figure 20, the correlation between compressive strength and net flexural tensile strength; compressive strength and bond strength; and compressive strength and fracture energy is strong. Despite the addition of MK and NS, it is possible to conclude that there are superior correlations between A-ASCC hardened performance and fresh performance. The fresh properties of A-ASCC had a substantial effect on its hardened properties. As a result, high fresh characteristics are an essential requirement to achieve superior A-ASCC specimens with good mechanical properties.

3.4. Statistical Analysis of the Experimental Result

A general linear model analysis of variance (GLM-ANOVA) was performed at a significant level of 0.05 to investigate the variation in the performance of the A-ASCC with different concentrations of NS and/or MK in detail. The concretes’ dependent variables were L-box height ratio, slump flow time, v-funnel flow time, slump-flow diameter, fracture toughness, bond strength, net flexural tensile strength, compressive strength, and critical-stress intensity factor, while the independent variables were MK and NS replacement level. To find the statistically significant components, statistical analysis was performed (p-level 0.05). A p-value less than 0.05 showed that the relevant parameter was significant in the test results. In addition, the % contribution was calculated to provide information on the parameter’s effect on overall performance. If this value is more than one, it is acceptable, since the parameter has a considerable influence on overall performance. The percentage contributions of each component to the final conclusions are shown in Table 6. The MK substitution was shown to have a bigger impact on fresh-state results than the NS insertion (v-funnel flow time, L-box ratio, T500 flow time, slump flow). Furthermore, MK was revealed to have a greater impact on the compressive strength of the specimens than NS. In contrast, the addition of NS and MK was shown to have the largest impact on bond and flexural performance.
A similar result was observed in a previous study. Guneyisi et al. [76] investigated the impact of MK and steel fiber on the properties of conventional concrete and determined that the type and volume of steel fiber had a slight effect on the compressive strength of concrete; however, the effect of steel fiber was shown to be dominant on the bonding strength and flexural tensile strength. The combination of these two criteria together reduces fresh-state performance. Meanwhile, by mixing steel fiber and MK, the mechanical properties of the specimens were substantially enhanced. The fracture energy, bending strength and bond/or bond strength of A-ASCC with and without NS and steel fiber was investigated by previous studies; the NS significantly improved the bending and bond strength of A-ASCC and the enhancement increased with the combined use of NS and steel fiber [31,32].

4. Conclusions

The effect of MK and NS use on the fresh and hardened behavior of A-ASCC was examined in this work. The findings are summarized below;
  • The use of nano-silica and metakaolin reduced v-funnel flow time, L-box passing ability, T50 flow time, and slump flow in fresh-state tests. The highest reduction in fresh performance was observed in mixes with the highest NS (4%) and/or MK ratios (20%). Even in this case, the A-ASCC mixes satisfied the EFNARC and TS 12,350 flowability and passing-ability standards.
  • Adding more NS and/or MK to the A-ASCC mixture improved resistance to segregation and bleeding, and NS and/or MK-containing mixtures were shown to be more cohesive than non-NS and/or non-MK-containing mixes.
  • EFNARC confirmed that all A-ASCC mixes were in the VS2/VF2 viscosity class, which has good bleeding and segregation resistance and low formwork pressure, based on v-funnel and slump-flow tests.
  • The inclusion of nano-silica (up to 2% in the A-ASCC mixes) increased compressive strength somewhat but decreased with an increase in the NS ratio (more than 2%), whereas metakaolin considerably enhanced the compressive strength of A-ASCC specimens.
  • The inclusion of NS and/or MK significantly increased the bond strength, flexural strength, fracture energy, and stress intensity factor of A-ASCC specimens. Mechanical performance was greatest in specimens with the highest concentrations of metakaolin (20%) and/or nano-silica (up to 2%).
  • NS and/or MK were used to obtain the highest binding strength. The maximum improvement was 8.8% and 22.2% for specimens with 2% NS and 20% MK, respectively. As a result, it can be concluded that the optimal NS/MK ratio for achieving the best fresh and hardened performance of FA-based A-ASCC was 2% and 20%, respectively.
  • The statistical analysis revealed that all of the independent variables had a significant influence on the features of A-ASCC (both fresh and hardened properties). The most critical components were shown to be the addition of nano-silica and metakaolin. The inclusion of metakaolin had a stronger impact on the specimens’ fresh performance (v-funnel flow time, L-box passage ability, T50 flow time, and slump flow) and compressive strength than the addition of nano-silica. The inclusion of NS and MK, on the other hand, was discovered to be the most relevant variable in the A-ASCC specimens’ flexural tensile strength, fracture energy, and bond-strength performances.

Funding

This research received no external funding.

Institutional Review Board Statement

Not applicable.

Informed Consent Statement

Not applicable.

Data Availability Statement

Generated during the experimental study.

Acknowledgments

Kindly I would like to express thanks and my sincere gratitude to Abdulkadir Çevik and the University of Gaziantep, department of civil engineering for continuous support during the experimental work and for providing guidance in the present for a successful academic future.

Conflicts of Interest

The authors declare no conflict of interest.

References

  1. Hardjito, D.; Rangan, B.V. Development and Properties of Low-Calcium Fly Ash-Based Geopolymer Concrete; Curtin Research Publications: Bentley, WA, Australia, 2005. [Google Scholar]
  2. Rangan, B.V. Low-Calcium, Fly-Ash-Based Geopolymer Concrete. In Concrete Construction Engineering Handbook; Taylor & Francis Group: Boca Raton, FL, USA, 2008. [Google Scholar]
  3. Temuujin, J.; van Riessen, A.; MacKenzie, K.J.D. Preparation and Characterisation of Fly Ash Based Geopolymer Mortars. Constr. Build. Mater. 2010, 24, 1906–1910. [Google Scholar] [CrossRef]
  4. Kong, D.L.Y.; Sanjayan, J.G. Damage Behavior of Geopolymer Composites Exposed to Elevated Temperatures. Cem. Concr. Compos. 2008, 30, 986–991. [Google Scholar] [CrossRef]
  5. Davidovits, J. Geopolymers—Inorganic Polymeric New Materials. J. Therm. Anal. 1991, 37, 1633–1656. [Google Scholar] [CrossRef]
  6. Duxson, P.; Fernández-Jiménez, A.; Provis, J.L.; Lukey, G.C.; Palomo, A.; Van Deventer, J.S.J. Geopolymer Technology: The Current State of the Art. J. Mater. Sci. 2007, 42, 2917–2933. [Google Scholar] [CrossRef]
  7. Hardjito, D.; Wallah, S.E.; Sumajouw, D.M.J.; Rangan, B.V. On the Development of Fly Ash-Based Geopolymer Concrete. Mater. J. 2004, 101, 467–472. [Google Scholar]
  8. Nazari, A.; Sanjayan, J.G. Modelling of Compressive Strength of Geopolymer Paste, Mortar and Concrete by Optimized Support Vector Machine. Ceram. Int. 2015, 41, 12164–12177. [Google Scholar] [CrossRef]
  9. Davidovits, J. High-Alkali Cements for 21st Century Concretes. ACI Spec. Publ. 1994, 144, 383–398. [Google Scholar]
  10. Ghezal, A.; Khayat, K.H. Optimizing Self-Consolidating Concrete with Limestone Filler by Using Statistical Factorial Design Methods. Mater. J. 2002, 99, 264–272. [Google Scholar]
  11. Khayat, K.H. Optimization and Performance of Air-Entrained, Self-Consolidating Concrete. Mater. J. 2000, 97, 526–535. [Google Scholar]
  12. Khayat, K.H.; Paultre, P.; Tremblay, S. Structural Performance and In-Place Properties of Self-Consolidating Concrete Used for Casting Highly Reinforced Columns. Mater. J. 2001, 98, 371–378. [Google Scholar]
  13. Felekoglu, B.; Turkel, S.; Baradan, B. Lent Effect of Water/Cement Ratio on the Fresh and Hardened Properties of Self-Compacting Concrete. Build. Environ. 2007, 42, 1795–1802. [Google Scholar] [CrossRef]
  14. Ferraris, C.F.; Brower, L.; Ozyildirim, C.; Daczko, J. Workability of Self-Compacting Concrete. In Proceedings of the Economical Solution for Durable Bridges and Transportation Structures, International Symposium on High Performance Concrete, PCI/FHWA/FIB, Orlando, FL, USA, 25–27 September 2000; pp. 398–407. [Google Scholar]
  15. Xie, J.; Wang, J.; Rao, R.; Wang, C.; Fang, C. Effects of Combined Usage of GGBS and Fly Ash on Workability and Mechanical Properties of Alkali Activated Geopolymer Concrete with Recycled Aggregate. Compos. Part B Eng. 2019, 164, 179–190. [Google Scholar] [CrossRef]
  16. Noushini, A.; Aslani, F.; Castel, A.; Gilbert, R.I.; Uy, B.; Foster, S. Compressive Stress-Strain Model for Low-Calcium Fly Ash-Based Geopolymer and Heat-Cured Portland Cement Concrete. Cem. Concr. Compos. 2016, 73, 136–146. [Google Scholar] [CrossRef]
  17. Kurtoğlu, A.E.; Alzeebaree, R.; Aljumaili, O.; Niş, A.; Gülşan, M.E.; Humur, G.; Çevik, A. Mechanical and Durability Properties of Fly Ash and Slag Based Geopolymer Concrete. Adv. Concr. Constr. 2018, 6, 345. [Google Scholar] [CrossRef]
  18. Zhang, P.; Zheng, Y.; Wang, K.; Zhang, J. A Review on Properties of Fresh and Hardened Geopolymer Mortar. Compos. Part B Eng. 2018, 152, 79–95. [Google Scholar] [CrossRef]
  19. Khaloo, A.; Raisi, E.M.; Hosseini, P.; Tahsiri, H. Mechanical Performance of Self-Compacting Concrete Reinforced with Steel Fibers. Constr. Build. Mater. 2014, 51, 179–186. [Google Scholar] [CrossRef]
  20. Alzeebaree, R.; Çevik, A.; Nematollahi, B.; Sanjayan, J.; Mohammedameen, A.; Gülşan, M.E. Mechanical Properties and Durability of Unconfined and Confined Geopolymer Concrete with Fiber Reinforced Polymers Exposed to Sulfuric Acid. Constr. Build. Mater. 2019, 215, 1015–1032. [Google Scholar] [CrossRef]
  21. Albegmprli, H.M.; Al-Qazzaz, Z.K.A.; Rejeb, S.K. Strength Performance of Alkali Activated Structural Lightweight Geopolymer Concrete Exposed to Acid. Ceram. Int. 2022, 48, 6867–6873. [Google Scholar] [CrossRef]
  22. Sobolev, K.; Flores, I.; Hermosillo, R.; Torres-Martínez, L.M. Nanomaterials and Nanotechnology for High-Performance Cement Composites. In Proceedings of the ACI Session on Nanotechnology of Concrete: Recent Developments and Future Perspectives, Denver, CO, USA, 7 November 2006; pp. 91–118. [Google Scholar]
  23. Qing, Y.; Zenan, Z.; Deyu, K.; Rongshen, C. Influence of Nano-SiO2 Addition on Properties of Hardened Cement Paste as Compared with Silica Fume. Constr. Build. Mater. 2007, 21, 539–545. [Google Scholar] [CrossRef]
  24. Li, H.; Xiao, H.; Yuan, J.; Ou, J. Microstructure of Cement Mortar with Nano-Particles. Compos. Part B Eng. 2004, 35, 185–189. [Google Scholar] [CrossRef]
  25. Çevik, A.; Alzeebaree, R.; Humur, G.; Niş, A.; Gülşan, M.E. Effect of Nano-Silica on the Chemical Durability and Mechanical Performance of Fly Ash Based Geopolymer Concrete. Ceram. Int. 2018, 44, 12253–12264. [Google Scholar] [CrossRef]
  26. Görhan, G.; Aslaner, R.; Sinik, O. The Effect of Curing on the Properties of Metakaolin and Fly Ash-Based Geopolymer Paste. Compos. Part B Eng. 2016, 97, 329–335. [Google Scholar] [CrossRef]
  27. Alzeebaree, R.; Gülsan, M.E.; Nis, A.; Mohammedameen, A.; Cevik, A. Performance of FRP Confined and Unconfined Geopolymer Concrete Exposed to Sulfate Attacks. Steel Compos. Struct. 2018, 29, 201–218. [Google Scholar] [CrossRef]
  28. Belkowitz, J.S. An Investigation of Nano Silica in the Cement Hydration Process. Ph.D. Thesis, University of Denver, Denver, CO, USA, 2009. [Google Scholar]
  29. Quercia, G.; Brouwers, H.J.H. Application of Nano-Silica (NS) in Concrete Mixtures. In Proceedings of the 8th Ph.D. Symposium, Copenhagen, Denmark, 20–23 June 2010. [Google Scholar]
  30. Alzeebaree, R.; Çevik, A.; Mohammedameen, A.; Niş, A.; Gülşan, M.E. Mechanical Performance of FRP-Confined Geopolymer Concrete under Seawater Attack. Adv. Struct. Eng. 2019, 23, 1055–1073. [Google Scholar] [CrossRef]
  31. Eren, N.A.; Alzeebaree, R.; Çevik, A.; Niş, A.; Mohammedameen, A.; Gülşan, M.E. Fresh and Hardened State Performance of Self-Compacting Slag Based Alkali Activated Concrete Using Nanosilica and Steel Fiber. J. Compos. Mater. 2021, 55, 4125–4139. [Google Scholar] [CrossRef]
  32. Gülşan, M.E.; Alzeebaree, R.; Rasheed, A.A.; Niş, A.; Kurtoğlu, A.E. Development of Fly Ash/Slag Based Self-Compacting Geopolymer Concrete Using Nano-Silica and Steel Fiber. Constr. Build. Mater. 2019, 211, 271–283. [Google Scholar] [CrossRef]
  33. Dheyaaldin, M.H.; Mosaberpanah, M.A.; Alzeebaree, R. Performance of Fiber-Reinforced Alkali-Activated Mortar with/without Nano Silica and Nano Alumina. Sustainability 2022, 14, 2527. [Google Scholar] [CrossRef]
  34. Dheyaaldin, M.H.; Mosaberpanah, M.A.; Alzeebaree, R. Shrinkage Behavior and Mechanical Properties of Alkali Activated Mortar Incorporating Nanomaterials and Polypropylene Fibers. Ceram. Int. 2022, in press. [Google Scholar] [CrossRef]
  35. Adak, D.; Sarkar, M.; Mandal, S. Effect of Nano-Silica on Strength and Durability of Fly Ash Based Geopolymer Mortar. Constr. Build. Mater. 2014, 70, 453–459. [Google Scholar] [CrossRef]
  36. Gao, X.; Yu, Q.L.; Brouwers, H.J.H. Characterization of Alkali Activated Slag—Fly Ash Blends Containing Nano-Silica. Constr. Build. Mater. 2015, 98, 397–406. [Google Scholar] [CrossRef]
  37. Lahoti, M.; Wong, K.K.; Tan, K.H.; Yang, E.-H. Effect of Alkali Cation Type on Strength Endurance of Fly Ash Geopolymers Subject to High Temperature Exposure. Mater. Des. 2018, 154, 8–19. [Google Scholar] [CrossRef]
  38. Chuah, S.; Duan, W.H.; Pan, Z.; Hunter, E.; Korayem, A.H.; Zhao, X.-L.; Collins, F.; Sanjayan, J.G. The Properties of Fly Ash Based Geopolymer Mortars Made with Dune Sand. Mater. Des. 2016, 92, 571–578. [Google Scholar] [CrossRef]
  39. Nazari, A.; Bagheri, A.; Sanjayan, J.G.; Dao, M.; Mallawa, C.; Zannis, P.; Zumbo, S. Thermal Shock Reactions of Ordinary Portland Cement and Geopolymer Concrete: Microstructural and Mechanical Investigation. Constr. Build. Mater. 2019, 196, 492–498. [Google Scholar] [CrossRef]
  40. Daniel, A.J.; Sivakamasundari, S.; Abhilash, D. Comparative Study on the Behaviour of Geopolymer Concrete with Hybrid Fibers under Static Cyclic Loading. Procedia Eng. 2017, 173, 417–423. [Google Scholar] [CrossRef]
  41. Kathirvel, P.; Kaliyaperumal, S.R.M. Influence of Recycled Concrete Aggregates on the Flexural Properties of Reinforced Alkali Activated Slag Concrete. Constr. Build. Mater. 2016, 102, 51–58. [Google Scholar] [CrossRef]
  42. He, J.; Jie, Y.; Zhang, J.; Yu, Y.; Zhang, G. Synthesis and Characterization of Red Mud and Rice Husk Ash-Based Geopolymer Composites. Cem. Concr. Compos. 2013, 37, 108–118. [Google Scholar] [CrossRef]
  43. Zabihi, S.M.; Tavakoli, H.; Mohseni, E. Engineering and Microstructural Properties of Fiber-Reinforced Rice Husk–Ash Based Geopolymer Concrete. J. Mater. Civ. Eng. 2018, 30, 4018183. [Google Scholar] [CrossRef]
  44. Heah, C.Y.; Kamarudin, H.; Al Bakri, A.M.M.; Binhussain, M.; Luqman, M.; Nizar, I.K.; Ruzaidi, C.M.; Liew, Y.M. Effect of Curing Profile on Kaolin-Based Geopolymers. Phys. Procedia 2011, 22, 305–311. [Google Scholar] [CrossRef] [Green Version]
  45. Okoye, F.N.; Durgaprasad, J.; Singh, N.B. Mechanical Properties of Alkali Activated Flyash/Kaolin Based Geopolymer Concrete. Constr. Build. Mater. 2015, 98, 685–691. [Google Scholar] [CrossRef]
  46. Weng, L.; Sagoe-Crentsil, K. Dissolution Processes, Hydrolysis and Condensation Reactions during Geopolymer Synthesis: Part I—Low Si/Al Ratio Systems. J. Mater. Sci. 2007, 42, 2997–3006. [Google Scholar] [CrossRef]
  47. Yao, X.; Zhang, Z.; Zhu, H.; Chen, Y. Geopolymerization Process of Alkali–Metakaolinite Characterized by Isothermal Calorimetry. Thermochim. Acta 2009, 493, 49–54. [Google Scholar] [CrossRef]
  48. Yunsheng, Z.; Wei, S. Semi-Empirical AM1 Calculations on 6-Memebered Alumino-Silicate Rings Model: Implications for Dissolution Process of Metakaoline in Alkaline Solutions. J. Mater. Sci. 2007, 42, 3015–3023. [Google Scholar] [CrossRef]
  49. Yunsheng, Z.; Wei, S.; Zongjin, L.; Yantao, J. Study of Polycondensation Process of Metakaolin-Based Geopolymeric Cement Using Semi-Empirical AM1 Calculations. Adv. Cem. Res. 2009, 21, 67–73. [Google Scholar] [CrossRef]
  50. Albidah, A.; Altheeb, A.; Alrshoudi, F.; Abadel, A.; Abbas, H.; Al-Salloum, Y. Bond Performance of GFRP and Steel Rebars Embedded in Metakaolin Based Geopolymer Concrete. In Proceedings of the Structures; Elsevier: Amsterdam, The Netherlands, 2020; Volume 27, pp. 1582–1593. [Google Scholar]
  51. Muñiz-Villarreal, M.S.; Manzano-Ramírez, A.; Sampieri-Bulbarela, S.; Gasca-Tirado, J.R.; Reyes-Araiza, J.L.; Rubio-Ávalos, J.C.; Pérez-Bueno, J.J.; Apatiga, L.M.; Zaldivar-Cadena, A.; Amigó-Borrás, V. The Effect of Temperature on the Geopolymerization Process of a Metakaolin-Based Geopolymer. Mater. Lett. 2011, 65, 995–998. [Google Scholar] [CrossRef]
  52. Perera, D.S.; Uchida, O.; Vance, E.R.; Finnie, K.S. Influence of Curing Schedule on the Integrity of Geopolymers. J. Mater. Sci. 2007, 42, 3099–3106. [Google Scholar] [CrossRef]
  53. Rovnaník, P. Effect of Curing Temperature on the Development of Hard Structure of Metakaolin-Based Geopolymer. Constr. Build. Mater. 2010, 24, 1176–1183. [Google Scholar] [CrossRef]
  54. Mohseni, E. Assessment of Na2SiO3 to NaOH Ratio Impact on the Performance of Polypropylene Fiber-Reinforced Geopolymer Composites. Constr. Build. Mater. 2018, 186, 904–911. [Google Scholar] [CrossRef]
  55. Pires, E.F.C.; de Azevedo, C.M.C.; Pimenta, A.R.; da Silva, F.J.; Darwish, F.A.I. Fracture Properties of Geopolymer Concrete Based on Metakaolin, Fly Ash and Rice Rusk Ash. Mater. Res. 2017, 20, 630–636. [Google Scholar] [CrossRef] [Green Version]
  56. Pouhet, R.; Cyr, M. Formulation and Performance of Flash Metakaolin Geopolymer Concretes. Constr. Build. Mater. 2016, 120, 150–160. [Google Scholar] [CrossRef]
  57. Xie, J.; Chen, W.; Wang, J.; Fang, C.; Zhang, B.; Liu, F. Coupling Effects of Recycled Aggregate and GGBS/Metakaolin on Physicochemical Properties of Geopolymer Concrete. Constr. Build. Mater. 2019, 226, 345–359. [Google Scholar] [CrossRef]
  58. Alanazi, H.; Yang, M.; Zhang, D.; Gao, Z. Early Strength and Durability of Metakaolin-Based Geopolymer Concrete. Mag. Concr. Res. 2017, 69, 46–54. [Google Scholar] [CrossRef]
  59. Zhang, H.Y.; Qiu, G.H.; Kodur, V.; Yuan, Z.S. Spalling Behavior of Metakaolin-Fly Ash Based Geopolymer Concrete under Elevated Temperature Exposure. Cem. Concr. Compos. 2020, 106, 103483. [Google Scholar] [CrossRef]
  60. Memon, F.A.; Nuruddin, M.F.; Khan, S.; Shafiq, N.; Ayub, T. Effect of Sodium Hydroxide Concentration on Fresh Properties and Compressive Strength of Self-Compacting Geopolymer Concrete. J. Eng. Sci. Technol. 2013, 8, 44–56. [Google Scholar]
  61. Olivia, M.; Nikraz, H. Properties of Fly Ash Geopolymer Concrete Designed by Taguchi Method. Mater. Des. 2012, 36, 191–198. [Google Scholar] [CrossRef] [Green Version]
  62. EFNARC The European Guidelines for Self-Compacting Concrete: Specification, Production and Use. In The European Guidelines for Self Compacting Concrete; The European Project Group: Gdańsk, Poland, 2005; p. 68.
  63. Memon, F.A.; Nuruddin, M.F.; Demie, S.; Shafiq, N. Effect of Curing Conditions on Strength of Fly Ash-Based Self-Compacting Geopolymer Concrete. Int. J. Civ. Environ. Eng. 2011, 3, 183–186. [Google Scholar]
  64. ASTM C39/C39M-01; Standard Test Method for Compressive Strength of Cylindrical Concrete Specimens. ASTM: West Conshohocken, PA, USA, 2003.
  65. RILEM 50-FMC Committee of Fracture Mechanics of Concrete. Determination of the Fracture Energy of Mortar and Concrete by Means of Three-Point Bend Tests on Notched Beams. Mater. Struct. 1985, 18, 285–290. [Google Scholar]
  66. Peterson, P.E. Fracture Energy of Concrete: Method of Determination. Cem. Concr. Res. 1980, 10, 79–89. [Google Scholar] [CrossRef]
  67. RILEM RC 6. Recommendations for the Testing and Use of Constructions Materials Bond Test for Reinforcement Steel. 2. Pull-Out Test; E & FN SPON: Washington, DC, USA, 1996; p. 3. [Google Scholar]
  68. EN, B. 12350-8; Testing Self Compacting Concrete: Slump Flow Test. British Standards International: London, UK, 2010.
  69. Van Jaarsveld, J.G.S.; Van Deventer, J.S.J.; Lukey, G.C. The Characterisation of Source Materials in Fly Ash-Based Geopolymers. Mater. Lett. 2003, 57, 1272–1280. [Google Scholar] [CrossRef]
  70. Chithra, S.; Kumar, S.R.R.S.; Chinnaraju, K. The Effect of Colloidal Nano-Silica on Workability, Mechanical and Durability Properties of High Performance Concrete with Copper Slag as Partial Fine Aggregate. Constr. Build. Mater. 2016, 113, 794–804. [Google Scholar] [CrossRef]
  71. Madandoust, R.; Mousavi, S.Y. Fresh and Hardened Properties of Self-Compacting Concrete Containing Metakaolin. Constr. Build. Mater. 2012, 35, 752–760. [Google Scholar] [CrossRef]
  72. EN, B. 12350-9; Testing Self Compacting Concrete: V-Funnel Test. British Standards International: London, UK, 2010.
  73. EN, B. 12350-10; Testing Self Compacting Concrete: L-Box Test. British Standards International: London, UK, 2010.
  74. Belkowitz, J.S.; Belkowitz, W.L.B.; Nawrocki, K.; Fisher, F.T. Impact of Nanosilica Size and Surface Area on Concrete Properties. ACI Mater. J. 2015, 112, 419–427. [Google Scholar] [CrossRef]
  75. Nili, M.; Afroughsabet, V. Combined Effect of Silica Fume and Steel Fibers on the Impact Resistance and Mechanical Properties of Concrete. Int. J. Impact Eng. 2010, 37, 879–886. [Google Scholar] [CrossRef] [Green Version]
  76. Güneyisi, E.; Gesoǧlu, M.; Akoi, A.O.M.; Mermerdaş, K. Combined Effect of Steel Fiber and Metakaolin Incorporation on Mechanical Properties of Concrete. Compos. Part. B Eng. 2014, 56, 83–91. [Google Scholar] [CrossRef]
  77. Saini, G.; Vattipalli, U. Assessing Properties of Alkali Activated GGBS Based Self-Compacting Geopolymer Concrete Using Nano-Silica. Case Stud. Constr. Mater. 2020, 12, e00352. [Google Scholar] [CrossRef]
  78. Nazari, A.; Riahi, S. The Role of SiO2 Nanoparticles and Ground Granulated Blast Furnace Slag Admixtures on Physical, Thermal and Mechanical Properties of Self Compacting Concrete. Mater. Sci. Eng. A 2011, 528, 2149–2157. [Google Scholar] [CrossRef]
  79. Adesina, A. Durability Enhancement of Concrete Using Nanomaterials: An Overview. In Proceedings of the Materials Science Forum; Trans Tech Publications: Bäch, Switzerland, 2019; Volume 967, pp. 221–227. [Google Scholar]
  80. Adesina, A. Nanomaterials in Cementitious Composites: Review of Durability Performance. J. Build. Pathol. Rehabil. 2020, 5, 21. [Google Scholar] [CrossRef]
  81. Alanazi, H.; Yang, M.; Zhang, D.; Gao, Z.J. Bond Strength of PCC Pavement Repairs Using Metakaolin-Based Geopolymer Mortar. Cem. Concr. Compos. 2016, 65, 75–82. [Google Scholar] [CrossRef]
  82. Davidovits, J. Geopolymer Chemistry and Applications, 2nd ed.; Geopolymer Institute: Saint-Quentin, Paris, 2008. [Google Scholar]
  83. Kamarudin, H.; Al Bakri, A.M.; Binhussain, M.; Ruzaidi, C.M.; Luqman, M.; Heah, C.Y.; Liew, Y.M. Preliminary Study on Effect of NaOH Concentration on Early Age Compressive Strength of Kaolin-Based Green Cement. In Proceedings of the International Conference on Chemistry and Chemical Process IPCBEE, Bangkok, Thailand, 7–9 May 2011; Volume 10, pp. 18–24. [Google Scholar]
  84. Sarker, P.K.; Haque, R.; Ramgolam, K.V. Fracture Behaviour of Heat Cured Fly Ash Based Geopolymer Concrete. Mater. Des. 2013, 44, 580–586. [Google Scholar] [CrossRef]
  85. ACI 363R-92. State of the Art Report on High Strength Concrete; American Concrete Institute: Detroit, MI, USA, 1992; pp. 363R1–363R55. [Google Scholar]
  86. Committee Euro International Du Beton (CEB-FIB). CEB-FIB Model Code; Thomas Telford: London, UK, 1990. [Google Scholar]
Figure 1. Materials used to produce the A-ASCC mixtures.
Sustainability 14 06572 g001
Figure 2. The test devices used to conduct the fresh properties of A-ASCC mixes. (a) Slump flow test; (b) v-funnel flow test; (c) l-box passing ability test [62].
Sustainability 14 06572 g002
Figure 3. Test apparatus and specimens exposed to three bending loading. (a) Detail of flexural test machine; (b) prism under flexural test; (c) the geometry of the test specimen.
Sustainability 14 06572 g003
Figure 4. The dimensions and details of the A-ASCC specimen used for the bonding strength test.
Sustainability 14 06572 g004
Figure 5. The test setup and specimens used in the pull-out test. (a) Installing the test device; (b) A-ASCC specimen under pull-out test.
Sustainability 14 06572 g005
Figure 6. The slump-flow values of A-ASCC mixtures vs. MK and NS replacement ratio.
Sustainability 14 06572 g006
Figure 7. The T50 duration of A-ASCC mixes vs. MK and NS replacement ratio.
Sustainability 14 06572 g007
Figure 8. The v-funnel duration of A-ASCC mixes vs. the NS and MK replacement ratio (a), V-funnel time vs. T50 flow time relationships (b).
Sustainability 14 06572 g008
Figure 9. The effect of NS replacement level and MK content on the L-box height ratio.
Sustainability 14 06572 g009
Figure 10. The compressive strength of the A-ASCC vs. NS and MK replacement ratios.
Sustainability 14 06572 g010
Figure 11. The combined influence of MK and NS replacement on bond strength.
Sustainability 14 06572 g011
Figure 12. Typical bond failure patterns of A-ASCCs: (a) without NS and/or MK and (b) with NS and/or MK.
Sustainability 14 06572 g012
Figure 13. The load displacement of A-ASCC vs. MK and NS replacement ratio. (a) Effect of MK on A-ASCC mixes; (b) effect of NS on A-ASCC mixes.
Sustainability 14 06572 g013
Figure 14. The flexural strength vs. MK and NS replacement ratio.
Sustainability 14 06572 g014
Figure 15. The Fracture energy of A-ASCC vs. MK and/or NS replacement ratio.
Sustainability 14 06572 g015
Figure 16. The stress intensity factor (KIC) of A-ASCC vs. MK and/or NS replacement ratio.
Sustainability 14 06572 g016
Figure 17. The Fracture energy vs. compressive strength relationship.
Sustainability 14 06572 g017
Figure 18. Correlation between the fresh properties of A-ASCC. (a) T50 vs. slump flow; (b) L-box vs. slump flow; (c) v-Funnel vs. slump flow.
Sustainability 14 06572 g018
Figure 19. The hardened vs. fresh properties of the A-ASCC relationship. (a) Compressive strength vs. slump flow; (b) bond strength vs. slump flow; (c) fracture energy vs. slump flow; (d) net flexural tensile strength vs. slump flow.
Sustainability 14 06572 g019aSustainability 14 06572 g019b
Figure 20. The hardened performance of A-ASCC relationships. (a) Bond strength vs. compressive strength; (b) fracture energy vs. compressive strength; (c) compressive strength vs. net flexural tensile strength; (d) net flexural tensile strength vs. bond strength; (e) net flexural tensile strength vs. fracture energy; (f) fracture energy vs. compressive strength; (g) bond strength vs. KIC; (h) compressive strength vs. KIC.
Sustainability 14 06572 g020aSustainability 14 06572 g020bSustainability 14 06572 g020c
Table 1. The physical and chemical characteristic of NS, FA, MK and SG.
ComponentCaOSiO2Al2O3Fe2O3MgOSO3K2ONa2OLOISGBF (m2/kg)
MK (%)1.28750.99542.6312.1140.1270.4390.3370.2841.6402.5418,000
NS (%)-99.800------<1.0002.2015,000
FA (%)1.57862.33221.1397.1482.4030.1023.3690.3811.5812.27379
Table 2. The sieve analysis and physical properties of aggregates used in the production of A-ASCC.
Sieve Size (mm)1684210.50.25Specific GravityFineness ModulesAbsorption
Coarse Aggregate10031.01.50.750.250.250.652.725.652.4
Fine Aggregate10010010066.340.927.417.42.452.561.5
Table 3. Component of A-ASCCs mixes.
Code of MixtureBinderNa2SO3 + NaOHFANSMKFine
Agg.
Coarse
Agg.
MolaritySPExtra
Water
kg/m3kg/m3kg/m3kg/m3kg/m3kg/m3kg/m3%%
0MKNS050025050000790.83678.691257
0MKNS150025049550790.72678.611257
0MKNS2500250490100790.62678.521257
0MKNS3500250485150790.52678.431257
0MKNS4500250480200790.42678.351257
0MKNS050025050000790.825678.691257
5MKNS0500250475025787.68675.991257
10MKNS0500250450050784.53673.291257
15MKNS0500250425075781.38670.581257
20MKNS05002504000100778.23667.881257
Note: Mix No. 1 and No. 6 in this table are the same (control mixes) for comparison of the results of the mixes with and without NS and/or MK.
Table 4. The EFNARC specification and classification of A-ASCC mix fresh properties.
Classification of Slump Flow (SF)
ClassSF diameter [cm]
SF 155–65
SF 266–75
SF 376–85
Classification of Viscosity
ClassT50 [s]V-funnel [s]
VS1/VF1≤2≤8
VS2/VF2>29 to 25
Classification of Passing Ability (PA)
PA1≥0.8 with two rebar
PA2≥0.8 with three rebar
Table 5. Hardened properties of A-ASCC mixtures.
MixturesMK%NS%Compressive Strength (MPa)Bond Strength (MPa)Fracture Energy (N/m)KIC (MPa-mm½)Net Flexural Strength (MPa)Displacement (mm)
0MKNS00%0%54.418.52111.5719.544.130.45
0MKNS10%1%54.679.14113.7419.714.160.47
0MKNS20%2%54.869.27119.2619.994.220.49
0MKNS30%3%50.359.04107.8018.053.810.52
0MKNS40%4%45.368.51107.5116.643.510.55
0MKNS00%0%54.418.52111.5719.544.130.45
5MKNS05%0%60.099.04117.0720.284.280.48
10MKNS010%0%61.069.79120.9722.334.710.51
15MKNS015%0%67.6010.05124.8923.184.890.53
20MKNS020%0%68.8410.40133.8525.065.290.56
Table 6. Statistical analysis of the study’s result.
Dependent VariableIndependent VariableSequential Sum of SquaresMean SquareComputed Fp-ValueSignificantContribution (%)
Compressive strengthMK replacement level132.27132.755.050.005Yes70.91
NS replacement level50.2650.268.540.005Yes29.94
Error3.97 2.12
Total186.52
Bond strengthMK replacement level2.272.2790.630.001Yes0.05
NS replacement level0.00140.00140.0080.001Yes79.9
Error0.31 20.0
Total0.99980
Fracture energyMK replacement level19.7619.760.800.001Yes0.1
NS replacement level0.0250.02500.005Yes79.84
Error4.96 20.0
Total24.75
KICMK replacement level19.4319.43141.450.002Yes21.18
NS replacement level5.565.566.80.000Yes73.96
Error1.27 4.85
Total26.27
Net Flexure Tensile StrengthMK replacement level0.850.856.9800Yes62.15
NS replacement level0.250.2513400Yes18.3
Error0.27 19.52
Total1.38
DisplacementMK replacement level0.0070.0077290.0002Yes33.85
NS replacement level0.006250.006252670.00Yes29
Error0.008 37
Total0.02
Slump FlowMK replacement level2656.92656.9123.90.000Yes89.26
NS replacement level313.6313.6168000Yes10.5
Error6 0.2
Total2976.5
L-box height ratioMK replacement level0.260.02685.7400Yes10.9
NS replacement level0.0050.00543200Yes49.26
Error0.02 39.87
Total0.05
V-Funnel flow timeMK replacement level84.2784.2798.900Yes75.3
NS replacement level26.1426.14151.100Yes23.36
Error1.5 1.3
Total111.9
T-50 flow timeMK replacement level1.151.15129.5800Yes69.29
NS replacement level0.350.35109.7400Yes21.41
Error0.155 9.2
Total1.66
Publisher’s Note: MDPI stays neutral with regard to jurisdictional claims in published maps and institutional affiliations.

