Article

Consumer Concern and Willingness to Pay for Plastic Alternatives in Food Service

1
Coastal Research and Extension Center, Mississippi State University, Biloxi, MS 39532, USA
2
Department of Sociology, Anthropology, and Social Work, University of South Alabama, Mobile, AL 36688, USA
3
Mississippi-Alabama Sea Grant Consortium, Ocean Springs, MS 39564, USA
4
Department of Criminal Justice, Azusa Pacific University, Azusa, CA 91702, USA
*
Author to whom correspondence should be addressed.
Sustainability 2022, 14(10), 5992; https://doi.org/10.3390/su14105992
Submission received: 17 April 2022 / Revised: 10 May 2022 / Accepted: 12 May 2022 / Published: 15 May 2022
(This article belongs to the Special Issue Sustainable Management of Marine Debris)

Abstract

:
Plastic food service packaging represents a large source of plastic waste and marine debris. Currently, most food service business operators are resistant to changing to environmentally friendly alternatives due to perceived cost and loss of business due to passing these costs onto the consumer. To address these issues, we assessed the willingness of consumers to pay for plastic alternatives in both dine-in and takeout scenarios at restaurants in relation to levels of environmental concern, environmental identity, and demographics through a survey. Data were analyzed using a combination of descriptive statistics, regressions, and exploratory factor analyses. Of the 1371 survey responses, nearly 66% of respondents indicated they would be willing to pay 40 cents or more per person per meal at a restaurant for plastic alternatives and that this preference did not vary between dine-in and takeout scenarios. Additionally, education level and level of caring for the environment were the two most significant factors that increased willingness to pay for plastic alternatives.

1. Introduction

Plastic polymers became heavily used in the consumer goods market after WWII to make everything from bread bags to rigid plastic containers. Over the next decades, plastic production escalated to an estimated 360 million tons produced in 2020 [1]. In the United States, plastic makes up approximately 12% of municipal solid waste [2], and yet it represents 80% or more of the waste that accumulates on land, shorelines, ocean surfaces, and seabeds [3].
Coastal cleanups are valuable sources of data to better understand the plastic packaging and products that are accumulating in the environment. For example, data from Mississippi Coastal Cleanup in 2016–2021 show that a large portion of coastal debris is plastic [4,5,6,7,8,9]. The most common items found were cigarette butts, plastic beverage bottles, food wrappers, plastic bags, plastic bottle caps and lids, and small pieces of plastic. Aside from cigarette butts, consumer food packaging and food service packaging are the most found items in coastal cleanups. These results are consistent with other coastal cleanup efforts such as the overall International Coastal Cleanup [10].
Efforts to reduce plastic pollution are normally focused on the recovery of plastic through recycling and the removal of plastic waste from the environment through cleanups. Within the last 10 years, several grassroots initiatives have started on the US Gulf Coast to reflect a shift in focus toward prevention of use with a focus on restaurants, events, offices, and municipalities (e.g., Plastic Free Gulf Coast, Reduce the Use, Plastic Free Padre, and Ditch the Disposables). These initiatives focus on practices that can shift restaurants away from plastic to alternatives without increasing the cost to consumers and saving money through implementing biodegradable, such as paper or bagasse materials, and/or reusable dine in and takeout foodservice products, “Bring your Own” discounts, and items on request such as cutlery, takeout condiment packets, and straws. These initiatives have found limited success and are usually hindered by the tight margins in the foodservice industry, lack of social pressure to make a change, and the perceptions that biodegradable or plastic-free products will add costs that the restaurant will have to absorb because the consumer will not be willing to pay more [11].
There is a large body of research that has found consumers with favorable attitudes toward the environment are willing to pay premium prices for green products [12,13]. There is also a large body of research stating that environmental literacy and environmentally friendly attitudes expressed during a survey do not necessarily translate to action [13]. The research focused on consumer willingness to pay for ‘green’ products reports that willingness to pay self-reported by consumers in surveys is not being reflected in the purchasing data [14]. Most of the research on willingness to pay for environmental goods involves some measure of environmental concern as one of the explanatory variables. Environmental Concern (EC) has also been used as one of the explanatory variables for various ‘good’ environmental behaviors such as volunteering participation, recycling, purchasing environmentally friendly products, household energy use, and more [15,16,17,18,19]. In cases of willingness to pay, attitudinal variables have been found to be explanatory factors that improved the predictive power of estimating willingness to pay [20]. Thus, examining the environmental concerns of the Gulf of Mexico and of the issue of plastic pollution is important in explaining the willingness to pay for plastic alternatives.
Research into concern for the environment and how it corresponds to pro-environmental behavior have been extensive. Researchers have operationalized and tested theoretical constructs such as environmental consciousness, environmental concern, values, beliefs, attitudes, norms, self-schemas, intrinsic and extrinsic rewards, environmental knowledge, and self-identity [20,21,22,23,24,25,26]. General environmental attitudes are less telling than specific consumer beliefs, as specific beliefs have been found to be better predictors of green purchasing behavior [27]. The research on attitudes and environmental behavior demonstrates a modest relationship, the authors of [28,29,30,31,32] argue a major limitation of traditional attitude theory is that attitudes are conceptualized as somehow existing independent of social processes. One important set of social processes is the relationship between attitudes and behaviors to the construction of self-identity [32]. An identity is defined as a set of meanings attached to the self that locate and embed individuals with webs of social relationships [26]. The meanings serve as a standard that guides behavior in situations [32]. People are presumed to hold multiple identities that are more central to the broader self-concept [32,33], Attitudes that are part of one’s self-identity are more stable and have more of an emotional basis [29]. Research on self-identity shows that it is an important predictor of pro-environmental actions and behaviors [23,32,34]. For instance, a strong environmental identity is associated with pro-environment behaviors such as buying fair trade products, willingness to pay higher taxes for the preservation of open space, higher fees and costs for ecosystem services, and for carbon offsets [34,35,36,37].
In addition to environmental identity as a potential driver for willingness to pay for environmentally-friendly products, demographics could also play an important role. In previous studies, the relationship between demographics and willingness to pay for premium or ethical products has been variable [13,38,39,40]. Some key demographic indicators for willingness to pay for environmentally-friendly products or initiatives from other studies have included education level, income level, gender, race, and age [38,39,40,41,42]. However, no studies could be found that comprehensively explored all of these demographic factors in relation to willingness to pay for plastic-free alternatives at restaurants. Knowledge of how willingness to pay for plastic alternatives at restaurants varies by demographics could be utilized by the restaurant and marketing industry alike to develop effective social marketing strategies [43]. For example, a social marketing strategy of nudge messaging and subsequent internet searches has been proven to increase the willingness to pay for sustainable bottled water [44].
To fill these informational gaps, this study was designed with the specific objectives to: (1) examine self-reported concern for the Gulf of Mexico’s well-being and plastic pollution, (2) determine Environmental Identity, (3) examine willingness to pay for environmentally friendly food service products in restaurants, and (4) explore how demographics and environmental identity influence willingness to pay. Our hypotheses were that (1) the majority of respondents would express concern for the environment and plastic pollution, (2) most respondents would be willing to pay for plastic alternatives at restaurants, and (3) environmental identity and income level would be the largest predictors for willingness to pay high amounts for plastic alternatives at restaurants. Exploring customer concern, environmental identity, and willingness to pay for plastic alternatives could be useful to inform policies, such as the prohibition of plastic bans in some US states [45,46], and targeted outreach or training efforts focused on incorporating green practices into consumer-based industries. Additionally, increased knowledge of consumer preferences may provide valuable data that facilitate the transition to plastic alternatives without the need for legislation.

2. Materials and Methods

2.1. Survey Instrument and Implementation

Data used in this study are drawn from a subset of responses (described in the analyses section) to a survey developed by Mississippi State University (MSU) and the Mississippi-Alabama Sea Grant Consortium (MASGC) with support from the NOAA/Northern Gulf Institute minority internship program (Appendix A). The study and associated survey were approved by the Institutional Review Board of Mississippi State University (IRB-17-194). The survey was divided into six sections and had a total of 35 questions. Given the sensitivity of providing demographic information, Section 1 was optional and included the collection of the respondent’s zip code, gender, age, race/ethnicity, education, working status, marital status, household income, and household size. Section 2 examined consumer beliefs, such as their views and amount of concern regarding plastic pollution in the Gulf of Mexico. Section 3 focused on consumer knowledge by asking about familiarity with certain environmental terms. Section 4 asked about food lifestyle, such as how often they eat out or dine in. Section 5 asked about consumer preferences, and Section 6 asked about consumer willingness to pay for plastic alternatives (Appendix A). The survey was distributed to the public online using Qualtrics’ survey software tool and was promoted in-person and through email by Mississippi State University employees, the University of South Alabama Tourism and Hospitality Club, Mississippi Master Naturalist Program, the Mississippi-Alabama Sea Grant Consortium, and online through the Mississippi Coastal Cleanup website. The source of survey responses was not tracked, but the timing of in-person and email distributions indicated that well over 90% of survey responses were collected through these interactions and very few responses through the link on the Mississippi Coastal Cleanup website. A total of 1371 surveys with responses were collected between 2 August 2016 to 8 October 2018 with some questions having a variable number of responses. All collected data from survey responses for specific questions (described in the following section) were included in this study.

2.2. Analyses

The specific questions from the survey examined in this study were demographic questions 2–5 and question 8 from Section 1 (sex, age, race/ethnicity, education, income), environmental concern questions 10–14 in Section 2, and willingness to pay questions 33 and 34 from Section 6 (Appendix A). The proportion of each response (expressed as percentage) was assessed for each question and, in some instances, grouped for discussions of general trends.
Questions 10–14 in Section 2 examined self-reported levels of environmental concern towards the Gulf Coast and acknowledgment of the problem of plastic pollution and its consequences. These questions utilized a 10-point Likert scale format. Respondents were asked how much they agreed with the following statements from disagreeing to agreeing to the statements.
10.
I care about Gulf Coasts’ environmental well-being
11.
Plastic pollution is a problem along the Gulf Coast
12.
I am concerned about plastic pollution on the Gulf Coast
13.
Plastic pollution is harmful to marine life (fish, turtles, dolphins, other animals)
14.
Plastic pollution can affect the quality and production of seafood
The questions used to examine consumer willingness to pay were questions 33–34 from Section 6 of the survey and utilized cent increments as follows: (1) 0 cents (2) 1–5 cents (3) 6–10 cents (4) 11–20 (5) 21–30 (6) 31–40 (7) 41–50 (8) more than 50. Respondents were asked how much they would be willing to pay for environmentally friendly alternatives as follows:
33.
If restaurants were to increase their prices to switch to environmentally friendly alternatives for eating in only, how much would you be willing to pay per person per meal?
34.
If restaurants were to increase their prices to switch to environmentally friendly alternatives for takeout or delivery only, how much would you be willing to pay per person per meal?
Given the similarity between questions 10–14, an encompassing variable of “Environmental Identity” was created and assessed for appropriateness using an exploratory factor analysis (EFA). The EFA consisted of a reliability test and a non-rotational maximum likelihood exploratory factor analysis was then run on questions 10–14. This method is appropriate when attempting to identify latent constructs and provides factor scores for this latent factor to give it an observable scale (e.g., Eigenvalue) [47].
A logistic regression model was used to examine what affects willingness to pay for plastic alternatives [48]. The independent variables for this regression model were Environmental Identity and demographic variables of education, income, race, age, and sex. The demographic variables of education, income, and race were recoded from their original categories. Education was rearranged and ‘grade school’ and ‘some high school’ were recoded into ‘less than high school’. The categories ‘Some graduate school’, ‘Master’s Degree’, ‘Doctoral Degree’, and ‘Professional Degree’ were recoded into the category ‘Advanced Degrees’. Income categories were also recoded into two categories, ‘Above Median’ being income from the category ‘70,000–99,999’ and above and ‘Below Median’ being income from the category of ‘50,000–69,000’ and below. For race, ‘Native American’, ‘Asian or Pacific Islander’ were recoded to join the existing category ‘Other’. The dependent variable used for this regression model was Willingness to Pay (question 33). Willingness to Pay was recoded into a binary variable of ‘Willingness to Pay 50 cents or more’. A binary logistic regression model was then performed using ‘Willingness to Pay 50 cents or more’ as the dependent variable. Dummy variables were created for the dependent and independent variables to run the regression. Since demographic information was voluntarily given, only cases with all the independent variables were run in the model. There was a total of 1011 cases that were usable in the model. Significance was considered alpha at 0.05.

3. Results

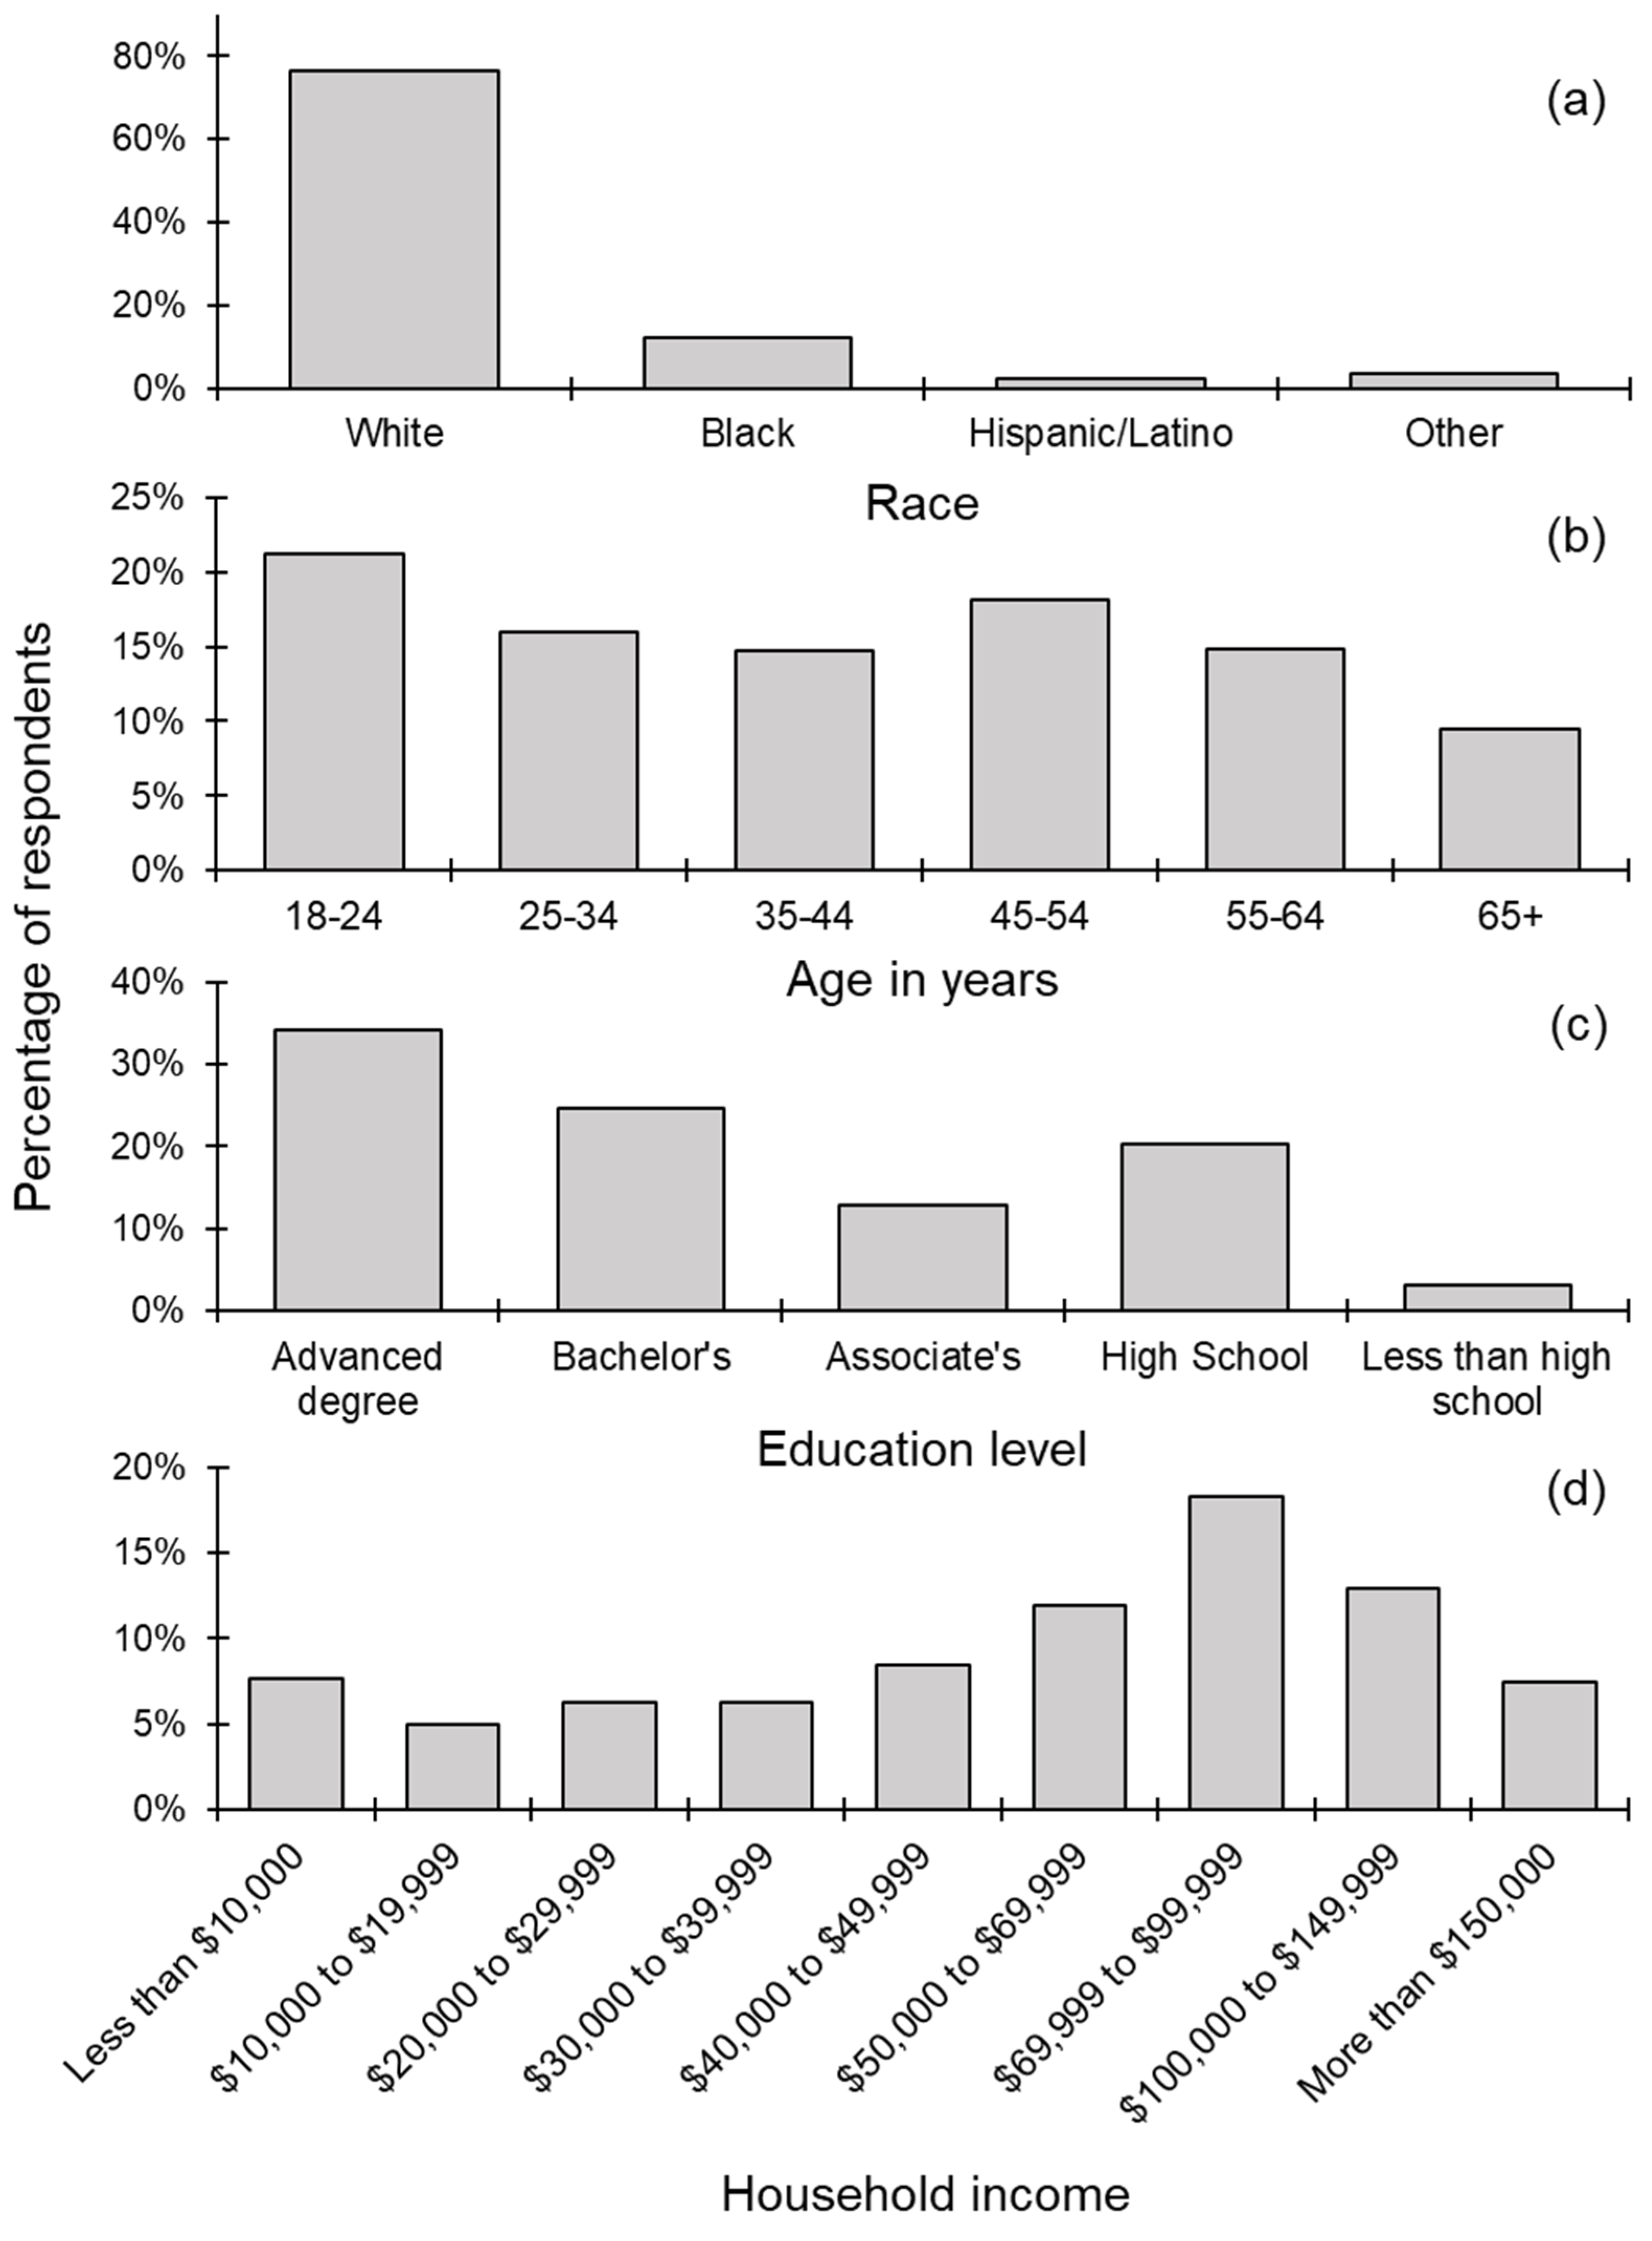
3.1. Survey Respondents

A total of 1371 were completed from 2 August 2016 to 8 October 2018. 72.6% of respondents were female and 22.5% were male, with 5% of respondents not answering the question. For race, 76.4% of respondents were White, 12.2% Black, 2.3% Hispanic/Latino, and 3.6% other with 5.6% of respondents not answering the question (Figure 1a). Most of the respondents were young and middle-aged, with 21.2% at ages 18–24, 16% at ages 25–34, 14.7% at ages 35–44, 18.2% at ages 45–54, 14.9% at ages 55–64, and 9.5% 65 or older and 5.6% of respondents not answering the question (Figure 1b). Respondents were well educated, with 34.2% of respondents having an advanced degree and 24.6% having a bachelor’s degree. 12.8% of respondents had an associate’s degree, 20.4% of respondents had a high school degree, and only a small portion (3%) of respondents had less than a high school education (Figure 1c). Only 5% of respondents did not answer this question. For household income, nearly 18% of respondents selected the $69,999 to $99,999 range, followed by the $100,000 to $149,999 (13%) and $50,000 to $69,999 (12%) ranges (Figure 1d). Responses to the remaining income level options were pretty similar and ranged from 5% to 8% of respondents for each income level range (Figure 1d).

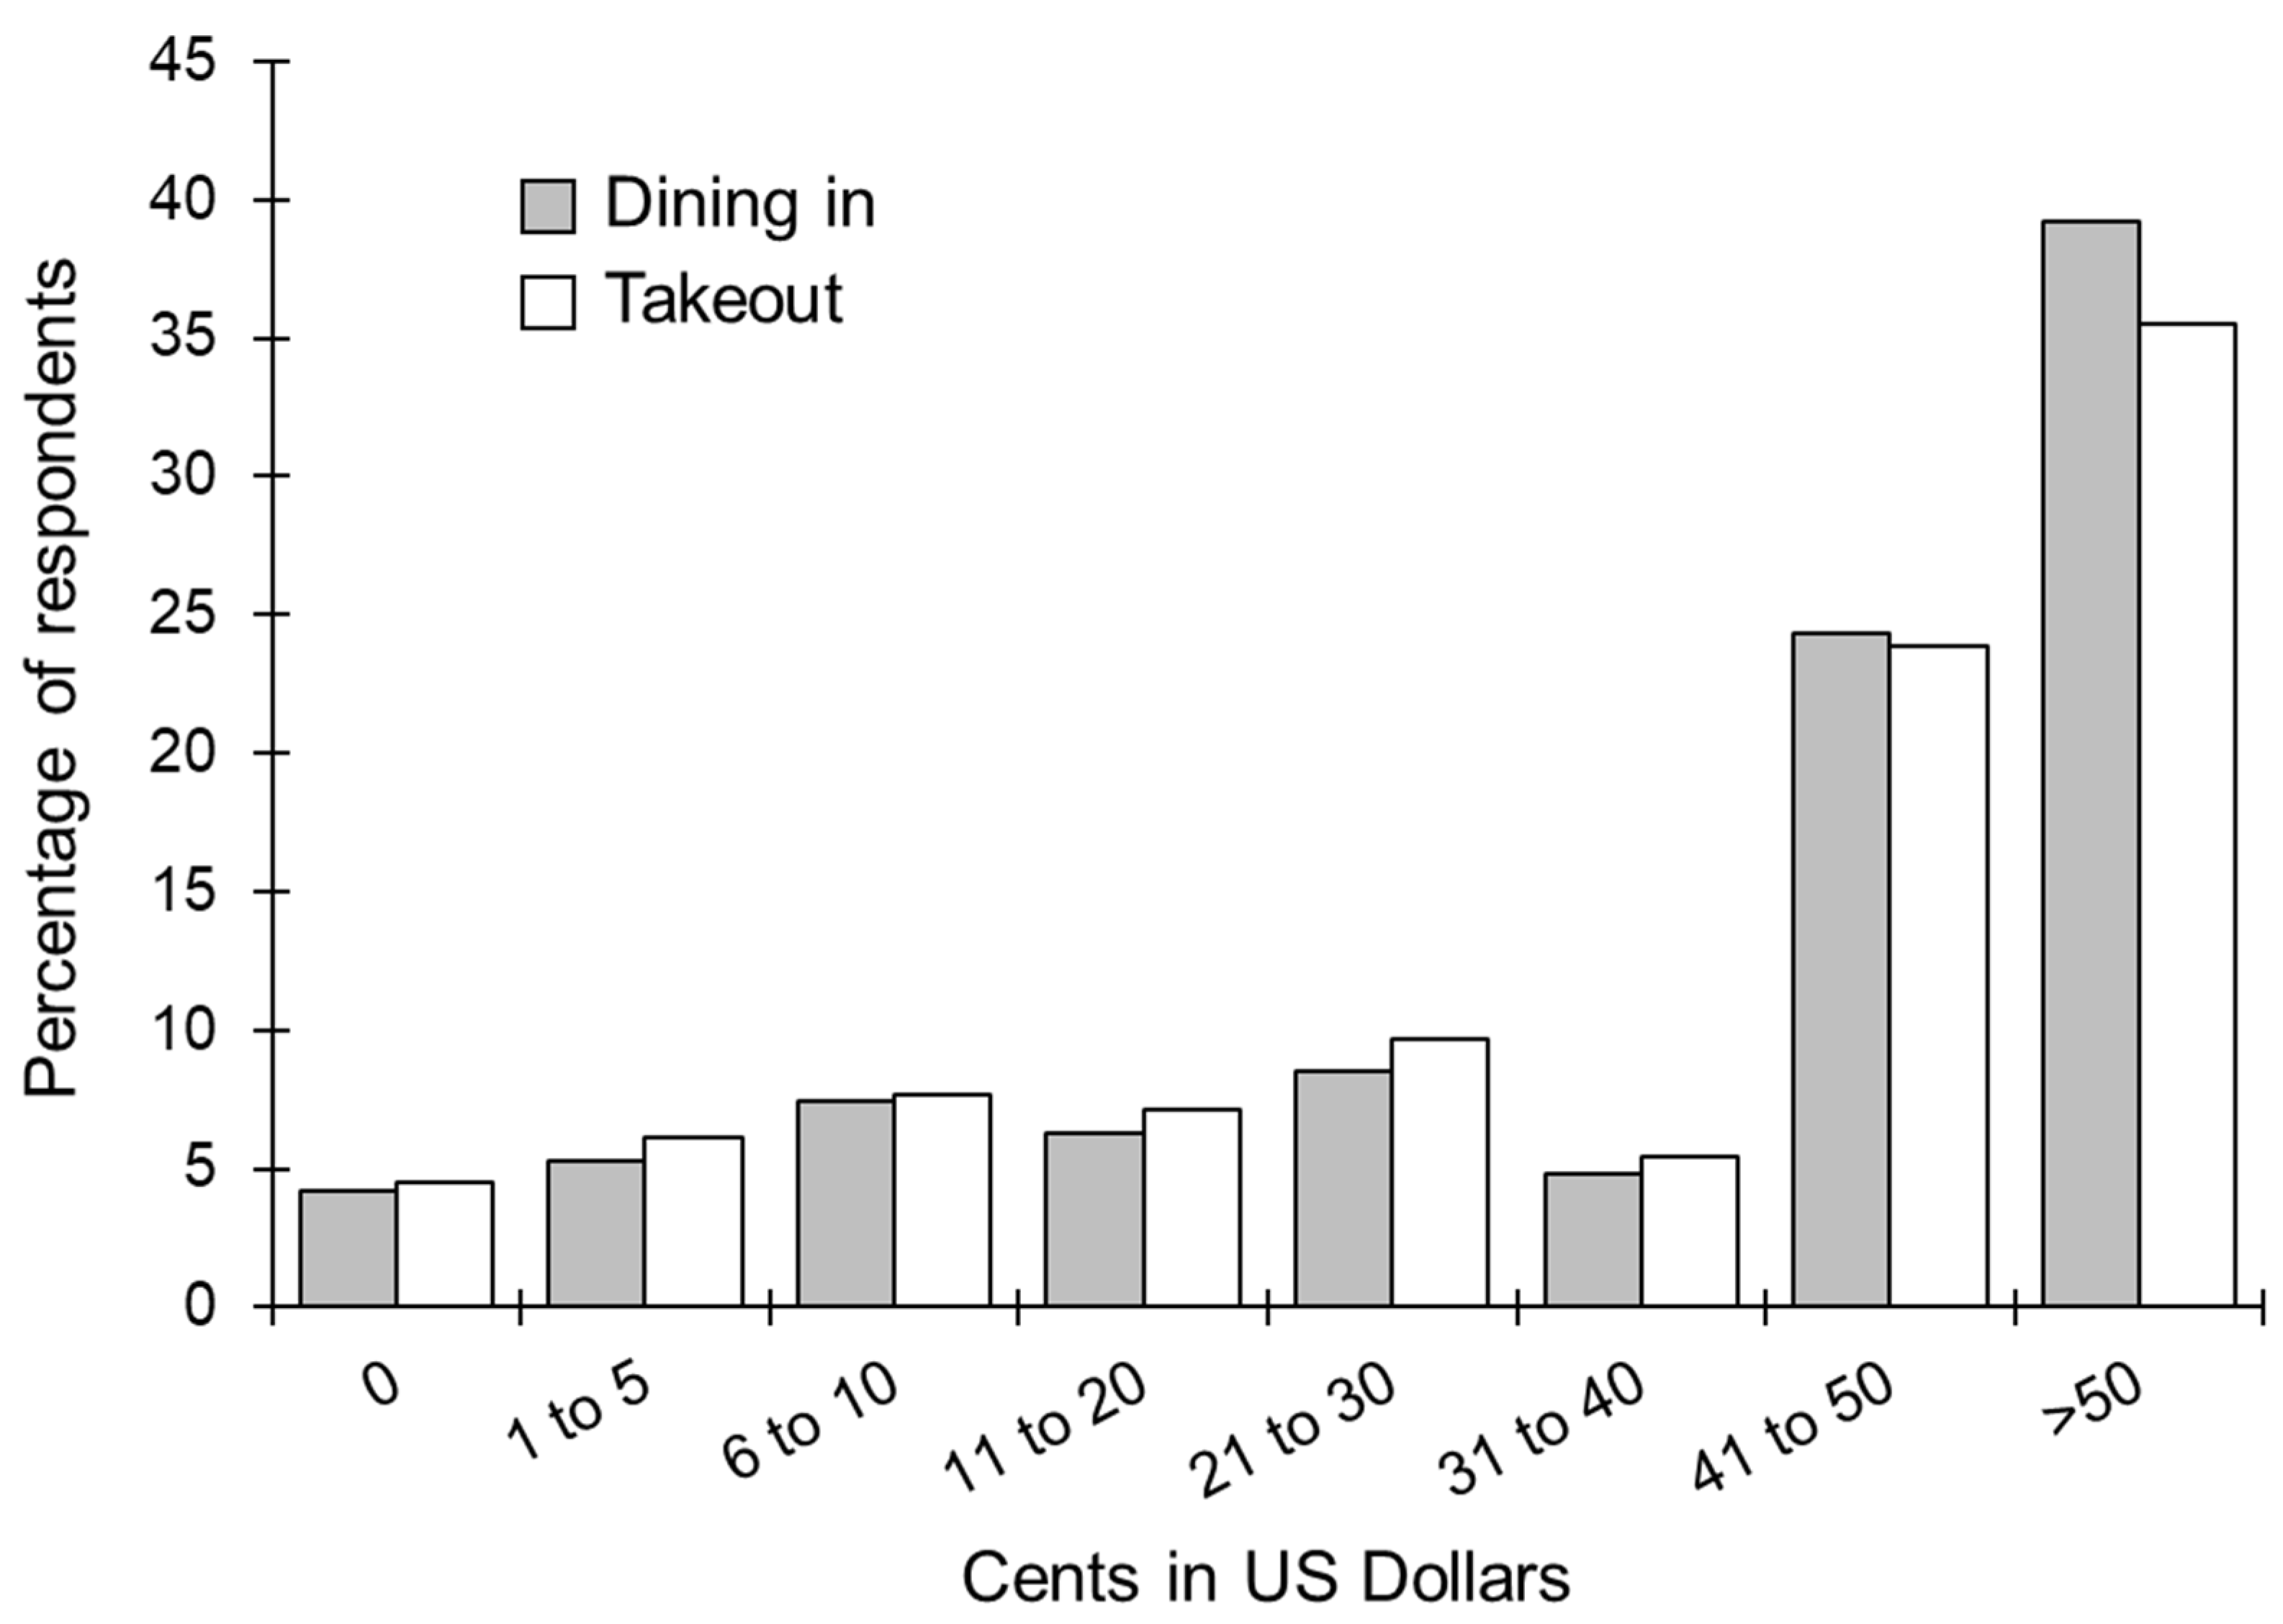
3.2. Environmental Concern and Willingness to Pay

The majority of respondents cared strongly about the Gulf Coast’s environmental well-being. When asked if they agreed with the statement ‘I care about the Gulf Coasts’ environmental well-being’, 94.7% of respondents agreed to some degree with caring, with 69% of respondents agreeing very strongly at a maximum of 10 on a scale of 1 to 10 (n = 1290). A total of 4.5% of respondents were neutral, and only 0.54% of respondents disagreed with the statement. Most respondents acknowledged that plastic pollution is a problem along the Gulf Coast. When asked if they agreed with the statement ‘Plastic pollution is a problem along the Gulf Coast’, 92.1% of respondents agreed, with 57.8% of respondents agreeing very strongly (n = 1290). 6.5% of respondents were neutral, and only 1.4% disagreed. Most respondents care about plastic pollution on the Gulf Coast. 91.5% of respondents agreed with the statement ‘I am concerned about plastic pollution in the Gulf Coast’, with 58.3% of respondents agreeing very strongly (n = 1289). A small proportion (6.6%) of respondents were neutral, and only 1.9% disagreed. Most respondents acknowledged that plastic can be harmful to marine life. 97.4% of respondents agreed with the statement ‘Plastic pollution is harmful to marine life’, with 83.1% agreeing very strongly (n = 1293). Only 1.9% were neutral, and less than 1% disagreed. A majority of respondents also acknowledge that plastic pollution can affect the quality or production of seafood. Most (94.4%) of respondents agreed with the statement ‘Plastic pollution can affect the quality and production of seafood’, with 68.2% agreeing very strongly (n = 1292). Very few respondents (4.3%) were neutral, and only 1.2% disagreed. For both dine-in and takeout scenarios, over 95% of respondents indicated that they would be willing to pay for plastic alternatives in food service with nearly 66% of respondents indicated that they would be willing to pay more than 40 cents more per person per meal (Figure 2).

3.3. Factor Analysis

Factor analysis indicates most of the variance in the five environmental concern items is explained by the existence of a single latent variable, thereby establishing the factorial validity of the EC variable used in the logistic regression analysis (Table 1). This is confirmed by the high reliability of the five items (Cronbach’s Alpha of 0.878). The extraction method used in the factor analysis is maximum likelihood and the factors were not rotated. Factor scores were used to estimate the effect of the factor in the logistic regression analysis.
The responses for questions 10–14 of the survey displayed a relatively high internal consistency (Cronbach’s Alpha of 0.878). Nearly 91% of the variability in an individual’s response to questions 10–14 can be explained from their answers to questions 10–12 and the remaining 9% percent from their responses to questions 13 and 14 (Table 1). In other words, if respondents expressed ‘care’ and ‘concern’ for the local environment, they most likely thought there were plastic pollution was harmful to the environment and the seafood industry.

3.4. Regression Model

Having a higher education in the form of an Advanced Degree and having a strong Environmental Identity were the top two most significant variables in determining WTP (Table 2). Having an Advanced Degree was the most significant (p < 0.001) with the odds of WTP increasing by 154% from a High School degree to an Advanced degree. Having a bachelor’s degree was a significant positive (p < 0.05) predictor of willingness to pay for plastic alternatives (Table 2). Environmental Identity was the second most significant variable (p < 0.001), with a slope value of 0.589, inferring as Environmental Identity increases 1 unit, the odds of WTP 50 cents or more increases by 80.2% when controlling for all other variables. Latinos/Hispanics and Black/African Americans were less likely to be willing to pay for plastic alternatives (76.2% and 36.9% respectively) controlling for all other variables. Individuals that identified as female were associated with a 28.8% reduction in willingness to pay for plastic alternatives compared to those that identified as male (Table 2). Neither age nor income showed a significant relationship with WTP (Table 2).

4. Discussion

This is the first study to our knowledge to assess the willingness of consumers to pay for plastic alternatives in both dine-in and takeout scenarios and in relation to levels of environmental concern, identity, and demographics. Some of the most profound results of this study were that 95% and 92% of respondents expressed concern for the Gulf of Mexico’s environmental well-being and that plastic pollution, respectively, and as predicted by our hypotheses. We also correctly hypothesized that most respondents (over 96%) would be willing to pay for plastic alternatives in restaurants. However, the level they were willing to pay was not anticipated with over a third of respondents willing to pay 50 cents or more for plastic alternatives, and over a fifth of respondents were willing to pay 41 to 50 cents for plastic alternatives. Thereby, leading to a total of over 66% that would be willing to pay more than 40 cents per person per meal.
Interestingly, there was no difference between the amount respondents were willing to pay for dine-in and takeout scenarios. The consumption of takeout food is increasing and is projected to continue increasing over time [49]. The COVID-19 pandemic has accelerated this trend in takeout food consumption [50] leading to even more unsustainable plastic usage [51,52]. However, one study showed that even with increases in concern related to food safety during the COVID-19 pandemic, there was still a slight increase in willingness to pay to reduce the use of plastic packaging [52].
Willingness to pay 41 to 50 cents is likely enough to more than cover costs for switching to plastic alternatives at restaurants depending on the alternative material type and what items are being exchanged. For example, clamshell containers are one of the most expensive items for restaurants to purchase related to packaging dine-out orders. The price difference between a standard-sized (22.86 cm × 22.86 cm × 7.62 cm) styrofoam and biodegradable bagasse material clamshell is 7 cents ($0.18 vs. $0.25) [53]. The difference in prices between standard-sized 22.86 cm diameter plates of different materials is less extreme with the bagasse being ($0.16 per unit) and $0.4 cents more expensive per unit than Styrofoam plates ($0.12 per unit). However, paper plates were the least costly option at $0.03 per plate and are also environmentally friendly [53]. Other items, such as cheap, lightweight plastic forks can be bought wholesale for just under a cent, while PLA light/medium forks and wooden forks can cost around 2 to 6 cents [53]. Additionally, the average cost to switch from plastic to paper straws is approximately 2 cents per unit. Utilizing the knowledge gained from participants in this study and examples from other industries [13,14,27,54,55], there is an evident body of knowledge that most consumers are willing to pay for more environmentally friendly materials at businesses. As the demand and production of these environmentally friendly materials increase, the cost will likely become more competitive with plastic options.
While the cost of these conversions to plastic-free alternatives could be passed on to the consumer, the food service industry could also utilize the demand for environmentally friendly alternatives for marketing purposes. Social marketing [43] has been shown to increase the willingness to pay for sustainable water bottles [44] and similar strategies could be used to expand to other food service products. For example, environmental and travel promotion organizations could create a promotion program that identifies and recognizes these businesses; thereby, providing free marketing. Surfrider and Plastic Free Gulf Coast have developed or are currently developing business recognition programs that may be used for these purposes. To facilitate “buy-in” from the food service industry, follow-up studies on the consumers’ willingness to visit restaurants or other food service entities that are promoted as environmentally friendly could further research the potential economic benefits of using these alternatives.
Other profound results from the study were that neither age nor income influenced the level at which consumers will willing to pay, yet education level, race (Black/African American and Latino/Hispanic), advanced education, and gender (female) did. Contrary to the original hypothesis of income level being one the strongest predictors of willingness to pay at high levels (greater than $0.50 per person per meal) for plastic alternatives at restaurants, education in the form of an Advanced Degree and having a strong Environmental Identity were the top two most significant predictors. While these results likely are not surprising in that education level related to environmental stewardship is a strong predictor of willingness to pay for green, sustainable, and/or environmentally friendly products or initiatives [38,39,40,41,42], it does highlight the potential impact of outreach and education on environmental identity and, subsequently, willingness to pay.
Alternatively, the effect of race and gender on willingness to pay for plastic alternatives is more difficult to explain. Females have traditionally been associated with a stronger environmental identity [56], yet they were less willing to pay for plastic-free alternatives than men in this study. Likewise, survey respondents that identified as Black/African American and Latino/Hispanic were less likely to be willing to pay for plastic alternatives. While there was no statistically significant relationship between income and willingness to pay, that could potentially be a factor explaining these group-specific results. Other studies have shown that purchasing behavior related to pro-environmental options is strongly associated with income [57] and women/minorities are known to have lower wages than their counterparts [58].
While the results of this study are impactful, the survey was not in a food service setting and, thus, respondents only provided theoretical responses. Follow-up studies conducted in partnership with restaurants where consumers are either assessed or not assessed a fee at the time of purchase for plastic alternatives may show different results. There is an inherent bias between theoretical and real-world situations where responses may be different [13]. More research is needed that focuses specifically on restaurant customers to find out if willingness to pay is translating into action. Some example research questions could be (1) will customers choose not to pay when it is voluntary but not say anything if the cost is a line item on the bill or written into the menu price or (2) is there loss or gain of customer base when the cost is put on the consumer?
Additionally, the COVID-19 pandemic showed that supply and demand for single-use products can be volatile. Restaurants that had previously used reusable plates and other reusable service items were forced to convert their business to single-use products with limited knowledge of their options. Single-use food service products (plastic and plastic alternatives) were back-ordered for months or were unavailable and the costs continue to rise for all single-use food service packing products [59]. Furthermore, as packaging can have a direct impact on food items and their shelf life, more research is needed to validate the potential direct effects of plastic alternative food packaging and shelf-life. These issues highlight the need for more outreach, education, and an increase in plastic alternatives for the food service industry.

5. Conclusions

The objectives of this study were to: (1) examine self-reported concern for the Gulf of Mexico’s well-being and plastic pollution, (2) determine environmental identity, (3) examine willingness to pay for environmentally friendly food service products in restaurants, and (4) explore how demographics and environmental identity influence willingness to pay. Results of this study indicate that 95% of restaurant visitors are concerned with environmental and plastic pollution and 96% are willing to pay more for environmentally friendly service items in both dine-in and takeout scenarios. Both of these results confirm our original hypotheses that (1) the majority of respondents would express concern for the environment and plastic pollution and (2) most respondents would be willing to pay for plastic alternatives at restaurants. Most of these respondents (66%) indicated they would pay at least $0.40 (USD) per person per meal for these items in both dine-in and takeout scenarios. This level of willingness to pay should be sufficient to cover any increased costs for purchasing environmentally friendly service items such as paper plates, bowls, cups, takeout containers, etc., and/or the purchase of reusable service items and dishwashing services. The two strongest predictors for whether someone would be willing to pay high amounts for environmentally friendly food service items in restaurants were education level (at least 1 college degree) and environmental identity. Additionally, race (Black/African American and Hispanic/Latino) and gender (female) were both negatively associated with willingness to pay high amounts for plastic alternatives in restaurants while there were no relationships between willingness to pay and income level or age. These results only partially confirmed our hypothesis that environmental identity and income level would be the largest predictors of willingness to pay high amounts for plastic alternatives at restaurants.
The novelty of this study is that it is the first to our knowledge to assess the willingness of consumers to pay for plastic alternatives in both dine-in and takeout scenarios and in relation to levels of environmental concern, identity, and demographics, which has both theoretical and practical implications. A major suggested action from this study is to increase education efforts focused on environmental stewardship prior to obtaining a college degree as education level and environmental identity were the two strongest drivers of willingness to pay. The level at which most respondents were willing to pay and how that changed across demographics could be used to communicate to the food service industry the demand and willingness to pay for environmentally friendly service items and help further marketing efforts. Both actions would likely reduce the amount of plastic pollution from food-service-associated products. However, research that goes beyond theoretical survey responses and presents fee-based willingness to pay scenarios in restaurants is needed and could further validate and expand upon these results. Additionally, food science, such as packaging, and social marketing research could help further the practicality and impact of this type of research by improving and better understanding food service packaging options while also maximizing social marketing of environmentally friendly products to different demographics.

Author Contributions

Conceptualization, E.F. and E.S.; Data curation, E.F. and E.S.; Formal analysis, E.F., K.H. and S.L.; Funding acquisition, E.S.; Investigation, E.F., E.S., K.H., S.L. and E.E.; Methodology, E.F., E.S., K.H. and S.L.; Project administration, E.S., K.H. and S.L.; Resources, E.S., K.H., S.L. and E.E.; Supervision, E.S., K.H. and S.L.; Writing—original draft, E.F., E.S., K.H., S.L. and E.E.; Writing—review and editing, E.F., E.S. and E.E. All authors have read and agreed to the published version of the manuscript.

Funding

This research was funded by NOAA—Northern Gulf Institute’s Minority Internship Program and NOAA (Office of Sea Grant, U.S. Dept. of Commerce, under Grant NA10OAR4170078, Mississippi Alabama Sea Grant Consortium).

Institutional Review Board Statement

The study was approved by the Institutional Review Board of Mississippi State University (IRB-17-194).

Informed Consent Statement

Informed consent was obtained from all subjects involved in the study.

Data Availability Statement

All data associated with this project are formatted and ready for upload into the Mississippi State University Institutional Repository. Upon acceptance of publication, all data will be uploaded to the repository and made fully available.

Acknowledgments

We would like to thank Mississippi State University Coastal Conservation and Restoration Program for their assistance with data collection. Funding for this project was provided by the NOAA—Northern Gulf Institute’s Minority Internship Program and NOAA (Office of Sea Grant, U.S. Dept. of Commerce, under Grant NA10OAR4170078, Mississippi Alabama Sea Grant Consortium).

Conflicts of Interest

The authors declare no conflict of interest. The funders had no role in the design of the study; in the collection, analyses, or interpretation of data; in the writing of the manuscript, or in the decision to publish the results.

Appendix A. Survey

Sustainability 14 05992 g0a1aSustainability 14 05992 g0a1bSustainability 14 05992 g0a1cSustainability 14 05992 g0a1dSustainability 14 05992 g0a1eSustainability 14 05992 g0a1fSustainability 14 05992 g0a1gSustainability 14 05992 g0a1hSustainability 14 05992 g0a1iSustainability 14 05992 g0a1jSustainability 14 05992 g0a1k

References

  1. Zalasiewicz, J.; Waters, C.N.; Do Sul, J.A.I.; Corcoran, P.L.; Barnosky, A.D.; Cearreta, A.; Edgeworth, M.; Gałuszka, A.; Jeandel, C.; Leinfelder, R.; et al. The geological cycle of plastics and their use as a stratigraphic indicator of the Anthropocene. Anthropocene 2016, 13, 4–17. [Google Scholar] [CrossRef] [Green Version]
  2. National Academies of Sciences, Engineering, and Medicine. Reckoning with the US Role in Global Ocean Plastic Waste; The National Academies Press: Washington, DC, USA, 2021. [Google Scholar]
  3. Barnes, D.K.; Galgani, F.; Thompson, R.C.; Barlaz, M. Accumulation and fragmentation of plastic debris in global environments. Philos. Trans. R. Soc. Lond. B Biol. Sci. 2009, 364, 1985–1998. [Google Scholar] [CrossRef] [PubMed] [Green Version]
  4. Sparks, E.; Fischbach, E.; Sartain, A. Mississippi Coastal Cleanup 2017; Mississippi State University Extension Service. Agricultural Communications. Publication 3061 (04-17) MASGP-17-014; Mississippi State University: Mississippi State, MS, USA, 2017. [Google Scholar]
  5. Sparks, E.; Sartain, A.; Baker, B. Mississippi Coastal Cleanup 2018; Mississippi State University Extension Service. Agricultural Communications. Publication 3188 (02-18) MASGP-18-004; Mississippi State University: Mississippi State, MS, USA, 2018. [Google Scholar]
  6. Sartain, A.; Sparks, E.; Baker, B. Mississippi Coastal Cleanup 2019; Mississippi State University Extension Service. Agricultural Communications. Publication 3312 (01-19) MASGP-19-004; Mississippi State University: Mississippi State, MS, USA, 2019. [Google Scholar]
  7. Sartain, A.; Sparks, E.; Baker, B. Mississippi Coastal Cleanup 2020; Mississippi State University Extension Service. Agricultural Communications. Publication 3420 (POD-02-20) MASGP-20-004; Mississippi State University: Mississippi State, MS, USA, 2020. [Google Scholar]
  8. Sartain, M.; James, J.; Rodolfich, A.; Chenier, K.; Sparks, E.; Baker, B. Mississippi Coastal Cleanup 2021; Mississippi State University Extension Service. Publication 3588 (POD-03-21) MASGP-20-004; Mississippi State University: Mississippi State, MS, USA, 2021. [Google Scholar]
  9. Sartain, M.; James, J.; Rodolfich, A.; Chenier, K.; Englebretson, E.; Mallon, E.; Sparks, E.; Baker, B. Mississippi Coastal Cleanup 2022; MASGP-21-004; Mississippi State University: Mississippi State, MS, USA, 2022. [Google Scholar]
  10. Ocean Conservancy. Newsroom a Voice for Our Ocean. Top Ten Items. Available online: https://oceanconservancy.org/news/top-ten-items/ (accessed on 12 April 2022).
  11. Herrmann, C.; Rhein, S.; Sträter, K.F. Consumers’ sustainability-related perception of and willingness-to-pay for food packaging alternatives. Res. Conserv. Rec. 2022, 181, 106219. [Google Scholar] [CrossRef]
  12. Ketelsen, M.; Janssen, M.; Hamm, U. Consumers’ response to environmentally-friendly food packaging—A systematic review. J. Clean. Prod. 2020, 254, 120123. [Google Scholar] [CrossRef]
  13. Laroche, M.; Bergeron, J.; Barbaro-Forleo, G. Targeting consumers who are willing to pay more for environmentally friendly products. J. Cons. Mark. 2001, 18, 503–520. [Google Scholar] [CrossRef] [Green Version]
  14. Guber, D.L. The Grassroots of a Green Revolution: Polling America on the Environment; MIT Press: Cambridge, MA, USA, 2002. [Google Scholar]
  15. Halpenny, E.A.; Caissie, L.T. Volunteering on nature conservation projects: Volunteer experience, attitudes, and values. Tour. Rec. Res. 2003, 28, 25–33. [Google Scholar] [CrossRef]
  16. Jekria, N.; Daud, S. Environmental concern and recycling behaviour. Procedia Econ. Fin. 2016, 35, 667–673. [Google Scholar] [CrossRef] [Green Version]
  17. Minton, A.P.; Rose, R.L. The effects of environmental concern on environmentally friendly consumer behavior: An exploratory study. J. Bus. Res. 1997, 40, 37–48. [Google Scholar] [CrossRef]
  18. Poortinga, W.; Steg, L.; Vlek, C. Values, environmental concern, and environmental behavior: A study into household energy use. Environ. Behav. 2004, 36, 70–93. [Google Scholar] [CrossRef]
  19. Tsen, C.H.; Phang, G.; Hasan, H.; Buncha, M.R. Going green: A study of consumers’ willingness to pay for green products in kota kinabalu. Int. J. Bus. Soc. 2006, 7, 40. [Google Scholar]
  20. Luzar, E.J.; Cosse, K.J. Willingness to pay or intention to pay: The attitude-behavior relationship in contingent valuation. J. Soc. Econ. 1998, 27, 427–444. [Google Scholar] [CrossRef]
  21. Dunlap, R.E. Environmental sociology: A personal perspective on its first quarter century. Organ. Environ. 2002, 15, 10–29. [Google Scholar] [CrossRef]
  22. Sanchez, M.J.; Lafuente, R. Defining and Measuring Environmental Consciousness; Consejo Superior de Investigaciones Científicas: Madrid, Spain, 2010.
  23. Van der Werff, E.; Steg, L.; Keizer, K. The value of environmental self-identity: The relationship between biospheric values, environmental self-identity and environmental preferences, intentions, and behaviour. J. Environ. Psychol. 2013, 34, 55–63. [Google Scholar] [CrossRef]
  24. Vesely, S.; Masson, T.; Chokrai, P.; Becker, A.M.; Fritsche, I.; Klöckner, C.A.; Tiberio, L.; Carrus, G.; Panno, A. Climate change action as a project of identity: Eight meta-analyses. Glob. Environ. Chang. 2021, 70, 102322. [Google Scholar] [CrossRef]
  25. Walton, T.; Austin, D.M. Pro-environmental behavior in an urban social structural context. Sociol. Spectr. 2011, 31, 260–287. [Google Scholar] [CrossRef]
  26. Walton, T.N.; Jones, R.E. Ecological identity: The development and assessment of a measurement scale. Environ. Behav. 2018, 50, 657–689. [Google Scholar] [CrossRef]
  27. Mainieri, T.; Barnett, E.G.; Valdero, T.R.; Unipan, J.B.; Oskamp, S. Green buying: The influence of environmental concern on consumer behavior. J. Soc. Psychol. 1997, 137, 189–204. [Google Scholar] [CrossRef]
  28. Clayton, S. Environmental Identity: A Conceptual and an Operational Definition. Identity and the Natural Environment: The Psychological Significance of Nature; MIT Press: Cambridge, MA, USA, 2003; pp. 45–65. [Google Scholar]
  29. Heberlein, T.A. Navigating Environmental Attitudes; Oxford University Press: Oxford, UK, 2012. [Google Scholar]
  30. Nordin, N.; Selke, S. Social aspect of sustainable packaging. Packag. Technol. Sci. 2010, 23, 317–326. [Google Scholar] [CrossRef]
  31. Stern, P.C.; Dietz, T.; Kalof, L.; Guagnano, G.A. Values, Beliefs, and Proenviornmental Action: Attitude Formation toward Emergent Attitude Objects. J. Appl. Soc. Psychol. 1995, 25, 1611–1636. [Google Scholar] [CrossRef]
  32. Stets, J.E.; Biga, C.F. Bringing Identity Theory into Environmental Sociology. Sociol. Theory 1995, 21, 398–423. [Google Scholar] [CrossRef] [Green Version]
  33. Brenner, P.S.; Serpe, R.T.; Stryker, S. Role-specific self-efficacy as precedent and product of the identity model. Sociol. Perspect. 2018, 61, 57–80. [Google Scholar] [CrossRef]
  34. Swim, J.K.; Zawadzki, S.J.; Cundiff, J.L.; Lord, B. Environmental identity and community support for the preservation of open space. Hum. Ecol. Rev. 2014, 20, 133–155. [Google Scholar] [CrossRef]
  35. Dono, J.; Webb, J.; Richardson, B. The relationship between environmental activism, pro-environmental behavior and social identity. J. Environ. Psychol. 2010, 30, 178–186. [Google Scholar] [CrossRef]
  36. Nielsen-Pincus, M.; Sussman, P.; Bennett, D.E.; Gosnell, H.; Parker, R. The influence of place on the willingness to pay for ecosystem services. Soc. Nat. Resour. 2017, 30, 1423–1441. [Google Scholar] [CrossRef]
  37. Schmitt, M.T.; Mackay, C.M.; Droogendyk, L.M.; Payne, D. What predicts environmental activism? The roles of identification with nature and politicized environmental identity. J. Environ. Psychol. 2019, 61, 20–29. [Google Scholar] [CrossRef]
  38. Shahsavar, T.; Kubeš, V.; Baran, D. Willingness to pay for eco-friendly furniture based on demographic factors. J. Clean. Prod. 2020, 250, 119466. [Google Scholar] [CrossRef]
  39. Rasool, F.; Ogunbode, C.A. Socio-demographic differences in environmental concern and willingness to pay for addressing global climate change in Pakistan. Asian J. Soc. Sci. 2015, 43, 273–298. [Google Scholar] [CrossRef]
  40. Lee, S. Consumers’ value, environmental consciousness, and willingness to pay more toward green-apparel products. J. Glob. Fash. Mark. 2011, 2, 161–169. [Google Scholar] [CrossRef]
  41. Bhandari, A.K.; Heshmati, A. Willingness to pay for biodiversity conservation. J. Travel Tour. Mark. 2010, 27, 612–623. [Google Scholar] [CrossRef]
  42. Khachatryan, H.; Campbell, B.; Hall, C.; Behe, B.; Yue, C.; Dennis, J. The effects of individual environmental concerns on willingness to pay for sustainable plant attributes. HortScience 2014, 49, 69–75. [Google Scholar] [CrossRef] [Green Version]
  43. Andreasen, A. Social Marketing: Its Definition and Domain. J. Public Policy Mark. 1994, 13, 108–114. [Google Scholar] [CrossRef]
  44. Grebitus, C.; Roscoe, R.D.; Van Loo, E.J.; Kula, I. Sustainable bottled water: How nudging and Internet Search affect consumers’ choices. J. Clean. Prod. 2020, 267, 121930. [Google Scholar] [CrossRef]
  45. Florida Food Safety Act. Chapter 500; 2021. Available online: https://www.flsenate.gov/Laws/Statutes/2018/0500.90 (accessed on 6 January 2022).
  46. Mississippi Legislature. Senate Bill 2570. Available online: http://billstatus.ls.state.ms.us/documents/2018/html/SB/2500-2599/SB2570IN.htm (accessed on 6 January 2022).
  47. Taherdoost, H.; Sahibuddin, S.; Jalaliyoon, N. Exploratory Factor Analysis; Concepts and Theory; HAL: Lyon, France, 2014. [Google Scholar]
  48. Long, J.S.; Cheng, S. Regression models for categorical outcomes. In Handbook of Data Analysis; SAGE Publishing: Thousand Oaks, CA, USA, 2004; p. 704. [Google Scholar]
  49. Guo, M.; Wu, L.; Peng, J.; Chiu, C.H. Research on Environmental Issue and Sustainable Consumption of Online Takeout Food—Practice and Enlightenment Based on China’s Meituan. Sustainability 2021, 13, 6722. [Google Scholar] [CrossRef]
  50. Shakespeare, S. Changing Consumer Landscape: Dining and Quick Service Restaurants. Available online: https://yougov.co.uk/topics/consumer/articles-reports/2020/05/13/changing-consumer-landscape-dining-and-quick-servi (accessed on 13 February 2022).
  51. Janairo, J.I.B. Unsustainable plastic consumption associated with online food delivery services in the new normal. Clean. Responsible Consum. 2021, 2, 100014. [Google Scholar] [CrossRef]
  52. Kitz, R.; Walker, T.; Charlebois, S.; Music, J. Food packaging during the COVID-19 pandemic: Consumer perceptions. Int. J. Consum. Stud. 2022, 46, 434–448. [Google Scholar] [CrossRef] [PubMed]
  53. Webstaurant Store. Available online: https://www.webstaurantstore.com/ (accessed on 12 April 2022).
  54. Rokka, J.; Uusitalo, L. Preference for green packaging in consumer product choices–do consumers care? Int. J. Consum. Stud. 2008, 32, 516–525. [Google Scholar] [CrossRef]
  55. Schlegelmilch, B.B.; Bohlen, G.M.; Diamantopoulos, A. The link between green purchasing decisions and measures of environmental consciousness. Eur. J. Mark. 2019, 5, 0309–0566. [Google Scholar] [CrossRef] [Green Version]
  56. Prévot, A.C.; Clayton, S.; Mathevet, R. The relationship of childhood upbringing and university degree program to environmental identity: Experience in nature matters. Environ. Educ. Res. 2018, 24, 263–279. [Google Scholar] [CrossRef]
  57. Gatersleben, B.; Murtagh, N.; Abrahamse, W. Values, identity and pro-environmental behaviour. Contemp. Soc. Sci. 2014, 9, 374–392. [Google Scholar] [CrossRef] [Green Version]
  58. Schirle, T.; Sogaolu, M. A work in progress: Measuring wage gaps for women and minorities in the Canadian labour market. CD Howe Inst. Comment. 2020, 20, 561. [Google Scholar]
  59. Molloy, S.; Varkey, P.; Walker, T.R. Opportunities for single-use plastic reduction in the food service sector during COVID-19. Sustain. Prod. Consum. 2022, 30, 1082–1094. [Google Scholar] [CrossRef] [PubMed]
Figure 1. Percentage of responses to demographic questions, including race (a), age (b), education level (c), and household income (d).
Sustainability 14 05992 g001
Figure 2. Willingness to pay for plastic alternatives in dining in (gray bars) and takeout (white bars) scenarios.
Sustainability 14 05992 g002
Table 1. Variance explained from an exploratory factor analysis of the responses to questions 10–14.
QuestionEigenvalues% of Variance % Cumulative
103.41168.2368.23
110.66913.3781.61
120.4689.3690.74
130.2805.5696.569
140.1723.43100.00
Table 2. Binary logistic regression of environmental identity with related demographic variables on willingness to pay for plastic alternatives.
VariableExp (B)Significance Level or Comment
Environmental Identity1.802***
Less than HS education-small sample size
Associates Degree1.186
Bachelor’s Degree1.473
Advanced Degree2.54***
Black/African American0.631*
Latino/Hispanic0.238*
Other (race)0.95
Above median income0.981
Young (age 18–24)1.245
Old (age 65+)0.949
Female0.712*
n = 1011 a = sig in 1 tail t-test
* p-value < 0.05, *** p-value < 0.0001
Publisher’s Note: MDPI stays neutral with regard to jurisdictional claims in published maps and institutional affiliations.

