Article

A Decision-Making Tool for Urban Planners: A Framework to Model the Interdependency among Land Use, Accessibility, Density, and Surface Runoff in Urban Areas

1
Urban Simulation Lab, Department of Town and Country Planning, University of Moratuwa, Moratuwa 10400, Sri Lanka
2
Department of Town and Country Planning, University of Moratuwa, Moratuwa 10400, Sri Lanka
*
Author to whom correspondence should be addressed.
Sustainability 2022, 14(1), 522; https://doi.org/10.3390/su14010522
Submission received: 8 October 2021 / Revised: 7 November 2021 / Accepted: 10 November 2021 / Published: 4 January 2022
(This article belongs to the Special Issue Urban Climate Change, Transport Geography and Smart Cities)

Abstract

:
The purpose of this study was to evaluate the four-dimensional relationship between land use, accessibility, density, and surface runoff in urban areas. In contemporary literature, a series of studies have been conducted that extensively discuss the natural components associated with the surface runoff in urban areas. However, the dynamic and complex dimensions of the urban form, such as land use, accessibility, and density, are yet to be fully understood. In this study, a 4D diagram was utilized to identify relationships between dimensions, in addition to decision tree analysis, to explore the structural flow between selected variables. Furthermore, a structural equation modeling (SEM) approach was employed with the purpose of investigating the direct, indirect, and moderating effects on the targeted dependent variable, surface runoff. The results of the analysis reported a strong correlation between land use, accessibility, density, and surface runoff, with an R-squared value of 0.802, which indicates an acceptable model accuracy by the international standard. A positive relationship between the four dimensions was indicated by the higher accessibility; the higher density in terms of a higher floor space index (FSI), ground space index (GSI), and open space; the building height of the adjacent buildings; the higher diversity of the land use; and the higher surface runoff. Accordingly, the findings of the study offer policy implications in the fields of land use planning, zoning regulations and overall urban development planning towards achieving climate resilient cities.

1. Introduction

Issues related to rapid urbanization have become a broadly discussed topic during the past two decades due to its negative impacts on livelihoods and functionality, as shown by clear evidence. Urban flooding, congested living spaces, and various types of pollutions are among the key issues in the current urban context. An extensive number of studies have shown that higher surface runoff directly influences the occurrence of flood events in the urban context [1,2,3]. Kang and Yeom [4] argued that the shape of the urban form is defined by the behavior of the urban components such as land use, accessibility, and the density and patterns of the movements. In some studies, land use behavior, accessibility, and density were identified as the determinants of the shape of the urban form and were therefore responsible for the emergence of certain outcomes, such as the attraction and movement of populations, changes in the surface runoff volume, and urban flooding events in the urban context [5,6].
In 2002, over 50% of the global population was declared as residing in urban areas, thus enabling the recognition of urban flooding as a consequence of the unplanned configuration of the components of the urban form [7,8,9].
The global population is growing at an alarming rate, reaching a record of 7.67 billion in 2019, which was surpassed by 7.71 billion in 2020 [10]. In contrast, however, habitable land on Earth is a limited resource, and is incapable of expanding in proportion to the population growth. This scarcity has led to ongoing competition among inhabitants to obtain land and access to infrastructure facilities with the purpose of improving their living conditions. The competition for land has triggered urbanization, with high rates of conversion of land use from green to brown and high building densities all over the world [11,12].
The increasingly built-up fabric in the urban context hinders the ecosystem’s ability to retain and infiltrate excessive precipitated water, causing urban flooding [13]. Figure 1 depicts the associations between land use, accessibility, and density with surface runoff, and how these four-dimensional associations create urban flooding incidents in the urban context.
Changes in the movements and attractions of inhabitants in the forest ecosystem increase accessibility opportunities with developments over time. Therefore, new land uses, activities, and built-up areas, including buildings and other infrastructure facilities, are gradually increased as vegetation cover is reduced. Therefore, the imperviousness of the area is increased by up to 35 to 50%. Surface runoff is increased by up to 30% due to the higher building density and solid surface coverage during the third stage. The fourth stage represents a highly urbanized area having 75–100% impervious surface and more than 55% surface runoff. This phenomenon is predominantly due to the growth in the highly built-up surface, which covers the soil using solid materials that have very low infiltration and evaporation, and the removal of vegetation for the erection of buildings. The built-up surface growth is encouraged by accessibility, land use, and density [15]. Therefore, the surface runoff rate increases in proportion to the built-up surface coverage improvements [16,17]. A number of studies have explained the requirement to explore the realtionships between major urban form componants, such as land use, accessibility, density, and surface runoff, to develop resilient future cities around the world.
Dempsey et al. [18] explained that land use, accessibility, and density components play key roles in shaping the image of the urban form [19]. Furthermore, Kang et al. [4] identified that the effects of a highly developed urban form with a superior land use diversity, accessibility, and density on urban flooding is due to two aspects—namely, the proportionate increment in an impermeable land surface and the decrement in the land cover that has a natural drainage function.
Higher land use diversity, accessibility, and density increase the level of urbanization. This reduces green land cover, which is capable of absorbing a significant amount of incoming precipitation and retain it to be directed gradually to the subsurface water flow [20]. Additionally, a higher impermeable surface cover confines the penetration of storm water and significantly increases the surface runoff volume and peak discharge, leading to an increased risk of urban flooding [21,22].
Urban form componants are perceieved to be inter-dependant, acting as a loop and driven by accessibility compared to land use or density in a given urban form. The key reason for higher accessibility is defined as a higher level of attraction in any given area. The change in land use occurs as a result of the attraction created by accessibility. Hence, land use and accessibility in combination create additional attraction for people. The next decisive factor is density, which changes with land use and accessibility [23]. Densification of the urban form can be increased by improving the street network and accessibility on multiple scale levels combined with high public transport options [24,25]. Strohbach et al. [26,27] explained that higher densification results in increased impermeable surfaces and a higher surface runoff, which in turn influences the occurrence of flooding incidents in an urban context. These studies mainly explain the influence of the topological characteristics of accessibility responsible for changing surface runoff and creating flood events.
Ye & Nes [28] highlighted the interdependencies between street network configuration, building density, and land use mixture when explaining the transformation of the urban form. They argued that the level of combination between land use, accessibility, and density is capable of interpreting the maturity of a particular city. Highly matured cities have more diversified land use, higher accessibility, and higher densification in the urban form. Aforementioned studies explain that higher accessibility and highly mixed land use create densified urban forms that can be identified as highly urbanized areas comprising of small plot sizes, with a large cumulative percentage of impervious surfaces, less vegetation cover, etc. Advancing a step further, Chen, Zhou, Zhang, Du & Zhou [8] have proposed a relationship between density and surface runoff based on the mean parcel size, building coverage, and building setback. They provided evidence to prove small-sized plots and areas consist of higher plot coverage, which are in line with higher accessibility and a higher surface runoff, with a greater possibility of flood events due to low infiltration and evapotranspiration. Nevertheless, these studies mainly explain the influence of density on the surface runoff out of the other urban form components which influence the change in runoff volume. Furthermore, Pertiwi, Hisyam and Yofianti [8], Ref. [29] explained that the runoff rate is changing based on land use conversions, and the degree of the surface runoff change depends on the native land use and converted land use. The highest surface runoff improvement has been identified from forest to built-up land cover conversion. Hill [30] explained that the runoff coefficient is a standard value for different land uses, but he argues that the coefficient value cannot be a standard value and essentially changes with the density level of land use. In further emphasis, the same land use can indicate different runoff coefficients under different density levels of land use. The concurrent knowledge vividly explains how land use, accessibility, and density influence the changes in surface runoff and flood incidents in an urban context. Therefore, as Conzen [31] emphasizes, urban planners, in dealing with flooding in an urban context, need to have a better understanding on the entire image of the urban form and its outcomes, which have been created by the urban form components.
The study has identified two main limitations in the contemporary literature. Firstly, no attempts were found to test the interrelationship between the four dimensions: land use, accessibility, density, and surface runoff in the events of urban flooding. Available knowledge merely explains how surface runoff depends on land use, accessibility, and density in isolation. All four dimensions have not been studied in a common context within a single study framework. Furthermore, the identification of the compound influence of each variable on the occurrence of urban flooding is crucial for decision makers to deliver adjustments to achieve the expected urban form. The second limitation is the lack of ground level verification of the findings. Existing knowledge has utilized different models to capture the surface runoff of the urban form. Nevertheless, those studies have not been verified with the field information.
This paper attempts to overcome the mentioned limitations noted in the domains related to urban planning, through a novel theoretical framework, to capture the four dimensional direct, indirect, and moderate relationships between land use, accessibility, density, and surface runoff in an urban context.
The theoretical framework of the study is explained in the next section. The third section focuses on the methods and materials extracted from contemporary literature. The analysis and results are aligned in the fourth section, which is comprised of three types of analysis to explore the relationships and influence of the variables. Conclusions and recommendations are presented at the end of the paper.

Theoretical Framework

The objective of the study is to analyze the relationship between land use, accessibility, density, and surface runoff and identify the influence of each variable on other variables in a common context. The theoretical framework of the study has been developed based on the four notions, i.e., natural movement theory, the transport land use feedback cycle, natural occupancy theory, and the infiltration concept under the water balance model. The theory of the movement economy explains that the “configuration of the urban grid itself is the main generator of the patterns of movement”. Commercial land uses are then located to take the opportunity offered by the passing trade and may well act as multipliers on the basic pattern of ‘natural movement’ generated by the grid configuration. Therefore, Configuration (C) is identified as a main driving force to direct movements and attractions of an urban context. Furthermore, a set of studies have been carried out to understand the relationship between the structure of the urban grid (Configuration) and movements (M) of the people based on the graph theory [32]. Hillier, Perm, Hanson, Grajewski, & Xu [23] have conducted a study based on the space syntax tool to prove that road networks that bifurcate into nodes and links can represent the urban block structure (Configuration) [33].
Therefore, confutation can be represented by the road network, which provides accessibility to the urban form. Furthermore, as the transport feedback cycle explains, the transport system increases accessibility to the urban areas and provides multiple effects on the land use to attract more people and new land uses to increase the diversity of land use distribution. A series of studies have shown evidence to prove the relationship between accessibility and land use (LU) [18,34].
As the natural occupancy theory explains, movements and attractions are directed by the configuration (Accessibility) of the urban form. Therefore, attraction and movements provide multiple spatial effects on the land use (LU) and density (D) [35,36]. Furthermore, highly accessible configuration and land use create more density in the urban form.
Figure 2 depicts the natural process of a single land evolution into a complex urban form, based on the changes of the configuration (Accessibility) land uses and movements. Configuration attracts people, and new activities are established to gain the attraction of people. New land uses are established, and single land plots are divided into more land plots. Configuration and land use are influenced to create the density of the context [37].
According to the aforementioned knowledge, both land use and density act as a function for accessibility. Typically, highly accessible locations have a higher land use diversification, with more attraction for people and also a highly densified urban fabric which includes a higher land demand and low land plot sizes. Hence, it directly changes the surface of the urban area with solid materials such as concrete, tar, etc. As the water balance model explains, at the forest vegetation cover, the infiltration level is more than 80% of the precipitation, whereas the highly urbanized urban surface has only a 10% infiltration, when the vegetation cover is changed into a densified solid surface coverage-based land [14]. This means that the runoff level is very high when a vegetation cover is converted to a density solid surface cover built-up land in the urban form. Hence, land use and density control the surface runoff of the urban form [38,39]. Further series of studies have discovered a higher relationship between surface runoff and land use [29] and density [40].
Aforementioned theories and empirical studies have created the argument that land use and density change accordingly with accessibility changes. Higher accessibility motivates an increase in the diversity of land use by increasing demand for the context. Hence, a higher number of people are attracted and demand is created for the available space. As a result, available open land and built-up land is subdivided into smaller land plots which increase the density and impermeability of the urban surface. Therefore, the potential of infiltration is reduced because of the higher built-up cover. Consequently, the increase in surface runoff volume and inundation have the potential to create flood risk for the urban context.
Therefore, the objective of this study is to analyze the relationship between land use, accessibility density and surface runoff in one context. Available knowledge which explains theoretical relationships have been compiled in Figure 3, with the directions of the influence by each variable. The study focuses on testing those relationships and the influence of each main variable and sub-variables on other variables.
The next section explains the methods of the main and sub-variables’ quantification. Those methods have been derived from the available knowledge related to this study.

2. Materials and Methods

2.1. Quantifying Variables—Land Use, Accessibility, Density, and Surface Runoff

There are 13 sub variables under the 4 main variables. Table 1 shows the calculation method and the type of data that is used to quantify all the sub-variables.

2.2. Justifcation for the Subvariable Sellection

Hillier [33] explains that the configuration of the urban form creates attraction for the area, and urban configuration can be captured by utilizing features of the road network. The closeness centrality represents the topological character of the road network which includes road segment graphs with the trip production of each segment [36]. It is created based on the closest distance of a particular segment with other segments. The higher closeness centrality represents higher attraction to people and creates multiple effects on the land use and density by attracting people into the area. Furthermore, this study utilized the width of the road network as a mobility character of the road network based on the data availability [42]
Frank [43] introduces the mixed-use index to capture the level of land use diversity based on the land use amount and area of a particular zone. The higher land use diversity attracts more people and creates multiple effects on the density which disturbs the water infiltration [22]. Furthermore, Luo [44] explains that canopy vegetation and ground vegetation make different contributions to the level of change to the surface runoff in an urban context. Ground vegetation supports the improvement of water infiltration more than an open surface. Comparatively, vegetation cover has a higher infiltration capacity than a built-up surface.
The space matrix method introduced by Ye and Nes [41] was utilized to capture the density of the urban form by incorporating the ground space index, floor space index, building height, and the open space percentage. The ground space index represents the area that has been covered by the building which disturbs the water infiltration to the soil. Building height and floor space index represents the vertical density of urban form [28]. The vertical density represents the level of trip attraction of the building. The attraction to people increases the diversity of the land use and creates multiple effects to attract more people and increase land subdivisions with the small land plot sizes [18].
A series of studies have been utilized in slope, imperviousness, and soil type as a sub-variable to measure the surface runoff of the urban form [4,12,42].

2.3. Case Study

The theoretical relationships (refer to Figure 3) tested in the Gampaha urban area is located in the western province. The selected area is a seasonally flood affected urban context. More than 50,000 people are affected when floods occur in the urban and suburban areas. Table 2 explores key information of the case study area.
The first step was the preparation of the analysis zones. Hu et al. [2] have utilized natural watersheds as these analysis zones. First, natural watersheds are delineated by covering the study area and the area of each zone is plotted in the histogram. Accordingly, the mean, maximum, and lowest sizes of the plots are identified. Then, the higher sizes of zones are subdivided; based on the road network, very low size zones are amalgamated with closer zones. Figure 4 depicts the process of the analysis zone preparation.
After developing the data set, 4D graphs, decision tree analysis, and the structure equation model were utilized to analyze the data set. The following section explains the data preparation process of all the main and sub variables.
There are four sub variables under land use. Those are Mix use index (MUI), prominent land use (PLU), ground vegetation cover (GVC), and canopy vegetation cover (CVC) variables. MUI and PLU are calculated based on the polygon land use file. First, the land use layer is joined with the zones and land use amount and area of different land use is extracted under separate zones. Then, MUI based on the entropy formula mentioned under Table 1 is computed. The PLU data set is developed by selecting the highest area of covered land use from each zone. Then all land uses are categorized under commercial, working, residential, and amenities. Those categories are rated according to Yu’s method [41] that has been developed to categorize land use. Ground vegetation areas and canopy vegetation cover needs to be digitized first. Then, these two layers are intersected with analysis zones to extract the respective GVC and CVC for each zone. Figure 5 shows the entire process of the land use data preparation.
There are two variables under accessibility that represent both mobility and topological characters of accessibility. Closeness centrality (CC) is computed for each road segment by utilizing the DNA tool in the QGIS environment. To calculate closeness centrality, the road network is intersected by utilizing analysis zones, to extract zone-wise centrality values. Road width is also extracted zone-wise by utilizing intersect tools in the Arc GIS environment (refer Figure 6).
There are nine density categories derived from the data set based on the sub-variables of density such as Ground space index (GSI), floor space index (FSI), building height (BH), and open space (OS). These variables were calculated based on the formulas mentioned in Table 1. Yu [41] has utilized the space matrix method to categorize the density of the urban form based on GSI, FSI, BH, and OS. Figure 7 shows the space matrix and nine density categories.
The Strong Water Management model (SWMM) is utilized to quantify surface runoff values based on the slope, imperviousness, and soil type variables. Results of the surface runoff value are derived from SWMM validated based on the real ground information. Flood locations, flood depth, and flood duration of the model have been validated, based on the ground of the respective information. Figure 8 and Figure 9 show the SWMM result validation based on the real ground data. From the systematic sampling method, 50% of flood locations and non-flood locations were selected in accordance with the SWMM result. More than 95% of model flood locations match with real ground flood locations. The relationship between model and real data flood depth and flood duration indicate 0.85 and 0.82 R squares, respectively. Therefore, surface runoff values are confidentially utilized for further analysis.

3. Results

The study first developed the data set for all four variables, i.e., accessibility, density, land use, and surface runoff (refer to Table 1). Then, 4D graphs were developed to analyze the relationship between those main variables and the sub-variables by utilizing the MATLAB environment. A decision tree analysis was conducted by utilizing the “Waikato Environment for Knowledge Analysis” (WEKA) application to identify the potential flows of variables that occur in different surface runoff levels. The third analysis was performed to identify the influence of each variable to change other variables by utilizing the structure equation model (SEM) for the analysis of a moment structures (AMOS) application (refer to Figure 10). The aim of these three studies is to identify the relationship between land use, accessibility, density, and surface runoff and the influence of each variable to change the other main and sub-variables.

3.1. Relationship between Accessibility, Land Use, Density, and Surface Runoff

3.1.1. Analysis Result—4D Plot Diagram

The study utilized 4D diagrams to show the relationship among land use, accessibility, density, and surface runoff. Furthermore, sub-variables have been plotted to explore more comprehensive ideas about the aforementioned relationships. The following figures show 4D graphs of the main variables and sub-variables (refer Figure 11a–d). More than 60% of the study area represents a highly urbanized context. Therefore, most of the data points are concentrated with high values in the four axes. The results clearly show the relationship between land use, accessibility, density, and surface runoff. Figure 11a depicts higher R squared values between surface runoff and other variables. This clearly shows that the HRB, MRB, LRB, and HRS density categories have been plotted with the highest levels of the surface runoff. Low density categories such as LRP, MRP, and HRP have been plotted with the lowest levels of surface runoff, accessibility, and land use. Figure 11b shows a higher GSI, which comes under density located with the higher surface runoff. These figures clearly show that a higher level of surface runoff can occur with higher levels of density categories, land use and accessibility. Among them, density shows a higher correlation with surface runoff by indicating 0.65 as the R squared value. The GSI index shows the highest correlation with surface runoff under the sub-variables of density. This finding proves that the influence of the level of the ground cover is capable of changing the surface runoff. Figure 11c shows the relationship between surface runoff, accessibility sub variables and density. More than 50% of the data points have been recorded with a higher closeness centrality and road width. At the same time, those are showing as very high surface runoff recorded zones. Overall, Figure 11a–d show a higher level of surface runoff recorded with higher density, accessibility, and land use. Comparatively, a low level of accessibility recorded zones represent a low level of surface runoff, density, and land use. Under density, GSI shows higher correlation with surface runoff and closeness centrality which shows a higher relationship with surface runoff under accessibility. Therefore, this result confirms that theoretical framework which explains these four variables are working together and also depend on other variables.
Overall, Figure 11a–d show a higher level of surface runoff recorded with higher density, accessibility, and land use. Comparatively, a low level of accessibility recorded zones represent a low level of surface runoff, density, and land use. Under density, GSI shows higher correlation with surface runoff and closeness centrality, which shows a higher relationship with surface runoff under accessibility. Therefore, this result confirms that the theoretical framework which explains these four variables are working together and also depend on other variables.

3.1.2. Analysis Result—Decision Tree

Decision tree analysis was utilized to explore the patterns between the given variables. Patterns can be derived based on the relationships between provided variables. The analysis generated a flow diagram by showing leading variables and a flow that influenced the creation of different levels of the given variable. The accuracy of the model is shown in Table 3. This study has analyzed the leading variable flow that occurs on different surface runoff levels based on the given data set. The model shows a higher model accuracy with 80.2% of correctly classified instances (Figure 2). The highest accuracy of the analysis indicates availability of a strong pattern and correlation with other variables in the given data set. Figure 12 depicts that closeness centrality is the leading variable to create the flow of different surface runoff levels in the study area. According to the data set, a possibility of 32% could be expected to occur in high and very high surface runoff events in the study area. Moderate level surface runoff incidents have the highest possibility (37%) to occur with different levels of accessibility, density, and land use variables. Furthermore, the result indicates that higher level surface runoff patterns occur with higher closeness centrality and densities, ground vegetation cover percentages, and mixed-use indices. Low surface categories are recorded with low levels of accessibility, density, canopy cover percentage, and road width variables. The analysis accentuates the relationship between these variables and shows that the variables tend to display different surface runoff incidents according to their hierarchy.

3.1.3. Analysis Result—Structure Equation Model (SEM)

The SEM model was utilized to test the theoretical relationship and influence of the main variables and sub variables on the other variables. The model provides facilities to test the direction of the correlation and level of influence by individual variables to change other variables. The data set has recorded a very high level of accuracy under seven parameters (refer Table 4).
Figure 13 depicts the influence of each main and sub variable on other variables with their direction of influence. The model is based on the conceptual diagram (refer Figure 3) that has been derived from the literature review. Table 5 shows individual influence of accessibility, density, and land use to change surface runoff. The highest influence recorded from density is value 0.88, which includes GSI, FSI, OS, and BH sub variables. Accessibility, especially, has a 0.94 influence to change density. It explains that when change unites with 1 unit of accessibility, it influences a change of 0.94 units from density. The second highest influence is recorded from accessibility by including closeness centrality and road width. The SEM model clearly confirms the conceptual diagram that has been developed based on the literature. The accuracy of the model and the levels of influence confidently prove the close relationship between land use, accessibility, density, and surface runoff with direction of the influence.
Table 6 depicts the influence of sub-variables on the surface runoff. The impervious variable is the highest influencing variable out of the 13 sub-variables. Nevertheless, it comes under the surface runoff main variable. Closeness centrality is a highly influenced individual sub-variable from other main variables. It has a 0.75 influence as an individual variable. In addition, the model result highlighted the influence of the GSI and FSI as 0.73 and 0.63, respectively. Table 7 shows the influence of sub-variables to change respective main variables according to the given dataset.
Finally, the results demonstrate the direction of dependency and influence of the variables on other variables. Specially, closeness centrality, ground space index, and floor space index display a higher influence to change the surface runoff in the ground. Density is the high main variable to change surface runoff with the dependency of accessibility and land use.

4. Discussion

The findings of this study contribute, on one hand, to sustain some of the arguments developed by the previous studies, and on the other hand, contribute newly developed evidence to studies related to the four-dimensional relationship between land use, accessibility, density, and surface runoff. Hillier [33], as well as Yu and Akkelies [8], established that land use, accessibility, and density have an interrelationship and that this relationship creates a major influence on the occurrence of urban-form-related incidents such as urban flooding. The results of this study also verify the interrelationship between land use, accessibility, and density. In addition, this study distinguishes that interrelationship has a significant influence on changing surface runoff which is a major contributor to create urban flood incidents.
Previous studies [15,28,32,41,
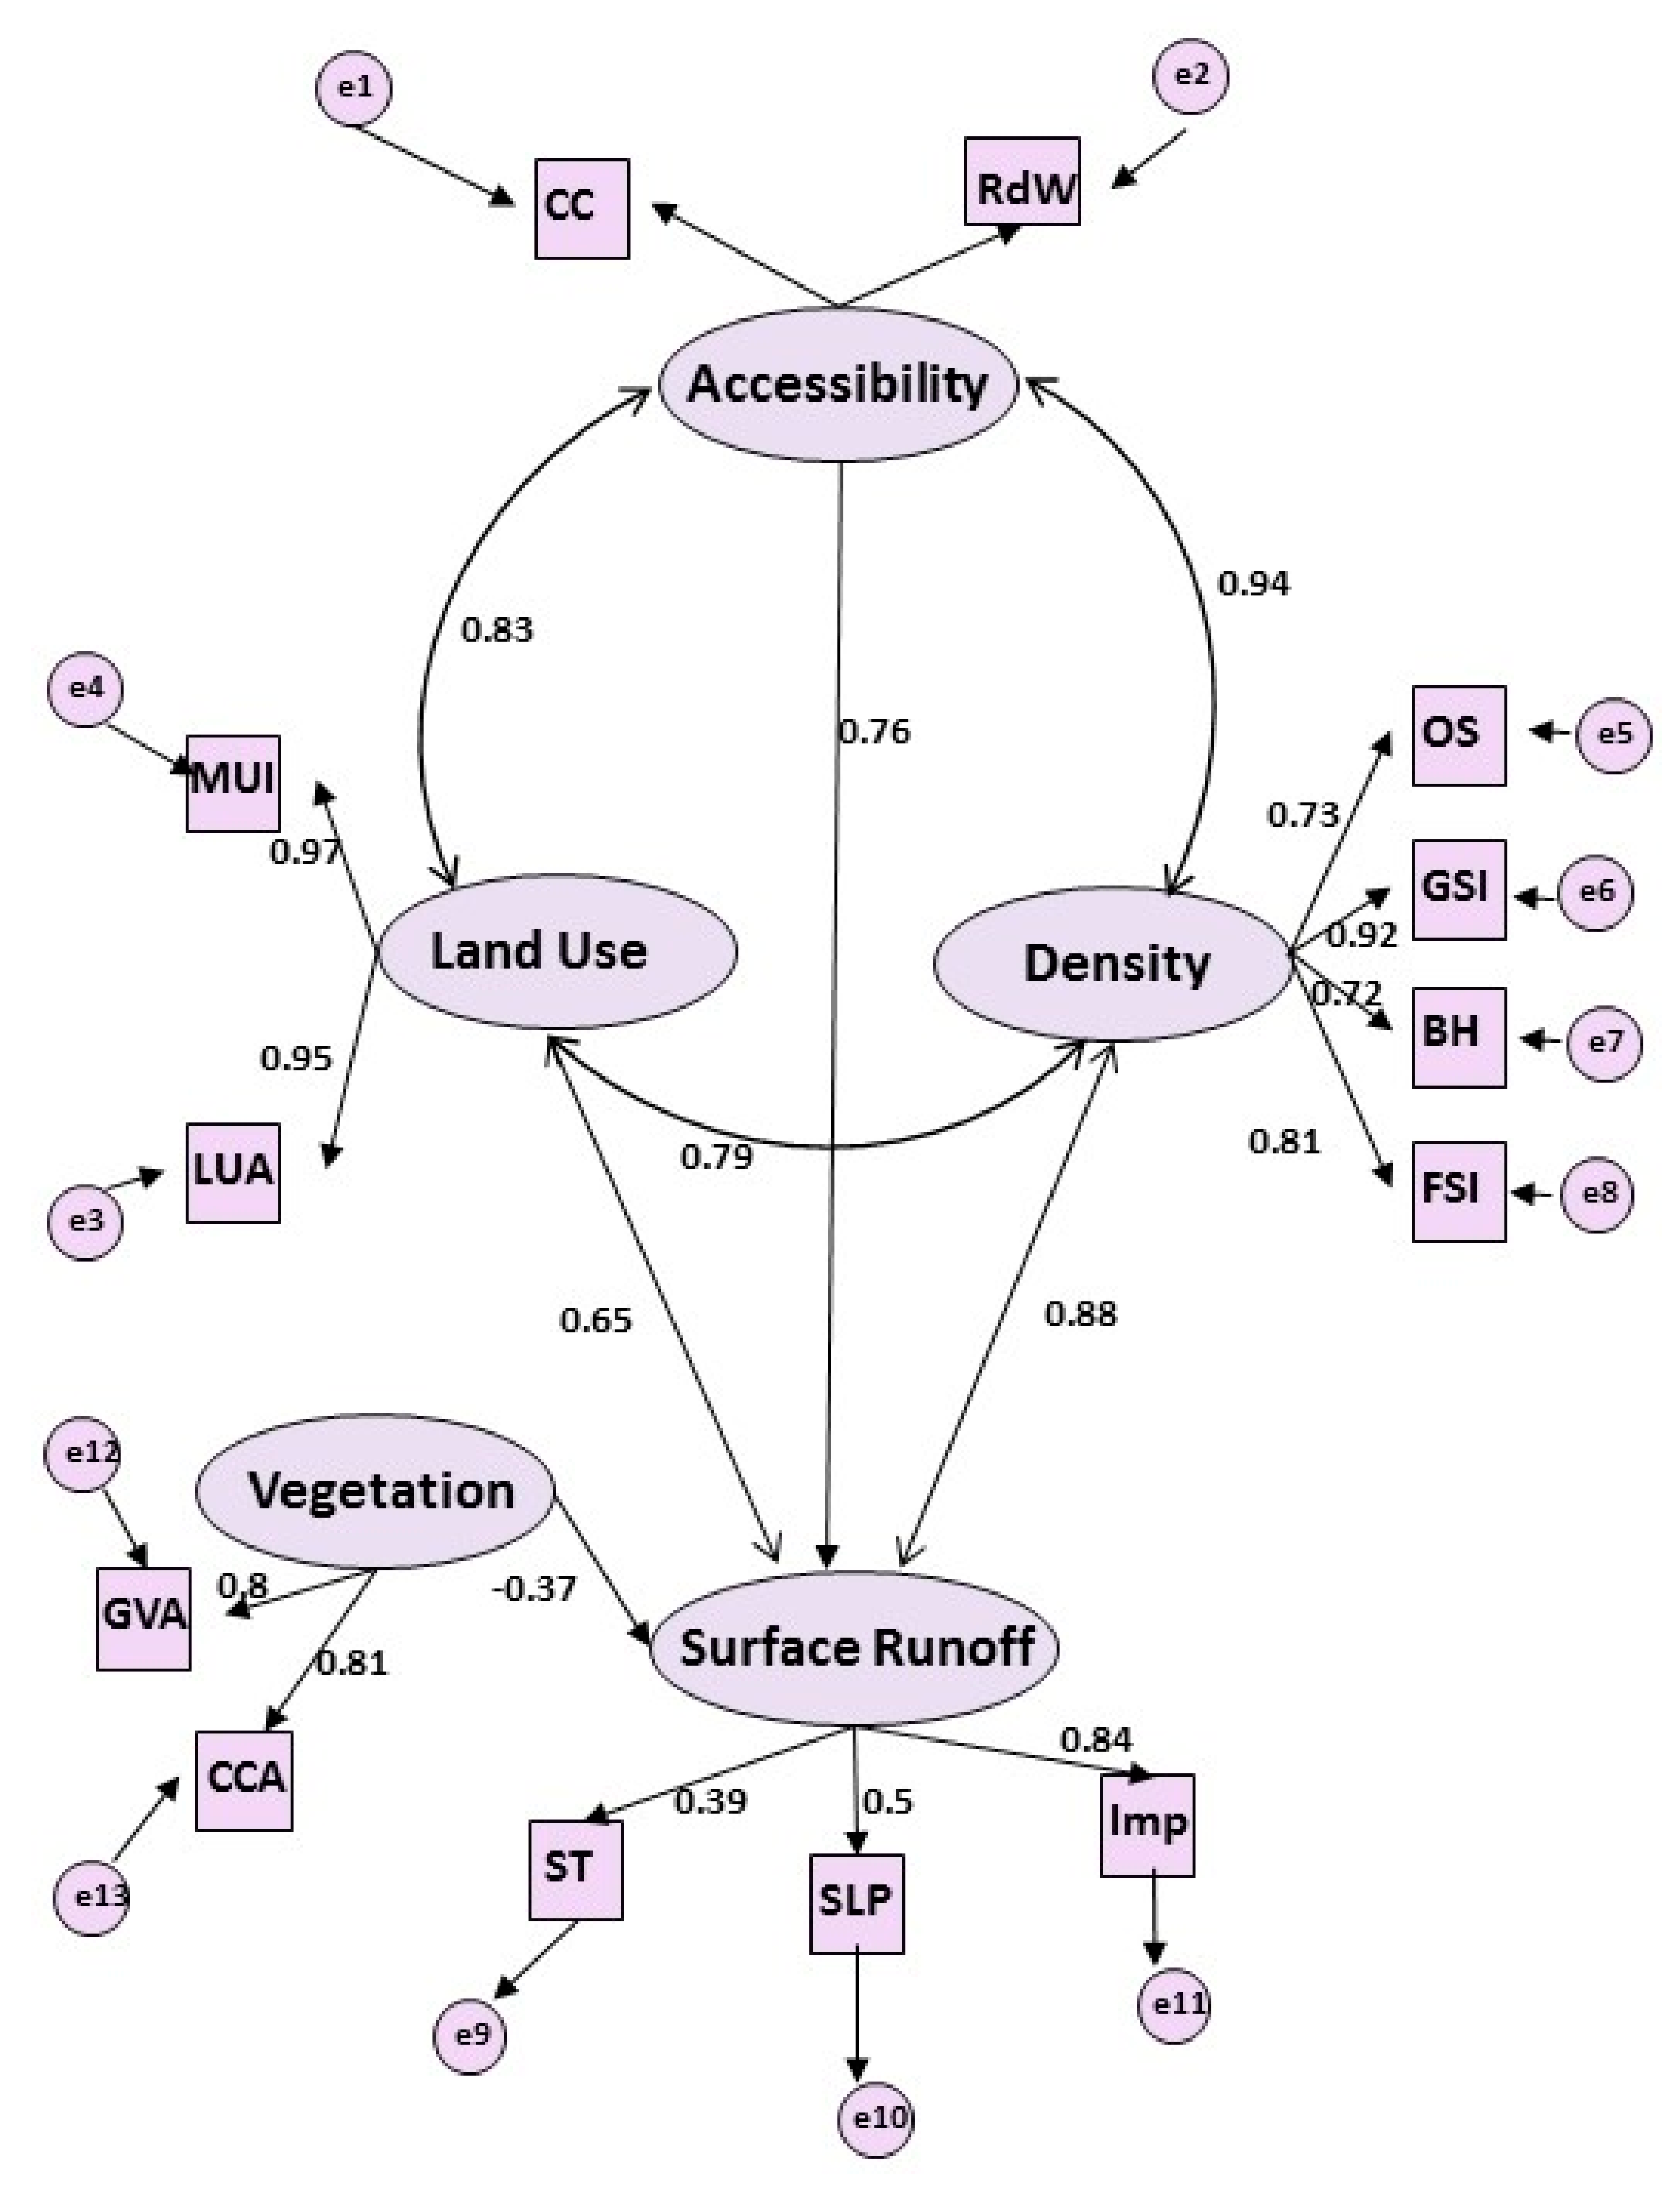
45] argued that land use and density can change based on the changes in accessibility. However, this study found that it is more effective to incorporate both topological and mobility characters of accessibility to capture the real influence of accessibility on land use, density, and surface runoff. The result recorded the relationship between accessibility with land use, density, and surface runoff as 0.83, 0.94, and 0.76, respectively. Furthermore, previous studies [8,
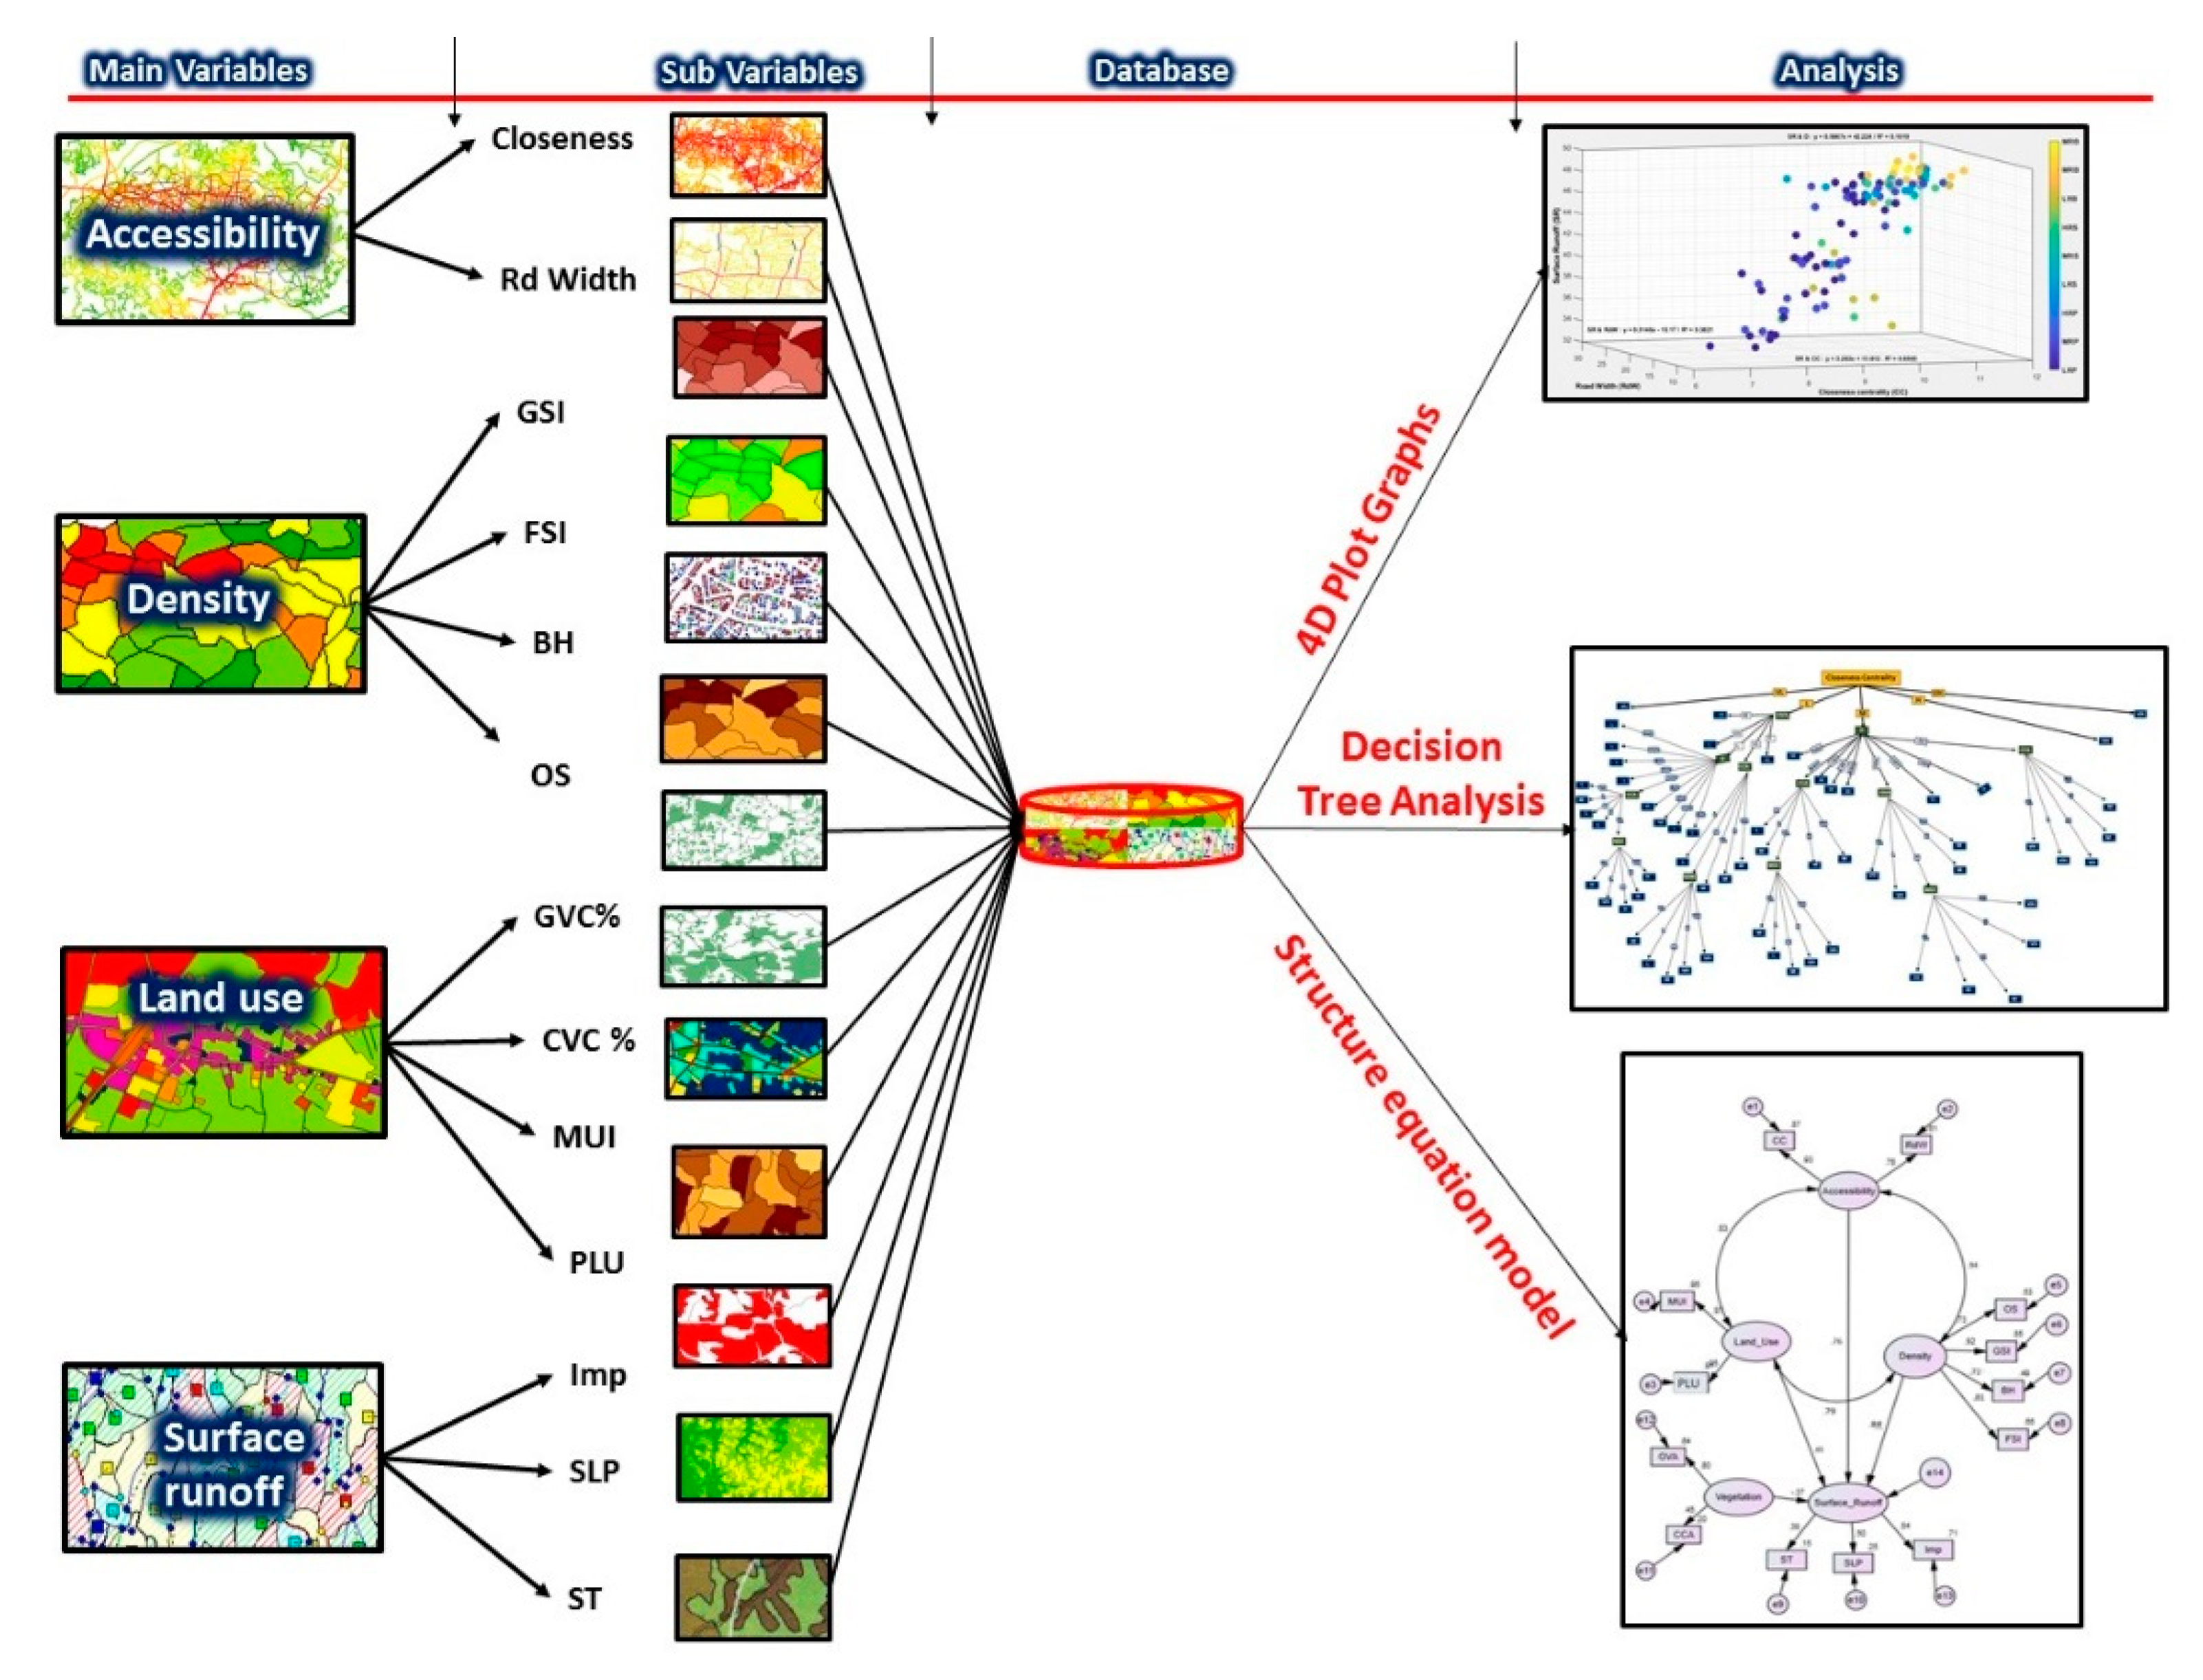
40] have shown that a higher density reduces the capability of water infiltration by covering the surface with solid materials. The results of this study revealed that higher accessibility encourages the increase in the land use mix, density, and surface runoff in the urban context. The novel finding of this study reveals the influence levels of accessibility, land use, and density on surface runoff. The density has a 0.88 influence on the surface runoff, which represents the highest influence change in surface runoff in an urban context to create urban flooding incidents. The influence value indicates that when there is a change in 1 unit of density, it influences a change of 0.88 in the surface runoff. Nevertheless, density change is based on the accessibility and land use. The results show that accessibility and land use have influences of 0.94 and 0.79, respectively, to change density. Closeness centrality is the leading sub-variable to change surface runoff out of the other 12 sub variables. It shows a 0.75 influence to change surface runoff as an individual sub-variable under the topological character of accessibility. Moreover, the decision tree analysis shows that there is more than 80% accuracy between the four variables that occur in different surface runoff events based on the relationship between the four dimensions. Finally, the study has tested the four-dimensional theoretical relationship in one context to comprehend the relationship between these four dimensions and the influence of each variable on other variables.

5. Conclusions and Recommendations

The objective of this study was to evaluate the four-dimensional relationship among land use, accessibility, density, and surface runoff in urban areas. Existing studies have not given considerable attention on the urban form components (land use, accessibility, and density) that create a complex and dynamic influence to change surface runoff in an urban context. Moreover, available studies have not attempted to analyze these four dimensions together. To overcome these limitations, this study utilized the 4D diagram technique to identify the relationship between four dimensions and sub-components of these dimensions. Furthermore, the patterns of the data set are read by the decision tree analysis. The influence of each variable on other variables is elaborated by utilizing the structural equations model (SEM).
The results of the study can be summarized into four main findings. First, the tested theoretical framework is accurate and confirmed with the result of higher density and land use mixed study zones located with higher accessibility. Additionally, higher surface runoff locations are also predominantly located with those zones which represent higher accessibility, land use, and density. The reverse scenario also shows the same pattern. Second, the dataset represents predominantly urban characteristics with higher accessibility, density and land use. Therefore, more than a 31% possibility is recorded with the high and very high-level surface runoff occurrences with the given dataset. A strong water management model detected flooding nodes within those zones. Therefore, this finding strongly proves that high accessibility, land use and density create more possibilities of increasing surface runoff and urban flood incidents. Third, according to the decision tree analysis, this possibility is led by the classlessness centrality and density. Fourth, structure equation model indicates that closeness centrality as an individual sub-variable has a higher influence on changing the surface runoff. According to the theoretical framework, closeness centrality comes under the accessibility parameter. It is capable of influencing changes in density and land use with a higher percentage. Therefore, closeness centrality can be identified as a core sub-variable of the entire system.
According to the findings of the study, decision makers can utilize these findings to understand the urban form and its components, the behavior of the urban form and the outcomes of the behavior, and how those components influence change in other variables and outcomes of the urban form. The understanding of dynamic behaviors of the urban form helps the urban planners to make their decisions more confidently in a logical framework. The identification of the complexity of the urban form and the influence of individual components provide better support to plan strategies and zoning regulations to control and encourage developments. According to the current trends of accessibility, land use and density, planners can predict how surface runoff will change based on the current trend and what kind of strategies and regulations should be formulated. Therefore, this study concludes that this framework will be an effective tool for decision makers in the field of land use planning, resilience city planning, transport planning, and for those who are focusing on developing resilient cities in the world.

Author Contributions

Conceptualization, C.A. and S.M.; methodology, S.M. and A.J.; software, A.J., C.P. and S.M.; validation, S.M. and C.A.; formal analysis, S.M. and A.J.; investigation, S.M.; resources, C.A. and C.P.; data curation, S.M., C.P. and A.J.; writing—original draft preparation, S.M. and C.A.; writing—review and editing, S.M. and A.J.; visualization, S.M. and A.J.; supervision, C.A. and A.J.; project administration, C.A. and A.J.; funding acquisition, C.A. All authors have read and agreed to the published version of the manuscript.

Funding

“This research was funded by University of Moratuwa (UOM), Sri Lanka, Senate Research Committee Grant, grant number SRC/LT/2020/28” and “The APC was funded by UoM, Senate Research Committee Conference & Publishing Support Grant”.

Institutional Review Board Statement

Not applicable.

Informed Consent Statement

Not applicable.

Data Availability Statement

Not applicable.

Conflicts of Interest

The authors declare no conflict of interest.

References

  1. Feng, B.; Zhang, Y.; Bourke, R. Urbanization impacts on flood risks based on urban growth data and coupled flood models. Nat. Hazards 2021, 106, 613–627. [Google Scholar] [CrossRef]
  2. Hu, S.; Fan, Y.; Zhang, T. Assessing the Effect of Land Use Change on Surface Runoff in a Rapidly Urbanized City: A Case Study of the Central Area of Beijing. Land 2020, 9, 17. [Google Scholar] [CrossRef] [Green Version]
  3. Weng, Q. Modeling Urban Growth Effects on Surface Runoff with the Integration of Remote Sensing and GIS. Environ. Manag. 2001, 28, 737–748. [Google Scholar] [CrossRef] [PubMed]
  4. Kang, S.; Yeom, J.; Jung, J. Urban Form and Natural Hazards: Exploring the Dual Aspect Concept of Urban Forms on Flood Damage. Sustainability 2021, 13, 9007. [Google Scholar] [CrossRef]
  5. Loenhout, J.V. Human Cost of Disasters: An Overview of the Last 20 Years; The Centre for Research on the Epidemiology of Disasters: Geneva, Switzerland, 2020. [Google Scholar]
  6. United Nations. Guidelines for Reducing Flood Losses. Available online: https://sustainabledevelopment.un.org/content/documents/flood_guidelines.pdf (accessed on 7 November 2021).
  7. Nutt, M.M. Framing the Challenge of Urban Flooding in the United States; The National Academies Press: Washington, DC, USA, 2019. [Google Scholar]
  8. Chen, Y.; Zhou, H.; Zhang, H.; Du, G.; Zhou, J. Urban flood risk warning under rapid urbanization. Environ. Res. 2015, 139, 3–10. [Google Scholar] [CrossRef]
  9. Huang, Q.; Wang, J.; Li, M.; Fei, M.; Dong, J. Modeling the influence of urbanization on urban pluvial flooding: A scenario-based case study in Shanghai, China. Nat. Hazards 2017, 87, 1035–1055. [Google Scholar] [CrossRef]
  10. Bank, T.W. Population Growth. December 2019. Available online: https://data.worldbank.org/indicator/SP.POP.GROW (accessed on 7 November 2021).
  11. Daniel, H. The effects of population and housing density in urban areas on income in the United States. SAGE 2020, 35, 27–47. [Google Scholar]
  12. Aswathanarayana, U. Water Resources Management and the Environment; CURWSL: London, UK, 2001; pp. 1–10. [Google Scholar]
  13. Du, S.; Wen, J.; Shi, P.; Rompaey, A.V. Quantifying the impact of impervious surface location on flood peak discharge in urban areas. Nat. Hazards 2015, 76, 1457–1471. [Google Scholar] [CrossRef]
  14. Wang, D.; Fu, X.; Luan, Q.; Liu, J.; Wang, H.; Zhang, S. Effectiveness assessment of urban waterlogging mitigation for low impact development in semi-mountainous regions under different storm conditions. Hydrol. Res. 2021, 52, 284–304. [Google Scholar] [CrossRef]
  15. Yin, J.; Yu, D.; Yin, Z.; Liu, M.; He, Q. Evaluating the impact and risk of pluvial flash flood on intra-urban road network: A case study in the city center of Shanghai, China. J. Hydrol. 2016, 537, 138–145. [Google Scholar] [CrossRef] [Green Version]
  16. Swain, D.L.; Wing, O.E.J.; Bates, P.D.; Done, J.M.; Johnson, K.A.; Cameron, D.R. Increased Flood Exposure Due to Climate Change and Population Growth in the United States. Earth’s Future 2020, 8, 1–12. [Google Scholar] [CrossRef]
  17. Dempsey, N.; Brown, C.; Raman, S.; Porta, S.; Jenks, M.; Jones, C.; Bramley, G. Elements of Urban Form. Future City 2008, 21–51. [Google Scholar] [CrossRef]
  18. Pandya, R.J.; Katti, B.K. Dynamism of Transportation and Land Use Interaction in Urban Context. Int. J. Adv. Res. Technol. 2012, 1, 1–5. [Google Scholar]
  19. Wang, Z.; Han, Q.; De Vries, B. Land Use/Land Cover and Accessibility: Implications of the Correlations for Land Use and Transport Planning. Appl. Spat. Anal. Policy 2018, 12, 923–940. [Google Scholar] [CrossRef] [Green Version]
  20. Lundgren, L.W. Environmental Geology; Pearson Prentice Hall, Inc.: Upper Saddle River, NJ, USA, 1999; pp. 3–4. [Google Scholar]
  21. Guzha, A.; Rufino, M.; Okoth, S.; Jacobs, S.; Nobrega, R. Impacts of land use and land cover change on surface runoff, discharge and low flows: Evidence from East Africa. J. Hydrol. Reg. Stud. 2018, 15, 49–67. [Google Scholar] [CrossRef]
  22. Tilahun, A.K. Land Use Land Cover Change and Its Implication on Surface Runoff: A Case Study of Baro River Basin in South Western Ethiopia. J. Environ. Earth Sci. 2015, 8, 1–9. [Google Scholar]
  23. Hillier, B.; Perm, A.H.; Grajewski, T.; Xu, J. Natural movement:or, configuration and attraction in urban pedestrian movemen. Environ. Plan. 1993, 20, 29–66. [Google Scholar] [CrossRef] [Green Version]
  24. Kelobonye, K.; Zhou, H.; Xia, J.; McCarney, G. Assessing the potential of an effective density-based measure against accessibility models for evaluation and prioritisation of activity centres. Appl. Geogr. 2021, 128, 102390. [Google Scholar] [CrossRef]
  25. Koning, R.d.; Nes, A.V. Strategies for Intergrated Densification with Urban Qualities: Combining Space Syntax with building density, land usage, public transport and property rights in Bergen city. In Proceedings of the 11th Space Syntax Symposium, Lisbon, Portugal, 3–7 July 2017; pp. 3–4. [Google Scholar]
  26. Sung, H.; Joong, C.M. An Effect of Rail Station Accessibility on Building Development Density. J. Korea Plan. Assoc. 2014, 49, 63–77. [Google Scholar] [CrossRef]
  27. Strohbach, M.W.; Döring, A.O.; Möck, M.; Sedrez, M.; Mumm, O. The “Hidden Urbanization”: Trends of Impervious Surface in Low-Density Housing Developments and Resulting Impacts on the Water Balance. Front. Environ. Sci. 2019, 7, 29. [Google Scholar] [CrossRef] [Green Version]
  28. Ye, Y.; Nes, A.V. Quantitative tools in urban morphology: Combining space syntax, spacematrix and mixed-use index in a GIS framework. Urban Morphol. 2014, 18, 97–118. [Google Scholar]
  29. Pertiwi, P.C.; Hisyam, E.S.; Yofianti, D. The effect of land use change to surface runoff discharge in the POMPONG watershed at Bangka regency. IOP Conf. Ser. Earth Environ. Sci. 2020, 599, 012039. [Google Scholar] [CrossRef]
  30. Hill, J. Evaluation of Rational Method “C” Values; Land Use and Environment Group: Sandiego, CA, USA, 2002. [Google Scholar]
  31. Conzen, M.R.G. Thinking about Urban Form. In Urban Morphology; Peter Lang: Brussels, Belgium, 2004; pp. 10–30. [Google Scholar]
  32. Hillier, B. Space Is the Machine: A Configurational Theory of Architecture; Cambridge University Press: Cambridge, UK, 1999. [Google Scholar]
  33. Jayasinghe, A.B. A Network Centrality-Based Simulation Approach to Model Traffic Volume. Ph.D. Thesis, CEPT University, Gujarat, India, 2011; pp. 11–15. [Google Scholar]
  34. Fischer, M.M.; Nijkamp, P. Handbook of Regional Science. Available online: https://link.springer.com/referencework/10.1007/978-3-662-60723-7 (accessed on 7 November 2021).
  35. Jayasinghe, A.; Sano, K.; Rattanaporn, K. Application for developing countries: Estimating trip attraction in urban zones based on centrality. J. Traffic Transp. Eng. 2017, 4, 464–476. [Google Scholar] [CrossRef]
  36. Shpuza, E. Block shape in historic cities: A classification based on compactness and fragmentation. In Proceedings of the ISUF 2020: Cities in the Twenty-First Century, Salt Lake City, UT, USA, 1–4 September 2020; pp. 2–8. [Google Scholar]
  37. Bobkova, E. Towards a Theory of Natural Occupation; Chalmers University of Technology: Gothenburg, Sweden, 2019. [Google Scholar]
  38. EPA. Environemntal Assessment; Environmental Protection Agency: Washington, DC, USA, 2000.
  39. Morbidelli, R.; Corradini, C.; Saltalippi, C.; Flammini, A.; Dari, J.; Govindaraju, R.S. Rainfall Infiltration Modeling: A Review. Water 2018, 10, 1873. [Google Scholar] [CrossRef] [Green Version]
  40. Bruwier, M.; Maravat, C.; Mustafa, A.; Teller, J.; Pirotton, M.; Erpicum, S.; Archambeau, P.; Dewals, B. Influence of urban forms on surface flow in urban pluvial flooding. J. Hydrol. 2020, 582, 124493. [Google Scholar] [CrossRef]
  41. Ye, Y.; Nes, A.V. Measuring urban maturation processes in Dutch and Chinese new towns: Combining street network configuration with building density and degree of land use diversification through GIS. J. Space Syntax 2013, 4, 18–37. [Google Scholar]
  42. Mecheri, S.; Rosey, F.; Lobjois, R. The effects of lane width, shoulder width, and road cross-sectional reallocation on drivers’ behavioral adaptations. Accid. Anal. Prev. 2017, 104, 65–73. [Google Scholar] [CrossRef] [PubMed]
  43. Frank, L.D. Impacts of Mixed Used and Density on Utilization of Three Modes of Travel: Single-Occupant Vehicle, Transit, Walking. Transp. Res. Rec. 1994, 1466, 44–52. [Google Scholar]
  44. Luo, J.; Zhou, X.; Rubinato, M.; Li, G.; Tian, Y.; Zhou, J. Impact of Multiple Vegetation Covers on Surface Runoff and Sediment Yield in the Small Basin of Nverzhai, Hunan Province, China. Forests 2020, 11, 329. [Google Scholar] [CrossRef] [Green Version]
  45. Kaletova, T.; Nemetova, Z. Determination of surface runoff from the modelled area. Environ. Earth Ecol. 2017, 1, 61–66. [Google Scholar] [CrossRef] [Green Version]
Figure 1. Effects of urbanization on runoff and infiltration. Adapted with permission from ref. [14] Copyright Year: 2021 Copyright Owner’s Name: Wang, D et al The surface runoff of a forest ecosystem is recorded to be less than 10% of the precipitation because 40% is lost to evapo-transpiration and 50% is lost to infiltration (refer to the 1st stage of Figure 1).
Sustainability 14 00522 g001
Figure 2. Conceptual explanation for natural occupancy.
Sustainability 14 00522 g002
Figure 3. Theoretical relationship between land use, accessibility, density, and surface runoff.
Sustainability 14 00522 g003
Figure 4. Analysis zones preparation.
Sustainability 14 00522 g004
Figure 5. Land use data preparation.
Sustainability 14 00522 g005
Figure 6. Data preparation process of accessibility.
Sustainability 14 00522 g006
Figure 7. Space matrix (Source: [28]).
Sustainability 14 00522 g007
Figure 8. Real ground and model flood locations: (a) Model identified flood locations; (b) Real ground flood locations.
Sustainability 14 00522 g008
Figure 9. (a) Model and Actual flood depth; (b) Model and actual flood duration.
Sustainability 14 00522 g009
Figure 10. Analysis process.
Sustainability 14 00522 g010
Figure 11. Four-dimensional graph analysis: (a) relationship between land use, accessibility, density, and surface runoff; (b) relationship between mixed use index, closeness centrality, density, and surface runoff; (c) relationship between road width, closeness centrality, density, and surface runoff; (d) relationship between surface runoff, building height, floor space index, and ground space index. (Note: LRP = Low Rise Point, MRP = Mid Rise Point, HRP = High Rise Point, LRS = Low Rise Strip, MRS = Mid Rise Strip, Low Rise Block = LRB, MRB=Mid Rise Block, HRB = High Rise Block).
Sustainability 14 00522 g011aSustainability 14 00522 g011b
Figure 12. Decision tree analysis.
Sustainability 14 00522 g012
Figure 13. Structure equation model result.
Sustainability 14 00522 g013
Table 1. Quantification methods of the variables.
Main VariableSub-VariablesEquation/MethodData Source
(1) AccessibilityCloseness centrality (CC) CCi = j 2 N , J 6 = I 1 d i j JICA Database
Road width (RdW)Extract average road width of the zoneGampaha Municipal council database
(2) Land useMixed use index MUI = ( 1 )   ×   P j   ×   ln ( P j ) l n j JICA Database
Prominent Land use (PLU)Commercial, working, residential, and amenities are land use categories. Highest area covered land use type is the prominent land use in the particular zone. Assign individual rates based on the above land use categories according to the Yu’s [41] methodJICA Database
Canopy vegetation cover % (CVC) CVC = Canopy   Vegetation   area Zone   area × 100Developed by the author
Ground vegetation cover % (GVC) GVC = Ground   Vegetation   area Zone   area × 100Developed by the author
(3) DensityGround space index (GSI) GSI = j   = 1   Bi A JICA Database
Floor space index (FSI) GSI = j   = 1   Bi   ×   fi A JICA Database
Building height (BH)Extract average building height of the zoneDeveloped by the author
Open space (OS) OS = Open   space   area Zone   area × 100JICA Database
(4) Surface runoffImperviousness (Imp) Imp = Builtup   Cover Zone   area × 100JICA Database
Slope (SLP)Developed by utilizing Arc GIS slope toolSurvey department, SL
Soil type (ST)Extract soil types from survey department soil mapSurvey department, SL
Table 2. Basic details of the study area.
Urban FormSettlement HierarchyPopulation DensityBuilding Density Index
Monocentric2nd order171 (p/Ha)0.71
Table 3. Model accuracy of the decision tree analysis.
ParametersAccuracy
Correctly classified instances80.2%
Incorrectly Classified Instances19.7%
Kappa statistic0.679
Mean absolute error0.2156
Relative absolute error32.82%
Table 4. SEM model fit.
Model Fit TypeRequired AccuracyRecorded Accuracy
Chi Square>0.01 (<76)99.869
R Square<0.70.802
RMSEA<0.080.096
GFI>0.90.876
AGFI<0.80.799
CFI<0.80.940
NFI<0.80.892
TLI<0.80.917
Table 5. Individual influence from main variables.
Estimate
Surface_Runoff ← Accessibility0.76
Surface_Runoff ← Density0.88
Surface_Runoff ← Land_Use0.65
Surface_Runoff ← Vegetation−0.37
Table 6. Influence of the sub-variables on surface runoff.
Estimate
Surface_Runoff ← CC0.75
Surface_Runoff ← RdW0.14
Surface_Runoff ← MUI0.42
Surface_Runoff ← PLU0.37
Surface_Runoff ← FSI0.63
Surface_Runoff ← GSI0.73
Surface_Runoff ← BH0.12
Surface_Runoff ← OS0.32
Surface_Runoff ← CCA−0.23
Surface_Runoff ← GVA−0.22
Surface_Runoff ← Imp0.91
Surface_Runoff ← SLP0.51
Surface_Runoff ← ST0.44
Table 7. Influence of the sub-variables on respective main variables.
Estimate
Accessibility ← CC0.93
Accessibility ← RdW0.78
Land_Use ← MUI0.97
Land_Use ← PLU0.95
Density ← FSI0.81
Density ← GSI0.92
Density ← BH0.72
Density ← OS0.73
Surface_Runoff ← CCA0.45
Surface_Runoff ← GVA0.80
Surface_Runoff ← Imp0.91
Surface_Runoff ← SLP0.51
Surface_Runoff ← ST0.44
Publisher’s Note: MDPI stays neutral with regard to jurisdictional claims in published maps and institutional affiliations.

