
Pedestrian-Level Wind Environment Assessment of Shenyang’s Residential Areas through Numerical Simulations

Abstract
:1. Introduction
2. Literature Review
2.1. Effects of the Architectural Geometric Factors
2.2. Effect of Architectural Spatial Morphology
2.3. Wind Environment Studies in China
2.4. Codes and Standards in China
- (1)
- Due to the restrictions of economic factors, more and more high-rise residential areas have been built in China. At present, there is a lack of simulations and comparisons concerning the wind environment in the planning modes of high-rise residential areas, especially in the severe cold regions in China.
- (2)
- Some of the current wind environment research works are mainly at a macroscopic scale and do not adhere to government standards and codes.
3. Materials and Methods
3.1. Study Area
3.2. Methods
3.2.1. Computational Domain and Grids
3.2.2. Building Arrangements for Simulation
3.2.3. Evaluation Standard of the Wind Velocity Ratio
4. Results
4.1. Arrangement of the Slab Buildings
4.2. Arrangement of the Point Buildings
4.3. Arrangement of the Slab-Point Combination Buildings
5. Discussion
5.1. Comparative Analysis of Three Kinds of Building Arrangement
5.2. Implications of Designing Wind Environments for the Buildings of Shenyang
5.3. Limitations
6. Conclusions
Author Contributions
Funding
Institutional Review Board Statement
Data Availability Statement
Acknowledgments
Conflicts of Interest
References
- Ma, T.; Chen, T. Classification and pedestrian-level wind environment assessment among Tianjin’s residential area based on numerical simulation—ScienceDirect. Urban Clim. 2020, 34, 100702. [Google Scholar] [CrossRef]
- Moonen, P.; Defraeye, T.; Dorer, V.; Bloken, B.; Carmeliet, J. Urban Physics: Effect of the micro-climate on comfort, health and energy demand. Front. Archit. Res. 2012, 1, 197–228. [Google Scholar] [CrossRef] [Green Version]
- Niu, J.; Liu, J.; Lee, T.C.; Lin, Z.J.; Mak, C.; Tse, K.T.; Tang, B.S.; Kwok, K. A new method to assess spatial variations of outdoor thermal comfort: Onsite monitoring results and implications for precinct planning. Build. Environ. 2015, 91, 263–270. [Google Scholar] [CrossRef] [Green Version]
- Stathopoulos, T. Pedestrian level winds and outdoor human comfort. J. Wind Eng. Ind. Aerodyn. 2006, 94, 769–780. [Google Scholar] [CrossRef]
- Blocken, B.; Stathopoulos, T.; Beeck, J. Pedestrian-level wind conditions around buildings: Review of wind-tunnel and CFD techniques and their accuracy for wind comfort assessment. Build. Energy Effic. 2016, 100, 50–81. [Google Scholar] [CrossRef]
- Iqbal, Q.; Chan, A.L.S. Pedestrian level wind environment assessment around group of high-rise cross-shaped buildings: Effect of building shape, separation and orientation. Build. Environ. 2016, 101, 45–63. [Google Scholar] [CrossRef]
- Lawson, T.V.; de Penwar, N.A.D. The effects of wind on people in the vicinity of buildings. In Proceedings of the 4th International Conference on Wind Effects on Buildings and Structures; Cambridge University Press: Cambridge, UK, 1975; pp. 605–622. [Google Scholar]
- Ai, Z.T.; Mak, C.M. CFD simulation of flow in a long street canyon under a perpendicular wind direction: Evaluation of three computational settings. Build. Environ. 2017, 114, 293–306. [Google Scholar] [CrossRef]
- Yang, J.; Yang, Y.; Sun, D.; Jin, C.; Xiao, X. Influence of urban morphological characteristics on thermal environment. Sustain. Cities Soc. 2021, 72, 103045. [Google Scholar] [CrossRef]
- Luo, X.; Yang, J.; Sun, W.; He, B. Suitability of human settlements in mountainous areas from the perspective of ventilation: A case study of the main urban area of Chongqing. J. Clean. Prod. 2021, 310, 127467. [Google Scholar] [CrossRef]
- Yang, J.; Wang, Y.; Xiu, C.; Xiao, X.; Jin, C. Optimizing local climate zones to mitigate urban heat island effect in human settlements. J. Clean. Prod. 2020, 275, 123767. [Google Scholar] [CrossRef]
- Wu, Y.; Niu, J. Numerical study of inter-building dispersion in residential environments: Prediction methods evaluation and infectious risk assessment. Build. Environ. 2017, 115, 199–214. [Google Scholar] [CrossRef]
- Yang, X.; Zhao, L.; Bruse, M.; Meng, Q. Application of urban microclimate simulation data in assessing building energy consumption. Acta Energ. Sol. Sin. 2015, 36, 1344–1351. [Google Scholar]
- Hong, B.; Lin, B.; Lin, J. Quantification of residential design parameters’ effects on the outdoor wind environment using orthogonal experimental design (OED) and numerical simulation. Procedia Eng. 2017, 205, 137–144. [Google Scholar] [CrossRef]
- Zhang, X.; Tse, K.T.; Weerasuriya, A.U.; Li, S.W.; Kwok, K.; Mak, C.M.; Niu, J.; Lin, Z. Evaluation of pedestrian wind comfort near ‘lift-up’ buildings with different aspect ratios and central core modifications. Build. Environ. 2017, 124, 245–257. [Google Scholar] [CrossRef]
- Wu, H.; Kriksic, F. Designing for pedestrian comfort in response to local climate. J. Wind Eng. Ind. Aerodyn. 2012, 104–106, 397–407. [Google Scholar] [CrossRef]
- An, K.; Fung, J.; Yim, S. Sensitivity of inflow boundary conditions on downstream wind and turbulence profiles through building obstacles using a CFD approach. J. Wind Eng. Ind. Aerodyn. 2013, 115, 137–149. [Google Scholar] [CrossRef]
- GB 50176-2016; Code for Thermal Design of Civil Building. China Building Industry Press: Beijing, China, 2016.
- Liu, Z.; Zhao, X.; Jin, Y.; Jin, H.; Xu, X. Prediction of Outdoor Human Thermal Sensation at the Pedestrian Level in High-rise Residential Areas in Severe Cold Regions of China. Energy Procedia 2019, 157, 51–58. [Google Scholar] [CrossRef]
- Jin, H.; Liu, S.; Kang, J. The Thermal Comfort of Urban Pedestrian Street in the Severe Cold Area of Northeast China. Energy Procedia 2017, 134, 741–748. [Google Scholar] [CrossRef]
- Yang, J.; Wang, Y.; Xiu, C.; Li, Y.; Xiao, X.; Xia, J.; He, B. Contribution of urban ventilation to the thermal environment and urban energy demand: Different climate background perspectives. Sci. Total Environ. 2021, 795, 148791. [Google Scholar] [CrossRef] [PubMed]
- Shui, T.; Liu, J.; Yuan, Q.; Qu, Y.; Jin, H.; Cao, J.; Liu, L.; Chen, X. Assessment of pedestrian-level wind conditions in severe cold regions of China. Build. Environ. 2018, 135, 53–67. [Google Scholar] [CrossRef]
- Capeluto, I.G.; Yezioro, A.; Shaviv, E. Climatic aspects in urban design—A case study. Build. Environ. 2003, 38, 827–835. [Google Scholar] [CrossRef]
- Allegrini, J.; Carmeliet, J. Coupled CFD and building energy simulations for studying the impacts of building height topology and buoyancy on local urban microclimates. Urban Clim. 2017, 21, 278–305. [Google Scholar] [CrossRef]
- Stathopoulos, T. Wind environmental conditions around tall buildings with chamfered corners. J. Wind Eng. Ind. Aerodyn. 1985, 21, 71–87. [Google Scholar] [CrossRef]
- Ng, E.; Chao, Y.; Liang, C.; Chao, R.; Fung, J. Improving the wind environment in high-density cities by understanding urban morphology and surface roughness: A study in Hong Kong. Landsc. Urban Plan. 2011, 101, 59–74. [Google Scholar] [CrossRef] [PubMed]
- Bo, H.; Lin, B. Numerical studies of the outdoor wind environment and thermal comfort at pedestrian level in housing blocks with different building layout patterns and trees arrangement. Renew. Energy 2015, 73, 18–27. [Google Scholar]
- Emmanuel Rohinton, M. An Urban Approach To Climate Sensitive Design; Spon Press: London, UK, 2005. [Google Scholar]
- Bonan, G.B. The microclimates of a suburban Colorado (USA) landscape and implications for planning and design. Landsc. Urban Plan. 2000, 49, 97–114. [Google Scholar] [CrossRef]
- Kantzioura, A.; Kosmopoulos, P.; Zoras, S. Urban surface temperature and microclimate measurements in Thessaloniki. Energy Build. 2012, 44, 63–72. [Google Scholar] [CrossRef]
- Kubota, T.; Miura, M.; Tominaga, Y.; Mochida, A. Wind tunnel tests on the relationship between building density and pedestrian-level wind velocity: Development of guidelines for realizing acceptable wind environment in residential neighborhoods. Build. Environ. 2008, 43, 1699–1708. [Google Scholar] [CrossRef]
- Taleghani, M.; Kleerekoper, L.; Tenpierik, M.; Dobbelsteen, A. Outdoor thermal comfort within five different urban forms in the Netherlands. Build. Environ. 2015, 83, 65–78. [Google Scholar] [CrossRef]
- Shahrestani, M.; Yao, R.; Luo, Z.; Turkbeyler, E.; Davies, H. A field study of urban microclimates in London. Renew. Energy 2015, 73, 3–9. [Google Scholar] [CrossRef] [Green Version]
- Zhang, A.; Gao, C.; Ling, Z. Numerical simulation of the wind field around different building arrangements. J. Wind Eng. Ind. Aerodyn. 2005, 93, 891–904. [Google Scholar] [CrossRef]
- Li, M.W. The Study on Effect of Architecture Space Form on Wind Environment in Nanjing Residential District. Master’s Thesis, Southeast University, Nanjing, China, 2016. [Google Scholar]
- Xi, R. Study on Residential Area Layout Based on Reasonable Silent Area. Master’s Thesis, Chongqing University, Chongqing, China, 2017. [Google Scholar]
- JGJ 286-2013; Design Standard for Thermal Environment of Urban Residential Areas. China Building Industry Press: Beijing, China, 2013.
- GB/T 50378-2019; Assessment Standard for Green Building. 2019. Available online: https://www.chinesestandard.net/PDF.aspx/GBT50378-2019 (accessed on 20 December 2021).
- JGJ 26-2018; Design Standard for Energy Efficiency of Residential Buildings in Severe Cold and Cold Zones. 2018. Available online: https://www.chinesestandard.net/PDF/English.aspx/JGJ26-2018 (accessed on 20 December 2021).
- GB50352-2019; Uniform Standard for Design of Civil Buildings. 2019. Available online: https://www.chinesestandard.net/PDF.aspx/GB50352-2019 (accessed on 20 December 2021).
- GB50016-2014; Code for Fire Protection Design of Buildings. 2014. Available online: https://www.chinesestandard.net/PDF.aspx/GB50016-2014 (accessed on 20 December 2021).
- Chen, H. Numerical Simulation Analysis of Outdoor Wind Environment of Two Kinds of Buildings. Refrigeration 2020, 39, 30–33. [Google Scholar]
- Chen, D.; Cai, J. Architectural Design Data Set of China; China Building Industry Press: Beijing, China, 2017. [Google Scholar]
- Franke, J.; Hellsten, A.; Schlünzen, H.; Carissimo, B. The COST 732 Best Practice Guideline for CFD simulation of flows in the urban environment: A summary. Int. J. Environ. Pollut. 2011, 44, 419–427. [Google Scholar] [CrossRef]
- Tominaga, Y.; Mochida, A.; Yoshie, R.; Kataoka, H.; Nozu, T.; Yoshikawa, M.; Shirasawa, T. AIJ guidelines for practical applications of CFD to pedestrian wind environment around buildings. J. Wind Eng. Ind. Aerod. 2008, 96, 1749–1761. [Google Scholar] [CrossRef]
- Sagaut, P. Large Eddy Simulation for Incompressible Flows, 2nd ed.; Springer: Berlin/Heidelberg, Germany, 2001. [Google Scholar]
- DB11/938-2012; Standard for Green Building Design (Beijing). China Building Industry Press: Beijing, China, 2012.


| Type | Slab Buildings | Point Buildings | Slab-Point Combination Buildings |
|---|---|---|---|
| A |  |  |  |
| B |  |  |  |
| C |  |  |  |
| D |  |  | |
| E |  | ||
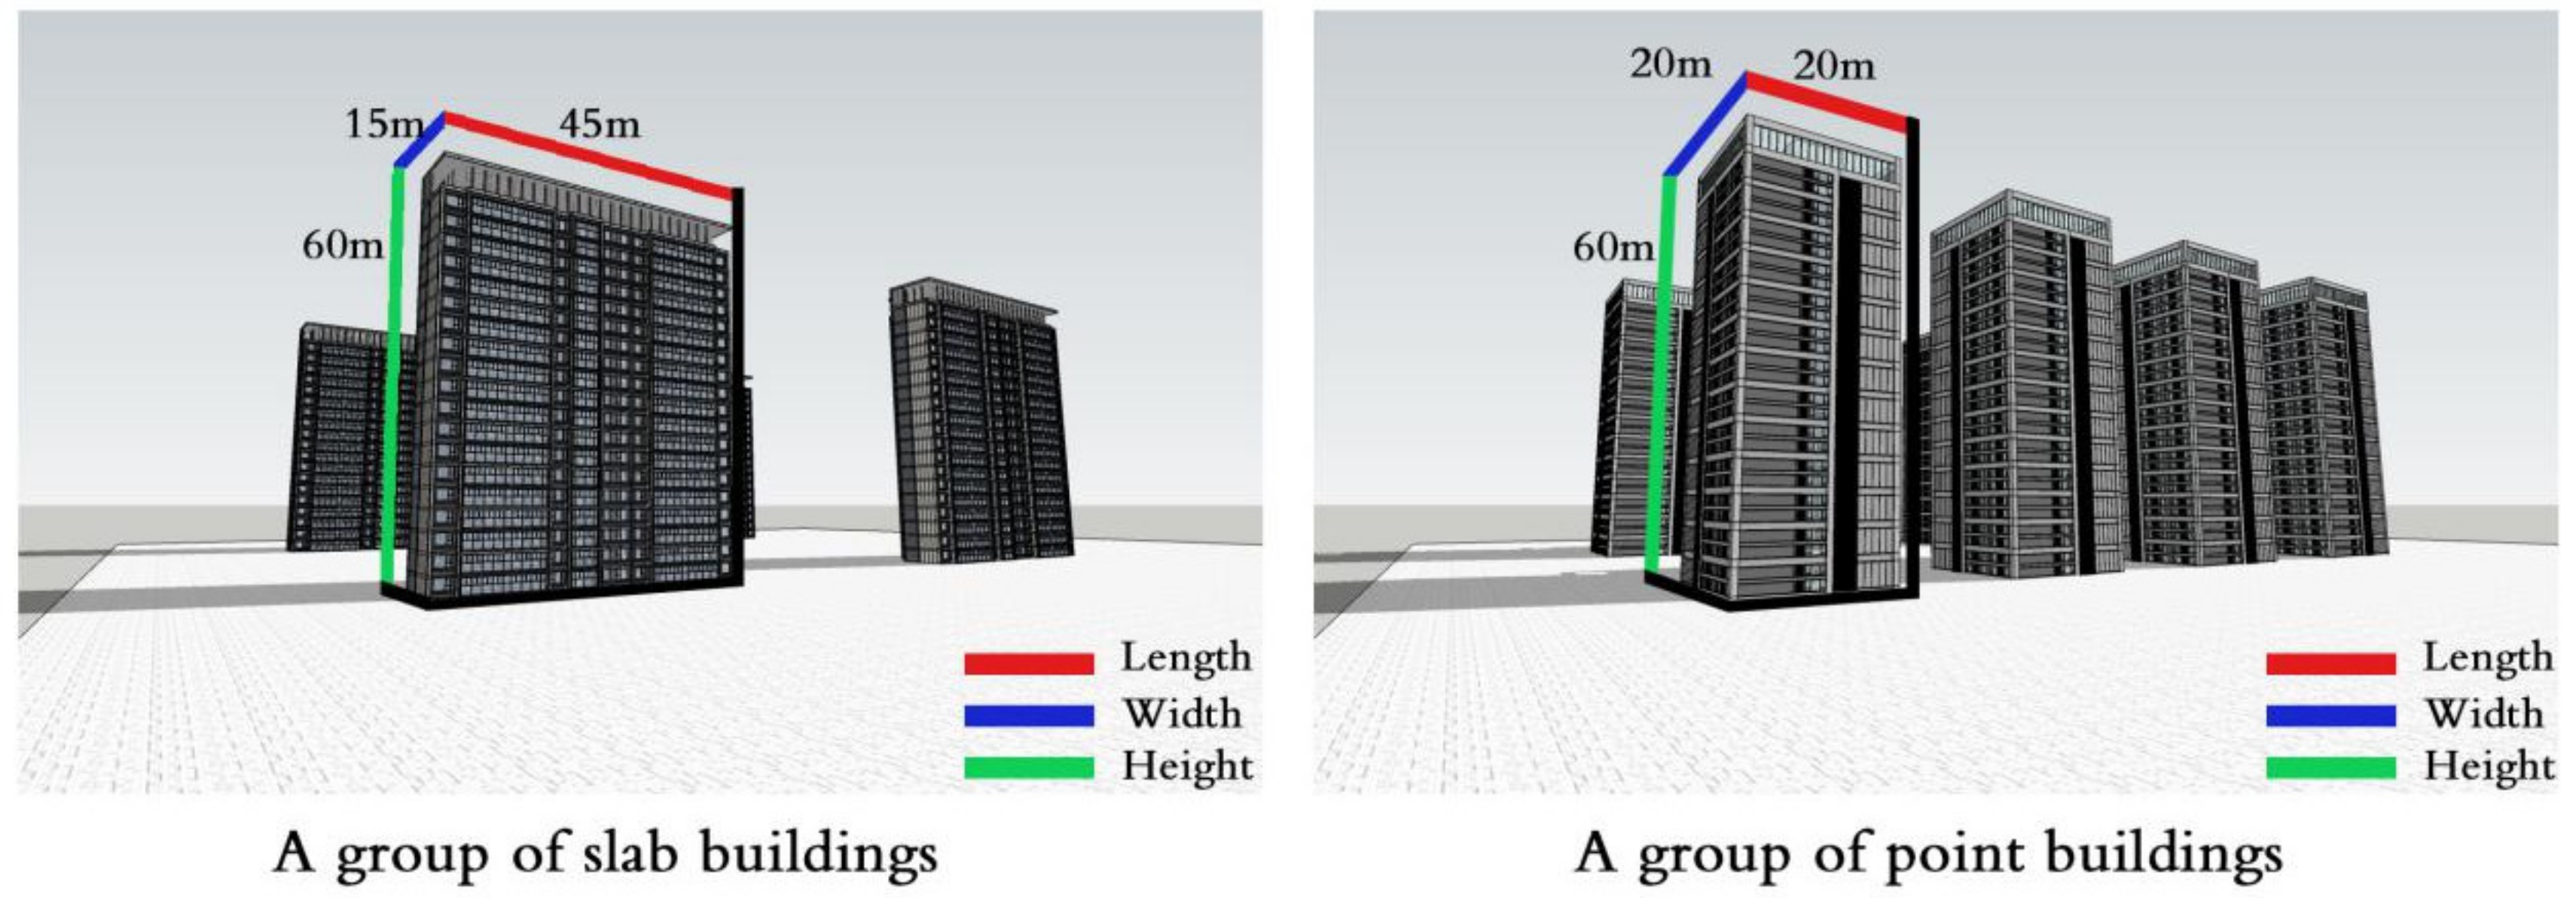
| SIZE (Length × Width × Height) | 45 m × 15 m × 60 m | 20 m × 20 m × 60 m | 45 m × 15 m × 60 m 20 m × 20 m × 60 m |
| Slab Buildings | Wind Vector | Wind Pressure |
|---|---|---|
| SB (A) |  | 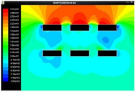 |
| SB (B) | 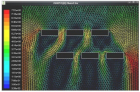 | 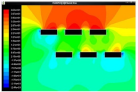 |
| SB (C) | 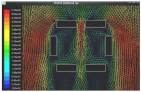 |  |
| Point Buildings | Wind Vector | Wind Pressure |
|---|---|---|
| PB (A) | 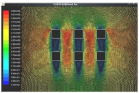 | 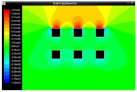 |
| PB (B) | 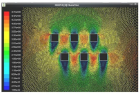 |  |
| PB (C) |  | 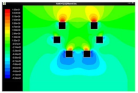 |
| PB (D) |  | 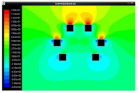 |
| PB (E) | 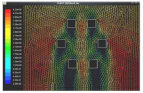 | 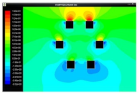 |
| Slab-Point Combination Buildings | Wind Vector | Wind Pressure |
|---|---|---|
| CB (A) | 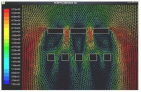 | 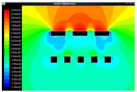 |
| CB (B) |  | 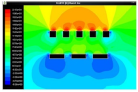 |
| CB (C) | 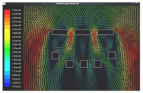 | 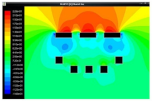 |
| CB (D) |  |  |
| Arrangements | Results | Arrangements | Results | Arrangements | Results |
|---|---|---|---|---|---|
SB (A)  | ○ | PB (A)  | ○ | CB (A)  | √ |
SB (B)  | √ | PB (B)  | ○ | CB (B)  | ○ |
SB (C)  | ○ | PB (C)  | ○ | CB (C)  | √ |
PB (D)  | √ | CB (D)  | ○ | ||
PB (E)  | ○ |
Publisher’s Note: MDPI stays neutral with regard to jurisdictional claims in published maps and institutional affiliations. |
© 2021 by the authors. Licensee MDPI, Basel, Switzerland. This article is an open access article distributed under the terms and conditions of the Creative Commons Attribution (CC BY) license (https://creativecommons.org/licenses/by/4.0/).
Share and Cite
Zhang, J.; Zhang, X. Pedestrian-Level Wind Environment Assessment of Shenyang’s Residential Areas through Numerical Simulations. Sustainability 2022, 14, 380. https://doi.org/10.3390/su14010380
Zhang J, Zhang X. Pedestrian-Level Wind Environment Assessment of Shenyang’s Residential Areas through Numerical Simulations. Sustainability. 2022; 14(1):380. https://doi.org/10.3390/su14010380
Chicago/Turabian StyleZhang, Jiuhong, and Xiaoqian Zhang. 2022. "Pedestrian-Level Wind Environment Assessment of Shenyang’s Residential Areas through Numerical Simulations" Sustainability 14, no. 1: 380. https://doi.org/10.3390/su14010380
APA StyleZhang, J., & Zhang, X. (2022). Pedestrian-Level Wind Environment Assessment of Shenyang’s Residential Areas through Numerical Simulations. Sustainability, 14(1), 380. https://doi.org/10.3390/su14010380