
Investigating the Relationship between Human Activity and the Urban Heat Island Effect in Melbourne and Four Other International Cities Impacted by COVID-19

 ,
,  ,
,  ,
, 
 and
and 
Abstract
:1. Introduction
2. The Urban Heat Island (UHI) Effect
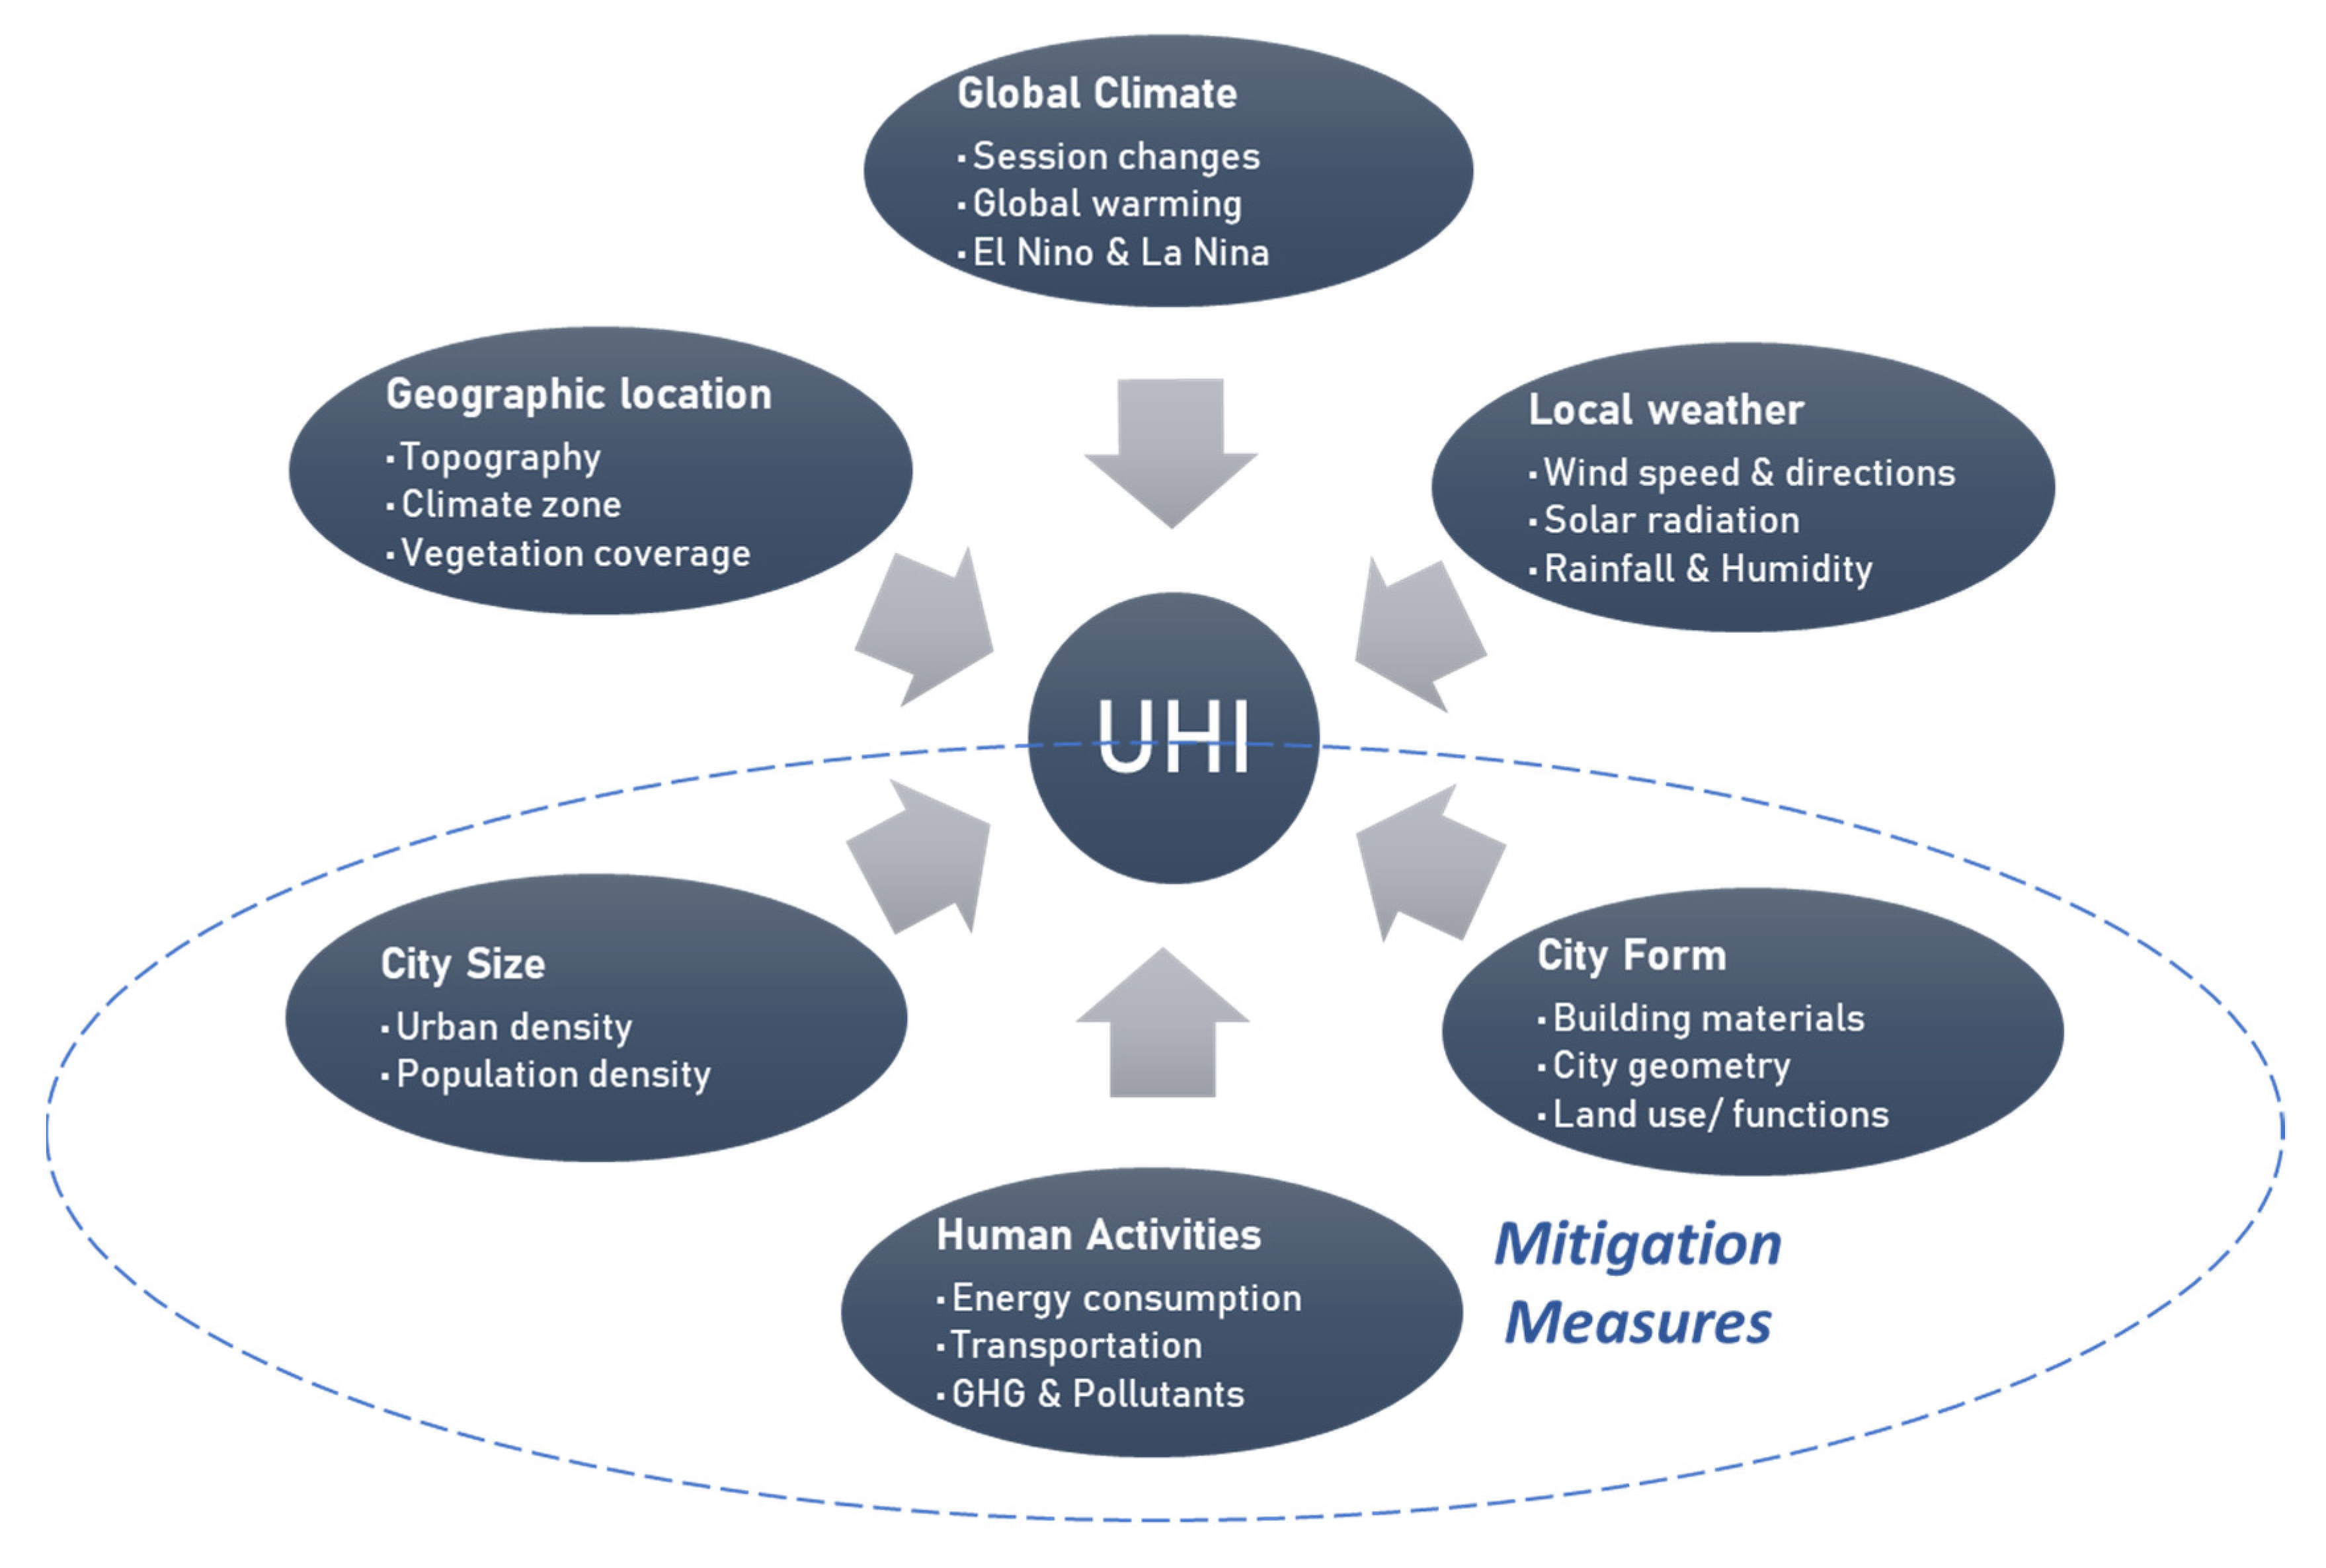
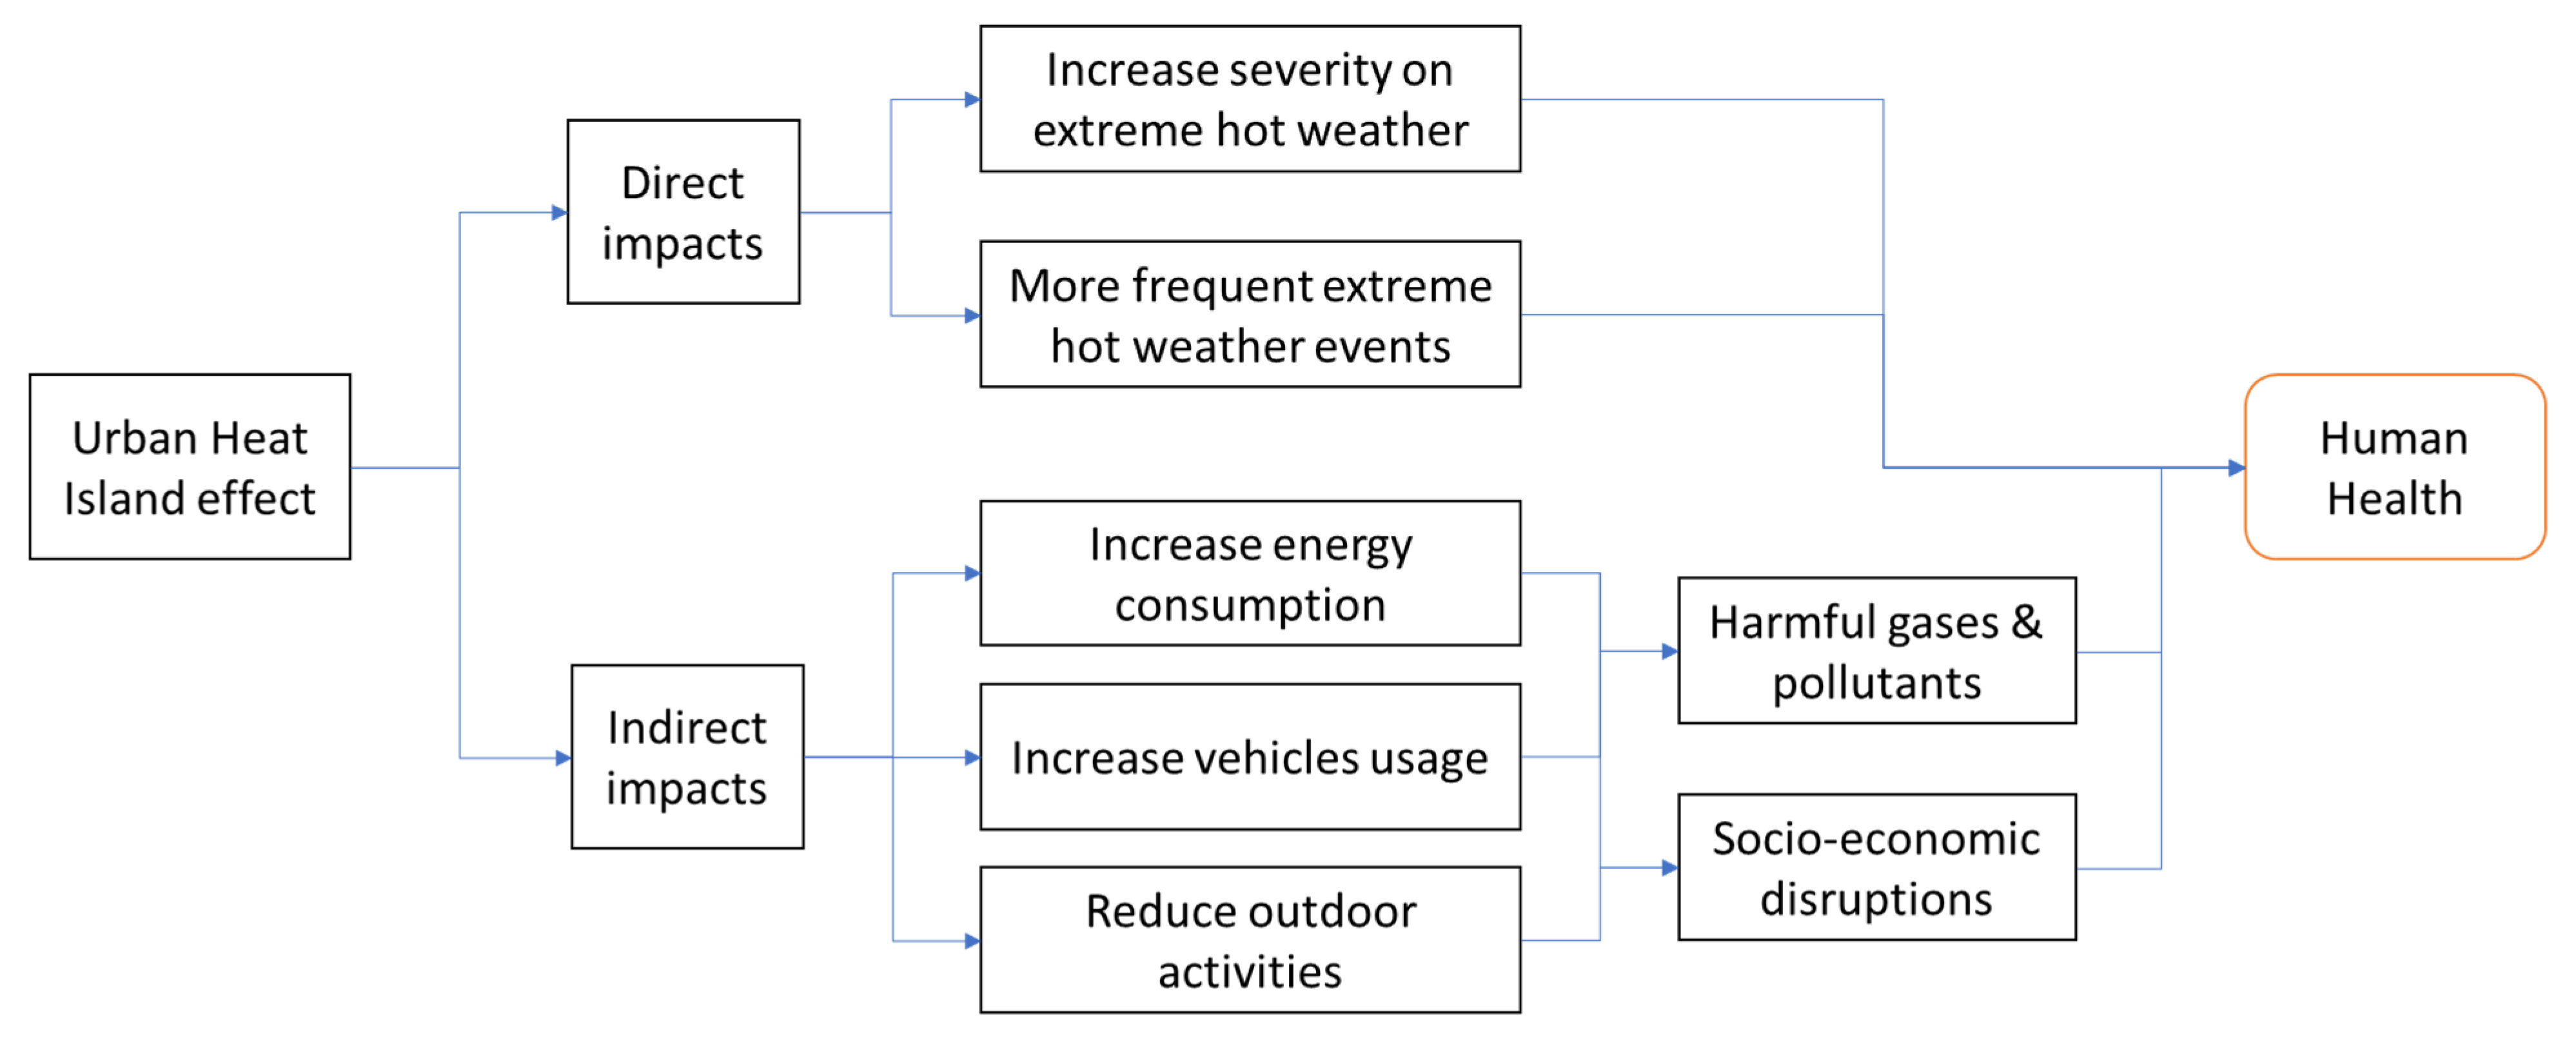
2.1. Causes of Urban Heat Island Effect
2.2. The Importance of Evaluating the Urban Heat Island Effect
3. Materials and Methodology
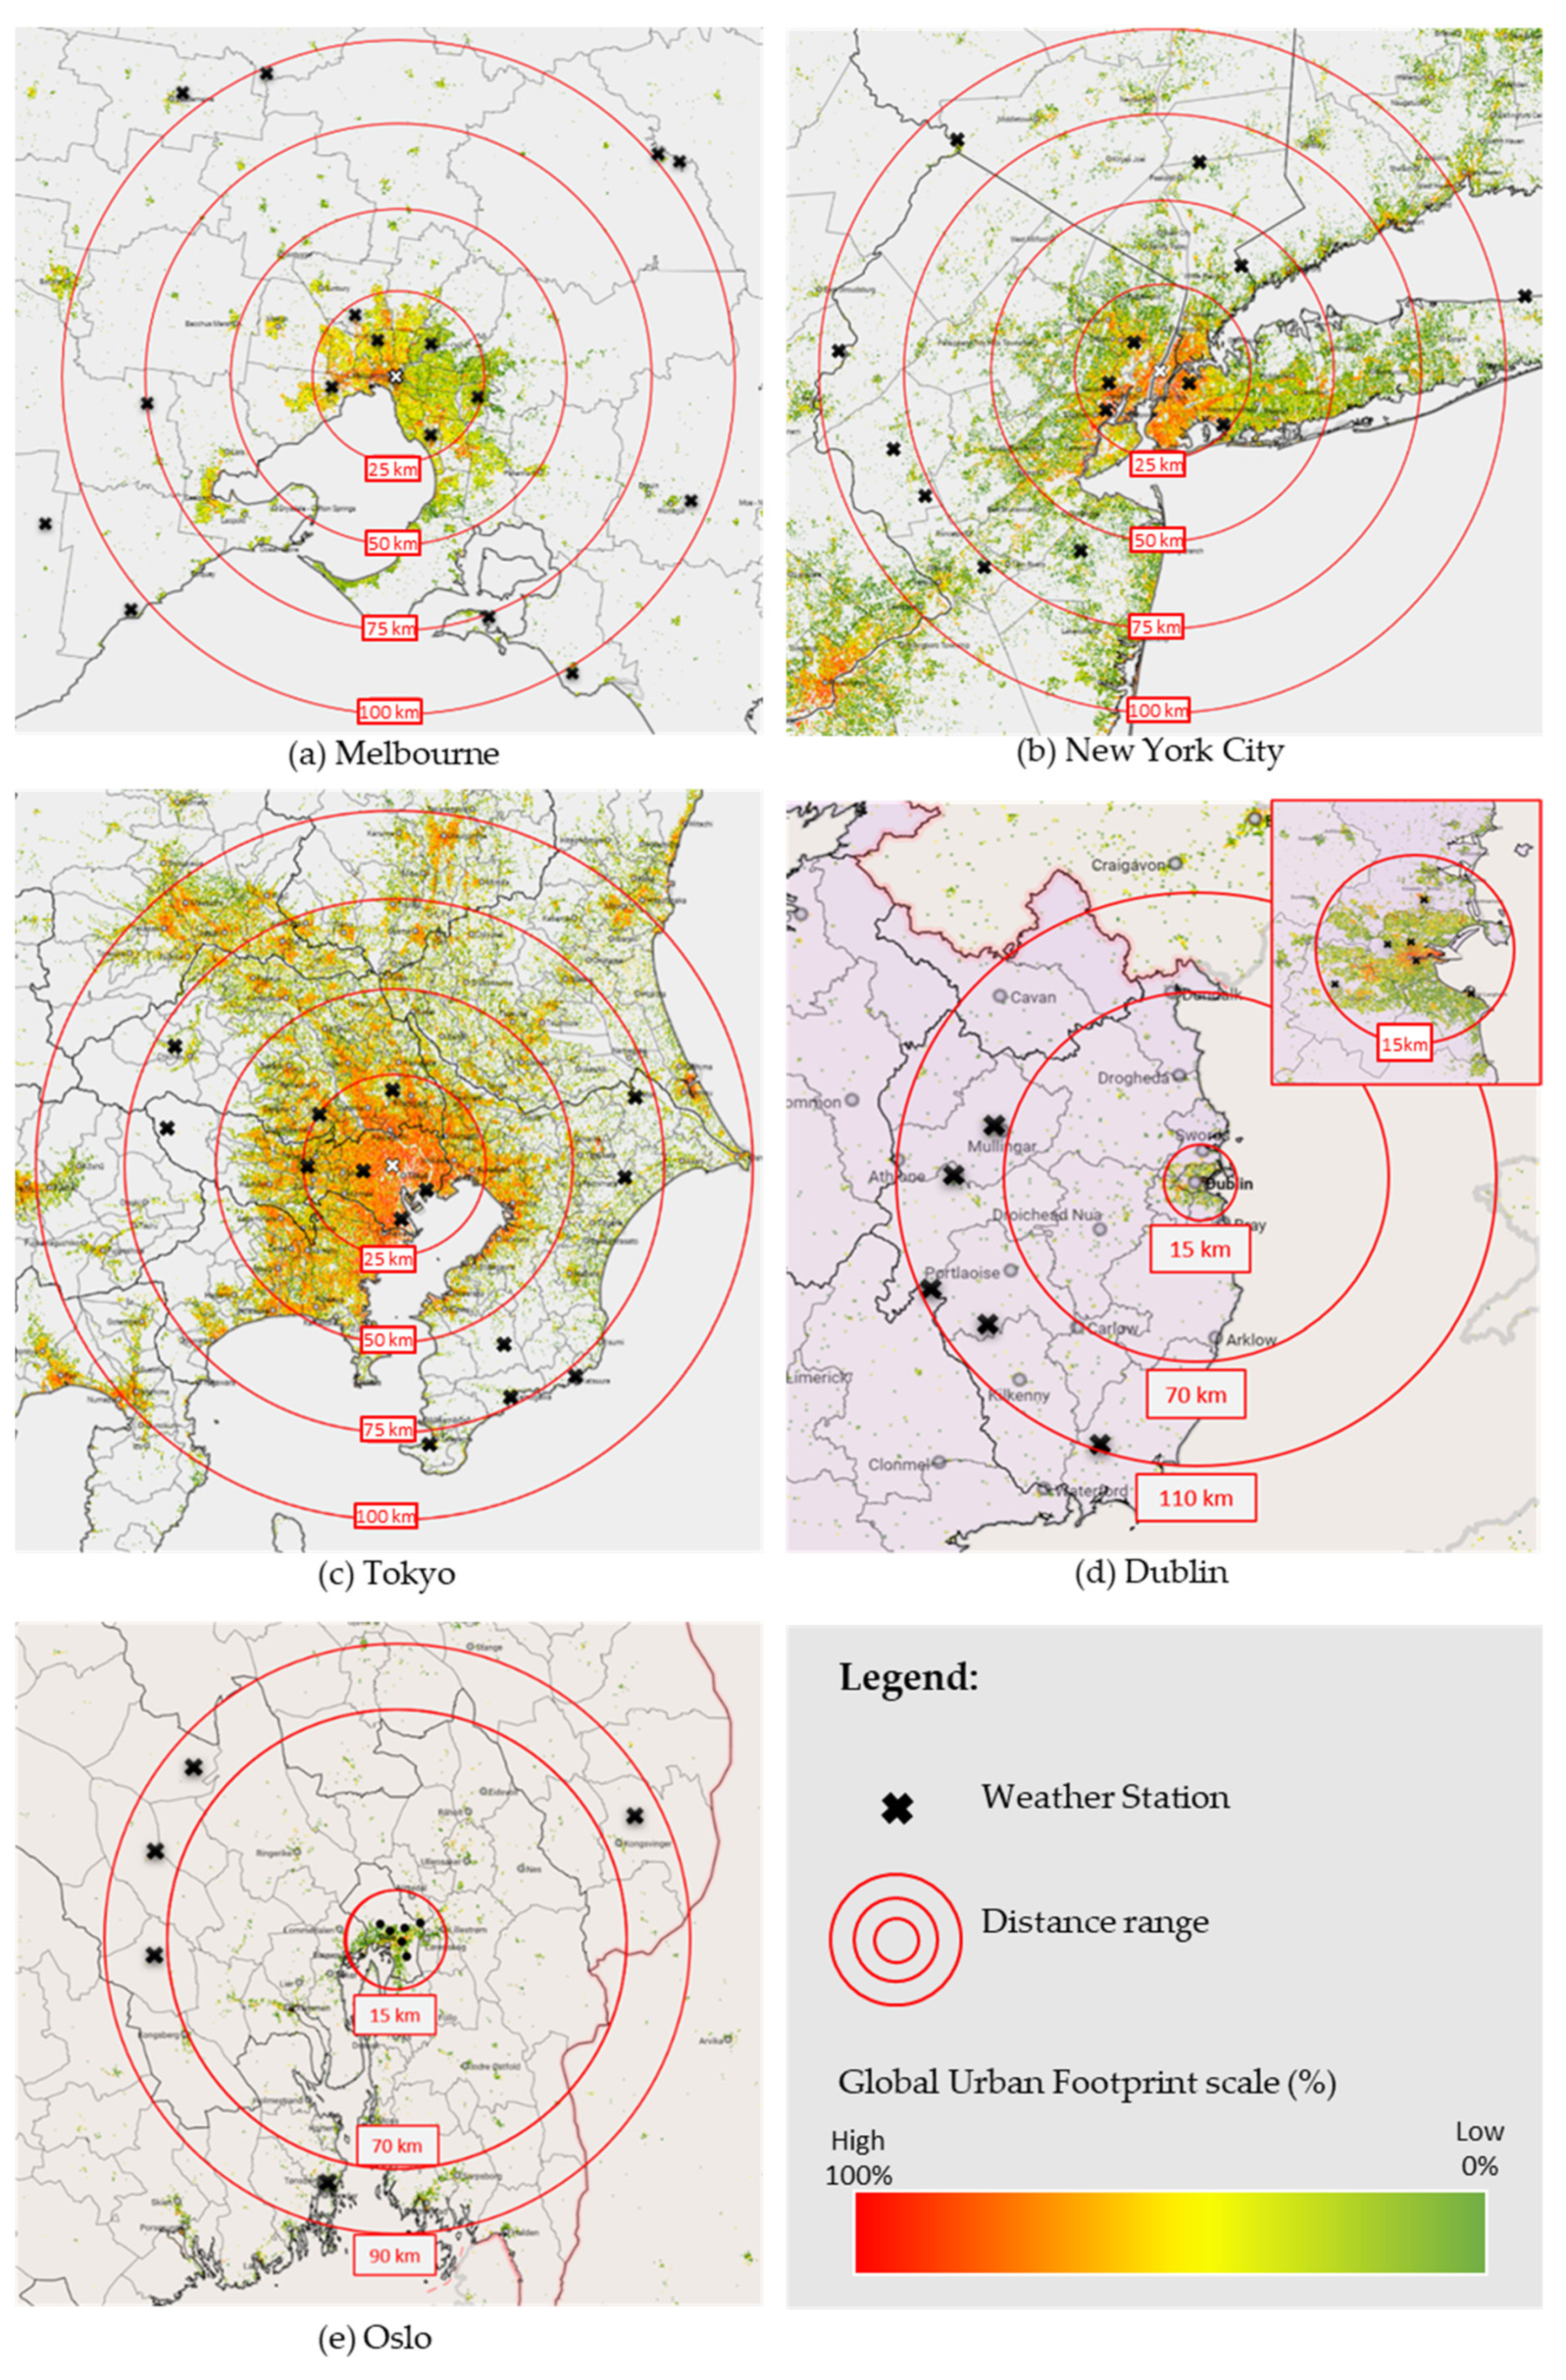
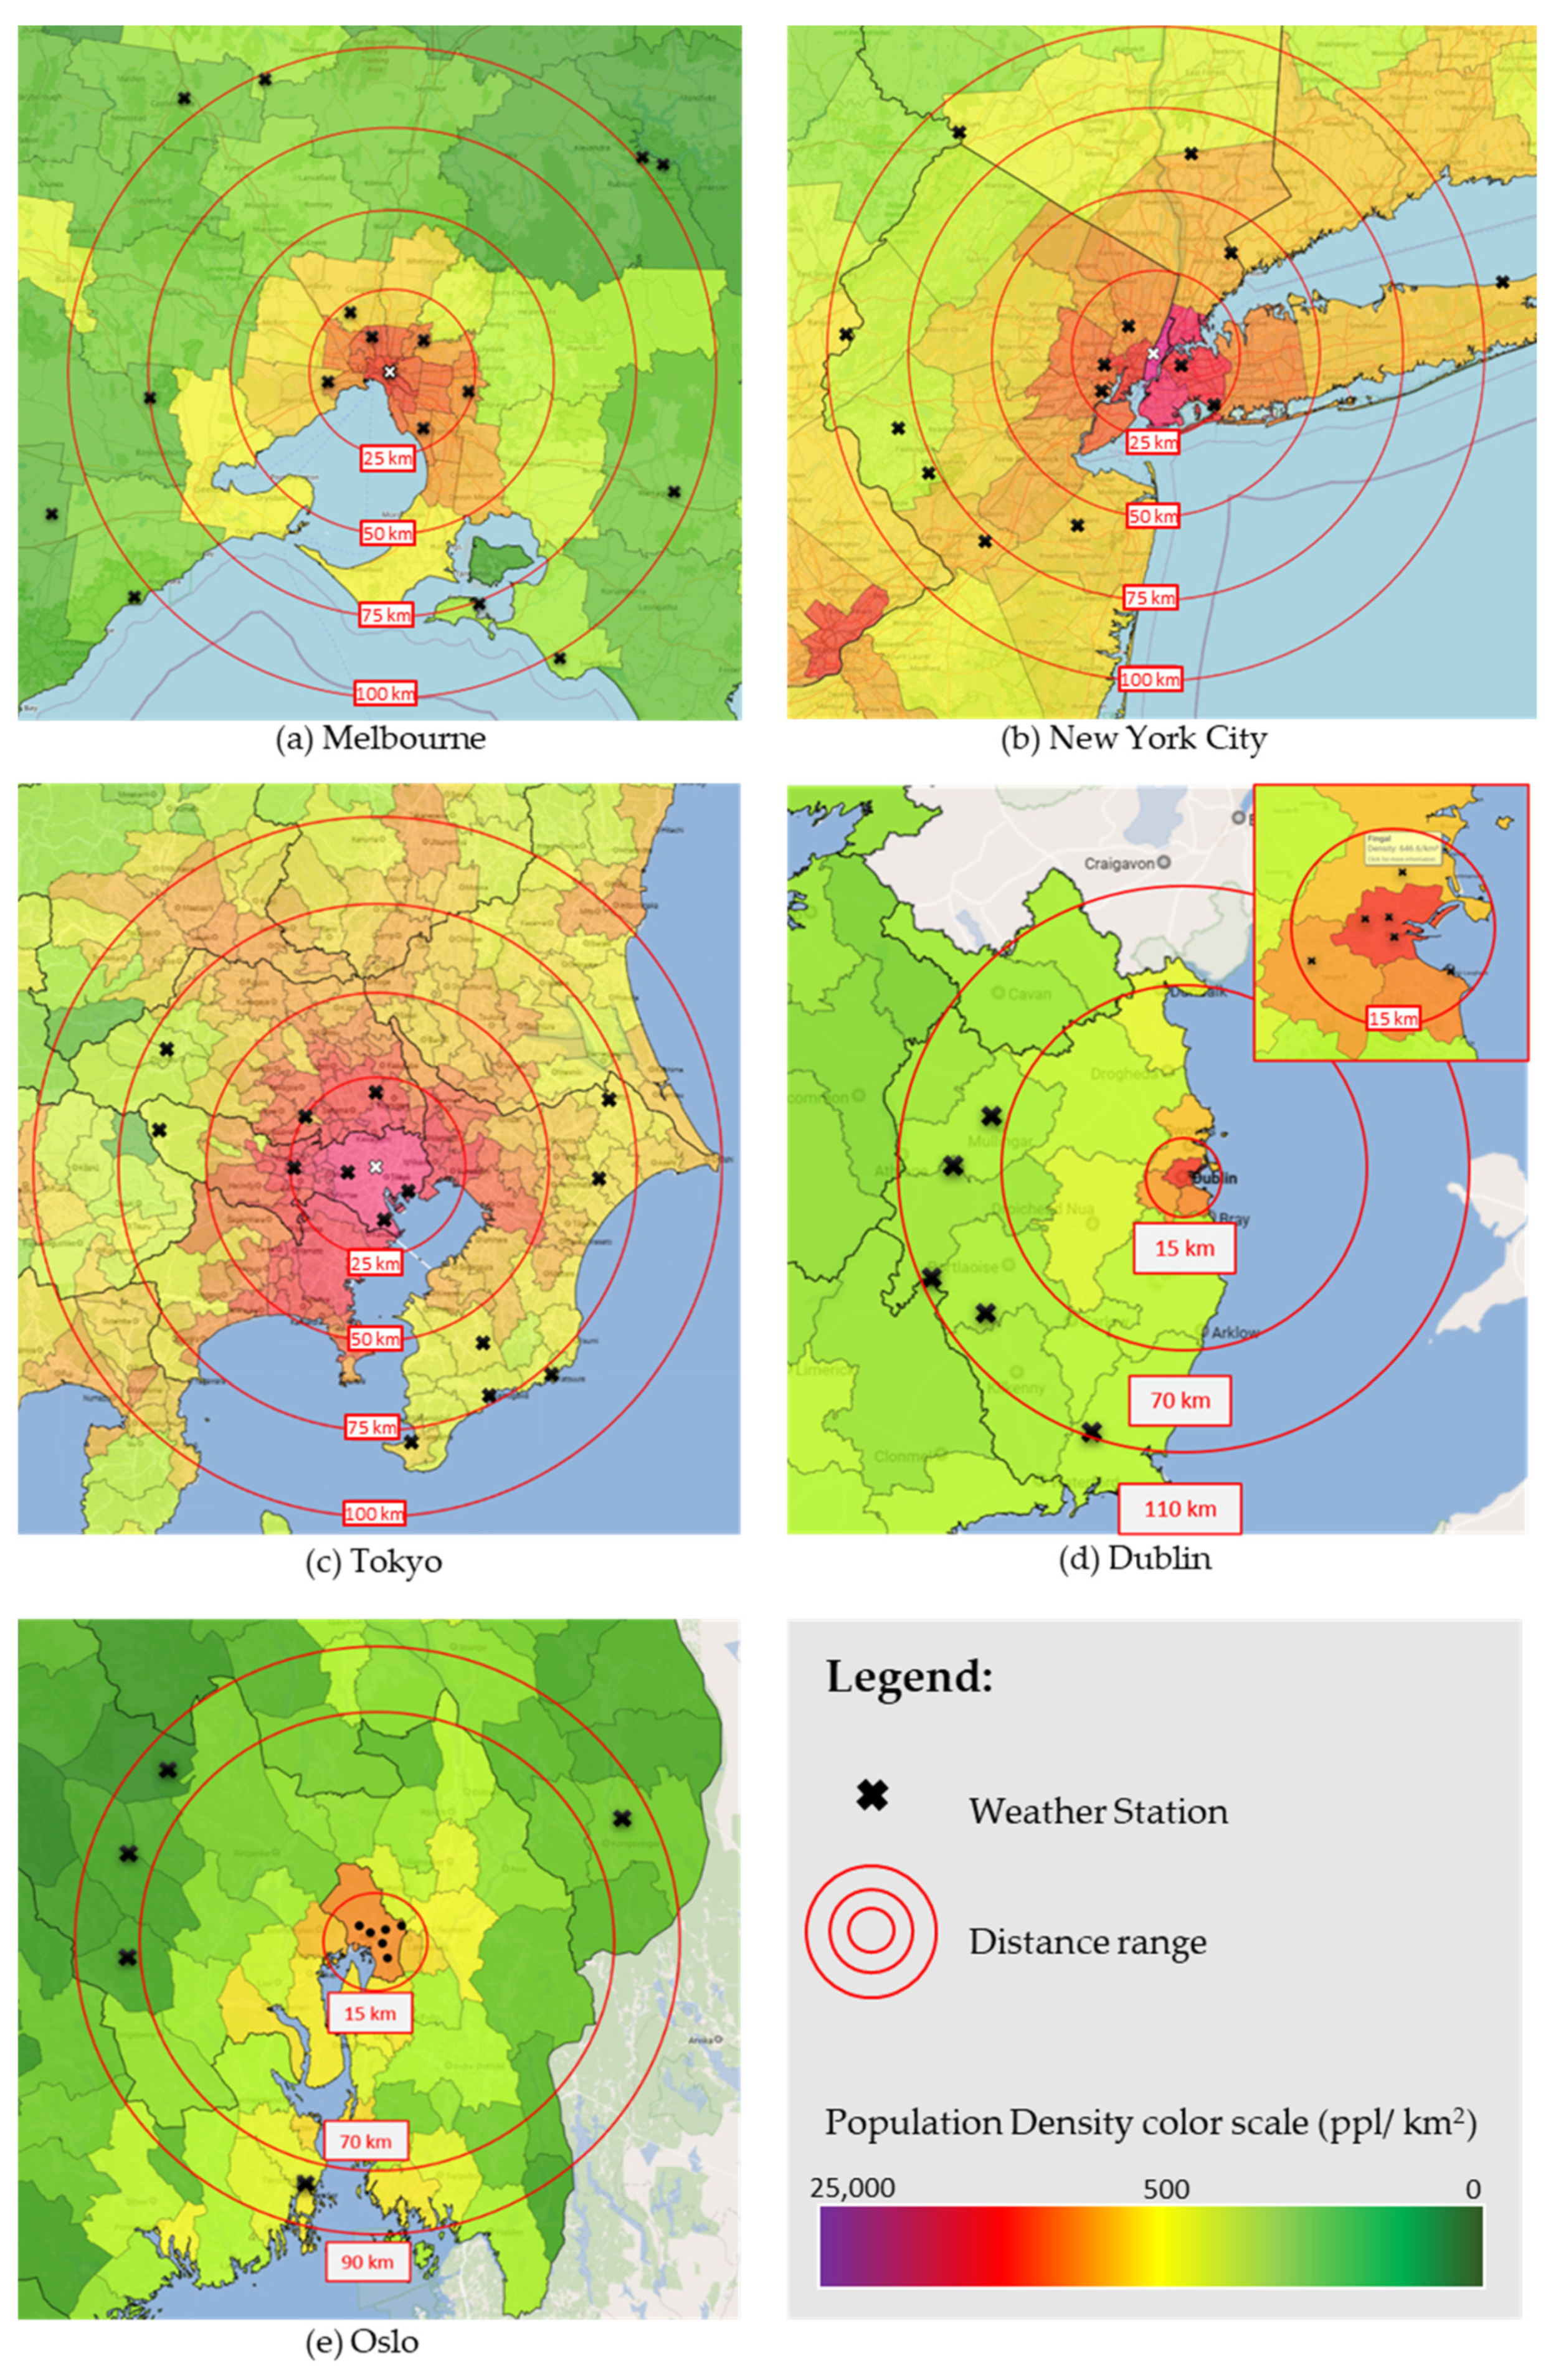
3.1. Study Area
- Availability of sufficient historical data for estimating the UHI effect;
- Large population size and urban area to observe a significant change in human activities;
- The level of restriction on human activities due to COVID-19;
- The duration of lockdown that the city has experienced;
- Location in a coast area;
- Köppen climate classification of group C and D without dry season (letter code f).
3.2. Estimate the UHI Intensity
3.3. Data Collection
4. Analysis of Results
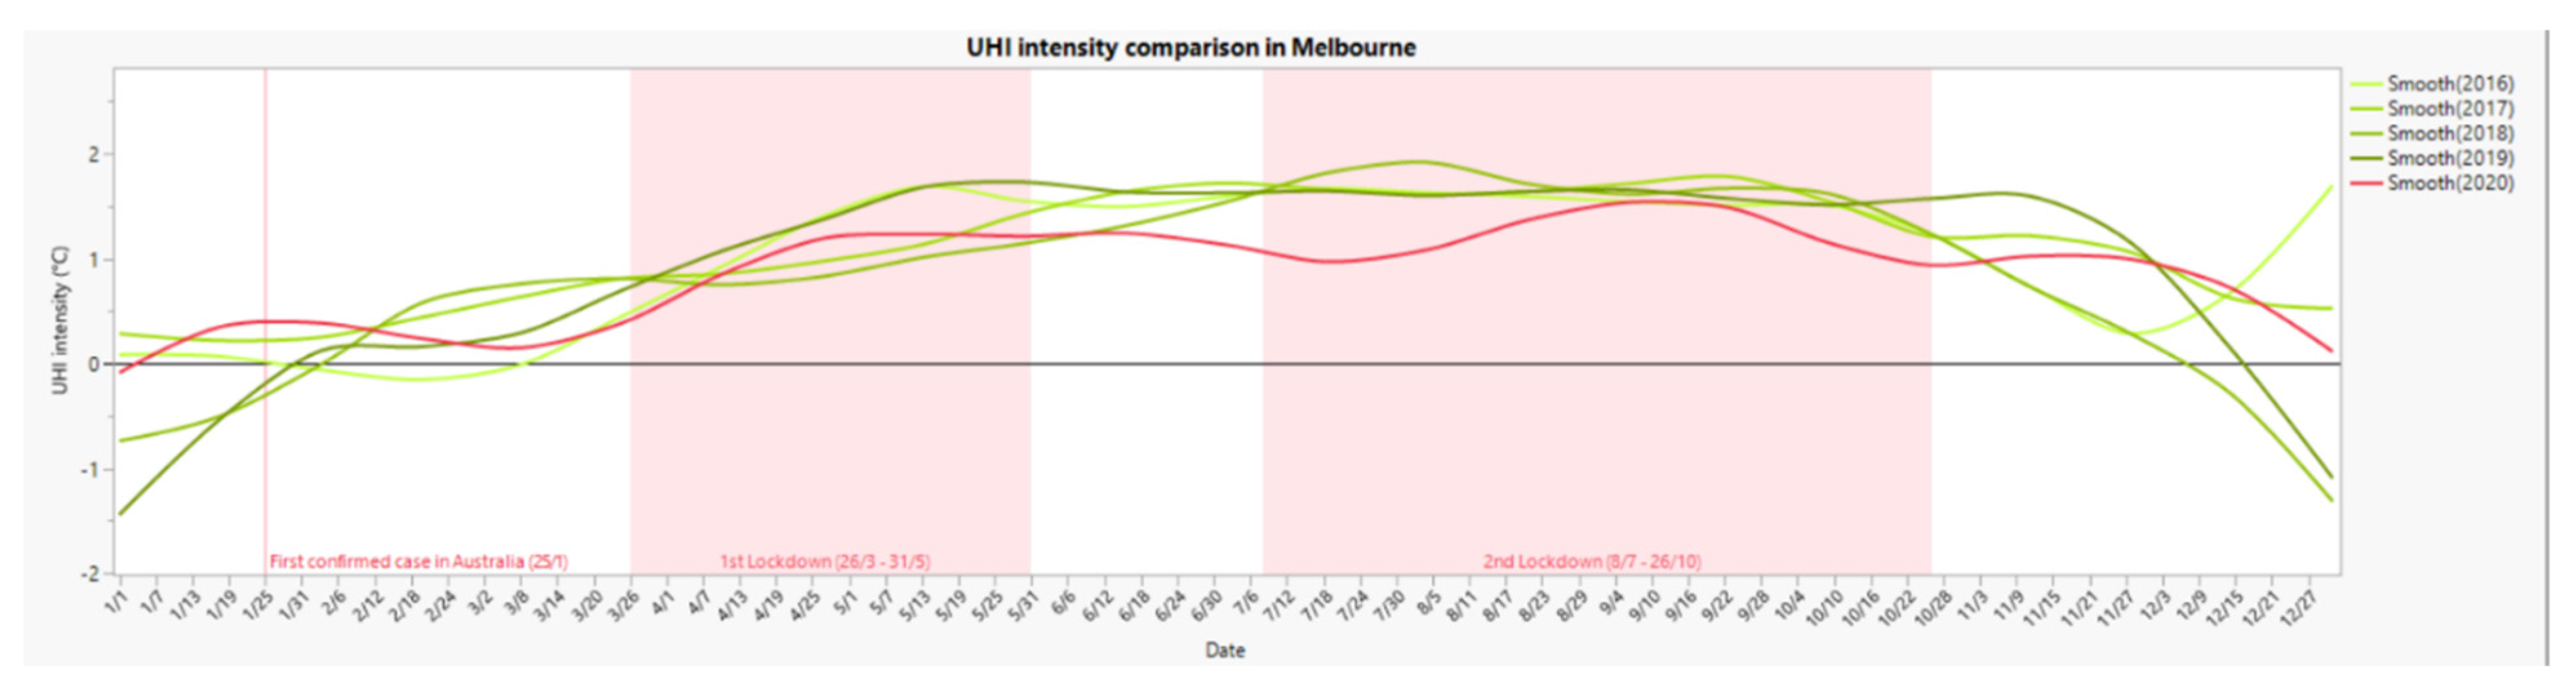
4.1. Melbourne
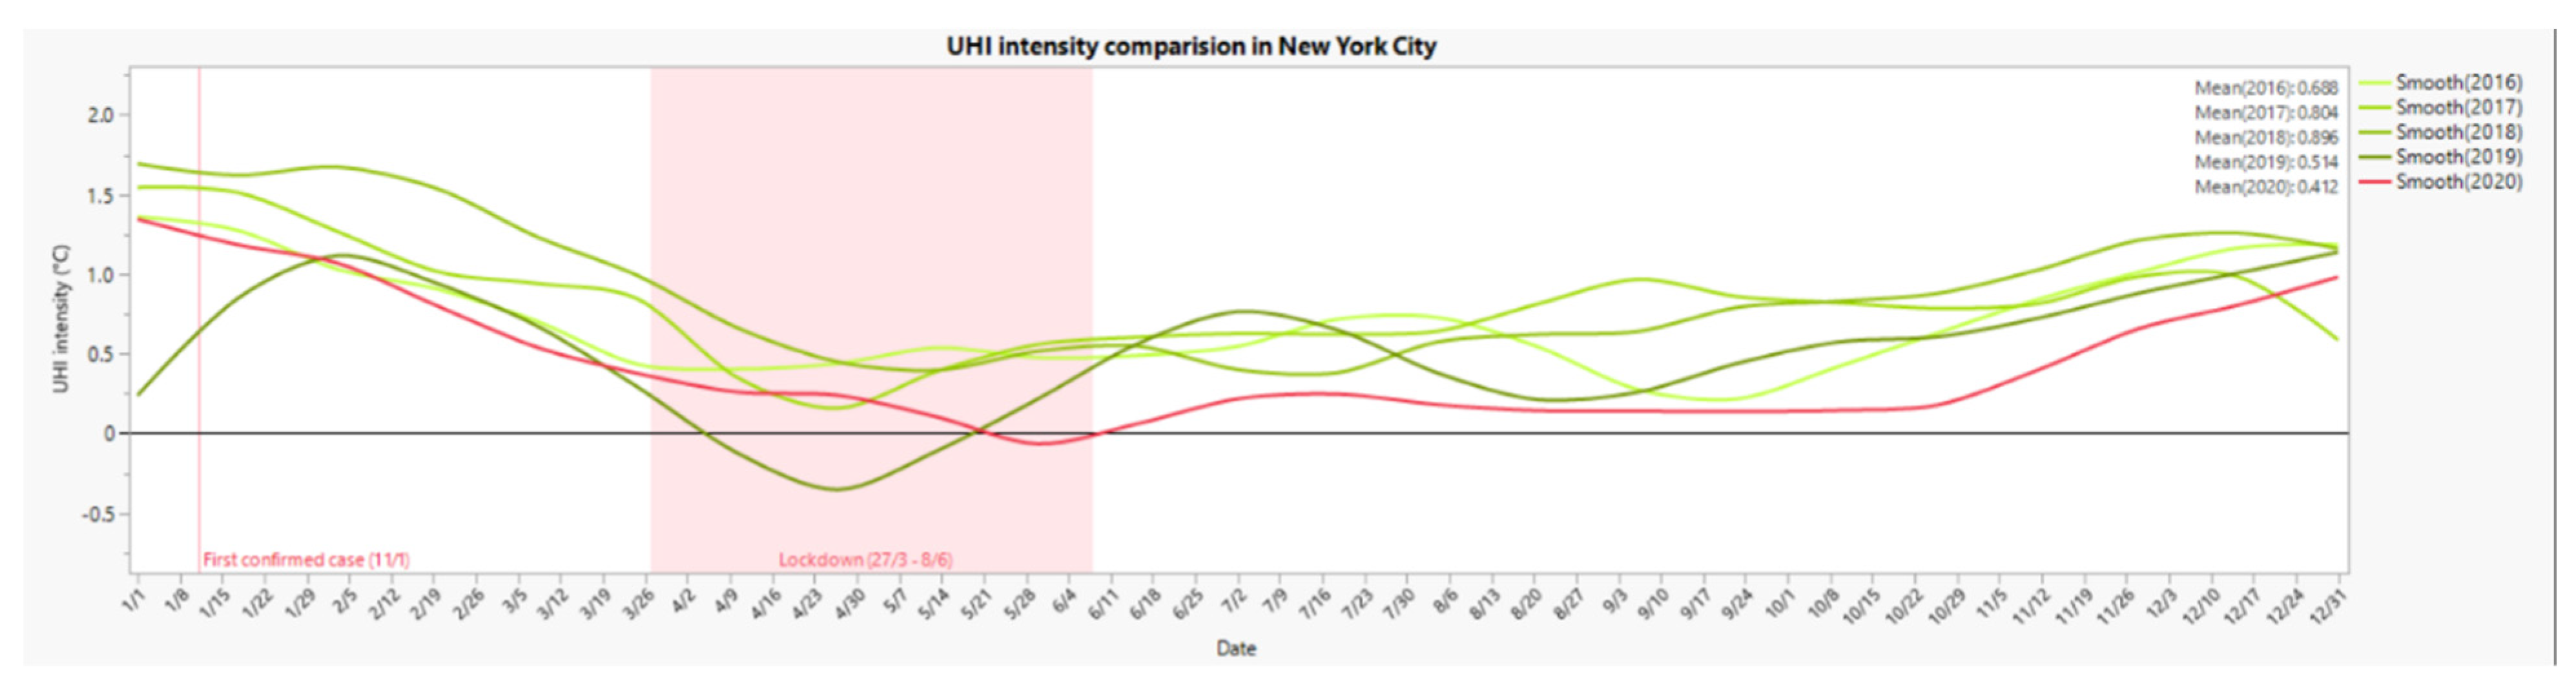
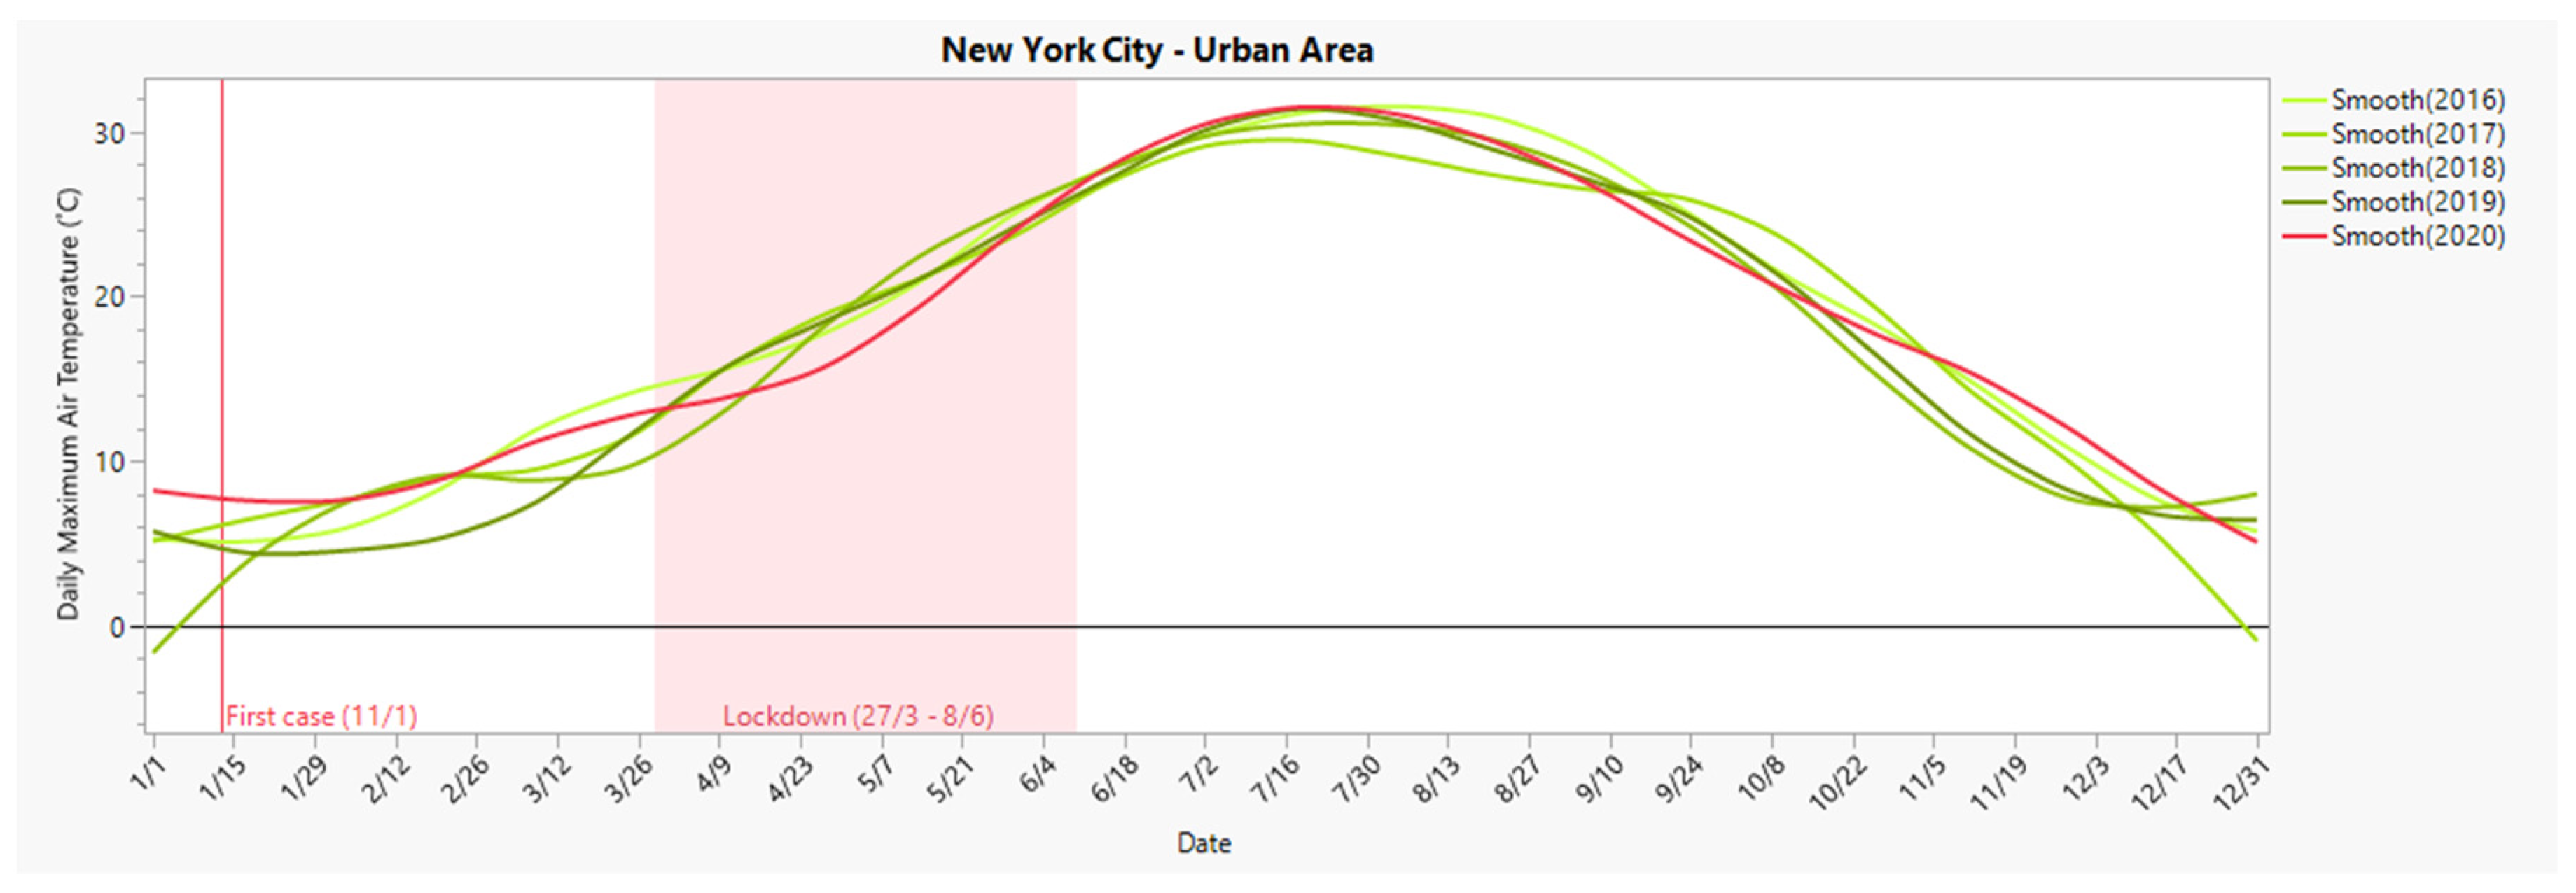
4.2. New York City
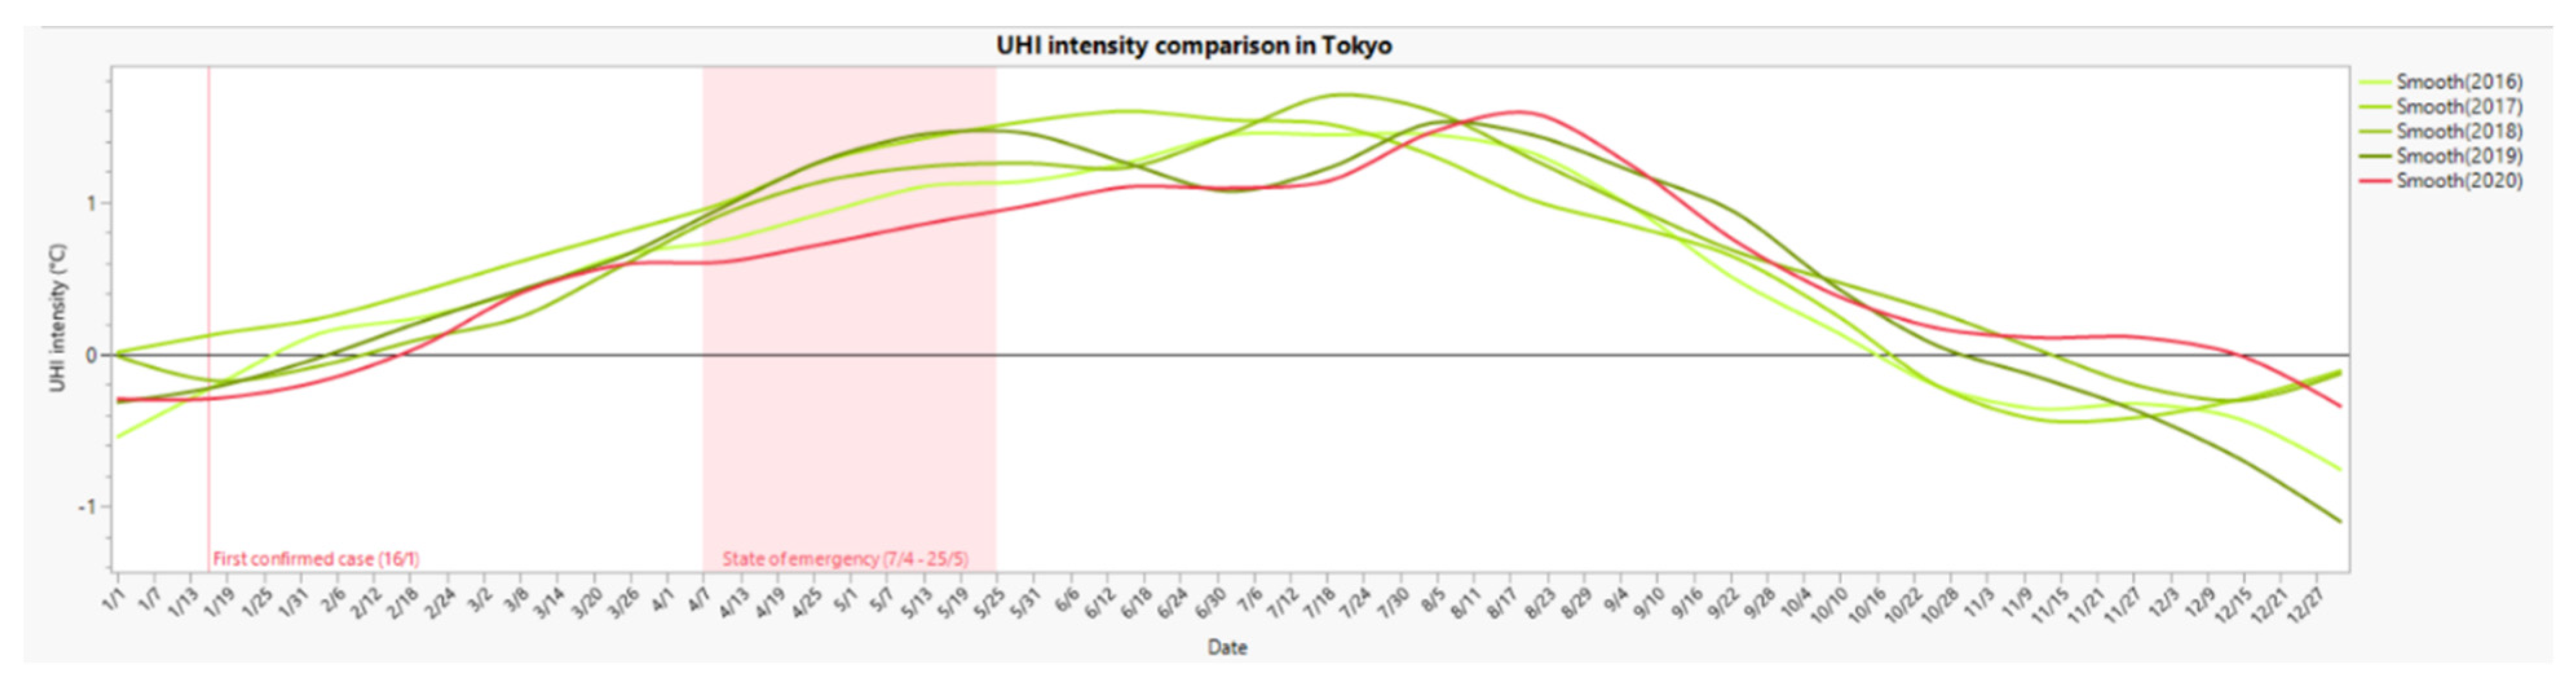
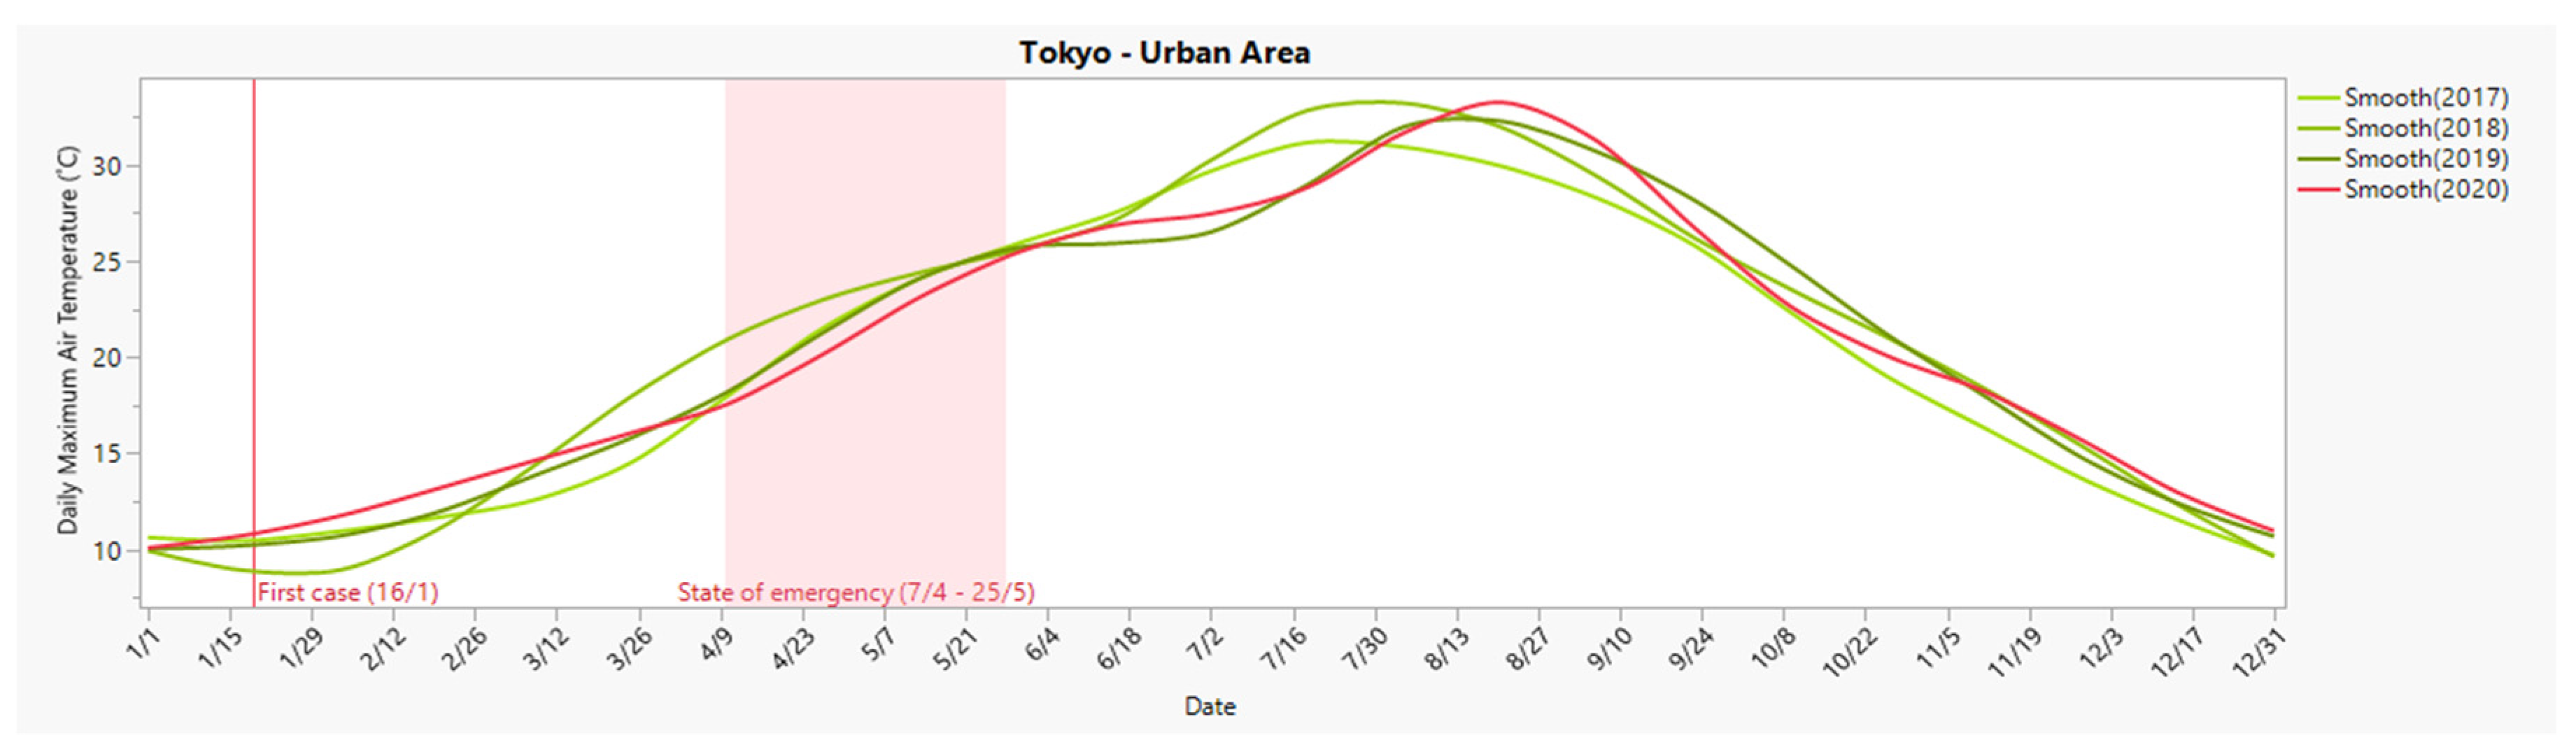
4.3. Tokyo
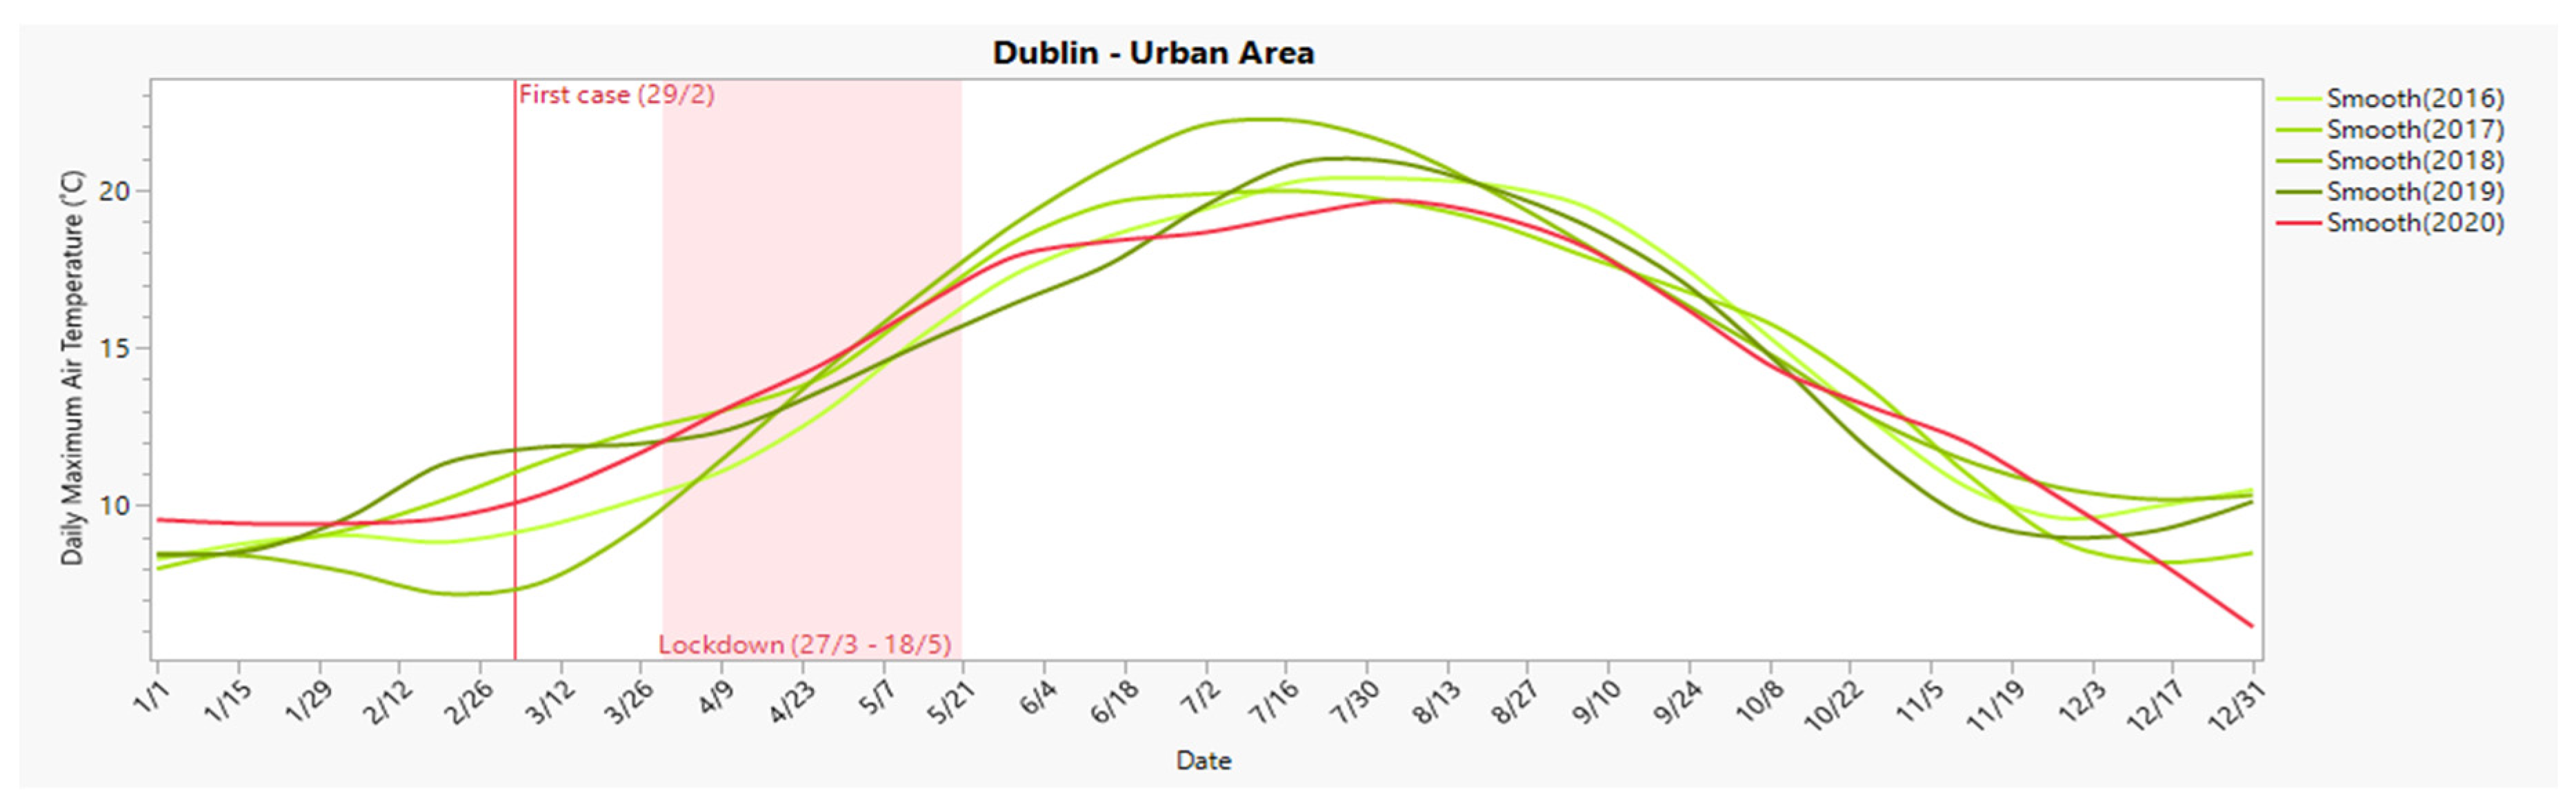
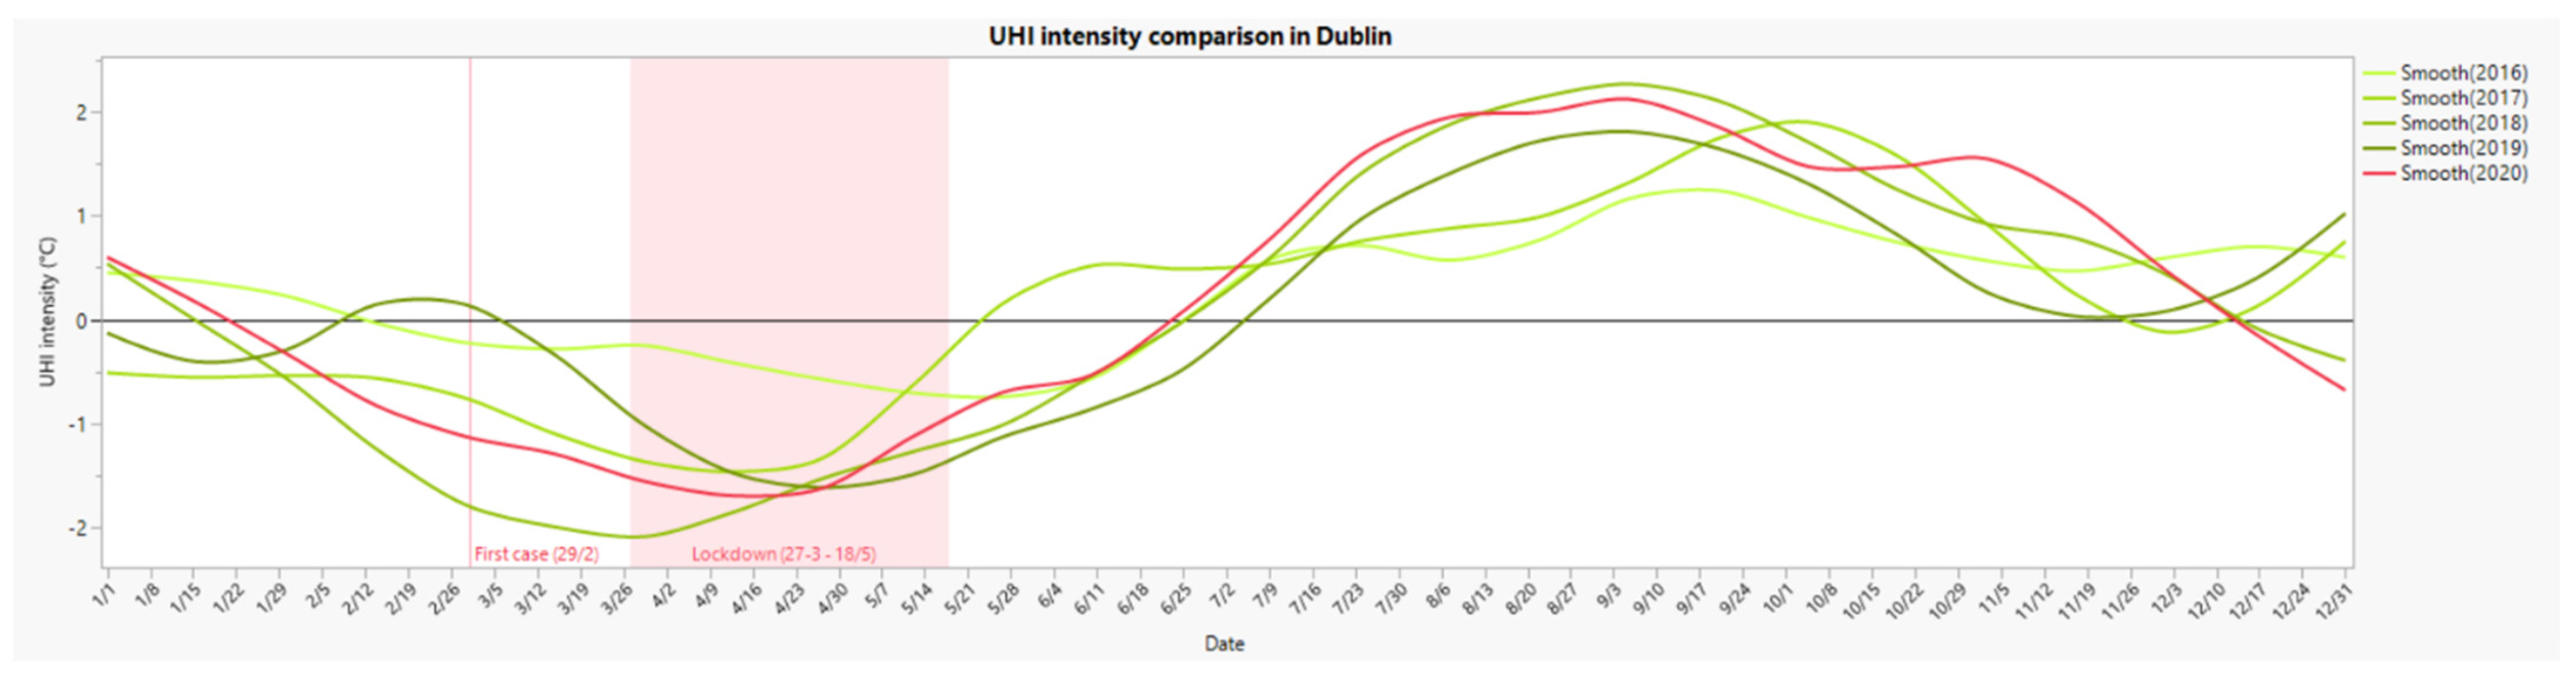
4.4. Dublin
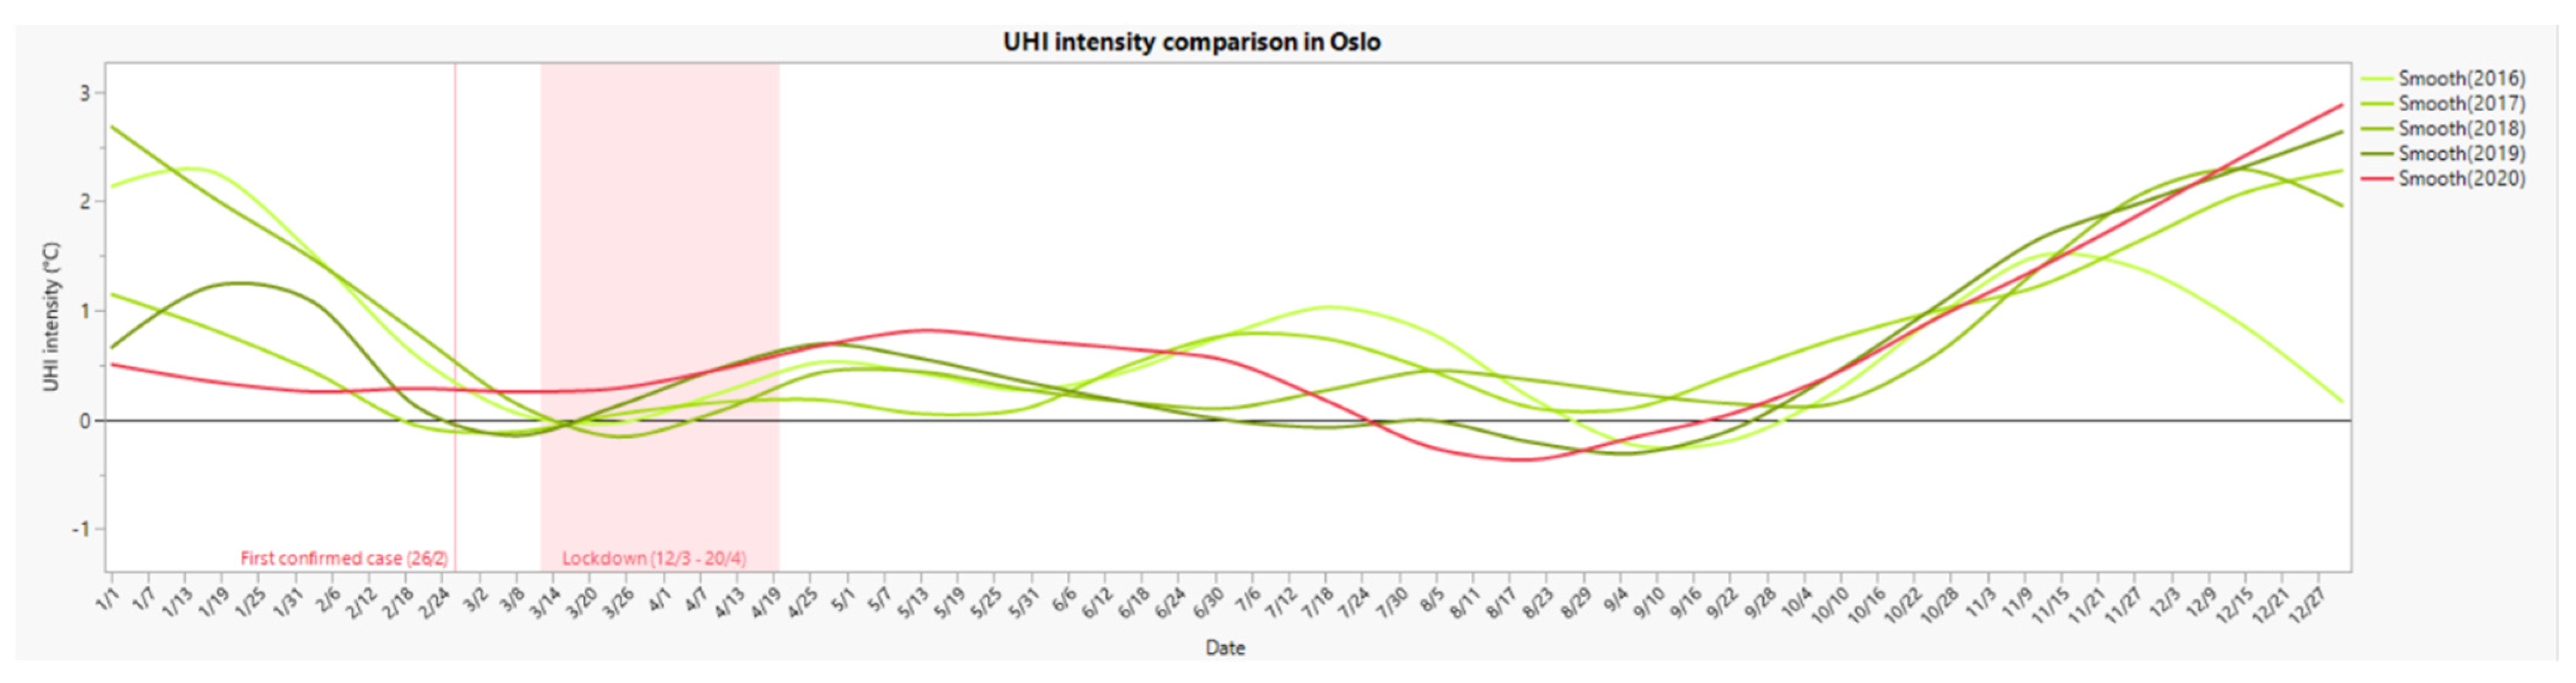
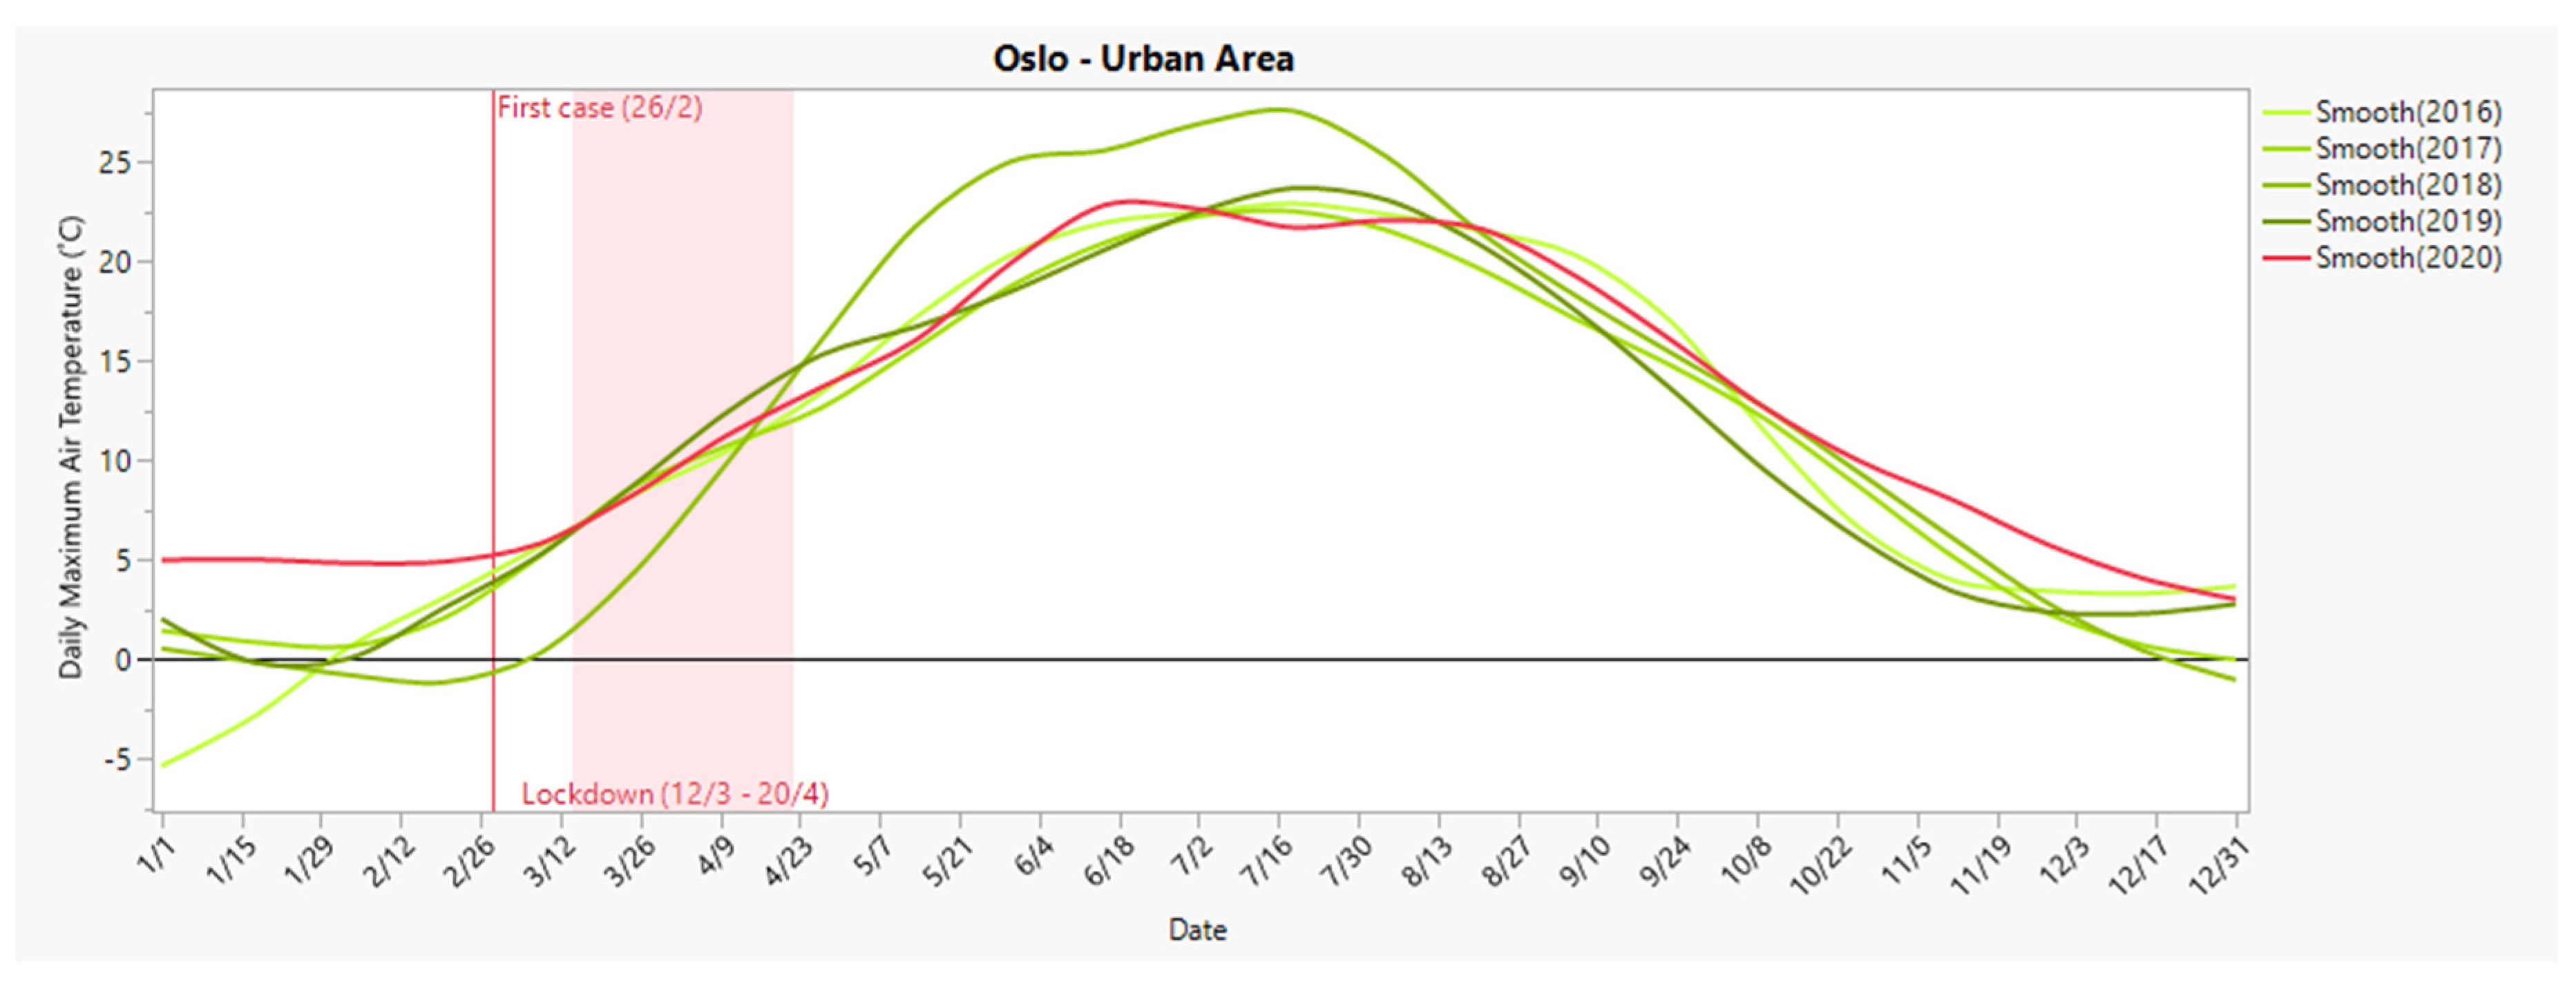
4.5. Oslo
5. Discussion
- (1)
- High-density cities showed a low UHI effect trend after lockdown restrictions were introduced;
- (2)
- The differences in UHI intensity are more distinctive in cities with stricter rules and longer lockdown duration;
- (3)
- The overall UHI intensity in 2020 was the lowest recorded in the past five years.
6. Recommendations
6.1. Energy Consumption
6.2. Transportation
- Limit car parking space for non-essential vehicles in the inner city to reduce traffic volume into the city and the risks of community spread of the virus in the future;
- Encourage people to use digital tools or apps to monitor and analyse their modes of transportation, thereby allowing them to conduct contact tracing of the coronavirus as well as check their carbon footprint;
- Improve bike lanes and road infrastructures to provide safer and user-friendly road conditions for people to commute by bike.
6.3. Building Materials
- Reduce building materials with good solar heat absorption, such as concrete, glass, stainless steel, and ceramic gravel;
- Avoid using dark colors on buildings and road surfaces to reduce radiation absorption;
- Increase the green areas and green infrastructures in the urban area to improve the cooling effect [95].
6.4. Future Research
7. Summary and Conclusions
Author Contributions
Funding
Institutional Review Board Statement
Informed Consent Statement
Data Availability Statement
Acknowledgments
Conflicts of Interest
Appendix A

| ID | Name/Location | Latitude | Longitude | Elevation | Population Density | Distance Range |
|---|---|---|---|---|---|---|
| Decimal | Decimal | (m) | (People/km2) | (km) | ||
| U1 | Melbourne (Olympic Park) | −37.83 | 144.98 | 7.53 | 5000–10,000 | 0–25 |
| U2 | Viewbank | −37.74 | 145.10 | 66.1 | 1000–2500 | 0–25 |
| U3 | Essendon Airport | −37.73 | 144.91 | 78.4 | 2500–5000 | 0–25 |
| U4 | Melbourne Airport | −37.67 | 144.83 | 113.4 | 250–500 | 0–25 |
| U5 | Moorabbin Airport | −37.98 | 145.10 | 12.1 | 1000–2500 | 0–25 |
| U6 | Scoresby Research Institute | −37.87 | 145.26 | 80 | 1000–2500 | 0–25 |
| U7 | Laverton RAAF | −37.86 | 144.76 | 20.1 | 1000–2500 | 0–25 |
| R1 | Sheoaks | −37.91 | 144.13 | 236.7 | 5–10 | 75–100 |
| R2 | Aireys Inlet | −38.46 | 144.09 | 105 | 10–25 | >100 |
| R3 | Mount Gellibrand | −38.23 | 143.79 | 261 | 5–10 | >100 |
| R4 | Castlemaine Prison | −37.08 | 144.24 | 330 | 10–25 | >100 |
| R5 | Redesdale | −37.02 | 144.52 | 290 | 25–50 | 75–100 |
| R6 | Lake Eildon | −37.23 | 145.91 | 230 | 1–5 | >100 |
| R7 | Eildon Fire Tower | −37.21 | 145.84 | 637 | 1–5 | >100 |
| R8 | Nilma North (Warragul) | −38.13 | 145.99 | 134.11 | 10–25 | 75–100 |
| R9 | Rhyll | −38.46 | 145.31 | 13.4 | 25–50 | 75–100 |
| R10 | Wonthaggi | −38.61 | 145.60 | 51.9 | 25–50 | >100 |
| ID | Name/Location | Latitude | Longitude | Elevation | Population Density | Distance Range |
|---|---|---|---|---|---|---|
| Decimal | Decimal | (m) | (People/km2) | (km) | ||
| U1 | Central Park | 40.78 | −73.97 | 47 | 25,000–50,000 | 0–25 |
| U2 | La Guardia Airport | 40.78 | −73.88 | 6 | 5000–10,000 | 0–25 |
| U3 | Teterboro Airport | 40.86 | −74.06 | 2 | 1000–2500 | 0–25 |
| U4 | Harrison | 40.75 | −74.15 | 7 | 5000–10,000 | 0–25 |
| U5 | Newark International Airport | 40.68 | −74.17 | 5 | 1000–2500 | 0–25 |
| U6 | JFK International Airport | 40.64 | −73.76 | 3 | 5000–10,000 | 0–25 |
| R1 | Shrub Oak | 41.33 | −73.84 | 128 | 100–250 | 50–75 |
| R2 | Port Jervis | 41.39 | −74.69 | 177 | 100–250 | 75–100 |
| R3 | Freehold−Marlboro | 40.31 | −74.25 | 50 | 500–1000 | 50−75 |
| R4 | Wertsville 4 NE | 40.45 | −74.78 | 87 | 100–250 | 75–100 |
| R5 | Flemington 5 NNW | 40.58 | −74.88 | 75 | 100–250 | 75–100 |
| R6 | Hightstown 2 W | 40.27 | −74.57 | 30 | 500–1000 | 75−100 |
| R7 | Belvidere Bridge | 40.83 | −75.08 | 78 | 100–250 | 75−100 |
| R8 | Baiting Hollow | 40.97 | −72.71 | 24 | 500–1000 | >100 |
| ID | Name/Location | Latitude | Longitude | Elevation | Population Density | Distance Range |
|---|---|---|---|---|---|---|
| Decimal | Decimal | (m) | (People/km2) | (km) | ||
| U1 | Tokyo (Chiyoda) | 35.68 | 139.75 | 25.2 | 10,000–25,000 | 0–25 |
| U2 | Edogawa Rinkai | 35.63 | 139.85 | 5 | 10,000–25,000 | 0–25 |
| U3 | Nerima | 35.73 | 139.58 | 51 | 10,000–25,000 | 0–25 |
| U4 | Fuchu | 35.68 | 139.48 | 59 | 5000–10,000 | 0–25 |
| U5 | Haneda (Airport) | 35.55 | 139.76 | 6 | 10,000–25,000 | 0–25 |
| U6 | Saitatma | 35.86 | 139.58 | 8 | 5000–10,000 | 0–25 |
| U7 | Koshigawa | 35.88 | 139.75 | 3 | 5000–10,000 | 0–25 |
| R1 | Chichibu | 35.98 | 139.06 | 232.1 | 100–250 | 50–75 |
| R2 | Yokoshibahikari | 35.65 | 140.46 | 6 | 250–500 | 50–75 |
| R3 | Sakahata | 35.23 | 140.08 | 120 | 250–500 | 50–75 |
| R4 | Kamogawa | 35.10 | 140.10 | 5 | 100–250 | 50–75 |
| R5 | Tateyama | 34.98 | 139.85 | 5.8 | 250–500 | 75–100 |
| R6 | Katori | 35.85 | 140.50 | 37 | 250–500 | 50–75 |
| R7 | Katsuura | 35.15 | 140.30 | 11.9 | 100–250 | 75–100 |
| R8 | Ogouchi | 35.78 | 139.05 | 530 | 100–250 | 50–75 |
| ID | Name/Location | Latitude | Longitude | Elevation | Population Density | Distance Range |
|---|---|---|---|---|---|---|
| Decimal | Decimal | (m) | (People/km2) | (km) | ||
| U1 | Phoenix Park | 53.36 | −6.32 | 45 | 2500–5000 | 0–15 |
| U2 | Casement Aerodrome | 53.31 | −6.44 | 91 | 1000–2500 | 0–15 |
| U3 | Glasnevin | 53.37 | −6.27 | 20 | 2500–5000 | 0–15 |
| U4 | Merrion Square | 53.34 | −6.25 | 19 | 2500–5000 | 0–15 |
| U5 | Dublin Airport | 53.43 | −6.24 | 69 | 500–1000 | 0–15 |
| U6 | Dun Laoghaire | 53.29 | −6.13 | 30 | 1000–2500 | 0–15 |
| R1 | Kilmichael, Cahore | 52.56 | −6.21 | 30 | 100–250 | 70–110 |
| R2 | Dunoge, Carrickmacross | 53.98 | −6.75 | 78 | 100–250 | 70–110 |
| R3 | Irishstown, Mullingar | 53.54 | −7.36 | 98 | 500–1000 | 70–110 |
| R4 | Gurteen, Tipperary | 53.04 | −8.01 | 75 | 500–1000 | 70–110 |
| R5 | Greenshill, Kilkenny | 52.67 | −7.25 | 61 | 500–1000 | 70–110 |
| ID | Name/Location | Latitude | Longitude | Elevation | Population Density | Distance Range |
|---|---|---|---|---|---|---|
| Decimal | Decimal | (m) | (People/km2) | (km) | ||
| U1 | Besserud | 59.96 | 10.67 | 177 | 2500–5000 | 0–15 |
| U2 | Haugenstua | 59.96 | 10.91 | 123 | 2500–5000 | 0–15 |
| U3 | Lambertseter | 59.87 | 10.81 | 135 | 2500–5000 | 0–15 |
| U4 | Sofienberg | 59.92 | 10.77 | 37 | 2500–5000 | 0–15 |
| U5 | Blindern | 59.94 | 10.72 | 94 | 2500–5000 | 0–15 |
| U6 | Disen | 59.94 | 10.79 | 136 | 2500–5000 | 0–15 |
| R1 | Nøtterøy-Vestskogen | 59.24 | 10.40 | 25 | 250–500 | 70–90 |
| R2 | Flesberg | 59.86 | 9.45 | 183 | 25–50 | 70–90 |
| R3 | Nord-odal | 60.26 | 12.05 | 147 | 25–50 | 70–90 |
| R4 | Nesbyen-Todokk | 60.38 | 9.61 | 166 | 10–25 | 70–90 |
| R5 | Sigdal-Nedre Eggedal | 60.14 | 9.44 | 143 | 25–50 | 70–90 |
Appendix B
| Start | End | Public Gathering | Restaurant, Bar & Café | Shops & Retails | Curfew | Travel Distance |
|---|---|---|---|---|---|---|
| 26 March | 30 March | Maximum 10 people | Open | Yes | No | No restriction |
| 31 March | 11 May | Maximum 2 people | Takeaway only | Essential only | No | No restriction |
| 12 May | 31 May | Maximum 10 people | Takeaway only | Essential only | No | No restriction |
| 1 June | 19 June | Maximum 20 people | Open with restrictions | Essential only | No | No restriction |
| 20 June | 8 July | Maximum 10 people | Open with restrictions | Essential only | No | No restriction |
| 8 July | 1 August | Maximum 2 people | Takeaway only | Essential only | No | Within reasonable distance |
| 2 August | 13 September | Maximum 2 people | Takeaway only | once per day per household | 8 p.m.–5 a.m. | <5 km of home |
| 14 September | 29 September | Maximum 2 people | Takeaway only | once per day per household | 9 p.m.–5 a.m. | <5 km of home |
| 29 September | 26 October | maximum 5 people from 2 households | Takeaway only | once per day per household | 9 p.m.–5 a.m. | <5 km of home |
| 27 October | 23 November | Maximum 10 people | Predominantly outdoor with 10-person group limit | Open with restrictions | No | <25 km of home |
| Key Dates | Key Announcement |
|---|---|
| 1 March 20 | First COVID-19 case in New York State |
| 7 March 20 | NY Governor Andrew Cuomo declares a state of emergency |
| 12 March 20 | NYC Mayor Bill de Blasio declares a state of emergency |
| 13 March 20 | President Trump declares a national emergency |
| 16 March 20 | NYC public schools close |
| 17 March 20 | NYC bars and restaurants close, except for delivery |
| 22 March 20 | NYS on PAUSE Program begins, all non-essential workers must stay home |
| 28 March 20 | Halts all non-essential construction sites in NYS |
| 6 April 20 | NYS’s stay-at-home order and school closures extends to 29 April |
| 16 April 20 | NYS’s stay-at-home order and school closures extends to 15 May |
| 30 April 20 | NYC subway closures from 1 a.m. to 5 a.m. |
| 1 May 20 | Closes all schools for the remainder of the academic year |
| 7 May 20 | Extends PAUSE order to 6 June |
| 14 May 20 | Extends PAUSE order to May 28 for NYC |
| 14 May 20 | State of emergency for NYS extended to 13 June |
| 15 May 20 | Reopen of Drive-in theaters, landscaping, and low-risk recreational activities |
| 23 May 20 | Allows gatherings of up to 10 people with social distancing |
| 8 June 20 | NYC begins Phase 1 reopening |
| 22 June 20 | NYC begins phase 2 of reopening |
| 6 July 20 | NYC begins Phase 3 of reopening, without indoor dining |
| 19 July 20 | NYC begins Phase 4 reopening, excluding malls, museums, and indoor dining/bars |
| 2 September 20 | Gyms in NYC reopen, but indoor group workouts and pools stay closed |
| 9 September 20 | Malls in NYC reopen at 50% capacity with no indoor dining. Casinos reopen across NYS at 25% capacity. |
| 29 September 20 | Elementary students return to public school classrooms across NYC |
| 30 September 20 | Indoor dining in NYC resumes with a 25% occupancy limit |
| Key Dates | Key Announcement |
|---|---|
| 16 January 20 | First confirmed case in Japan |
| 26 January 20 | Japan started evacuating its citizens from Wuhan, China |
| 10 February 20 | Virus spreading from Diamond Princess Cruise ship arrived in Yokohama Bay |
| 14 February 20 | Kyoto launched its empty tourism campaign |
| 27 February 20 | Prime Minister Abe Shinzo requested closure of all elementary, junior high, and high schools |
| 28 February 20 | Hokkaido prefecture was the first one to declare a state of Emergency |
| 25 March 20 | Tokyo governor Koike-san asked people to stay indoors over the weekend to stop community spread |
| 1 April 20 | Foreigners that have travelled to 73 different countries in the last 14 days will be denied entry to the country. |
| 7 April 20 | Prime Minster Abe Shinzo declare a state of emergency that cover Tokyo and six other prefectures. |
| 10 April 20 | Tokyo government offered financially compensated to businesses that agreed to reduce operating hours |
| 16 April 20 | Japan declared a national wide state of emergency |
| 14 May 20 | The state of emergency lifts from 39 prefectures, but not include Tokyo |
| 25 May 20 | Tokyo has lifted the state of emergency, international travel allowed from permitted countries |
| 27 May 20 | Tokyo ease up restrictions in three stages |
| 1 June 20 | Children allowed back to school |
| Key Dates | Key Announcement |
|---|---|
| 29 February 20 | First confirmed case in the Republic of Ireland. Ireland entered the containment phase |
| 12 March 20 | Announced the closure of all schools, colleges, and childcare facilities until 29 March |
| 27 March 20 | Announced a national stay-at-home order unit 12 April |
| 10 April 20 | Extended the stay-at-home order unit 5 May |
| 1 May 20 | Extended the stay-at-home order unit 18 May |
| 18 May 20 | Phase one of the government’s roadmap of easing COVID-19 restrictions began |
| 8 June 20 | Phase two plus of the government’s roadmap of easing COVID-19 restrictions began |
| 29 June 20 | Phase three began, businesses reopened, including all pubs serving food, cafés, restaurants, hotels, hairdressers, beauty salons and tourist attractions |
| 15 July 20 | Phase four is postponed to 10 August; Pubs, hotel bars, nightclubs and casinos will remain closed; Restrictions on public gathering remained |
| 4 August 20 | Phase four will not proceed on 10 August; Restaurants and pubs serving food will now have to close by 11 pm except deliveries and takeaways |
| 7 August 20 | Confirmed cases increased, restrictions were applied to some counties |
| 15 August 20 | Announced of second spread of disease |
| Key Dates | Key Announcement |
|---|---|
| 26 February 20 | First confirmed case |
| 12 March 20 | A national lockdown for 14 days |
| 16 March 20 | Introduced an internal border control |
| 28 March 20 | The government extended the lockdown until 13 April. |
| 14 April 20 | Internal border control has been extended for 20 days from 15 April |
| 20 April 20 | Kindergartens and schools are gradually reopening |
| 30 April 20 | Internal border control will be continued unit 16 May |
| 7 May 20 | Venues reopened in public places for maximum 50 people; a few community areas are reopening |
| 5 June 20 | People allowed back to office and workplace |
| 15 June 20 | Gym, water parks, and swimming pools are reopened; venues allowed maximum 200 people |
| 25 June 20 | Foreigner works and students allow to entry |
| 15 July 20 | Allow travel between Norway and other European countries |
| 7 August 20 | Government slow down the reopening and tightening control of the spread of infection |
| 12 August 20 | Continued internal border control from 14 August for 60 days. |
| 30 September 20 | More national infection control measurements are being replaced by local measurements. |
References
- World Health Organization. WHO Announces COVID-19 Outbreak a Pandemic. 12 March 2020. Available online: https://www.euro.who.int/en/health-topics/health-emergencies/coronavirus-covid-19/news/news/2020/3/who-announces-covid-19-outbreak-a-pandemic (accessed on 10 August 2020).
- Ducharme, J. World Health Organization Declares COVID-19 A ‘Pandemic.’ Here’s What That Means. TIME. 11 March 2020. Available online: https://time.com/5791661/who-coronavirus-pandemic-declaration/ (accessed on 10 August 2020).
- World Health Organization. Coronavirus Disease (COVID-19) Pandemic. 21 November 2020. Available online: https://www.who.int/emergencies/diseases/novel-coronavirus-2019 (accessed on 10 August 2020).
- Rupani, P.F.; Nilashi, M.; Abumalloh, R.A.; Asadi, S.; Samad, S.; Wang, S. Coronavirus pandemic (COVID-19) and its natural environmental impacts. Int. J. Environ. Sci. Technol. 2020, 17, 4655–4666. [Google Scholar] [CrossRef]
- Fernando, G. Is Melbourne’s Coronavirus Lockdown Really the Longest in the World? Here’s How Other Countries Stack Up. SBS News. 8 September 2020. Available online: https://www.sbs.com.au/news/is-melbourne-s-coronavirus-lockdown-really-the-longest-in-the-world-here-s-how-other-countries-stack-up#:~:text=Melbourne%E2%80%99s%20lockdown%20is%20one%20of%20the%20longest%20and,March%2C%20which%20were%20initially%20extended%20to%2011%20May (accessed on 4 October 2020).
- Doman, M.; Scott, N. From Ghost Town to Green Shoots. ABC News. 6 November 2020. Available online: https://www.abc.net.au/news/2020-11-06/search-melbourne-suburbs-to-see-the-rebound-after-covid-lockdown/12851854?nw=0 (accessed on 25 November 2020).
- AAEMO. Latest COVID19 Demand Impact Summary. May 2020. Available online: https://www.aemo.com.au/newsroom/news-updates/latest-covid19-demand-impact-summary (accessed on 25 November 2020).
- The Bureau of Meteorology and CSIRO. State of the Climate 2020. 2020. Available online: http://www.bom.gov.au/state-of-the-climate/documents/State-of-the-Climate-2020.pdf (accessed on 10 September 2020).
- Press Trust of India. 17% Decline in Global Carbon Emssions COVID-19 Lockdown Study. The Economic Times. 20 May 2020. Available online: https://economictimes.indiatimes.com/news/international/business/17-decline-in-global-carbon-emissions-due-to-covid-19-lockdown-study/articleshow/75840410.cms (accessed on 13 October 2020).
- Kanniah, K.D.; Zaman, N.A.F.K.; Kaskaoutis, D.G.; Latif, M.T. COVID-19’s impact on the atmospheric environment in the Southeast Asia region. Sci. Total Environ. 2020, 736, 139658. [Google Scholar] [CrossRef] [PubMed]
- Chowdhuri, I.; Pal, S.C.; Saha, A.; Chakrabortty, R.; Ghosh, M.; Roy, P. Significant decrease of lightning activities during COVID-19 lockdown period over Kolkata megacity in India. Sci. Total Environ. 2020, 747, 141321. [Google Scholar] [CrossRef] [PubMed]
- Baldasano, J.M. COVID-19 lockdown effects on air quality by NO2 in the cities of Barcelona and Madrid (Spain). Sci. Total Environ. 2020, 741, 140353. [Google Scholar] [CrossRef] [PubMed]
- Rossi, R.; Ceccato, R.; Gastaldi, M. Effect of road traffic on air pollution. Experimental evidence from covid-19 lockdown. Sustainability 2020, 12, 8984. [Google Scholar] [CrossRef]
- Barua, S.; Nath, S.D. The impact of COVID-19 on air pollution: Evidence from global data. J. Clean. Prod. 2021, 298, 126755. [Google Scholar] [CrossRef] [PubMed]
- Sannigrahi, S.; Kumar, P.; Molter, A.; Zhang, Q.; Basu, B.; Basu, A.S.; Pilla, F. Examining the status of improved air quality in world cities due to COVID-19 led temporary reduction in anthropogenic emissions. Environ. Res. 2021, 196, 110927. [Google Scholar] [CrossRef] [PubMed]
- Toro, R.; Catalán, F.; Urdanivia, F.R.; Rojas, J.P.; Manzano, C.A.; Seguel, R.; Gallardo, L.; Osses, M.; Pantoja, N.; Leiva-Guzman, M.A. Air pollution and COVID-19 lockdown in a large South American city: Santiago Metropolitan Area, Chile. Urban Clim. 2021, 36, 100803. [Google Scholar] [CrossRef]
- Girdhar, A.; Kapur, H.; Kumar, V.; Kaur, M.; Singh, D.; Damasevicius, R. Effect of COVID-19 outbreak on urban health and environment. Air Qual. Atmos. Health 2021, 14, 389–397. [Google Scholar] [CrossRef] [PubMed]
- Albayati, N.; Waisi, B.; Al-Furaiji, M.; Kadhom, M.; Alalwan, H. Effect of COVID-19 on air quality and pollution in different countries. J. Transp. Health 2021, 21, 101061. [Google Scholar] [CrossRef]
- Oke, T.R. The urban energy balance. Prog. Phys. Geogr. Earth Environ. 1988, 12, 471–508. [Google Scholar] [CrossRef]
- Oke, T.R. The energetic basis of the urban heat island. Q. J. R. Meteorol. Soc. 1982, 108, 1–24. [Google Scholar] [CrossRef]
- Imhoff, M.L.; Zhang, P.; Wolfe, R.E.; Bounoua, L. Remote sensing of the urban heat island effect across biomes in the continental USA. Remote Sens. Environ. 2010, 114, 504–513. [Google Scholar] [CrossRef] [Green Version]
- Alahmad, B.; Tomasso, L.P.; Al-Hemoud, A.; James, P.; Koutrakis, P. Spatial Distribution of Land Surface Temperatures in Kuwait: Urban Heat and Cool Islands. Int. J. Environ. Res. Public Health 2020, 17, 2993. [Google Scholar] [CrossRef]
- Wu, X.; Zhang, L.; Zang, S. Examining seasonal effect of urban heat island in a coastal city. PLoS ONE 2019, 14, e0217850. [Google Scholar] [CrossRef] [Green Version]
- Morris, C.J.G.; Simmonds, I. Associations between varying magnitudes of the urban heat island and the synoptic climatology in Melbourne, Australia. Int. J. Climatol. 2000, 20, 1931–1954. [Google Scholar] [CrossRef]
- Morris, C.J.G.; Simmonds, I.; Plummer, N. Quantification of the influence of wind and cloud on the nocturnal urban heat island of a large city. J. Appl. Meteorol. 2001, 40, 169–182. [Google Scholar] [CrossRef]
- Carpio, M.; González, Á.; González, M.; Verichev, K. Influence of pavements on the urban heat island phenomenon: A scientific evolution analysis. Energy Build. 2020, 226, 110379. [Google Scholar] [CrossRef]
- Kamboj, S.; Ali, S. Urban sprawl of Kota city: A case study of urban heat island linked with electric consumption. Mater. Today Proc. 2020, 46, 5304–5314. [Google Scholar] [CrossRef]
- Yow, D.M. Urban Heat Islands: Observations, Impacts, and Adaptation. Geogr. Compass 2007, 1, 1227–1251. [Google Scholar] [CrossRef]
- NOAA National Centers for Environmental Information. State of the Climate Global Climate Report. January 2021. Available online: https://www.ncdc.noaa.gov/sotc/global/202013#gtemp (accessed on 20 January 2021).
- Horton, R.M.; Mankin, J.S.; Lesk, C.; Coffel, E.; Raymond, C. A Review of Recent Advances in Research on Extreme Heat Events. Curr. Clim. Chang. Rep. 2016, 2, 242–259. [Google Scholar] [CrossRef]
- Smoyer, K.E. Putting risk in its place: Methodological considerations for investigating extreme event health risk. Soc. Sci. Med. 1998, 47, 1809–1824. [Google Scholar] [CrossRef]
- Boumans, R.J.M.; Phillips, D.L.; Victery, W.; Fontaine, T.D. Developing a model for effects of climate change on human health and health–environment interactions: Heat stress in Austin, Texas. Urban Clim. 2014, 8, 78–99. [Google Scholar] [CrossRef]
- Katsouyanni, K.; Pantazopoulou, A.; Touloumi, G.; Tselepidaki, I.; Moustris, K.; Asimakopoulos, D.; Poulopoulou, G.; Trichopoulos, D. Evidence for Interaction between Air Pollution and High Temperature in the Causation of Excess Mortality. Arch. Environ. Health Int. J. 1993, 48, 235–242. [Google Scholar] [CrossRef] [PubMed]
- Hansel, N.N.; McCormack, M.C.; Kim, V. The Effects of Air Pollution and Temperature on COPD. COPD J. Chronic Obstr. Pulm. Dis. 2016, 13, 372–379. [Google Scholar] [CrossRef] [PubMed]
- NOAA National Weather Service. Weather Related Fatality and Injury Statistics. 2019. Available online: https://www.weather.gov/hazstat/ (accessed on 5 October 2020).
- García-Herrera, R.; Díaz, J.; Trigo, R.M.; Luterbacher, J.; Fischer, E.M. A Review of the European Summer Heat Wave of 2003. Crit. Rev. Environ. Sci. Technol. 2010, 40, 267–306. [Google Scholar] [CrossRef]
- Bell, J.E.; Brown, C.L.; Conlon, K.; Herring, S.; Kunkel, K.E.; Lawrimore, J.; Luber, G.; Schreck, C.; Smith, A.; Uejio, C. Changes in extreme events and the potential impacts on human health. J. Air Waste Manag. Assoc. 2018, 68, 265–287. [Google Scholar] [CrossRef] [PubMed] [Green Version]
- Vitart, F. Monthly forecast and the summer 2003 heat wave over Europe: A case study. Atmos. Sci. Lett. 2005, 6, 112–117. [Google Scholar] [CrossRef]
- Salagnac, J.-L. Lessons from the 2003 heat wave: A French perspective. Build. Res. Inf. 2007, 35, 450–457. [Google Scholar] [CrossRef]
- Johnson, H.; Kovats, R.S.; McGregor, G.; Stedman, J.; Gibbs, M.; Walton, H.; Cook, L.; Black, E. The impact of the 2003 heat wave on mortality and hospital admissions in England. Health Stat. Q. 2005, 25, 6–11. [Google Scholar] [CrossRef] [Green Version]
- Clarke, J.F. Some effects of the urban structure on heat mortality. Environ. Res. 1972, 5, 93–104. [Google Scholar] [CrossRef]
- Heaviside, C.; Vardoulakis, S.; Cai, X.-M. Attribution of mortality to the urban heat island during heatwaves in the West Midlands, UK. Environ. Health 2016, 15, S27. [Google Scholar] [CrossRef] [PubMed] [Green Version]
- Zhao, L.; Oppenheimer, M.; Zhu, Q.; Baldwin, J.; Ebi, K.L.; Bou-Zeid, E.; Guan, K.; Liu, X. Interactions between urban heat islands and heat waves. Environ. Res. Lett. 2018, 13, 034003. [Google Scholar] [CrossRef]
- Vaidyanathan, A.; Malilay, J.; Schramm, P.; Saha, S. Heat-Related Deaths—United States, 2004–2018. MMWR Morb. Mortal. Wkly. Rep. 2020, 69, 729–734. [Google Scholar] [CrossRef] [PubMed]
- Cleugh, H.; Smith, M.S.; Battaglia, M.; Graham, P. Climate Change: Science and Solutions for Australia; CSIRO: Canberra, Australia, 2011.
- He, J.; Chen, G.; Jiang, Y.; Jin, R.; Shortridge, A.; Agusti, S.; He, M.; Wu, J.; Duarte, C.M.; Christakos, G. Comparative infection modeling and control of COVID-19 transmission patterns in China, South Korea, Italy and Iran. Sci. Total Environ. 2020, 747, 141447. [Google Scholar] [CrossRef]
- Yang, L.; Qian, F.; Song, D.-X.; Zheng, K.-J. Research on Urban Heat-Island Effect. Procedia Eng. 2016, 169, 11–18. [Google Scholar] [CrossRef]
- Stewart, I.D.; Oke, T.R. Local Climate Zones for Urban Temperature Studies. Bull. Am. Meteorol. Soc. 2012, 93, 1879–1900. [Google Scholar] [CrossRef]
- Schatz, J.; Kucharik, C.J. Urban climate effects on extreme temperatures in Madison, Wisconsin, USA. Environ. Res. Lett. 2015, 10, 094024. [Google Scholar] [CrossRef] [Green Version]
- Yang, X.; Li, Y.; Luo, Z.; Chan, P.W. The urban cool island phenomenon in a high-rise high-density city and its mechanisms. Int. J. Climatol. 2017, 37, 890–904. [Google Scholar] [CrossRef]
- United States Environmental Protection Agency, Heat Island Effect. 2020. Available online: https://www.epa.gov/heatislands (accessed on 24 July 2020).
- Zhou, B.; Rybski, D.; Kropp, J.P. On the statistics of urban heat island intensity. Geophys. Res. Lett. 2013, 40, 5486–5491. [Google Scholar] [CrossRef]
- U.S. Census Bureau. Urban and Rural. 2020. Available online: https://www.census.gov/programs-surveys/geography/guidance/geo-areas/urban-rural.html (accessed on 1 September 2020).
- Bureau of Meteorology. Climate Data Online. 2020. Available online: http://www.bom.gov.au/climate/data/index.shtml?bookmark=136&zoom=3&lat=-37.1235&lon=145.2&layers=B00000TFFFFFFFTFFFFFFFFFFFFFFFFFFFFTTT&dp=IDC10002-d (accessed on 11 August 2020).
- Norwegian Climate Service Center. Observations and Weather Statistics. 2020. Available online: https://klimaservicesenter.no/observations/ (accessed on 12 September 2020).
- Met Éireann Forecast. The Irish Meteorological Service. 2020. Available online: https://www.met.ie/ (accessed on 25 September 2020).
- National Weather Service. NOWData—NOAA Online Weather Data. 2020. Available online: https://w2.weather.gov/climate/xmacis.php?wfo=okx (accessed on 2 August 2020).
- Japan Meterological Agency. Historical Weather Data Search. 2020. Available online: https://www.data.jma.go.jp/obd/stats/etrn/index.php (accessed on 1 August 2020).
- City Population. Map Index. 2020. Available online: https://www.citypopulation.de/mapindex.html (accessed on 23 October 2020).
- Central Statistics Office. 2020. Available online: https://www.cso.ie/en/ (accessed on 12 October 2020).
- Statistics Norway. Statistisk Sentralbyrå. 2020. Available online: https://www.ssb.no/en (accessed on 26 September 2020).
- National Statistics Center. e-State: Statistics of Japan. 2020. Available online: https://www.e-stat.go.jp/en (accessed on 26 September 2020).
- Australian Bureau of Statistics. Data by Region. 2020. Available online: https://itt.abs.gov.au/itt/r.jsp?databyregion (accessed on 26 October 2020).
- United States Census Bureau. QuickFacts: New York City, New York. 2020. Available online: https://www.census.gov/quickfacts/fact/table/newyorkcitynewyork/PST045219 (accessed on 15 November 2020).
- Handley, E. From Wuhan to Australia: A Timeline of Key Events in the Spread of the Deadly Coronavirus. ABC News. 6 April 2020. Available online: https://www.abc.net.au/news/2020-01-29/coronavirus-timeline-from-wuhan-china-to-global-crisis/11903298?nw=0 (accessed on 13 July 2020).
- 9 News Staff. Timeline: How Coronavirus Spread from China to Australia. Nine Digital. 29 April 2020. Available online: https://www.9news.com.au/national/coronavirus-time-of-how-covid19-spread-from-china-to-australia/b73efd0a-fb38-44a2-9d34-e68f1de5098e (accessed on 13 July 2020).
- McNaughton, J. COVID-19 Restrictions Sees Drive-Through Businesses Boom as Customers Avoid Supermarkets, Keep Their Distance. ABC News. 26 April 2020. Available online: https://www.abc.net.au/news/2020-04-26/coronavirus-drive-through-business-boom/12184972 (accessed on 13 July 2020).
- Vaughan, R.; Ky, J. A Timeline of How Melbourne Landed Back in Stage three Lockdowns. 7 News. 11 July 2020. Available online: https://7news.com.au/lifestyle/health-wellbeing/a-timeline-of-how-melbourne-landed-back-in-stage-three-lockdowns-c-1157684#:~:text=%20A%20timeline%20of%20how%20Melbourne%20landed%20back,for%20the%20first%20time%20in%20a...%20More%20 (accessed on 3 August 2020).
- Earl, N.; Simmonds, I.; Tapper, N. Weekly cycles in peak time temperatures and urban heat island intensity. Environ. Res. Lett. 2016, 11, 074003. [Google Scholar] [CrossRef]
- Simmonds, I.; Kaval, J. Day-of-the week variation of rainfall and maximum temperature in Melbourne, Australia. Arch. Meteorol. Geophys. Bioclimatol. Ser. B 1986, 36, 317–330. [Google Scholar] [CrossRef]
- Department of Health and Human Services. Coronavirus (COVID-19). Available online: https://www.dhhs.vic.gov.au/coronavirus (accessed on 22 August 2020).
- Lapin, T. Coronavirus in NY: A Timeline of How the Disease Spread through the Metro Area. New York Post. 12 March 2020. Available online: https://nypost.com/2020/03/12/coronavirus-in-ny-a-timeline-of-how-the-disease-spread-through-the-metro-area/ (accessed on 26 June 2020).
- Lee, A.; DeVibiss, J. Daily Electricity Demand in New York Falls about 13% after COVID-19 Mitigation Efforts, Washington, DC. May 2020. Available online: https://www.eia.gov/todayinenergy/detail.php?id=43635#tab1 (accessed on 12 October 2020).
- Kerr, A. A Historical Timeline of COVID-19 in New York City. Investopedia. 6 October 2020. Available online: https://www.investopedia.com/historical-timeline-of-covid-19-in-new-york-city-5071986 (accessed on 10 November 2020).
- Vazquez, J.; Shea, T.; Rajamani, M.; Price, B.; Intarasuwan, K. Timeline: Tracking the Spread of COVID-19 in Tri-State. NBC Universal Media. 25 November 2020. Available online: https://www.nbcnewyork.com/news/local/timeline-tracking-the-spread-of-covid-19-in-tri-state/2313123/ (accessed on 2 October 2020).
- Kyodo. Japan Confirms First Case of Coronavirus that Has Infected Dozens in China. The Japan Times. 16 January 2020. Available online: https://www.japantimes.co.jp/news/2020/01/16/national/science-health/japan-first-coronavirus-case/ (accessed on 13 July 2020).
- Kyodo News. Hokkaido Declares State of Emergency over Coronavirus. KYODO NEWS. 28 February 2020. Available online: https://english.kyodonews.net/news/2020/02/69d1b85128b9-urgent-hokkaido-declares-state-of-emergency-over-coronavirus.html (accessed on 20 August 2020).
- Osumi, M. Japan Tightens Border Controls over COVID-19, But Power to Quarantine Limited. The Japan Times. 9 March 2020. Available online: https://www.japantimes.co.jp/news/2020/03/09/national/japan-border-controls-coronavirus/ (accessed on 20 August 2020).
- Furutani, K. Live updates: The Covid-19 Coronavirus Situation in Tokyo and Japan Right Now. Time Out Tokyo. 20 August 2020. Available online: https://www.timeout.com/tokyo/things-to-do/live-updates-the-covid-19-coronavirus-situation-in-tokyo-and-japan-right-now (accessed on 20 August 2020).
- Tokyo Metropolitan Government. Updates on COVID-19 in Tokyo. Tokyo Metropolitan Governmen. 20 August 2020. Available online: https://stopcovid19.metro.tokyo.lg.jp/en/ (accessed on 20 August 2020).
- Coronavirus: First case confirmed in Republic of Ireland. BBC News. 29 February 2020. Available online: https://www.bbc.com/news/world-europe-51693259 (accessed on 6 September 2020).
- Leahy, P.; Cullen, P.; Lynch, S.; Kelly, F. Coronavirus: Schools, Colleges and Childcare Facilities in Ireland to Shut. The Irsish Times. 12 March 2020. Available online: https://www.irishtimes.com/news/health/coronavirus-schools-colleges-and-childcare-facilities-in-ireland-to-shut-1.4200977 (accessed on 6 September 2020).
- Carroll, R. ‘Stay home’: Varadkar Announces Sweeping Two-Week Lockdown. The Guardian. 28 March 2020. Available online: https://www.theguardian.com/world/2020/mar/27/stay-home-varadkar-urges-irish-in-drastic-lockdown (accessed on 6 September 2020).
- Kenny, A. Outdoor Time for over 70s and Exercise Limit Extended to 5 km. RTÉ News. 1 May 2020. Available online: https://www.rte.ie/news/2020/0501/1135923-cabinet/ (accessed on 6 September 2020).
- BBC News. Coronavirus: Concern over ‘Increasing Number’ of Cases in NI. BBC News. 11 August 2020. Available online: https://www.bbc.com/news/uk-northern-ireland-53740465 (accessed on 7 September 2020).
- AFP. Updated: Norway Announces First Case of Coronavirus. The Local Norway. 27 February 2020. Available online: https://www.thelocal.no/20200226/breaking-norway-announces-first-case-of-coronavirus (accessed on 5 October 2020).
- Norwegian Government Security and Service Organisation. Timeline: News from Norwegian Ministries about the Coronavirus disease Covid-19. Government.no. 27 February 2020. Available online: https://www.regjeringen.no/en/topics/koronavirus-covid-19/timeline-for-news-from-norwegian-ministries-about-the-coronavirus-disease-covid-19/id2692402/ (accessed on 2 November 2020).
- NOAA National Centers for Environmental Information. State of the Climate: Global Climate Report. July 2020. Available online: https://www.ncdc.noaa.gov/sotc/global/202007/supplemental/page-1 (accessed on 26 November 2020).
- The Skyscraper Center. Cities Ranked by Number of Completed Structures (Buildings & Towers). 2020. Available online: http://skyscrapercenter.info/cities?list=structures (accessed on 26 November 2020).
- Baj, L. COVID-19 Had ‘No Measurable Impact’ on Carbon Emissions, so There’s Not Even A Silver Lining. Pedestrian. 24 November 2020. Available online: https://www.pedestrian.tv/news/covid-19-carbon-emissions/ (accessed on 1 December 2020).
- Ryan, J. COVID-19 Lockdowns Caused an ‘Extreme’ Reduction in Carbon Emissions. Cnet. 19 May 2020. Available online: https://www.cnet.com/news/covid-19-lockdowns-caused-an-extreme-reduction-in-carbon-emissions/ (accessed on 4 October 2020).
- City of Melbourne. Transport Strategy 2030, Melbourne. 2020. Available online: https://www.melbourne.vic.gov.au/SiteCollectionDocuments/transport-strategy-2030-city-of-melbourne.pdf (accessed on 23 November 2020).
- Institute for Sensible Transport. Institute for Sensible Transport Projects. 2020. Available online: https://sensibletransport.org.au/projects/ (accessed on 1 December 2020).
- City of Melbourne. Green Our City Strategic Action Plan 2017–2021. June 2017. Available online: https://www.melbourne.vic.gov.au/sitecollectiondocuments/green-our-city-action-plan-2018.pdf (accessed on 15 November 2020).
- Cohen, P.; Potchter, O.; Matzarakis, A. Daily and seasonal climatic conditions of green urban open spaces in the Mediterranean climate and their impact on human comfort. Build. Environ. 2012, 51, 285–295. [Google Scholar] [CrossRef]


| City | Geographical Location (Latitude, Longitude) | Population (Thousands) | Land Area (km2) | Köppen Climate Classification |
|---|---|---|---|---|
| Melbourne | Costal Area | 4963 | 9993 | oceanic climate (Cfb) |
| (37.81° S, 144.96° E) | ||||
| Tokyo | Costal Area | 35,600 | 13,555 | humid subtropical climate (Cfa) |
| (35.68° N, 139.75° E) | ||||
| New York City | Costal area | 8337 | 783.8 | humid subtropical climate (Cfa); humid continental climate (Dfa) |
| (40.78° N, −73.97° E) | ||||
| Dublin | Costal Area | 1111 | 317.5 | marine west coast climate (Cfb) |
| (53.35° N, −6.27° E) | ||||
| Oslo | Costal Area | 693 | 426.4 | humid continental climate (Dfa) |
| (59.91° N, 10.75° E) |
| Year | Annual Average UHI Intensity (°C) | |||||
|---|---|---|---|---|---|---|
| Melbourne | Tokyo | New York City | Dublin | Oslo | Overall | |
| 2016 | 0.99 | 0.53 | 0.68 | 0.25 | 0.69 | 0.63 |
| 2017 | 1.11 | 0.67 | 0.80 | 0.15 | 0.59 | 0.66 |
| 2018 | 0.88 | 0.65 | 0.90 | 0.05 | 0.74 | 0.64 |
| 2019 | 1.03 | 0.61 | 0.52 | 0.09 | 0.59 | 0.57 |
| 2020 | 0.89 | 0.56 | 0.41 | 0.22 | 0.61 | 0.54 |
Publisher’s Note: MDPI stays neutral with regard to jurisdictional claims in published maps and institutional affiliations. |
© 2021 by the authors. Licensee MDPI, Basel, Switzerland. This article is an open access article distributed under the terms and conditions of the Creative Commons Attribution (CC BY) license (https://creativecommons.org/licenses/by/4.0/).
Share and Cite
Wai, C.Y.; Muttil, N.; Tariq, M.A.U.R.; Paresi, P.; Nnachi, R.C.; Ng, A.W.M. Investigating the Relationship between Human Activity and the Urban Heat Island Effect in Melbourne and Four Other International Cities Impacted by COVID-19. Sustainability 2022, 14, 378. https://doi.org/10.3390/su14010378
Wai CY, Muttil N, Tariq MAUR, Paresi P, Nnachi RC, Ng AWM. Investigating the Relationship between Human Activity and the Urban Heat Island Effect in Melbourne and Four Other International Cities Impacted by COVID-19. Sustainability. 2022; 14(1):378. https://doi.org/10.3390/su14010378
Chicago/Turabian StyleWai, Cheuk Yin, Nitin Muttil, Muhammad Atiq Ur Rehman Tariq, Prudvireddy Paresi, Raphael Chukwuka Nnachi, and Anne W. M. Ng. 2022. "Investigating the Relationship between Human Activity and the Urban Heat Island Effect in Melbourne and Four Other International Cities Impacted by COVID-19" Sustainability 14, no. 1: 378. https://doi.org/10.3390/su14010378
APA StyleWai, C. Y., Muttil, N., Tariq, M. A. U. R., Paresi, P., Nnachi, R. C., & Ng, A. W. M. (2022). Investigating the Relationship between Human Activity and the Urban Heat Island Effect in Melbourne and Four Other International Cities Impacted by COVID-19. Sustainability, 14(1), 378. https://doi.org/10.3390/su14010378