Article

Extreme Weather Conditions and Cardiovascular Hospitalizations in Southern Brazil

by
Iago Turba Costa
1,*,
Cassio Arthur Wollmann
1,*,
João Paulo Assis Gobo
2,
Priscilla Venâncio Ikefuti
3,
Salman Shooshtarian
4 and
Andreas Matzarakis
5
1
Department of Geoscience, Federal University of Santa Maria, Santa Maria 97105-900, Brazil
2
Department of Geography, Federal University of Rondônia, Porto Velho 76801-059, Brazil
3
Epidemiological Surveillance Center, State Department of Health (CVE/SES), São Paulo 01246-000, Brazil
4
School of Property, Construction and Project Management, RMIT University, Melbourne, VIC 3001, Australia
5
Research Centre Human Biometeorology, Deutscher Wetterdienst, 79104 Freiburg, Germany
*
Authors to whom correspondence should be addressed.
Sustainability 2021, 13(21), 12194; https://doi.org/10.3390/su132112194
Submission received: 30 August 2021 / Revised: 26 October 2021 / Accepted: 30 October 2021 / Published: 4 November 2021
(This article belongs to the Special Issue Thermal Comfort and Adaptation in Urban Areas)

Abstract

:
This research concerns the identification of a pattern between the occurrence of extreme weather conditions, such as cold waves and heat waves, and hospitalization for cardiovascular diseases (CVDs), in the University Hospital of Santa Maria (HUSM) in southern Brazil between 2012 and 2017. The research employed the field experiment method to measure the biometeorological parameters associated with hospital admissions in different seasons, such as during extreme weather conditions such as a cold wave (CW) or a heat wave (HW), using five thermal comfort indices: physiologically equivalent temperature (PET), new standard effective temperature (SET), predicted mean vote (PMV), effective temperatures (ET), and effective temperature with wind (ETW). The hospitalizations were recorded as 0.775 and 0.726 admissions per day for the winter and entire study periods, respectively. The records for extreme events showed higher admission rates than those on average days. The results also suggest that emergency hospitalizations for heart diseases during extreme weather events occurred predominantly on days with thermal discomfort. Furthermore, there was a particularly high risk of hospitalization for up to seven days after the end of the CW. Further analyses showed that cardiovascular hospitalizations were higher in winter than in summer, suggesting that CWs are more life threatening in wintertime.

1. Introduction

Cardiovascular diseases (CVDs) comprise all pathologies that affect the heart and its arterial segments, such as heart disease, infarction, arrhythmia, ischemia, stroke, and angina [1]. Although most CVDs are preventable, they continue to be the most significant cause of death and disability worldwide with an increasing trend. This trend is mainly attributed to the lack of adoption of adequate preventive measures. In this context, CVDs are currently considered the main noncommunicable disease (NCD) that affects most societies around the world, as confirmed in a study carried out in 2008 showing that 63% and 30% of the total deaths (57 million) recorded in 2007 were related to NCDs and CVDs, respectively [2]. In Brazil, one study suggests that CVDs are the most significant cause of hospitalizations in all regions of Brazil for the population over the age of 60 years old, with the southern region presenting the highest rate of hospitalization compared with the other regions [3].
The World Health Organization [4] lists the following associated health risk factors for CVDs: alcohol consumption, smoking, hypertension, high body mass index (BMI), high cholesterol and glucose, inadequate intake of fruits and vegetables, and physical inactivity [4]. These factors are potentially threatening contributors to a healthy population and, as well as socioeconomic background, are known in the human biometeorology sciences for having the largest contingencies of hospitalization related to the heart in historical and recent studies, especially relating to air temperature (Ta) [5,6,7,8,9,10,11]. Lower temperature values cause more significant cardiac risks, meaning a greater effort is required to keep the body warm [12]. The interplay between thermal conditions and CVDs has been linked to cold weather conditions in Europe [13]. When researching coronary events in 21 countries, Barnett et al. relate more harm to the cold in warm climate countries than in cold climate countries, a factor attributed to the characteristics and greater domestic preparation to combat the lower temperatures in cold climatic regions [14]. In this context, the inclusion of studies on the seasonality and duration of hot and cold periods in a given place, and their relationships with rates or public health indices, become of paramount importance as they reveal the disease patterns of a population [5,6,7,8]. Studies on respiratory diseases in the United States and Europe [5,6,7,12,15,16] have associated CVD morbidity or mortality with seasonality and with higher rates and peak hospitalizations in winter and in short periods with lowering air temperature values. Ta behaviors in relation to hospitalizations for cardiovascular diseases in Brazil were discussed in a smaller number of papers, and the majority, such as [17,18,19] and recently [20] focused on the tropical latitudes of the country.
Heat waves (HWs) have already been linked to mortality in previous research studies [21,22]. Currently, more studies are focusing on HWs because of the likelihood of future trends increasing the magnitude of heat frequency and intensity [23]. The definitions of CWs and HWs typically only use air temperature (Ta) as a form of delimitation, which is also a variable adopted in the analysis of Anthes et al. regarding environmental human thermal comfort [24]. Human biometeorological indices are more effective ways to assess the impact of climate on human health, as they can factor in multiple atmospheric factors [25,26].
The number of HWs has also increased in recent decades and will increase even more in the immediate future [23]. In the past, it has been argued that HWs [27] are events that are easy to identify, as they may be represented in all seasons including winter. On the other hand, CWs are events that sometimes occur in winter, but less often in number than HWs in summer because—according to the climate classification of the study area—summers are hot and winters are not too cold [27,28]. Data on CWs and HWs in Brazil were collected from 1961 to 2016 and a study concluded that both are more severe in the southern region of the country at any time of the year [29].
In the Netherlands, humans’ susceptibility to heat has been found to have decreased over time, meaning people tend to adapt more easily to heat [30]. The study found that HWs often surpass the usual standard Ta of the coldest months. This can cause greater thermal discomfort for the organism and, therefore, it is believed that of the data on the maximum Ta (Tamax) presents more significance than minimum Ta (Tamin).
Human thermal comfort (HTC) is defined as a condition of mind that expresses its satisfaction with the surrounding thermal environment ([31], p. 8), as influenced by physiological, psychological, behavioral, social, and economic factors [32]. HTC is a valuable benchmark for assessments of human health conditions related to thermal conditions as it considers a wide range of biometeorological parameters, including Ta, wind speed (Va), air humidity (RH), solar radiation (Sr), and human factors such as the level of clothing insulation and metabolic activity [33].
During CWs and HWs, hospitalizations for CVDs are more closely related to human thermal discomfort than during typical conditions. Golden et al. [34], in a study of HWs in Phoenix (USA), point out that the highest incidence of medical occurrences and mortality during HW days are associated with excess Ta and the thermal discomfort caused by the HW. Aboubakri et al. [35] found a higher correlation for mortality in heat stress than cold in Iran’s PET, PMV, and SET indices. In the Iberian Peninsula, Fares [11] used universal thermal climate index (UTCI), net effective temperature (NET), and apparent temperature (TA) to assess hospitalizations for CVDs and noted that low Ta values were a risk factor regardless of the index used.
Anderson et al. [36] analyzed mortality in American communities and realized that the occurrence of short-lived HWs might have a greater effect on mortality than longer-lived HWs (in days). This phenomenon is termed short-term acclimation by Matzarakis et al. [37], who, in their research on heat stress during HWs in Freiburg, Germany, found that the HWs in early summer were more uncomfortable for the population than those of late summer due to adaptation of the organism by the end of summer to high-temperature values. Brychkov et al. [38] found that short-term acclimatization can vary between natives and people from different regions.
Acclimatization is a process in which human beings adapt to a given climatic environment [39], and, in the long run, it causes people to develop more physiological resistance to the climatic characteristics of a certain region. The thermal sensation varies from person to person in different climates according to several scholars [40,41,42,43,44,45] who report that different groups may be more susceptible to certain thermal conditions. The study area of Rio Grande do Sul state is characterized by a subtropical climate (Cfa) [46], with hot summers but lower temperatures more prevalent in the daily life of the population, especially in the winter. The heat promoted in anomalies, such as HWs, causes much more thermal discomfort compared to CWs [45].
Based on Bitencourt et. al. [29], this study attempts to correlate extreme weather conditions and CVD hospitalizations in southern Brazil in the period from 2012 to 2017. We aim to determine whether hospitalizations due to cardiac crises have climatic associations through seasonal peaks and extreme temperature events, such as CWs and HWs, and to show how human thermal comfort indices can vary in a timeline and influence hospitalizations, especially in the worst classes of discomfort.
There are no studies that show the relationship between extreme weather conditions and the rate of hospitalization due to cardiovascular diseases in southern Brazil (subtropical climate), especially with regard to sudden and persistent variations in Ta. This research seeks to fill this research gap through the following objectives:
(1)
To understand whether the seasonality of hospitalizations for CVDs is correlated with extreme weather conditions (CWs and HWs);
(2)
To determine the worst thermal comfort classes in southern Brazil for CVD hospitalizations.
The main intention of this work is not to demonstrate that climatic and cardiological factors are closely linked as people can naturally have heart problems and will experience symptoms or crises at some point in life, regardless of the climatic condition. Rather, it shows that bioclimatic events, such as CWs and HWs, and thermal discomfort [47], can generate some ‘triggers’ for individuals who already have organic coronary problems and end up developing early crises that require urgent hospitalization or emergency treatment.

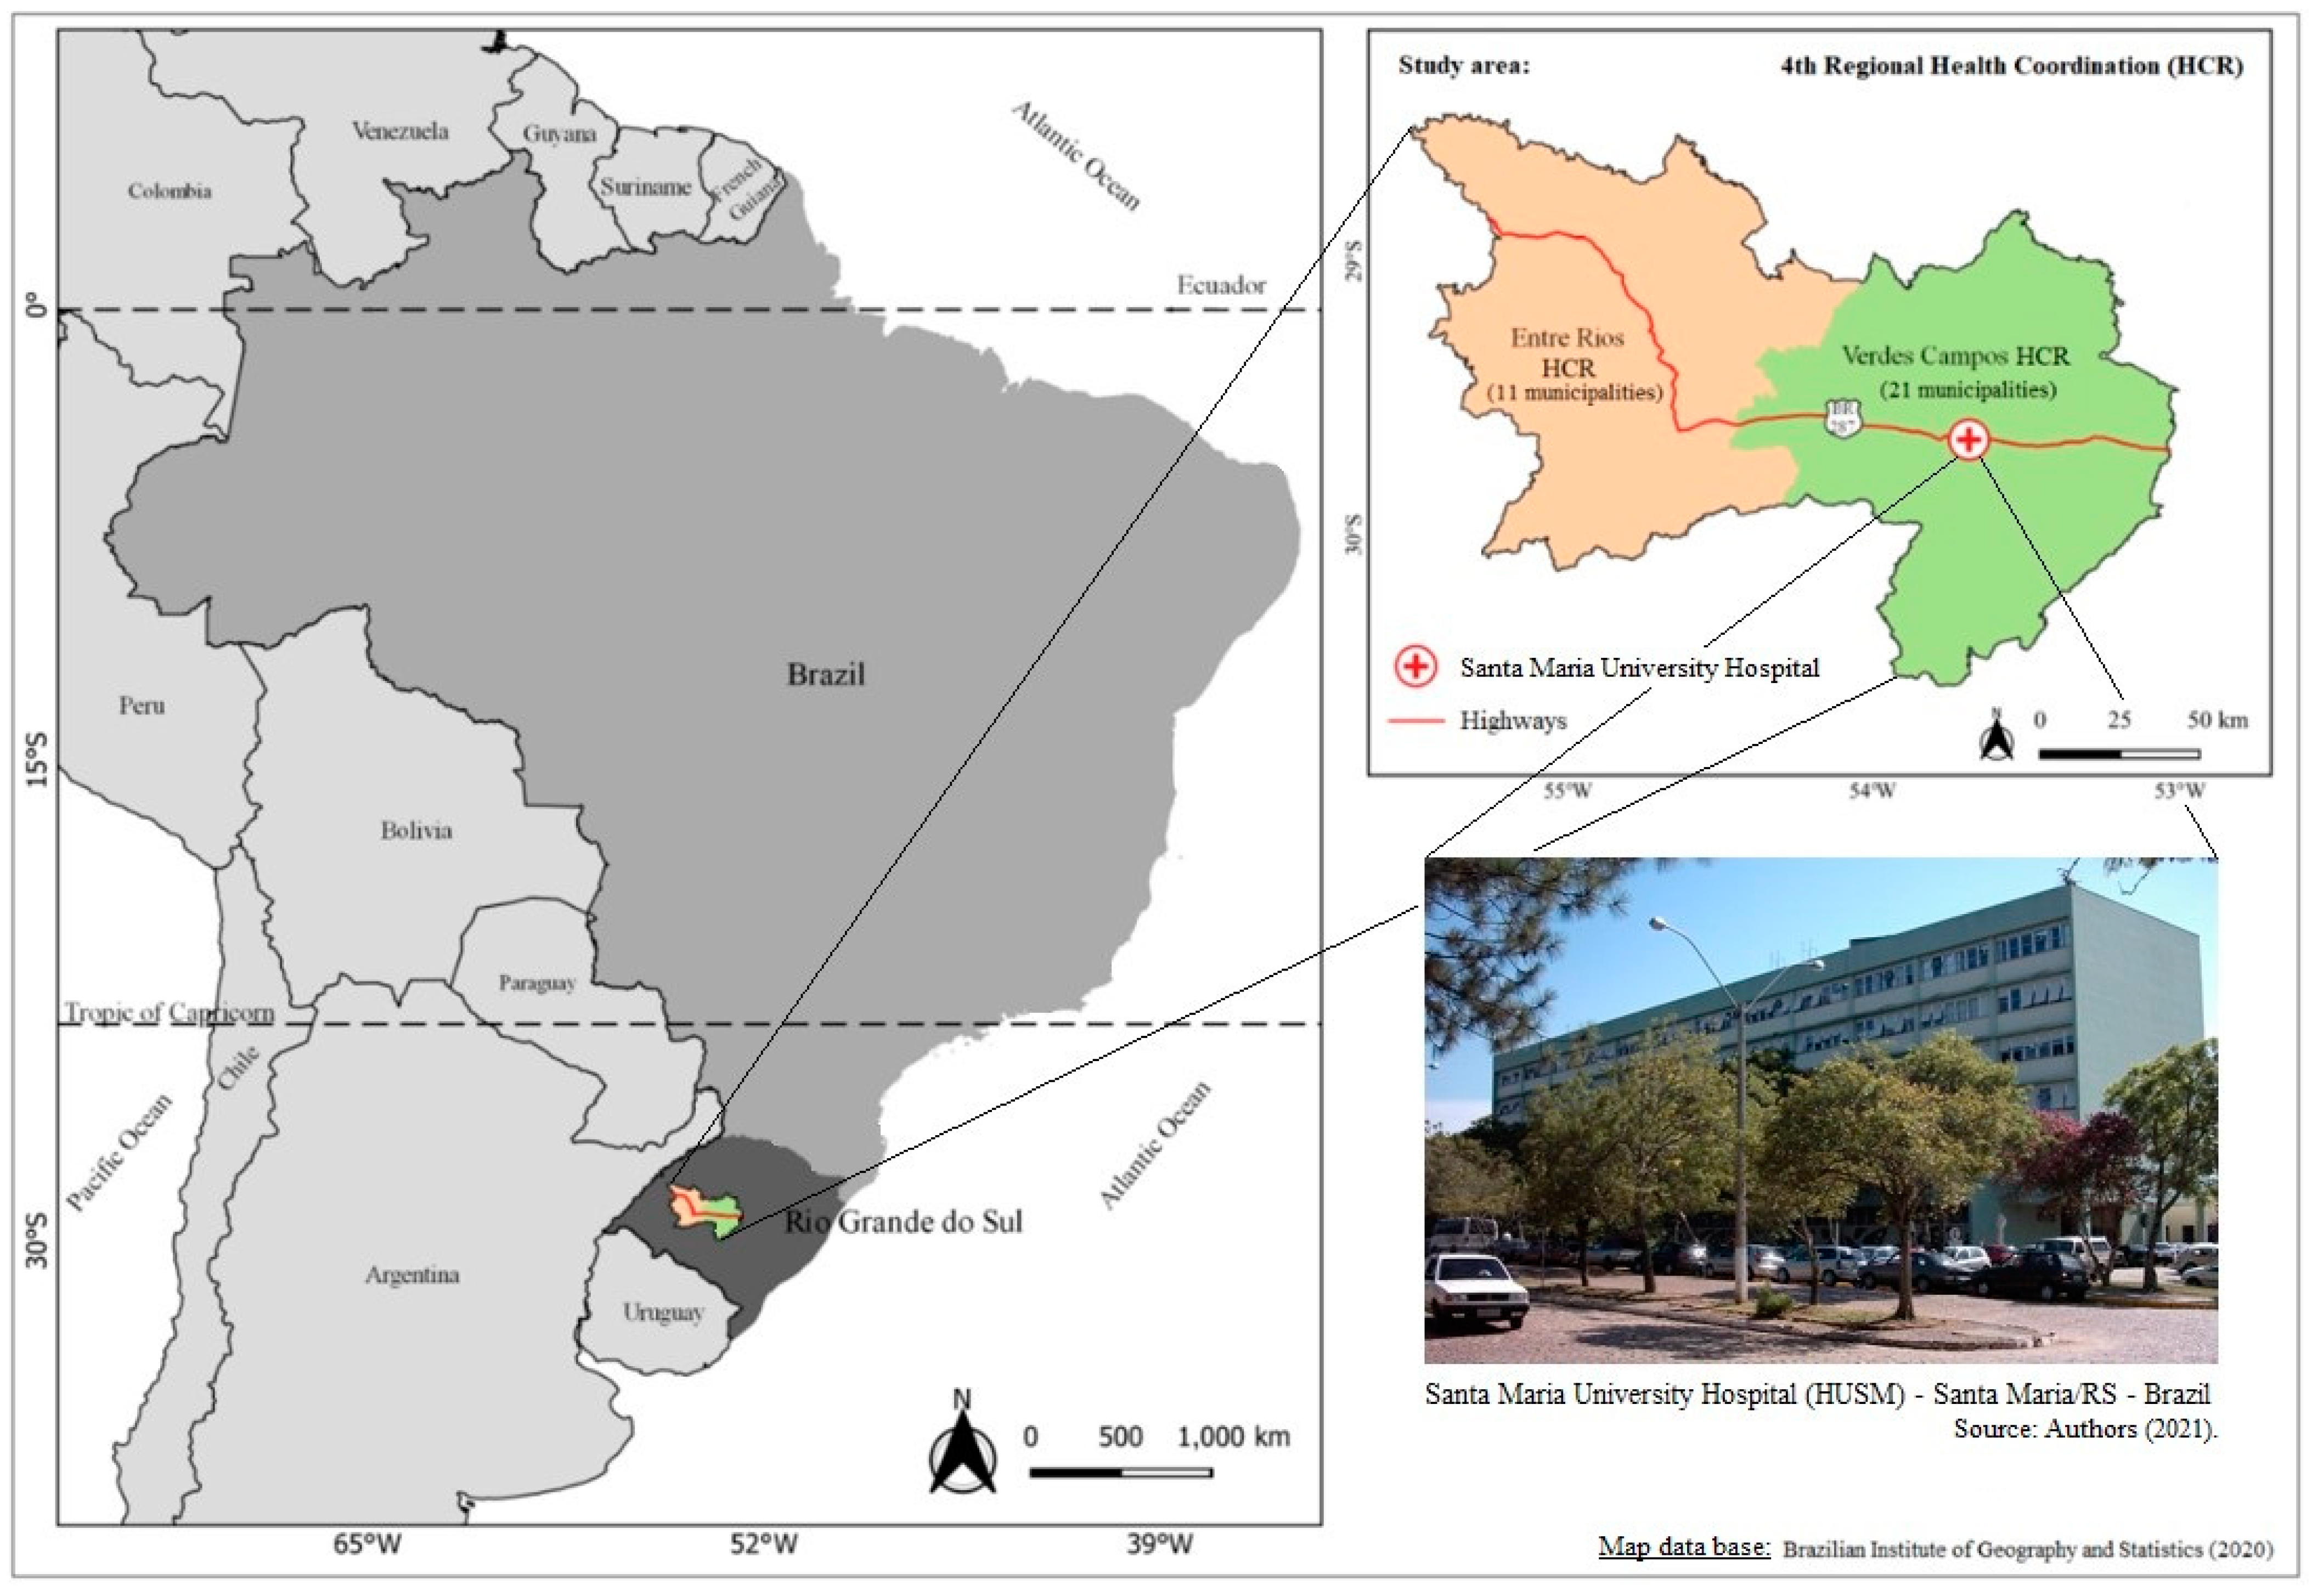
2. Materials and Methods

This research was conducted at the University Hospital in Santa Maria (HUSM), located in the fourth regional health coordination (4th RHC), which belongs to the Rio Grande do Sul state, which is the southernmost federative state of Brazil. The 4th RHC comprises two health regions, Verdes Campos and Entre Rios, which service 32 municipalities; Santa Maria is the administrative center of this public health structure (Figure 1).
The HUSM is the public reference hospital for complex cases in the Verdes Campos and Entre Rios RHCs, including services in the cardiology patient assistance network. The services provided in HUSM follow the Brazilian government’s Ordinance SAS/MS No. 123/2005 [48] requirements, which include treatment of high vascular complexities. This means severe cardiovascular complexities that are covered by the Brazilian public health system (SUS) receive specialized treatment in this hospital. Therefore, the cities that are part of the study area need to transfer patients who require more complex cardiovascular healthcare to the HUSM.
The study area has a humid subtropical climate (Cfa) [46,49]. This area is classified under the thermal region of the central depression [50]. The average winter Ta values in the coldest month (July) fall between 10.0 °C and 15.0 °C. During July, the Tamin can reach below zero, mainly due to the periodic and frequent presence of the polar air masses coming from the south of Brazil. During summer, the Ta values in the hottest month (January) are above 24.0 °C [51]. Using PMV, PET, and SET, Gobo, et al. [52] estimated the outdoor HTC for January and July. For the most part, the results showed it was ‘neither cold nor hot.’ In the bands of thermal discomfort, the cold was more prevalent than heat, and for PET the range of ‘hot’ thermal stress was not observed.
In this study, two secondary data sets between 2012 and 2017 were collected: health-related data and microclimate data. The data collection procedure was approved by the UHSM’s Teaching and Research Group (No. 048/2018), responsible for the management of human ethics research activities. Health data were obtained from the HUSM’s statistics department. Included in the data collected were the admission date, age, and sex of patients who were hospitalized between 2012 and 2017 for emergency care.
Biometeorological data (Tamin and Tamax, Va, RH, and Sr—daily mean values) were acquired from the National Meteorological Institute (INMET) in Santa Maria’s automatic weather station (Figure 2) for the period from January 2012 to December 2017. Due to a technical failure in reading the Sr data, 12 June 2016 was not recorded.
Seasonal periods were defined by Costa et al. [53] as summer days (22 December to 20 March), autumn days (21 March to 20 June), winter days (21 June to 21 September), and spring days (22 September to 21 December). CWs were days with a minimum temperature of ≤8.0 °C for at least three consecutive days [53]. HWs were classified as a minimum occurrence of three consecutive days with minimum and maximum daily temperatures above 18.0 °C and 28.0 °C, respectively [51]. The cited references were used because they were carried out in the study area, and their considerations about the CW and HW values were analyzed up to seven days after the end of each wave.
The analysis of hospitalization data and meteorological data was performed on a daily, seasonal basis during CWs and HWs. To follow this process, the researchers referred to the ‘average daily census’, which is used as an indicator in Brazilian public hospital management to represent the average number of hospitalizations in a given period [54]. This average relationship is calculated using Equation (1):
Average   hospitalization   rate : T o t a l   n u m b e r   o f   h o s p i t a l i z e d   p a t i e n t s   T o t a l   d a y s   i n   t h e   p e r i o d
For human thermal comfort analysis, the physiologically equivalent temperature (PET) defined by Mayer and Höppe [55] and Höppe [56], new standard effective temperature (SET) [57], and predicted mean vote (PMV) [58] were used. These indices were adapted and calibrated for the subtropical climate conditions [59]. In this way, calibration was performed during CWs and HWs and associated with the amount of hospitalization for heart disease in each interpretive range.
The effective temperatures (ET) index, defined by effective temperature with wind (ETW) [60], was also calibrated [51]. The PET, SET, and PMV indices were calculated for CWs and HWs that occurred within a period of 1802 days, as there was a missing data point in the Santa Maria weather station database in the collection of sunshine on 12 June 2016. For this reason, it was not possible to calculate these indices on the following days. The ET and ETW indices were presented for the CWs and HWs that occurred during 2192 days, a period ranging from 2012 to 2017. Table 1 contains the formulas and class ranges considered in each of the human thermal comfort indices adopted.
The classes of thermal comfort index were extracted from Gobo et al. [51] and [59] because they were calibrated in the context of the same climate in the study area. The PMV, PET, and SET indices were calculated with the meteorological data (recording time of daily Tamax and Tamin) from the Santa Maria weather station and using the RayMan model [61,62]. ETW and ET were calculated according to Rossato et al. [53], using Equation (2) and (3), respectively.
ETW   = 37 ( 37   Ta ) / { 0.68 0.0014 × RH   + [ 1 / ( 1.76 + 1.4   v 0.75 ) ] } 0.29 × Ta   × ( 1 0.01 × RH )
ET   =   Ta   0.4 × ( Ta   10 ) × ( 1 0.01   RH ) .
In which, Ta = air temperature (°C); RH = relative humidity (%); v = wind velocity (m/s).
To measure the effect of Ta (minimum, average, and maximum) on daily hospitalizations, the relative risks (RR) were estimated with the distributed nonlinear lag models (DLNMs). The DLNMs represent a modeling framework for simultaneously describing nonlinear and time-lagged dependencies, called exposure–lag–response associations. Often, the effect of a specific exposure event is not limited to the period in which it is observed, as reported by Gasparrini [63]. Thus, the use of DLNMs is indicated for the calculation of the effect of temperatures on hospitalizations in Santa Maria. This type of modeling (the R program packages dlnm, splines, Epi, stats, foreign, tsModel, AER, and zoo were used for all calculations) has been widely applied in studies with the same characteristics as this one and has proved to be very effective in providing the results of the associations [64,65,66,67,68].
DLNMs are based on the generalized linear model (GLM) with Poisson distribution. To control the seasonality and trend of the series, a non-parametric smoothing function (NS) was used; in addition, an indicator of holidays and days of the week (Wdays) was adopted to control the short-time trend. The cross base of temperature (cb.temp) used a lag of 21 days to include the effects of cold; in previous studies, this appeared with a time lag of more than three weeks. The RH of the air (cb.umid) was used as a control and to obtain only the isolated effect of temperature on daily admissions. The formula for the model used is in Equation (4):
Log   ( Yt ) =   α   +   cb . temp   +   cb . RH   +   Wdays   +   NS   ( Time ,   7 × 5 df year ) .

3. Results

3.1. Seasonal Hospitalizations

The absolute number of people in emergency and urgent situations for cardiology between 2012 and 2017 was 1592, which totaled 2192 days. The seasonal distribution of hospitalizations showed that in 2012, 2013, and 2016, the winter period had the highest number of hospitalizations, while in 2014 and 2017 summer was the season with the most hospitalizations, and in 2015 spring had the most hospitalizations. Adding the hospitalizations for each season of the year, winter is more affected with 433 hospitalizations. In the sequence, spring (395 hospitalizations), summer (384), and autumn (380) followed. The hospitalization rates calculated for Brasil [54] for seasonality also presented a higher rate of hospitalization in winter (0.775 hospitalizations/day), followed by spring (0.723 hospitalizations/day), summer (0.716 hospitalizations/day), and autumn (0.688 hospitalizations/day).
The sex of the patients in the 1592 admissions during the study period was 634 women and 958 men. These numbers reflected the same pattern of higher cardiovascular morbidity for the male population as reflected in medical studies. The age range with the highest number of hospitalizations was from 60 to 79 years old with 794 cases (483 men and 311 women). Adding the age groups of patients under 60 years old, which [2] indicates an age group too young to die from CVD and morbidity (labeled as premature death), 635 admissions of ‘premature’ age were counted.
The winter season had the highest number of hospitalizations for men and women, with 255 and 178 hospitalizations, respectively. The lowest hospitalization per season for men was in the summer, with 221 hospitalizations, and in the spring for women, with 153 hospitalizations. Winter, considering the differentiation between the sexes, continued to be the season with the highest hospital morbidity. In the age groups with the highest hospitalizations (60 to 79 years), winter was once again the season with the highest number of hospitalizations for men and women with 136 and 95, respectively. The other age groups maintained relatively similar numbers of hospitalizations. The graph in Figure 3 shows the variation in seasonal hospitalizations.
During the six years researched, the average hospitalization rate was 0.726 hospitalizations/day. Only winter had higher rates than the total period of researched days. The autumn and summer seasons had lower rates; spring, on the other hand, was close to the average total rate.

3.2. Hospitalizations during Cold and Heat Waves

The total average of hospitalizations (Table 2), considering only the days that did not show the existence of waves (called ‘normal days’), was 0.714 hospitalizations/day. During HWs it was 0.759 hospitalizations/day, and during CWs it was 0.751 hospitalizations/day. It is noteworthy that even the total average daily census of the period is 0.726 hospitalizations/day. Both HWs and CWs showed higher average hospitalizations even though they represent shorter periods. In total, 36 CWs and 69 HWs were recorded.
The CWs showed three years with hospitalizations above the total average of the studied period (0.726 hospitalizations/day). These were 2013 (0.772 hospitalizations/day), 2016 (0.893 hospitalizations/day), and 2017 (1235 hospitalizations/day). As for late responses, when up to seven days after the end of the CW was considered, 166 hospitalizations were found in 2012, which generated an average hospitalization rate of 0.783 hospitalizations/day. After the end of the waves, there was a greater correspondence to the cold response.

3.3. Hospitalizations during Representative Cold Waves

CWs had a higher number of occurrences in 2013 (9), and the longest wave lasted 11 days and had eight hospitalizations. The shortest CW lasted three days (and occurred three times) with 1, 0, and 4 hospitalizations during each CW, respectively. 2015 and 2017 had the lowest number of waves (four waves each). Figure 4 shows the most representative CW for each year from 2012 to 2017. Hospitalizations during the most representative waves (average hospitalization rate) for each year were analyzed.
The first CW selected occurred between 11 July 2012 and 20 July 2012 (Figure 4A), its lowest Tamin and highest Tamax varied between 2.2 °C and 23.0 °C, and there were 12 hospitalizations (1.2 hospitalizations/day); another four hospitalizations occurred in the days after the wave (2.0 hospitalizations/day). The second CW selected (Figure 4B), between 15 July 2013 to 17 July 2013, had absolute Tamin and Tamax values of 5 °C and 26.4 °C, respectively, and involved four hospitalizations (1.33 hospitalizations/day). Notably, the occurrence of a new wave (19 July 2013 to 29 July 2013) two days after the end of the most representative wave, at a duration of 12 days, had eight hospitalizations (0.73 hospitalizations/day). For this reason, the 2013 chart (Figure 4B) represents the two waves.
In 2014 (Figure 4C), the CW that occurred between 27 May 2014 and 29 May 2014 had absolute Tamin and Tamax of 4.4 °C and 21.4 °C, respectively, and there were two hospitalizations (0.67 hospitalizations/day); another six hospitalizations were counted in the days after the wave (0.85 hospitalizations/day). In 2015, the fourth CW (Figure 4D) evaluated was 11 September 2015 and 14 September 2015, during which the absolute temperatures ranged between 1.0 °C and 26.4 °C, and there were two hospitalizations (0.5 hospitalizations/day); another four hospitalizations occurred in the days after the end of the wave (0.57 hospitalizations/day).
The fifth most representative CW (22 August 2016 to 24 August 2016) registered a Tamax and Tamin of 2.0 °C and 25.2 °C, respectively, (Figure 4E), in which there were no hospitalizations during the three days of the study. However, there were 17 hospitalizations in the seven days after the end of this wave (2.43 hospitalizations/day). The last CW analyzed was a wave that occurred in 2017 between 1 July 2017 and 3 July 2017 (Figure 5F) where the lowest Tamin and highest Tamax varied between 6.2 °C and 18.8 °C, and six hospitalizations occurred (2.0 hospitalizations/day); 11 hospitalizations occurred in the days after the wave (1.57 hospitalizations/day).

3.4. Hospitalizations during Representative Heat Waves

HWs occurred in greater numbers than CWs, being recorded 69 times altogether. The total number of waves, hospitalizations, hospitalization rates, and the HWs with the greatest representativeness for hospitalizations due to heart diseases from 2012 to 2017 can be seen in Figure 5.
The first HW analyzed occurred between the dates 28 June 2012 and 1 July 2012 (Figure 5A), its lowest Tamin and highest Tamax varied between 19.6 °C and 30.2 °C, and 12 hospitalizations were registered (2.4 hospitalizations/day); another four hospitalizations occurred in the days after the wave (1.4 hospitalizations/day). The second HW selected (22 January 2013 and 25 January 2013) (Figure 5B), had a lowest and highest absolute Ta of 18.2 °C and 35.4 °C, respectively, and there were eight hospitalizations (2.0 hospitalizations/day); another five hospitalizations occurred in the days after the wave (1.66 hospitalizations/day).
In 2014, between 21 February 2014 and 24 February 2014, the third HW was recorded (Figure 5C), its absolute Tamin and Tamax varied between 20.4 °C and 32.8 °C, respectively, and there were four hospitalizations (1.5 hospitalizations/day) during the wave; six hospitalizations occurred in the days following the wave (0.85 hospitalizations/day). In 2015, the fourth HW was between the dates 3 December and 12 December (Figure 5D), the lowest Tamin and highest Tamax varied between 19.2 °C and 30.4 °C, respectively, and there were four hospitalizations (1.33 hospitalizations/day); six hospitalizations occurred in the days after the wave (0.85 hospitalizations/day).
In the fifth HW selected (Figure 5E), (13 April 2016 to 19 April 2016), the Tamin and highest Tamax varied between 18.8 °C and 36.4 °C, respectively, and there were eight hospitalizations (1.14 hospitalizations/day); 10 hospitalizations occurred in the following days (1.42 hospitalizations/day). In the sixth HW analyzed (27 December 2017 to 31 December 2017), the absolute Ta varied between 20.4 °C and 33.6 °C, respectively, and 12 hospitalizations were registered (2.4 hospitalizations/day). In this wave, it was not possible to analyze the subsequent days because a database was not available for 2018 (Figure 5F).

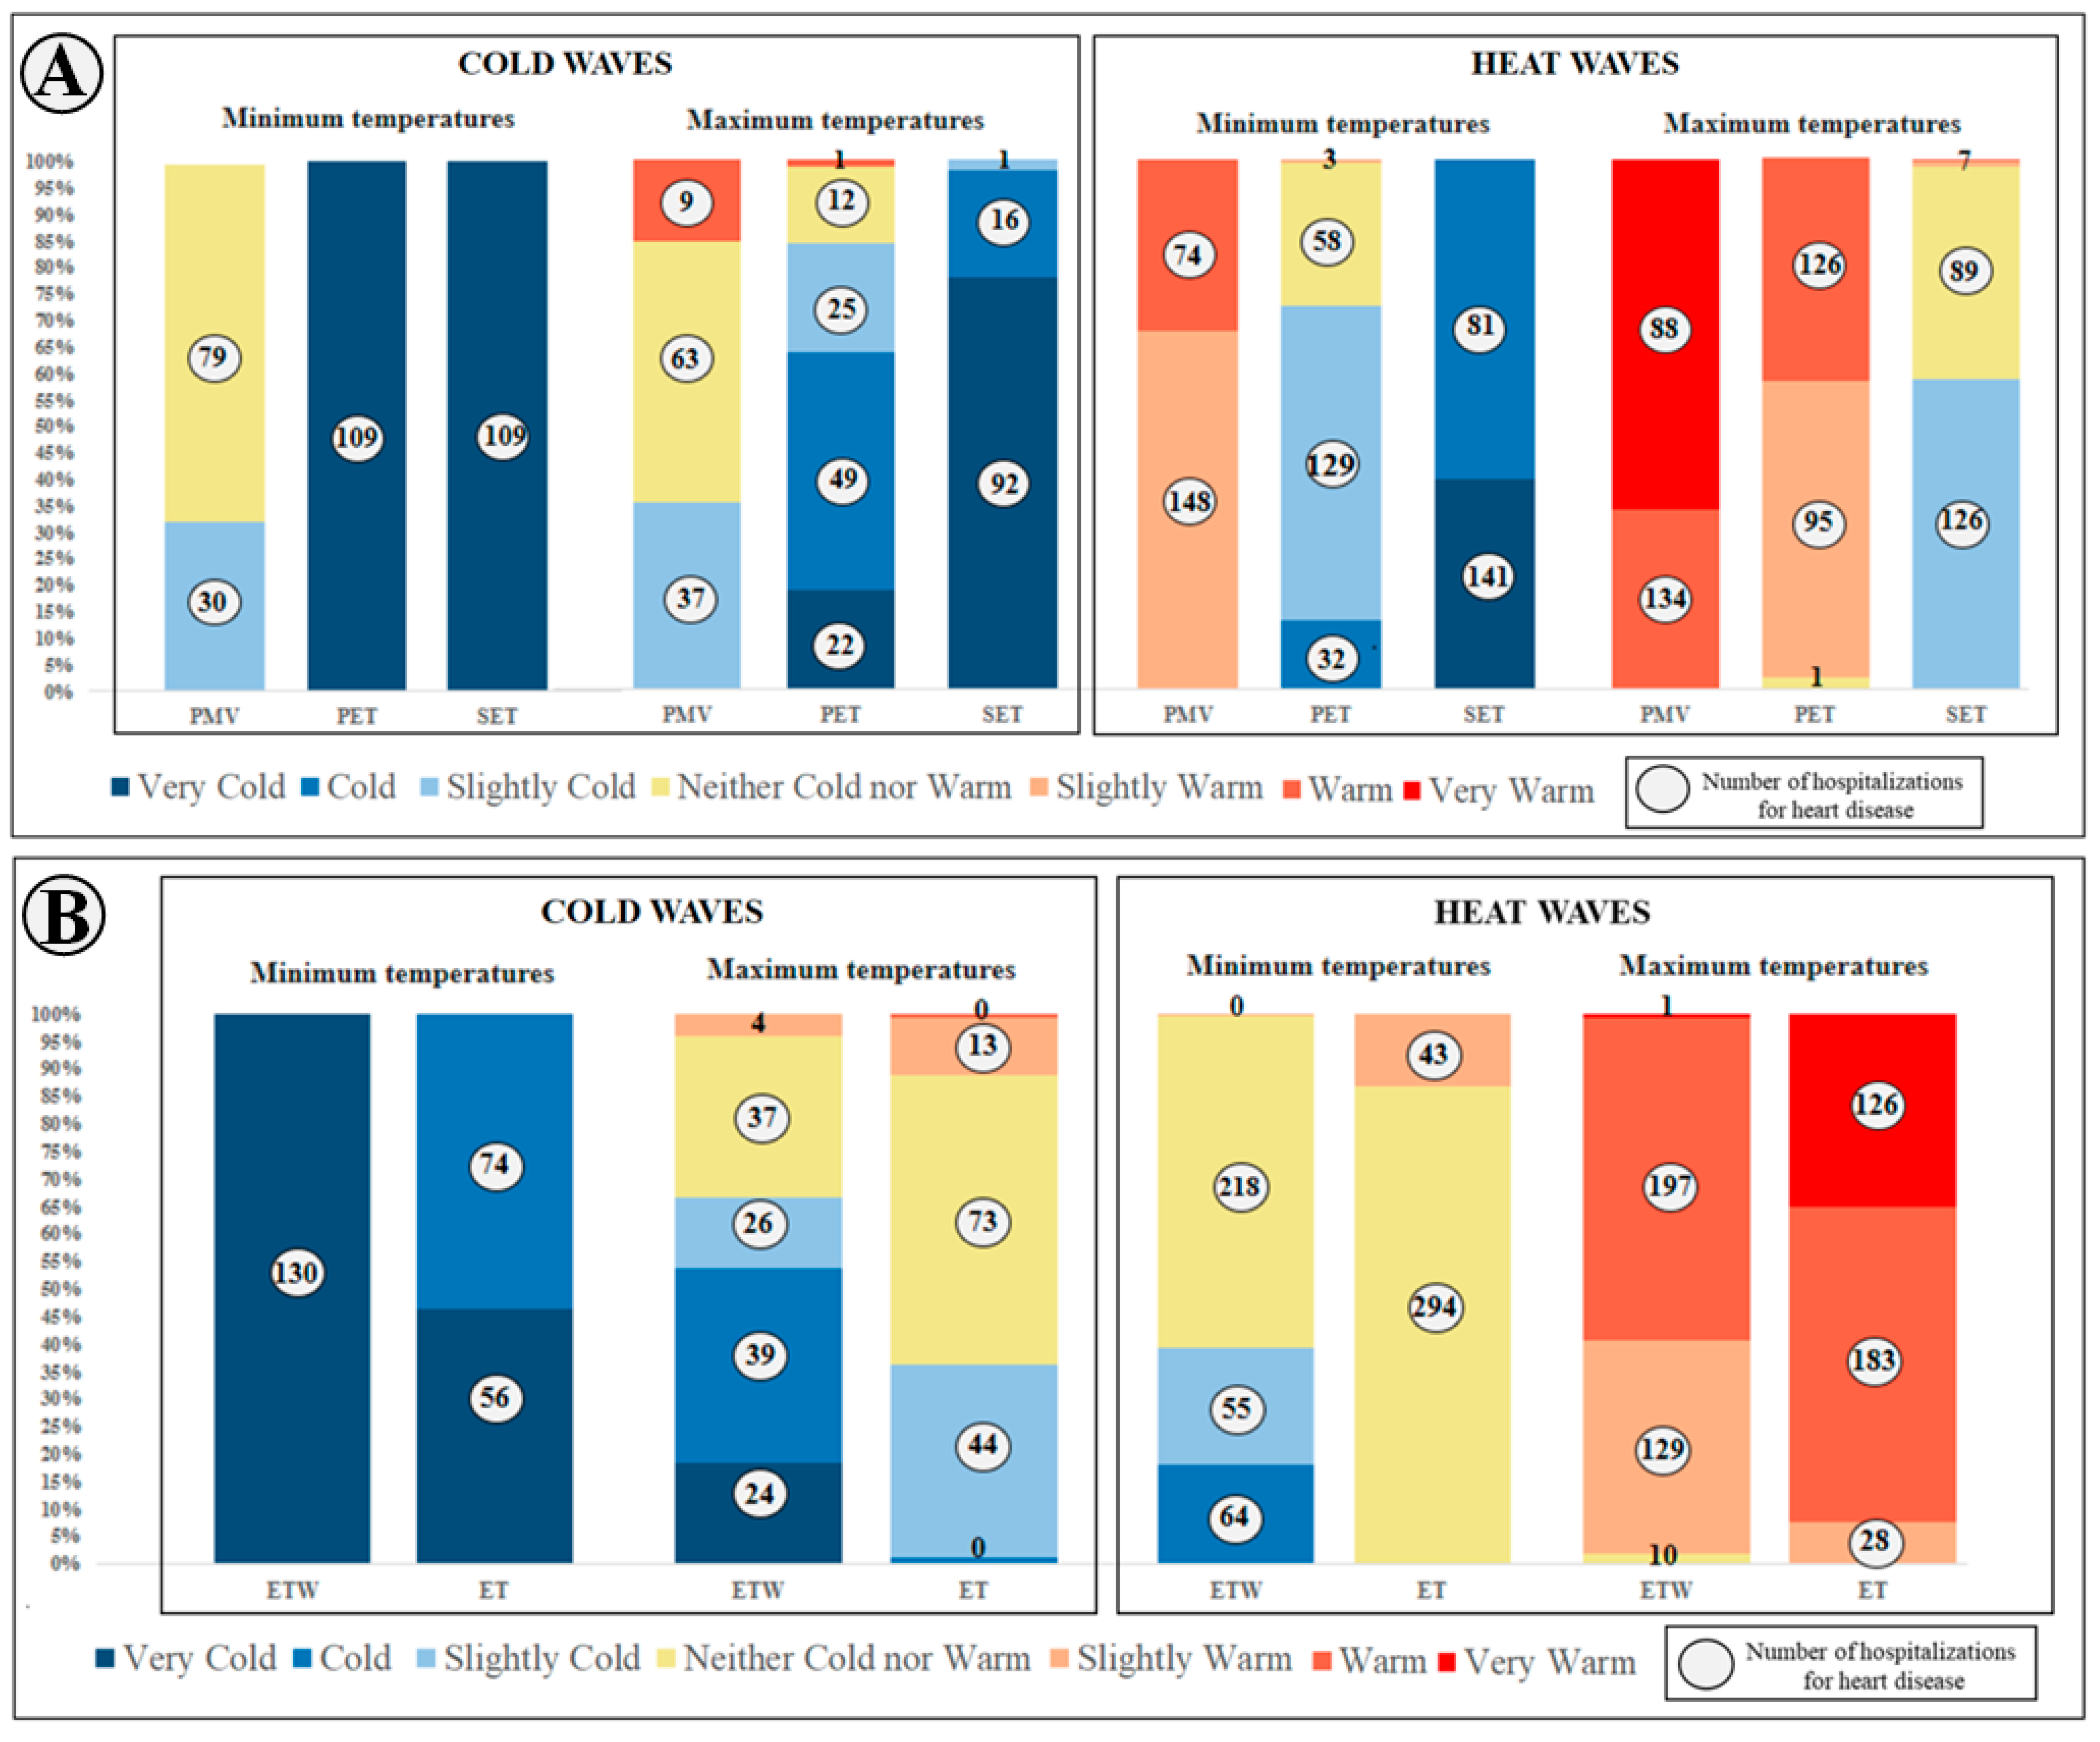
3.5. Hospitalizations and Human Thermal Comfort Indices during Cold and Heat Waves

Data on Sr at the weather station were lacking (missing) for the period analyzed for the PMV, PET, and SET indices from 1 January 2012 to 6 December 2016 (a total of 1802 days). The total number of days under the control of CWs in the period was 156 (8.65% of the period), and 109 hospitalizations occurred that were associated with these dates (0.7 hospitalizations/day). HWs totaled 345 days (19.15% of the period), and 222 hospitalizations were recorded on these days (0.6 hospitalizations/day). In total, 27.80% of the period was affected by either a CW or a HW.
The ETW and ET indices were calculated for the entire period (2012 to 2017—A total of 2192 days). CWs were observed in 173 days (7.90% of the days in the period), and 130 hospitalizations were recorded (0.7 hospitalizations/day). HWs occurred in 444 days (20.25% of the days in the period), and 337 hospitalizations for urgent heart diseases were recorded (0.8 hospitalizations/day).
In Figure 6, hospitalizations are presented in terms of the PMV, PET, SET, ETW, and ET comfort indices (ranges according to Table 1) recorded during the CWs and HWs.
In the CWs (Figure 6A), the thermal discomfort related to the Tamin values was within the ‘Very Cold’ stress range for the PET and SET indices in all occurrences of hospitalizations. For Tamax values, thermal discomfort for the PET and SET indices was in the ‘Very Cold’ and ‘Cold’ ranges for most hospitalizations.
The Tamin values during HWs (Figure 6B) registered discomfort for heat in the PMV index. The ‘Slightly Warm’ range accounted for 66.7% of hospitalizations and that of the ‘Warm’ range was 33.7%. The SET index showed discomfort in the ‘Very Cold’ and ‘Cold’ ranges with 63.5% and 36.5% of hospitalizations, respectively. The discomfort for heat was more representative in the PMV and PET indices for Tamax, with more hospitalizations being recorded during the ‘Warm’ and ‘Very Warm’ ranges.
The testing associations performed according to the proposed methodology, using Ta data, are represented for the Tamin values in Figure 7. Tests were performed using meteorological data on air humidity, but the results were not statistically satisfactory.

3.6. Distributed Nonlinear Lag Models Analysis

The testing associations performed according to the proposed methodology, using Ta data, are represented for the Tamin values in Figure 7. Tests were conducted using meteorological data on air humidity, but the results were not statistically satisfactory.
The Tamin values (Figure 7A) show, considering their lower value, a rapid association with the level of hospitalization in the first five days after their occurrence, and the Relative Risk (RR) decreases with the passage of days. The responses to hospital admissions, considering the Tamin values, presented a higher RR after 17 days.
Assessing the Tamin values, their highest values (30.0 °C) were revealed to be a risk factor in hospitalizations with up to 15 days of time lag. However, lower values of Tamin proved to be a protective factor in hospitalizations with up to 17 days lag. After this period, there was a significant RR of up to 21 days. The DLMN model showed that the Tamin of 15.0 °C was the one that registered the lowest number of hospitalizations.
Regarding the Tamax values (Figure 7B), their lower values were proven to have an acute effect on hospitalizations for CVDs: in the first four days after their occurrences, the RR was 50% higher for temperatures of 10.0 °C, and the highest Tamax values (around 40.0 °C) presented a significant relative risk after 15 days of lag.
The highest Tamin values and the lowest Tamax values obtained the highest RR. Therefore, it was necessary to evaluate the Taavg value and observe whether the behavior of the extreme values was the most significant. Regarding the average Ta values (Figure 7C), the highest values showed a significant RR for hospitalizations in the first five days (acute effect). The Tamin showed a significant RR with a response above 20 days. RR was calculated during CWs and HWs; however, no valid statistical relationship was found.

4. Discussion

This research constitutes a first approach in southern Brazil, where no research of this nature using the data presented has previously been undertaken. The most similar research was conducted in São Paulo, in southeastern Brazil [20].
The average hospitalization rates in winter (0.775 hospitalizations/day) were higher than the rates of all other seasons, including the total hospitalization rate for the period studied (0.726 hospitalizations/day). Morbidities due to CVDs, as shown in the literature, are related to low temperatures [5,6,7,12,16], which in turn also tend to occur in the seasonal winter period.
This is because in the central region of Rio Grande do Sul, as well as in the entire state, temperatures on winter days tend to decrease significantly and are often close to 0.0 °C [27,28]. This seasonal condition and temperature variability make it possible for the bioclimatic events associated with CVDs to be a risk factor for the population of Rio Grande do Sul. Similarly, mortality from general illness in Hong Kong has been found to have negative results due to both hot and cold temperatures [69]. In the current study, CWs and HWs were shown, within the variability of the Tamin and Tamax, to be related to peaks and higher average frequencies of hospitalizations within the periods of occurrence of the anomalies. In this sense, the frequencies of hospitalizations (0.751 for CW and 0.761 for HW) were higher than on days without anomalies (normal days). In southern Brazil, there is a large annual temperature fluctuation that sometimes causes HWs in the hottest months and CWs in the coldest months [27,28].
The results of the DLNMs indicated that the relative risks (RR) of the Tamin, average and Tamax values, and their effects on hospitalizations in Santa Maria, represented differences in lags: for CWs, 7 to 10 days; for HWs, 14 to 18 days; and on normal days, up to 21 days of lag. The 21-day lag was used because the model demonstrated that the use of this lag was more suitable for the research, as tests with the model were previously performed using other time/day intervals, and the 21-day lag was more accurate. The heat has been found to have an acute effect on hospitalizations in the analysis of the Tamin and average Taavg. This behavior has been observed in other studies [20,42,63,70,71,72]. The Tamin values were more associated with the number of hospitalizations for CVDs, and these results differ from those found in southwestern Brazil [20].
A higher Taavg offers more risk than a lower Taavg to the population in Santa Maria. The population is accustomed and acclimated to lower Ta values because the southern latitudes of the country are more frequently impacted by polar air masses and cold fronts coming from the south pole when compared to the city of São Paulo [20,28,73], which is a tropical city.
In a study of the Czech Republic [9], other thermal indices, such as the universal thermal climate index (UTCI) and apparent temperature (AT), were used to identify days with heat and cold stress. In metropolitan areas of the Iberic Peninsula [11], such as Lisbon and Barcelona, 53% of the hospitalizations occurred during the cold periods when relationships with UTCI, AT, and net effective temperature (NET) were made, including air pollution data.
Some limitations of the current study are related to the difficulty of collecting more accurate data, both health and climatic information. However, these possible flaws in the data modeling are secondary and beyond the researcher’s purview, as observed in the data on heatstroke. Access to health data are limited by Brazilian health institutions, so it was not possible to carry out a retrospective study.
The absence of socioeconomic information was another limiting factor, as it would be useful to relate this to hospitalization and climate data. Events related to CWs, in addition to the climatological influence itself, and exploring the association between these events and the socioeconomic aspects and vulnerability of affected populations, can be carried out using indices previously developed for this purpose, such as the urban adaptation index (UAI) [74]. This index has been developed for São Paulo but is not yet calibrated for subtropical climate conditions in Brazil.
Bioclimatic investigations are important, as they can inform a heat-health action plan, as has been the case in countries where such research is customary [75]. In Germany, a heat monitoring and health alert system was created that generates alerts automatically [37]. In the future, it would be desirable for Brazil to invest in such initiatives. The findings of this research serve as a first approach to the discussion of thermal indices and cardiovascular morbidities in the study area. It is hoped that Brazilian researchers will conduct further studies on this topic.

5. Limitations

Limitations in the acquisition of hospitalization data are still a major bottleneck for the development of research of this nature in Brazil. Due to inherent sensitivity and ethical considerations, hospitalization data are difficult to obtain. The lack of information on the cases of hospitalizations on digital platforms is another obstacle that hinders research efforts. However, the use of thermal comfort indices related to medical data allowed the research to achieve good results for a first approach. Climate data can be easily acquired, although it is from only one meteorological station of records on a regional scale. It is noted that a larger network of stations should be used in future studies. There is a project under development by the same research group in the study area, which foresees the installation of more stations.

6. Conclusions

Regarding climate data, unfortunately, the network of weather stations in Brazil does not adequately cover the entire national territory, meaning there are many gaps in climate data for local investigations. However, the weather station in Santa Maria is one of the oldest in Brazil, with data dating back to 1912, making it a useful reference in southern Brazil. As the research respected the limit adopted by the World Meteorological Organization, that a station can cover an area with a radius of up to 100 km if there are no other data sources [76], the reliability of the data from the weather station can be guaranteed.
Briefly, recommendations for further study include the insertion of the study of air pollution, which is rarely used in Brazilian climatology studies. In addition, the analysis of the monthly temporal evolution will allow the identification of the seasonal variation of air pollution in the study area to identify the role of prevailing atmospheric systems and the weight of anthropogenic contributions in each season of the year. Pollutants data, unfortunately, are even more difficult to access in Brazil than hospitalization data.
However, this type of study is recommended when data are available, even on a regional climate scale, since, in the winter period, biomass burning can play a highly relevant role. Comparing the spatial distribution of pollution with atmospheric variables on an intra-urban scale, for example, could elucidate the importance of local ventilation conditions in the concentration or dispersion of pollutants, as these are strongly influenced by the configuration of the built environment in the vicinity of the monitoring point. Additional thermal comfort indices also deserve to be explored, such as UTCI, AT, and NET.
Future research should emphasize the spatial association between the hospital’s reference address, socioeconomic standards, and the degree of vulnerability to which they are exposed, depending on the location of their neighborhood, district, or municipality. The use of GIS, such as GeoDA, spatial autocorrelation models, such as Moran, and the local indicator of spatial association (LISA) [74] is suggested.
It is important to note that this study is novel for southern Brazil. Measures and adaptation strategies to counter thermal (dis)comfort [47], which can contribute to situations that lead people to develop heart attacks, are still non-existent in Brazil. This study only fills the preliminary gap, representing a first approach to the subject.
Finally, the great technical, methodological, and technological relevance of this research is to produce results capable of promoting an improvement in the geographic space through the development of documents that can be effectively used by the government to inform the environmental planning of cities and regions.

Author Contributions

Conceptualization, C.A.W. and J.P.A.G.; methodology, C.A.W., J.P.A.G. and P.V.I.; software, I.T.C. and P.V.I.; validation, I.T.C. and P.V.I.; formal analysis, S.S. and A.M.; investigation, I.T.C.; resources, C.A.W. and S.S.; data curation, I.T.C. and P.V.I.; writing—original draft preparation, I.T.C. and C.A.W.; writing—review and editing, S.S. and A.M.; visualization, S.S. and A.M.; supervision, C.A.W., J.P.A.G., S.S. and A.M.; project administration, C.A.W.; funding acquisition, C.A.W. and S.S. All authors have read and agreed to the published version of the manuscript.

Funding

This work was carried out with the support of the Coordination for the Improvement of Higher Education Personnel—Brazil (CAPES)—Financing Code 001.

Institutional Review Board Statement

Not applicable.

Informed Consent Statement

Not applicable.

Data Availability Statement

Not applicable.

Conflicts of Interest

The authors declare no conflict of interest.

References

  1. Schlegel, I.; Muthers, S.; Mücke, H.G.; Matzarakis, A. Comparison of Respiratory and Ischemic Heart Mortalities and their Relationship to the Thermal Environment. Atmosphere 2020, 11, 826. [Google Scholar] [CrossRef]
  2. Mendis, S.; Puska, P.; Norrving, B. Global Atlas on Cardiovascular Disease Prevention and Control; World Health Organization: Geneva, Switzerland, 2011. [Google Scholar]
  3. Marques, L.P.; Confortin, S.C. Doenças do aparelho circulatório: Principal causa de internações de idosos no Brasil entre 2003 e 2012. Rev. Bras. Ciênc. Saúde 2015, 19, 83–90. [Google Scholar] [CrossRef] [Green Version]
  4. World Health Organization. Global Health Risks: Mortality and Burden of Disease Attributable to Selected Major Risks; World Health Organization: Geneva, Switzerland, 2009. [Google Scholar]
  5. Ornato, J.P.; Peberdy, M.A.; Chandra, N.C.; Bush, D.E. Seasonal pattern of acute myocardial infarction in the National Registry of Myocardial Infarction. J. Am. Coll. Cardiol. 1996, 28, 1684–1688. [Google Scholar] [CrossRef] [Green Version]
  6. Manfredini, R.; Manfredini, F.; Boari, B.; Bergami, E.; Mari, E.; Gamberini, S.; Gallerani, M. Seasonal and weekly patterns of hospital admissions for nonfatal and fatal myocardial infarction. Am. J. Emerg. Med. 2009, 27, 1097–1103. [Google Scholar] [CrossRef] [PubMed]
  7. Abrignani, M.G.; Corrao, S.; Biondo, G.B.; Renda, N.; Braschi, A.; Novo, G. Influence of climatic variables on acute myocardial infarction hospital admissions. Int. J. Cardiol. 2009, 137, 123–129. [Google Scholar] [CrossRef] [PubMed]
  8. Conlon, K.C.; Rajkovich, N.B.; White-Newsome, J.L.; Larsen, L.; O’Neill, M.S. Preventing cold-related morbidity and mortality in a changing climate. Maturitas 2011, 69, 197–202. [Google Scholar] [CrossRef] [Green Version]
  9. Urban, A.; Kyselý, J. Comparison of UTCI with other thermal indices in the assessment of heat and cold effects on cardiovascular mortality in the Czech Republic. Int. J. Environ. Res. Public Health 2014, 11, 952–967. [Google Scholar] [CrossRef] [PubMed] [Green Version]
  10. Gronlund, C.J.; Sullivan, K.P.; Kefelegn, Y.; Cameron, L.; O’Neill, M.S. Climate change and temperature extremes: A review of heat-and cold-related morbidity and mortality concerns of municipalities. Maturitas 2018, 14, 54–59. [Google Scholar] [CrossRef]
  11. Santurtún, A.; Almendra, R.; Fdez-Arroyabe, P.; Sanchez-Lorenzo, A.; Royé, D.; Zarrabeitia, M.T.; Santana, P. Predictive value of three thermal comfort indices in low temperatures on cardiovascular morbidity in the Iberian peninsula. Sci. Total Environ. 2020, 729, 138969. [Google Scholar] [CrossRef]
  12. Fares, A. Winter cardiovascular diseases phenomenon. N. Am. J. Med. Sci. 2013, 5, 266. [Google Scholar] [CrossRef] [Green Version]
  13. Group, T.E. Cold exposure and winter mortality from ischaemic heart disease, cerebrovascular disease, respiratory disease, and all causes in warm and cold regions of Europe. Lancet 1997, 349, 1341–1346. [Google Scholar]
  14. Barnett, A.G.; Dobson, A.J.; McElduff, P.; Salomaa, V.; Kuulasmaa, K.; Sans, S. Cold periods and coronary events: An analysis of populations worldwide. J. Epidemiol. Community Health 2005, 59, 551–557. [Google Scholar] [CrossRef] [Green Version]
  15. Fischer, T.; Lundbye-Christensen, S.; Johnsen, S.P.; Schønheyder, H.C.; Sørensen, H.T. Secular trends and seasonality in first-time hospitalization for acute myocardial infarction—A Danish population-based study. Int. J. Cardiol. 2004, 97, 425–431. [Google Scholar] [CrossRef]
  16. Achebak, H.; Devolder, D.; Ingole, V.; Ballester, J. Reversal of the seasonality of temperature-attributable mortality from respiratory diseases in Spain. Nat. Commun. 2020, 11, 2457. [Google Scholar] [CrossRef]
  17. Pimentel, M.; Grüdtner, L.; Zimerman, L.I. Seasonal variation of ventricular tachycardia registered in 24-hour Holter monitoring. Arq. Bras. Cardiol. 2006, 87, 403–406. [Google Scholar] [CrossRef] [PubMed] [Green Version]
  18. Jorge, J.E.L.; Cagy, M.; Mesquita, E.T.; Da Costa, T.L.; Moscavitch, S.D.; Rosa, M.L.G. Seasonal variation in hospitalizations due to heart failure in Niterói city, Southeastern Brazil. Rev. Saude Publica 2009, 43, 555–557. [Google Scholar] [CrossRef]
  19. Godoy, H.L.; Silveira, J.A.; Segalla, E.; Almeida, D.R. Hospitalization and mortality rates for heart failure in public hospitals in São Paulo. Arq. Bras. Cardiol. 2011, 97, 402–407. [Google Scholar] [CrossRef] [Green Version]
  20. Ikefuti, P.V.; Barrozo, L.V.; Braga, A.L. Mean air temperature as a risk factor for stroke mortality in São Paulo, Brazil. Int. J. Biometeorol. 2018, 62, 1535–1542. [Google Scholar] [CrossRef] [PubMed]
  21. Kovats, R.S.; Kristie, L.E. Heatwaves and public health in Europe. Eur. J. Public Health 2006, 16, 592–599. [Google Scholar] [CrossRef] [Green Version]
  22. Basu, R. High ambient temperature and mortality: A review of epidemiologic studies from 2001 to 2008. Environ. Health 2009, 8, 40. [Google Scholar] [CrossRef] [Green Version]
  23. Shevchenko, O.; Lee, H.; Snizhko, S.; Mayer, H. Long-term analysis of heat waves in Ukraine. Int. J. Climatol. 2014, 34, 1642–1650. [Google Scholar] [CrossRef]
  24. Anthes, R.A.; Panofsky, H.A.; Cahir, J.J.; Rango, A. The Atmosphere; Charles, E., Ed.; Merrill Publishing Company: Columbus, OH, USA, 1975. [Google Scholar]
  25. Kim, Y.M.; Kim, S.; Cheong, H.K.; Kim, E.H. Comparison of temperature indices for the impact assessment of heat stress on heat-related mortality. Environ. Health Toxicol. 2011, 26, e2011009. [Google Scholar] [CrossRef]
  26. Royé, D.; Zarrabeitia, M.T.; Riancho, J.; Santurtún, A. A time series analysis of the relationship between apparent temperature, air pollutants and ischemic stroke in Madrid, Spain. Environ. Res. 2019, 173, 349–358. [Google Scholar] [CrossRef]
  27. Machado, F. P Contribuição ao Estudo do Clima do Rio Grande do Sul; Serviço Geográfico do IBGE: Rio de Janeiro, Brazil, 1950. [Google Scholar]
  28. Sartori, M.D.G.B. A dinâmica do clima do Rio Grande do Sul: Indução empírica e conhecimento científico. Terra Livre 2003, 20, 27–50. [Google Scholar]
  29. Bitencourt, D.P.; Fuentes, M.V.; Franke, A.E.; Silveira, R.B.; Alves, M.P. The climatology of cold and heat waves in Brazil from 1961 to 2016. Int. J. Climatol. 2020, 40, 2464–2478. [Google Scholar] [CrossRef]
  30. Folkerts, M.A.; Bröde, P.; Botzen, W.J.; Martinius, M.L.; Gerrett, N.; Harmsen, C.N.; Daanen, H.A. Long term adaptation to heat stress: Shifts in the minimum mortality temperature in the Netherlands. Front. Physiol. 2020, 11, 225. [Google Scholar] [CrossRef] [PubMed]
  31. ASHRAE. American Society for Heating Ventilating and Air-Conditioning Engineers; ASHRAE Fundamentals Handbook: New York, NY, USA, 2017. [Google Scholar]
  32. Chen, L.; Ng, E. Outdoor thermal comfort and outdoor activities: A review of research in the past decade. Cities 2012, 29, 118–125. [Google Scholar] [CrossRef]
  33. Fong, C.S.; Aghamohammadi, N.; Ramakreshnan, L.; Sulaiman, N. Holistic recommendations for future outdoor thermal comfort assessment in tropical Southeast Asia: A critical appraisal. Sustain. Cities Soc. 2019, 46, 101428. [Google Scholar] [CrossRef]
  34. Golden, J.S.; Hartz, D.; Brazel, A.; Luber, G.; Phelan, P. A biometeorology study of climate and heat-related morbidity in Phoenix from 2001 to 2006. Int. J. Biometeorol. 2008, 52, 471–480. [Google Scholar] [CrossRef]
  35. Aboubakri, O.; Khanjani, N.; Jahani, Y.; Bakhtiari, B. Thermal comfort and mortality in a dry region of Iran, Kerman; a 12-year time series analysis. Theor. Appl. Climatol. 2020, 139, 403–413. [Google Scholar] [CrossRef]
  36. Anderson, B.G.; Bell, M.L. Weather-Related Mortality: How Heat, Cold, and Heat Waves Affect Mortality in the United States. Epidemiology 2009, 20, 205–213. [Google Scholar] [CrossRef] [PubMed] [Green Version]
  37. Matzarakis, A.; Muthers, S.; Graw, K. Thermische Belastung von Bewohnern in Städten bei Hitzewellen am Beispiel von Freiburg (Breisgau). Bundesgesundheitsblatt-Gesundh.-Gesundh. 2020, 63, 1004–1012. [Google Scholar] [CrossRef] [PubMed]
  38. Brychkov, D.; Garb, Y.; Pearlmutter, D. The influence of climatocultural background on outdoor thermal perception. Int. J. Biometeorol. 2018, 62, 1873–1886. [Google Scholar] [CrossRef] [PubMed]
  39. Gosling, S.; Bryce, E.; Dixon, P.G.; Gabriel, K.A.; Gosling, E.; Hanes, J.; Hondula, D.L.; Liang, P.; Bustos, M.S.; Nascimento, S.; et al. A glossary for biometeorology. Int. J. Biometeorol. 2014, 58, 277–308. [Google Scholar] [CrossRef]
  40. Givoni, B.; Noguchi, M.; Saaroni, H.; Pochter, O.; Yaacov, Y.; Feller, N.; Becker, S. Outdoor comfort research issues. Energy Build. 2003, 35, 77–86. [Google Scholar] [CrossRef]
  41. Nikolopoulou, M.; Lykoudis, S. Thermal comfort in outdoor urban spaces: Analysis across different European countries. Build. Environ. 2006, 41, 1455–1470. [Google Scholar] [CrossRef] [Green Version]
  42. Lim, Y.-H.; Kim, H.; Hong, Y.-C. Variation in mortality of ischemic and hemorrhagic strokes in relation to high temperature. Int. J. Biometeorol. 2013, 57, 145–153. [Google Scholar] [CrossRef]
  43. Ormandy, D.; Ezratty, V. Health and thermal comfort: From WHO guidance to housing strategies. Energy Policy 2012, 49, 116–121. [Google Scholar] [CrossRef]
  44. Martinelli, L.; Matzarakis, A. Andreas. Influence of height/width proportions on the thermal comfort of courtyard typology for Italian climate zones. Sustain. Cities Soc. 2017, 29, 97–106. [Google Scholar] [CrossRef]
  45. Jowkar, M.; De Dear, R.; Brusey, J. Influence of long-term thermal history on thermal comfort and preference. Energy Build. 2020, 210, 109685. [Google Scholar] [CrossRef]
  46. Alvares, C.A.; Stape, J.L.; Sentelhas, P.C.; Gonçalves, J.D.M.; Sparovek, G. Köppen’s climate classification map for Brazil. Meteorol. Z. 2013, 22, 711–728. [Google Scholar] [CrossRef]
  47. Shooshtarian, S.; Rajagopalan, P.; Sagoo, A. comprehensive review of thermal adaptive strategies in outdoor spaces. Sustain. Cities Soc. 2018, 41, 647–665. [Google Scholar] [CrossRef]
  48. Brasil. Ministério da Saúde. Secretaria de Atenção à Saúde. Portaria nº 123, de 28 de Fevereiro de 2005. Atualiza as Normas Para Organização das Redes de Atenção em Alta Complexidade Cardiovascular, Assim Como Inclui Procedimentos de Órteses, Próteses e Materiais Referentes À Assistência Cardiovascular na Tabela do SIH/SUS. Brasília, DF. 2005. Available online: http://adcon.rn.gov.br/ACERVO/Suvisa/doc/DOC000000000024879.PDF (accessed on 1 October 2021).
  49. Köppen, W. Climatologia; Fondo de Cultura Económica: México City, Mexico, 1931; Volume 2. [Google Scholar]
  50. Sartori, M.G.B.O. Vento Norte, 1st ed.; DR Publicidade: Santa Maria, RS, Brazil, 2016; 256p. [Google Scholar]
  51. Rossato, P.S.; Sartori, M.G.B.; Missio, L.R. As ondas de calor na região central do RS entre os meses de maio a outubro. In Simpósio Brasileiro de Geografia Física Aplicada; SBGFA: São Paulo, Brazil, 2003; Volume 10. [Google Scholar]
  52. Gobo, J.P.A.; Galvani, E.; Wollmann, C.A.; Gonçalves, F.L.T. Calibração das Faixas de Conforto Térmico Humano para Espaços Abertos em Clima Subtropical. Rev. Do Dep. Geogr. 2018, 1, 129–139. [Google Scholar] [CrossRef] [Green Version]
  53. Costa, E.R.; Sartori, M.G.B.; Almeida, A.P. Gênese e ocorrência de ondas de frio na região de Santa Maria-RS: Análise do período de 1968 a 2007. Rev. Geogr. Ensino Pesqui. St. Maria 2008, 12, 811–820. [Google Scholar]
  54. Brasil. Ministério da Saúde. Secretaria de Assistência à Saúde. Departamento de Sistemas e Redes Assistenciais. In Padronização da Nomenclatura do Censo Hospitalar; Ministério da Saúde: Brasília, Brazil, 2002.
  55. Mayer, H.; Höppe, P. Thermal comfort of man in different urban environments. Theor. Appl. Climatol. 1987, 38, 43–49. [Google Scholar] [CrossRef]
  56. Höppe, P. The physiological equivalent temperature–a universal index for the biometeorological assessment of the thermal environment. Int. J. Biometeorol. 1999, 43, 71–75. [Google Scholar] [CrossRef]
  57. Gagge, A.P.; Stolwijk, J.A.; Nishi, Y. An effective temperature scale based on a simple model of human physiological regulatory response. Mem. Fac. Eng. Hokkaido Univ. 1972, 13, 21–36. [Google Scholar]
  58. Fanger, P.O. Thermal Comfort; McGraw-Hill Book Company: New York, NY, USA, 1970. [Google Scholar]
  59. Gobo, J.P.A.; Galvani, E.; Wollmann, C.A. Subjective Human Perception of Open Urban Spaces in the Brazilian Subtropical Climate: A First Approach. Climate 2018, 6, 24. [Google Scholar] [CrossRef] [Green Version]
  60. Suping, Z.; Guanglin, M.; Yanwen, W.; Ji, L. Study of the relationships between weather conditions and the marathon race, and of meteorotropic effects on distance runners. Int. J. Biometeorol. 1992, 36, 63–68. [Google Scholar] [CrossRef]
  61. Matzarakis, A. Climate Change: Temporal and spatial dimension of adaptation possibilities at regional and local scale. In Tourism and the Implications of Climate Change: Issues and Actions; Schott, C., Ed.; Emerald Group Publishing: Bingley, UK, 2010; Volume 3, pp. 237–259. [Google Scholar]
  62. Matzarakis, A.; Rutz, F.; Mayer, H. Modelling radiation fluxes in simple and complex environments—Application of the RayMan model. Int. J. Biometeorol. 2007, 51, 323–334. [Google Scholar] [CrossRef]
  63. Gasparrini, A. Statistical Methods in Studies on Temperature-Health Associations. Ph.D. Thesis, London School of Hygiene & Tropical Medicine, London, UK, 2011. [Google Scholar] [CrossRef]
  64. Gao, J.; Sun, Y.; Liu, Q.; Zhou, M.; Lu, Y.; Li, L. Impact of extreme high temperature on mortality and regional level definition of heat wave: A multi-city study in China. Sci. Total Environ. 2015, 505, 535–544. [Google Scholar] [CrossRef]
  65. Sherbakov, T.; Malig, B.; Guirguis, K.; Gershunov, A.; Basu, R. Ambient temperature and added heat wave effects on hospitalizations in California from 1999 to 2009. Environ. Res. 2018, 160, 83–90. [Google Scholar] [CrossRef]
  66. Fu, S.H.; Gasparrini, A.; Rodriguez, P.S.; Jha, P. Mortality attributable to hot and cold ambient temperatures in India: A nationally representative case-crossover study. PLoS Med. 2018, 15, e1002619. [Google Scholar] [CrossRef] [PubMed]
  67. Dang, T.N.; Honda, Y.; Van Do, D.; Pham, A.L.T.; Chu, C.; Huang, C.; Phung, D. Effects of extreme temperatures on mortality and hospitalization in Ho Chi Minh City, Vietnam. Int. J. Environ. Res. Public Health 2019, 16, 432. [Google Scholar] [CrossRef] [Green Version]
  68. Aklilu, D.; Wang, T.; Amsalu, E.; Feng, W.; Li, Z.; Li, X.; Tao, L.; Luo, Y.; Guo, M.; Liu, X.; et al. Short-term effects of extreme temperatures on cause specific cardiovascular admissions in Beijing, China. Environ. Res. 2020, 186, 109455. [Google Scholar] [CrossRef] [PubMed]
  69. Liu, J.; Hansen, A.; Varghese, B.; Liu, Z.; Tong, M.; Qiu, H.; Bi, P. Cause-specific mortality attributable to cold and hot ambient temperatures in Hong Kong: A time-series study, 2006–2016. Sustain. Cities Soc. 2020, 57, 102131. [Google Scholar] [CrossRef]
  70. Rothwell, P.M.; Wroe, S.J.; Slattery, J.; Warlow, C.P. On behalf of the Oxfordshire Community Stroke Project. Is stroke related to season or temperature. Lancet 1996, 347, 934–936. [Google Scholar] [CrossRef]
  71. Wang, X.Y.; Barnett, A.G.; Hu, W.; Tong, S. Temperature variation and emergency hospital admissions for stroke in Brisbane, Australia, 1996–2005. Int. J. Biometeorol. 2009, 53, 535–541. [Google Scholar] [CrossRef] [PubMed] [Green Version]
  72. Zanobetti, A.; O’Neill, M.S.; Gronlund, C.J.; Schwartz, J.D. Summer temperature variability and long-term survival among elderly people with chronic disease. Proc. Natl. Acad. Sci. USA 2012, 109, 6608–6613. [Google Scholar] [CrossRef] [Green Version]
  73. Abreu-Harbich, L.V.; Labaki, L.C.; Matzarakis, A. Thermal bioclimate in idealized urban street canyons in Campinas, Brazil. Theor. Appl. Climatol. 2014, 115, 333–340. [Google Scholar] [CrossRef]
  74. Neder, E.A.; de Araújo Moreira, F.; Dalla Fontana, M.; Torres, R.R.; Lapola, D.M.; da Penha Costa Vasconcellos, M.; Bedran-Martins, A.M.B.; Philippi, A., Jr.; Lemos, M.C.; Di Giulio, G.M. Urban adaptation index: Assessing cities readiness to deal with climate change. Clim. Chang. 2021, 166, 16. [Google Scholar] [CrossRef]
  75. Linares, C.; Díaz, J.; Negev, M.; Martínez, G.S.; Debono, R.; Paz, S. Impacts of climate change on the public health of the Mediterranean Basin population-current situation, projections, preparedness and adaptation. Environ. Res. 2020, 182, 109107. [Google Scholar] [CrossRef] [PubMed]
  76. World Meteorological Organization (WMO). Guide to the Global Observing System. 488; WMO: Geneva, Switzerland, 2010; Volume 172. [Google Scholar]
Figure 1. Location of the study area and an overview of HUSM.
Sustainability 13 12194 g001
Figure 2. Automatic weather station in Santa Maria.
Sustainability 13 12194 g002
Figure 3. The frequency distribution of seasonal hospitalization (total number and average rates).
Sustainability 13 12194 g003
Figure 4. Six most representative cold waves during the analyzed period.
Sustainability 13 12194 g004
Figure 5. Six most representative heat waves during the analyzed period.
Sustainability 13 12194 g005
Figure 6. (A) Frequency (%) of hospitalization for heart disease events for each track after interpreting the calibration indices PMV, PET, and SET with Tamin values during CWs and HWs. (B) Frequency of hospitalization for heart disease events for each track after interpreting the calibration indices ETW and TE for Tamin during CWs and HWs.
Sustainability 13 12194 g006
Figure 7. (A) Lag–response association at different Tamin; (B) lag–Response association at different Tamax; (C) lag–response association at different mean Ta values. All the results present show IC = 95%.
Sustainability 13 12194 g007
Table 1. Class ranges considered in each human thermal comfort index.
Gobo et al., 2018 [59]CategoriesGobo et al., 2018 [51]
PMVPETSETETWET
<−3.6<5<6Cold<7<4
−3.6 to −2.35 to 116 to 12Cool7 to 144 to 8
−2.3 to −1.011 to 1612 to 17Slightly cool14 to 158 to 15
−1.0 to 0.816 to 2417 to 23Neither cold nor hot15 to 2215 to 22
0.8 to 1.924 to 3023 to 29Slightly warm22 to 3822 to 23
1.9 to 3.530 to 3929 to 33Warm38 to 4623 to 26
>3.5>39>33Very warm>46>26
Table 2. Hospitalization rates during normal days and cold and hot waves.
DescriptionTotal DaysNo. HospitalizationHospitalizations/Day
Days without anomalies157511250.714
Heat waves4443370.759
Cold waves1731300.751
Total219215920.726
Publisher’s Note: MDPI stays neutral with regard to jurisdictional claims in published maps and institutional affiliations.

