1. Introduction
One of the key problems with which the rural settlements of Serbia entered the 21st century is depopulation [
1,
2]. The continuing trend of population losses requires a radical reorientation of public policies on key issues, such as changing the development strategy and emphasizing more balanced rural development [
3,
4,
5]. Despite the modest attempts to revitalize rural settlements through programs which encourage young families to return to the countryside, the weaker interest of political elites in the issue of rural sustainability in Serbia is still noticeable. In this context, research on well-being and satisfaction with living conditions in the countryside is also lacking.
The use of data on life satisfaction as a basic goal should show the quality of life in a country or in a social group. Thereby, the degree of a social problem is usually assessed, and possible interventions on the part of state services recommended. A high level of satisfaction suggests that quality of life is good. Low levels of satisfaction indicate serious shortcomings in the society [
6,
7].
The term Quality of Life includes and refers to the general condition of the individual and the state of society, which makes this modern phenomenon an extremely sensitive dimension difficult to measure. It is the degree or extent to which an individual is healthy, feels comfortable in his position and is able to participate in and attend events in his own environment. The term quality of life is ambiguous in itself, because it can refer simultaneously to the experience of an individual that is referenced by different life habits, and to the living conditions in which the individual finds himself. Thus, quality of life should not be equated with the notion of the standard of living, which is based primarily on income [
8,
9,
10,
11,
12,
13].
Well-being is defined as a positive physical, social, and mental state; it is not just the absence of pain, discomfort and incompetence. It arises not only from the actions of individuals, but also from a multitude of collective goods and relationships with other people. It requires that basic needs be met, that individuals have a sense of purpose, and that they feel capable of achieving important personal goals and of participating in society [
14,
15,
16].
Decision-makers are increasingly recognizing well-being as crucial to people’s lives and vital to improving local area development policies. Giving local authorities the power to do whatever they deem necessary to promote or improve economic, social, or environmental well-being in their area affects the improvement of the quality of life in rural areas. Therefore, indicators have been developed with the aim of measuring quality of life. They should be used by local authorities and their partners to monitor changes in living conditions at the local level.
The government’s role is to provide people with fair immediate and future access to the social, economic, and environmental resources needed to achieve prosperity. The goal is to enable all the people around the world to meet their basic needs and enjoy a better quality of life without compromising the quality of life of future generations.
Wellbeing is often used to describe initiatives that address health and environmental issues [
17,
18]. However, the emphasis in this paper is on “subjective well-being”, i.e., how people think and feel about their lives, and how people function in the context of the wider economy, environment, and society in which they live. This reflects an approach to well-being that is in line with the set work goals.
The research starts from the assumption that the rural population in the region of Srem is not satisfied with their quality of life, and that their experienced well-being differs in relation to their socio-demographic characteristics. The aim of this paper is to present the quality of life in the rural areas of the region of Srem in Serbia through a unique multidimensional approach. The primary scientific goal of the research is to identify the most significant factors that influence the formation of experienced well-being. The ultimate goal of the research is to indicate the potentials and limitations of further rural development of local communities, and based on that, determine the direction of their future development. The applicable goal of the paper is to draw attention to the needs of local communities and provide advice to local governments, health, educational, sports, and cultural institutions, police forces, and other responsible local public service institutions in order for them to develop their practice based on the results presented, and measures of well-being at the local level.
2. Literature Review
Quality of life is, in theoretical terms, a concept that has increasingly been used in recent decades, and one which is still evolving [
19,
20,
21,
22]. With the development of the welfare state, the transition to capitalism of the former socialist states, and the expansion of development to the east, new concepts are increasingly being introduced into theory and economic–political discourse.
Wilkinson and Pickett [
23] believe that in the past few thousand years of human development, the best way to improve the quality of human life has been to increase the material standard of living. However, in the last few decades, life problems for the vast majority of people in rich countries are no longer merely consuming food, using clean water, or providing heat.
Despite the fact that economic development has lifted millions of people out of poverty, the increasingly clear message of the new age is that a development model based solely on economic development is not complete. Porter and others [
24] say that a society that fails to meet basic human needs and enable its citizens to improve their quality of life, as well as a society that destroys the environment and limits opportunities for its citizens, will not prosper. The study concludes that countries around the world are making progress by increasing the competitiveness of their economies and GDP growth, but that this does not guarantee sustainable growth, and that economic growth without social progress leads to low levels of inclusion, lack of content, and social unrest. The study also warns of an increasingly pronounced gap between the so-called objective and subjective indicators that describe society. In order to avoid the focus of development relying exclusively on economic development and productivity policies, it is necessary to measure indicators of quality of life, as well as the sustainability of economic development. Therefore, it is suggested that, in addition to indicators of economic growth and development, indicators of social progress should be measured as well, and that the emphasis should be on measuring outcomes.
Confirmation of the importance of subjective indicators was also given by Stiglitz, Sen and Fitusi [
25] said the study claims that the time had come for our measurement system to shift its attention from measuring economic production to measuring people’s well-being. The measurement of well-being should be placed in the context of sustainability, while the measurement of subjective well-being provides key information about the quality of life of people. The study also claims that it is necessary to integrate the perspective of the citizens themselves into the preparation of policies to a greater extent, i.e., to their perception.
Quality of life indicators combine both objective and subjective elements [
26,
27], so there are two notions of quality of life in global research. Objective indicators are data obtained by observers and can be measured directly (e.g., the number of persons living below the minimum standard of living), while subjective indicators are those formed on the basis of questions to which different answers can be given, depending on the personality of the respondents. Since the objective circumstances of individuals’ quality of life are usually difficult to measure, subjective judgments must be added to these indicators. These are primarily questions that determine the personal attitude of an individual. The most common questions are related to the life circumstances of an individual, but there are also frequent questions about their general level of happiness [
28,
29]. Subjective well-being refers to the way people evaluate their lives, and includes variables such as life satisfaction, positive mood and emotions, and the absence of depression and anxiety [
30].
Numerous researchers have examined the relationship between individual satisfaction and satisfaction with life as a whole. Diener and Suh [
31] speak strongly about the indicators of economic, social, and subjective well-being of a person. The study defines subjective quality of life as the way people value their lives, which includes happiness, satisfaction with their own lives, pleasant feelings, as well as a relative lack of unpleasant feelings and moods.
Tsou and Liu [
32] have studied the ways in which individual characteristics have an impact on life satisfaction. Happiness is the level on the basis of which an individual evaluates the overall quality of their life as favorable, which is generally considered to be the ultimate goal in life. Happiness depends on many things, including income, the labor market, job characteristics, health, leisure, family, social relations, security, freedom, moral values, and many others [
33,
34,
35,
36,
37].
However, there are significant differences between countries in the notion of happiness and contentment [
38,
39,
40]. They come to the fore through economic and cultural factors. Satisfaction with living conditions is closely related to economic prosperity and the cultural level in individual countries [
41,
42,
43]. Peiro [
44], studying the relationship between socio-economic conditions and happiness, found that unemployment does not have to be associated with happiness, although it is clear that it is associated with satisfaction. Additionally, income is closely related to pleasure, but its connection with happiness is weaker.
Bertolini and others [
45,
46] question why subjective well-being does not increase if incomes increase. The study outlined two explanations as reasons: one based on hedonistic adaptation, and the other based on social comparison. Changes in people’s living conditions only have a transient effect on their well-being, because people tend to adapt to their past experiences. This theory assumes that, as time goes by, there is an adaptation process that sooner or later erodes the benefits of increased income [
47,
48]. Another theory, based on social comparison, assumes that what matters to people is not the absolute level of their income, but the level of their income relative to the income level of selected groups of individuals with whom they are compared [
49,
50,
51].
Veenhoven [
52] studied life satisfaction as a whole and satisfaction with three aspects of life (finance, housing, and social contacts) in ten European countries. The study concluded that average satisfaction differs significantly in individual countries. It was also pointed out that satisfaction with life as a whole and satisfaction with certain aspects of life is highest in Northern and Western Europe, medium in Southern Europe, and lowest in Eastern European countries [
53].
Diener [
14] includes several theories in his work on the research of quality of life and life satisfaction. One of the most important theories cited in the study is Michalos’ theory on the existence of several disproportions. According to this theory, individuals constantly compare what they have achieved with what they wish for, while comparing their own achievements with the achievements of other people. Satisfaction or dissatisfaction arises as a result of these constant comparisons.
Observing that people describe subjective satisfaction mainly using a scale ranging from satisfied to dissatisfied, Cummins and others [
54,
55] hypothesize that quality of life is reflected in homeostasis. Since it is an integral part of life processes, homeostasis seeks to re-establish disturbed harmony by a feedback mechanism, automatically. All major disturbances of balance in intrasomatic, social, or psychological processes are regulated without conscious intention. In addition, Cummins [
56] states that quality of life is both objective and subjective, that it is basically the sum of seven dimensions: material well-being, health, productivity, intimacy, security, togetherness, and emotional well-being.
From a sociological point of view, the quality of life concept provides information on life satisfaction and the degree of adequate functioning in the environment. From a psychological point of view, quality of life provides information about a person’s feelings, as well as about their interactions with others. In medicine, the goal of quality of life is, on the one hand, prevention and alleviation of symptoms of disease and their consequences, and on the other, the state of achieving a more meaningful, fuller, and better general quality of life [
57]. The WHOQOL Group [
58] states that quality of life is a personal perception of lifestyle in the context of culture, value systems, aspirations, future prospects, standards, and interests.
Testa and Simonson [
59] state that quality of life, more precisely quality of life based on health, indicates the physical, psychological, and social dimension of health, all of which are viewed as special areas under the influence of experience, beliefs, expectations, and perceptions of the individual. Each of these domains can be measured along two dimensions: objective assessments of functioning or health status and subjective-perceptions of health. According to Diener and others [
60], higher levels of subjective well-being are associated with good health and longevity, better social interactions, creativity, and success at work.
Haas [
61] states that quality of life is a multidimensional assessment of the current circumstances of an individual’s life in the context of the culture in which this person lives and the values they have. It is, above all, a subjective feeling of well-being, and encompasses a physical, psychological, social, and spiritual dimension. In some circumstances, objective indicators may complement or, in the case of individuals incapable of subjective observation, serve as an aid to assessing quality of life.
Rejeski and Mihalko [
18] claim that quality of life is a conscious cognitive assessment of satisfaction with one’s life, and in the same year Hagerty and others [
62] claimed that quality of life implies quality of overall life, not just some parts. If quality of life is divided into individual dimensions, those dimensions must, taken as a whole, represent and form a unity.
Christoph and Noll [
20] say that quality of life is precisely defined by the relationship between subjective or personally based elements and a set of objective circumstances. Subjective indicators of a high quality of life include: a sense of well-being and personal development-progress. The objective element is understood through circumstances that represent a favorable chance for exploitation by people living their lives.
There is some difference between the methods used to measure the quality of life in the general population and those used to measure the quality of life of individuals. In both approaches, the dominant methodology can be described as positivist, and is based on quantitative methods. Qualitative methods are also used in quality of life research, especially for the development of quality of life assessment instruments. The quality of life of the population is based on traditional “social indicators”. This usually involves identifying indicators and measures related to a range of dimensions/domains, in order to calculate a unique quality of life index [
63,
64,
65,
66]. These indicators can be both subjective and objective, derived from socio-economic statistics collected by the government or censuses. For the quality of life of individuals, the dominant measurement approach is the use of self-assessment instruments, i.e., questionnaires [
67].
3. Materials and Methods
3.1. Place of Research
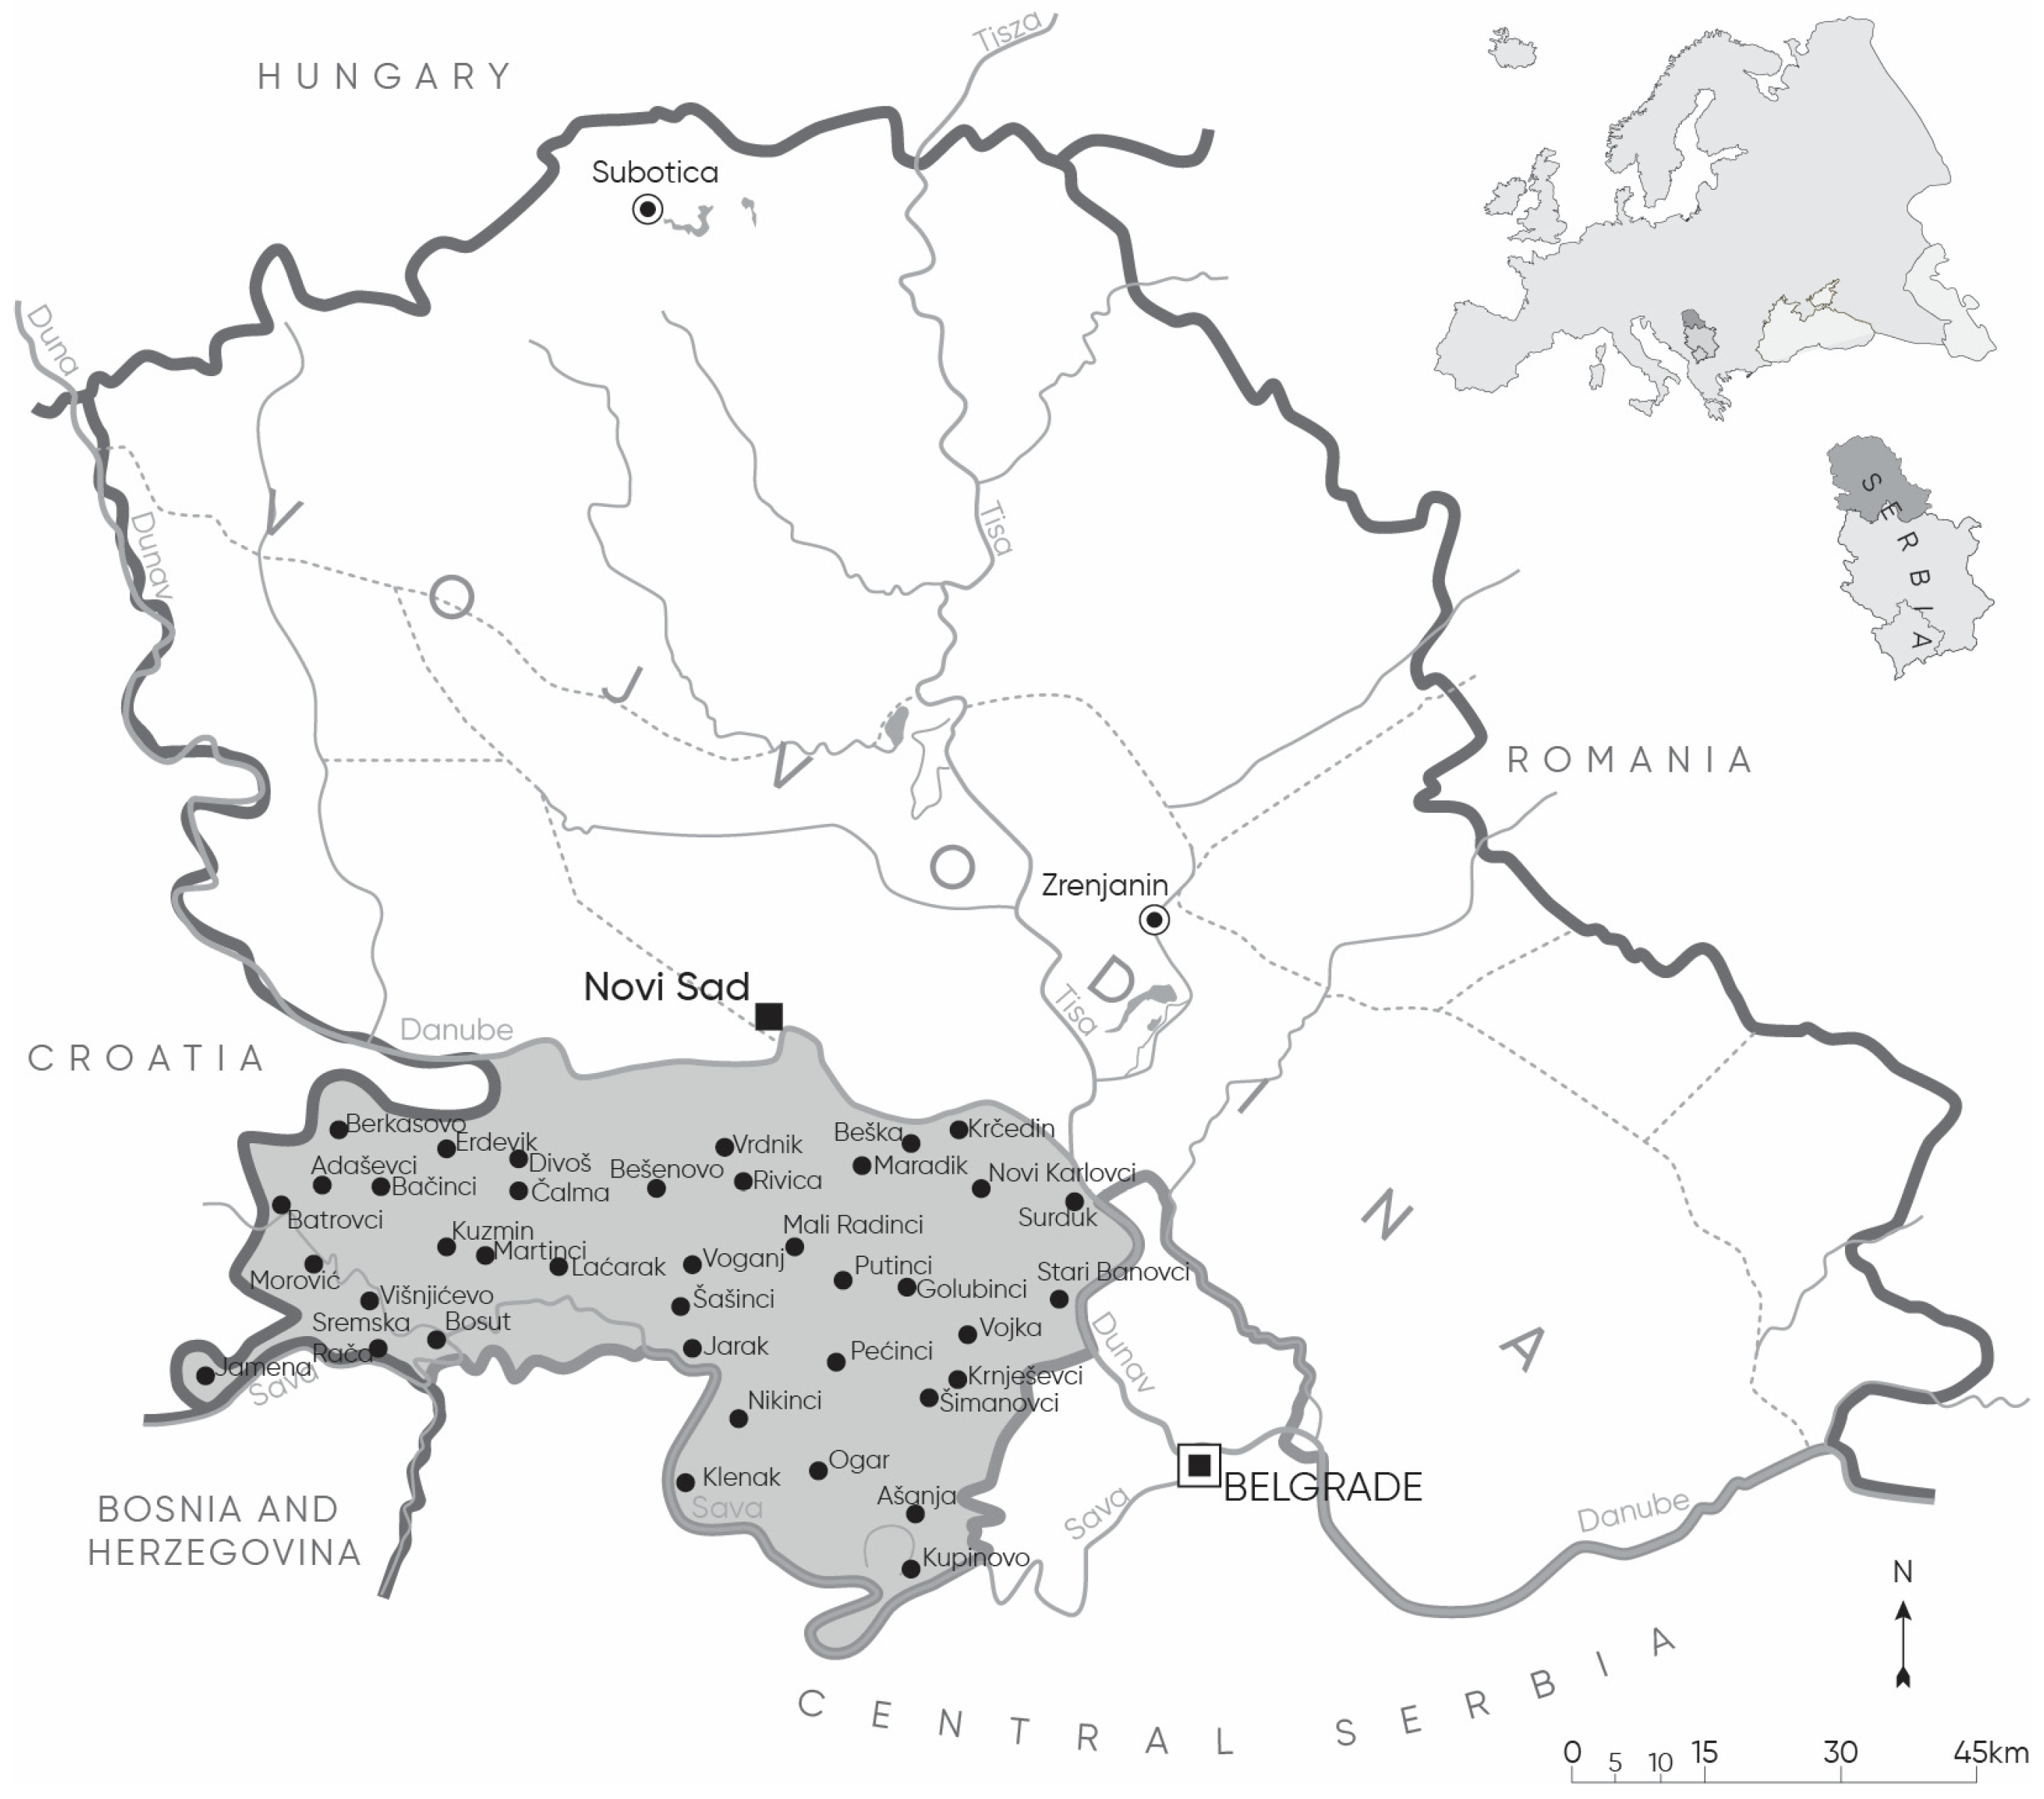
Srem is a geographical region located in the southern part of the Pannonian Plain, between the Danube and Sava rivers. In an administrative sense, it belongs to Northern Serbia, i.e., the Autonomous Province of Vojvodina. It consists of the municipalities of Inđija, Irig, Pećinci, Ruma, Stara Pazova, Šid and the City of Sremska Mitrovica, the seat of the region. The total area of the Srem region is 3671 km
2, and it has 312,278 inhabitants of which 175,643 or 56.2% live in rural settlements [
68,
69].
In order to examine the attitudes of the local population about the factors that affect the sustainability of settlements and the quality of life in them, a survey was conducted. The survey was conducted in the following 39 villages: Beška, Krčedin, Maradik, Novi Karlovci (Inđija Municipality), Vrdnik, Rivica (Irig Municipality), Ašanja, Kupinovo, Ogar, Pećinci, Šimanovci (Pećinci Municipality), Voganj, Klenak, Mali Radinci, Nikinci, Putinci (Ruma Municipality), Bešenovo, Bosut, Divoš, Jarak, Kuzmin, Laćarak, Martinci, Sremska Rača, Čalma, Šašinci (Sremska Mitrovica Municipality), Vojka, Golubinci, Krnješevci, Stari Banovci, Surduk (Stara Pazova Municipality), Adaševci, Batrovci, Bačinci, Berkasovo, Erdevik, Jamena, Morović, and Višnjićevo (Šid Municipality) (
Figure 1).
3.2. Measuring Well-Being
Measuring people’s well-being can be undertaken in ways that are both comprehensive and beneficial to the local authorities. This requires that people be asked about their feelings and experiences, usually through surveys and/or questionnaires. This is often called measuring people’s “subjective well-being.” The main question, therefore, is not whether well-being can be measured, but how it can most effectively be measured at the local level in order to equip the local authorities and their partners with the information needed to achieve better results for individuals and communities [
70,
71].
To measure well-being at the local level, a three-step approach is recommended:
The universal level;
The domain level;
The target level.
The universal level provides a general, comprehensive measure of the human life experience. It provides the main findings at the level of the total population. It usually involves measuring a single item (or a small group of measures), such as asking people to rate their overall life satisfaction.
The domain level measures different aspects or dimensions of human well-being, for example, in relation to health, community safety, economic circumstances, etc. It goes beyond providing a comprehensive assessment of outcomes to explore differences and variations in the local government, exploring some of the key components of people’s life experiences.
The target level measures some of the basic factors that affect the general well-being of people. This may include, for example, autonomy, resilience, self-esteem, a sense of competence, and relationship strength [
72].
These levels are not mutually exclusive. The decision on which level well-being will be measured depends on the reasons for gathering new information and the potential for decisions and actions to be taken as a result of the findings in each local area. The research in this paper was conducted at the universal level and the domain level. The recommended indicator for measuring the general subjective well-being of residents is a question of life satisfaction, which consists of one item. This is a universal measure of well-being and does not set a specific time frame in which respondents should rate their satisfaction. The most common question is: Considering everything, how satisfied are you today with your life as a whole?
By measuring well-being at the domain level, the aim was to investigate how the well-being of the population varies in different areas of life (health, education, culture, sports, the neighborhood, etc.), to provide a more detailed understanding of well-being in relation to a particular domain, as the basis for future planning and service delivery, and to assess how different population groups experience different aspects of their lives (for example, by age, by gender, by education).
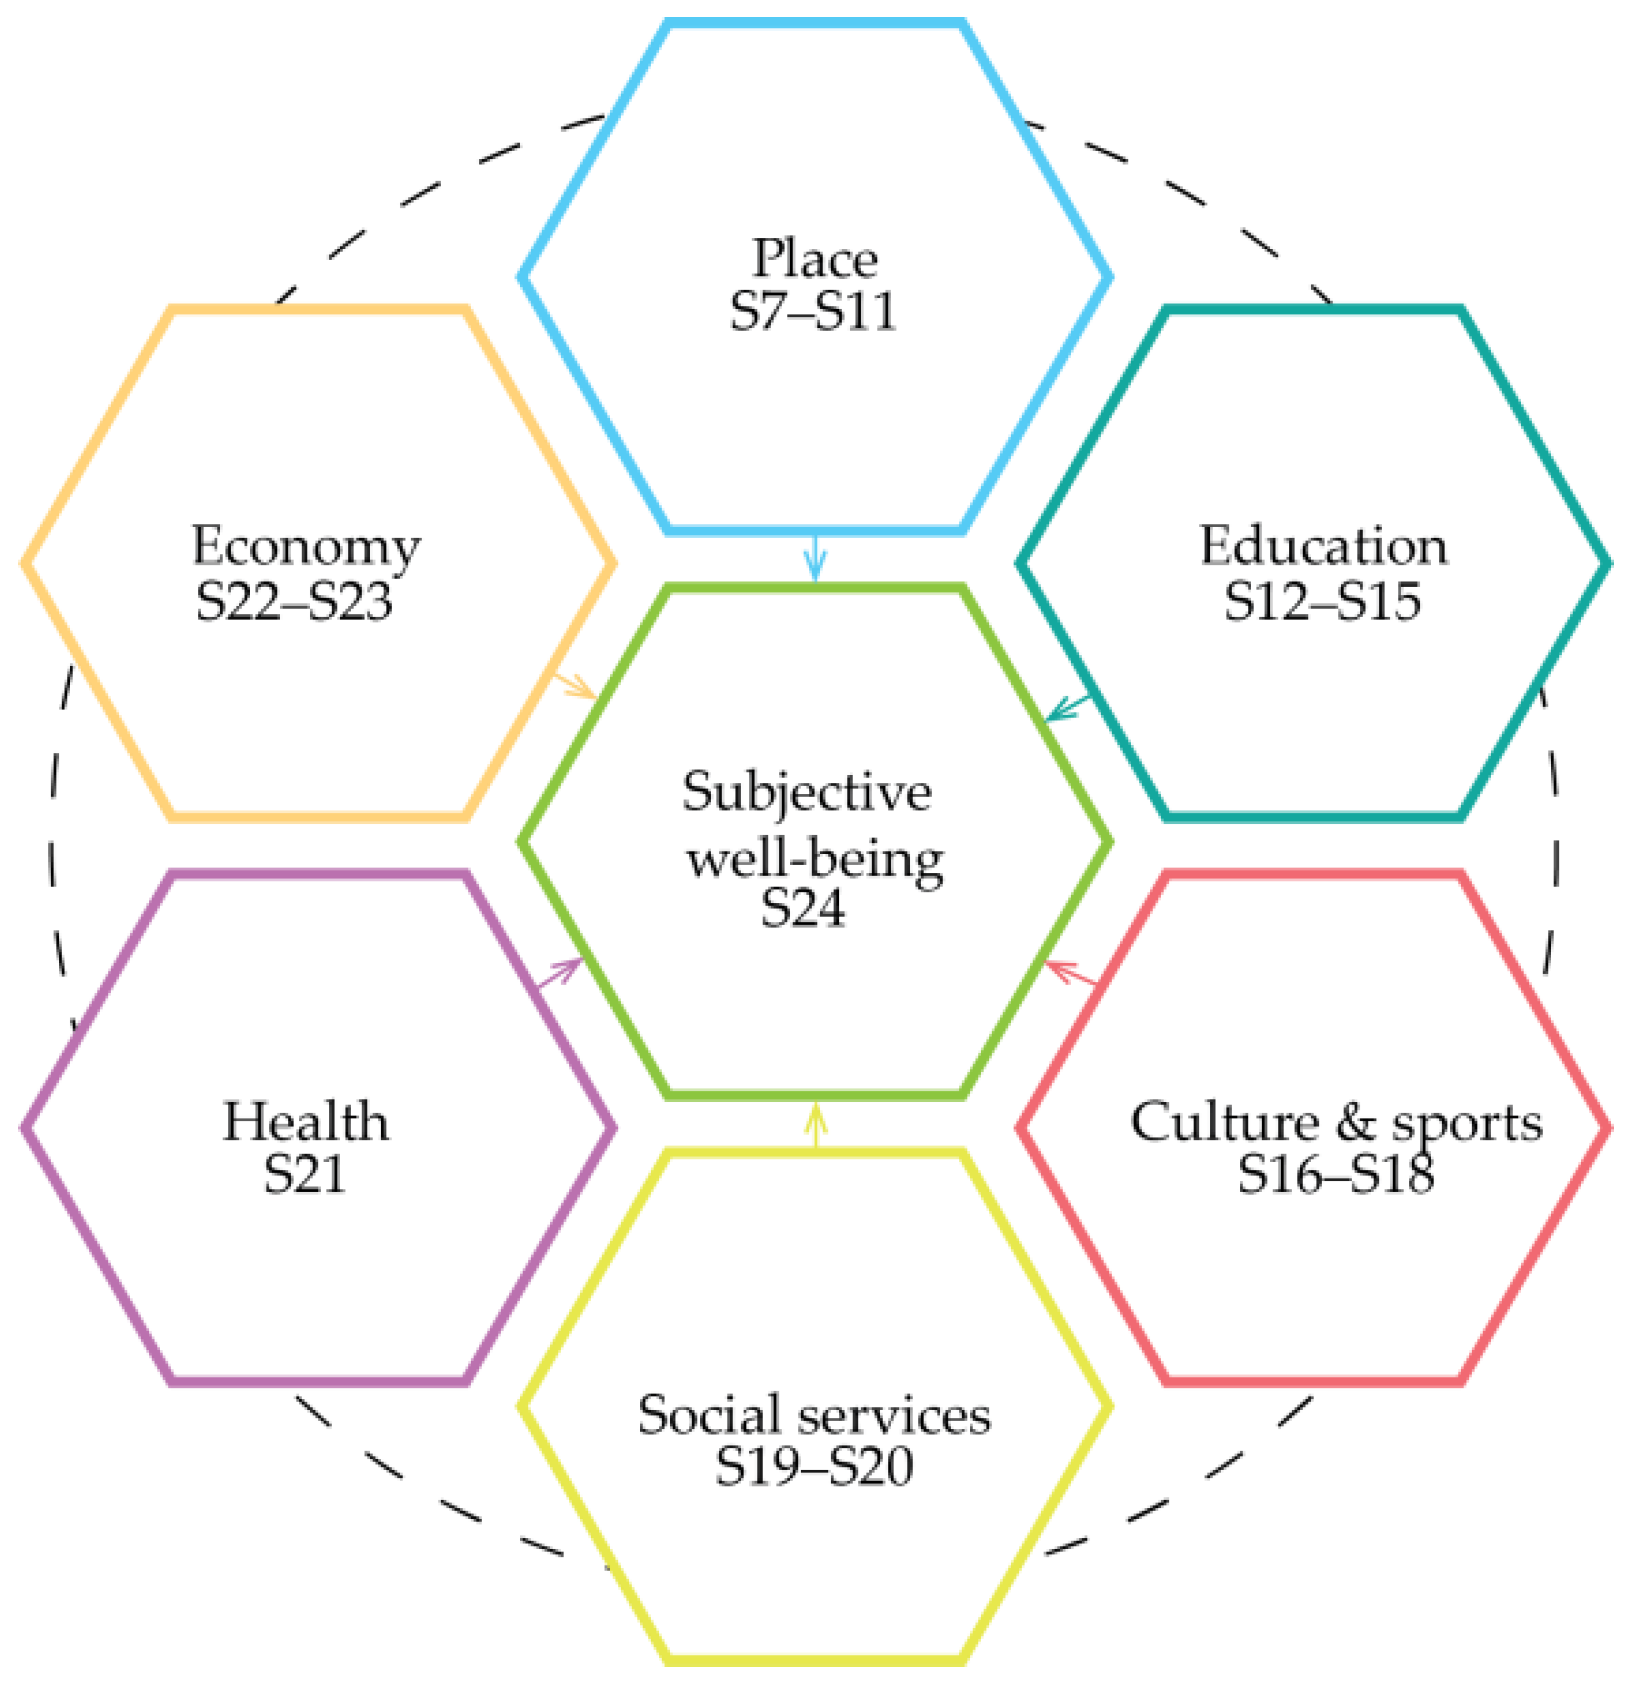
In order to measure well-being in relation to different areas or domains of life of the inhabitants, a mixture of satisfaction and experiential indicators is proposed. They should cover key domains or areas that are recognized as having an important impact on people’s life experiences. This provides a limited but holistic way of thinking about well-being and includes key dimensions of how people experience their lives locally:
How they feel about their own lives (for example, health, financial opportunities);
How they feel about those around them (for example, their neighbors, community);
How they feel about where they live (for example, the quality of their neighborhood, accessibility, security). These three key dimensions are complemented by a list of additional indicators shown in
Figure 2. Feelings about their own lives are presented by the Health and Economy group of indicators, feelings about those around them are presented by the Social services, Culture and sports, and Education group of indicators, feelings about the place where they live are shown with the Place group of indicators. Ultimately, all these indicators affect the formation of subjective well-being. The full names of the indicators coded and schematically shown in
Figure 2 are presented in
Table 1.
A multidimensional approach is necessary for a more complex and comprehensive view of quality of life and largely ensures that there are no mistakes. Therefore, well-being in this paper is analyzed through specifically selected indicators and a flow of six dimensions, each of which is represented by a series of indicators, of which there are 17 in the final analysis, while the last dimension “Subjective well-being” is processed individually.
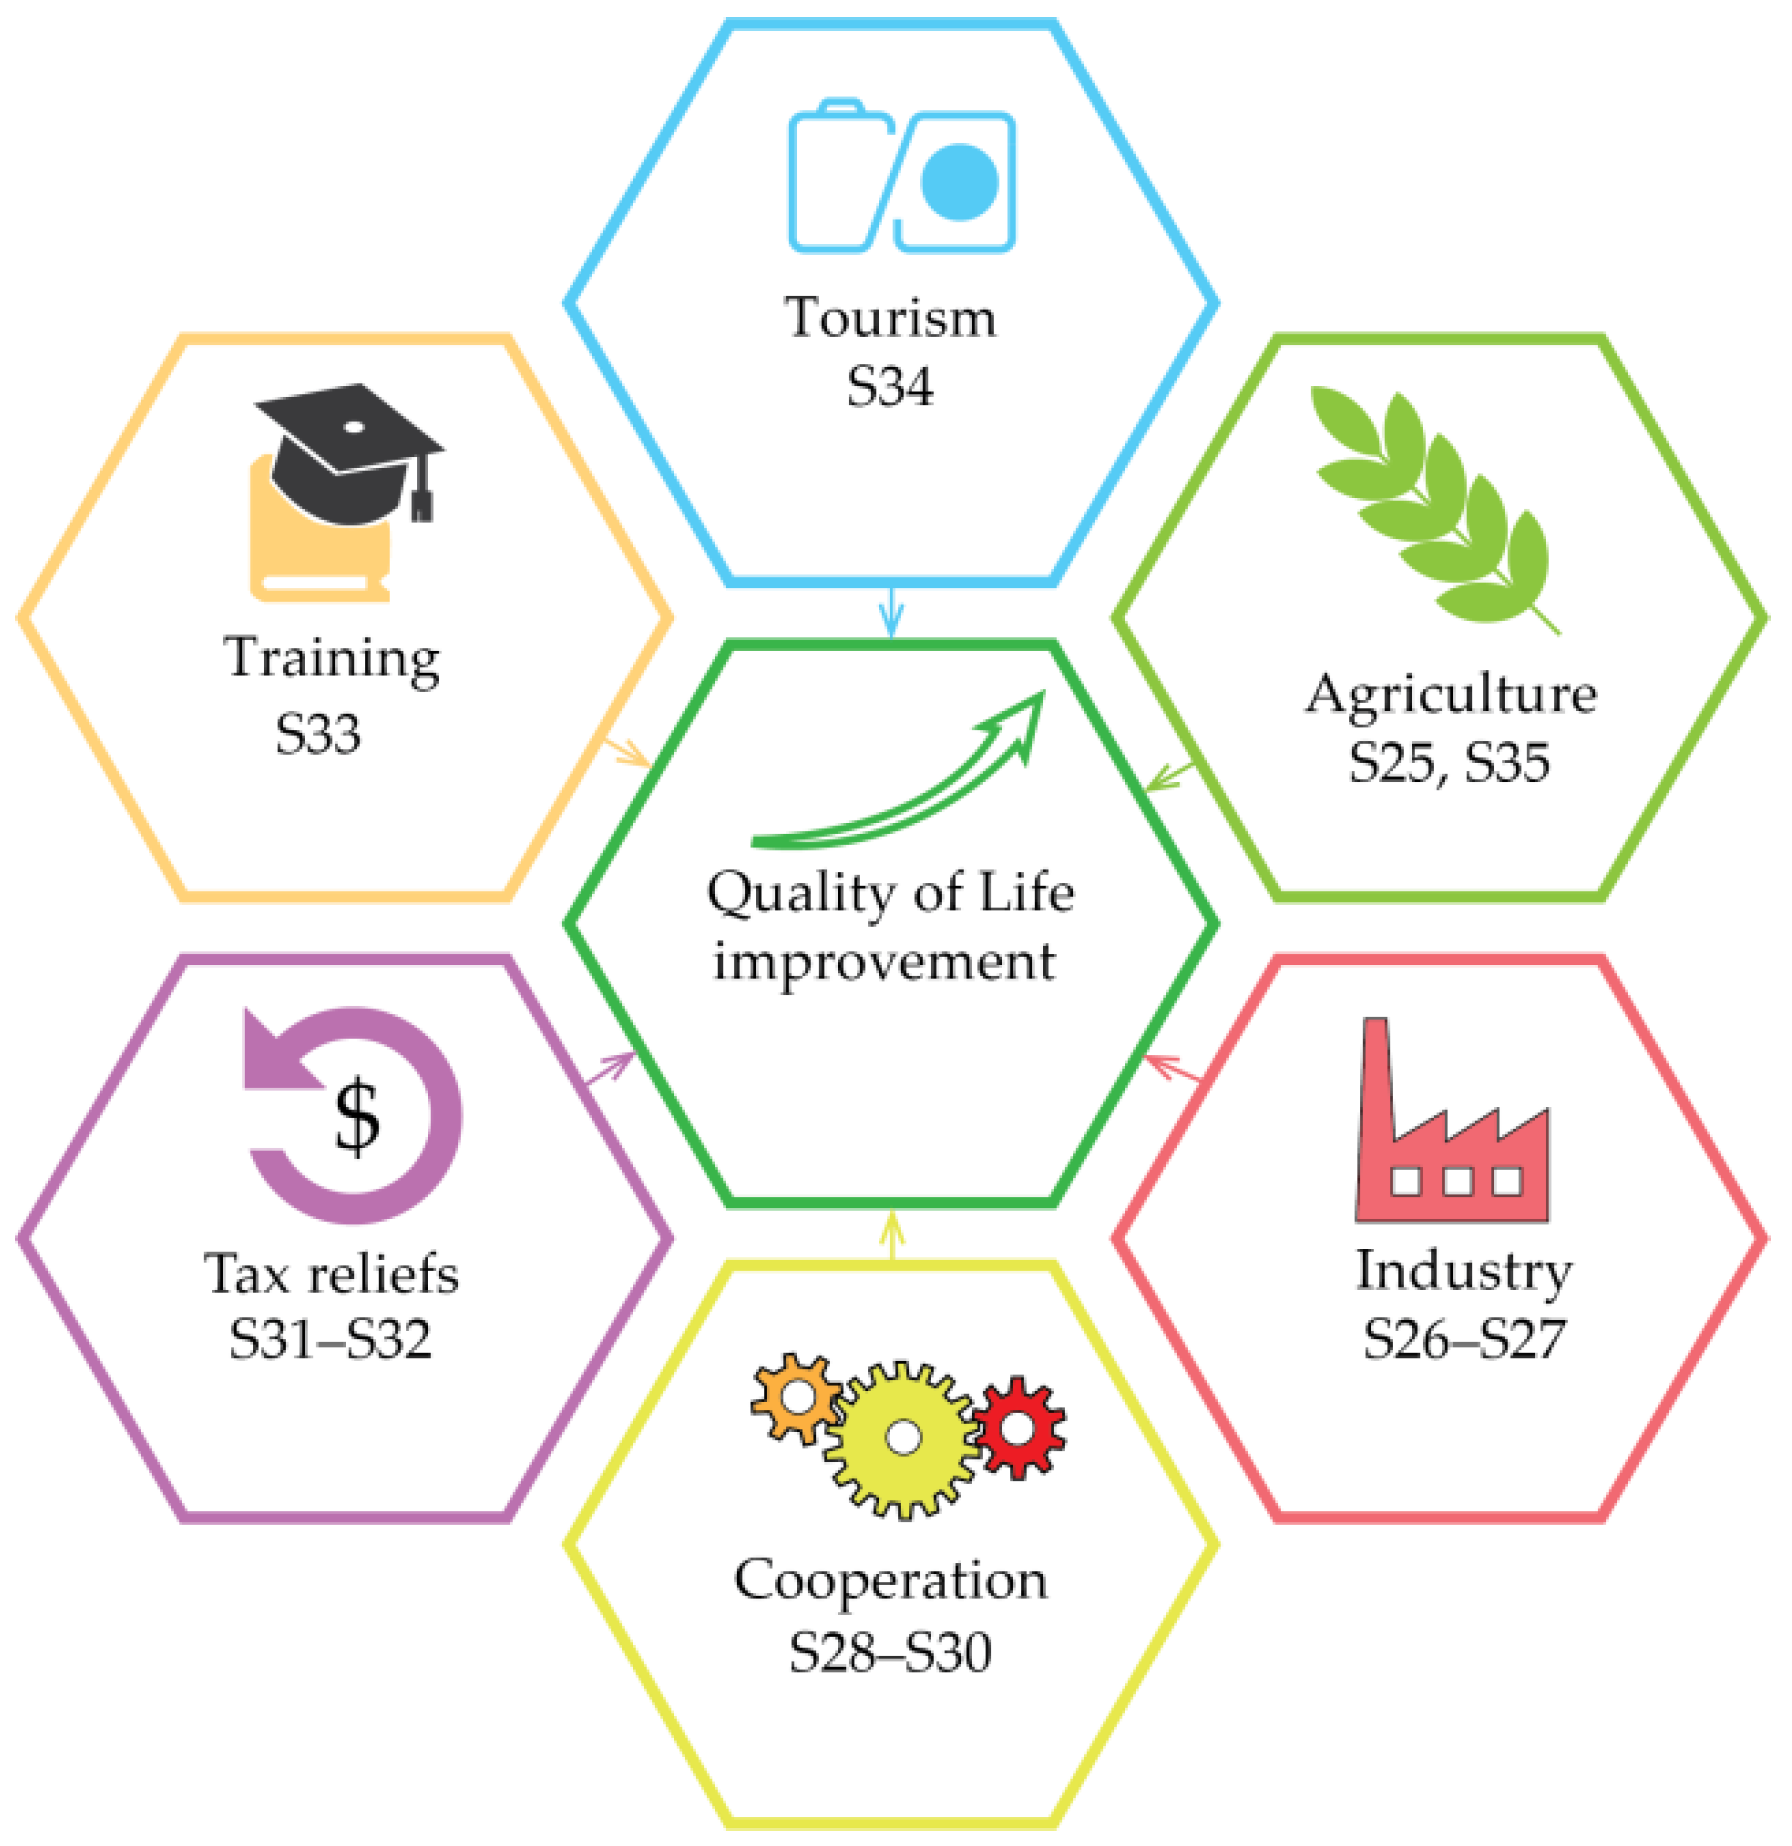
In the next part of the questionnaire, the respondents were asked to assess the importance of measures for improving quality of life. Eleven indicators were proposed, which were classified into 6 groups, and are shown in
Figure 3. The statements are coded S25-S35, and the full names are shown in
Table 2.
3.3. Study Sample
A total of 424 respondents, residents of the 39 abovementioned settlements, participated in the study. The age limit for inclusion in the survey was 18. The majority of the surveyed individuals are employed (65.3%), which corresponds to their age structure. Most completed secondary school (50.5%), with no significant difference in the level of education of women and men. Their basic sociodemographic characteristics are shown in
Table 3.
3.4. Procedure
Data collection was performed by a survey on a sample of citizens living in the abovementioned settlements. The survey was conducted during May and June 2019. Participation in the survey was voluntary and the respondents were informed about the main purpose of the research. A total of 500 questionnaires were distributed, and 424 were successfully completed. Thus, the response rate was 84.8%.
3.5. Instrument
The questionnaire was used in order to collect data for the study. It consisted of two parts. The first part included the socio-demographic characteristics of the respondents, while the second part focused on the perceptions of the local community. The second part of the questionnaire measured indicators that determine quality of life. A modified Satisfaction with Life Scale was used in the construction of the questionnaire [
73]. The rest of the questionnaire was modeled on similar surveys conducted in Serbia [
74,
75], based on the recommendation of national indicators [
76], as well as on the basis of the recommendations of international experts [
72]. Statements of the degree of satisfaction with life indicators were assessed on a five-point Likert scale (1—strongly disagree, 5—strongly agree). The importance of the statements related to improving quality of life was measured on a five-point Likert scale (1—it does not matter to me at all, 5—it is very important to me). Cronbach’s alpha coefficient of internal consistency for the first scale is 0.857, and for the second scale is 0.884, suggesting that the items have a relatively high internal consistency [
77].
3.6. Statistical Analysis
The data were processed by the STATISICA 10.0 software. Methods of nonparametric statistics were used in the paper: the χ2—test, Mann–Whitney U test, and the Pearson correlation test.
4. Results and Discussion
To assess the current perceived life satisfaction, the respondents were asked to evaluate 18 statements. They rated their level of agreement with the statements on a scale ranging from 1 to 5 (1—strongly disagree, 5—strongly agree). Mean values with standard deviations are shown in
Table 1. Thereby, the current quality of life in the settlements of Srem was perceived.
The first statement for which the respondents had to express their position referred to whether they were satisfied with the access roads to the settlements in which they live (S7). On average, they were undecided, but most of them (167) agreed with the statement that the access roads to their places of residence are satisfactory. This proves the value of the mode (Mo = 4). The biggest difference in the degree of satisfaction was noted for the question about the traffic connection of settlement with the surroundings (S8), i.e., the question of whether the number of bus and railway lines is sufficient. The largest dispersion of answers was recorded in this question (coefficient of variation (Cv) = 52.5%) when compared to the others. Half of the 424 total surveyed individuals are not at all satisfied with the traffic connection of their settlements with the environment (median (Me) = 2), and this is confirmed by the value of the mode (Mo = 1), which shows that as many as 130 of them show complete dissatisfaction.
Unlike for traffic connections, the respondents generally do not have a clearly defined attitude towards road quality. Half are of the opinion that the quality of the roads is not satisfactory, while the other half think that the roads are of satisfactory quality (Me = 3). For the infrastructural equipment of the settlements in which they live (S10), the respondents also express different levels of satisfaction; on average, they neither agree nor disagree that the electrification, sewerage, telephone, gas, television, and the internet are at a satisfactory level. They show a similar level of satisfaction with the level of hygiene in their settlements (S11).
The respondents’ satisfaction with the number and territorial distribution of educational institutions, starting from preschool institutions to colleges and faculties, was assessed on the basis of their answers to statements S12, S13, S14, and S15. The values of the calculated parameters show they are mostly satisfied with the number of preschool institutions in their settlements (Mo = 4). The highest degree of satisfaction was expressed when it comes to the number of primary schools. What is not adequately developed are colleges and universities.
When it comes to the number and availability of cultural institutions (S16), the respondents do not have a clear position. Most of them are neither satisfied nor dissatisfied with the state of culture (Me = 3, Mo = 3).
Unlike in the case of culture, when it comes to sports and recreational facilities (S17), the respondents expressed dissatisfaction with the availability of these facilities in their settlements (Mo = 2). Regarding the diversity of content for children and adults (S18), the values of the calculated parameters show that they are not satisfied with this content.
The respondents are not completely satisfied or dissatisfied with the work of the social services in their settlements (S19). Most of them do not have a clear position on satisfaction with the work of these services (Me = 3, Mo = 3). They were slightly more precise in expressing their satisfaction when the safety of life in their settlements was analyzed (S20). Most of the surveyed individuals are mainly satisfied with the level of safety in the settlement in which they live (Mo = 4).
The respondents are not satisfied with the provision of medical services (S21) in their settlements. This is shown by the values calculated based on the frequency of their answers to this question (Me = 2, Mo = 2). They expressed the greatest degree of dissatisfaction when asked how satisfied they were with the prices of products and services (S22), and how satisfied they were with the quality of products and services (S23). Most are not at all satisfied with the prices (Mo = 1), while they show somewhat less dissatisfaction with the quality of products and services (Mo = 2).
Based on the previous claims, the degree of satisfaction of the respondents with certain indicators of quality of life was considered. It can be concluded that they are not very satisfied with the current level of quality of life in their settlements. On the specific question of whether they are satisfied with their lives as a whole (S24), the opinions of the respondents were divided. Half are not satisfied with their standard of living, while the other half consider their standard of living satisfactory (Me = 3).
After expressing a certain degree of dissatisfaction with their current life, in the following eleven statements the respondents expressed their position on the importance of the selected measures related to improving the quality of life in their settlements. The basic characteristics of their attitudes are given in
Table 3.
The respondents’ dissatisfaction with their current quality of life imposes the logical conclusion that they will evaluate certain proposals for improving it as important. This is also confirmed by their levels of agreement with claims S25–S35. The construction of a sustainable and efficient agricultural sector (S25) and the construction and modernization of the industrial sector (S26) are considered by most to be very important for improving quality of life (Mo = 5). The respondents also consider attracting foreign investors (S27) a very important indicator for raising the standards of living in their settlements. Some previous research has also reached similar conclusions [
78].
The clear attitude of the respondents about the great importance of opening new companies for the development of the local community (S28) is confirmed by the calculated values of the basic indicators (Me = 5, Mo = 5).
The respondents’ attitudes to the question of improving inter-municipal and regional cooperation (S29), which they mostly consider to be very important (Mo = 5), together with the answers to the previous question, lead to the conclusion that they believe that quality of life can be improved through their own efforts, i.e., resources, which does not mean that foreign aid is not welcome [
79]. This statement is confirmed by the answers to the question about the importance of cross-border cooperation (S30). This cooperation is rated as important for improving quality of life (Mo = 4).
Lending to the economy (S31) and tax relief (S32) are also assessed by the respondents as important for improving quality of life. They give more importance to tax relief (Mo = 5) because as many as 219 of the surveyed individuals consider it very important, while 172 rate only lending to the economy as important (Mo = 4).
The respondents also see the workforce as a significant factor in improving quality of life. This confirms their view that the implementation of a workforce training program (S33) is very important (Mo = 5).
The fact that tourism is a development opportunity for rural settlements in the Srem region and that respondents see it as a significant factor in improving quality of life is confirmed by the answers to the question about the importance of promoting tourist values (S34). Most of the surveyed individuals (172) also evaluate this factor as very important (Mo = 5). This confirms the findings of numerous studies that see tourism as a development opportunity for rural areas [
80,
81,
82,
83,
84,
85].
Recently, great attention worldwide and in Serbia has been paid to the development of organic and ecological production. The respondents are of the opinion that this is a development opportunity for rural settlements in Srem as well. Based on that, they assessed the development of organic and ecological production (S35) as a very important factor of improving quality of life (Mo = 5).
4.1. Differences in Perceived Well-Being Based on Socio-Demographic Characteristics
The answers of the respondents to the questions asked made it possible to see, to some extent, the current situation when it comes to the level of life satisfaction in the rural settlements of Srem, as well as to see the possibilities for its further development. In order to concretize the possibilities of acting in that direction in the right way, it is necessary to answer some of the assumptions on which the research is based, and which refer to the attitudes of the surveyed persons. The starting hypothesis in this part of the research is that gender, age, occupation, level of education, monthly income, and number of household members significantly influence attitudes about quality of life.
4.1.1. Differences by Gender
First, the assumption that satisfaction depends on the gender of the respondents was tested. Differences in the degree of satisfaction appear when men and women are asked how satisfied they are with the traffic connection of their settlement with the environment (S8). The Mann–Whitney test (
Table 4) shows that the level of satisfaction of men and women differs in their opinions on the number of high schools (S14), opinions on the number and availability of sports and recreational facilities (S17), the diversity of content for children and youths (S18), in their satisfaction when it comes to the work of the social services (S19), and in terms of how safe they feel in their settlements (S20).
When it comes to other attitudes about the indicators of the quality of life in the rural settlements of Srem, there is no statistically significant difference between men and women. When the differences in question were expressed, it can be concluded that women showed a slightly lower degree of satisfaction with these indicators compared to men, i.e., they were somewhat more uncompromising in their assessment.
4.1.2. Differences by Age
The age of the respondents significantly affects the expressed degree of satisfaction only in some indicators of quality of life. Differences in the degree of satisfaction are observed between individuals aged 18−35 and those aged 35−50 when it comes to the work of the social services (S19). In this case, the younger population is less satisfied with the work of the social services. The results further show that respondents aged 35–50 are less satisfied with the quality of products and services (S23) than those aged 18–35 (
Table 5). Additionally, this group is less satisfied with their life as a whole (S24), compared to the younger population.
Slightly more differences in the degree of satisfaction are observed between respondents aged 18–35 and those aged over 50. In this case, the younger population is less satisfied with the availability of cultural institutions (S16) and sports and recreational facilities (S17). Young people are also less satisfied with the work of the social services (S19), while respondents over the age of 50 are more critical of the quality of products and services (S23) compared to the younger population (
Table 6).
When it comes to satisfaction with the indicators of quality of life, respondents aged 35–50 and over 50 are almost of a similar opinion. The only statistically significant difference between these two age groups was expressed in relation to the traffic connection of their settlements with the surroundings. Individuals over the age of 50 are less satisfied in this case than those aged 35–50.
4.1.3. Differences by Occupation
The respondents’ satisfaction with certain indicators of quality of life statistically significantly depends on their occupation. The results of comparing the degree of satisfaction of students and employees are given in
Table 7. The differences are primarily reflected in how satisfied the surveyed individuals are with the number of educational institutions (S12, S13, S15). Students show a higher degree of satisfaction with the number of preschool institutions, the number of primary schools, and the number of colleges and universities, compared to the employed population.
The results in
Table 7 further suggest that students are undecided about the diversity of content for children and youths (S18), while employed people express dissatisfaction. The employed are also dissatisfied with the quality of products and services (S23), as well as quality of life in general (S24), while students do not show a clear degree of satisfaction with these issues.
There is no statistically significant difference between employed and unemployed respondents in the degree of satisfaction with these indicators of quality of life. Some significant differences are visible when comparing unemployed respondents and retirees. They differ primarily in their degree of satisfaction when it comes to the number and availability of cultural institutions (S16), the number and availability of sports and recreational facilities (S17), and the variety of content for children and adults (S18). Unemployed people are not satisfied with these indicators, and retirees do not have a clearly defined degree of satisfaction. Additionally, when it comes to life satisfaction as a whole (S24), the unemployed are not satisfied, and retirees are neither satisfied nor dissatisfied (
Table 8).
Based on the above comparisons of the degree of satisfaction of the respondents, it can be seen that differences exist only in some indicators, and that between a number of indicators there are no significant differences. Given that the last question (S24), i.e., how satisfied the surveyed individuals are with their lives as a whole, includes all of the abovementioned indicators, differences in the degree of satisfaction depending on occupation were examined using the
χ2-test. The test results are given in
Table 9.
Based on the response frequencies of the respondents, the χ2 value was calculated, which shows a high statistical significance (p < 0.05). This means that the expressed degree of satisfaction is significantly influenced by occupation.
4.1.4. Differences by Education
When analyzing the differences in the respondents’ satisfaction with quality of life indicators depending on their level of education, it must be noted that their numbers are unevenly distributed among the stated levels of education. Only a small number have not completed primary school. Only six were interviewed. What is characteristic for this group of respondents is that, unlike those with other levels of education, they are completely dissatisfied with the quality of roads in their settlements. Forty-six of the surveyed individuals have completed their primary education. The level of satisfaction of this group does not differ statistically significantly from the level of satisfaction of those who have a secondary education or who have graduated from college or university.
According to some indicators of quality of life, their satisfaction differs from the expressed satisfaction of the respondents who graduated from college or university. Surveyed individuals who completed primary school express a higher degree of satisfaction with access roads and the quality of the roads in general compared to those who graduated from college or university (
Table 10). On the other hand, they are not satisfied with their life as a whole (S24), while those with a higher level of education do not have a clear position on this issue.
Most of the respondents have a high school degree (214). Their satisfaction with life as a whole, as well as with individual indicators, does not differ significantly from the satisfaction of those who have not completed primary school and from those who have.
The respondents who completed high school differ from those who have a college degree only in terms of their satisfaction when it comes to the quality of the roads in their settlement (S9). The surveyed individuals who completed high school are neither satisfied nor dissatisfied with the quality of the roads, i.e., they do not have a clear position, while those with a higher education believe that the quality of the roads is at a satisfactory level.
Compared to the respondents who graduated from college or university, those who graduated from high school show greater satisfaction with access roads and the quality of the roads in their settlement (S7, S9), and these differences in satisfaction are statistically significant. When comparing the degree of satisfaction of the surveyed individuals who graduated from high school and the degree of those who graduated from college or university, significant differences are reflected in their opinions on access roads and road quality, as well as in their satisfaction with the prices of products and services (S22), and quality of products and services (S23). On these issues, university-educated respondents show a lower degree of satisfaction.
As statistically significant differences were observed in the respondents’ satisfaction with individual quality of life indicators, all this resulted in differences in life satisfaction as a whole (S24). Those who have completed primary school are dissatisfied with their lives. Those who have not, as well as those who have completed secondary school or college, have no clear attitude towards life satisfaction. The respondents who graduated from college are mostly of the opinion that their quality of life is at a satisfactory level.
4.1.5. Differences by Monthly Income
By analyzing the differences in the degree of satisfaction of the respondents with quality of life indicators depending on the level of their monthly income, it is concluded that differences in attitudes exist, but that a small number of them are statistically significant. The results of the analysis are given in
Table 11.
The results of the performed test (
Table 11) show that the respondents with incomes up to USD 200 are undecided about their satisfaction when looking at the infrastructural equipment of their settlements (S10). In contrast, those who have incomes between USD 200 and 500, as well as those whose incomes are higher than USD 500, believe that the electrification of settlements, sewerage, gas, telephone, television, and the internet are at a very satisfactory level, expressing their satisfaction with these indicators. The same relations are observed in the attitude towards satisfaction with the number of high schools (S14). Respondents with lower incomes do not show a clear position on this issue. The next statistically significant difference in the degree of satisfaction appears when it comes to the question of satisfaction with life as a whole (S24). A lower level of income produces greater dissatisfaction with life (
Table 11).
4.1.6. Differences by Household Size
The results of the analysis of the degree of satisfaction with quality of life indicators depending on the number of household members show that the size of the household to some extent affects the attitude about quality of life (
Table 12).
The first difference, which is statistically significant, is related to the issue of traffic connection of the respondents’ settlements with the surroundings (S8). People living alone are satisfied with the traffic connections, while those living in a union with one, two, three or more members are by no means satisfied with this indicator. Surveyed individuals living alone have the same attitude when it comes to the availability of sports and recreational facilities, i.e., they are also satisfied (S17). Those living in two- or three-member households do not have a clear position on this indicator. Respondents coming from four-member households are dissatisfied with the availability of sports and recreational facilities, as are those coming from households with five or more members. Surveyed individuals from two-member households, as well as those living with three and five or more household members are dissatisfied with the provision of medical services. Those living in four-member households are neither satisfied nor dissatisfied with the provision of medical services.
Differences between respondents living in households of different sizes are also noticeable in their degree of satisfaction with prices and quality of products and services (S22, S23). All the respondents, except those who live alone and who do not have a clearly defined position on this issue, are dissatisfied with these indicators.
4.2. Results on Measures for Improving the Standard of Living
As the respondents expressed a certain degree of dissatisfaction in their answers to the previous group of questions, which referred to certain quality of life indicators, the next group of questions refers to certain measures meant to improve the quality of life and the further sustainable development of their settlements (S25–S35). The initial assumption was that there are differences in the attitudes of the respondents regarding measures to improve quality of life depending on their gender, age, occupation, level of education, monthly income, and household size (expressed by number of members) in which they live.
The assumption that the attitudes about the measures to improve the quality of life of men differ from the attitudes of the surveyed women was tested first. The results of the Mann–Whitney test (
Table 13) show that the attitudes of men and women in the proposed individual measures are statistically significantly different.
The results in
Table 13 show that the first difference in attitudes between men and women appears in their opinion on the importance of building a sustainable and efficient agricultural sector (S25). Men assessed this measure as mostly important when it comes to improving the quality of life in the countryside, while women did not show a clear attitude. When it comes to tax breaks as a measure to improve quality of life (S32), they are very important for women, while they are mostly important for men. Women assign the same level of importance to the implementation of the workforce training program (S33). They think that this measure is of great importance, while for men it is mostly important. It could be said that women show a greater willingness to learn and train for something new. The women also assessed the promotion of the tourist values of the Srem region as very important for them (S34). The men were a bit more restrained in this case as well, ranking it as mostly important.
The general conclusion that can be reported based on the views of men and women is that, for men, all these measures to improve the quality of life in rural settlements are mostly important, but their attitude does not indicate their willingness to actively participate in their implementation. Women expressed more will and readiness for certain measures that require their active participation. This conclusion is very important because human resources are crucial for the sustainable development of rural communities [
86,
87].
The age of the respondents influences their attitude about the importance of certain measures for improving quality of life, which is confirmed by the results of the performed analysis (
Table 14).
The younger population of respondents is generally of the opinion that all the proposed measures to improve quality of life are mostly important for them, with the exception of the development of organic and ecological production, which they consider very important. The older population of respondents almost has the completely same attitude towards all the proposed measures as do the ones aged 18–34, with the exception of the measure of tax relief (S32), which is very important for the older population, while it is mostly important for the younger one.
Compared to the previously analyzed age groups of respondents, those aged 35–50 give slightly more importance to some of the proposed measures. They assessed the construction and modernization of the industrial sector (S26), the opening of local community development enterprises (S28), and tax relief (S32) as very important measures to improve quality of life. Respondents aged 35–50 show the highest readiness to improve quality of life.
Occupation has a significant impact on the respondents’ position on the importance of the proposed measures to improve quality of life. This is indicated by the results of the Mann–Whitney test shown in
Table 15. With their views on the importance of certain proposed measures, unemployed respondents show the greatest interest in improving quality of life. Employed respondents and retirees do not have a clearly defined position when it comes to certain measures, while students are mostly interested in all the proposed measures, i.e., they are mostly important to them.
Students and employed respondents see the construction of a sustainable and efficient agricultural sector (S25) as important, and for the unemployed this measure is very important. Retirees expressed a dilemma on this issue, i.e., they did not show very clearly that this measure is very important to them. On the other hand, those who are retired assessed the construction and modernization of the industrial sector as a measure that is very important to them (S26). This measure is also very important for the unemployed. Employed and unemployed respondents assessed the opening of companies for the development of the local community (S28) as a very important measure. Both students and retirees think that this measure is important, but for them it is less important than for the other two mentioned groups. The difference in attitude towards the importance of measures for improving quality of life depending on occupation also appears in the issue of lending to the economy (S31). For employees, this measure is neither important nor unimportant. Students and retirees rate it as mostly important, and for the unemployed it is of great importance. In general, the unemployed assess a large number of measures as very important, because they see the implementation of these measures as a chance for changing their status as an unemployed person.
The level of education of the respondents significantly affects the differences in attitudes about the importance of some of the proposed measures to improve quality of life (
Table 16). The differences are reflected in attitudes towards attracting foreign investors (S27), improving inter-municipal and regional cooperation (S29), developing cross-border cooperation (S30), and lending to the economy (S31).
Attracting foreign investors (S27), as a measure that will contribute to improving quality of life, is assessed as very important by the respondents who do not have a primary school education and those who have completed primary school. For those with a higher education, this measure is mostly important. When it comes to the improvement of inter-municipal and regional cooperation (S29), the respondents who did not finish primary school do not have a clearly defined attitude. On the other hand, those who graduated from college rate this measure as very important. For the surveyed persons who graduated from high school and university, this is generally an important measure for raising quality of life.
The development of cross-border cooperation (S30) is assessed by the respondents who completed primary school, college, and university as a mostly important measure for improving quality of life. Those who have not completed primary school have a clear position on the importance of cross-border cooperation. Those who have completed high school assess cross-border cooperation as very important. Lending to the economy (S31) is assessed as a very important measure of improvement by those respondents who have completed primary school or graduated from college. For those with other educational backgrounds, this measure is mostly important.
The level of monthly income of the respondents does not have a significant impact on attitudes towards the measures to improve quality of life, according to the result of the Mann–Whitney test. The only measure where the difference is statistically significant is the construction and modernization of the industrial sector (S26; p = 0.03). The respondents whose income is less than USD 200, and those with an income of USD 200–500, consider this measure mostly important, while those whose income is over USD 500 consider it very important.
The number of household members does not have much influence on attitudes towards measures to improve quality of life; it is the result of comparing the attitudes of the respondents. The only statistically significant difference in the attitudes towards measures to improve quality of life is in the opinion on the importance of lending to the economy (S31; p = 0.00). For respondents living alone, this measure is neither important nor unimportant. Those living in two-member households consider lending to the economy to be a very important measure for improving quality of life. Other categories of respondents believe that lending to the economy is generally an important measure for improving quality of life.
The last question in the questionnaire referred to personal opinions, proposals, and suggestions for improving quality of life. The respondents were expected to present their observations and suggestions by answering open-ended questions. Of the 424 surveyed individuals, 175 or approximately 41.3% answered this question. The vast majority of responses were related to the current economic situation, and all the proposed solutions aim to reduce unemployment by creating new jobs, increase incomes while reducing prices, and invest in agriculture and industry. Numerous proposals refer to greater engagement and sincere commitment in the work of those in charge of all private and state institutions.
Based on these responses, it is possible to draw a general conclusion that the poor economic situation is the main cause of dissatisfaction, along with a low standard of living. Limitations in the development of the economy are reflected, primarily, in the insufficient use of existing capacities. Problems are also prominent in the decline in production, the difficult financial situation various businesses find themselves in, the unemployment rate, incomplete privatization processes, the stagnation of small businesses, and the stagnation of the trade in services. For most of the respondents, agricultural production is very important. The current limitations in development can be overcome with a renewal of agricultural production. Special importance should be given to the mechanisms and measures of the regional political development of insufficiently developed and depopulated areas. However, with the strengthening of agriculture and the specialization of agricultural production, we can expect to see a surplus in the workforce in that particular field. That is why, from an economic point of view, the focus should be on other activities, such as industry and tourism.
The most important existing capacities lie in the food industry, and potential ones in the fields of food, chemical, wood, and textile industry. The development of tourism should be in cooperation with the development of homemade crafts (as the fundamental or additional source of income of the households) [
88,
89], so that the manufacture of objects would be in the function of the development of tourism. This would further keep the population active and keep young people in rural areas, so that they could, by offering tourist services, in part overcome the problem of unemployment [
90].
Transit is one of the main features of the geographical location of Srem. The E-70 highway and a railroad connecting Serbia and Western Europe crosses this area. An increase in the transport of goods and passengers would certainly benefit the entire region. When Croatia joined the European Union, the importance of border crossings and the border regions of Srem increased even more. The fact that Srem is the only region in Serbia that borders Croatia by land certainly contributes to the fact that trade with the European Union takes place across this territory. A significant potential of the future economic development of the region of Srem is also to be found in the proximity of large consumer centers such as Belgrade and Novi Sad, and the proximity of the borders with Croatia and Bosnia and Herzegovina. However, this may prove to be a disadvantage as well, since Belgrade is a powerful magnet of internal migration. There is also the alluring power of the markets of neighboring countries of the European Union [
91], which is becoming increasingly more prominent, and thereby rendering the problem of keeping young people in rural areas even greater.
5. Conclusions
This study examined local communities’ perceived quality of life and well-being in the context of rural sustainability. The results of the study showed a medium or low level of satisfaction with most indicators, and confirmed the assumption of differences in the perception and self-assessment of subjective well-being in relation to the socio-demographic characteristics of the surveyed population. The proposed measures to improve quality of life are in most cases highly rated, with a willingness to engage further in solving local community problems. As the results relate to Serbian rural areas, any generalization must take into account the fact that issues of rural settlement sustainability may vary from place to place. Therefore, there is a need to formulate site-specific policies with the ability to recognize the specific context of sustainability at the local level. By applying the above list of indicators or their modification in accordance with the development tendencies of the area, such research can be applied to other depopulated settlements anywhere in the world. By committing to research on well-being at the domain level (for example, agriculture, tourism, crafts), clear guidelines can be obtained for economic investments in a particular niche.
Measuring well-being has the potential to offer a lot of new information and insights into the quality of life of local rural communities. A more coherent framework for measuring well-being at the local level would help local authorities to explore and understand some of the problems local communities face. Such research can have implications in addressing rural community problems and overcoming local resources, which are sometimes limited. Although the measuring of subjective well-being differs from more objective indicators of quality of life at the local level, such as crime rates, economic activity rates, data on local air pollution, these measures provide valuable insight and a way for local authorities to understand and respond to local needs. Good measurement should provide new information that can be used to inform local decisionmakers to achieve better public services, improve community life, and improve outcomes in the local area. An important role is played by the way in which local authorities and decision makers analyze and interpret information on the subjective well-being of people, along with objective data obtained from official statistics as key elements in the process of planning the development of local rural communities.
A comprehensive set of domain-level well-being indicators for use at the local level provides local authorities with a wealth of information and an evidence base needed to demonstrate a genuine understanding of local needs, and enables local authorities to enhance their role in shaping the area by taking actions relevant to their specific local context. The obtained research data according to age, gender, education, etc., additionally ensure that an understanding of different local needs is achieved.
Several limitations in this research were also noticed, which could be overcome in some future work. First, the list of indicators could be expanded further. Second, the scope of the research could be extended to a larger number of settlements and rural areas in other regions of Serbia. Additionally, similar research can be conducted in neighboring countries that share the same or similar patterns of demographic and economic development (primarily the countries of the former Yugoslavia), as well as other middle or less developed countries in Europe and the rest of the world. Third, the sample in the study was selected using the convenience sampling technique, so the probability sampling technique could be introduced in subsequent studies.
Nevertheless, the paper makes a broad contribution to creating proposals for measuring well-being that will support local authorities in their role in shaping places, improving their understanding of the feelings and experiences of the residents, and contributing to the survival and vitality of rural communities.


 ,
, 


