
Design and Deployment of Vehicular Internet of Things for Smart City Applications


Abstract
:1. Introduction
1.1. V-IoT Generalized Architecture
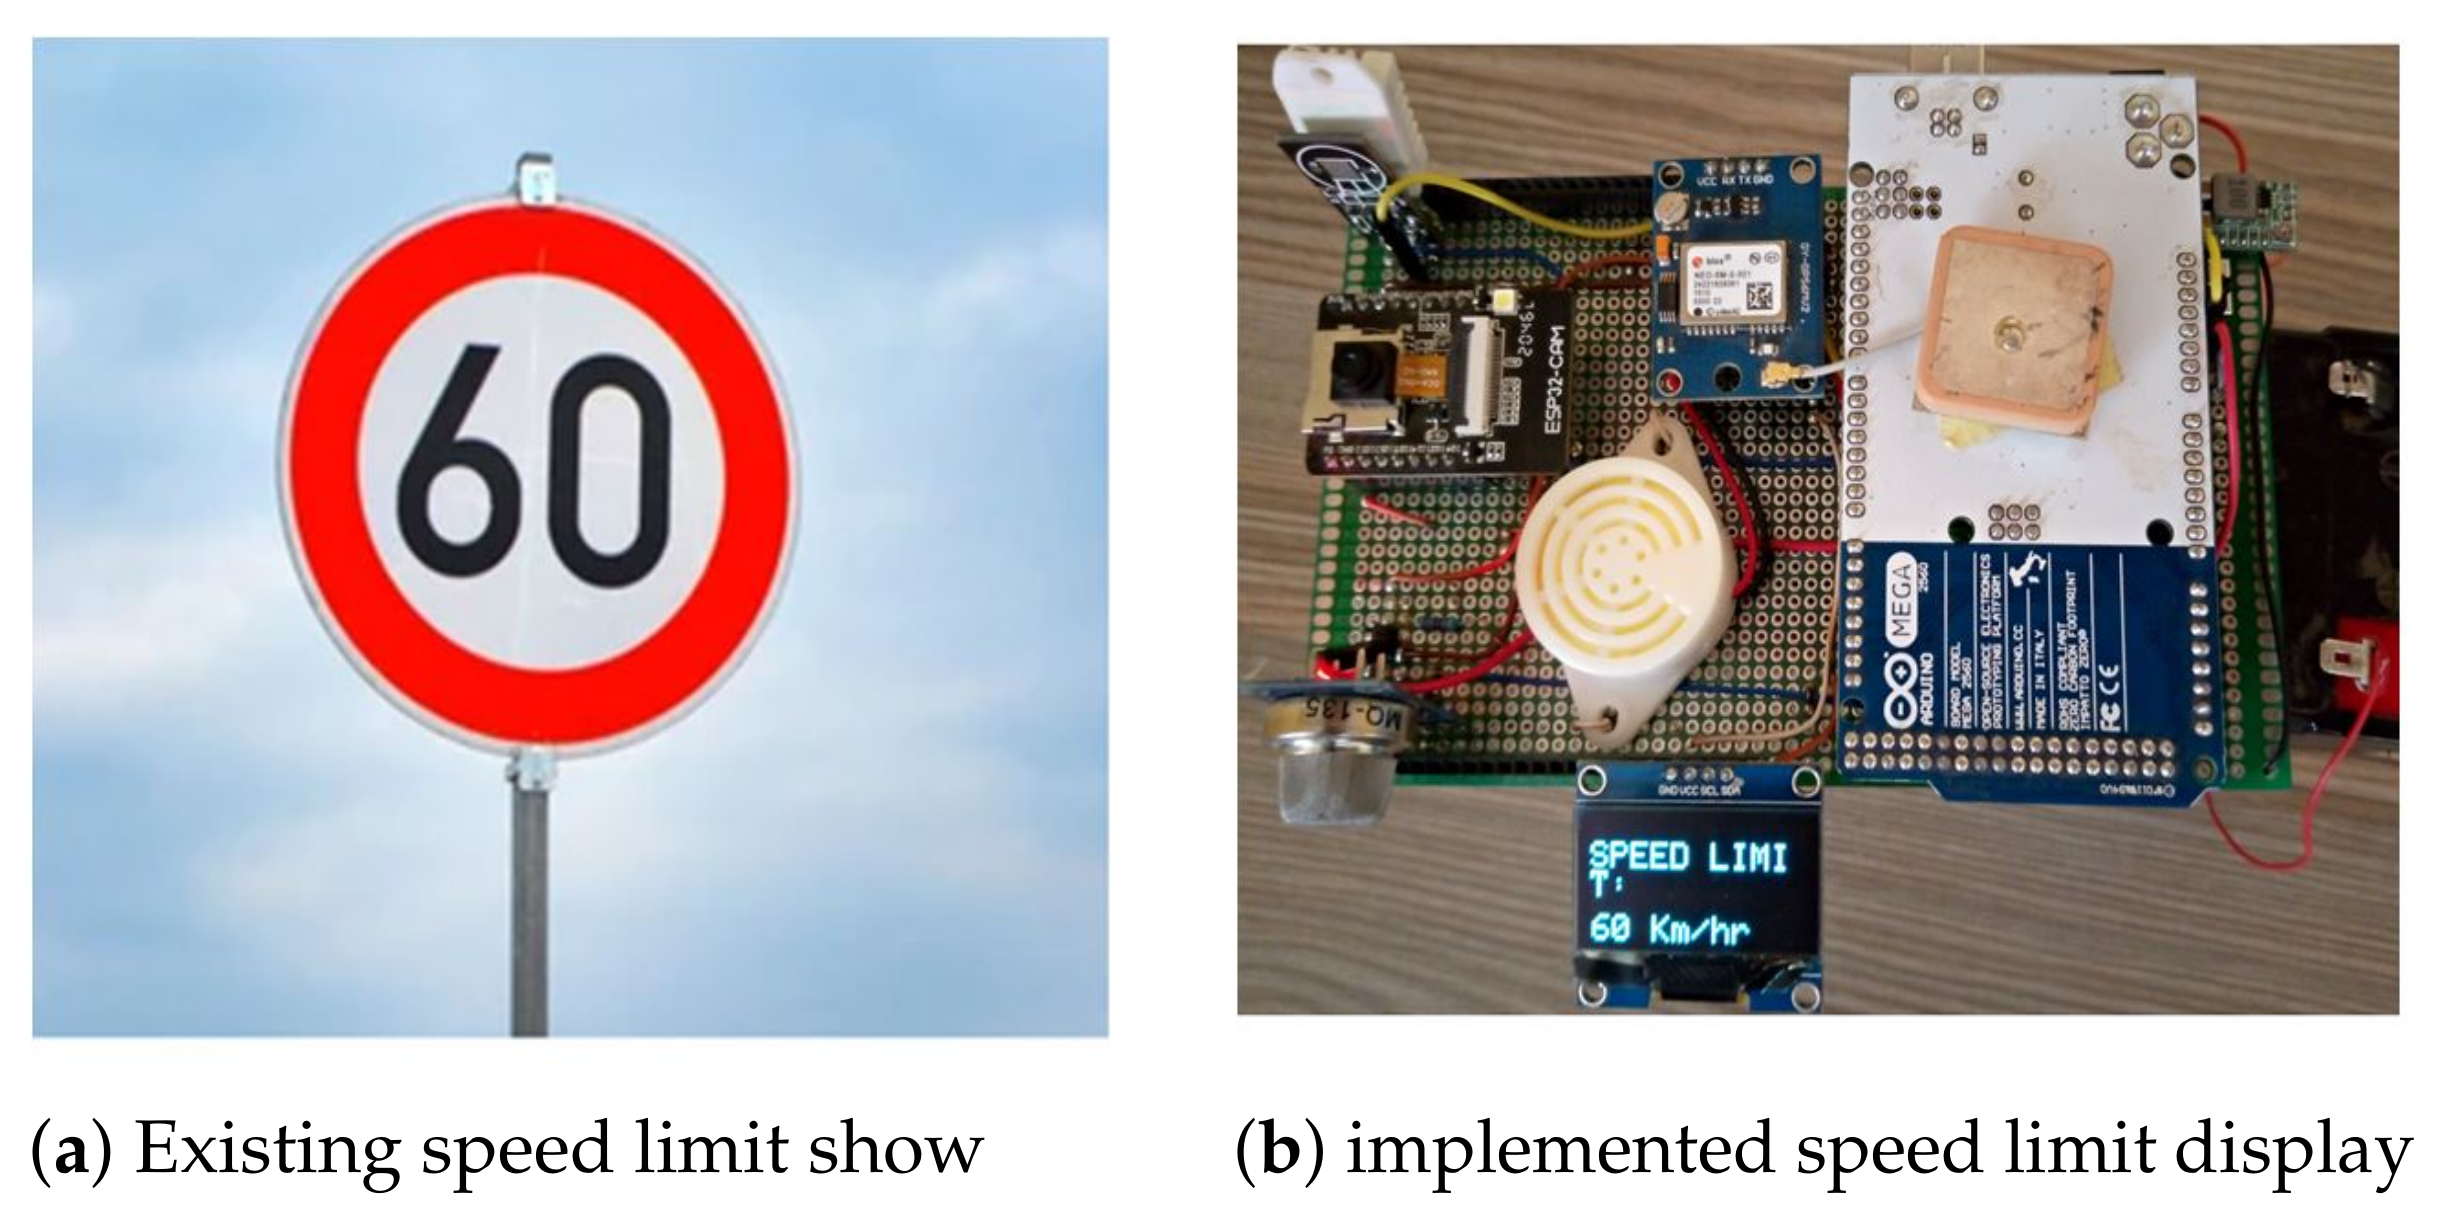
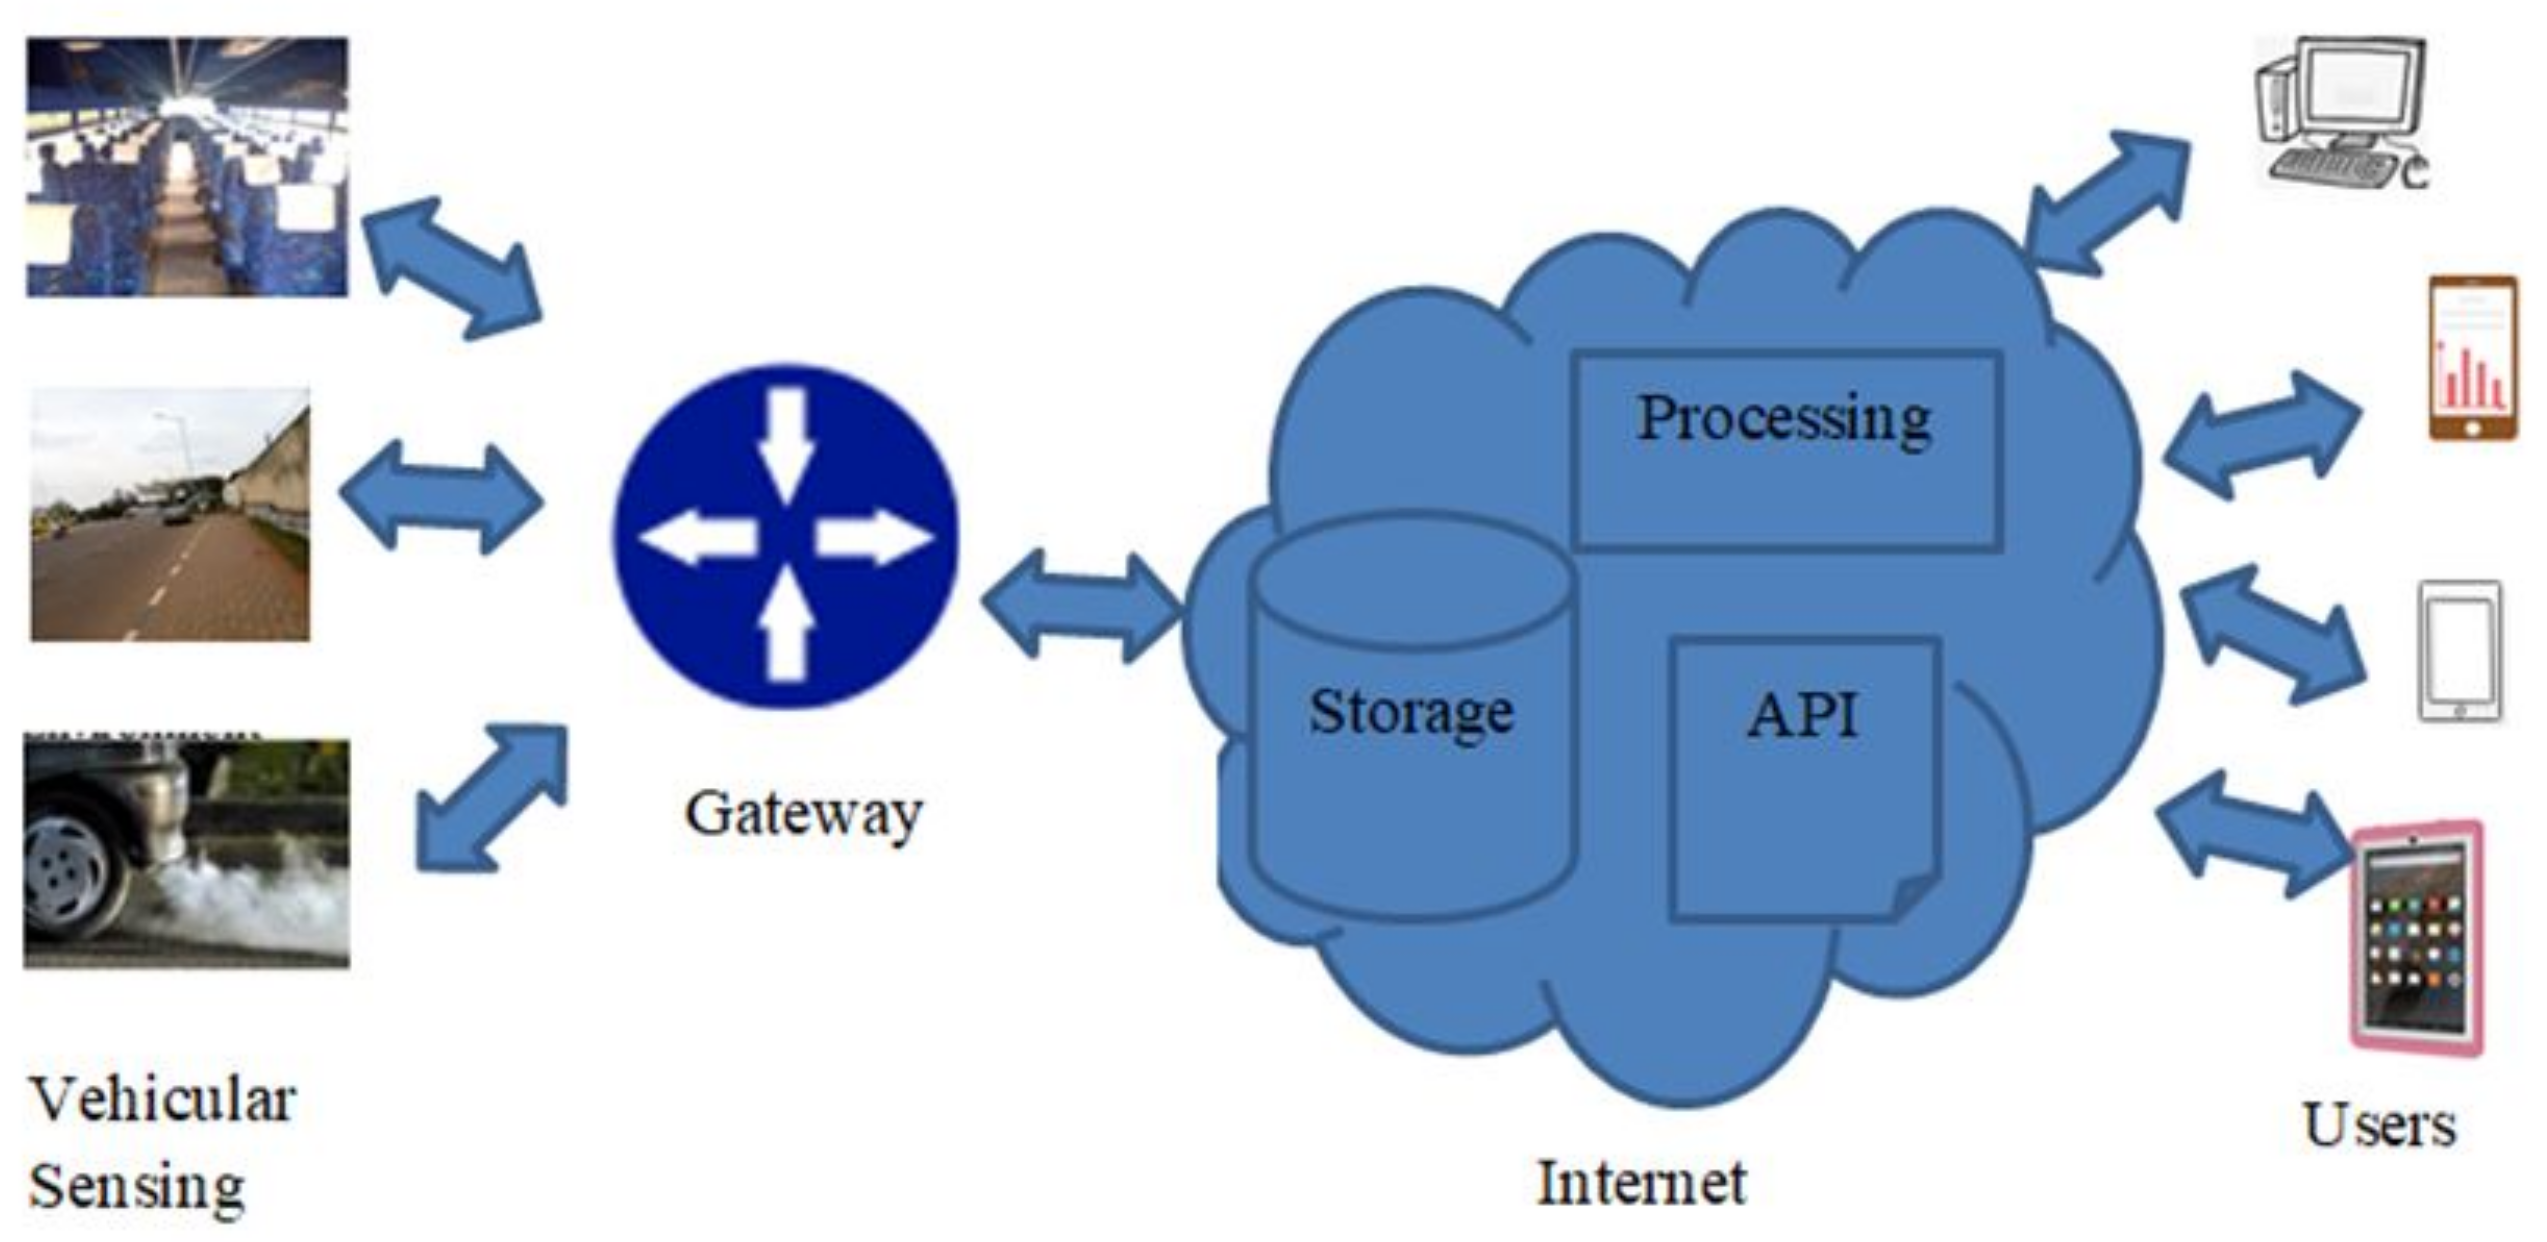
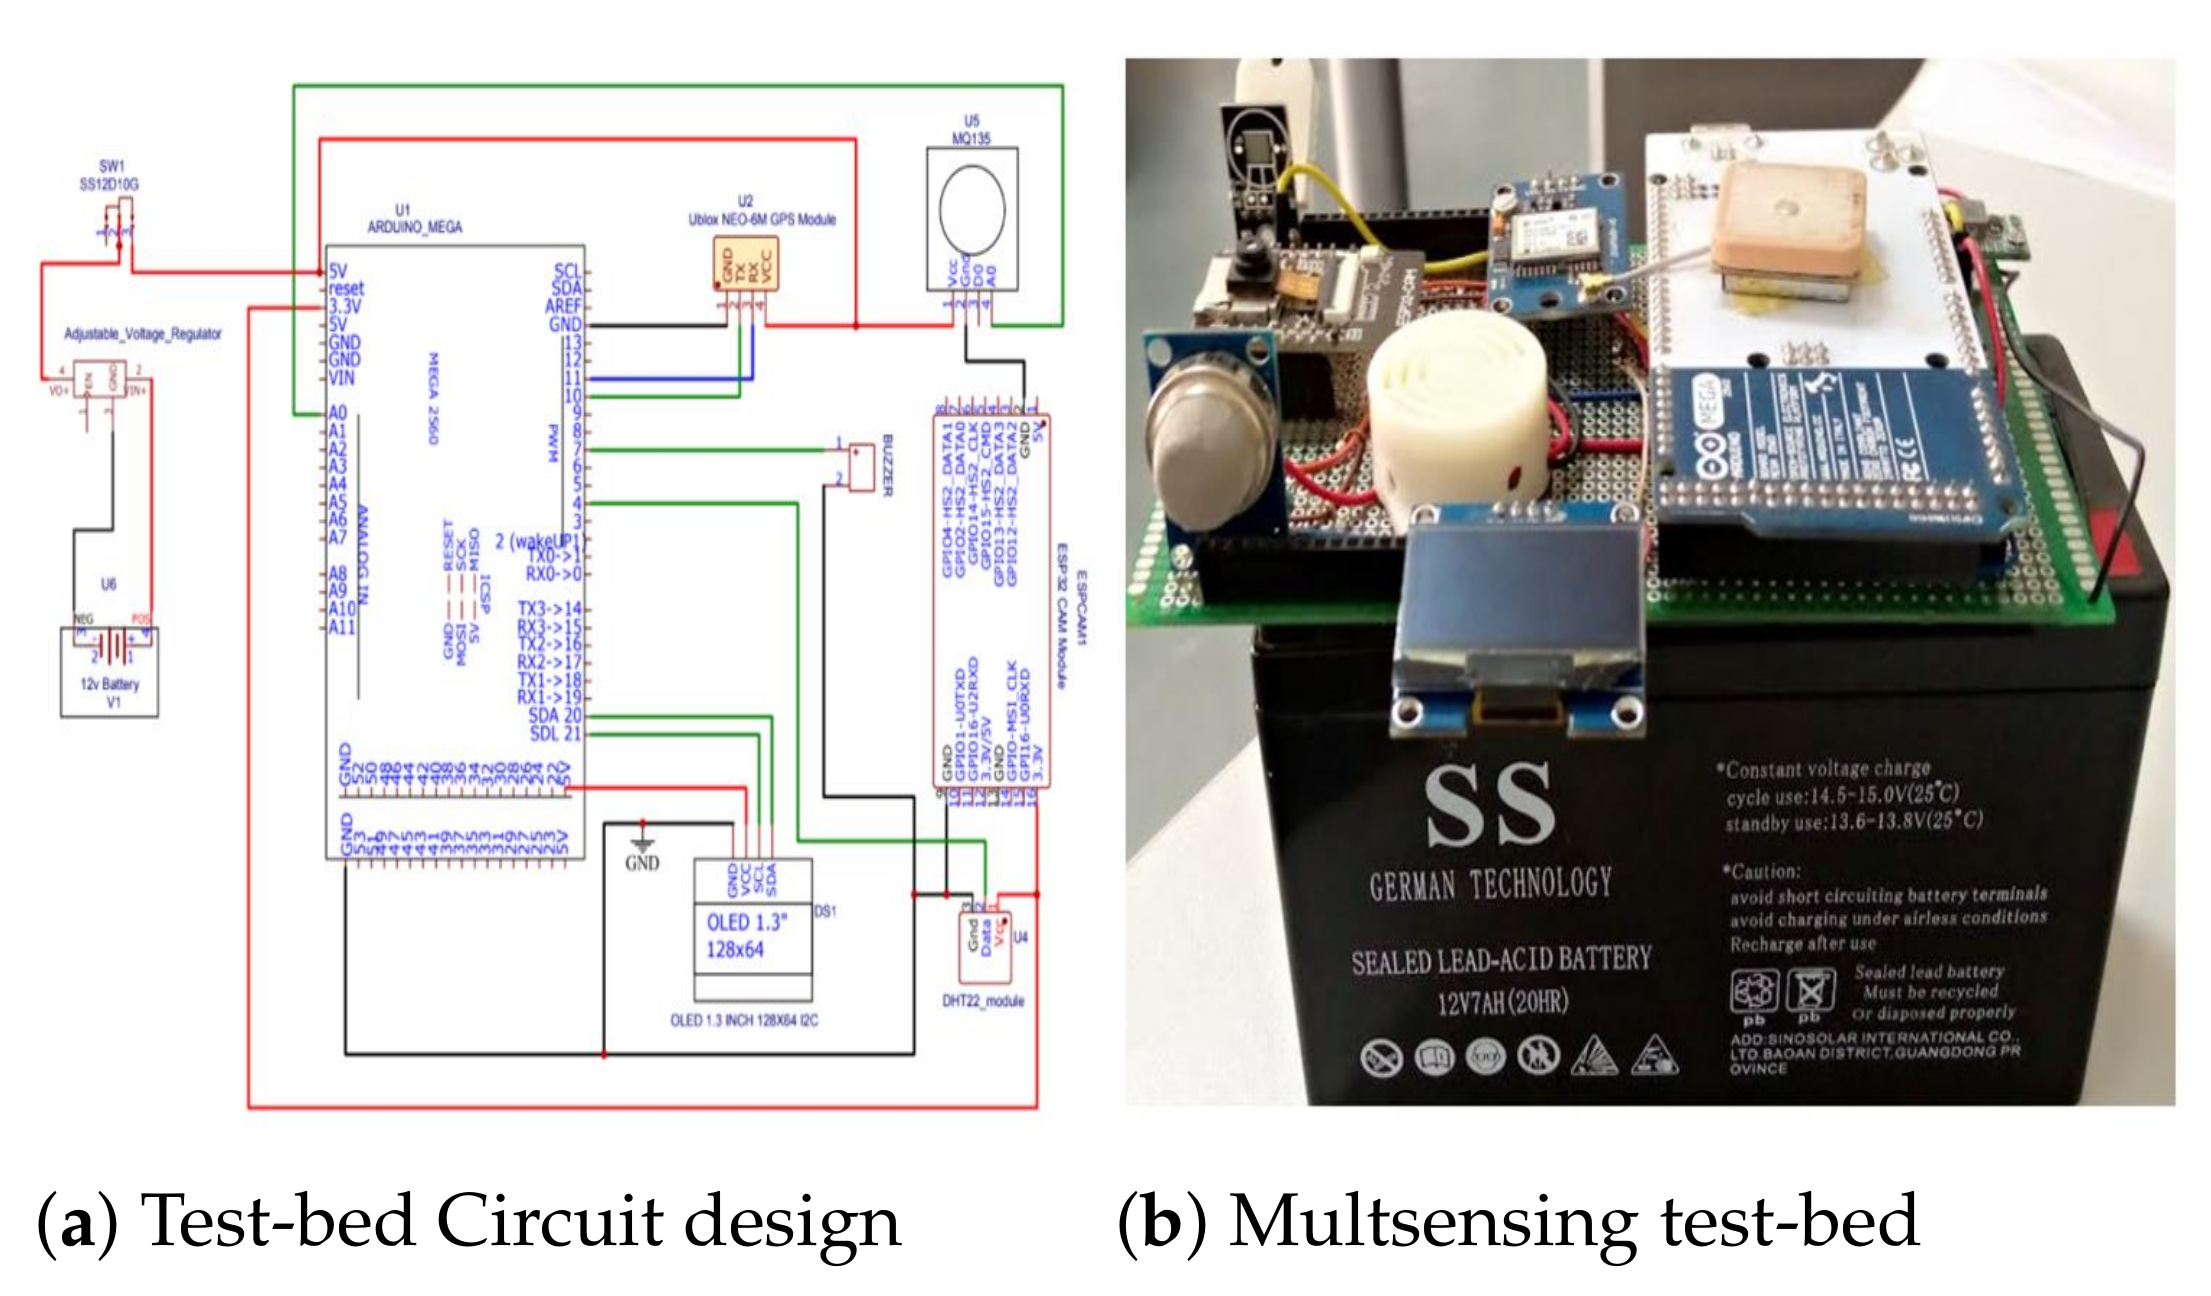
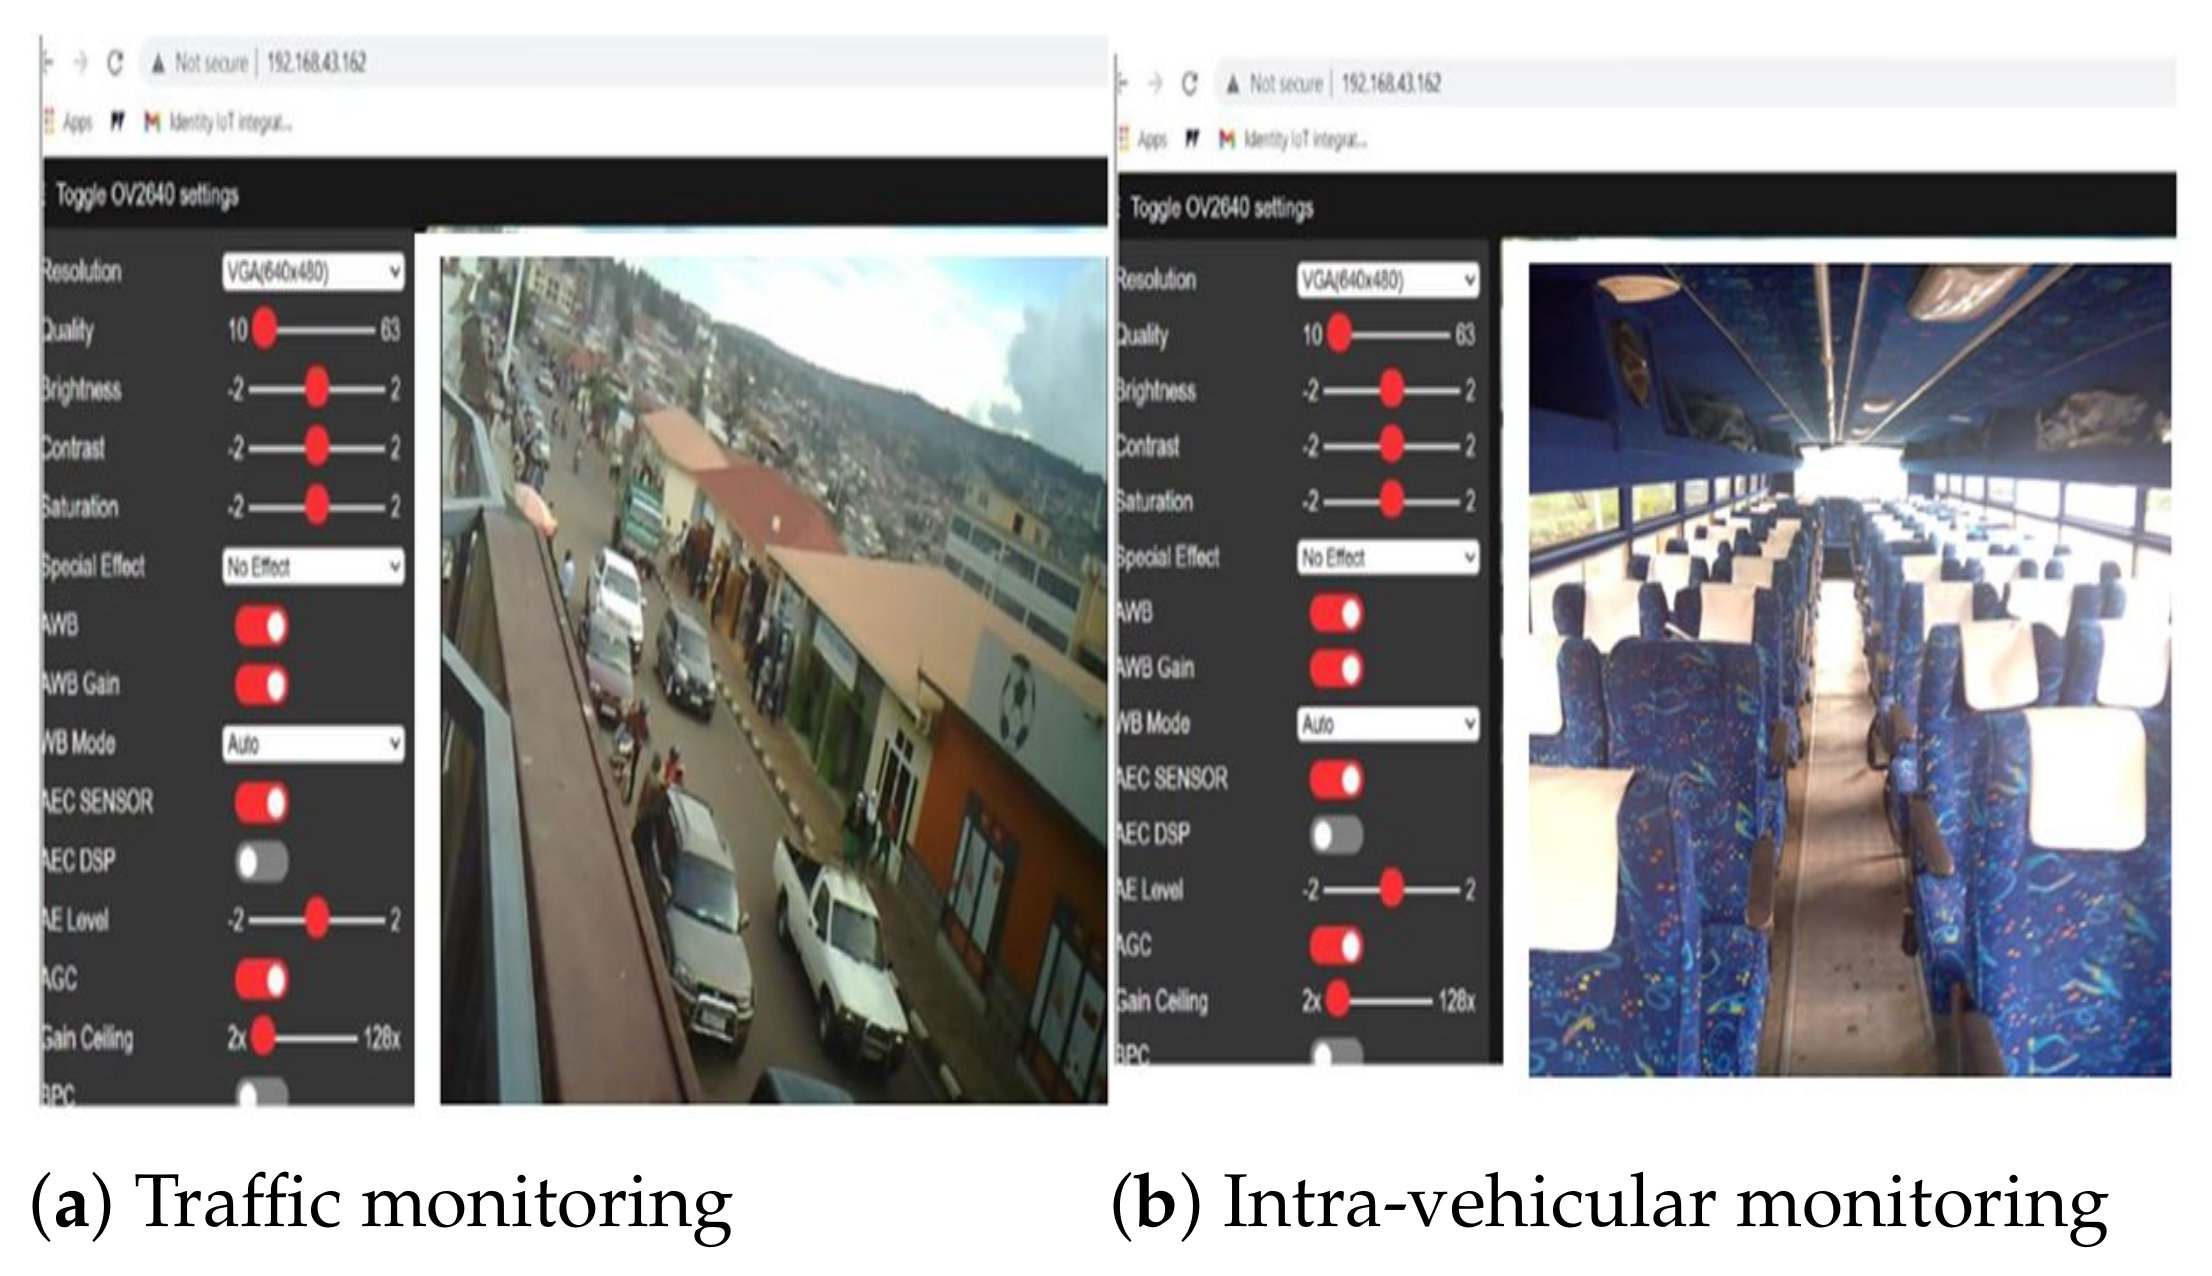
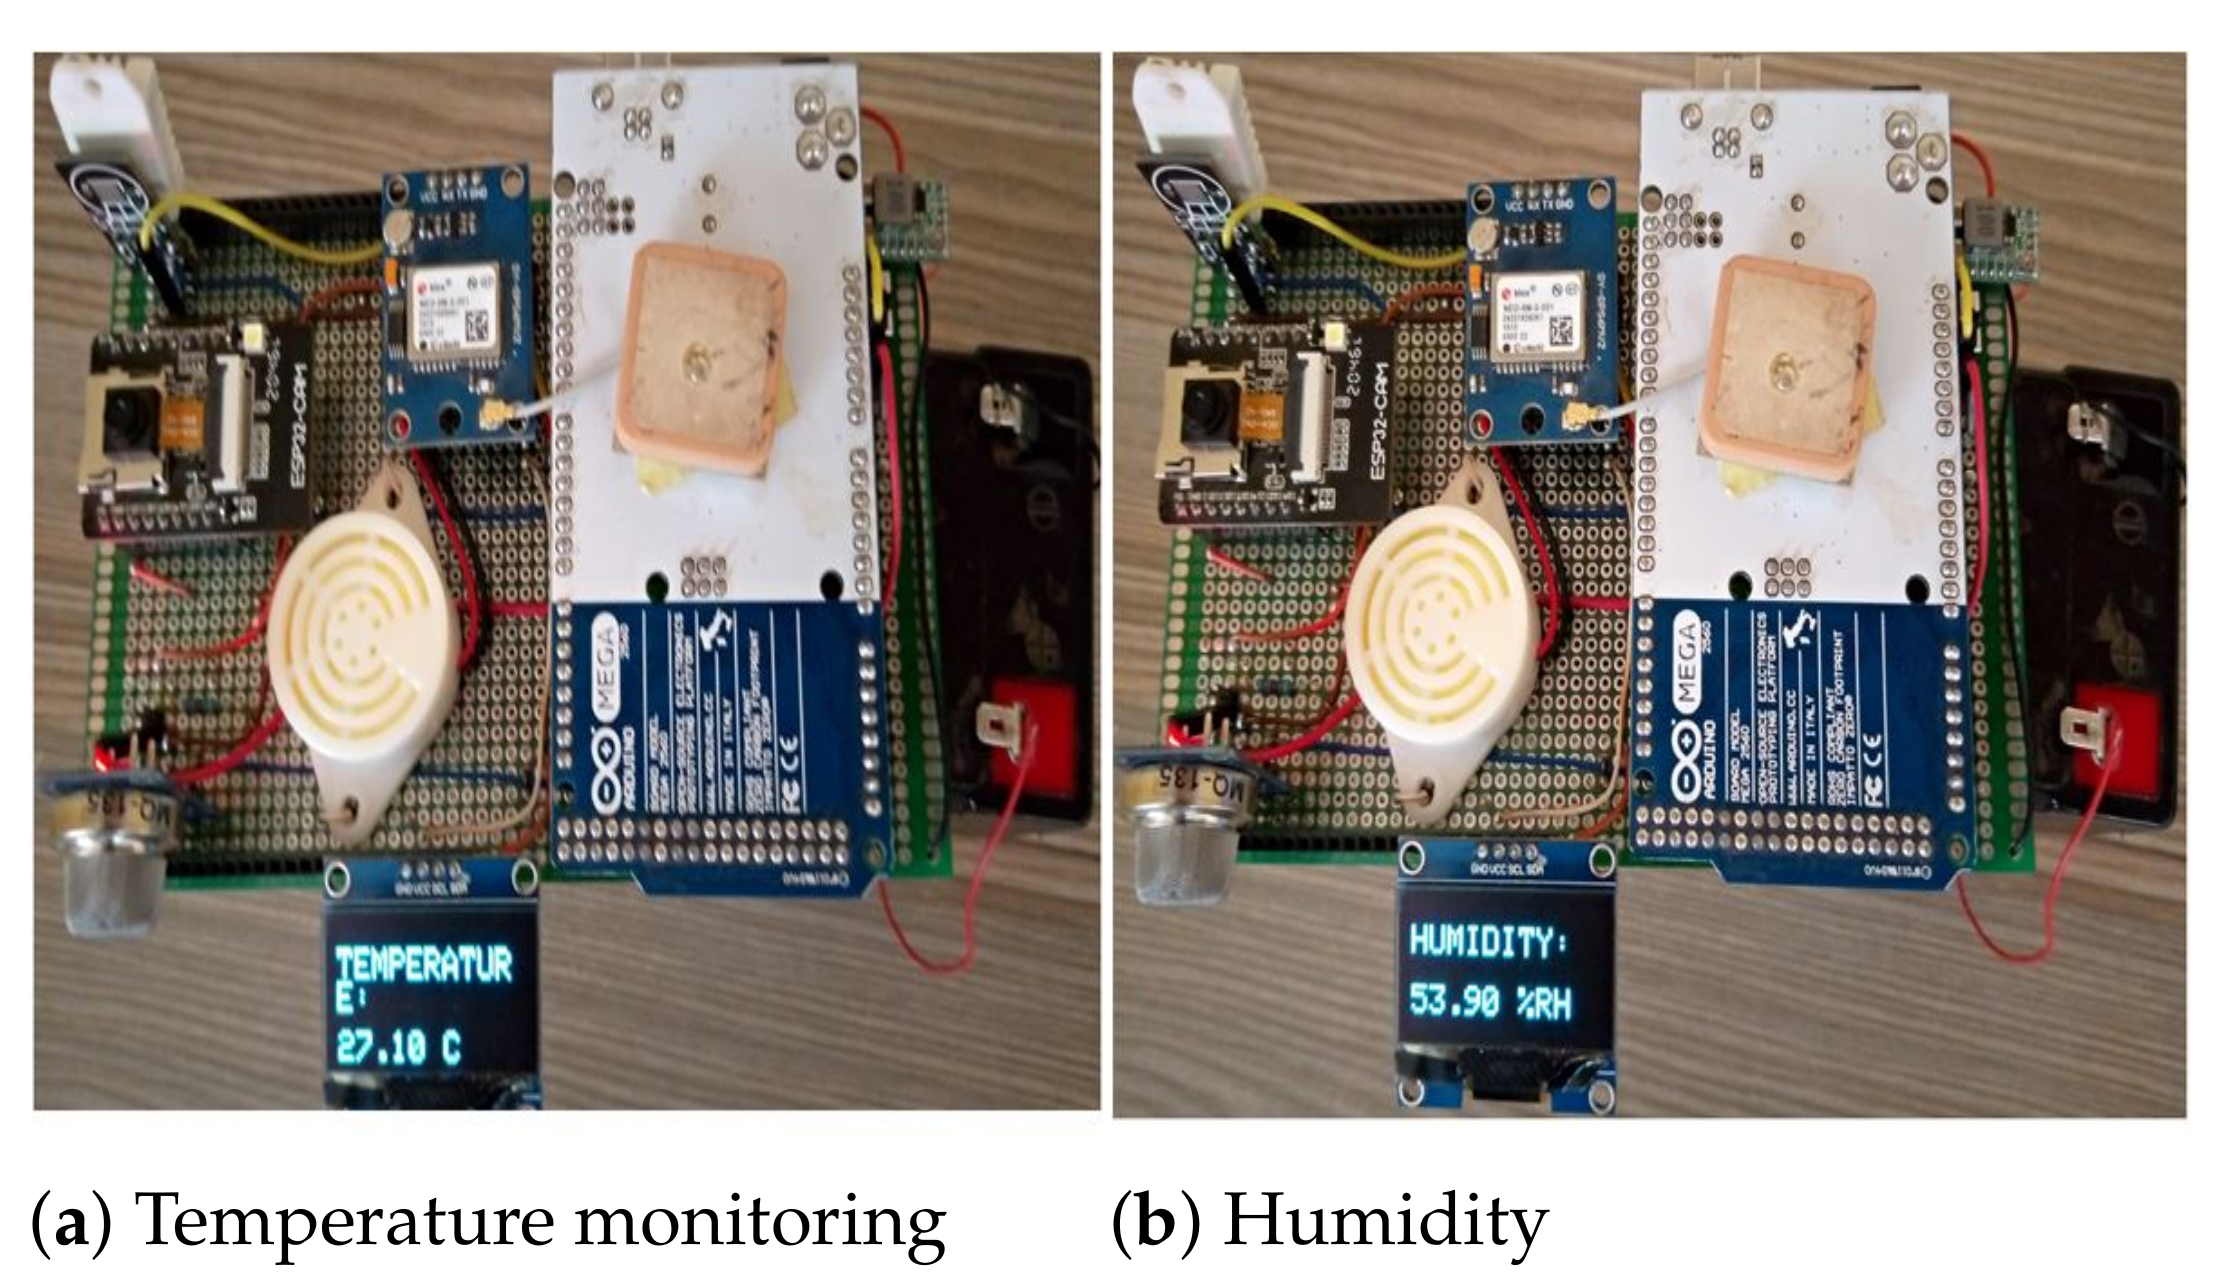
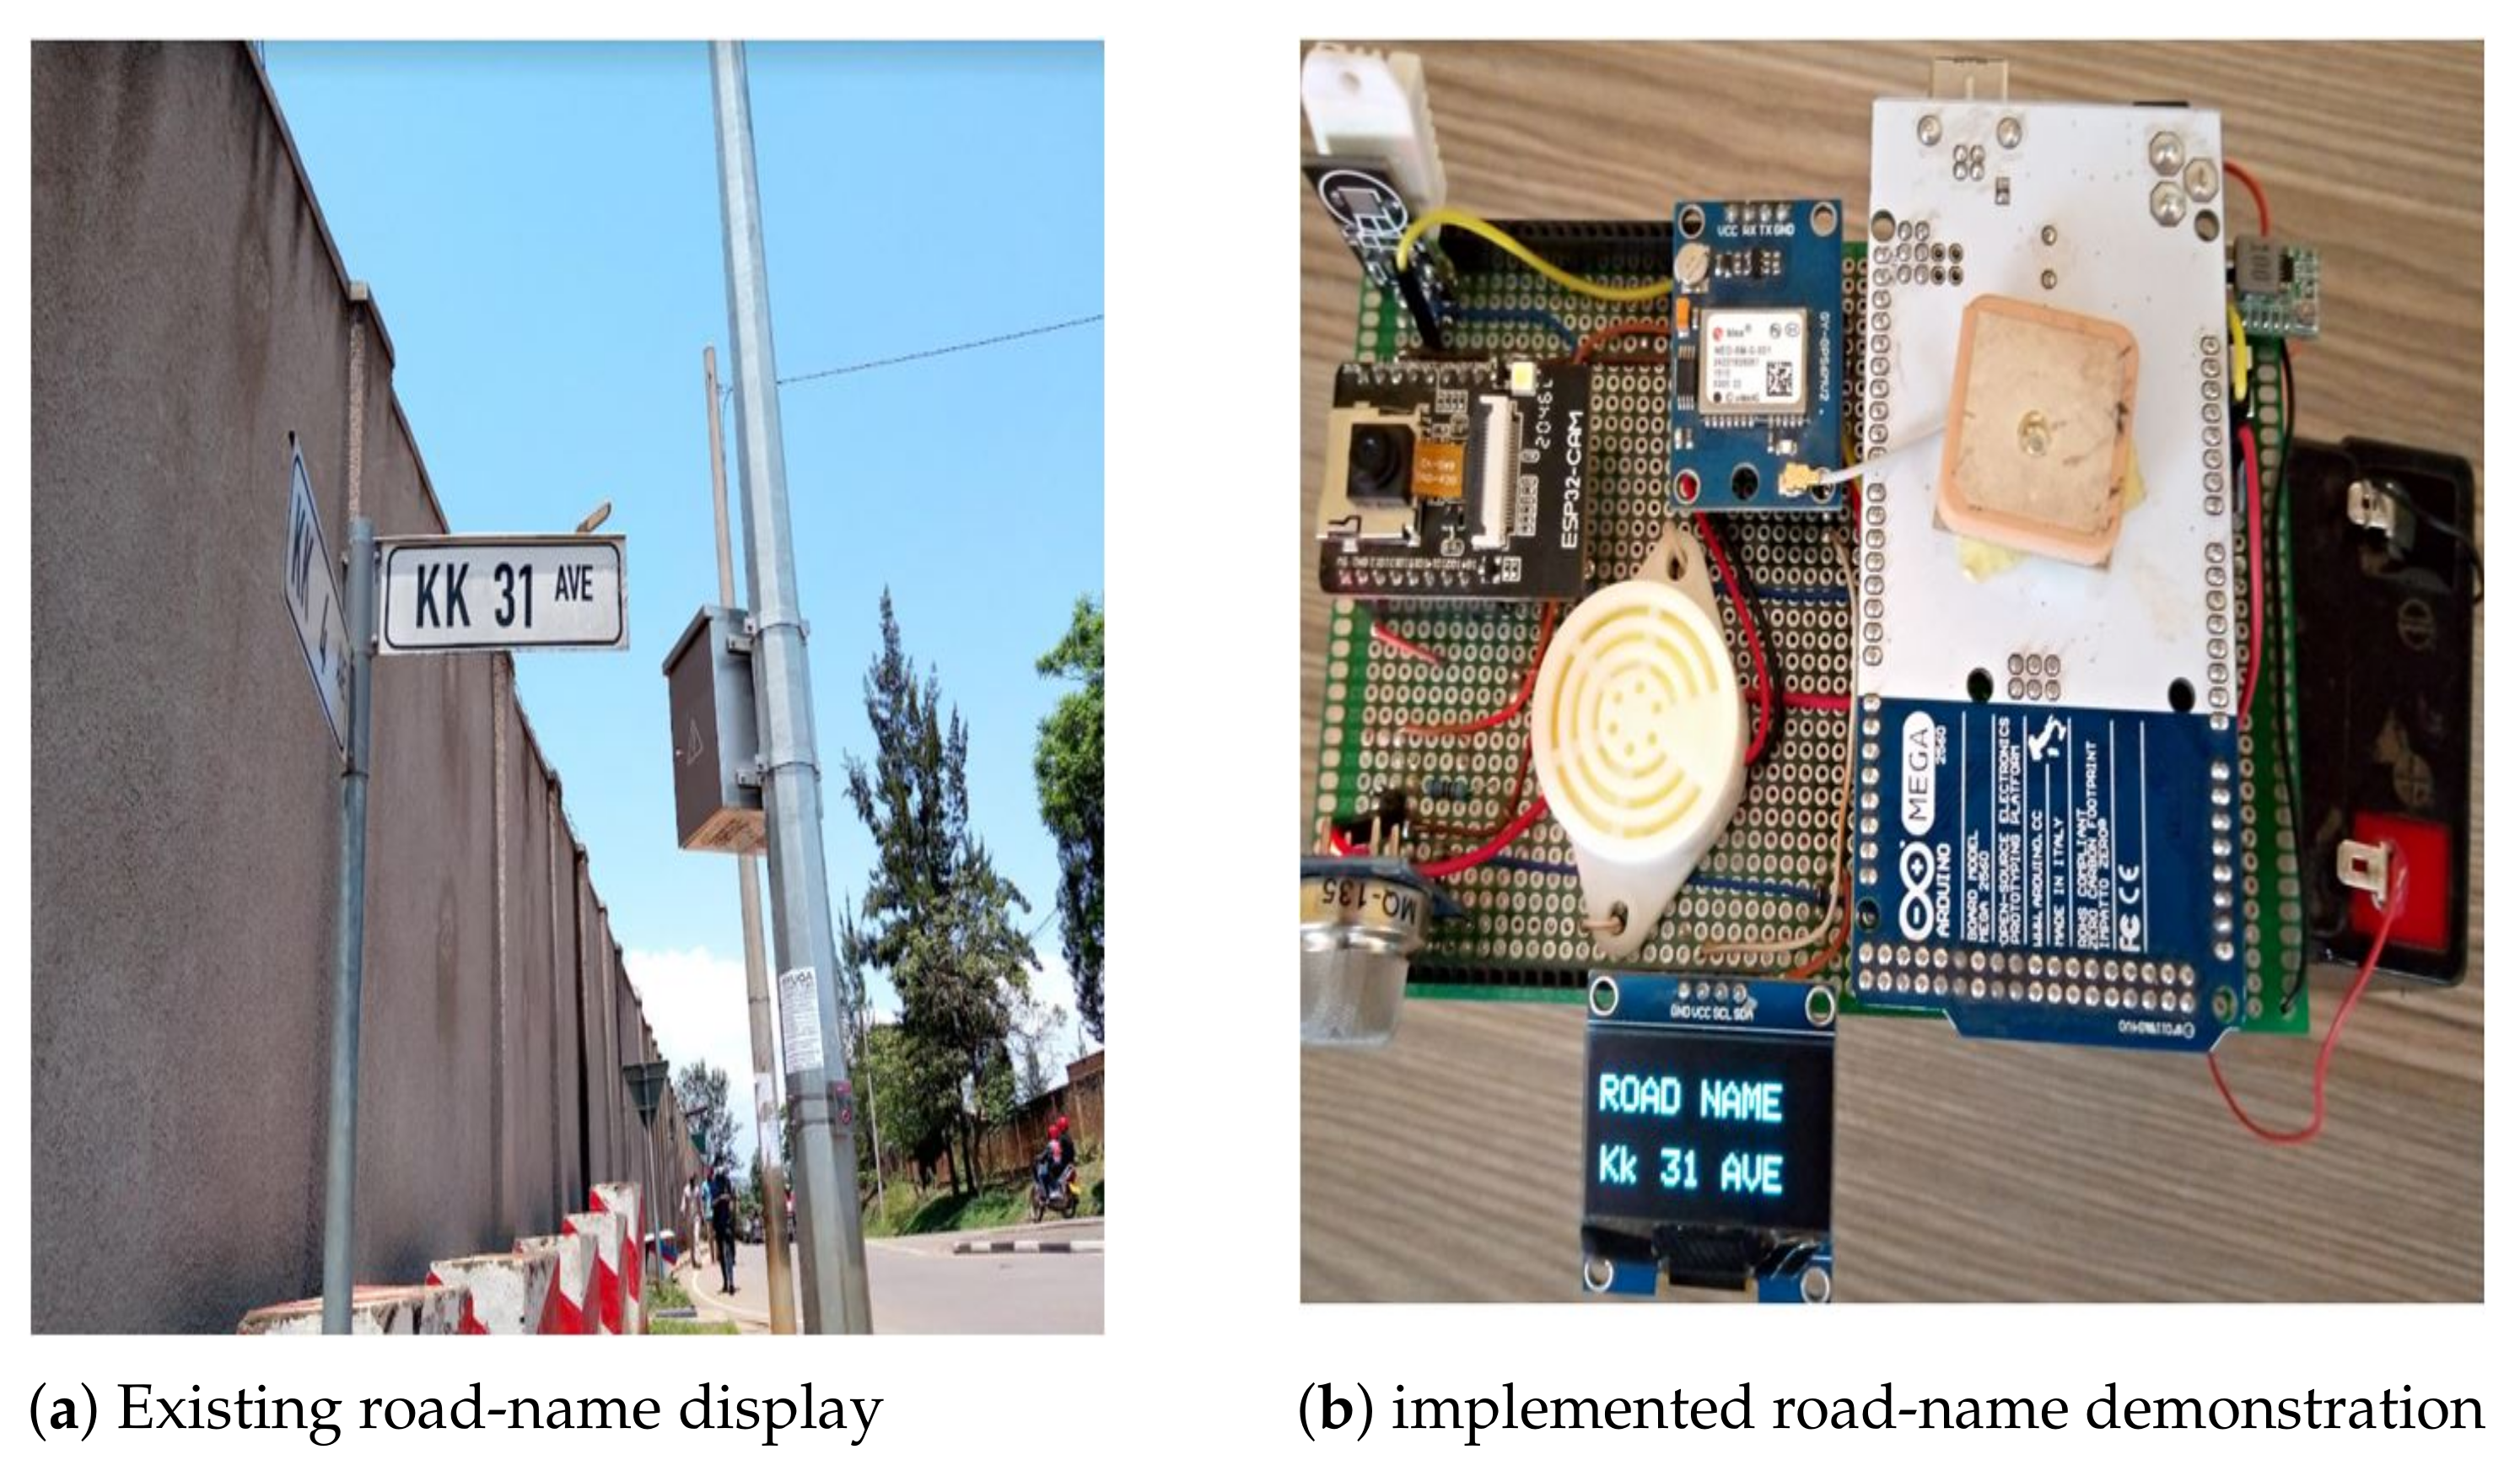
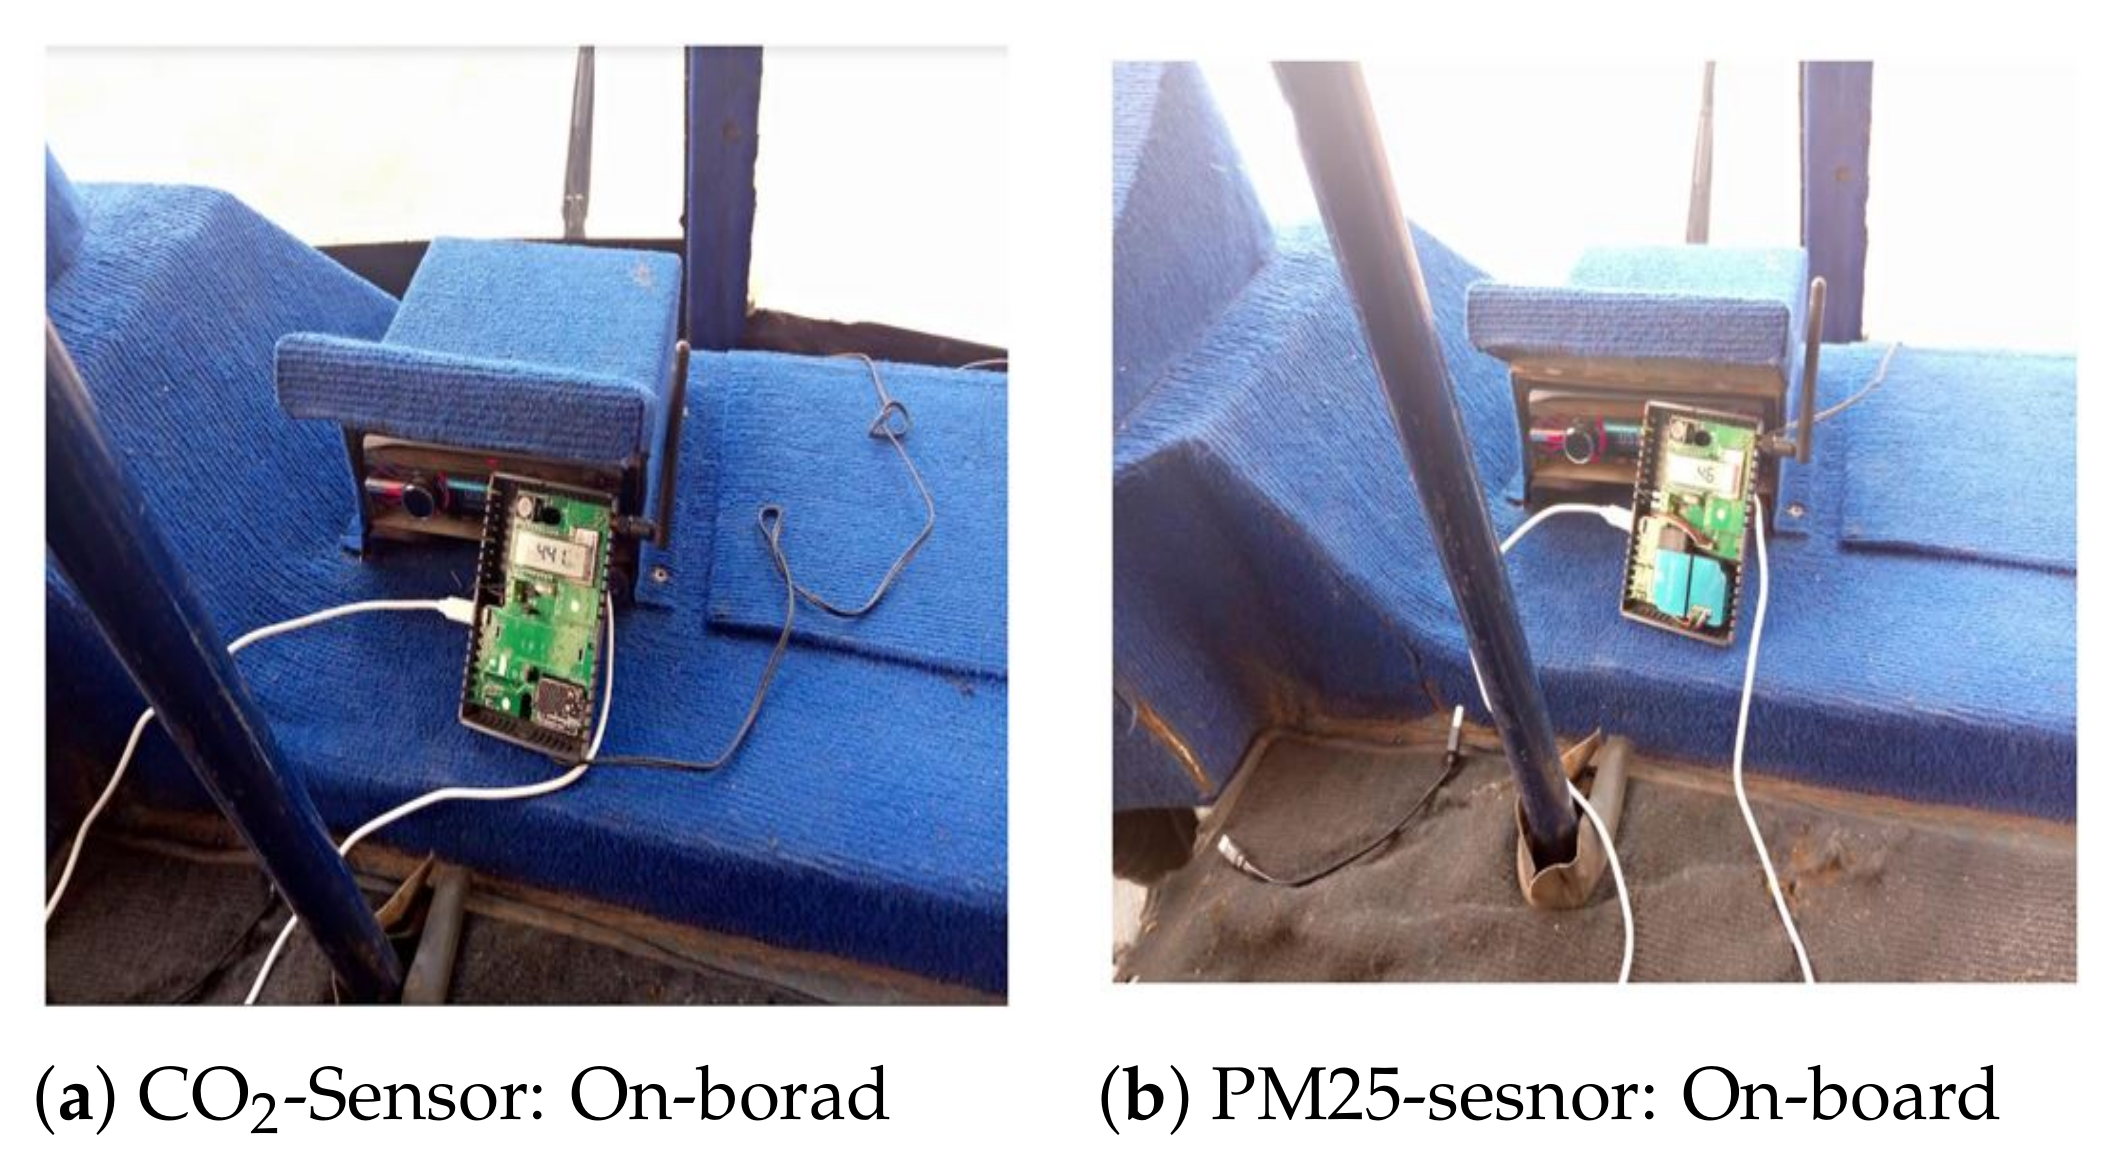
- V-IoT Perception LayerThe fist layer in a V-IoT architecture the perception layer is found at the bottom of the architecture. It comprises of different vehicular sensors that gather and collect data from the vehicle itself and its environment. In our developed systems, we have implement a multi-sensing IoT unit and deployed it at the perception layer to collect relevant information that are important for seamless driving in the case study area. The unit comprises of web-cam, GPS, air quality, weather monitoring sensing modules, and buzzers to actuate alarms in case of abnormal level of the monitored parameters.
- V-IoT Network LayerThe network layer interconnects the smart devices at the perception to the dedicated network infrastructure like network devices, gateways, severs, needed for data transmission and processing. The network layer links the things layer with application layer. The network infrastructures such as gateways, application servers, are all configured at the network layer of the IoT architecture to converge all collected data from the vehicular entities and environments to the dedicated storage and processing systems for further analysis and presentation.
- V-IoT Application LayerThe application layer is the top-most layer that extends the V-IoT architecture to the end-users that are truly concerned. Mobile applications, machine learning applications, data analysis and visualization are found at the application layer. Users could interact with the IoT system through the developed application programming interfaces (APIs). Several Web based front-end IoT platforms are available for specific applications configuration and customization. Sensors, gateways, edge, and cloud configuration could be carried out at this layer. Novel machine learning and artificial algorithms are also implemented based on the needs of end-users.
1.2. Benefits of V-IoT
- (i)
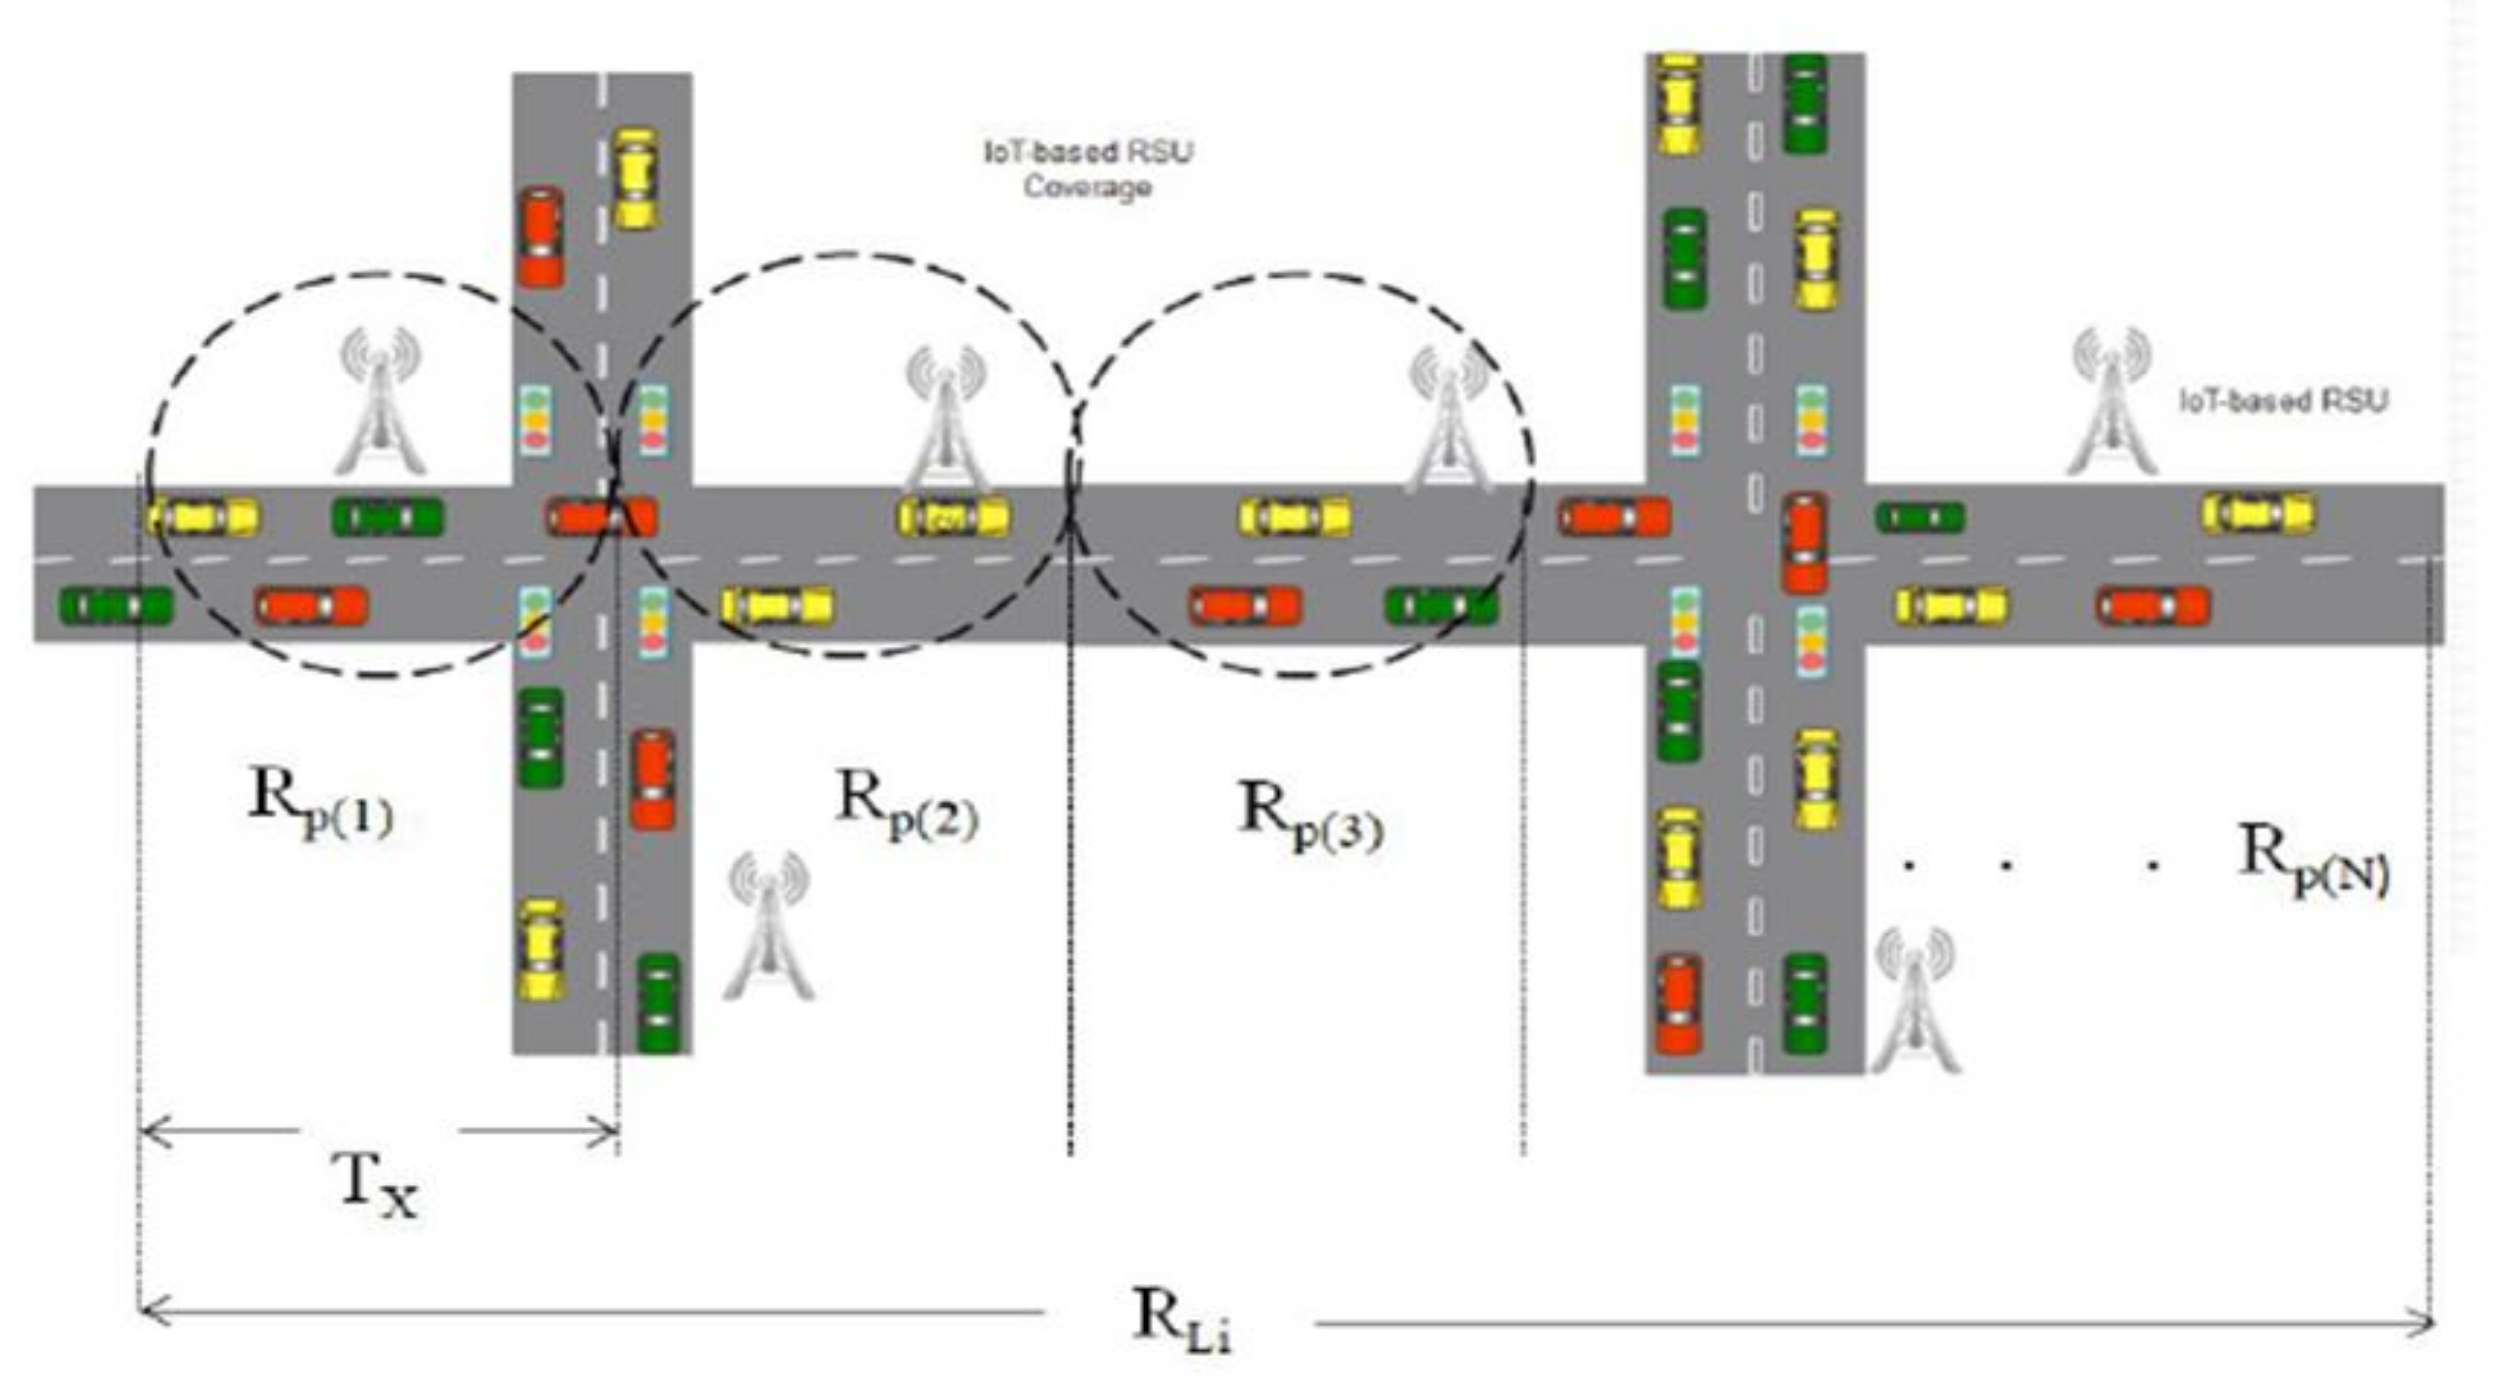
- Wide coverageIn urban environments, vehicles are ubiquitous in nature, this creates a pervasive communication in an ad hoc manner that covers large areas in urban areas including highways [13].
- (ii)
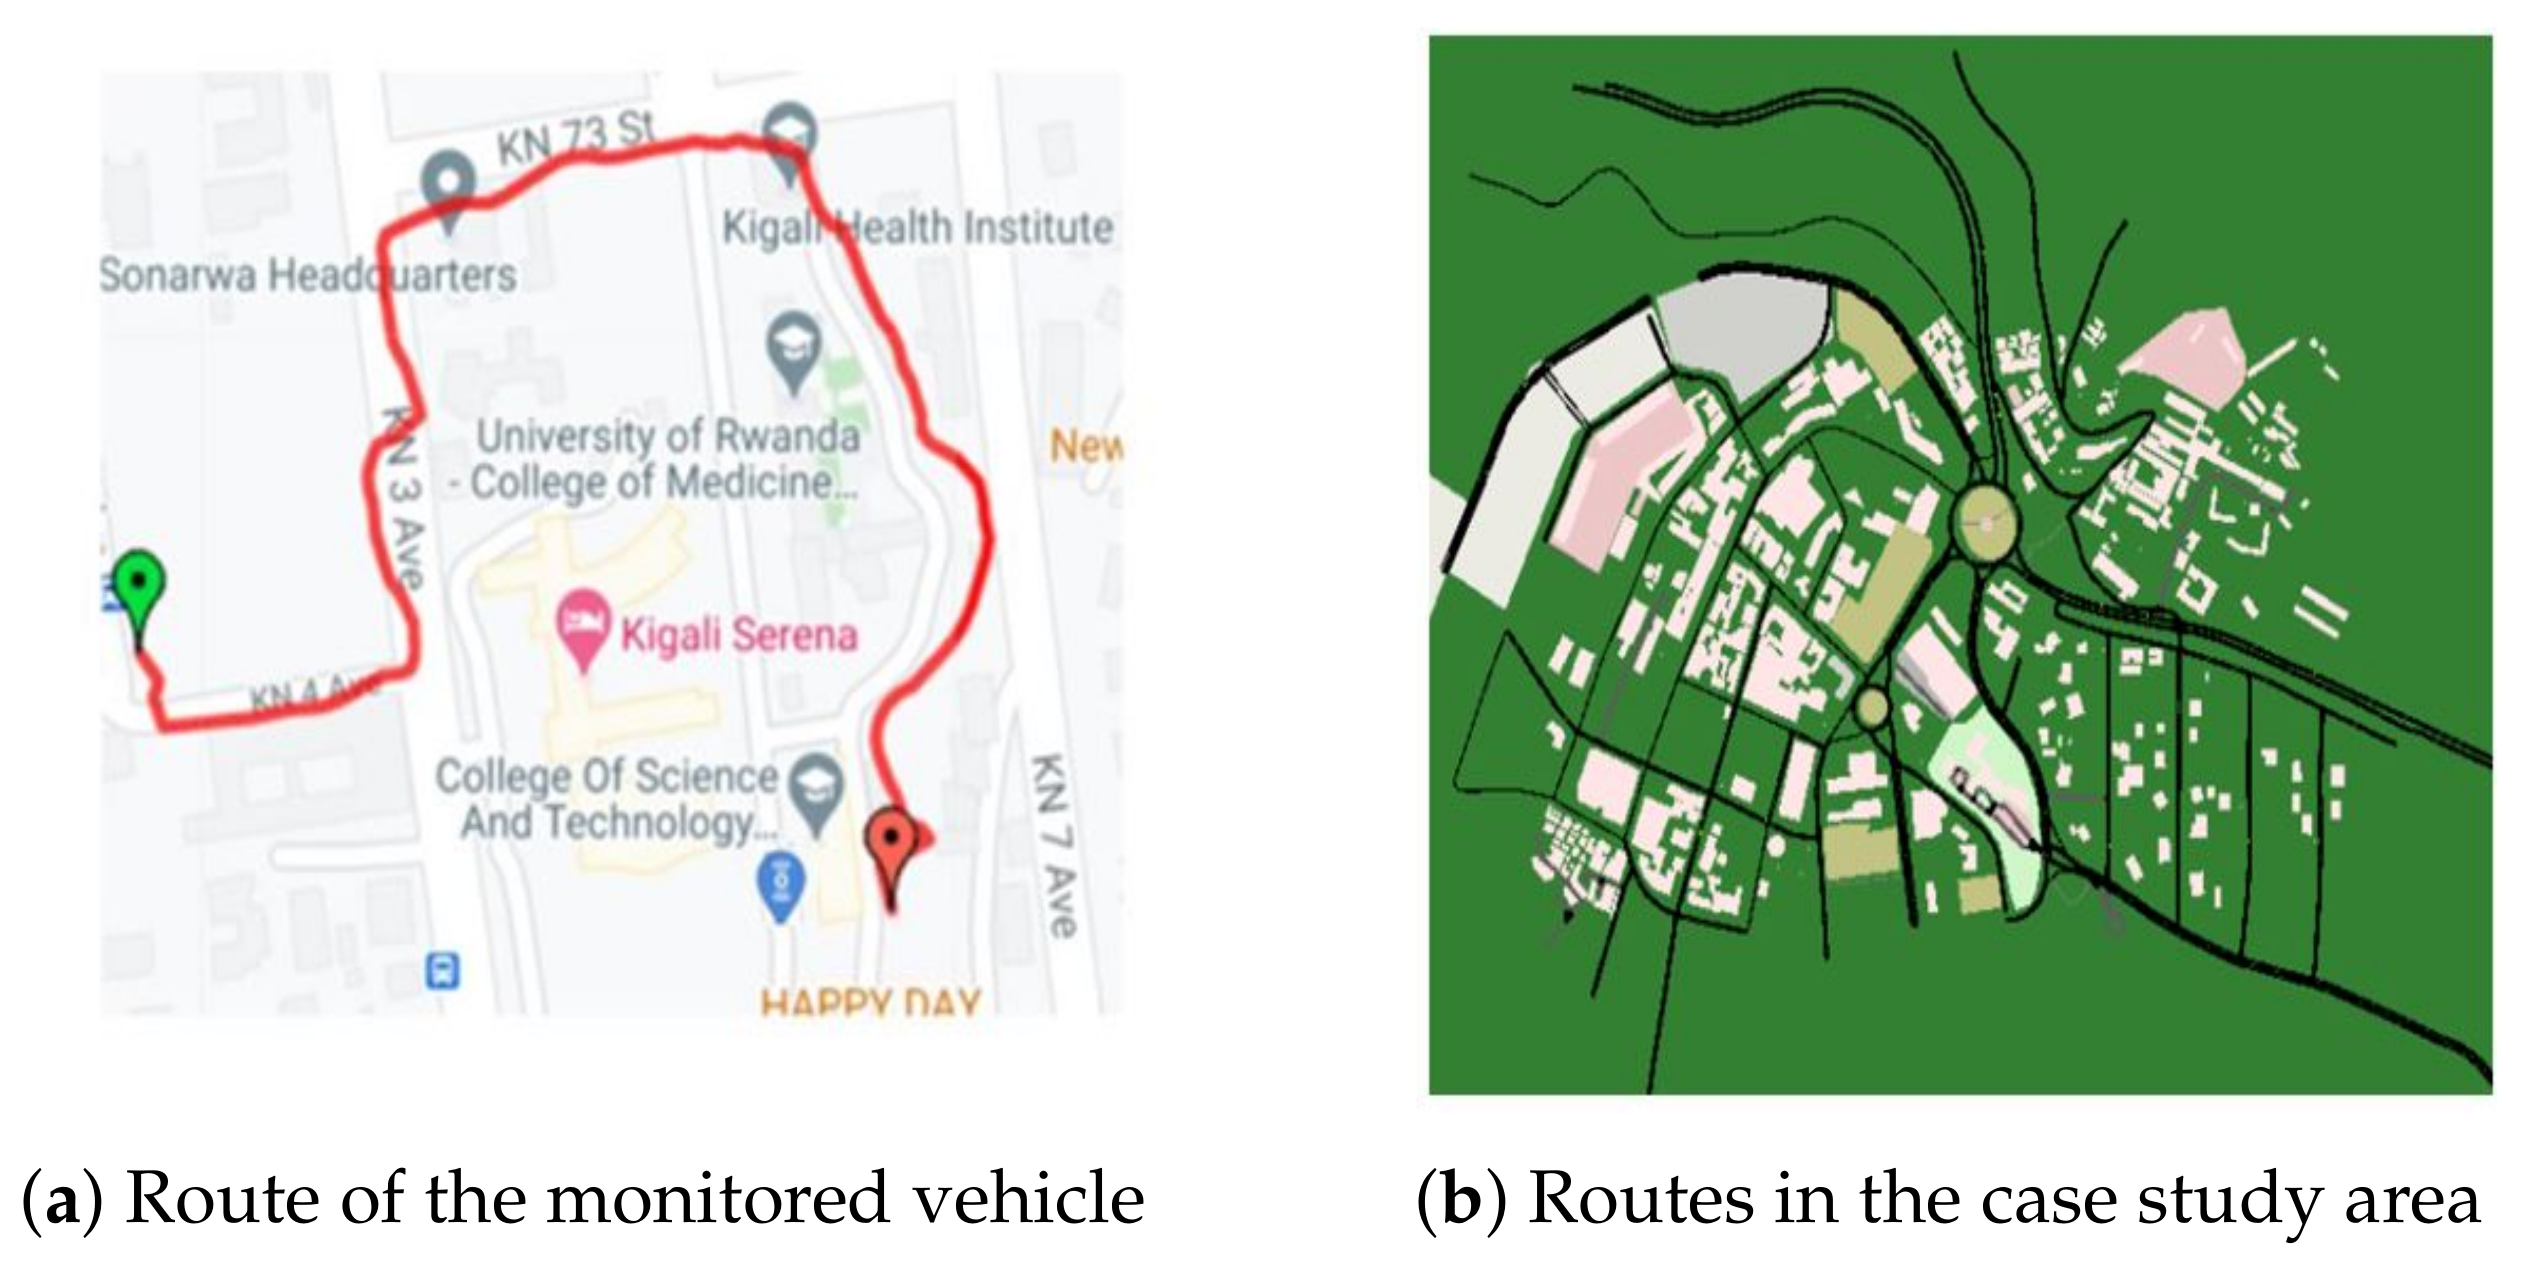
- Known mobility routesUrban roads are fixed, some vehicles pass in specific routes with known start and end points, this creates known routes. Moreover, vehicles equipped with GPS modules could capture road travel history information, such information could be used for traffics flow management, vehicular location monitoring, and so forth.
- (iii)
- Alternative energy sourcesV-IoT electronics could be powered by the engines of vehicles when they are moving. When vehicles are parked, several alternative energy sources like rechargeable batteries, suitable solar panels can power the V-IoT electronics. The emerging of energy harvesting technologies promises stable energy efficient vehicular networks [14].
- (iv)
- Edge and cloud integrationThe possibility to integrate edge and cloud computing in vehicular networks creates important distributed network system required by urban computation tasks. Computation offloading, and resource allocation is an important aspect that enhances cloud and edge in vehicular network systems [15].
1.3. Open Issues in V-IoT
- (i)
- Initial high investment costEven-though IoT allows low-cost system development, deployment in sparse areas like cities for full coverage incurs high initial investment cost. Some works have identified vehicles themselves as temporal communication infrastructure [16].
- (ii)
- High speedszCompared to ordinary mobile Ad Hoc networks, V-IoT nodes exist in a more dynamic environment. This leads to network topological changes in a more often fashion. Research works have been conducted related to routing in vehicular networks. But efforts are required in the designing algorithms and routing protocols that govern such dynamism observed in the vehicular networks [17].
- (iii)
- Communication heterogeneityThe heterogeneity in communication technologies is also a challenging factor. V-IoT ecosystem brings together diverse entities that like vehicles, passengers, sensors, etc. Different entities employ different communication protocols, and generate different data types. Harmonizing such diversity becomes a research issue.
- (iv)
- Context aware representationContext-awareness representation in V-IoT, and other vehicular-enabled networks is an issue. In a smart transport environment, all is fine if participating entities are aware of their surroundings, particularly vehicles should be cognizant of their environmental factors, especially those of greater interest like driving behavior, assistance, parking, etc., [18].
- (v)
- Large data volumes & handlingV-IoT system considers heterogeneous devices that generate large and multidimensional large volumes of data from multiple vehicles that require advanced knowledge and expertise in big data for storage, processing, and analysis.
2. Related Work
3. Materials, Methods, and Case-Study Area
3.1. V-IoT Based Multi-Sensing Test-Bed Components
3.2. Main Software Applications Used
3.3. IoT-Based MULTI-Sensing Unit Deployment Process
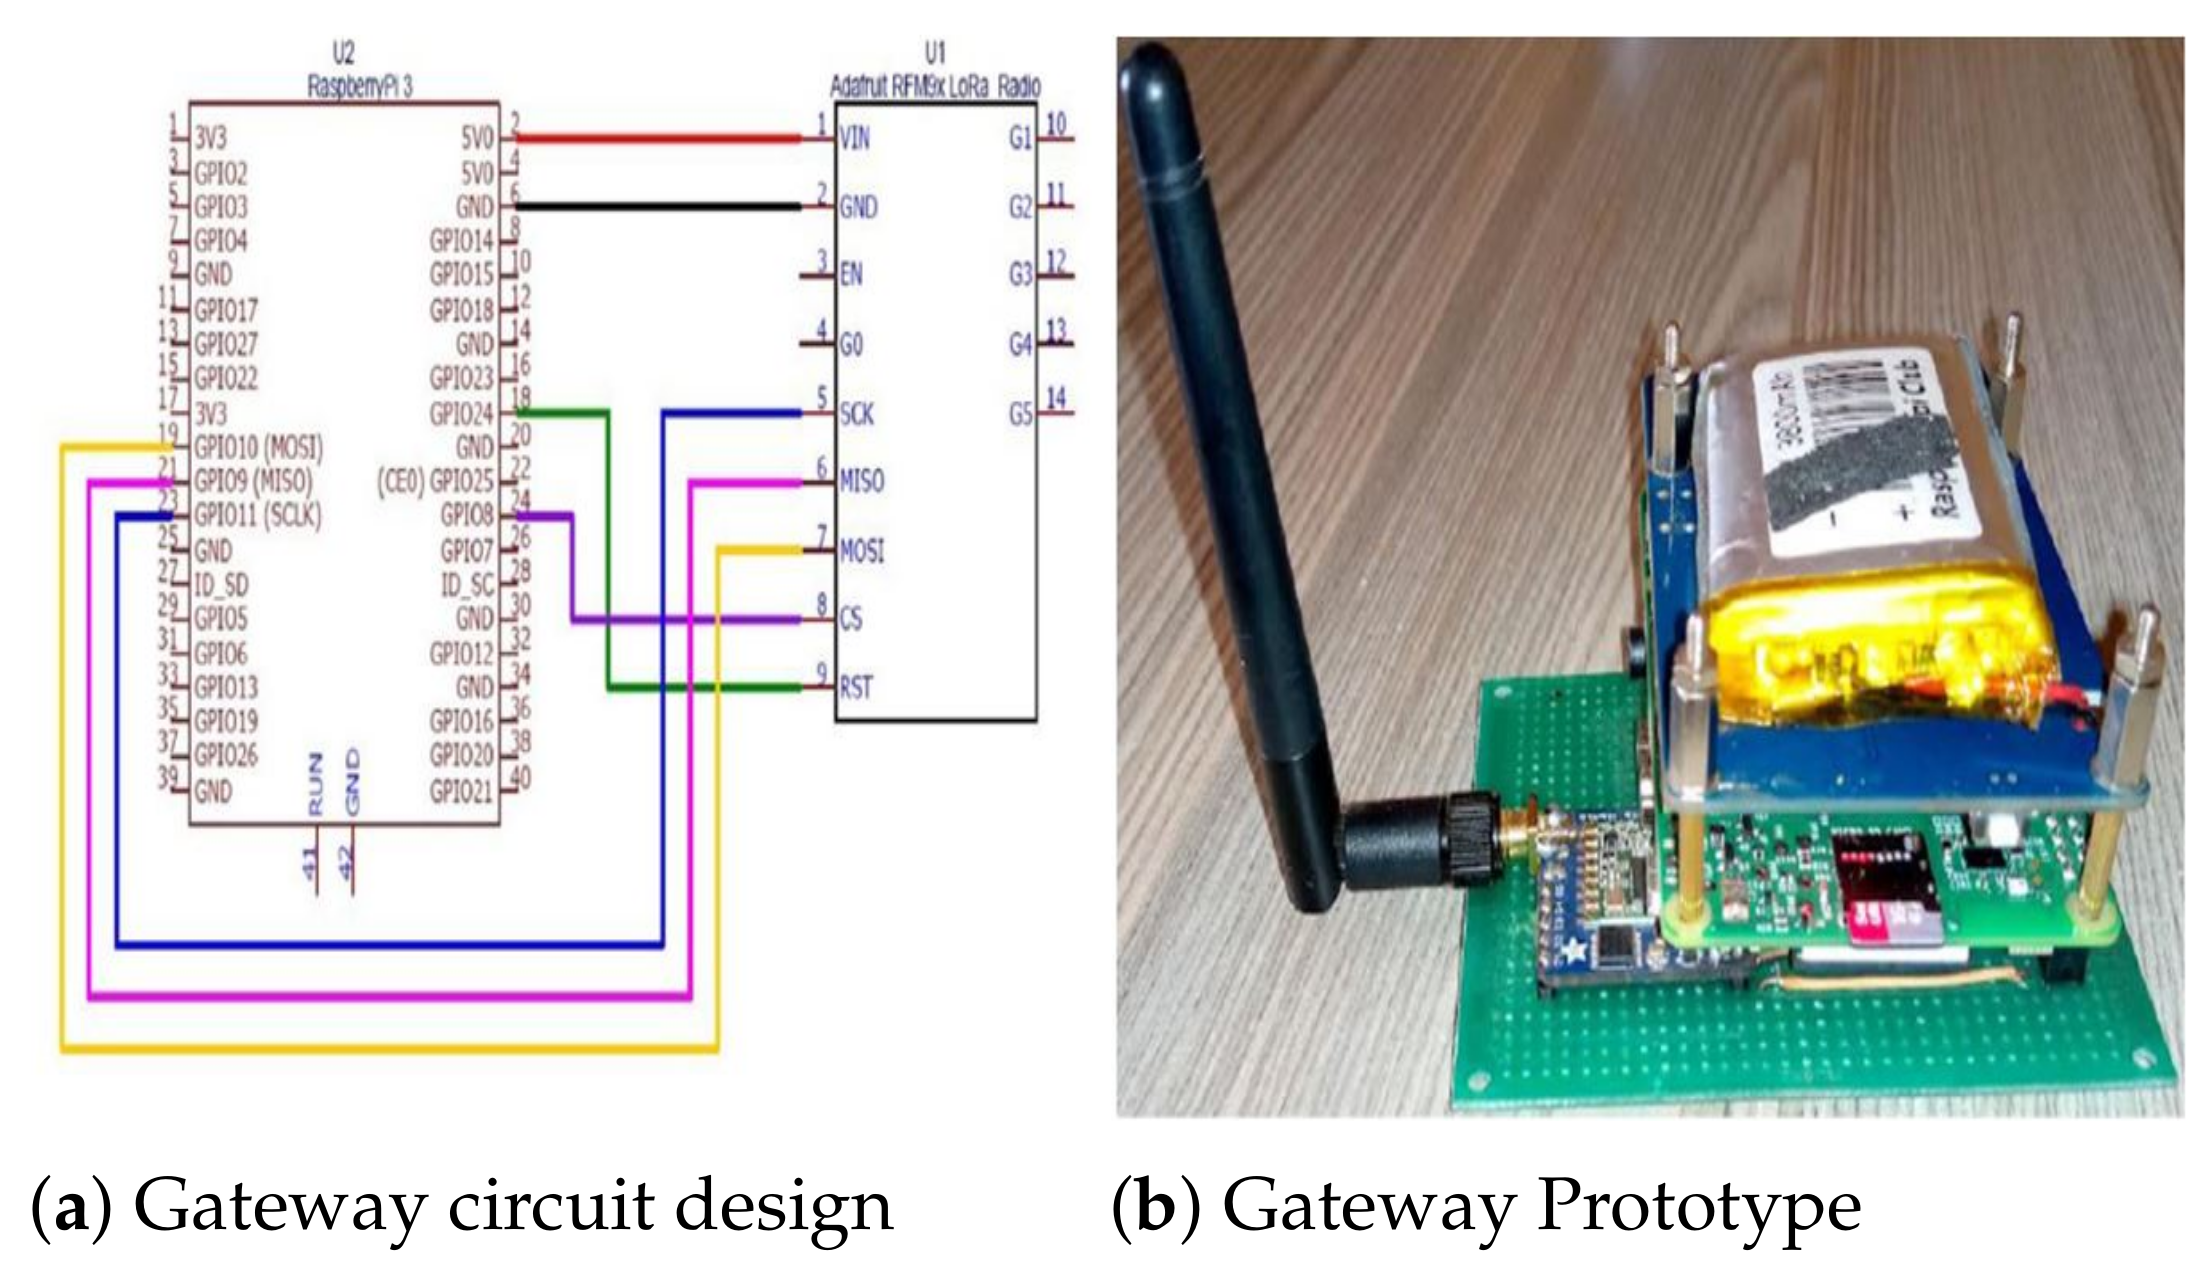
3.4. Gateway Prototype for Data Transmission
3.5. Sensor Data Retrieval and Triggers Algorithms from Intra-Vehicular Environments
| Algorithm 1 Average Sensor Data retrieval & Display |
| Monitored Parameters: P,P,P,… P |
| Output: Avg, Avg,Avg,… Avg |
| Initialization: |
| 1: for to N do |
| 2: Compute: Avg, Avg, Avg,… Avg |
| 3: Avg =, Avg =, Avg =,… Avg = |
| 4: Sensor Data display: |
| 5: if (AvgP=AvgP) then |
| 6: Display AvgP |
| 7: else if (AvgP AvgP) then |
| 8: Display AvgP |
| 9: else |
| 10: Exit |
| 11: end if |
| 12: end for |
| 13: END |
| Algorithm 2 Buzzer Triggering Algorithm |
| Monitored parameters: P1,P2,P3,…PN |
| Output: Buzzer Alarm |
| Initialization: |
| 1: for to N do |
| 2: Set Threshold for each Parameter |
| 3: Read the target parameter . |
| 4: if (P P) then |
| 5: Actuate the buzzer, fan,message,email |
| 6: end if |
| 7: end for |
| 8: END |
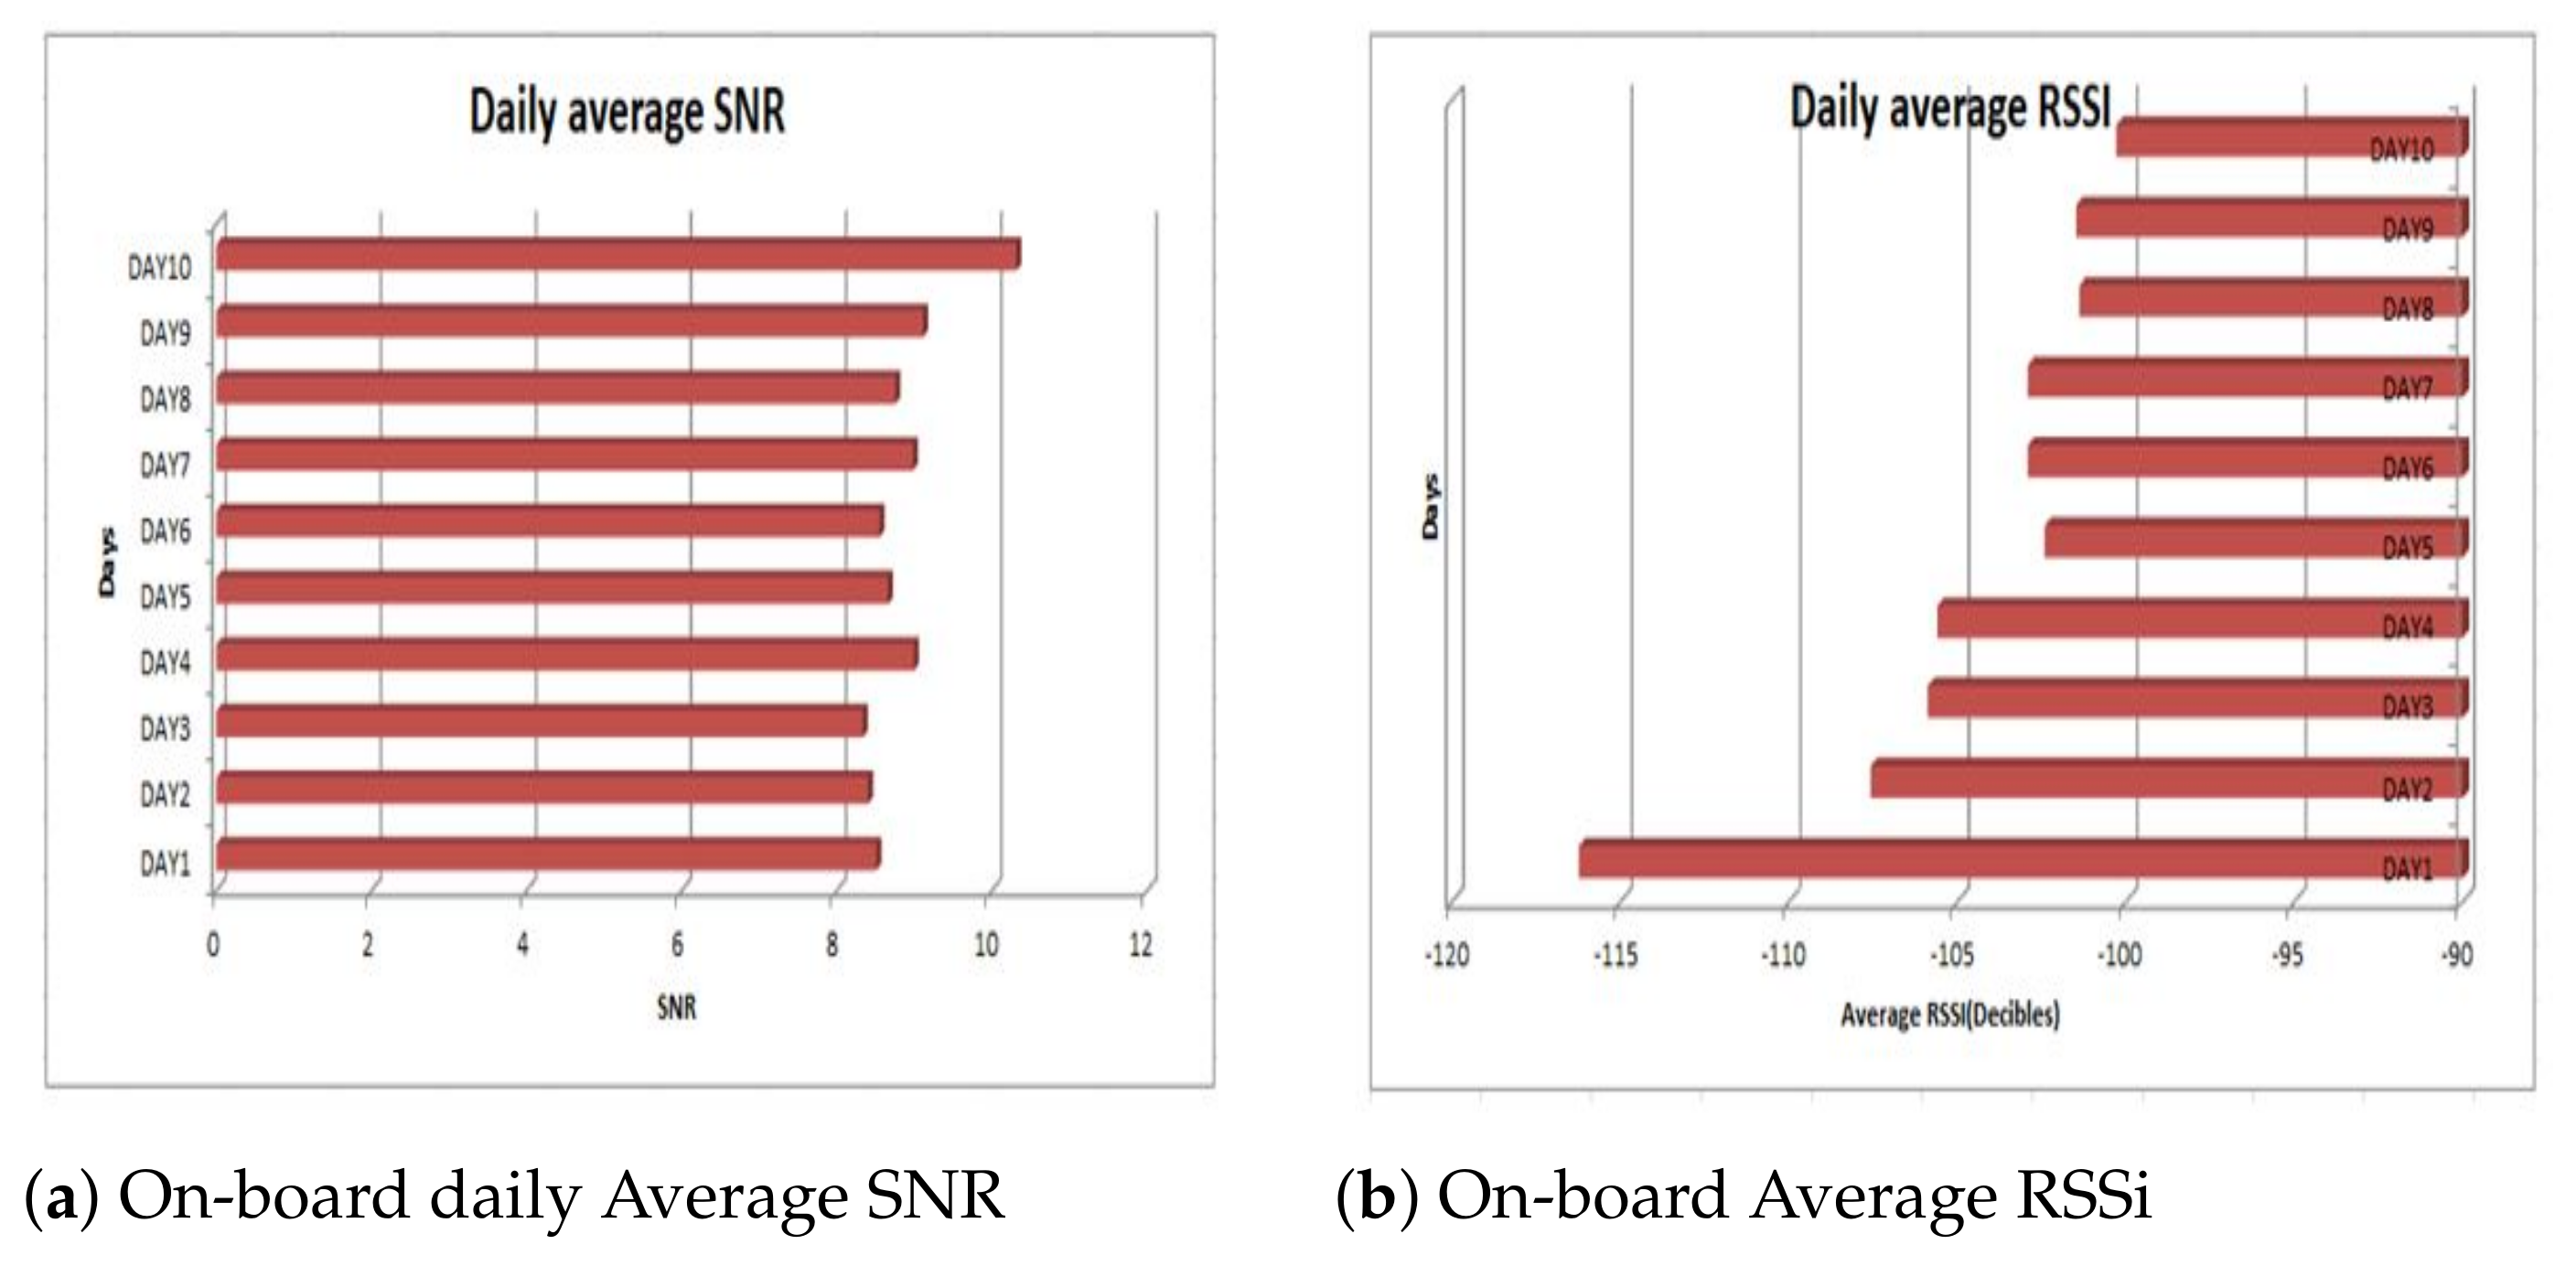
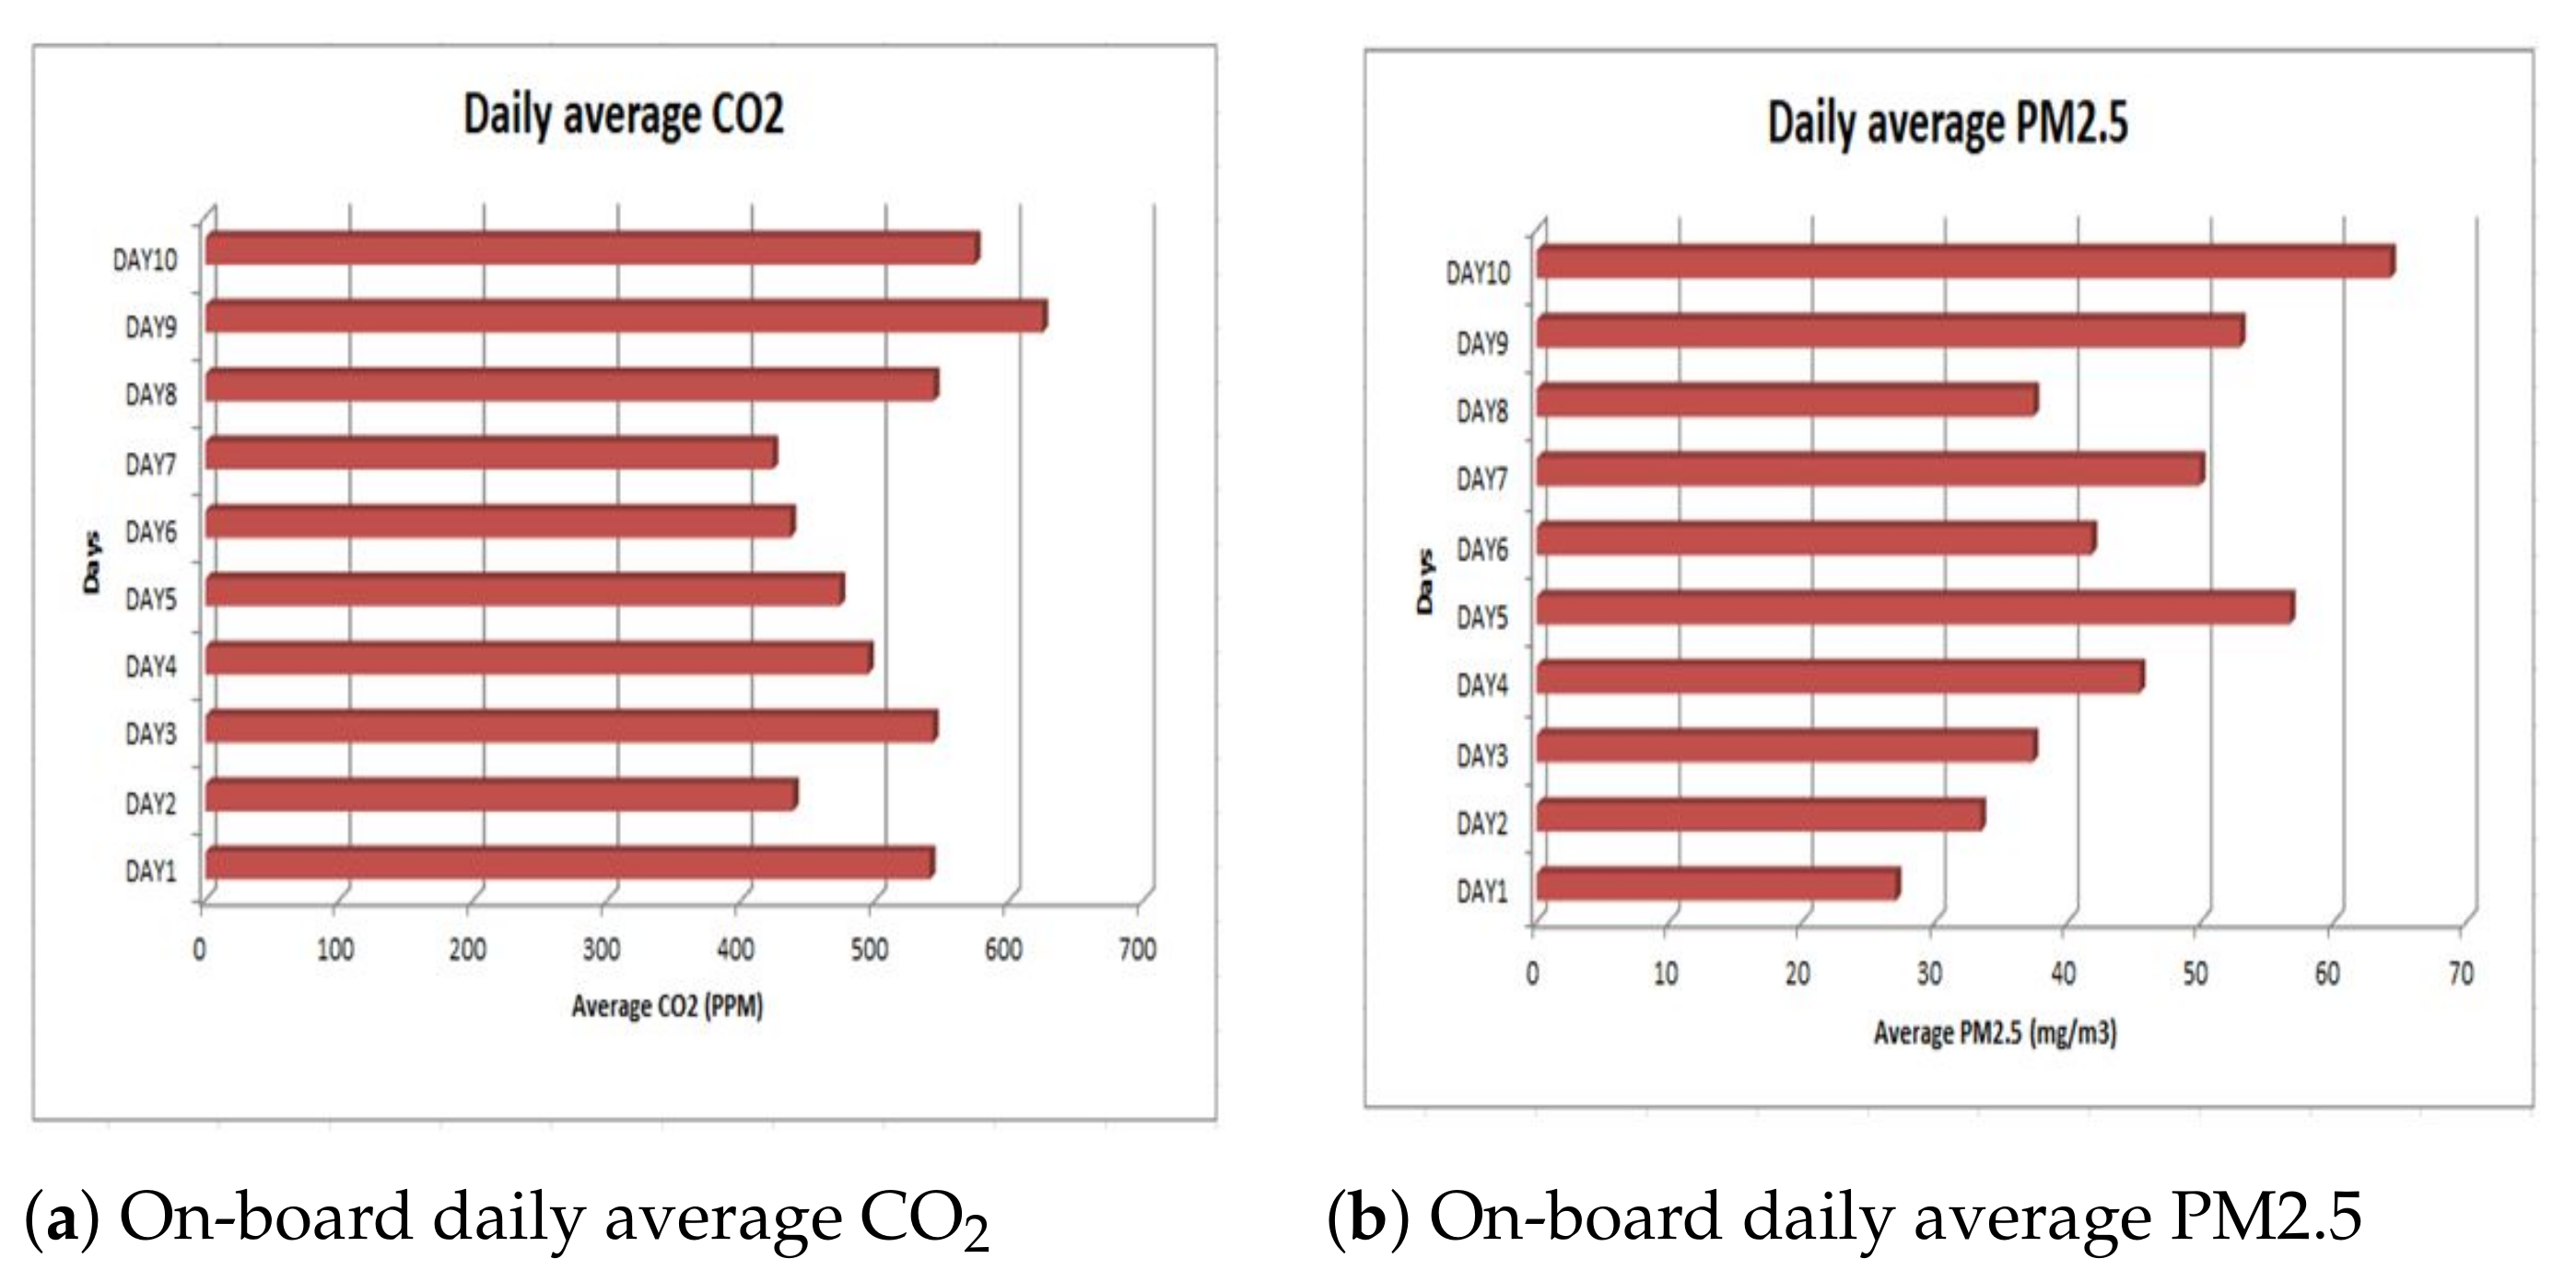
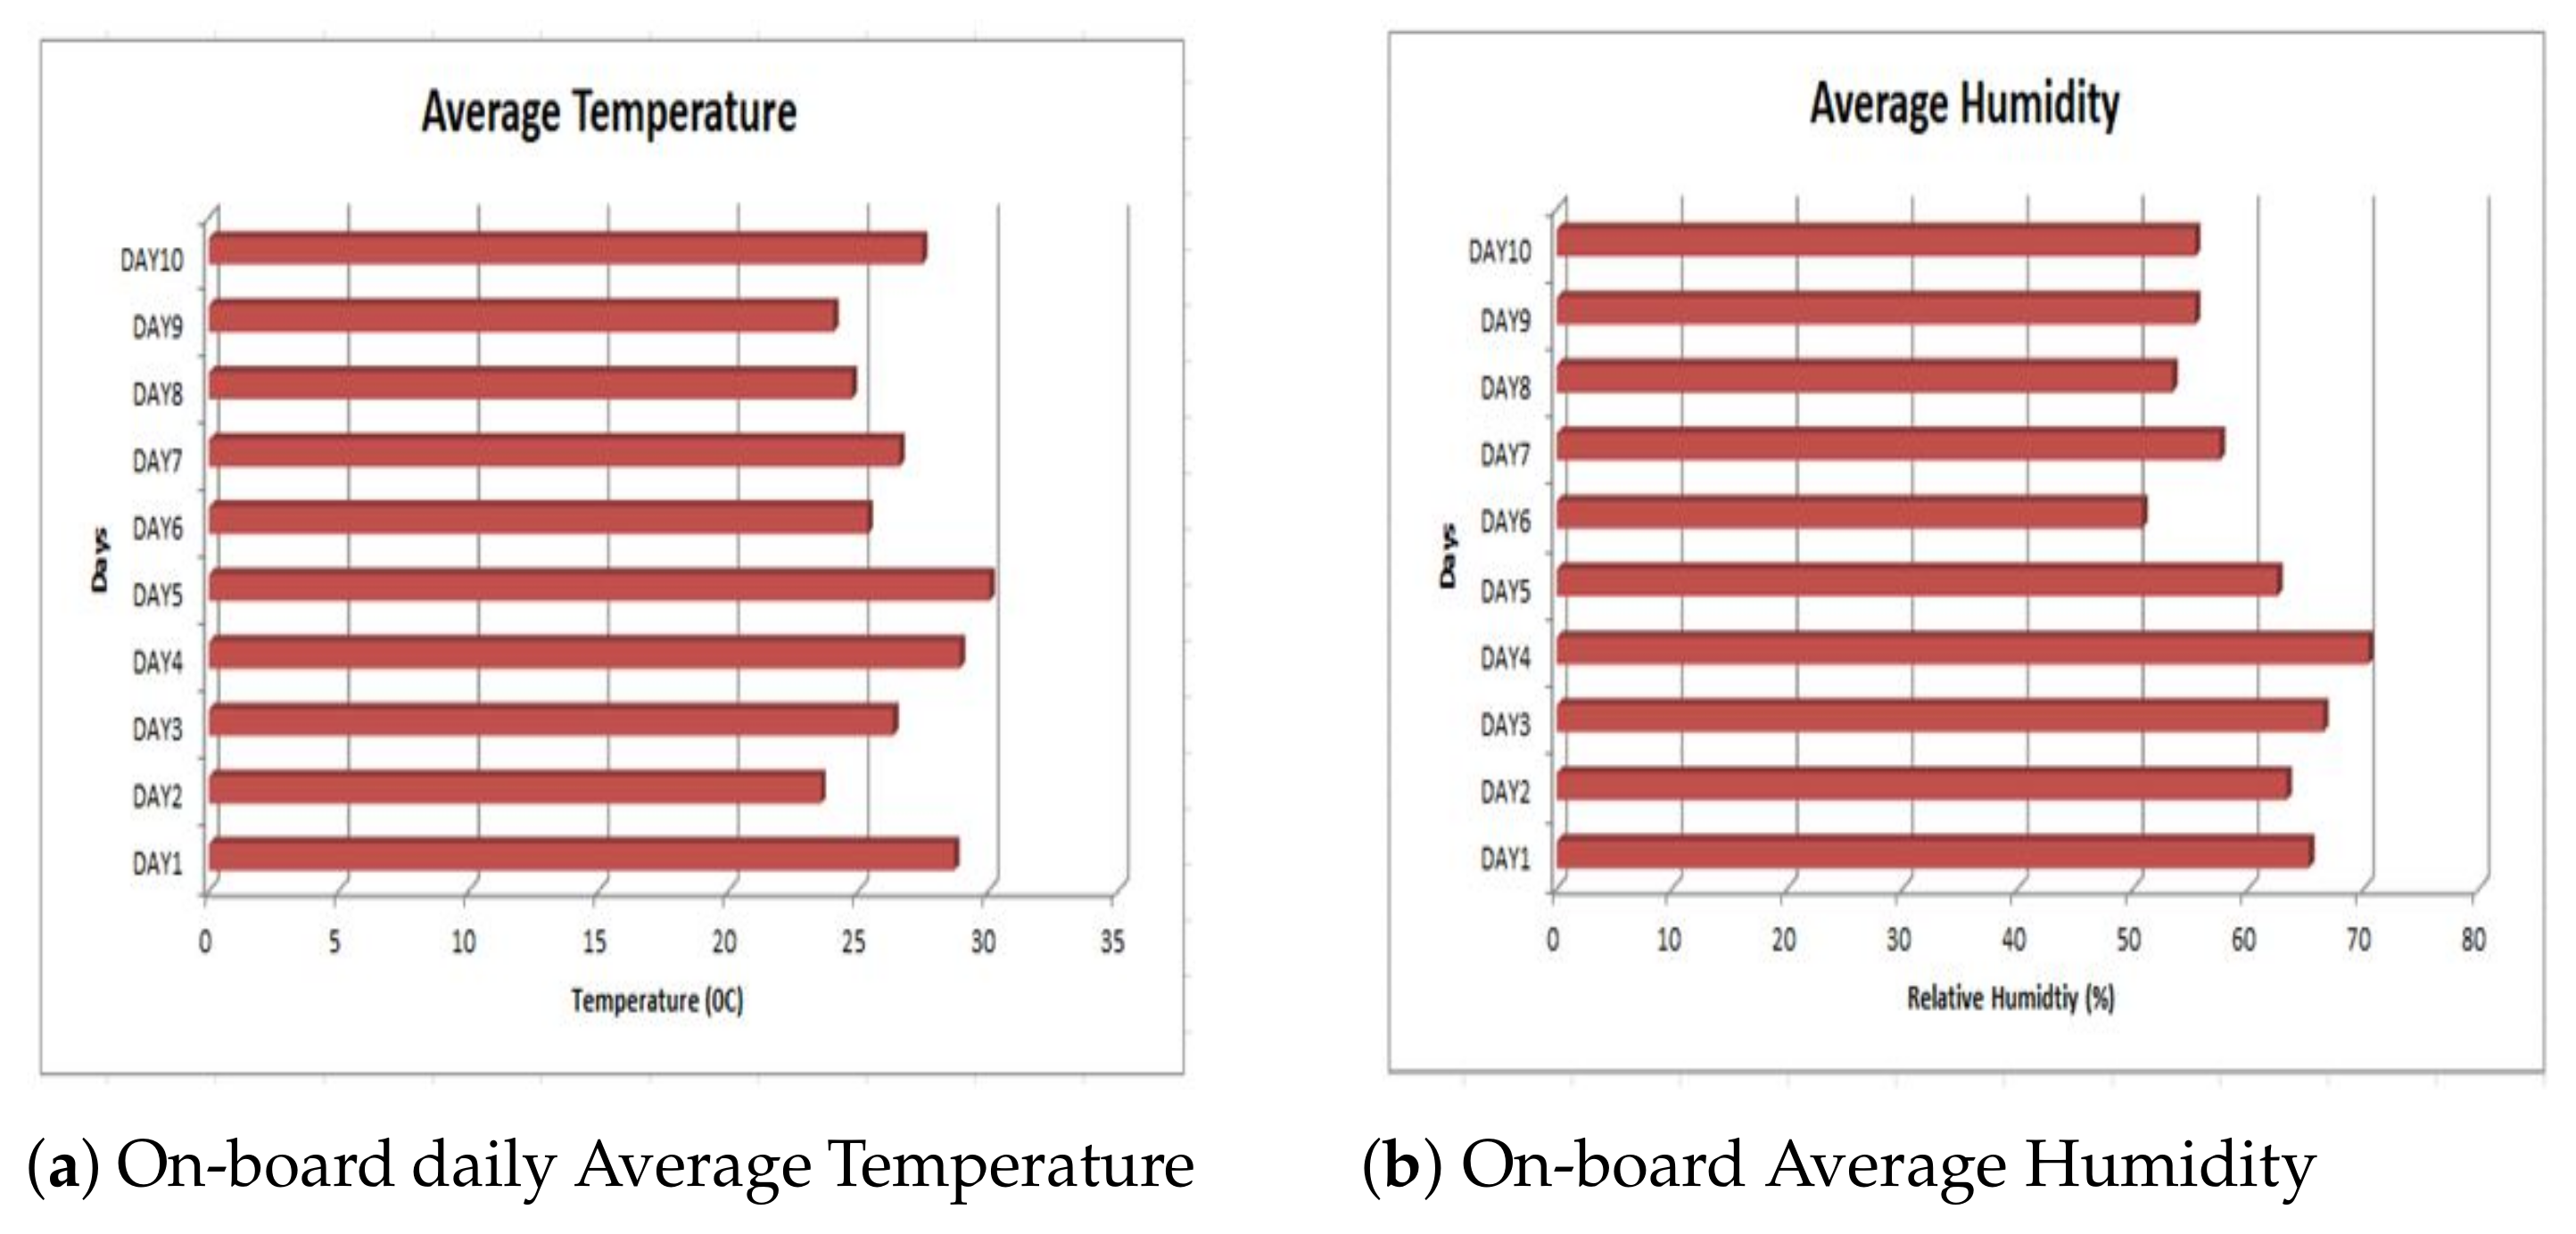
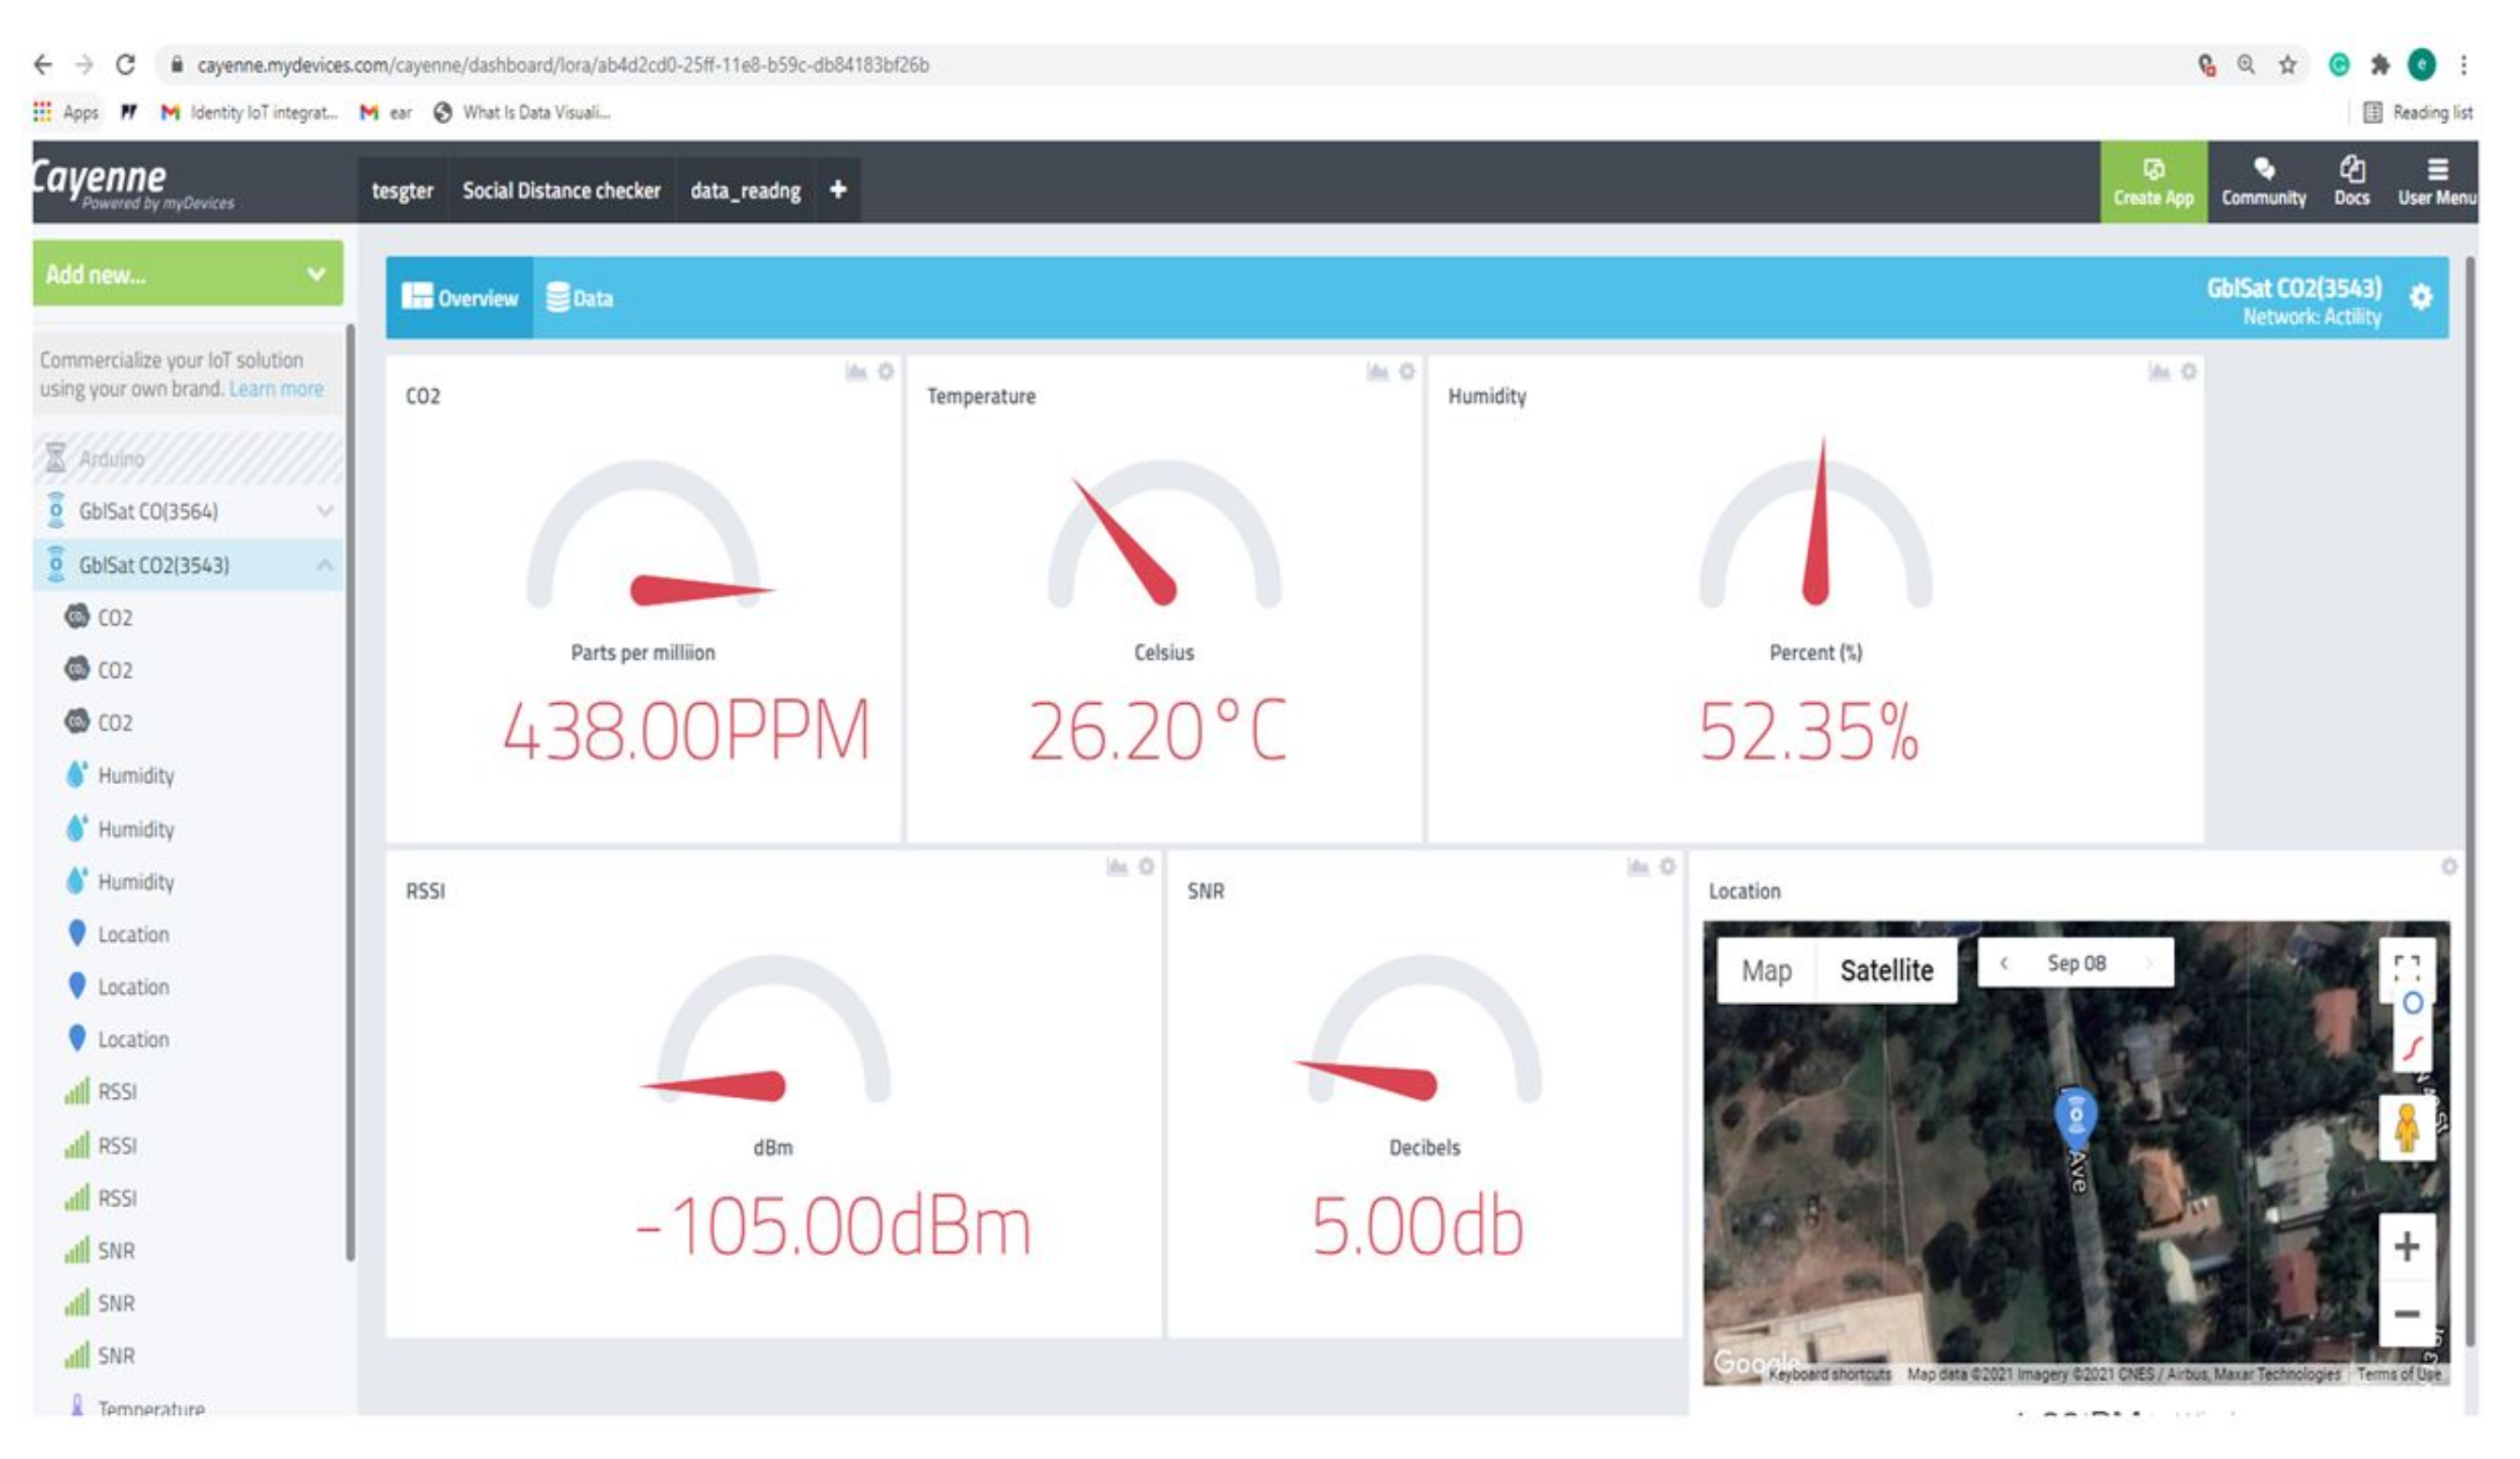
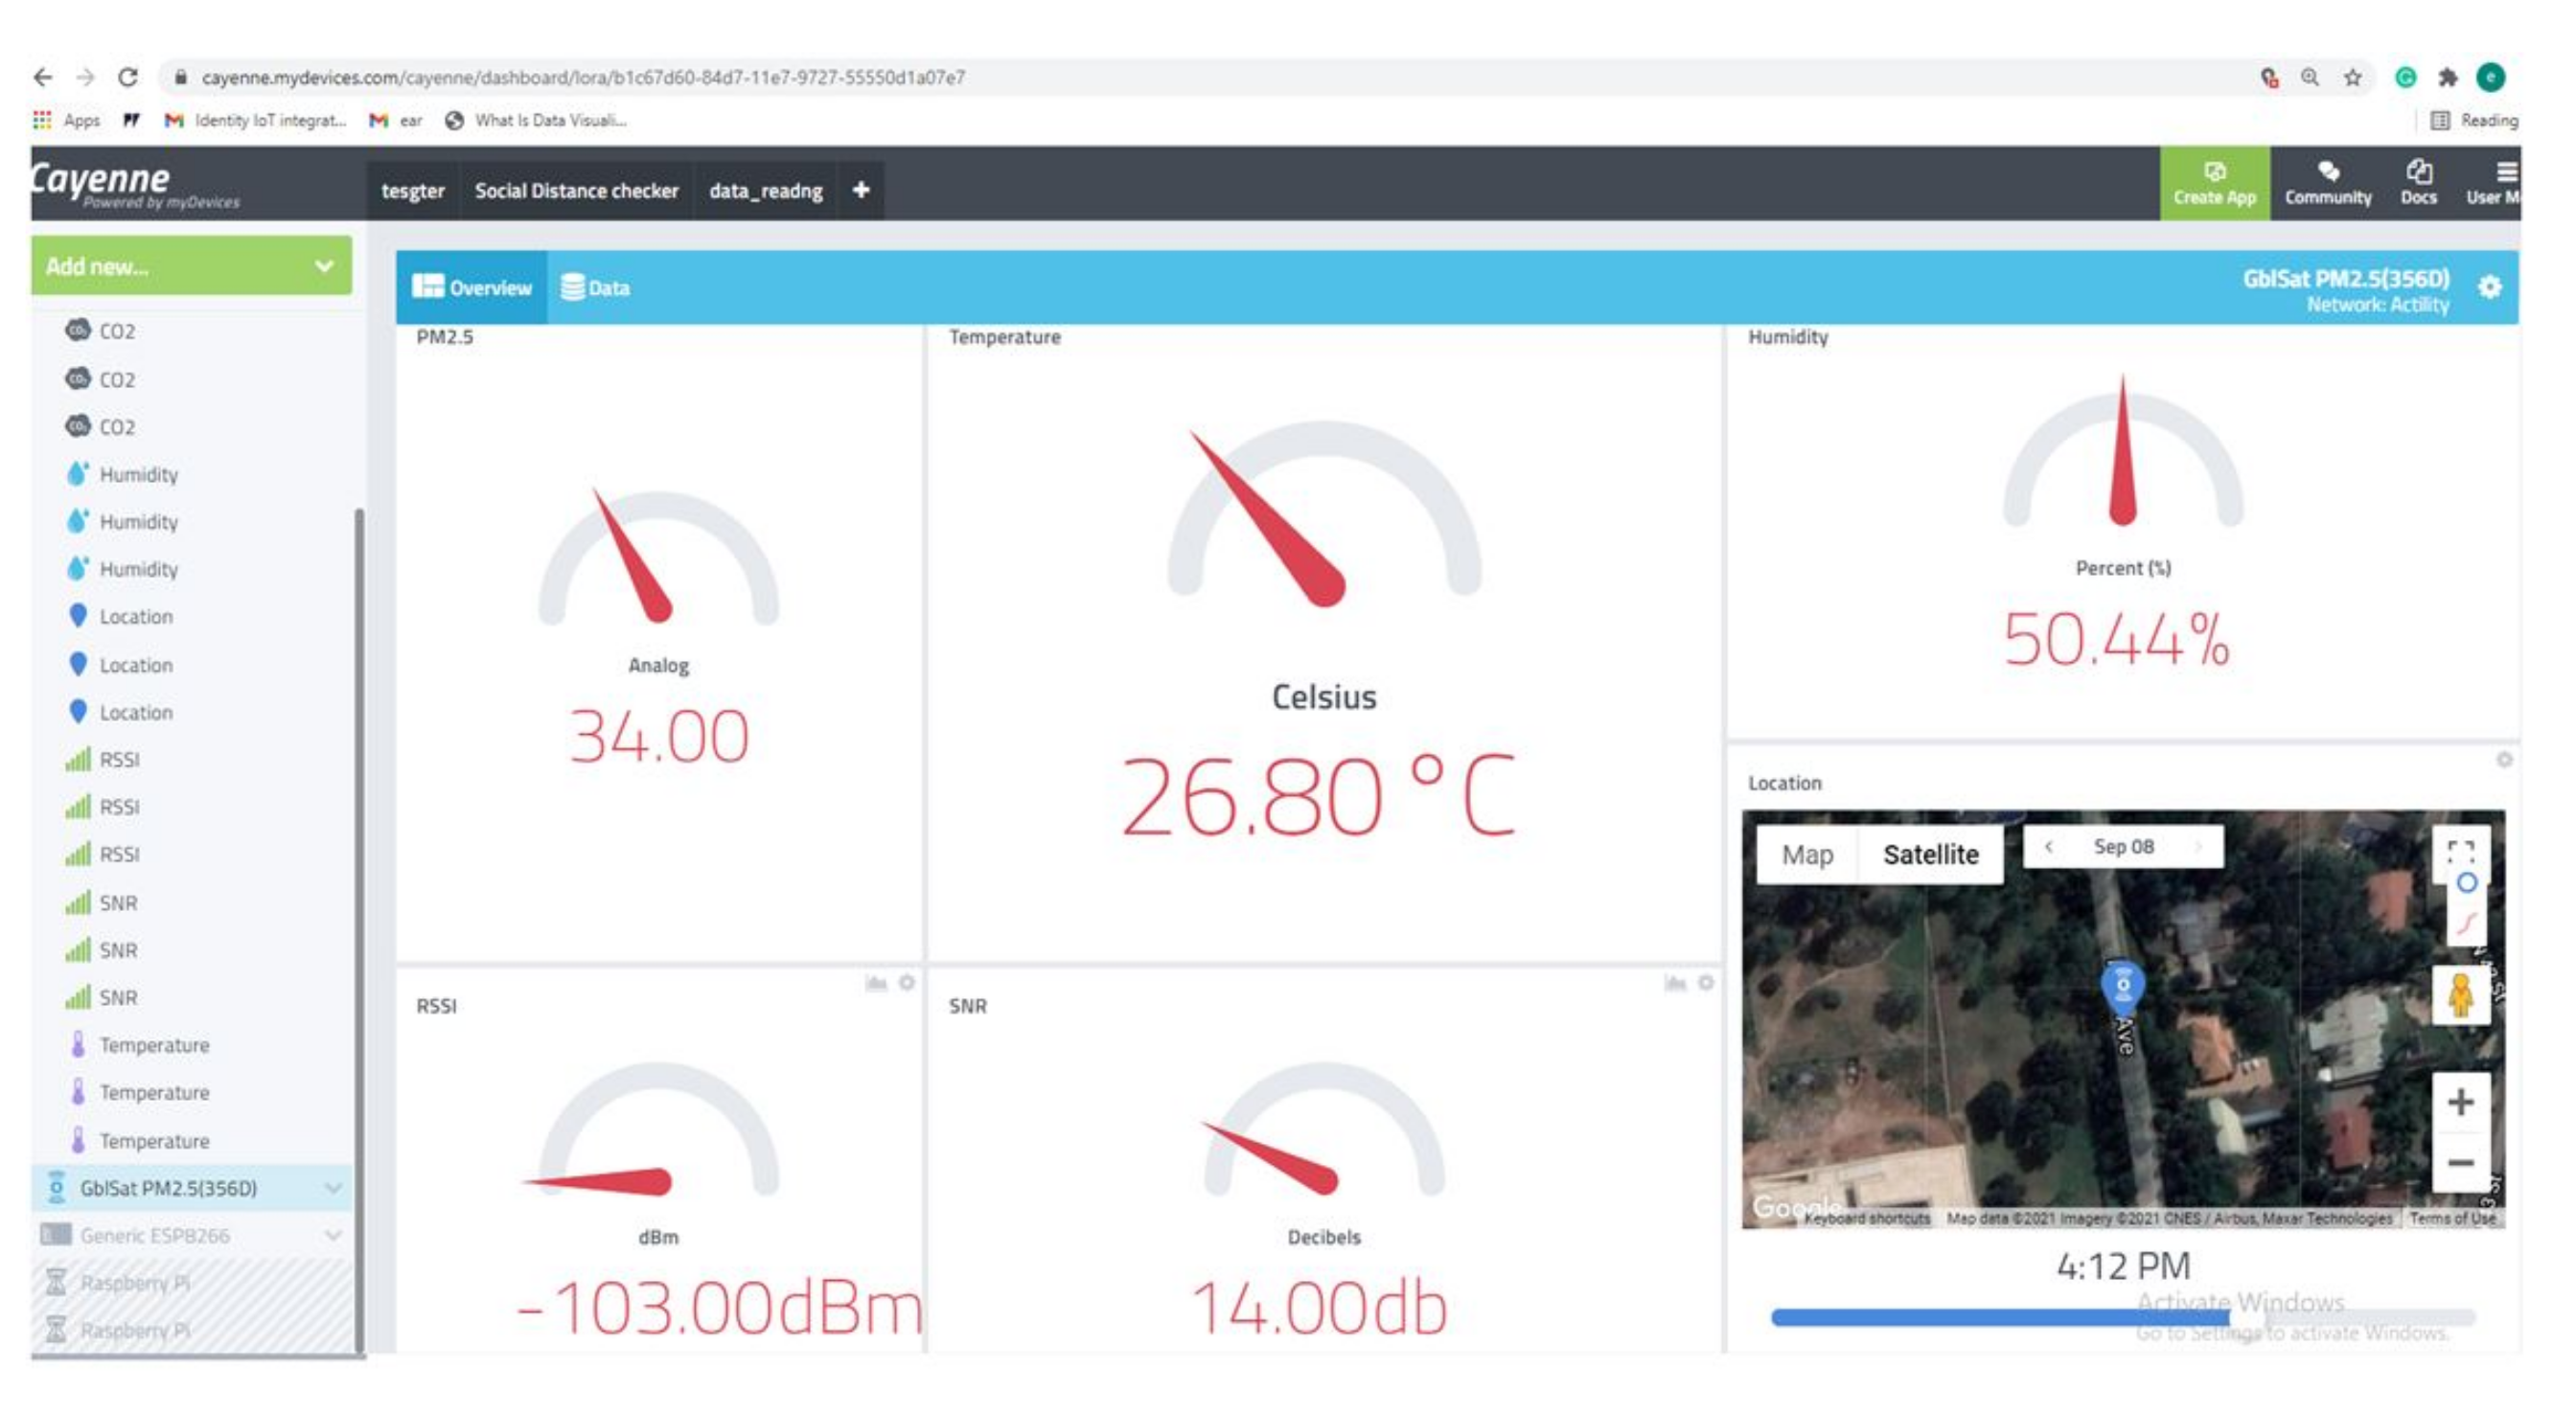
4. On-Board Sensor Data Collection and Analysis
5. Conclusions
Author Contributions
Funding
Acknowledgments
Conflicts of Interest
References
- Atzori, L.; Iera, A.; Morabito, G. The internet of things: A survey. Comput. Netw. 2010, 54, 2787–2805. [Google Scholar] [CrossRef]
- Wortmann, F.; Flüchter, K. Internet of things. Bus. Inf. Syst. Eng. 2015, 57, 221–224. [Google Scholar] [CrossRef]
- Lee, I.; Lee, K. The Internet of Things (IoT): Applications, investments, and challenges for enterprises. Bus. Horiz. 2015, 58, 431–440. [Google Scholar] [CrossRef]
- Ang, K.L.M.; Seng, J.K.P. Application specific internet of things (ASIoTs): Taxonomy, applications, use case and future directions. IEEE Access 2019, 7, 56577–56590. [Google Scholar] [CrossRef]
- Jiang, D. The construction of smart city information system based on the Internet of Things and cloud computing. Comput. Commun. 2020, 150, 158–166. [Google Scholar] [CrossRef]
- Chu, G.; Lisitsa, A. Penetration testing for internet of things and its automation. In Proceedings of the 2018 IEEE 20th International Conference on High Performance Computing and Communications, IEEE 16th International Conference on Smart City, IEEE 4th International Conference on Data Science and Systems (HPCC/SmartCity/DSS), Exeter, UK, 28–30 June 2018; pp. 1479–1484. [Google Scholar]
- Kaiwartya, O.; Abdullah, A.H.; Cao, Y.; Altameem, A.; Prasad, M.; Lin, C.T.; Liu, X. Internet of vehicles: Motivation, layered architecture, network model, challenges, and future aspects. IEEE Access 2016, 4, 5356–5373. [Google Scholar] [CrossRef]
- Yang, F.; Wang, S.; Li, J.; Liu, Z.; Sun, Q. An overview of internet of vehicles. China Commun. 2014, 11, 1–15. [Google Scholar] [CrossRef]
- Kim, T.H.; Ramos, C.; Mohammed, S. Smart City and IoT; Future Generation Computer Systems; Elsevier: Amsterdam, The Netherlands, 2017. [Google Scholar]
- Qian, Y.; Wu, D.; Bao, W.; Lorenz, P. The internet of things for smart cities: Technologies and applications. IEEE Netw. 2019, 33, 4–5. [Google Scholar] [CrossRef]
- Ahlgren, B.; Hidell, M.; Ngai, E.C.H. Internet of things for smart cities: Interoperability and open data. IEEE Internet Comput. 2016, 20, 52–56. [Google Scholar] [CrossRef]
- Mehmood, Y.; Ahmad, F.; Yaqoob, I.; Adnane, A.; Imran, M.; Guizani, S. Internet-of-things-based smart cities: Recent advances and challenges. IEEE Commun. Mag. 2017, 55, 16–24. [Google Scholar] [CrossRef]
- Reis, A.B.; Sargento, S.; Neves, F.; Tonguz, O.K. Deploying roadside units in sparse vehicular networks: What really works and what does not. IEEE Trans. Veh. Technol. 2013, 63, 2794–2806. [Google Scholar] [CrossRef]
- Atallah, R.; Khabbaz, M.; Assi, C. Energy harvesting in vehicular networks: A contemporary survey. IEEE Wirel. Commun. 2016, 23, 70–77. [Google Scholar] [CrossRef]
- Zhao, J.; Li, Q.; Gong, Y.; Zhang, K. Computation offloading and resource allocation for cloud assisted mobile edge computing in vehicular networks. IEEE Trans. Veh. Technol. 2019, 68, 7944–7956. [Google Scholar] [CrossRef]
- Evariste, T.; Kasakula, W.; Rwigema, J.; Datta, R. Optimal Exploitation of On-Street Parked Vehicles as Roadside Gateways for Social IoV—A Case of Kigali City. J. Open Innov. Technol. Market Complet 2020, 6, 73. [Google Scholar] [CrossRef]
- Abbas, M.T.; Muhammad, A.; Song, W.C. SD-IoV: SDN enabled routing for internet of vehicles in road-aware approach. J. Ambient Intell. Humaniz. Comput. 2020, 11, 1265–1280. [Google Scholar] [CrossRef] [Green Version]
- Wang, X.; Zhang, R.; Gou, Y.; Liu, J.; Zhao, L.; Li, Y. Variable speed limit control method of freeway mainline in intelligent connected environment. J. Adv. Transp. 2021, 2021, 8863487. [Google Scholar] [CrossRef]
- Krasniqi, X.; Hajrizi, E. Use of IoT technology to drive the automotive industry from connected to full autonomous vehicles. IFAC-PapersOnLine 2016, 49, 269–274. [Google Scholar] [CrossRef]
- Philip, B.V.; Alpcan, T.; Jin, J.; Palaniswami, M. Distributed real-time IoT for autonomous vehicles. IEEE Trans. Ind. Inf. 2018, 15, 1131–1140. [Google Scholar] [CrossRef]
- Minovski, D.; Åhlund, C.; Mitra, K. Modeling quality of IoT experience in autonomous vehicles. IEEE Internet Things J. 2020, 7, 3833–3849. [Google Scholar] [CrossRef]
- Khayyam, H.; Javadi, B.; Jalili, M.; Jazar, R.N. Artificial intelligence and internet of things for autonomous vehicles. In Nonlinear Approaches in Engineering Applications; Springer: New York, NY, USA, 2020; pp. 39–68. [Google Scholar]
- Guerrero-Ibanez, J.A.; Zeadally, S.; Contreras-Castillo, J. Integration challenges of intelligent transportation systems with connected vehicle, cloud computing, and internet of things technologies. IEEE Wirel. Commun. 2015, 22, 122–128. [Google Scholar] [CrossRef]
- Guleng, S.; Wu, C.; Chen, X.; Wang, X.; Yoshinaga, T.; Ji, Y. Decentralized trust evaluation in vehicular Internet of Things. IEEE Access 2019, 7, 15980–15988. [Google Scholar] [CrossRef]
- Rathee, G.; Jaglan, N.; Iqbal, R.; Lal, S.P.; Menon, V.G. A trust analysis scheme for vehicular networks within IoT-oriented green city. Environ. Technol. Innovat. 2020, 20, 101144. [Google Scholar] [CrossRef]
- Reddy, M.R.; Srinivasa, K.; Reddy, B.E. Smart vehicular system based on the internet of things. J. Org. End User Comput. (JOEUC) 2018, 30, 45–62. [Google Scholar] [CrossRef]
- Du, Z.; Wu, C.; Yoshinaga, T.; Yau, K.L.A.; Ji, Y.; Li, J. Federated learning for vehicular internet of things: Recent advances and open issues. IEEE Open J. Comput. Soc. 2020, 1, 45–61. [Google Scholar] [CrossRef]


| Parameter Symbol/Name | Parameter Description |
|---|---|
| Sensor Module | long range wide area network (LORAWAN) |
| Transmission Range | Upto 20 km |
| Frequency type | License-free bands |
| TCP/IP protocol | Message Queuing Telemetry Transport (MQTT) |
| Transmission Power | 100 mW |
Publisher’s Note: MDPI stays neutral with regard to jurisdictional claims in published maps and institutional affiliations. |
© 2021 by the authors. Licensee MDPI, Basel, Switzerland. This article is an open access article distributed under the terms and conditions of the Creative Commons Attribution (CC BY) license (https://creativecommons.org/licenses/by/4.0/).
Share and Cite
Twahirwa, E.; Rwigema, J.; Datta, R. Design and Deployment of Vehicular Internet of Things for Smart City Applications. Sustainability 2022, 14, 176. https://doi.org/10.3390/su14010176
Twahirwa E, Rwigema J, Datta R. Design and Deployment of Vehicular Internet of Things for Smart City Applications. Sustainability. 2022; 14(1):176. https://doi.org/10.3390/su14010176
Chicago/Turabian StyleTwahirwa, Evariste, James Rwigema, and Raja Datta. 2022. "Design and Deployment of Vehicular Internet of Things for Smart City Applications" Sustainability 14, no. 1: 176. https://doi.org/10.3390/su14010176
APA StyleTwahirwa, E., Rwigema, J., & Datta, R. (2022). Design and Deployment of Vehicular Internet of Things for Smart City Applications. Sustainability, 14(1), 176. https://doi.org/10.3390/su14010176