1. Introduction
Current traffic-calming measures, such as Raised Safety Platforms (RSPs), are used for speed reduction, safety enhancement, reduced air pollution, and noise reduction [
1,
2] and have more commonly been introduced to the intersection of local roads. They are typically used by traffic engineers to moderate vehicle speeds when required, or to deflect vehicles from using particular streets and roadways. Lydon and Morehouse [
3] andVasudevan and Patel [
4] argued that they are effective by presenting a visual change in the road to oncoming vehicles and on account of the discomfort caused by vertical deflection when misused.
At frequently used locations, it is likely to be discomfort that largely motivates the change in speed behaviour, noting that riders of bicycles and motorcycles in particular have been observed to complain of their use, and some medical practitioners have claimed they present a health hazard. In general, however, they are designed to encourage safer speeds whilst minimising undue road-user discomfort and also minimising the risk of vehicle damage, including rollover (of heavy vehicles).
In Victoria, Australia, RSPs are designed to have a raised surface with a flat-top profile of at least 6 m to accommodate the length of a standard passenger car. The vertical deflection is also limited to no more than 150 mm (or less than 75 mm for effectiveness), with a desirable increase of 100 mm. The grade of the approach ramp varies on account of the operating speed limit and the pre-build road surface grade but is typically 1 in 15 (6.7%) on slower roads and 1 in 25 (4.0%) on higher speed roads. The ramp grades on approach and departure are also of consistent grade, unlike other designs (e.g., Watts’s profile, sinusoidal). RSPs are only an applicable speed management treatment at intersections where the posted speed limit is 70 km/h or less. Where the speed-limit exceeds 70 km/h, it is recommended that other speed-mitigating treatments be used to reduce speeds [
5]. They are also recommended at locations where there is the potential for collisions to occur at speeds that do not comply with Safe System standards but are less suited to locations with substantial road grade.
There have been a small number of evaluations of individual RSPs at major signalised intersections. The performance of RSPs that have been installed in Australia and New Zealand were recently summarised in a research report by Austroads [
6], which included early findings from the present evaluation. The report tentatively indicates that the percentage speed reductions at site treated with an RSP has the potential to vary substantially, largely given the initial operating speed. Overall, however, it indicates that RSPs have the potential to reduce operating speeds to a level consistent with Safe System values.
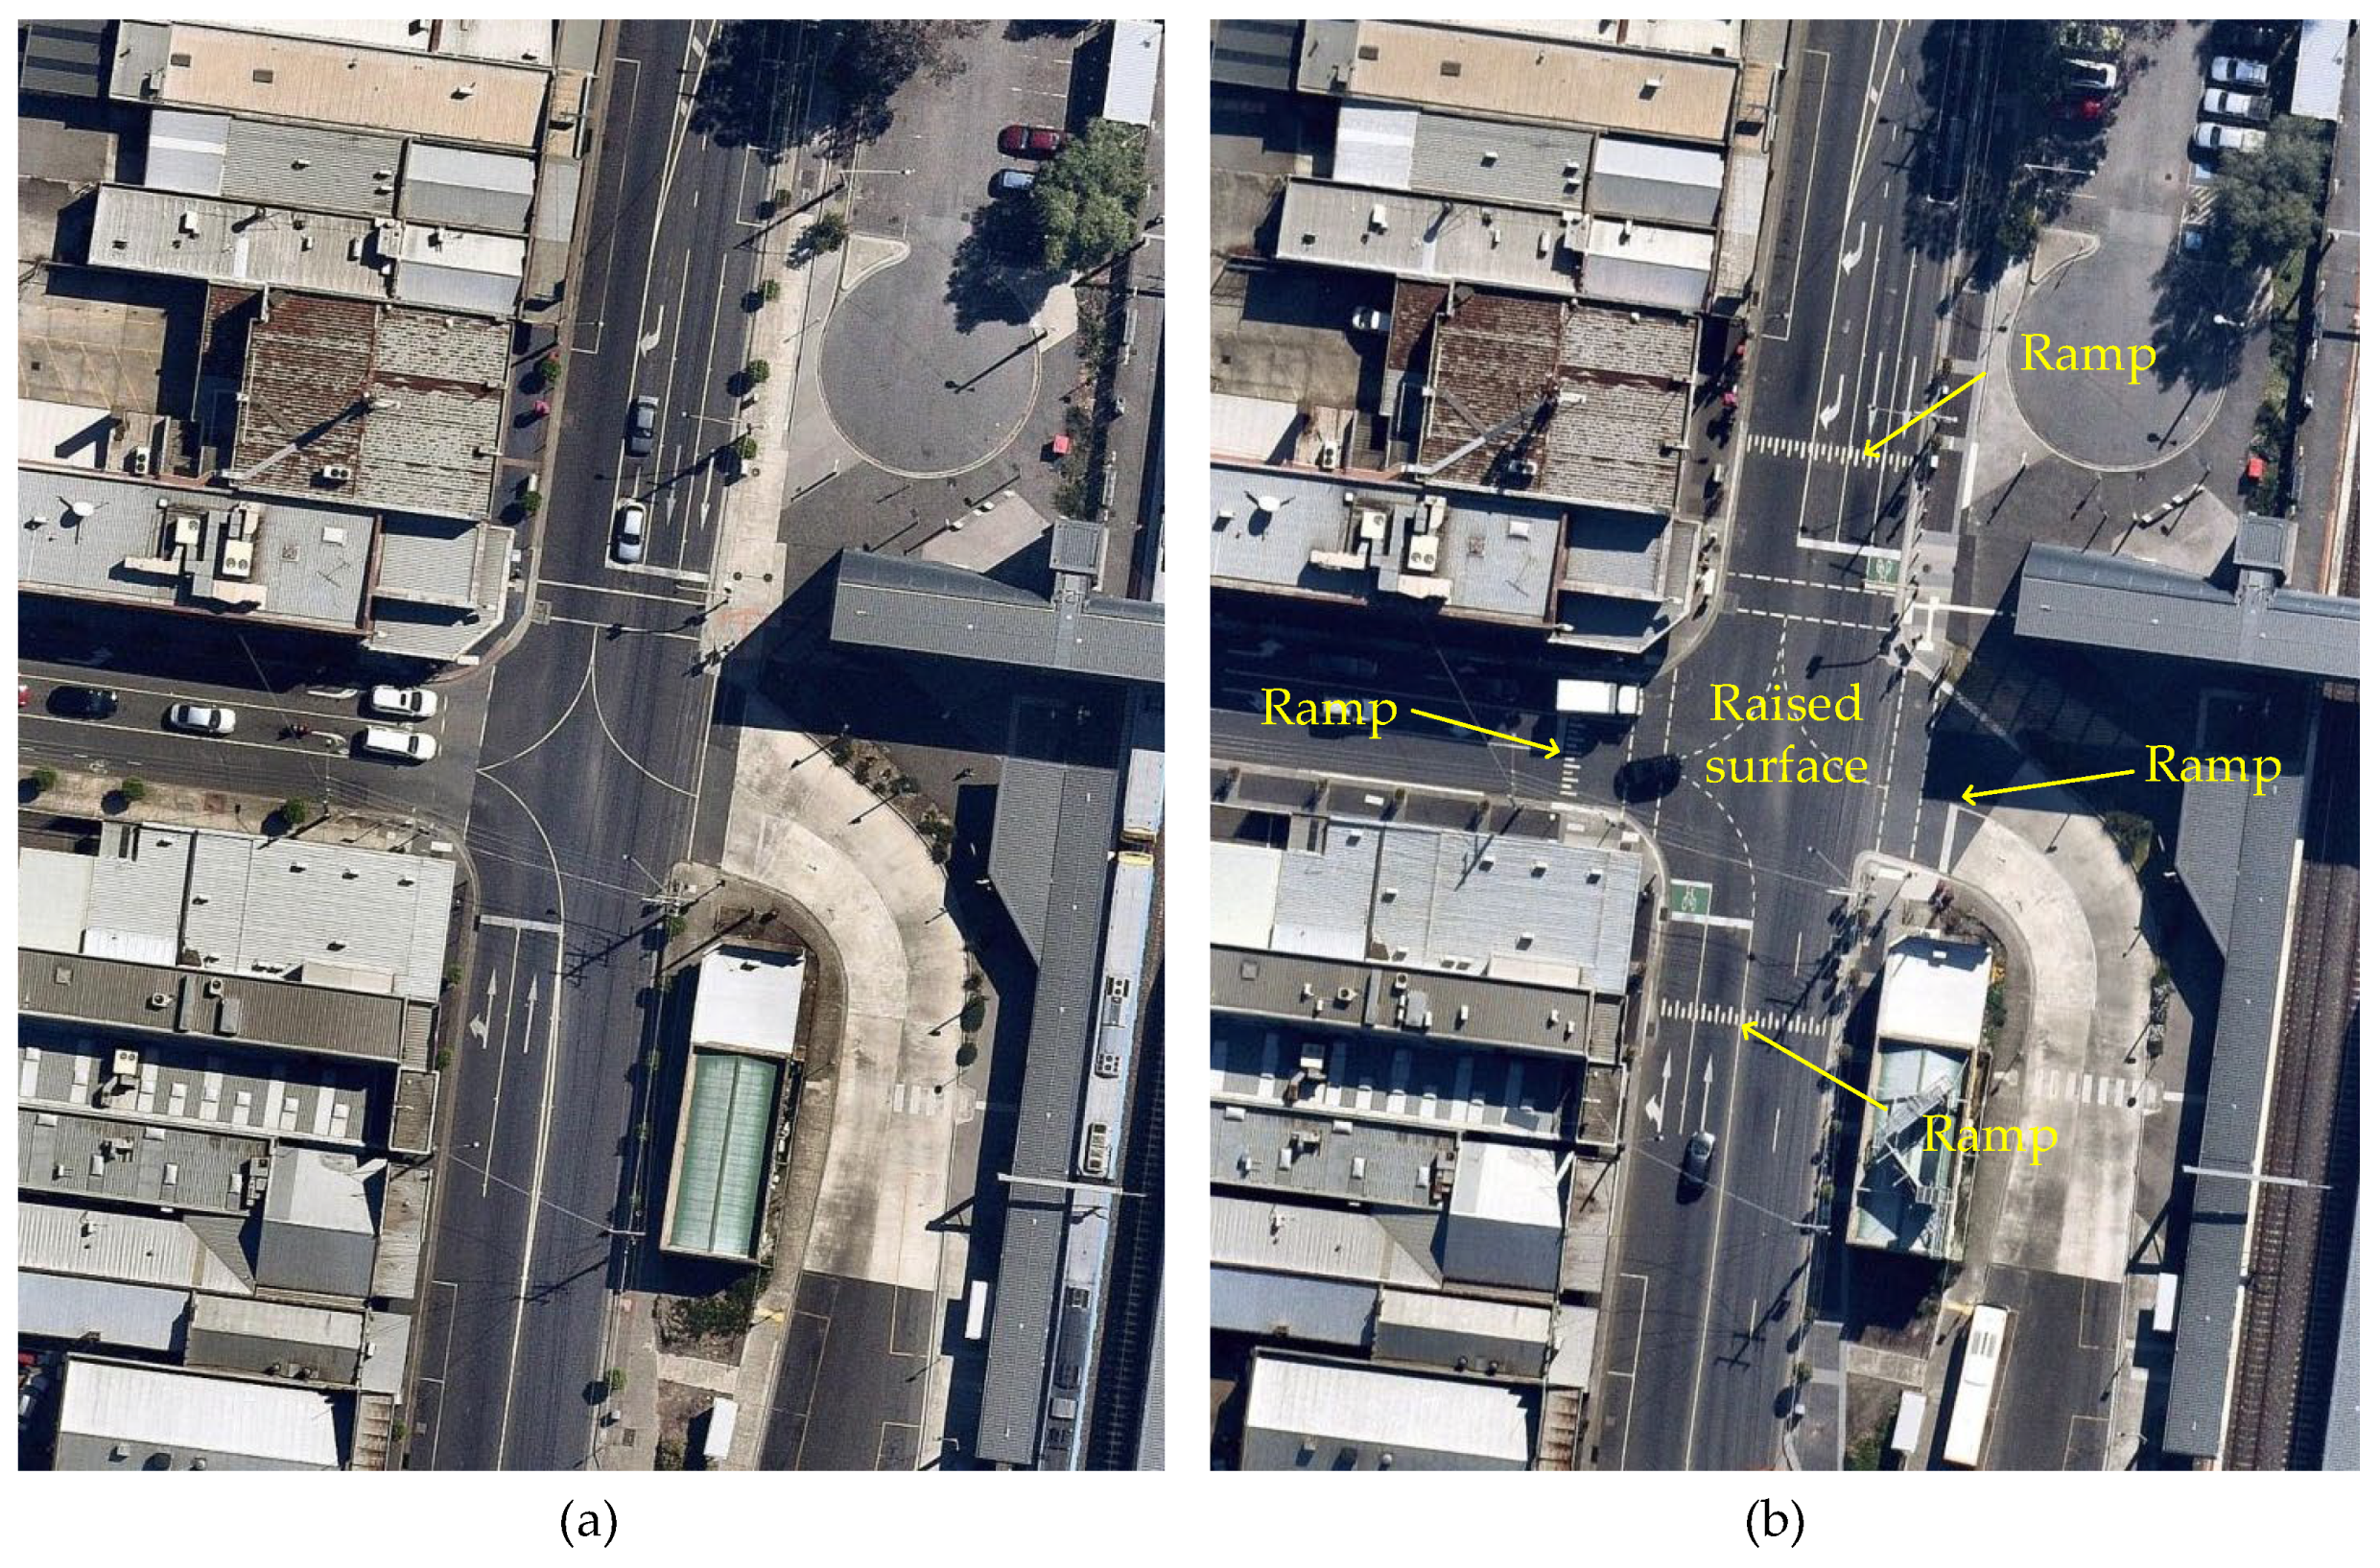
While this report indicates that RPSs may have significant safety benefits on account of likely speed reductions, the findings are based on a small sample of sites, which included one site with results confounded by other infrastructure work. Accordingly, there is a need for more evaluation studies to more accurately estimate their effectiveness and safety benefits particularly at major intersections (
Figure 1). In Victoria, Australia, the Road Safety Strategy, administered by the Transport Accident Commission (TAC) and the Department of Transport, describes a vision to halve road deaths and reduce serious injuries by 2030 through the use of proven safety measures [
7]. This includes modifications to the road infrastructure. In view of this, the Safer Roads Programme of the Department of Transport introduced a limited number of RSPs at Victorian intersections supported by a prospective evaluation their safety performance [
7].
The Raised Safety Platforms (RSPs) chosen for this study involved a combination of sites with raised intersections (surface raised across the full intersection) and raised approaches (raised across the stop-lines). There were six treated sites in total and five non-treated sites that were used as a control group. All RSPs at the treated sites were designed to reduce the comfort for drivers traversing through the intersection in an attempt to reduce the overall travel speed of vehicles approaching and entering the intersection.
1.1. Vision Zero and Safe Systems
Vision Zero is an expression of the ethical imperative that nobody should be killed or severely injured from road crashes. It was developed during the late 1990s by the Swedish Road Authority under the guidance of Professor Claes Tingvall [
8] and written into law in Sweden in October 1997 [
9]. From this philosophy, the Safe System approach was developed involving four research pillars, namely (i) safe behaviour, (ii) safe vehicles, (iii) safe roads and roadsides, and, importantly here, (iv) safe speeds to address these outcomes. The Safe System approach has been accepted widely by many countries to both understand the key factors associated with road trauma as well as identifying the most suitable and beneficial interventions to achieve the goal of Vision Zero.
Safe System speeds in urban areas are nominated as limits above which there is a steep increase in the likelihood of a fatal or severe injury to vehicle occupants and vulnerable road users in urban areas [
10]. In particular, the likelihood of a severe injury to a pedestrian increases steeply above 30 km/h and, to an occupant in a cross-traffic crash, above 50 km/h. Based on the speed limit at the treated sites, a notional reduction of 20 km/h or between 25% and 30% is required to bring speeds down to conform to the Safe System speed values.
1.2. Project Objectives
The project objectives here called for an analysis of the effectiveness of the RSPs to reduce speeding overall as well as at the three nominated Safe System speeds, namely 30 km/h, 40 km/h, and 50 km/h [
11]. In judging the Safe System benefits of the RSP trial, it was important to identify the benefit in terms of the overall speed reductions as well as what effects RSP provides in terms of the speed profiles in the approach and departure zones of the treated intersections. Potential for conflicts and red-light running were also studied, but these are not addressed here.
2. Materials and Methods
2.1. Study Design
The study involved a controlled before-and-after-treatment, quasi-experimental design that ran for 12 months. Baseline (before) data were collected initially over 24 h, seven days a week, for two weeks prior to the installation of the platforms. “After-treatment” data were collected 12 months later using the same strategy.
Speed measurement involved the use of pneumatic road tube data collected during the observational times. Road tube systems are commonly used to collect traffic volumes and speeds [
12] and were logged onto two-tube timestamp recorders. These are stand-alone units where data can be read from the displays and can be downloaded to a computer for creating reports.
Data were collected at multiple locations on the approach and departure of each leg at the six treated intersections and at five control sites. An additional treatment site was surveyed during the before period; however, this was later removed given that changes occurred at this site that are typically associated with reduced vehicle speed. Moreover, an additional control site was initially included in the study, and this was removed considering extraneous changes to the operating environment at the site.
The GPS of each tube location at baseline were logged for use in the after-study. Metro Count 5712 Timing Analysis Roadside Units were also interfaced with a limited number of signal displays for recording times when vehicles entered on the red signal attributed to the main through movement. In addition, limited video data were also collected at one or two sites for assessing potential conflicts, but these were not included in this analysis.
2.2. Data Collection and Analysis
Baseline speeds were measured at five locations on each intersection leg (A1 to A3 in the approach and D1 and D2 on departure) within the period 8 November 2018 to 13 December 2018.
Figure 2 shows the typical locations and spacings for the five tubes locations. Not all sites were surveyed at the same time due to on-site limitations, such as roadworks. After implementation, speeds were measured within the period 2 September 2019 to 30 September 2019. Each speed observation was stamped to one-hundredth of a second, from which the observation was identified by the type of day (weekday or weekend), time of day (hour starting), and traffic-signal phase status (green, amber, red) where available.
The findings were analysed in terms of both numbers and percentage differences, using differential and inferential statistics to show their robustness. Regression techniques were used to control for any contaminating factors that might bias the overall findings. This included controlling for the mean change in speed across the control group and differences in sampling across the different sites between the two time points with respect to the total number and temporal distribution (e.g., day of week). The control and treatment sites were matched at a group level but were not individually matched.
A regression model assuming a log-link relationship was used to estimate the group difference in the central tendency of speed across the treated sites. This model adjusted for the changes in the control group and other potential confounding factors and was also considered the most appropriate function to account for the non-normal distribution of the speed observations (Equation (1)).
A binary logit model was the general class of model used to evaluate the treatment effect on the odds of exceeding the Safe System speed values. This model was considered the most appropriate model to estimate the change in odds of exceeding Safe System speed values, which is a meaningful measure of safety performance. Moreover, the binary logit model is more robust against negatively skewed data that are often observed in traffic speed data at a signalised intersection. An example of the form of this model is provided below.
where, for each observation:
D describes the type of the day of week (weekday or weekend);
H describes the time of day (hour starting);
P describes the study period (before or after);
S describes the site (specific treated site or control);
G describes the group (treated or control);
β are coefficients representing the change in mean (log-linear) or odds (logit) of the outcome variable per unit change in the predictor variable.
While differences in the number and severity of crashes before and after treatment were sought, it was impossible to gain reliable figures for such a small sample of sites over a relatively short “after” period. Instead, the crash and severe injury savings were extrapolated from speed results plotted against severe injury and fatal risk curves. This included the exponential relationship between aggregated mean speed and the risk of injurious crashes published by Elvik in 2019 [
13] and the likelihood of a serious injury (MAIS3+) given a two-vehicle crash published by Bathouth in 2014 [
14].
3. Results
The study set out to examine the changes between the before-and-after-treatment periods in terms of speed reductions at each individual site and overall. These are presented for the main roads at the intersections, and a small number of minor road approaches were excluded. It was expected that these main road measures would essentially cover the main effects of the treatment given their few full-crossover intersections.
The road safety benefits attributed to these changes were estimated using the two different measures. Although not presented in this paper, the study also estimated change the risk of rear-end, right-turn-against, and vulnerable road-user crashes using conflict analysis methods.
3.1. Number of Observations
The total number of speed observations across the treated and control sites are provided in
Table 1. The total number of observations across all tube locations and sites in the treated group was 5.2 million before implementation and 4.9 million after implementation, with reduction of approximately 5.0%. The total number of observations in the control group remained consistent between the two periods, with 5.1 million before the time of implementation and 5.2 million after, an increase of only 1.5%.
These figures do not represent the actual volume of traffic at the intersection given the repeated observation across different detectors, possible variation due to study artefacts (e.g., data logger misreads), and that not all lanes on an approach were sampled (e.g., some exclusive turn lanes were excluded). Whilst they do suggest a possible change in traffic patterns in the treatment group indicative of a traffic diversion, the noticeable between-site variation suggests either random variation or another explanatory factor.
This is not unusual in such studies and given the high numbers of observations collected and the relatively small differences. It is unlikely therefore to have been an exposure effect, as described by the Transportation Safety Council (2009) in their Technical Briefing of Before-and-After Studies (
www.ite.org, accessed on 15 March 2021).
3.2. Speed
3.2.1. Central Tendency
The mean and 85th percentile of the speed observations at the detectors closest to the intersection on the approach (A3) and departure (D1) side are provided in
Table 2,
Table 3,
Table 4 and
Table 5. Whilst not of necessarily of statistical importance, the 85th percentile is typically used in traffic studies given its relationship to road design standards and guidelines.
All values combine observations in both directions at the approach and the departure locations. Differences in central tendency were assessed for each intersection, and all were found to be of statistical significance (p < 0.001). Little differences were observed between mean and median values. Group values are a weighted mean based on a unit observation.
Table 2 shows there was overall an 8.3 km/h (19.8%) significant reduction in the mean speed on the approach to a treated site, with a subsequent 3.0 km/h (6.8%) reduction on departure from a treated site. By contrast, there was only a 6.6% reduction in average mean speed on approach to a control site and a similar 0.4% reduction on departure.
The distribution of speed did not resemble a normal distribution before or after the implementation of the treatment. Accordingly, a regression model assuming a log-link relationship was used to estimate the difference in the central tendency of speed in the treatment group, adjusted for the change in the control group and other study factors. On approach to the intersection, there was a 15.6 percent reduction in speed due to the Road Safety Platforms (and a 6.8% reduction on departure). This difference was meaningful and of statistical significance at p < 0.001. Whilst the reduction in the central tendency of speed on departure of the treated sites was not as marked (−6.8%), it was still greater than that observed in the control group (−0.4%) and still attributed to the treatment.
The reduction in the 85th percentile speed on approach to a treatment site also reduced from before to after implementation (−21.0%). A reduction was also observed in the control group (−5.3%); however, this was noticeably lower.
Interestingly, the before-and-after difference at one site (Site E) was relatively small compared to the other treated sites. This site was the northernmost of a group of closely spaced intersections in a busy shopping area with a major commuter interchange. The southbound approach may have been subject to long queues during the morning peak, and traffic on the northbound approach would have been slowed by the lights at neighbouring intersections, tending to limit the possibilities for reduced speeds in the after phase.
The U.S. Department of Transportation noted that the geometric design of roundabouts in the USA assumes an entry speed of 25 to 40 km/h (FHWA 2000), approximately similar to what was observed here for the RSPs. This finding might suggest that in the future, well-designed RSPs at signalised intersections could become a treatment comparable to roundabouts in effectiveness.
3.2.2. Safe System Speed Values
The percentage of vehicles exceeding the Safe System speed values of 30 km/h, 40 km/h, and 50 km/h before and after implementation are provided in
Table 6. These are provided for vehicles approaching the intersection on a main road approach, at the tube location immediately at the intersection (A3). There were reductions observed in the percentage of vehicles exceeding all Safe System thresholds in both the treatment and control groups; however, the markedly greater reductions were observed in the treatment group.
The odds of a vehicle exceeding the Safe System speeds given the treatment are provided in
Table 7. The model indicated that there were reductions in the odds of a vehicle exceeding all Safe System values given the treatment compared to the control group and that these reductions were of statistical significance. There was a 46% reduction in the odds of a vehicle exceeding the nominal Safe System value for pedestrians (30 km/h), a 69% reduction in the odds of exceeding 40 km/h, and an 80% reduction in the odds of exceeding 50 km/h. It was also estimated that the threshold speed above which “practically no” vehicles would exceed was in the order of 60 to 65 km/h.
3.2.3. Treatment Halo
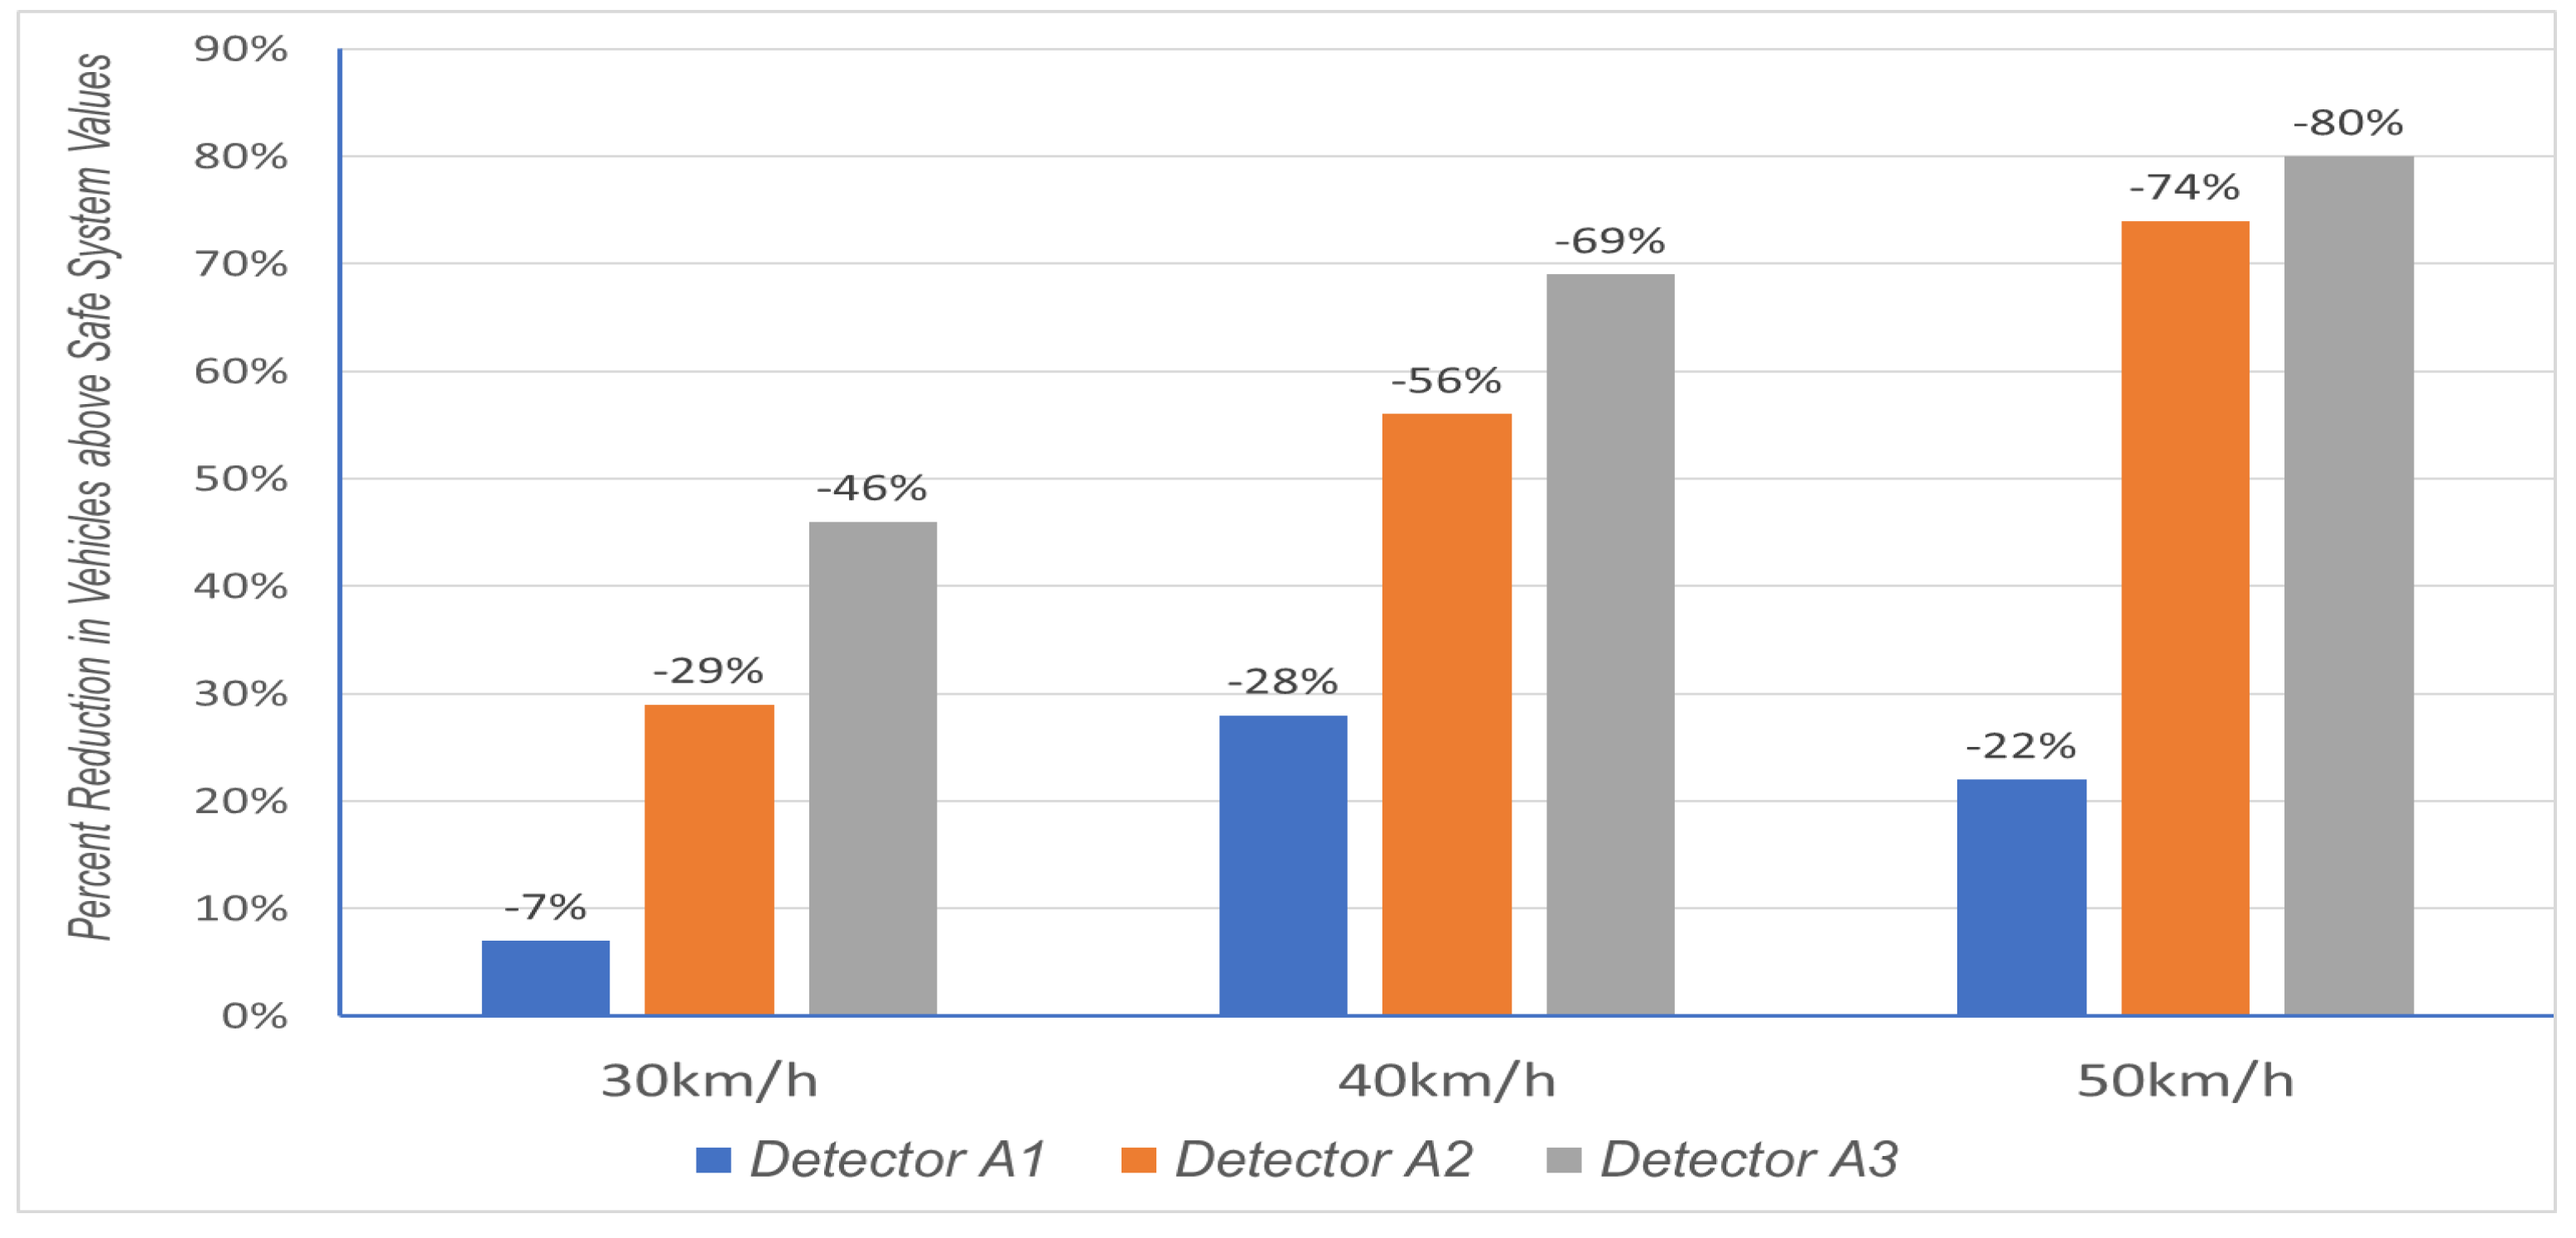
The odds of a vehicle exceeding the Safe System values at the different tube locations (A1, A2, and A3) on the approach to a treated site is expressed as a percentage reduction in
Figure 3. Whilst the greatest reductions were observed across all Safe System values at the tube location closest to the intersection (A3), there were still meaningful reductions observed at the two tube locations farther from the intersection. This was particularly true for the higher Safe System speeds of 40 km/h and 50 km/h.
The distance of the tube location of farthest from the intersection (A1) varied across the sites. Notwithstanding this, it was estimated that the treatment effect halo is not likely to be greater than 100 m from the intersection.
3.3. Injury Benefits
The programme analysis called for an assessment of its impact on the likely crash and injury reductions of these platforms. While it was not possible to collect sufficient real-world crash figures in this trial, an alternative approach was considered involving two separate methods.
The first made use of crash risk analyses, recently published by Elvik et al. [
13], which reported the relationship between the change in mean speed of the traffic and the likely change in the number of injurious crashes. This is an aggregated injurious crash-reduction analysis that generalises across crash types. The second approach made use of published injury likelihood curves in two-vehicle crashes of different configurations. This assesses the likelihood of a severe injury (MAIS3+) given that a crash occurs involving vehicles travelling at different speeds and crashing under different crash configurations (e.g., cross-traffic crash) [
14,
15].
3.3.1. Injurious Crash Reductions
In a recent publication, Elvik et al. [
13] reported on the most recent estimate of the relationship between speed and road safety, confirming that an exponential parameter for relating the overall risk of a fatal or severe crash outcome with mean speed to be 0.034. Given the speed reductions observed in this study, this would amount to a reduction in fatal and serious injures (FSI) of around 23.6%, that is, 24 fewer serious injuries for every 100 crashes at these this type of intersection. This method is commonly adopted by studies such as this one for estimating aggregate safety benefits [
16], and the studies on which the model exponent is based include studies based in jurisdictions applicable to the present study. It is noted, however, that the studies are most commonly on area-wide road safety programs, such as changes to speed-limit policy, education, and enforcement, and the applicability of the model to changes to road infrastructure at a specific location must be considered.
3.3.2. Severe Injury Likelihood Reductions
The change in the likelihood of a severe (MAIS3+) injury given a crash between two vehicles was assessed for crash configurations typical of this type of intersection based on the speed reductions observed in this study. For this assessment, the likelihood curves described in Bahouth et al. [
14] were used to describe the relationship between change in velocity (Delta V) in a collision and the likelihood of a severe injury to a driver. The methodology to calculate Delta V and the corresponding likelihood of an MAIS3+ injury, was adapted from Jurewicz et al. [
15]. This included identifying the likelihood of an injury for each driver of the two vehicles, along with the likelihood of the collision resulting in at least one MAIS3+ injury.
Based on the change in speed observed in the study, there were reductions in the likelihood of a severe injury (to any driver) that ranged from 38.3% to 57.2% across the different crash configurations. Crashes involving vehicles initially travelling from adjacent directions (e.g., cross-traffic crashes) were subjected to greater percentage reductions. It was also observed that drivers of the struck vehicle in a cross-traffic crash were beneficiaries of the greatest reduction in the likelihood of a severe injury.
4. Discussion
This study set out to assess the likely road safety benefits of Raised Safety Platforms (RSPs) at busy urban intersections. Clearly, the RSPs in this study have substantially reduced vehicle speeds at the treated sites compared to the control sites. Speeds at control sites had changed very little in the period between the surveys, indicating that little had changed on the road network in the area other than the installation of the RSPs. Unfortunately, one treatment and one control site could not be included in the analysis given the installation of traffic signals during the study period. It was concluded, though, that including these sites was unlikely to have had any impact on the findings here, as vehicle speed findings were based on a large sample of observations at both the treatment and control sites.
4.1. Individual Site Analysis
For the six individual treated sites, the speed reductions at the approach to the RSPs (location A3) varied appreciably from a high of 29% to a low of only 4%, while for five control sites, the differences ranged from −4% to +3%. The 85th percentile findings revealed similar speed reductions, with a 21% reduction at the approach and an 8% reduction on departure at the treated sites, and the respective values were −5% and −1.4% at the controls. Similar patterns of speed reduction were also noted on at the departure locations too.
In terms of recommended Safe System speeds, there were sizeable reductions in the number of vehicles exceeding these values in both the approach and departure measurement locations. Following the installation of the RSP, the capacity was found to increase slightly by 1.4% to just over 1700 PCU/lane/h. Demand was found to be well below this level, peaking at approximately 800 vehicles/h in the morning peak in the Before phase, falling to approximately 700 vehicles/h in the after phase. The findings illustrated that it is extremely unlikely there would be an adverse effect on capacity or congestion following installation of the platforms.
4.2. Programme Analysis
As noted earlier, there were significant reductions overall in mean travel speed at the treated sites compared to the control or untreated sites in the same travel environment. There were also similar differences observed at the 85th percentile of the treated and control speed distributions. This illustrates the potential overall benefit of the RSP at the locations under test. Using a log-link model approach, a
15.6 percent overall reduction in travel speed due to the Road Safety Platforms was found after adjusting for the change in the controls. This was statistically significant at
p < 0.001. Using the risk curves published by Elvik et al. (2019) [
13] and the exponential parameter of 0.034 per km/h they reported, an overall reduction in severe injury crash risk of 24% after treatment could be expected across the six treated sites evaluated here. In addition, using the injury risk curves published in Bahouth et al. (2014) [
14], a reduction in the risk of a severe injury for pedestrians impacts of between 18% to 56% was identified.
Finally, the speed profile analysis showed that speed reductions occurred progressively across the three measurement locations in the approach to the platforms and on departure from the platforms. This is important, as it shows the effect is not a late decision by the motorists, ensuring that the platforms are unlikely to induce last-minute braking that would pose a potential danger and conflict at these treated intersections not currently observed.
4.3. Safe System Benefits
Taking account of the change in speed in the control group, the regression model indicated that, overall, the treatment had a positive effect on reducing the likelihood of vehicles exceeding the Safe System speeds on the approach to the intersection. Overall, these ranged from a 46 percent reduction in the likelihood of a vehicle exceeding 30 km/h at the intersection to a maximum 80 percent reduction in the likelihood of exceeding 50 km/h. It also had a positive effect at those measurement sites further from the intersections (A1, A2, and D2) although the benefits of the treatment varied with increasing distance from the intersection. For example, the likelihood of a vehicle exceeding 30 km/h was reduced by 7 percent around 50–60 m back from the intersection (A1). While not directly measured, this suggests a halo effect of the treatment in the order of around 80 to 100 m.
4.4. So What Does This Mean for RSPs?
These results are extremely promising for the widespread use of Raised Safety Platforms as an intervention at urban intersections across the state of Victoria and possibly beyond. The Department of Transport noted that intersections in Metropolitan Melbourne (urban) areas pose a significant safety risk [
17]. From 2015 to 2019 in Melbourne Metropolitan, they noted that collisions at intersections led to 30% of deaths and 42% of serious injuries on Victorian roads. With motorists, pedestrians, and cyclists making turns and crossing paths, the risk of a crash is very high.
The Transport Accident Commission [
7] claimed that small increases in travel speed can have large increases in the level of injury and the likelihood of death. Thus, reducing travel speed at intersections, especially in urban areas, has the potential to reduce these severe crashes. They are potentially cost effective although this was beyond the scope of this study.
4.5. Strengths and Limitations
To our knowledge, this was the first published on-road analysis of the effectiveness of the chosen design of the Road Safety Platform using a quasi-experimental design with before-and-after approach with both treated and control sites. The before-and-after design is most useful in demonstrating the immediate impacts of short-term programs [
18]. However, it is less useful for evaluating longer term benefits of interventions, as the benefits may be compromised over a longer period of time with new circumstances arising that may obscure the effects of an intervention. (the inclusion of a treatment and control comparison helps in validating the findings). It would have been useful to have included more sites across varying test regions and environments; however, this was not possible within the constraints of this study. It is an area that warrants further research.
5. Conclusions
The speed and Safe System benefits achieved from the preliminary trial of the six treated intersections with RSPs revealed significant slower travel speeds at each of the treated sites before and after treatment and between cases and controls. The reductions in the speed observed represent substantive progress towards achieving safer vehicles speeds through road design. In particular, there were marked reductions in the proportion of vehicles exceeding the Safe System speeds for vulnerable road users (30 km/h) and other critical crash types (40 km/h and 50 km/h).
These reductions ranged from 46% to 80%, and the odds of a speed exceedance reduced as the Safe System speed value increased. It is expected that the treatment more strongly influences speed choice at higher speeds, overriding other factors, such as the speed limit, given the physical discomfort imposed on the vehicle occupants.
When related to empirical injury risk curves, the speed reductions reflected an aggregate-level injurious crash reduction of around 26% and a reduction in the likelihood of a serious injury given a crash of between 38% to 57% depending on the crash type. Again, this indicates substantive progress towards reducing the burden of road trauma.
Whilst these results were adjusted for the changes in the control group, they are robust estimates of the consequence of the installation of the intersection platforms as a programme of works.
It should be noted that these benefits were averaged across the six sites and that they varied individually in travel speed across each site at the project level. The variation across different sites was largely attributed to the initial operating speed at the intersection before treatment, where higher reductions were observed at sites with higher initial speeds. While this indicates that intersections in higher speed environments may benefit more from this type of treatment, it is important to note that they may require additional treatments on the approach to the intersection to reduce the speed incrementally to the design speed of 40 km/h.
As this preliminary study only involved a limited number of sites in a single region, further research is warranted across a broader sample of urban intersections and regions.
Author Contributions
B.L.—data duration, major formal analysis contribution, methodology, writing original and review, acceptance for published manuscript, contact person. B.F.—conceptualisation, funding acquisition, formal analysis contribution, methodology input, project administration, writing contribution for draft and review, supervision, presentation to clients, agreement to publication. P.C.—input to conceptualisation, funding acquisition, methodology input, project administration, writing review and discussion, liaison with major funders, agreement to publication. S.D.—input to funding acquisition, methodology input, administration, writing review, project supervision, liaison with major funders, agreement to publication. A.S.—input to funding, methodology input, project administration, draft review and approval of final draft, project supervision, presentation of findings, agreement to publication. All authors have read and agreed to the published version of the manuscript.
Funding
This research was funded by Department of Transport and the Transport Accident Commission of Victoria, grant number CN9887.
Institutional Review Board Statement
The study was conducted according to the guidelines of the Declaration of Helsinki, and approved by Ethics Committee of ARRB Transport and Monash University (details waived).
Informed Consent Statement
Not applicable.
Data Availability Statement
The data are the property of the funders and participating research organisations and are not freely available.
Acknowledgments
Not applicable.
Conflicts of Interest
The authors declare no conflict of interest.
References
- Hawley, L.; Henson, C.; Hulse, P.; Brindle, R. Towards Traffic Calming: A Practitioner’s Manual of Implemented Local Area Traffic Management and Blackspot Devices; Report CR126; Federal Office of Road Safety, 1992.
- Huan, H.F.; Cynecki, M.J. Effect of traffic calming measures on pedestrian and motorist behaviour. Transp. Res. Rec. 2000, 1705, 26–31. [Google Scholar] [CrossRef] [Green Version]
- Lydon, M.; Morehouse, M. Moving from Regional Complete Streets: Policy to Action; Report; Fitzgerald and Halliday Inc.: Hartford, CT, USA, 2008; Available online: https://complete-streets-policy-to-action.eventbrite.com (accessed on 20 December 2018).
- Vasudevan, T. Patel Comparison of Discomfort Caused by Speed Humps on Bicyclists and Riders of Motorized Two-Wheelers, Sustainable Cities and Society; Elsevier Publications: Amsterdam, The Netherlands, 2017. [Google Scholar] [CrossRef]
- VicRoads. Raised Safety Platforms (RSPs); Road Design Not. RDN 03-07; December 2019.
- Austroads. Effectiveness and Implementation of Raised Safety Platforms; Research report AP-R642-20; November 2020. [Google Scholar]
- Cairney, P.; Davy, S.; Fildes, B.; Lawrence, B.; Thompson, L.; Newstead, S. Road Safety Platforms, Final Report on the Short-Term Evaluation of their Safety Performance; Report CN9887; Safer Roads, Dept. Transport: Footscray, VIC, Australia, 2020.
- VicRoads. Road Safety Program—Metropolitan Melbourne Projects. 2021. Available online: https://www.vicroads.gov.au/safety-and-road-rules/road-rafety-program/road-safety-program-metropolitan-melbourne-projects (accessed on 15 March 2021).
- Ministry of Transport and Communications. En Route to a Society with Safe Road Traffic; Selected extract from Memorandum prepared by the Swedish Ministry of Transport and Communications. Memorandum, DS 1997:13; 1997.
- Austroads. Guide to Traffic Management Part 2: Traffic Theory; AGTM02-08; Austroads: Sydney, NSW, Australia, 2008. [Google Scholar]
- Austroads. Safe System Assessment Framework AP-R509-16; Austroads: Sydney, NSW, Australia, 2016. [Google Scholar]
- FHA. Traffic Monitoring Guide; US Department of Transport, Federal Highway Administration: Washington DC, USA, 2016; Updated.
- Elvik, R.; Vadeby, A.; Hels, T.; van Schagen, I. Updated estimates of the relationship between speed and road safety at the aggregate and individual levels. Accid. Anal. Prev. 2019, 123, 114–122. [Google Scholar] [CrossRef] [PubMed]
- Bahouth, G.; Graygo, J.; Digges, K.; Schulman, C.; Bau, P. The Benefits and Trade-offs for Varied High-Severity Injury Risk Thresholds for Advanced Automatic Crash Noti-fication Systems. Traffic Inj. Prev. 2014, 15 (Suppl. 1), S134–S140. [Google Scholar] [CrossRef] [PubMed]
- Jurewicz, C.; Sobhani, A.; Woolley, J.; Dutschke, J.; Corben, B. Exploration of vehicle impact speed—Injury severity relationships for application in safer road design. Transp. Res. Procedia 2016, 14, 4247–4256. [Google Scholar] [CrossRef] [Green Version]
- World Health Organisation. Road Safety—Speed. 2004. Available online: https://www.who.int/violence_injury_prevention/publications/road_traffic/world_report/speed_en.pd (accessed on 20 December 2018).
- Department of Transport 2020. Victorian Road Safety Strategy 2021–2030; Victorian Department of Transport, December 2020. Available online: https://transport.vic.gov.au/-/media/tfv-documents/victoria (accessed on 20 December 2018).
- Sedgwick, P. Before and after study designs. BMJ 2014, 349, g5074. [Google Scholar] [CrossRef] [PubMed] [Green Version]
| Publisher’s Note: MDPI stays neutral with regard to jurisdictional claims in published maps and institutional affiliations. |
© 2021 by the authors. Licensee MDPI, Basel, Switzerland. This article is an open access article distributed under the terms and conditions of the Creative Commons Attribution (CC BY) license (https://creativecommons.org/licenses/by/4.0/).


