Article

Equivalent CO2 Emission and Cost Analysis of Green Self-Compacting Rubberized Concrete

1
Department of Civil Engineering, Bayero University, P.M.B. 3011, Kano 700006, Nigeria
2
Department of Mechanical and Civil Engineering, Purdue University, Northwest, Hammond, IN 46323, USA
3
Engineering Management Department, College of Engineering, Prince Sultan University, Riyadh 11586, Saudi Arabia
4
Department of Materials Science and Engineering, African University of Science and Technology, Abuja 900109, Nigeria
5
Department of Civil and Environmental Engineering, College of Engineering, Majmaah University, Al-Majmaah 11952, Saudi Arabia
*
Author to whom correspondence should be addressed.
Sustainability 2022, 14(1), 137; https://doi.org/10.3390/su14010137
Submission received: 22 November 2021 / Revised: 16 December 2021 / Accepted: 20 December 2021 / Published: 23 December 2021
(This article belongs to the Special Issue Sustainable Concrete Materials and Technologies)

Abstract

:
Global warming and climate changes are the major environmental challenges globally. With CO2 emission being one of the main greenhouse gases emitted to the environment, and cement and concrete production amounting to about 10% of the global CO2 emission, there is a need for the construction industry to utilize an environmentally sustainable material as an alternative to cement. This study analyzed the cost, CO2 emission and strength properties of green self-compacting concrete (SCC) ternary blend containing fly ash, calcium carbide residue (CCR), and crumb rubber (CR) as a replacement material by volume of cement, cementitious material, and fine aggregate, respectively. Cement was replaced with fly ash at 0% and 40% by volume. CCR was used as a replacement at 5% and 10% by volume of cementitious materials, CR replaced fine aggregate in proportions of 10% and 20% by volume. The result indicated that the mix with 0% fly ash and 20% CR replacement of fine aggregate was the most expensive and had the highest CO2 emission. However, the mix with 10% CR, 40% fly ash, and 10% CCR had the lowest CO2 emission and was therefore the greenest SCC mix. The 28-day maximum compressive strength of 45 MPa was achieved in a mix with 0% CR, 0% fly ash, and 10% CCR, while the utmost 28-day splitting tensile strength of 4.1 MPa was achieved with a mix with 10% CR, 0% fly ash, and 5% CCR, and the highest flexural strength at 28 days was 6.7 MPa and was also obtained in a mix with 0% CR, 0% fly ash, and 5% CCR. In conclusion, a green SCC can be produced by substituting 40% cement with fly ash, 10% fine aggregate with CR, and 10% CCR as a replacement by volume of cementitious material, which is highly affordable and has an acceptable strength as recommended for conventional SCC.

1. Introduction

Climate change has emerged as a major environmental concern. Environmental sustainability is the major challenge of the construction industry, and several measures have recently been taken to overcome excess CO2 emission and greenhouse gas emissions associated with cement and concrete production. About 30 billion tons of concrete is consumed annually all over the world. Previously, the production of one ton of concrete generated about 0.5 to 0.6 tons of CO2. However, in 2019, the CO2 generated from concrete production reached 72.5 kg CO2/ton. Compared to forty years ago, the quantity of CO2 generated from concrete production has tripled due to the increase in demand of concrete compared to other construction materials [1]. Cement production alone accounts for 8% of the world CO2 emission generated as a result of human activity [2]. Cement production emits more carbon; the process entails heating a combination of limestone and clay in a kiln at a very high temperature of 1400 °C using fossil fuel, although the amount of CO2 generated is a measure of different factors such as the production material used, cement kin type, and the fuel burned [3]. Cement plants produce CO2 emissions in two ways: firstly, CO2 generated from burned fuel accounts for 34% of the emission of the plant, and this could be avoided by using cleaner alternative means of energy; secondly, the remaining portion of CO2 comes from the reaction of calcium carbide during the clinker production, accounting for the remaining 66% [4]. Research shows that 2.5 g of CO2/kg on average is generated from natural stone and raw cement material transportation does not contribute much to the CO2 emission due to the proximity of the raw materials [5]. As of 2006, 31% of cement use in the USA was for road construction, 15% for commercial building, and 27% for residential building; the remaining 27% was used for other purposes such as the maintenance and construction of water-retaining structures [6].
Several sustainable methods of concrete production such as CO2 curing, CO2 infusion, and permanent locking in concrete, carbonation of concrete, the use of alternative fuels, carbon capture and storage, and a reduced amount of cement clinker through the use of supplementary cement materials has been adopted recently to reduce the emission of carbon dioxide in concrete production [7]. These processes have been discovered to improve the durability of concrete with reduced cement demand. This move will undoubtedly promote a carbon-neutral concrete industry. In this light, the major cause of CO2 emission, which is cement production, is reduced, as the cement is replaced with high-volume fly ash or other binders or pozzolanic materials in various proportions, thereby reducing the demand for cement production [8]. Several researchers have also evaluated the CO2 emissions of building structures using different concrete mix proportioning for different types of buildings and stages of life cycles [9,10,11]. Wang [12] utilized a gene expression algorithm to compute the cost and evaluate the equivalent CO2 emission of high-strength concrete containing silica-fume. They reported that an increase in strength of the concrete resulted in an increase in the cost of CO2 emission and concrete materials. Paik et al. [13] evaluated the CO2 emission of voided slab systems in comparison to conventional reinforced concrete slabs. They considered the raw materials and operation for the CO2 calculations. They reported that a reduction in the CO2 emission for the voided slab compared to the conventional reinforced concrete slab due to a reduction in the materials used. Kim et al. [14] also evaluated the CO2 emissions of concrete used in construction sites. They reported that the use of fly ash and blast-furnace slag as cement replacement materials reduced the equivalent CO2 emissions of the concrete. Yang et al. [15] Studied the CO2 emission effects of alkali-activated concrete (AAC) following all steps from cradle to gate. They found that an increase in the concrete’s strength resulted in an increase in CO2 emission. Furthermore, they reported that the use of cement replacement materials in the AAC reduces the CO2 emission in the range between 55% and 75%. Therefore, the higher the strength of the concrete, the more CO2 will be emitted and the higher the cost of the concrete.
However, the cost of construction has always been a great concern in construction, and engineers are required to design and implement projects at a minimal cost provided the structural integrity of the construction is not undermined [16]. As the human population continues to grow with time, provision for more affordable housing becomes important for nation building. Low-cost buildings are suggested as a key to sustainable construction and a means to provide affordable houses for individuals with lower incomes [17]. SCC, however, requires no compaction and thereby reduces the time and cost of construction, although the cost of superplasticizers could be high, but only a small portion of these superplasticizers (about 2% of the concrete mix) are required, so their cost implication is not significant [18]. This research, therefore, aims to justify the incorporation of environmentally friendly materials in SCC production. The equivalent CO2 emission and production cost for the SCC mixes containing fly ash and CCR as supplementary cementitious materials, and CR as a partial substitute for fine aggregate were evaluated. Additionally, the mechanical strengths of the SCC blend mixes were also evaluated. Similar research has been conducted on conventional concrete; therefore, it is also adequate to examine these properties in SCC to bridge the research gap.

2. Materials and Methods
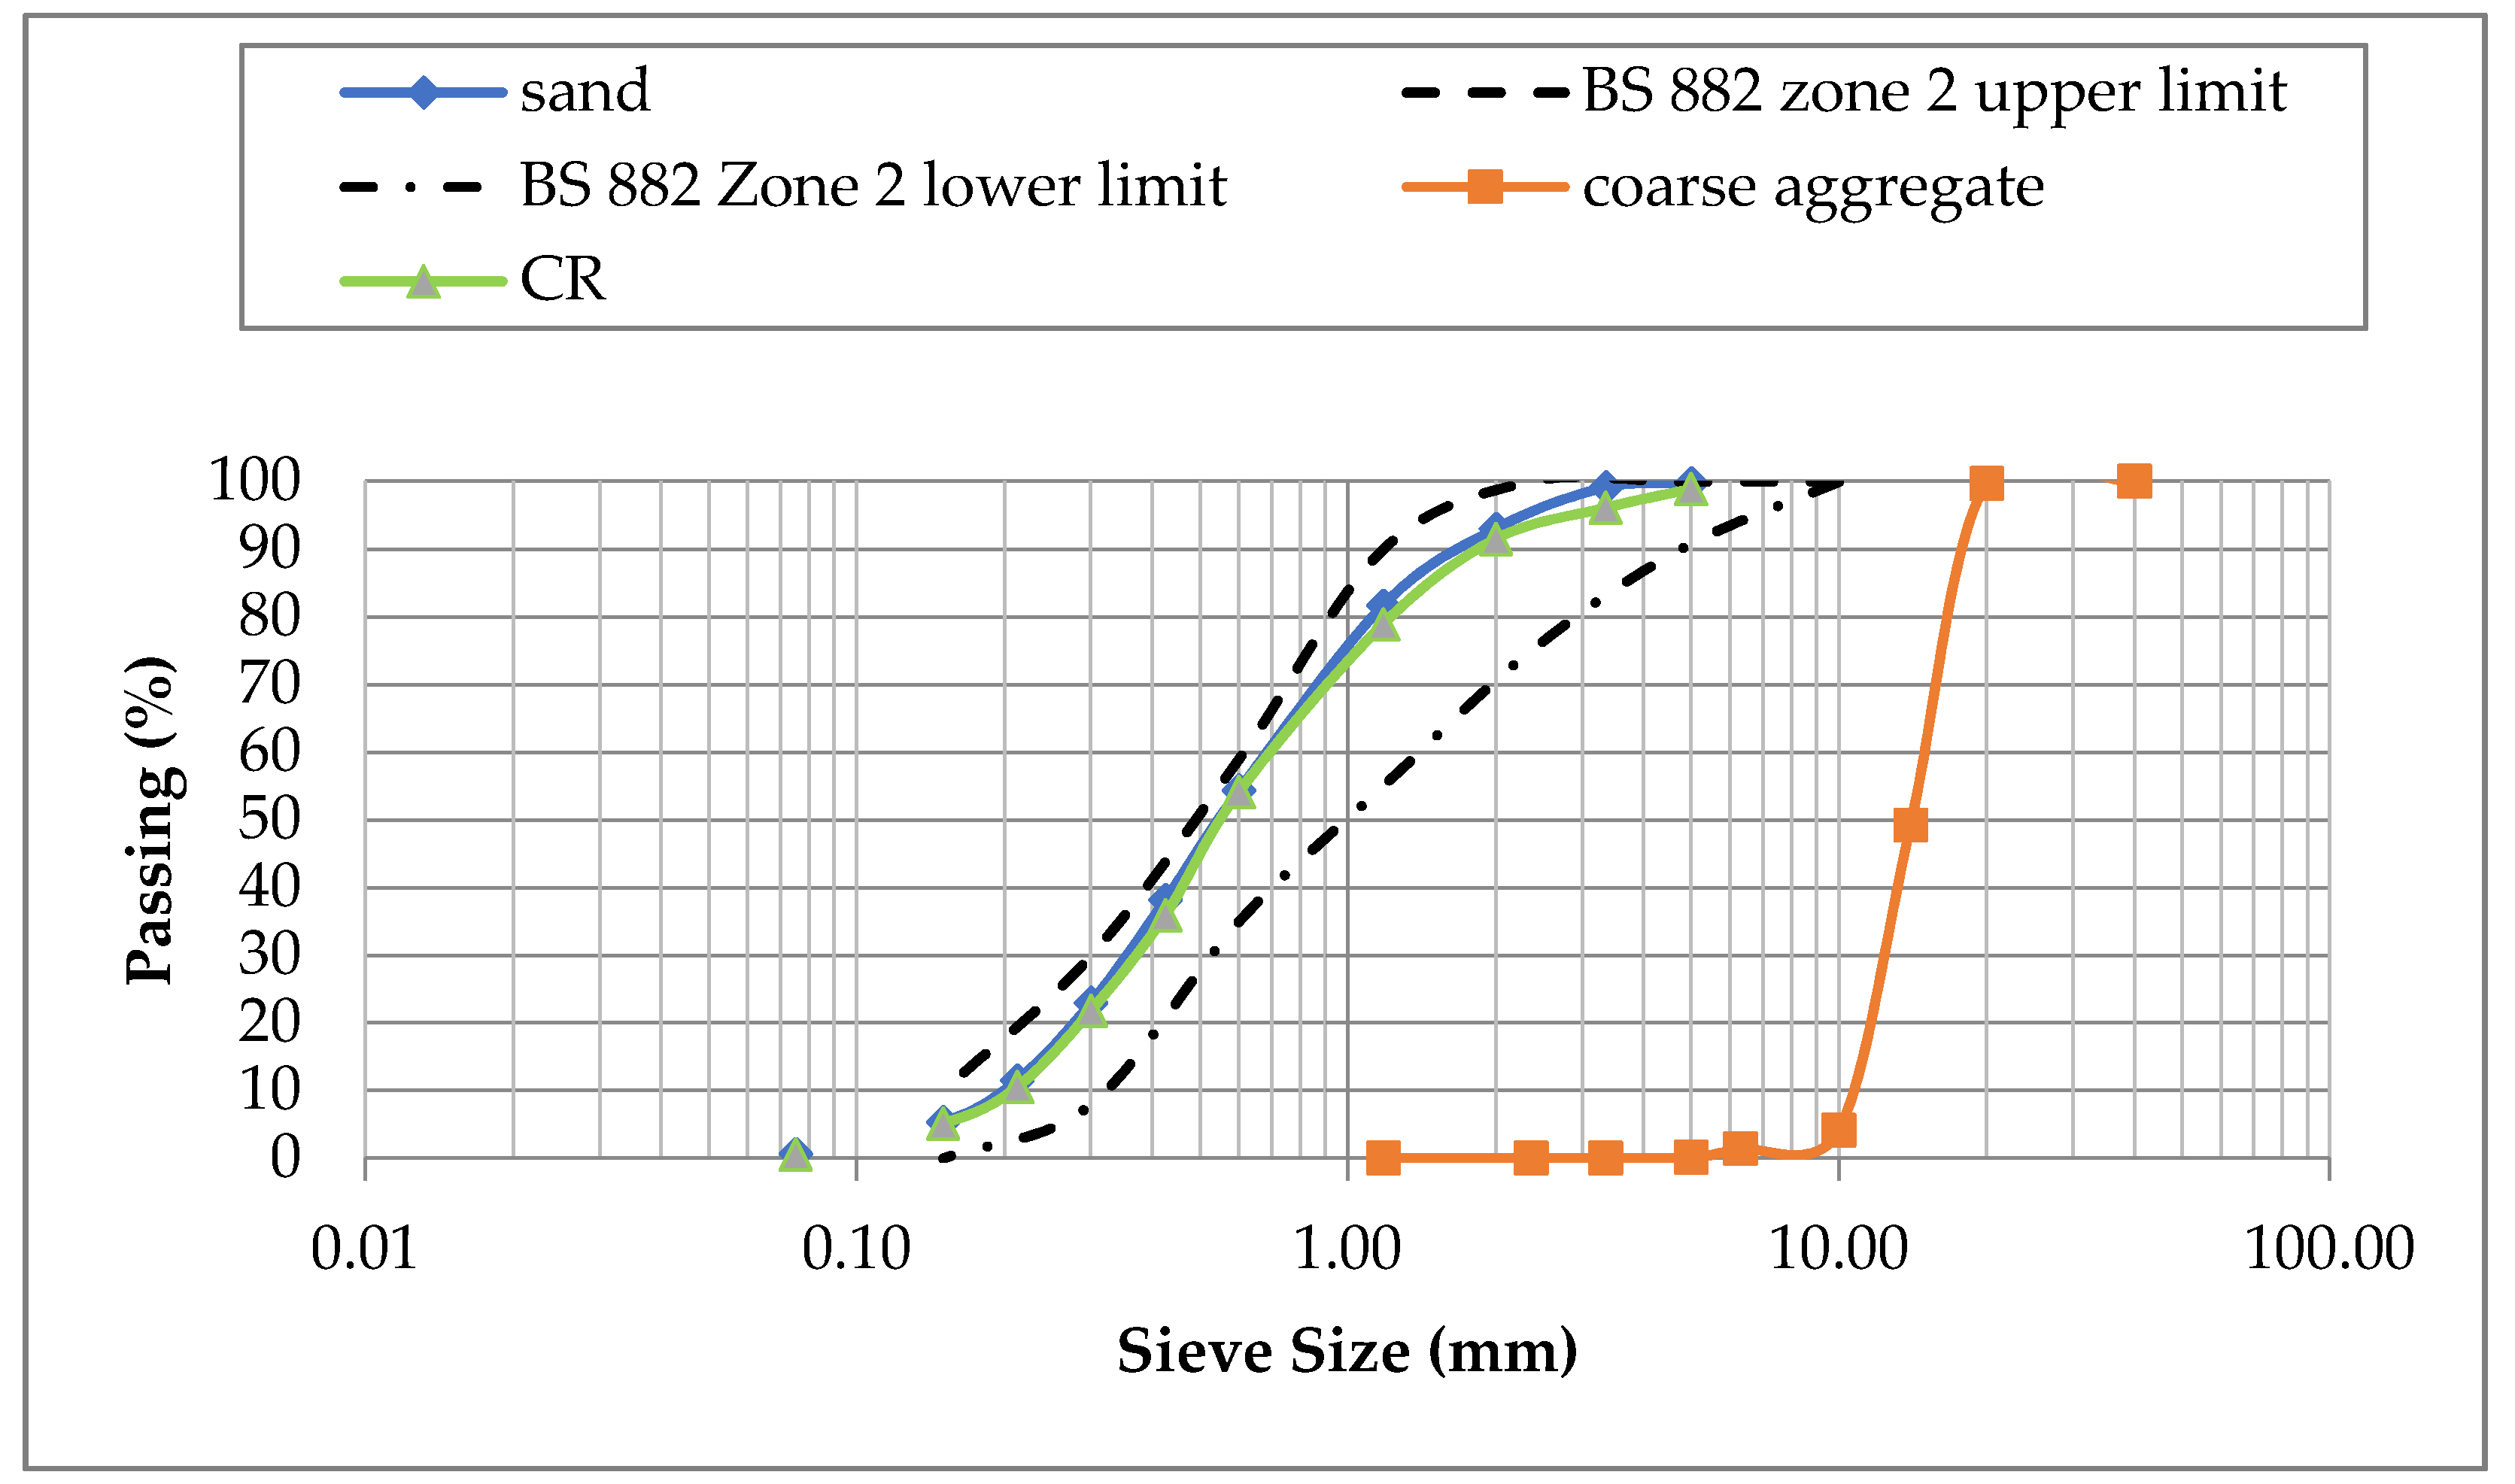
2.1. Materials

For this study, Type 1 Ordinary Portland Cement with a specific gravity of 3.5 obtained in accordance with BS EN 196-6 [19] requirements were used throughout this study. The chemical properties and specific gravity of the cement, fly ash, and CCR are presented in Table 1. Fine aggregate, coarse aggregate, and CR of particle gradation curve combined together as shown in Figure 1 were used. The fine aggregate grading shows a similar particle size with CR and belongs to the zone II class based on the grading limit on [20]. The coarse particle sizes are dominantly 53.77 and 41.49% as specified by EFNARC [21]. A high-range water-reducing admixture was added by weight of cementitious materials to achieve the self-compaction. The dosage of the superplasticizer was used based on the manufacturer’s specification of 1.3 to 9.8 mL/kg of cementitious materials.

2.2. Mix Proportioning

Percentage replacement was generated around the optimized mix from the existing literature to elaborately predict the effect of the green replacement materials on properties of SCC. Hence, eighteen blends of SCC were produced with variables as follows: in the proportion of 0%, 10%, and 20 CR replacement by volume of fine aggregate, and 40% fly ash volume replacement of cement, and 0%, 5%, and 10% CCR replacement by volume of cementitious materials. The mix proportions are presented in Table 2. The mix IDs are numbered according to the percentage replacement of the material. For example, mix number M10CR40F5C signifies a mix containing 10% by volume replacement of fine aggregate with CR, 40% by volume replacement of cement with fly ash, and 5% addition of CCR to cementitious material.

2.3. Sample Preparations and Experimental Methods

The batching, mixing, and sampling of the fresh concrete was carried out in accordance with the guidelines outlined in BS 1881-125 [22]. A rotating pan mixer was utilized for the mixing of the fresh concrete. Before mixing, the cement, fly ash, and CCR were ensured to be completely dried and free from lumps, and the aggregates were in saturated surface dry condition to avoid absorption of the mixing water. The fine aggregate was first poured into the mixer, followed by the cement, fly ash, and CCR. They were then allowed to mix for about 30 s. After that, the coarse aggregate and half of the mixing water were added, and the mixing continued. The superplasticizer was mixed with the other half of the mixing water and was poured gently to the concrete in the mixer. The mixing was continued for about 2 min until a completely homogenous paste was achieved. The mixing was carried out at a room temperature of 20 ± 5 °C and controlled relative humidity. Immediately after mixing, the fresh concrete was casted into the molds. Prior to casting, the molds were cleaned and oiled for ease of demolding. The samples were then air dried for 24 h at room temperature before demolding. After demolding, the samples were fully immersed in clean water for the curing periods prior to testing. The compressive strength test was carried out in accordance with EN 12390-3 [16] using a 1000 kN capacity universal testing machine. One-hundred-millimeter cube samples were prepared and cured for 3, 7, 28, 56, and 90 days prior to testing. For each mix and curing period, triplicate samples were tested, and the average result was reported. The flexural strength test was performed in accordance with the guideline outlined in BS EN 12390-5 [23] using the center point loading method. Prisms of 100 mm × 100 mm × 500 mm were prepared and cured for 3, 7, 28, 56, and 90 days before testing. The samples were tested in triplicate for each mix and each curing period, and the mean value was reported. The splitting tensile strength test was performed following the specifications of BS EN 12390-6 [24], using a 1000 kN UTM. Cylindrical samples of 100 mm diameter and 200 mm height were prepared and cured for 3, 7, 28, 56, and 90 days prior to testing. For each mix and curing period, three samples were tested, and the average value was reported.
The cost of the material used in this study was obtained from the market prices and is shown in Table 3. The total cost for each of the mix was calculated using Equation (1).
C o s t = i = 1 n ( k i × m i )
where i represents the constituent material number in the mix, n represents the total raw materials in the mix, ki represents the cost of raw material i, and mi represents the quantity of raw material i in kg/m3.
The equivalent CO2 emission of the concrete constituent materials from cradle to gate is presented in Table 4. The CO2 emission for the concrete production include that of the batching and mixing and does not include that of transporting the concrete as it is produced and tested in the laboratory. This implies the overall carbon dioxide emission resulting from production, transportation, and mixing processes. The equivalent CO2 emission of the mixes from cradle to gate was calculated from the unit emission in Table 4 with the mix designs in Table 2 using Equation (2).
C O 2 ,   e m i s s i o n = i = 1 n ( M i × C O 2 , ( i J ) )
where i is the individual constituent material number in the self-compacting ternary blend mix, n is the overall constituent material in the self-compacting ternary blend mix, Mi is the quantity of the constituent material i in kg/m3, CO2,(i − J) is the equivalent CO2,emission of the constituent material i including material and production, transportation, batching and casting of the concrete in (CO2-kg/kg).

3. Results and Discussion

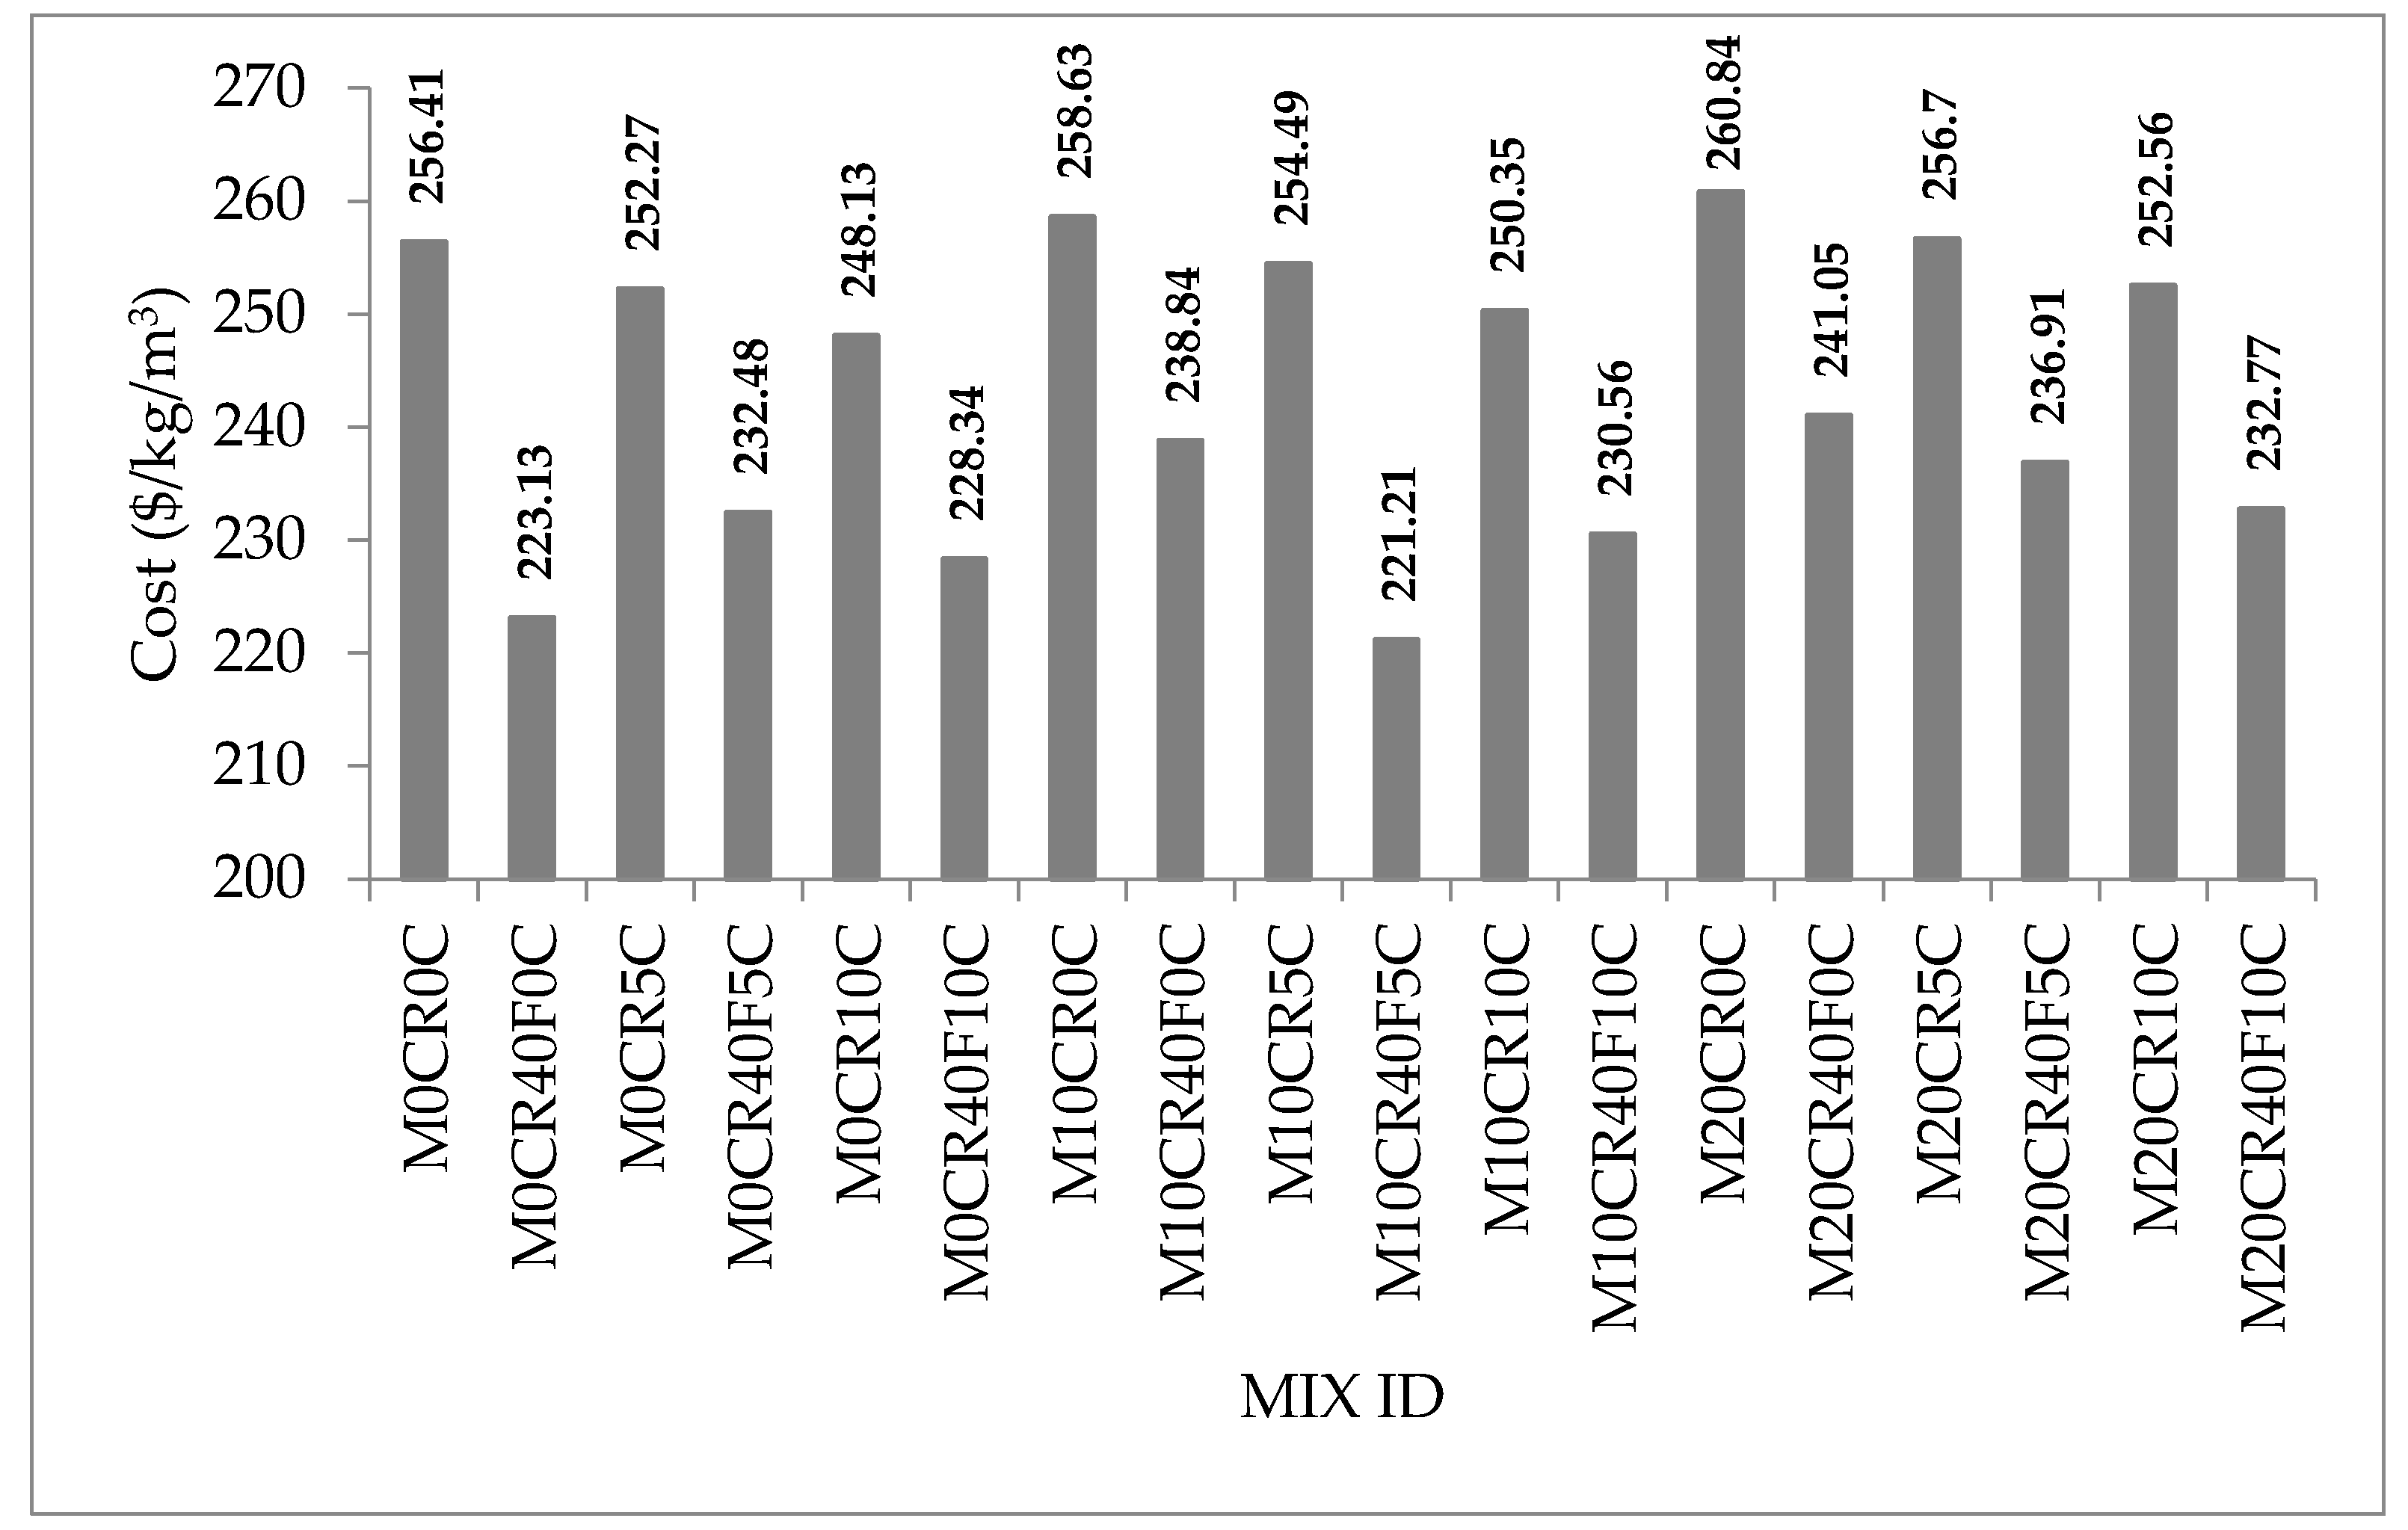
3.1. Cost Analysis of SCC Mixes

The cost summary used to produce each of the SCC blend mixes is presented in Figure 2. It can be observed that the mixes with fly ash cost less than the control mixes due to the lower cost of fly ash in comparison to cement it replaced in the SCC mixes. On the other hand, the cost of the SCC blend increased slightly with the partial replacement of fine aggregate with CR due to the increased cost of the latter compared to the former, the slight increased cost of the CR results from the processing cost of the waste tires into crumb sizes. However, this could be reduced when the CR production became highly commercialized in large quantities. Nevertheless, incorporation of CR in SCC has several benefits ranging from the increase in flexural strength, toughness, and energy absorption, which in turn enhances its durability and ability to last longer, thereby saving the maintenance cost [16]. This is in line with the study of Samarul H. et al. [29], wherein they agreed that the initial cost of concrete is high but cost of maintenance tends to be low. Additionally, the use of CR in concrete promotes waste utilization and prevents the nuisance caused by the disposal of the non-biodegradable waste tires, which occupies useful land space when disposed or buried and generates toxic gases in the atmosphere when burnt. Similarly, sustainable construction is encouraged through the partial replacement of fine aggregate with CR; hence, nature is preserved through human control from exploiting the natural resources reserve over continuous mining of the natural aggregate. As seen in Figure 2, the addition of CCR to the mix reduced the cost of the mixes but not as much as fly ash did; this is because CCR is a common waste and needs no further processing aside from drying, partial grinding, and sieving to be incorporated in concrete. Aside from the lower cost, CCR is beneficial in several other ways; it enhances early strength development of the concrete mix and dissipates the strength reduction associated with the addition of CR. This is in conformity with the research outcome of van der Spek et al. [30].

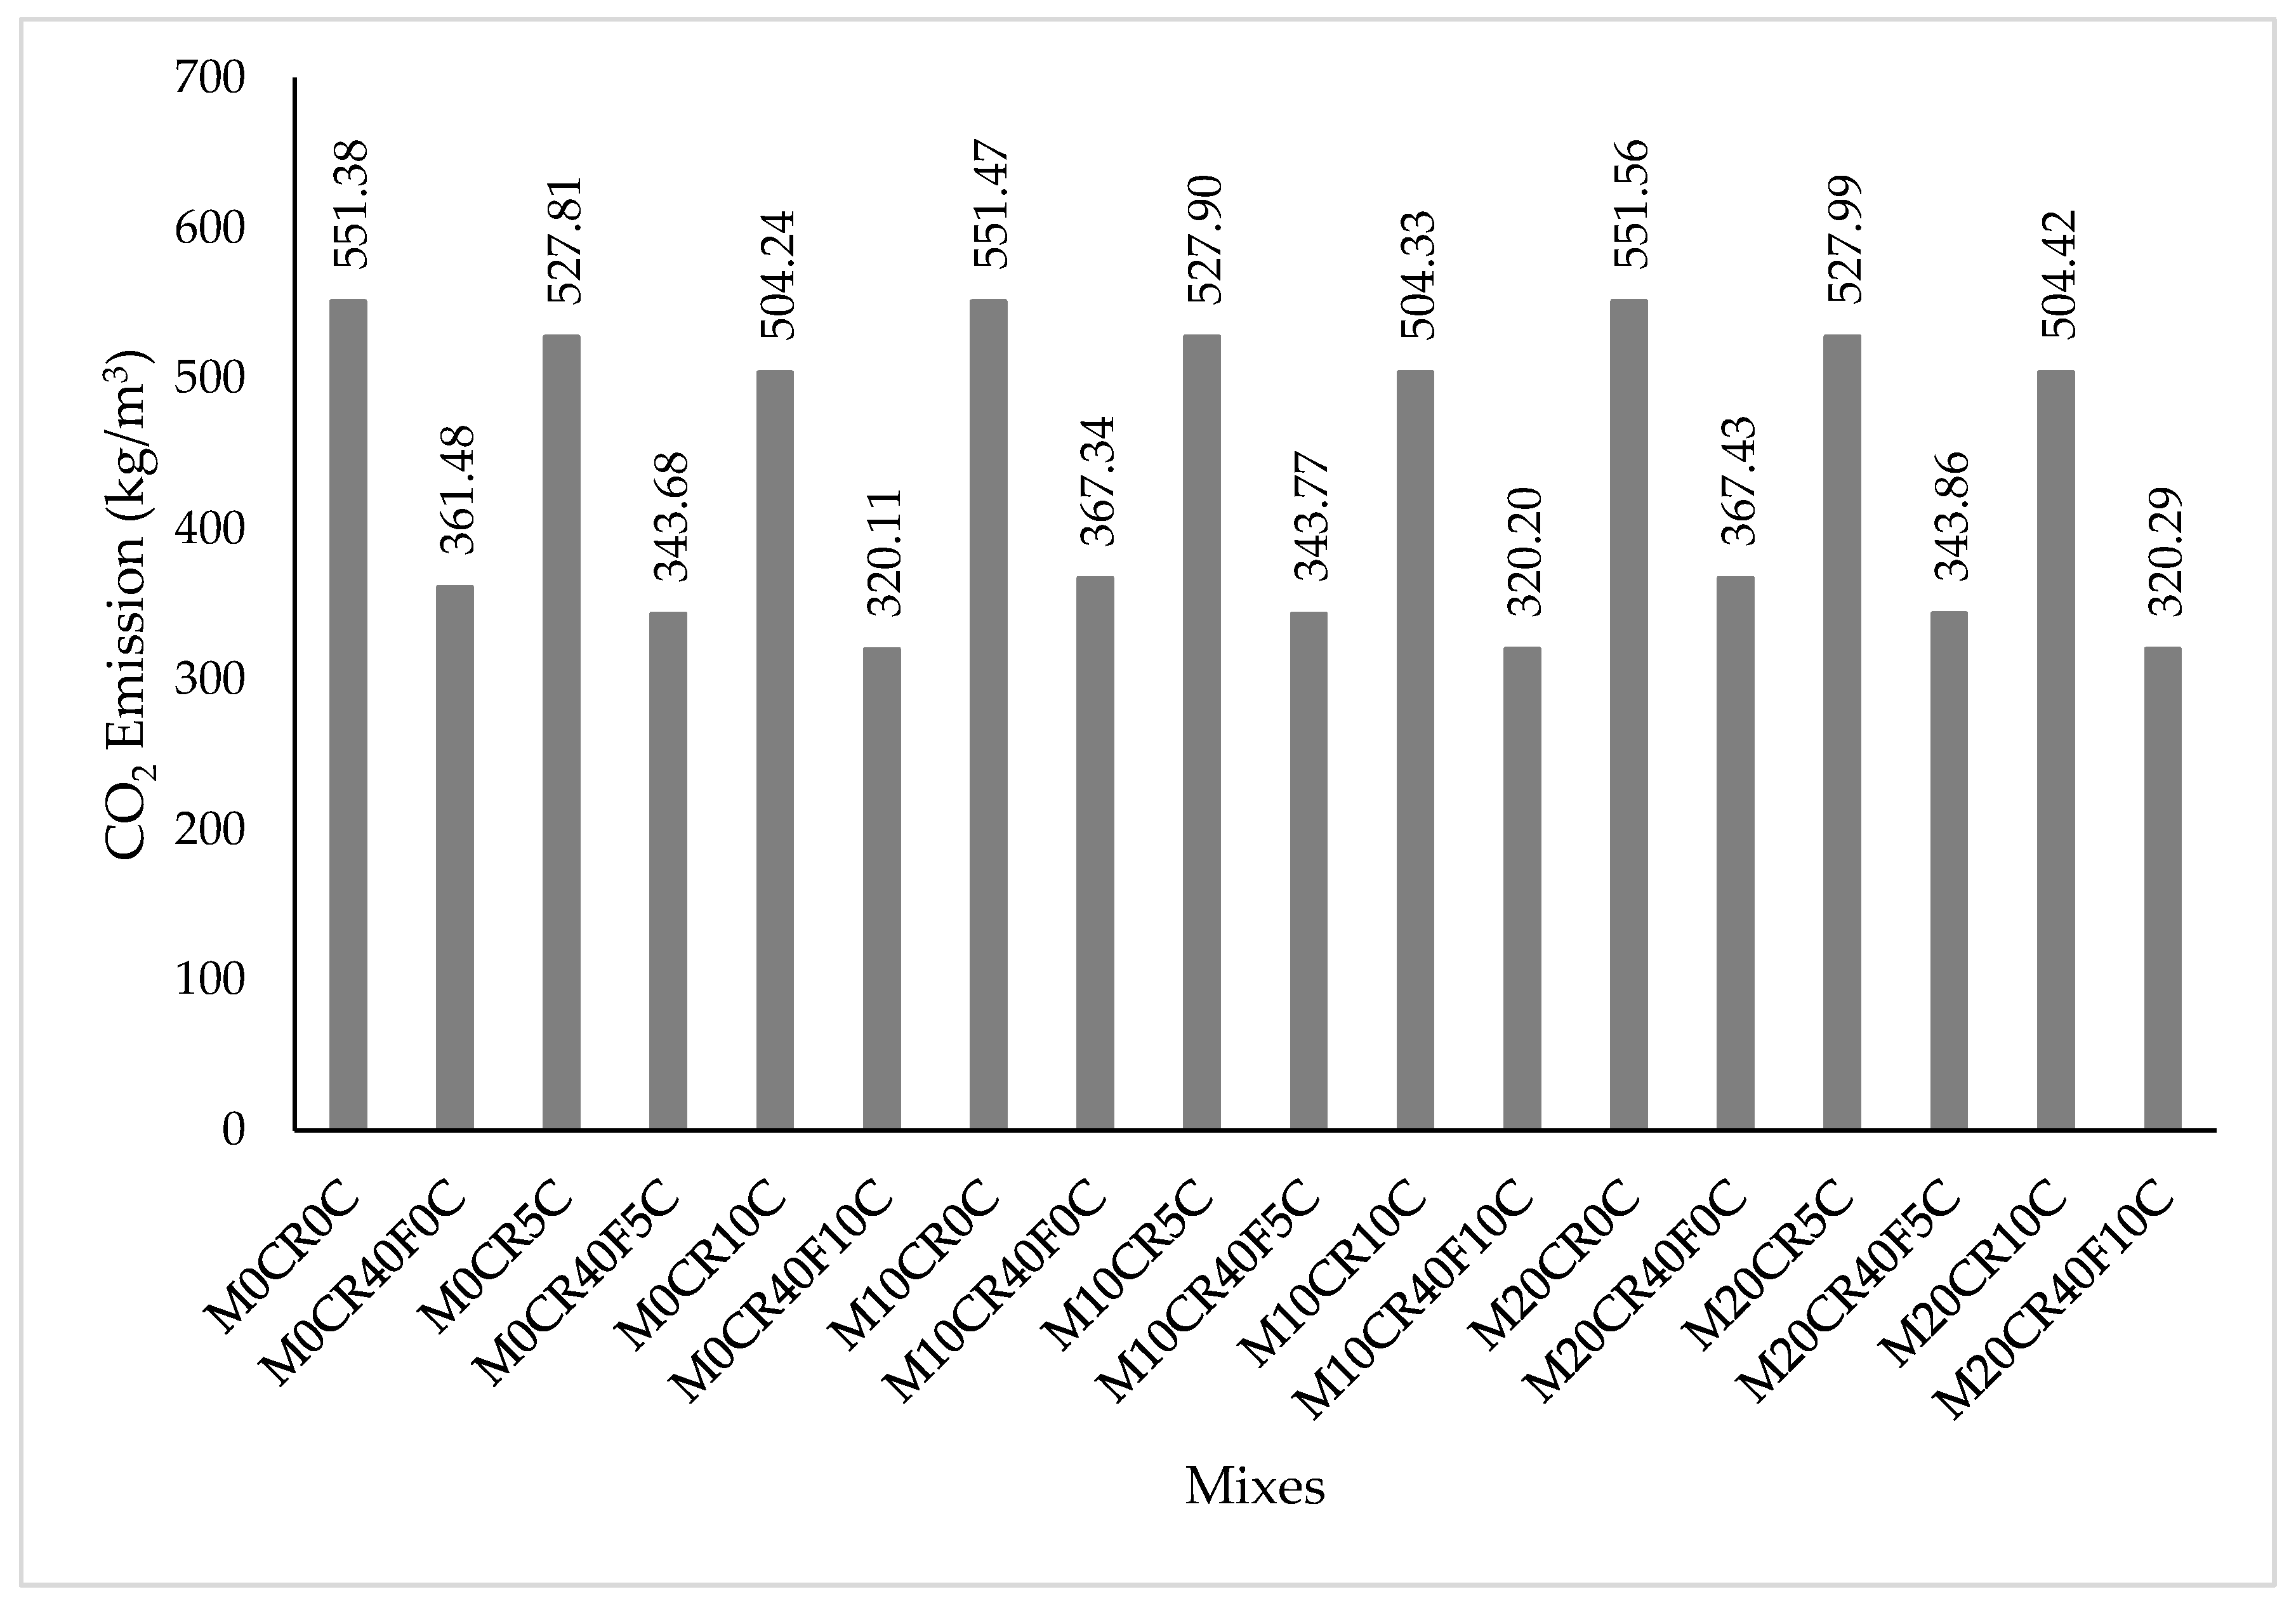
3.2. Equivalent CO2 Gas Emission of SCC Mixes

The summary of the CO2 emission from cradle to gate in all the SCC blend mixes is shown in Figure 3. All the mixes have lower CO2 emissions when compared to the control mix; this is because of the high CO2 emitted in concrete production, unlike fly ash, which requires zero CO2 emission except for the minimal CO2 generated during grinding and transportation of the fly ash [8]. Partial replacement of fine aggregate with CR also increased the CO2 emission of the mix; this is because of the higher CO2 emission in CR compared to natural aggregate, as could be seen in Table 4. As for CR, the high CO2 emission emanates from the grinding of the waste tire to smaller sizes and transportation; thus, CR alone contains no CO2. More so, the addition of CCR decreases the CO2 emission but not as much as fly ash because of the greenhouse gas generated during acetylene gas production that generates calcium carbide residue as a byproduct. This is in line with the research outcome of Fennell et al. [31]. Therefore, more sustainable and green SCC mixes can be obtained by reducing and replacing the amount of cement with supplementary cementitious materials such as fly ash and CCR. These materials, when used in high percentages to replace cement, result in a decrease in strength development, yet they decrease the CO2 emission of the SCC and also reduce the cost of producing the mix.

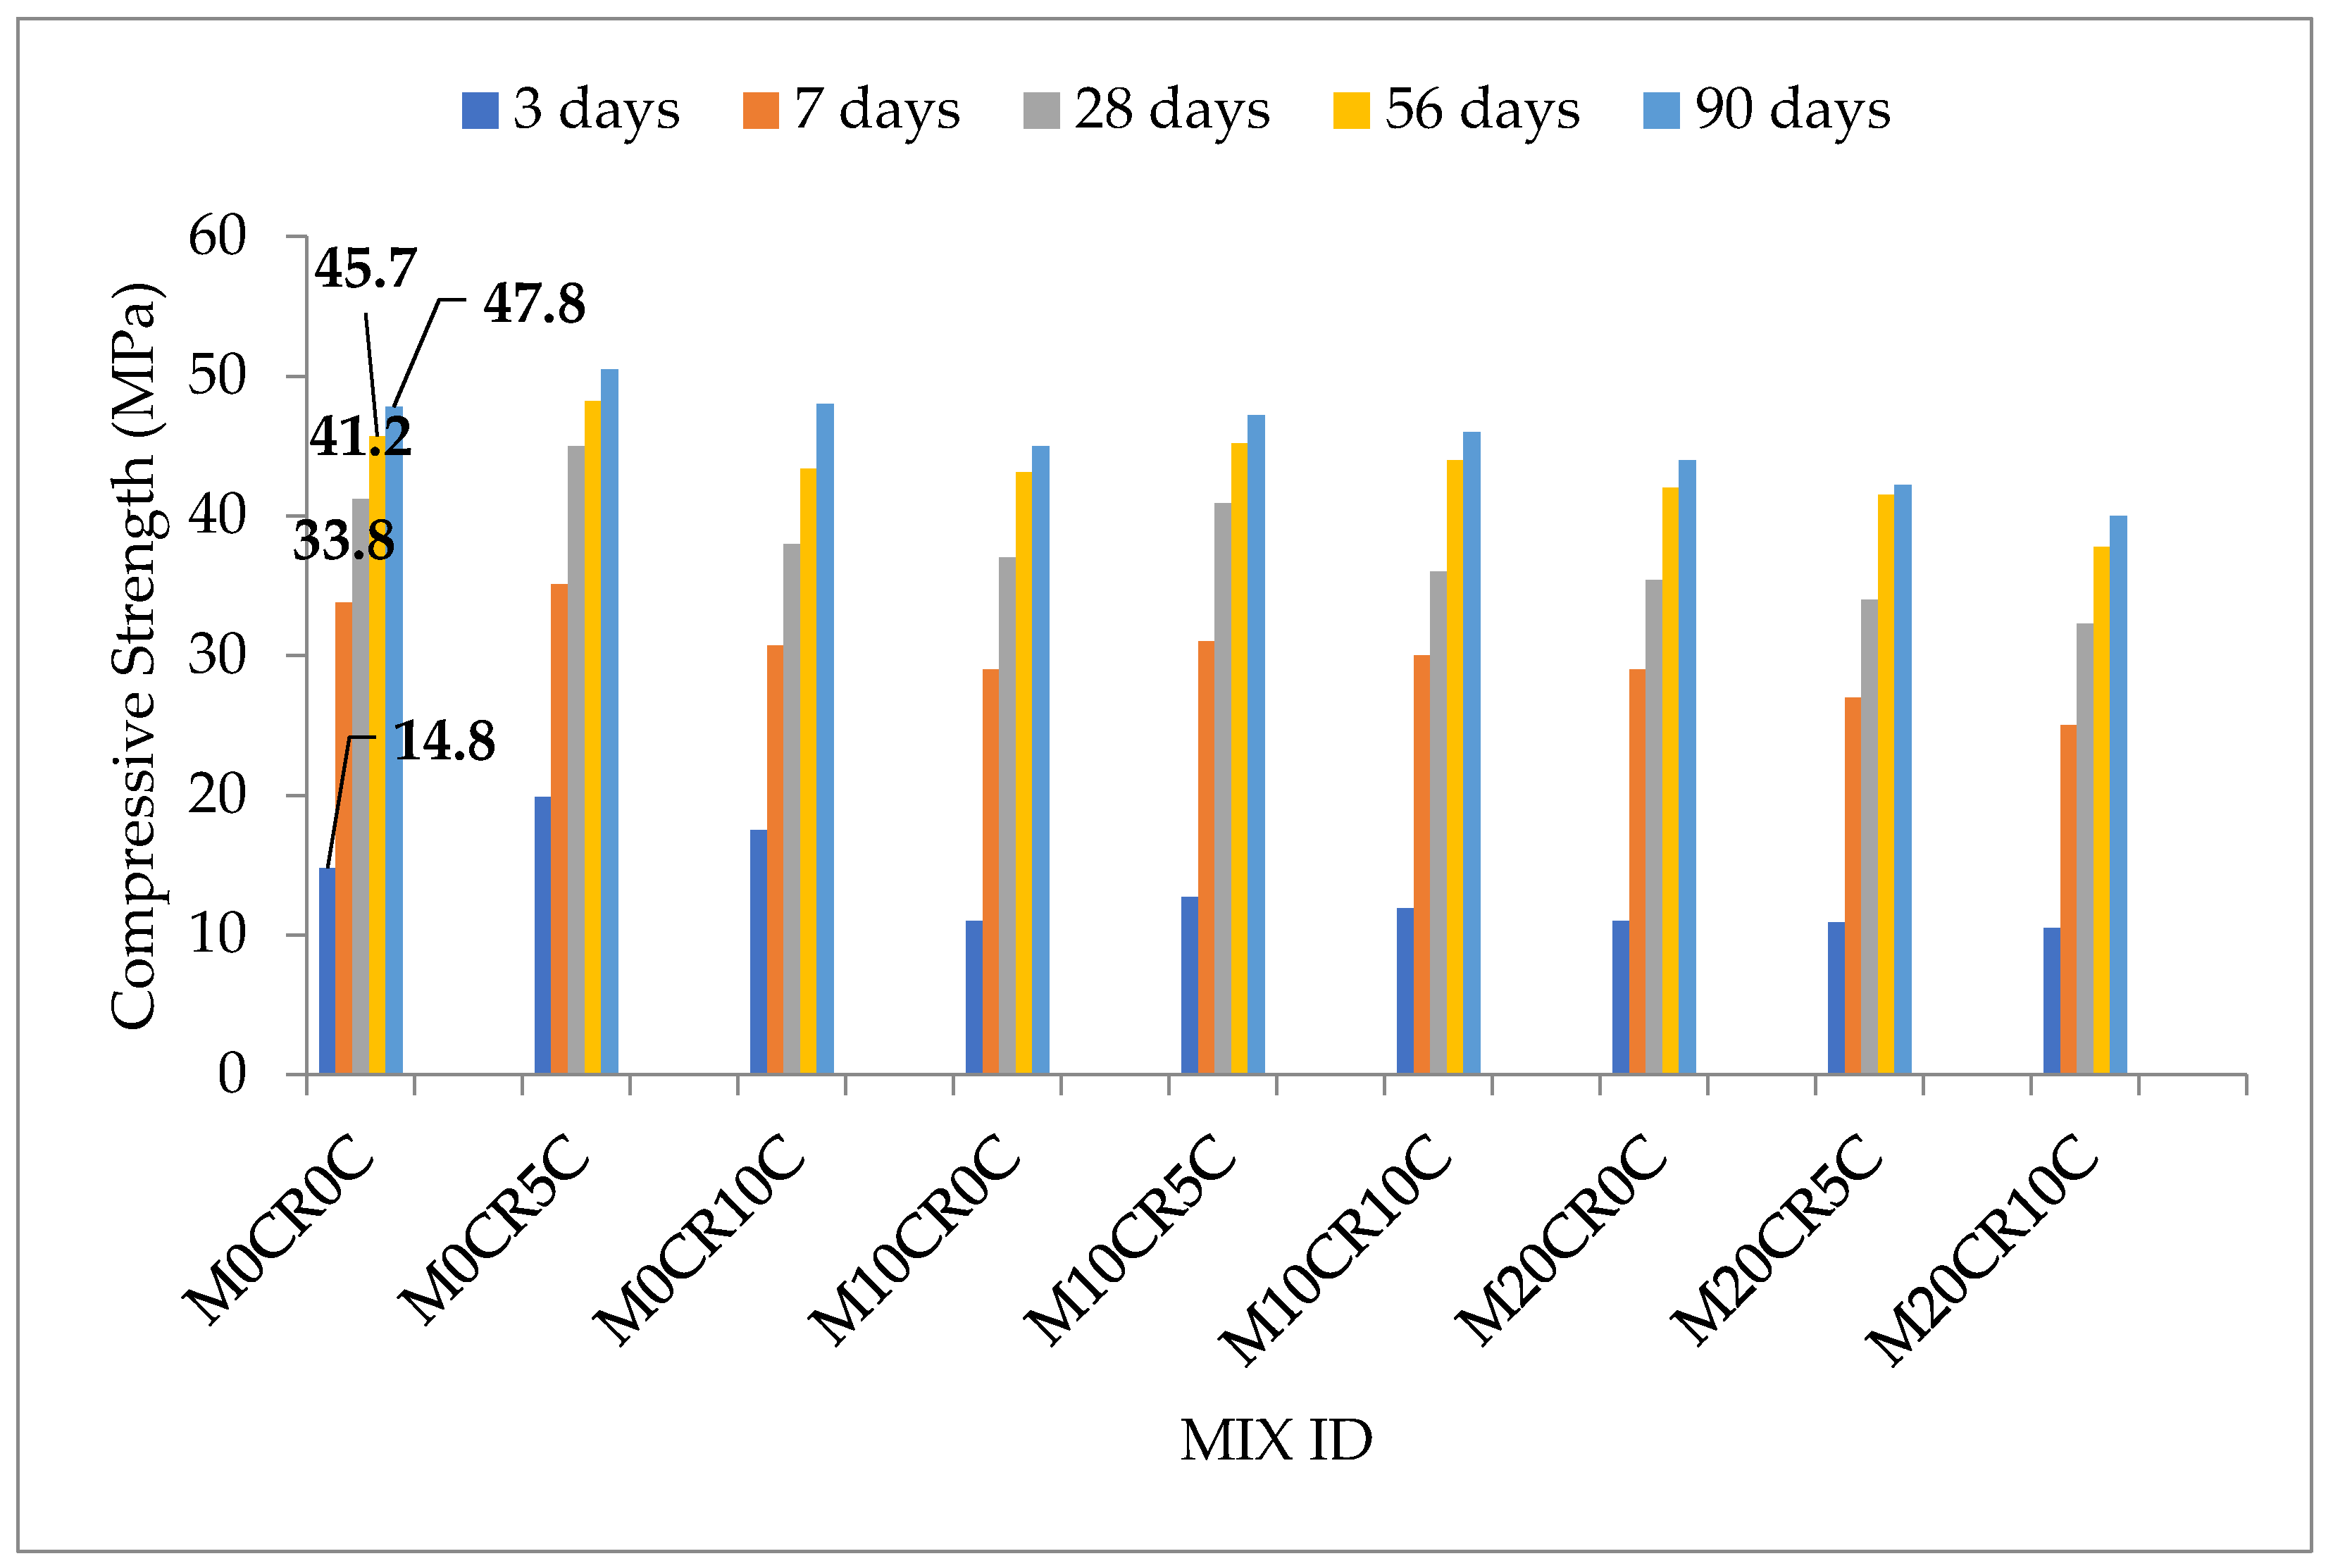
3.3. Compressive Strength of SCC Mixes

The compressive strength results for selected SCC blends without and with fly ash are presented in Figure 4 and Figure 5, respectively. The compressive strength of the mixes generally increased with curing age and decreased with the addition of the optimum 40% fly ash content to the mix. The increase in strength with the age of curing is due to the hydration of cement and the pozzolanic reaction of fly ash. It is also a result of modification of the bonding properties of the binders’ hydrates [32]. The 28-day compressive strength of the SCC mix without fly ash ranged from 38 to 45 N/mm2 but decreased to the range of 36 to 40 N/mm2 on replacement of 10% fine aggregate with CR and further decreased to the range of 32.3 to 35.4 N/mm2 on 20% fine aggregate replacement with CR. The maximum 45 N/mm2 value was obtained on replacement of 5% of the cementitious materials with CCR, which was an 8.4% increase in the strength of the control mix. The same trend was maintained by the mixes containing fly ash. The decrease in strength with CR incorporation can be attributed to the poor bonding between the rubber particles and cement paste, resulting in premature failure with load application and consequently a reduction in strength. Additionally, CR, due to its hydrophobic nature, entraps air during mixing; after the concrete has dried up, this entrapped air created pores in the hardened cement matrix. The pores generate weak paths for which premature failure occurs with load application [16,33,34]. Another reason is due to the increased thickness of the interfacial transition zone between the hardened concrete paste matrix and CR particles, resulting in a low bond between them and forms micro-cracks which consequently cause premature failure. This is in line with the finding of Mohammed and Adamu [33]. Therefore, moderate proportions of CCR and fly enhance the compressive strength of SCC. The pozzolanic reaction between Ca(OH)2 from cement hydration products and CCR with the SiO2 from fly ash reacts to produce more C-S-H gels, a vital compound that enhances strength development in concrete [35]. Moreover, the incorporation of a higher proportion of CCR and fly ash results in increased water demand or superplasticizer for consistency because its larger surface area and the mix has low water content, which causes agglomeration of the particles and poor consistency of the SCC mix and consequently leads to reduced compressive strength [36].
From Figure 4, it can be observed that mixes containing CCR such as M0CR5C and M0CR10C demonstrated higher early strength development at 3 days compared to mixes without CCR such as M0CR0C. This can be attributed to the higher CaO (cementitious element) content of CCR, which is a major compound also found in cement, reacting during the early hydration process to produce the compound for strength development in the concrete. As CCR is a highly reactive pozzolanica material, the pozzolanic reaction occurs at earlier ages, thereby enhancing the early strength development

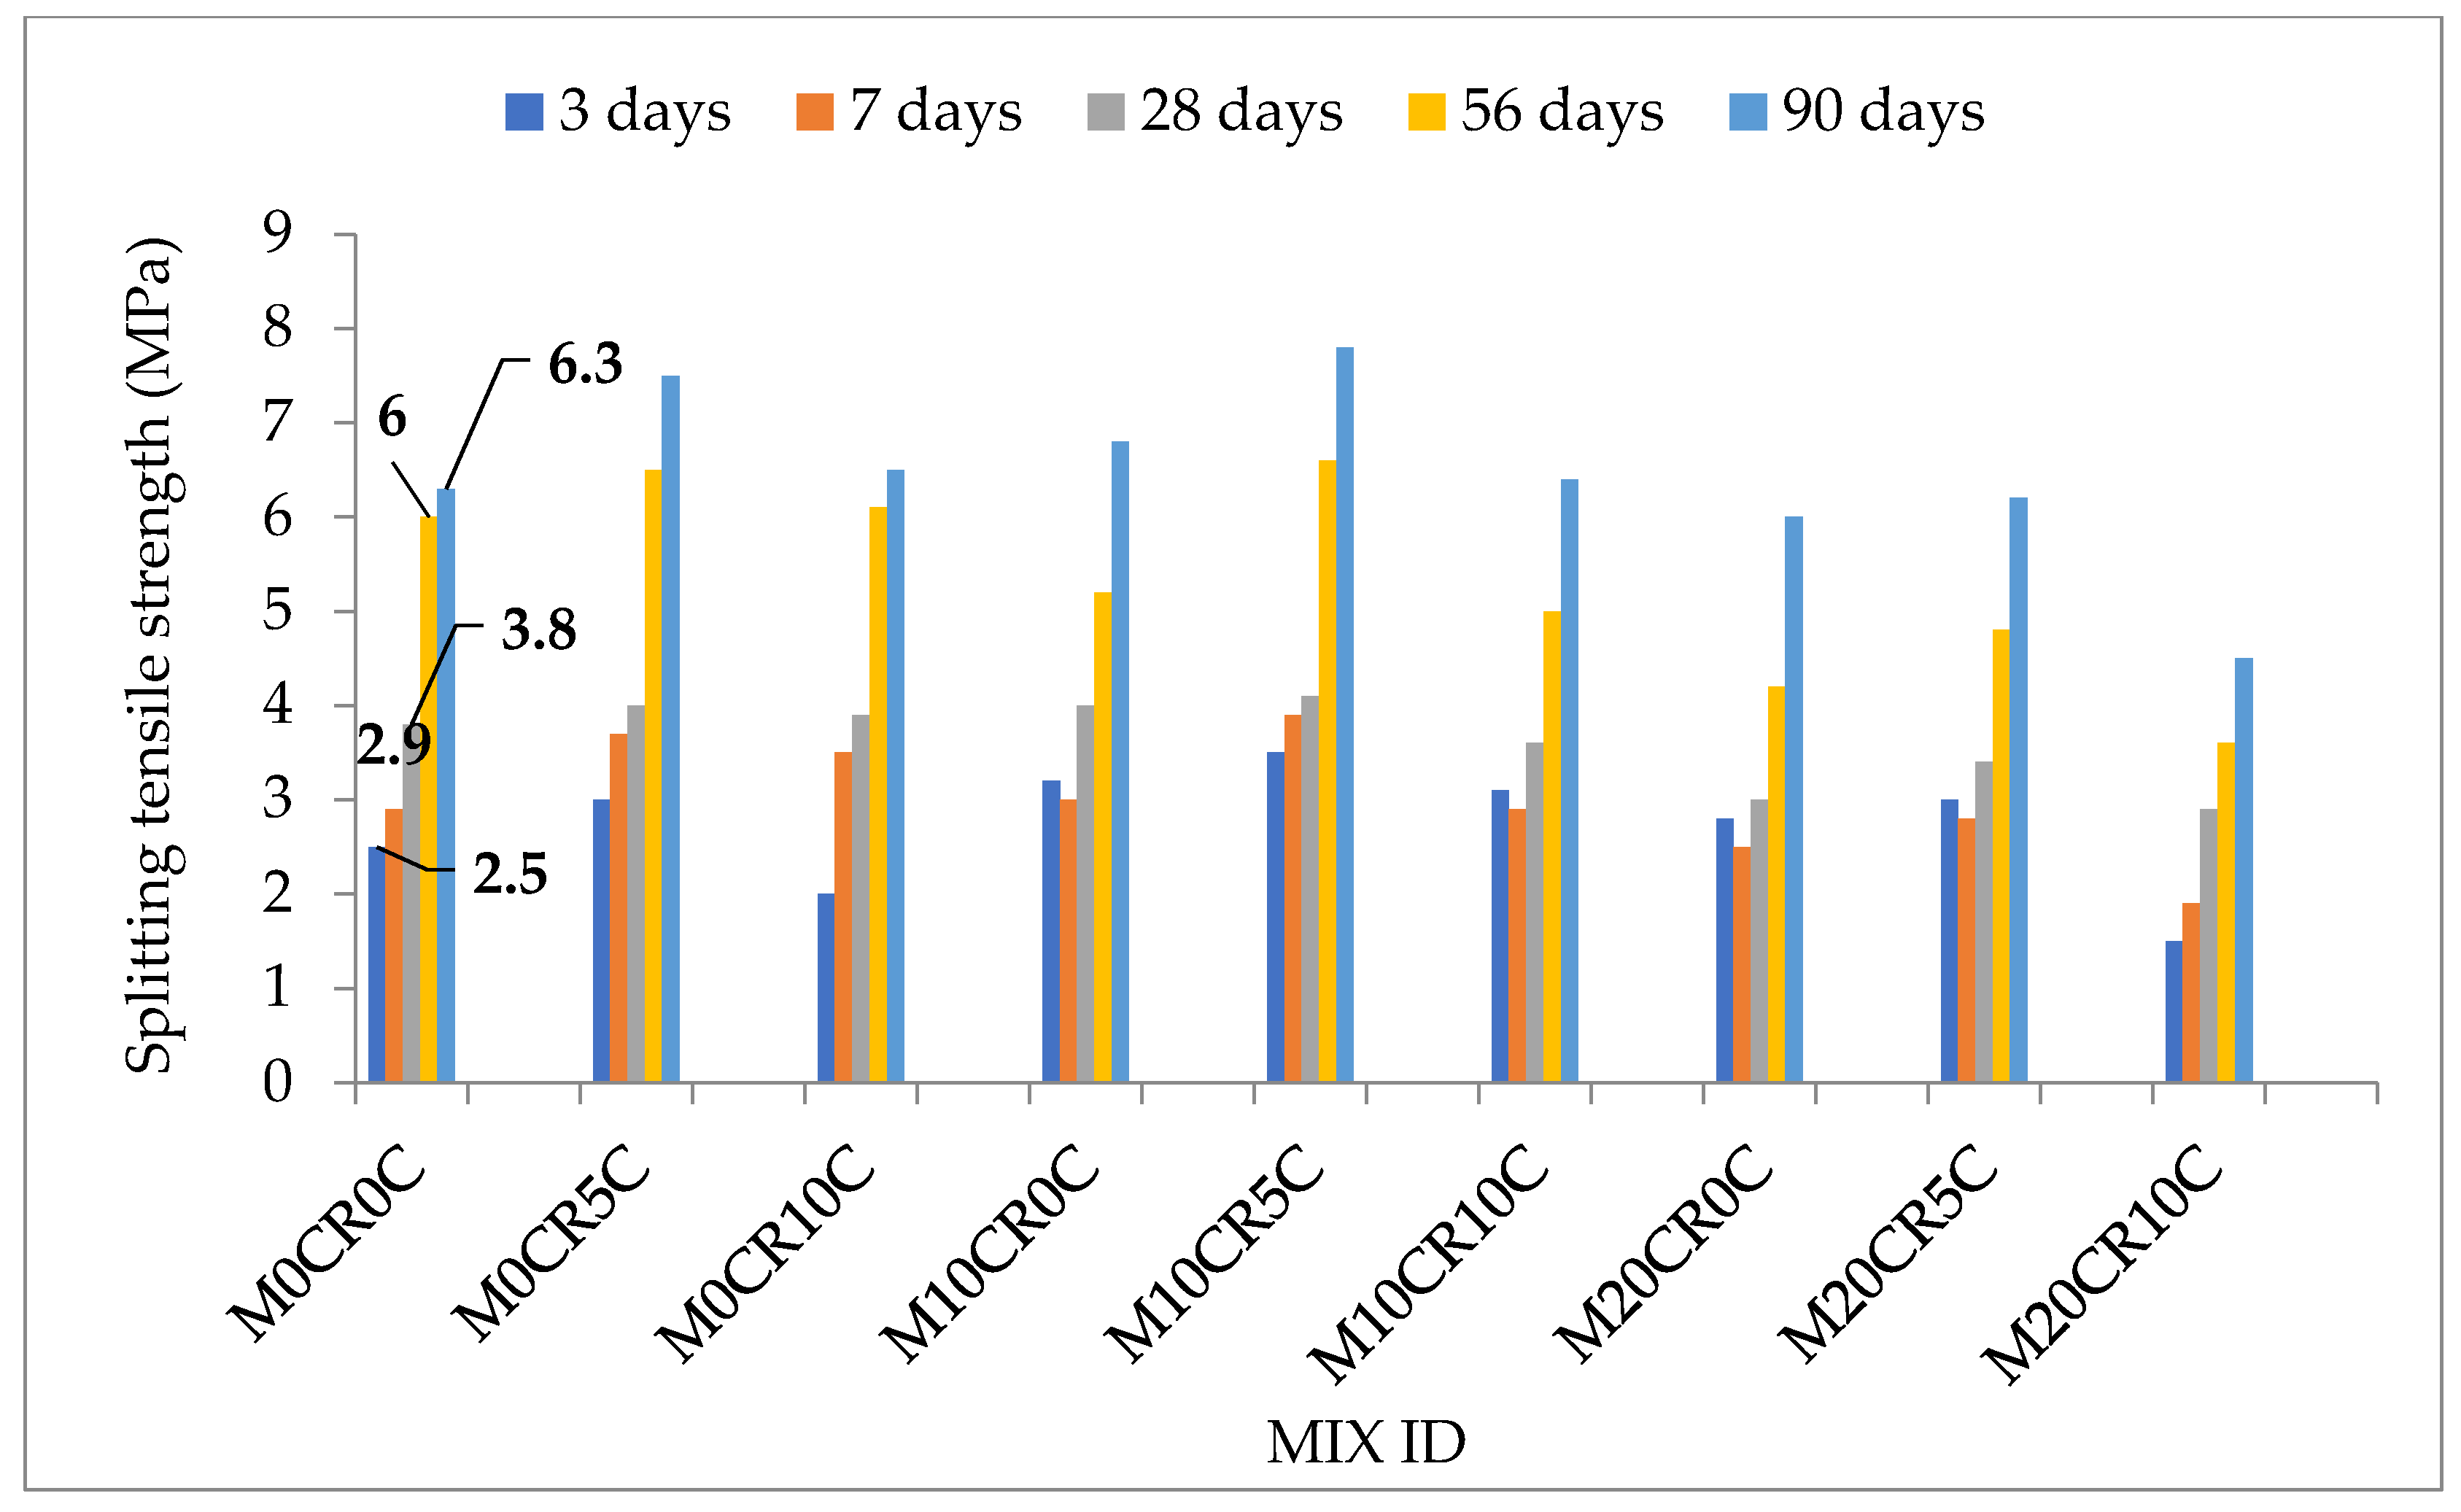
3.4. Splitting Tensile Strength of SCC Mixes

The results of the splitting tensile strength of various SCC mixes without and with optimum 40% fly ash is presented in Figure 6 and Figure 7. The splitting tensile strength of all the mixes increased with curing age and decreased on adding the optimum 40% fly ash content to the mix. The 28 days splitting tensile strength of the SCC mix without FA ranged from 2.9 to 4.1 N/mm2 but decreased to the range of 2.1 to 3.6 N/mm2 on replacement of 40% of cement with fly ash. Generally, increment in splitting tensile strength was observed on incorporating CR and CCR into the mix but decreased beyond 10% CR and 5% CCR, though not below that of the control mix. Hence, mix M10CR5C and M10CR40F5C had the maximum splitting tensile strength value for without and with fly ash mixes, respectively. The increase in the splitting tensile strength of concrete resulted from the increased micro fiber nature of CR, which bridges the cracks in the concrete, thereby reducing the chance of total failure [33]. However, the decrease in the splitting tensile strength when the proportion of CR is further increased is based on the weak bonding between harden concrete paste matrix and rubber particles, which results in small cracks and consequently sudden strength loss [37]. The presence of CCR enhanced the splitting tensile strength. For example, the splitting tensile strength of mix M10CR0C containing 10% CR and 0% CCR was increased by 2.4% on incorporation of 5% CCR on mix M10CR5C. This increment is caused by a large surface area and the irregular morphology of CCR particles which enhanced the bond between the hardened cement paste and aggregates [38]. This is similar to the finding of Bayuaji et al. [39].

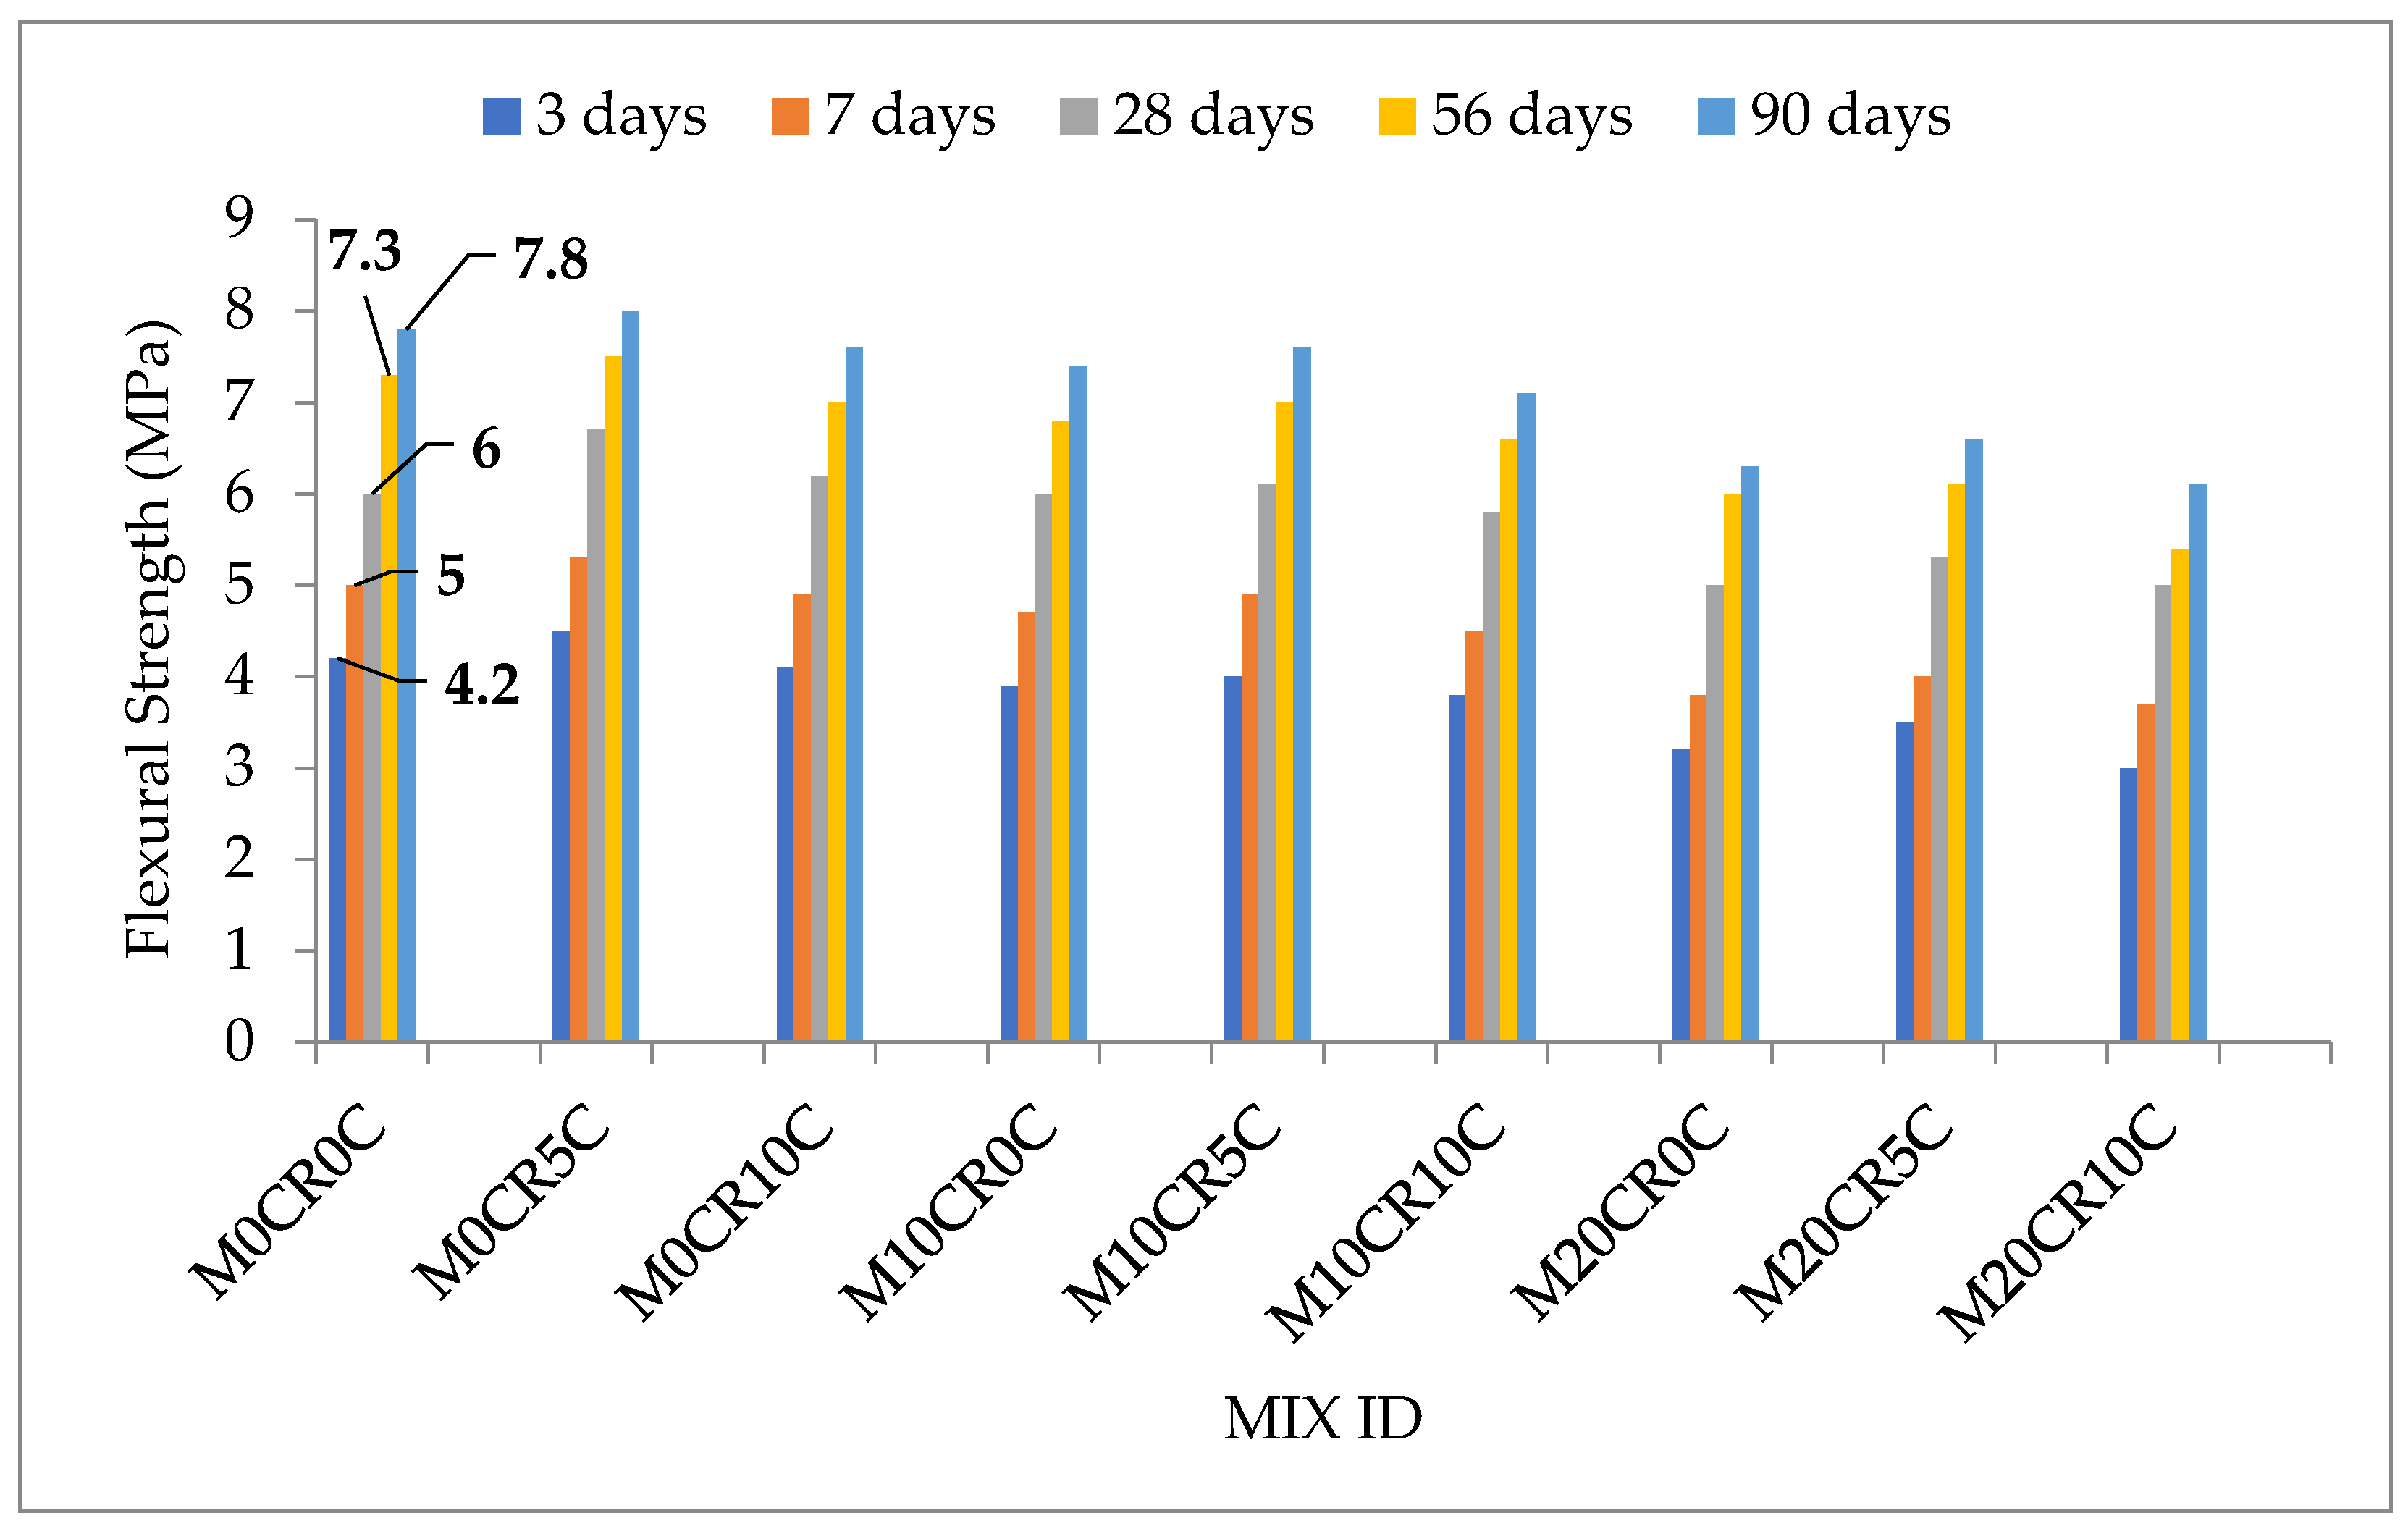
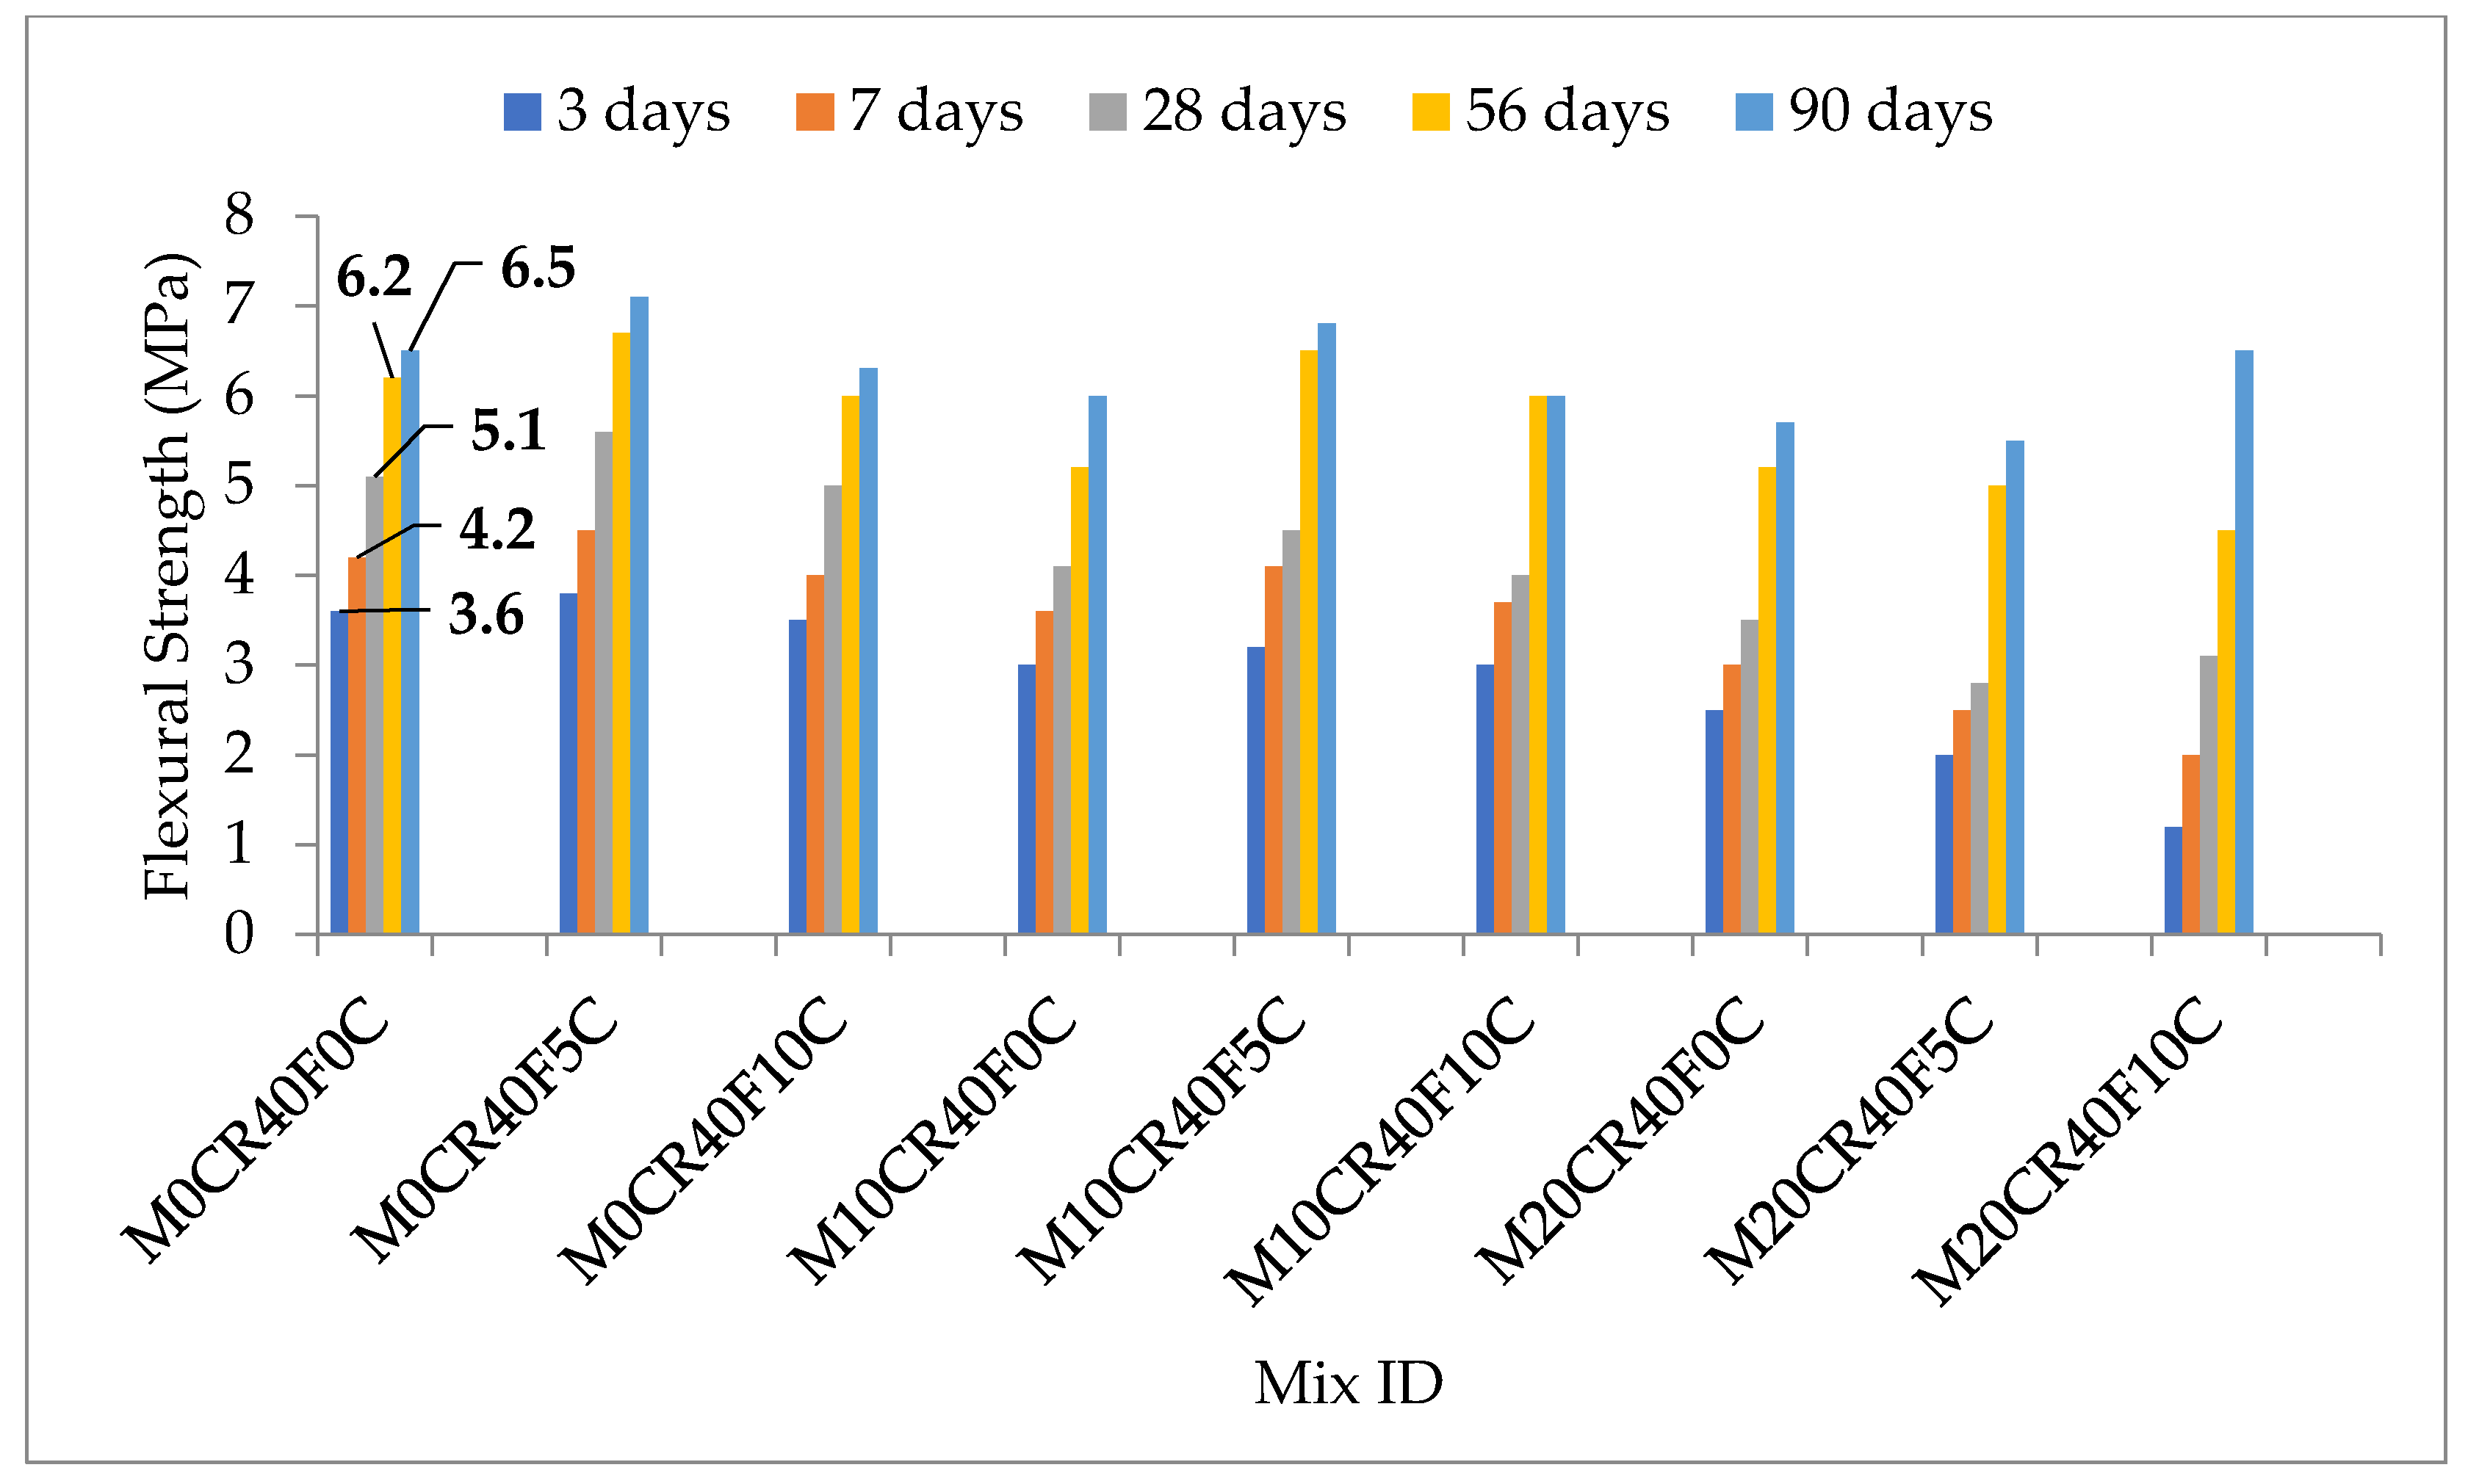
3.5. Flexural Strength of SCC Mixes

The results of flexural strength of various SCC blends without and with optimum 40% fly ash are presented in Figure 8 and Figure 9, respectively. The highest 28-day flexural strength of 6.7 MPa without fly ash was achieved with mix M0CR5C in proportions of 0% and 5% of CR and CCR, respectively. Mix M20CR0C has the lowest flexural strength of 4.9 MPa with a mixed proportion of CR and CCR at 20% and 0%, respectively. The increase in flexural strength associated with the incorporation of CCR was due to the increased pozzolanic reaction resulting from the strengthening of the interfacial zone between CR-cement paste and aggregate. The average flexural strength of SCC ranges from 3 to 6 MPa; as such, the flexural strength of all the mixes falls within this range with the maximum exceeding it. This implies that partial replacement of cementitious materials with CCR in the right proportion will result in an SCC of quality flexural strength. The results of the mix containing fly ash in Figure 9 followed the same trend. Overall, this is in line with the result obtained from the research conducted by Ganesan et al. [40]. The increse in flexural strength due to CR addition can be attributed to the higher flexibility, bending ability and fibrous nature of the CR in comparison to fine aggregate it partially replaced. This resulted to an improvement in post-cracking bending resistance, giving the SCC some capability of resisting some bending loading, even after failure [33].

4. Conclusions

In this study, SCC mixes were produced, where two series of mixes were prepared. In this series, 100% OPC was used, and CR was used as a partial replacement by volume of fine aggregates, and CCR was used as a partial replacement by volume of cementitious materials. In the second series, 40% cement was replaced with fly ash, CR was used as a partial replacement to fine aggregate, and CCR was used as a partial replacement to cementitious materials. Based on the experimental work and results analysis, the following conclusions were drawn:
  • Fly ash utilization in SCC as SCM significantly reduced the cost of production of the concrete, wherein up to 14% reduction in cost was achieved with replacing 40% cement using fly ash. However, CR increased the initial cost of the green self-compacting concrete ternary blend by 2% when compared to the control mix, and these continued to reduce at greater percentage replacements.
  • Fly ash and CCR were effective in reducing the greenhouse CO2 emission of SCC during production, wherein up to a 35% reduction was achieved with the replacement of 40% cement using fly ash and 4% reduction with replacing 5% cement with CCR. On the contrary, replacement of fine aggregate with CR has a significantly less negative effect on the CO2 emission of the SCC, wherein 10% CR as a replacement to fine aggregate increased the CO2 emission by less than 1%.
  • The use of fly ash as SCM and CR as a partial replacement to fine aggregate contributed negatively to its compressive strength, flexural strength, and splitting tensile strength of the SCC.
  • The addition of CCR to the SCC mixes improved its mechanical strengths and partially mitigated the negative effects of fly ash and CR on the concrete’s strengths. The addition of CCR increased precipitation of the hydration products from cement and fly ash and contributed to the early-age strength development.
  • Therefore, fly ash and CCR are recommended for the production of green, sustainable, environmentally friendly, and cost-effective SCC with lower CO2 emissions and less cost, which will be particularly beneficial now that the world is facing the challenges of global warming.

Author Contributions

Conceptualization, S.E.K., A.M. and M.A.; methodology, S.E.K., A.M. and I.I.O.; software, S.E.K. and M.A.; validation, A.M., H.A. and S.E.K.; formal analysis, S.E.K., M.A. and I.I.O.; investigation, S.E.K., A.M. and M.A.; resources, Y.E.I. and H.A.; data curation, S.E.K., A.M. and M.A.; writing—original draft preparation, S.E.K. and M.A.; writing—review and editing, M.A., Y.E.I. and H.A.; visualization, S.E.K. and M.A.; supervision, Y.E.I.; funding acquisition, Y.E.I. All authors have read and agreed to the published version of the manuscript.

Funding

This research is supported by the Structures and Materials (S&M) Research Laboratory. Furthermore, the authors acknowledge the support of Prince Sultan University for paying the article processing charges (APC) for this publication.

Institutional Review Board Statement

Not applicable.

Informed Consent Statement

Not applicable.

Data Availability Statement

Not applicable.

Acknowledgments

The authors wish to acknowledge the Structures and Materials (S&M) Laboratory, Prince Sultan University, Riyadh, Saudi Arabia for their viable support.

Conflicts of Interest

The authors declare no conflict of interest.

References

  1. Mäkikouri, S.; Vares, S.; Korpijärvi, K.; Papakonstantinou, N. The Carbon Dioxide Emissions Reduction Potential of Carbon-Dioxide-Cured Alternative Binder Concrete. Recent Prog. Mater. 2021, 3, 1–34. [Google Scholar] [CrossRef]
  2. Fayomi, G.; Mini, S.; Fayomi, O.; Ayoola, A. Perspectives on environmental CO2 emission and energy factor in Cement Industry. In Proceedings of the International Conference on Energy and Sustainable Environment, Ota, Nigeria, 18–20 June 2019; IOP Conference Series: Earth and Environmental Science. IOP Publishing: Bristol, UK, 2019; Volume 331, p. 012035. [Google Scholar]
  3. Miller, S.A.; Horvath, A.; Monteiro, P.J. Impacts of booming concrete production on water resources worldwide. Nat. Sustain. 2018, 1, 69–76. [Google Scholar] [CrossRef]
  4. Benhelal, E.; Shamsaei, E.; Rashid, M.I. Challenges against CO2 abatement strategies in cement industry: A review. J. Environ. Sci. 2021, 104, 84–101. [Google Scholar] [CrossRef] [PubMed]
  5. Ferrari, M.-C.; Amelio, A.; Nardelli, G.M.; Costi, R. Assessment on the Application of Facilitated Transport Membranes in Cement Plants for CO2 Capture. Energies 2021, 14, 4772. [Google Scholar] [CrossRef]
  6. PCA. Cement & Concrete Basics FAQs. In US Cement Industry Annual Yearbook; Portland Cement Association: Washington, DC, USA, 2017. [Google Scholar]
  7. Obrist, M.D.; Kannan, R.; Schmidt, T.J.; Kober, T. Decarbonization pathways of the Swiss cement industry towards net zero emissions. J. Clean. Prod. 2021, 288, 125413. [Google Scholar] [CrossRef]
  8. Kim, T.; Tae, S.; Roh, S. Assessment of the CO2 emission and cost reduction performance of a low-carbon-emission concrete mix design using an optimal mix design system. Renew. Sustain. Energy Rev. 2013, 25, 729–741. [Google Scholar] [CrossRef] [Green Version]
  9. Gartner, E. Industrially interesting approaches to “low-CO2” cements. Cem. Concr. Res. 2004, 34, 1489–1498. [Google Scholar] [CrossRef]
  10. Tae, S.; Baek, C.; Shin, S. Life cycle CO2 evaluation on reinforced concrete structures with high-strength concrete. Environ. Impact Assess. Rev. 2011, 31, 253–260. [Google Scholar] [CrossRef]
  11. Miller, S.A.; Horvath, A.; Monteiro, P.J.; Ostertag, C.P. Greenhouse gas emissions from concrete can be reduced by using mix proportions, geometric aspects, and age as design factors. Environ. Res. Lett. 2015, 10, 114017. [Google Scholar] [CrossRef] [Green Version]
  12. Wang, X.-Y. Effect of carbon pricing on optimal mix design of sustainable high-strength concrete. Sustainability 2019, 11, 5827. [Google Scholar] [CrossRef] [Green Version]
  13. Paik, I.; Na, S.; Yoon, S. Assessment of CO2 emissions by replacing an ordinary reinforced concrete slab with the void slab system in a high-rise commercial residential complex building in South Korea. Sustainability 2019, 11, 82. [Google Scholar] [CrossRef] [Green Version]
  14. Kim, T.H.; Chae, C.U.; Kim, G.H.; Jang, H.J. Analysis of CO2 emission characteristics of concrete used at construction sites. Sustainability 2016, 8, 348. [Google Scholar] [CrossRef] [Green Version]
  15. Yang, K.-H.; Song, J.-K.; Song, K.-I. Assessment of CO2 reduction of alkali-activated concrete. J. Clean. Prod. 2013, 39, 265–272. [Google Scholar] [CrossRef]
  16. Adamu, M.; Mohammed, B.S.; Liew, M.S. Mechanical properties and performance of high volume fly ash roller compacted concrete containing crumb rubber and nano silica. Constr. Build. Mater. 2018, 171, 521–538. [Google Scholar] [CrossRef]
  17. Obianyo, I.I.; Mahamat, A.A.; Stanislas, T.T.; Ihekweme, G.O.; Kelechi, S.E.; Onyelowe, K.C.; Onwualu, A.P.; Soboyejo, A.B. Production and utilization of earth-based bricks for sustainable building applications in Nigeria: Status, benefits, challenges and way forward. J. Build. Pathol. Rehabil. 2021, 6, 1–11. [Google Scholar] [CrossRef]
  18. Santos, S.; Da Silva, P.; De Brito, J. Self-compacting concrete with recycled aggregates–a literature review. J. Build. Eng. 2019, 22, 349–371. [Google Scholar] [CrossRef]
  19. BS EN 196-6; Cement Density Test. British Standard Institution: London, UK, 2005.
  20. BS 882; Specification for Aggregates from Natural Sources for Concrete. British Standards Institution: London, UK, 1992.
  21. Efnarc, F. Specification and guidelines for self-compacting concrete. Eur. Fed. Spec. Constr. Chem. Concr. Syst. 2002. Available online: https://wwwp.feb.unesp.br/pbastos/c.especiais/Efnarc.pdf (accessed on 1 December 2021).
  22. British Standard. Methods for mixing and sampling concrete in the laboratory. In Testing Concrete; British Standard Institution: London, UK, 2013. [Google Scholar]
  23. BS EN 12390-5; Testing Hardened Concrete: Flexural Strength of Test Specimens. British Standards Institution: London, UK, 2009.
  24. BS EN 12390-6; Testing Hardened Concrete: Tensile Splitting Strength of Test Specimens. British Standard Institution: London, UK, 2009.
  25. Liu, X.; Zhu, B.; Zhou, W.; Hu, S.; Chen, D.; Griffy-Brown, C. CO2 emissions in calcium carbide industry: An analysis of China’s mitigation potential. Int. J. Greenh. Gas Control 2011, 5, 1240–1249. [Google Scholar] [CrossRef]
  26. Magnusson, S.; Mácsik, J. Analysis of energy use and emissions of greenhouse gases, metals and organic substances from construction materials used for artificial turf. Resour. Conserv. Recycl. 2017, 122, 362–372. [Google Scholar] [CrossRef]
  27. Turner, L.K.; Collins, F.G. Carbon dioxide equivalent (CO2-e) emissions: A comparison between geopolymer and OPC cement concrete. Constr. Build. Mater. 2013, 43, 125–130. [Google Scholar] [CrossRef]
  28. Quattrone, M.; Angulo, S.C.; John, V.M. Energy and CO2 from high performance recycled aggregate production. Resour. Conserv. Recycl. 2014, 90, 21–33. [Google Scholar] [CrossRef]
  29. Huda, S.; Ahmad, A.; Ahmad, S.A.; Khan, Z.R. Analysis of Cost (M30 grade) of concrete by partial replacement of fly ash with cement and addition of steel fibre. Int. J. Eng. Res. Manag. Stud. 2017, 4, 49–59. [Google Scholar]
  30. Van der Spek, M.; Roussanaly, S.; Rubin, E.S. Best practices and recent advances in CCS cost engineering and economic analysis. Int. J. Greenh. Gas Control. 2019, 83, 91–104. [Google Scholar] [CrossRef]
  31. Fennell, P.S.; Davis, S.J.; Mohammed, A. Decarbonizing cement production. Joule 2021, 5, 1305–1311. [Google Scholar] [CrossRef]
  32. Rao, G.M.; Rao, T.G. Final setting time and compressive strength of fly ash and GGBS-based geopolymer paste and mortar. Arab. J. Sci. Eng. 2015, 40, 3067–3074. [Google Scholar]
  33. Mohammed, B.S.; Adamu, M. Mechanical performance of roller compacted concrete pavement containing crumb rubber and nano silica. Constr. Build. Mater. 2018, 159, 234–251. [Google Scholar] [CrossRef]
  34. Mohammed, B.S.; Adamu, M.; Liew, M.S. Evaluating the effect of crumb rubber and nano silica on the properties of high volume fly ash roller compacted concrete pavement using non-destructive techniques. Case Stud. Constr. Mater. 2018, 8, 380–391. [Google Scholar] [CrossRef]
  35. Mohammed, B.S.; Yen, L.Y.; Haruna, S.; Huat, S.; Lim, M.; Abdulkadir, I.; Al-Fakih, A.; Liew, M.; Zawawi, A.; Wan, N.A. Effect of Elevated Temperature on the Compressive Strength and Durability Properties of Crumb Rubber Engineered Cementitious Composite. Materials 2020, 13, 3516. [Google Scholar] [CrossRef]
  36. Adamu, M.; Olalekan, S.S.; Aliyu, M.M. Optimizing the Mechanical Properties of Pervious Concrete Containing Calcium Carbide and Rice Husk Ash Using Response Surface Methodology. J. Soft Comput. Civ. Eng. 2020, 4, 95–118. [Google Scholar]
  37. Khalil, E.; Abd-Elmohsen, M.; Anwar, A.M. Impact resistance of rubberized self-compacting concrete. Water Sci. 2015, 29, 45–53. [Google Scholar] [CrossRef] [Green Version]
  38. Haruna, S.; Adamu, M. Effect of Hybridization of Calcium Carbide Waste and Rice Husk Ash on the Properties of Self-Compacting Concrete. J. Ceram. Concr. Sci. 2020, 5, 1–10. [Google Scholar]
  39. Bayuaji, R.; Putri, N.; Ming, L.Y.; Mortar, N.A.M. Study Of The Utilization Of Carbide Waste And Fly Ash On Geopolymer Paste. In Proceedings of the 1st International Conference Functional and Engineering Materials—FEM 2019, Lodz, Poland, 16–18 October 2019; IOP Conference Series: Materials Science and Engineering. IOP Publishing: Bristol, UK, 2020; Volume 743, p. 012042. [Google Scholar]
  40. Ganesan, N.; Raj, J.B.; Shashikala, A. Flexural fatigue behavior of self compacting rubberized concrete. Constr. Build. Mater. 2013, 44, 7–14. [Google Scholar] [CrossRef]
Figure 1. Particle size distribution of aggregates and CR.
Sustainability 14 00137 g001
Figure 2. Cost of SCC mixes.
Sustainability 14 00137 g002
Figure 3. Equivalent CO2 emission of SCC mixes.
Sustainability 14 00137 g003
Figure 4. Compressive strength of SCC blends without fly ash.
Sustainability 14 00137 g004
Figure 5. Compressive strength of fly-ash-modified SCC blends.
Sustainability 14 00137 g005
Figure 6. Splitting tensile strength of SCC blends without fly ash.
Sustainability 14 00137 g006
Figure 7. Splitting tensile strength of fly-ash-modified SCC blends.
Sustainability 14 00137 g007
Figure 8. Flexural strength of SCC blends without fly ash.
Sustainability 14 00137 g008
Figure 9. Flexural strength of fly-ash-modified SCC blends.
Sustainability 14 00137 g009
Table 1. Properties of binder materials.
Oxide CompositionCementFly AshCCR
SiO212.0052.061.1
Al2O33.0130.480.04
Fe2O34.114.470.5
CaO74.035.6296.46
MgO1.31.320
SO32.072.10.29
Na2O0.190.990.01
K2O1.281.540.45
LOI1.020.951.02
Specific Gravity3.152.272.22
Table 2. Mix proportions.
Mix IDVariables (%)Quantities in kg/m3
CRCCRFly AshCementCCRFly AshFine AggregateCRCoarse AggregateWaterSP
M0CR0C000520008800850192.4117
M0CR40F0C0040312008800850192.4117
M0CR5C05049418.3208800.00850192.4117
M0CR40F5C054028618.32149.898800.00850192.4117
M0CR10C010046836.6508800.00850192.4117
M0CR40F10C0104026036.65149.898800.00850192.4117
M10CR0C10005200.00079238.25850192.4117
M10CR40F0C100403120.00149.8979238.25850192.4117
M10CR5C105049418.32079238.25850192.4117
M10CR40F5C1054028618.32149.8979238.25850192.4117
M10CR10C1010046836.65079238.25850192.4117
M10CR40F10C10104026036.65149.8979238.25850192.4117
M20CR0C20005200.00070476.49850192.4117
M20CR40F0C200403120.00149.8970476.49850192.4117
M20CR5C205049418.32070476.49850192.4117
M20CR40F5C2054028618.32149.8970476.49850192.4117
M20CR10C2010046836.65070476.49850192.4117
M20CR40F10C20104026036.65149.8970476.49850192.4117
Table 3. Unit cost constituent materials ($/kg/m3).
MaterialCementFly AshCCRCoarse AggregateFine AggregateCRWaterSP
Cost ($/kg)0.160.090.0010.110.090.2650.0021.1
Table 4. Equivalent CO2 emission for each material ($/kg/m3).
Item/MaterialA: Material and ProductionTransportationTotalReference
DCT = D·C(A + T)
CO2-kg/kgDistance (km)CO2-kg/kg·mCO2-kg/kgCO2-kg/kg
Cement0.94000.00001580.004740.905[2,15]
CCR0.00085100.00001580.0001580.00101[15,25]
Fly ash0.0253500.00001580.005530.03053[15,16]
CR0.05350.0000630.0022050.05221[15,26]
Fine aggregate0.014500.0000630.003150.01715[15,27]
Coarse aggregate0.05500.0000630.003150.05315[15,28]
Water0.000196---0.000196[15]
Concrete Production0.0080--0.008[15]
Publisher’s Note: MDPI stays neutral with regard to jurisdictional claims in published maps and institutional affiliations.

