Article

Differential Effect of Hydroxen Peroxide οn Toxic Cyanobacteria of Hypertrophic Mediterranean Waterbodies

by
Theodoti Papadimitriou
1,*,
Matina Katsiapi
2,
Natassa Stefanidou
2,
Aikaterini Paxinou
3,
Vasiliki Poulimenakou
3,
Chrysi S. Laspidou
3,
Maria Moustaka-Gouni
2 and
Konstantinos A. Kormas
1
1
Department of Ichthyology and Aquatic Environment, School of Agricultural Sciences, University of Thessaly, 38446 Volos, Greece
2
Department of Botany, School of Biology, Aristotle University of Thessaloniki, 54124 Thessaloniki, Greece
3
Department of Civil Engineering, University of Thessaly, Pedion Areos, 38334 Volos, Greece
*
Author to whom correspondence should be addressed.
Sustainability 2022, 14(1), 123; https://doi.org/10.3390/su14010123
Submission received: 30 November 2021 / Revised: 19 December 2021 / Accepted: 20 December 2021 / Published: 23 December 2021
(This article belongs to the Section Environmental Sustainability and Applications)

Abstract

:
Cyanobacterial blooms have been known since ancient times; however, they are currently increasing globally. Human and ecological health risks posed by harmful cyanobacterial blooms have been recorded around the world. These risks are mainly associated with their ability to affect the ecosystem chain by different mechanisms like the production of cyanotoxins, especially microcystins. Their expansion and their harmful effects have led many researchers to seek techniques and strategies to control them. Among them, hydrogen peroxide could be a promising tool against cyanobacteria and cyanotoxins and it is well-established as an environmentally friendly oxidizing agent because of its rapid decomposition into oxygen and water. The aim of the present study was to evaluate the effect of hydrogen peroxide on phytoplankton from two hypertrophic waterbodies in Greece. The effect of hydrogen peroxide on concentration of microcystins found in the waterbodies was also studied. Treatment with 4 mg/L hydrogen peroxide was applied to water samples originated from the waterbodies and Cyanobacterial composition and biomass, phycocyanin, chlorophyll-a, and intra-cellular and total microcystin concentrations were studied. Cyanobacterial biomass and phycocyanin was reduced significantly after the application of 4 mg/L hydrogen peroxide in water treatment experiments while chlorophytes and extra-cellular microcystin concentrations were increased. Raphidiopsis (Cylindrospermopsis) raciborskii was the most affected cyanobacterial species after treatment of the water of the Karla Reservoir in comparison to Aphanizomenon favaloroi, Planktolyngbya limnetica, and Chroococcus sp. Furthermore, Microcystis aeruginosa was more resistant to the treatment of Pamvotis lake water in comparison with Microcystis wesenbergii and Microcystis panniformis. Our study showed that hydrogen peroxide differentially impacts the members of the phytoplankton community, affecting, thus, its overall efficacy. Different effects of hydrogen peroxide treatment were observed among cyanobacerial genera as well as among cyanobacterial species of the same genus. Different effects could be the result of the different resistance mechanisms of each genus or species to hydrogen peroxide. Hydrogen peroxide could be used as a treatment for the mitigation of cyanobacterial blooms in a waterbody; however, the biotic and abiotic characteristics of the waterbody should be considered.

1. Introduction

Cyanobacterial blooms were first described in 1878 [1] and from then until today, mass cyanobacterial blooms have been reported in eutrophic lakes and reservoirs worldwide [2,3,4]. Major consequences of the global expansion of cyanobacterial blooms are associated with threats to the safety and sustainability of water supplies for human consumption, agriculture (irrigation), inland fisheries, as well as the recreational and ecological value of impacted waters [5]. Moreover, cyanobacteria possess a range of unique and highly adaptable eco-physiological traits which enable them to dominate over other phytoplankton groups: the ability to grow in warmer temperatures, buoyancy, high affinity for and ability to store phosphorus, nitrogen-fixation, akinete production and associated life history characteristics, and light capture at low intensities and a range of wavelengths [6,7].
Another trait of cyanobacteria is the production of toxins. Scientific research has shown that 75% of the water containing cyanobacteria also contains toxic cyanobacterial metabolites [8]. The microcystins (MCYSTs), as the most cosmopolitan cyanotoxins, are accused of degrading water quality and also public health [9,10]. More than 90 variants of MCYSTs have been detected [11]. It is known that MCYSTs are hepatotoxins that act in the intense inhibition of intracellular serine/threonine phosphatases 1 and 2A (PP1 and PP2A) [12]. Because of this inhibition, an imbalance of cell phosphorylation occurs, culminating in a cell signaling disorder [13]. In addition, MCYSTs can cause oxidative stress due to the intracellular excess of reactive oxygen species (ROS) [14,15].
Cyanobacteria can influence the structure and dynamics of an aquatic ecosystem especially if the intensity and duration of cyanobacteria blooms increase along with the proceeding eutrophication [5]. The effect of cyanobacteria on grazers has generally been negative because of the toxins they produce, but also because cyanobacteria are difficult to manage because of their colonial form and because they have a low nutritional value [5]. Fish seem to be more sensitive to cyanobacteria than invertebrates [5]. Hepatotoxic MCYSTs can damage the gill structures of fish, exposing them to other dissolved toxins in the water [16]. Moreover, the oxidative stress caused by microcystins can also affect fish at the cellular level [17]. The negative effects on fish can also be caused by the low nutritional quality of cyanobacteria [5]. Community-level changes in fish populations may be possible as well. Decreased feeding, condition, and growth of fish larvae probably affect their survival rates, potentially leading to variations in year-class strength [18].
Numerous studies have shown that climate change probably favors the further expansion of cyanobacterial blooms [3,19,20], leading many researchers to find techniques and strategies to control them. The root cause of cyanobacterial blooms is usually nitrogen and phosphorous loading, so watershed management to reduce nutrient pollution of a waterbody is an effective strategy to prevent and mitigate cyanobacterial blooms [21]. However, such a solution is often difficult, expensive, and time consuming [22]. Biologically-driven control may be able to target cyanobacteria, although it poses a risk of release of toxins from cells after treatment and its toxicity towards other non-target species and organisms is unknown [23].
The hydrogen peroxide (H2O2) treatment has been proposed as an effective option of controlling cyanobacterial bloom formation [24,25]. Since H2O2 rapidly decomposes to H2O and O2 via biological, chemical, and photochemical mechanisms during oxidation, it does not leave harmful residues in the environment. H2O2 inhibits photosynthetic electron transfer in Photosystem II by inhibiting the ascorbate peroxidase system of hydrogen peroxide detoxication [26]. Because cyanobacteria are prokaryotic, H2O2 has an even more pronounced effect on cyanobacterial cells than eukaryotic phytoplankton groups, whose photosynthetic apparatus are contained within discrete organelles [27]. The application of H2O2 on cyanobacteria results in the lysis of their cells. When cyanobacterial cells are lysed, the possible intra-cellular cyanotoxins will be released. The fate of released MCYSTs after H2O2 treatment of natural cyanobacterial populations has only been studied in a few investigations and the results are conflicting [25,28,29,30]. It has been suggested that, under natural conditions, the amount of MCYSTs released after cell lysis induced by H2O2 may be reduced by environmental factors, such as microbiological degradation, UV radiation, photosensitized transformation in the presence of humic substances and pigments, or adsorption to particles [31]. However, more studies on degradation of MCYSTs in waterbodies are required since degradation of MCYSTs is essential for the proper functioning of waterbodies and for the protection of public health.
The potential of H2O2 to control cyanobacteria has been studied by several researchers. Drabkova et al. [27] showed that cyanobacteria were negatively affected by H2O2 at concentrations 10 times less than that of green algae and diatoms. Matthijs et al. [32] showed that H2O2 can be used to selectively suppress cyanobacteria in natural waters without affecting other organisms. Yang et al. [33] concluded that H2O2 treatment promotes chlorophytes over toxic cyanobacteria in a hyper-eutrophic aquaculture pond. They also showed that H2O2 treatment was less effective in the degradation of Microcystis compared with Anabaena, Cylindrospermopsis, and Planktothrix under culture conditions. Most studies used laboratory strains to evaluate the performance of H2O2 [34,35,36]. These cultured strains might pose present different adaptations to the new environment when compared to the cyanobacteria living in natural environments, and thus their observed response to H2O2 may be not realistic under natural conditions [6]. Studies related to the effect of H2O2 on different cyanobacterial genera or species of natural communities are rather scare [37,38]. Since cyanobacterial algal blooms can be dominated by one or more cyanobacterial taxa, it would be useful to know if the effects of H2O2 are genus and/or species dependent in natural communities. The aim of the present study was to evaluate the possible differential effect of H2O2 on phytoplankton communities, in abstracted water from a hypertrophic lake and a hypertrophic reservoir, suffering from prolonged cyanobacterial blooms. Furthermore, the effects of H2O2 on MCYSTs concentrations in the abstracted waters were also evaluated.

2. Materials and Methods
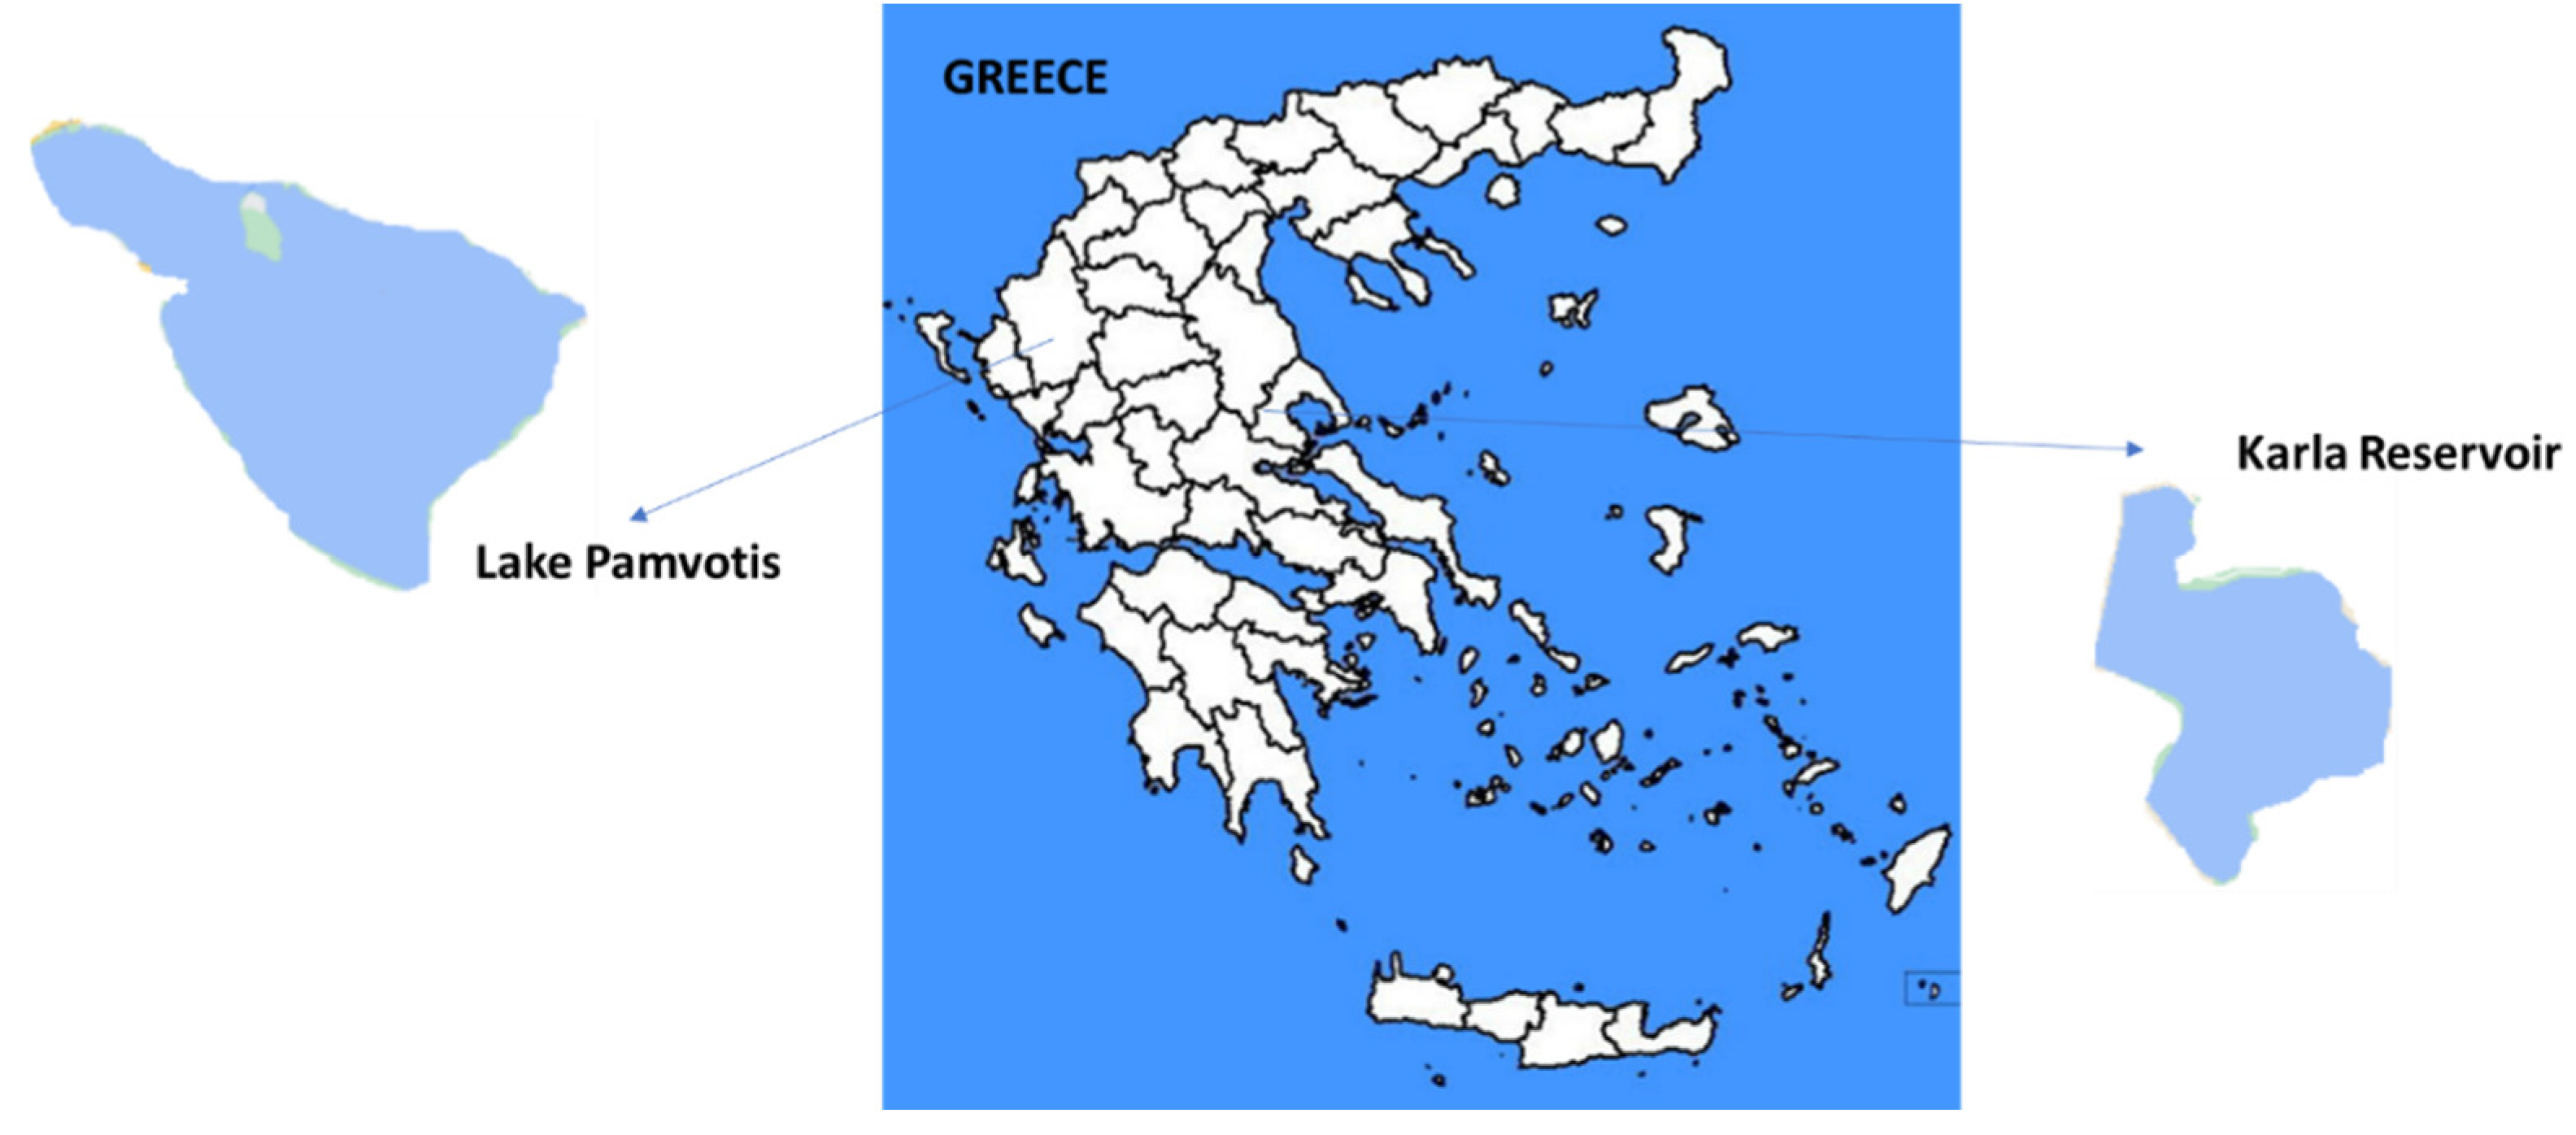
2.1. Study Areas

To study the effects of H2O2 on phytoplankton focusing on cyanobacteria and microcystins, water samples were collected from two different waterbodies: Karla Reservoir (39°29′27″ N 22°49′19″ E) and Lake Pamvotis (39°40′0″ N and 20°52′60″ E) (Figure 1).
Karla Reservoir used to be a natural lake with important biodiversity; however, the lake was intentionally dried in 1960s. The reconstruction of Karla Reservoir in 2010 was a public request for the local area to be upgraded environmentally, socially, and economically. The reconstructed reservoir has a surface of 38 km2, while its maximum depth has not exceeded 2 m. Karla Reservoir has already been adversely affected by both agricultural and industrial pollution from the surrounding area resulting to eutrophic-hypertrophic conditions. During the time from re-establishment until now, extensive cyanobacterial and algal blooms were recorded, dominated by toxin-producing species [39,40]. During the same period, episodes of fish and bird mortality were also recorded [40,41]. Water from the Karla Reservoir is used for irrigation needs for the surrounding cultivations and is planned to be used for supply needs for the city of Volos. Recent studies showed that the cyanotoxins from the Karla Reservoir are transferred via irrigation to edible vegetables [42,43].
Pamvotis is an urban, shallow eutrophic-hypertrophic lake (mean depth, 4.3 m, maximum depth of 7.5 m) and occupies an area of 22.8 km2 [44]. During the last three decades, Pamvotis Lake was exposed to many activities such as irrigation, discharge of domestic sewages, and sediment deposit, affecting its trophic status [44,45]. Cyanobacterial blooms have been recorded almost throughout the year, whereas high concentrations of microcystins have been recorded in water (0.29–15.83 μg/L) and tissues of animals (45.35–1200 ng/g) living in the lake [46]. Water from Lake Pamvotis is used for recreation, fisheries, and irrigation.

2.2. Design of the Experiment

The experimental design consisted of the following steps:
Step 1: Sampling and water sample analysis. Water samples were collected from Karla Reservoir and Lake Pamvotis (200 L from each waterbody) on 17 September 2017. Water was collected in polyethylene containers, which were placed 10–20 cm below the water surface. The containers were slowly immersed in the water so that the surface of the water was disturbed as little as possible. Water samples were transferred to the laboratory within 3 h after sampling. At each sampling site, water temperature, pH, dissolved oxygen (the in situ oxygen saturation was measured in the morning), and conductivity were measured in situ by electrode probes (YSI, Yellow Springs, OH, USA). Concentrations of nitrate, nitrite, ammonium, and soluble reactive phosphorus (SRP) in the water of the Karla Reservoir and Lake Pamvotis were analyzed according to standard methods [47]. Before the H2O2 treatment (time zero), sub-samples were collected from the containers and initial phytoplankton composition, chlorophyll–a, phycocyanin, and extra-cellular and intracellular MCYSTs were analyzed.
Step 2: Treatment of the samples with H2O2. Sixty L of water collected from Karla Reservoir and 60 L of water collected from Lake Pamvotis were placed into transparent jars. The experiment consisted of two conditions, with three replicate jars each: a control (0 mg/L H2O2) and 4 mg/L H2O2 treatment achieved by the addition of a 30% w/w H2O2 solution. Jars were put in an incubation cabinet (50 μmol photon/m2/s) and temperature of 24 ± 1 °C. A light/dark cycle of 12 h:12 h was used. An air pump was placed in each jar and jars were mixed daily by hand. The experiment lasted six days. Subsamples were collected from each jar at 5, 72, and 144 h. Subsamples were used for phytoplankton identification and biovolume determination as well as for the analysis of chlorophyll-a, phycocyanin, and intra-cellular and extra-cellular microcystins concentrations. Our previous results showed that a dose of 4 mg/L H2O2 resulted in a significant decrease of phycocyanin concentration in samples of the Karla Reservoir [48] and doses higher than 4 mg/L had a negative impact on the dynamics of zooplankton living in the Karla reservoir (unpublished data). Therefore, we chose the concentration of 4 mg/L H2O2 as the appropriate concentration of H2O2 to be used in the present study.
Step 3. Hydrogen peroxide degradation assay. Ιn order to assess whether there is a difference between H2O2 degradation in a sample that contains phytoplankton and one that does not, we filtered (GF/C filter, nominal filtering size of 1.2 μm) water samples (5 L each) from the Karla Reservoir and Lake Pamvotis and added H2O2 to a concentration of 4 mg/L. The jars containing the filtered water samples were used to assess the chemical degradation of H2O2 over time and were incubated under the same conditions as step 2. Subsamples of 50 mL were collected from each jar (filtered and unfiltered) at the beginning (t = 0) and at 30, 90, 180, and 300 min after the addition of H2O2. Two replicates were included. Subsamples were only analyzed for H2O2 concentration. H2O2 concentrations were measured according to Allen et al. [49], who used the spectrophotometric determination of triiodide complex for the detection of H2O2 concentrations. Degradation rate of H2O2 was calculated according to the following equation:
Rate = −Δ[H2O2]/Δt (mg/L/min)

2.3. Phytoplankton Analysis

Live and preserved samples were examined in sedimentation chambers using an inverted microscope with phase contrast (Nikon SE 2000). Phytoplankton in composite samples of three replicates were counted. Phytoplankton species were identified using taxonomic keys [50]. Phytoplankton counts (cells, colonies, and filaments) were performed using the Utermöhl sedimentation method [51]. For biovolume estimation, the dimensions of 30 individuals (cells, filaments, or colonies) of the dominant species were measured a digital microscope camera (Nikon DS-L1), while mean cell or filament volume estimates were calculated using the appropriate geometric formulae [52].

2.4. Pigment Analysis

To analyze pigments, the water subsamples were processed at low-intensity light.

2.4.1. Chlorophyll-a (Chl a) Analysis

To determine the concentration of Chl a (μg/L), a volume of 200 mL of water subsamples was passed through Whatman GF/C filters (0.45-μm) in vacuum. Chl- a was then extracted from the filter with 95% acetone solution [47]. The solution absorbance was then recorded at 630 nm, 647 nm, 664 nm, and 750 nm [47]. The final concentration of Chl- a was determined according to the equation of Jeffrey and Humphrey [53]:
Chla = Ca * Vex * Vsample−1,
where,
Vex = measured sample volume
Vsample = volume of sample filtered
and
Ca = 11.85 * (OD’664) − 1.54 * (OD’647) − 0.08 * (OD’630)
where
OD’664 = Absorption 664 − Absorption 750
OD’647 = Absorption 647 − Absorption 750
OD’630 = Absorption 630 − Absorption 750

2.4.2. Phycocyanin Analysis

The quantitation of phycocyanin (μg/L) was performed fluorometrically according to the methods of Sarada et al. [54] and Mellios et al. [55]. Water volume (200 mL) was passed through cellulose acetate membrane filters (Whatman glass fiber filters) (0.22 μm, 47 mm) in vacuum. The extraction of phycocyanin from the filters with a solution of phosphates 10 mM (pH = 7) was the next step. The determination was performed on a fluorometer (Perkin Elmer, LS45) with excitation wavelength of the molecule at 630 nm and emission wavelength of the molecule at 660 nm. The construction of the standard curve was carried out using standard solutions of pure phycocyanin isolated from the cyanobacterium Spirulina sp. (Sigma, P2172).

2.5. MCYSTs Analysis

Three forms of MCYST were investigated: extra-cellular, cell-bound (intra-cellular), and Total MCYSTs (the sum of extra-cellular and intra-cellular). For intra-cellular MCYSTs, subsamples were filtered on a Whatmann GF/C filter which was immediately frozen at −20 °C. MCYSTs were extracted from the filter after placement in 100% methanol and stirred overnight at room temperature followed by centrifugation at 1300× g for 15 min. This extraction procedure was repeated three times and the three supernatants were pooled. The organic solvent was removed by placing the extract under nitrogen-stream. The remaining concentrated sample was subjected to enzyme-linked immunosorbent assay (ELISA). Results are expressed as micrograms of cellular MCYST equivalents per liter. For analysis of dissolved MCYST, the filtered water was applied directly to ELISA. A commercial ABRAXIS Microcystin ELISA kit was used (520011, USA) following the instructions of the manufacturer. Results are expressed as micrograms of cellular MCYSTs equivalents per liter [56]. For each ELISA run, the negative control and four calibrates were assayed at least in duplicate.

2.6. Statistical Analysis

Analysis of variance (ANOVA) and Fisher LSD test were carried out using the software package SPSS 20. The statistical requirements for the ANOVA (normal distribution, homogeneity of variance) were performed.

3. Results

3.1. Water Physical—Chemical Parameters

Physical and chemical parameters measured in the lake water are presented in Table 1. Temperature in the Karla Reservoir (23.5 °C) and Lake Pamvotis (22.4 °C) was within expected values for the month of sampling (September). Table 1 shows that pH values were relatively high in both areas (8.85 in Lake Pamvotis and 9.04 in the Karla Reservoir), suggesting high photosynthetic activity. Furthermore, the electrical conductivity was significant higher in the Karla Reservoir (3.21 mS/cm) than in Lake Pamvotis (1.97 mS/cm). High Dissolved Inorganic Nitrogen (DIN) concentrations in both areas are associated with very high concentrations of ammonium found in both areas (Table 1). SRP high values were similar in both water bodies (0.32 mg/L in the Karla Reservoir and 0.25 in Lake Pamvotis. High values of phycocyanin were measured in both areas (Karla Reservoir: 456 μg/L; Lake Pamvotis: 1256 μg/L). The values of the above parameters were in addition to the high concentrations of Chl a (Karla Reservoir: 250 μg/L; Lake Pamvotis: 570 μg/L. Both areas are characterized by significant concentrations of intra-cellular MCYSTs (Karla Reservoir: 5.45 μg/L; Lake Pamvotis: 8.10 μg/L) and extra- cellular MCYSTs (Karla Reservoir: 3.65 μg/L; Lake Pamvotis: 5.21 μg/L).

Natural Phytoplankton Communities of the Waterbodies

Phytoplankton blooms occurred in both the Karla Reservoir and Lake Pamvotis. Almost 99% of the total phytoplankton biomass in Karla Reservoir consisted of cyanobacteria, while chlorophytes (the most abundant was Monoraphidium spp.) were counted in low biomass, consisting of less than 1% of the total phytoplankton biomass (Table 2). The cyanobacterial species forming the bloom in the Karla Reservoir were Aphanizomenon favaloroi (biomass 23.88 mg/L), Raphidiopsis (Cylindrospermopsis) raciborskii (biomass 21.72 mg/L), Chroococcus sp. (biomass 1.91 mg/L), and Planktolyngbya limnetica (biomass 1.55 mg/L). Additionally, in Lake Pamvotis, cyanobacteria were forming a heavy bloom with biomass of 150 mg/L (Table 2). Microcystis aeruginosa was the species with the highest biomass (81.88 mg/L), followed by Microcystis wesenbergii and Microcystis panniformis (42.60 and 17.35 mg/L, respectively). Chlorophytes, diatoms, and cryptophytes were also observed in Lake Pamvotis in low biomass (0.086, 0.65, and 0.68 mg/L, respectively) (Table 2).

3.2. H2O2 Degradation

To explore the role of biological processes in H2O2 degradation in water samples from the Karla Reservoir and Lake Pamvotis, degradation rates of H2O2 in both filtered and unfiltered samples from the waterbodies were calculated. According to results, degradation rates of H2O2 in unfiltered samples (Biological and Chemical degradation) of both waterbodies were quite fast (Figure 2A). The biological and chemical degradation rate in water samples from Lake Pamvotis was significantly higher (p < 0.05) than the corresponding rate in water samples from the Karla Reservoir (Figure 2A). On the other hand, degradation rates in both waterbodies appeared significantly lower (p < 0.05) for filtered samples (chemical processes). Figure 2B shows that all the added H2O2 in water samples from Lake Pamvotis was degraded completely in 3 h, different from the added H2O2 in water samples from the Karla Reservoir, which was dissipated completely in 5 h.

3.3. Effects of H2O2 on Karla Reservoirs’ Phytoplankton

Cyanobacterial biomass in Karla Reservoir samples treated with H2O2 decreased over time (Figure 3). At the end of the experiment (144 h), in samples treated with H2O2, the initial cyanobacterial biomass (time zero) decreased by 93% in Karla’s samples. In contrast, in the control samples, initial cyanobacterial biomass increased by 140% at the end of the experiment.
Figure 4 shows biomass variation of different cyanobacterial species in control and treated samples over time in Karla Reservoir water samples. R. raciborskii, A. favaloroi, P. limnetica, and Chroococcus sp. were the dominant cyanobacterial species identified in water samples of the Karla Reservoir. Among them, R. raciborskii was affected the most by the application of H2O2. Specifically, R. raciborskii’s biomass dropped from 21.72 mg/L in the control samples to non-detectable in the samples treated with 4 mg/L H2O2 (Figure 4A). Figure 5 shows micrographs of water samples taken 5 h after the beginning of the experiment. Micrograph of the control sample (Figure 5A) and the samples treated with H2O2 5 h (Figure 5B), 72 h (Figure 5C), and 144 h (Figure 5D). In Figure 5B, broken filaments of R. raciborskii are depicted. In the micrographs from 72 (Figure 5C) and 144 h (Figure 5D)-treated samples, no R. raciborskii are present, while the filaments of A. favaloroi and P. limnetica and small-number colonies of Chroococcus are shown. It is noteworthy that R. raciborskii’s biomass increased from 21.72 mg/L to 100.45 mg/L in the control samples (Figure 4A).
A. favaloroi’s biomass decreased significantly (p < 0.05) from 23.88 mg/L in the control samples to 2.58 mg/L in the samples treated with 4 mg/L H2O2 (Figure 4B). The A. favaloroi biomass decreased not only due to filament numbers decreasing, but also due to the filament size decreasing. In the treated samples A. favaloroi filaments were half in length and 10–20% thinner. A. favaloroi biomass in the control samples increased 72 h after the beginning of the experiment; however, a significant decrease (p < 0.05) occurred at the end of the experiment (144 h) (Figure 4B).
P. limnetica biomass was not affected by the application of H2O2 since its biomass remained constant in the samples treated with 4 mg/L H2O2 throughout the experiment. Additionally, its biomass remained constant in control samples throughout the experiment. Chroococcus sp.’s biomass reduced significantly (p < 0.005) by 26% in the samples treated with 4 mg/L H2O2 at the end of the experiment (144 h), in contrast with control samples, in which the biomass of Chroococcus sp. did not change significantly (p > 0.05) in comparison with the biomass that this species had at time zero (Figure 4D).
The remaining phytoplankton taxa and particularly chlorophytes, the most abundant group contributing less than 1% to the total phytoplankton biomass in the lake water, changed very little during the experiment between <1% and <2% in all the treatments and controls, while an individual of euglenophytes was observed only at the end of the experiment (144 h).

3.4. Effects of H2O2 on Lake Pamvotis’ Phytoplankton

Cyanobacterial biomass in Lake Pamvotis samples treated with H2O2 decreased over time (Figure 6A). At the end of the experiment (144 h), in samples treated with H2O2, the initial cyanobacterial biomass (time zero) decreased by 71% in Pamvotis’ samples. In contrast, in the control samples, initial cyanobacterial biomass increased by 49% at the end of the experiment (Figure 6A). In contrast with cyanobacteria, chlorophytes were positively affected by the application of H2O2 by increasing their biomass significantly (p < 0.05) throughout the experiment. In control samples, biomass of chlorophytes remained constant throughout the experiment (p > 0.05) (Figure 6B).
Biomass of diatoms increased significantly (p < 0.05) 72 h after the application of H2O2. In the control samples, biomass of diatoms decreased significantly (p < 0.05) by 17% at the end of the experiment (Figure 6C).
Biomass of cryptophytes was not affected by the treatment of H2O2 (p > 0.05); however, in control samples their biomass decreased significantly over time (p < 0.05) (Figure 6D).

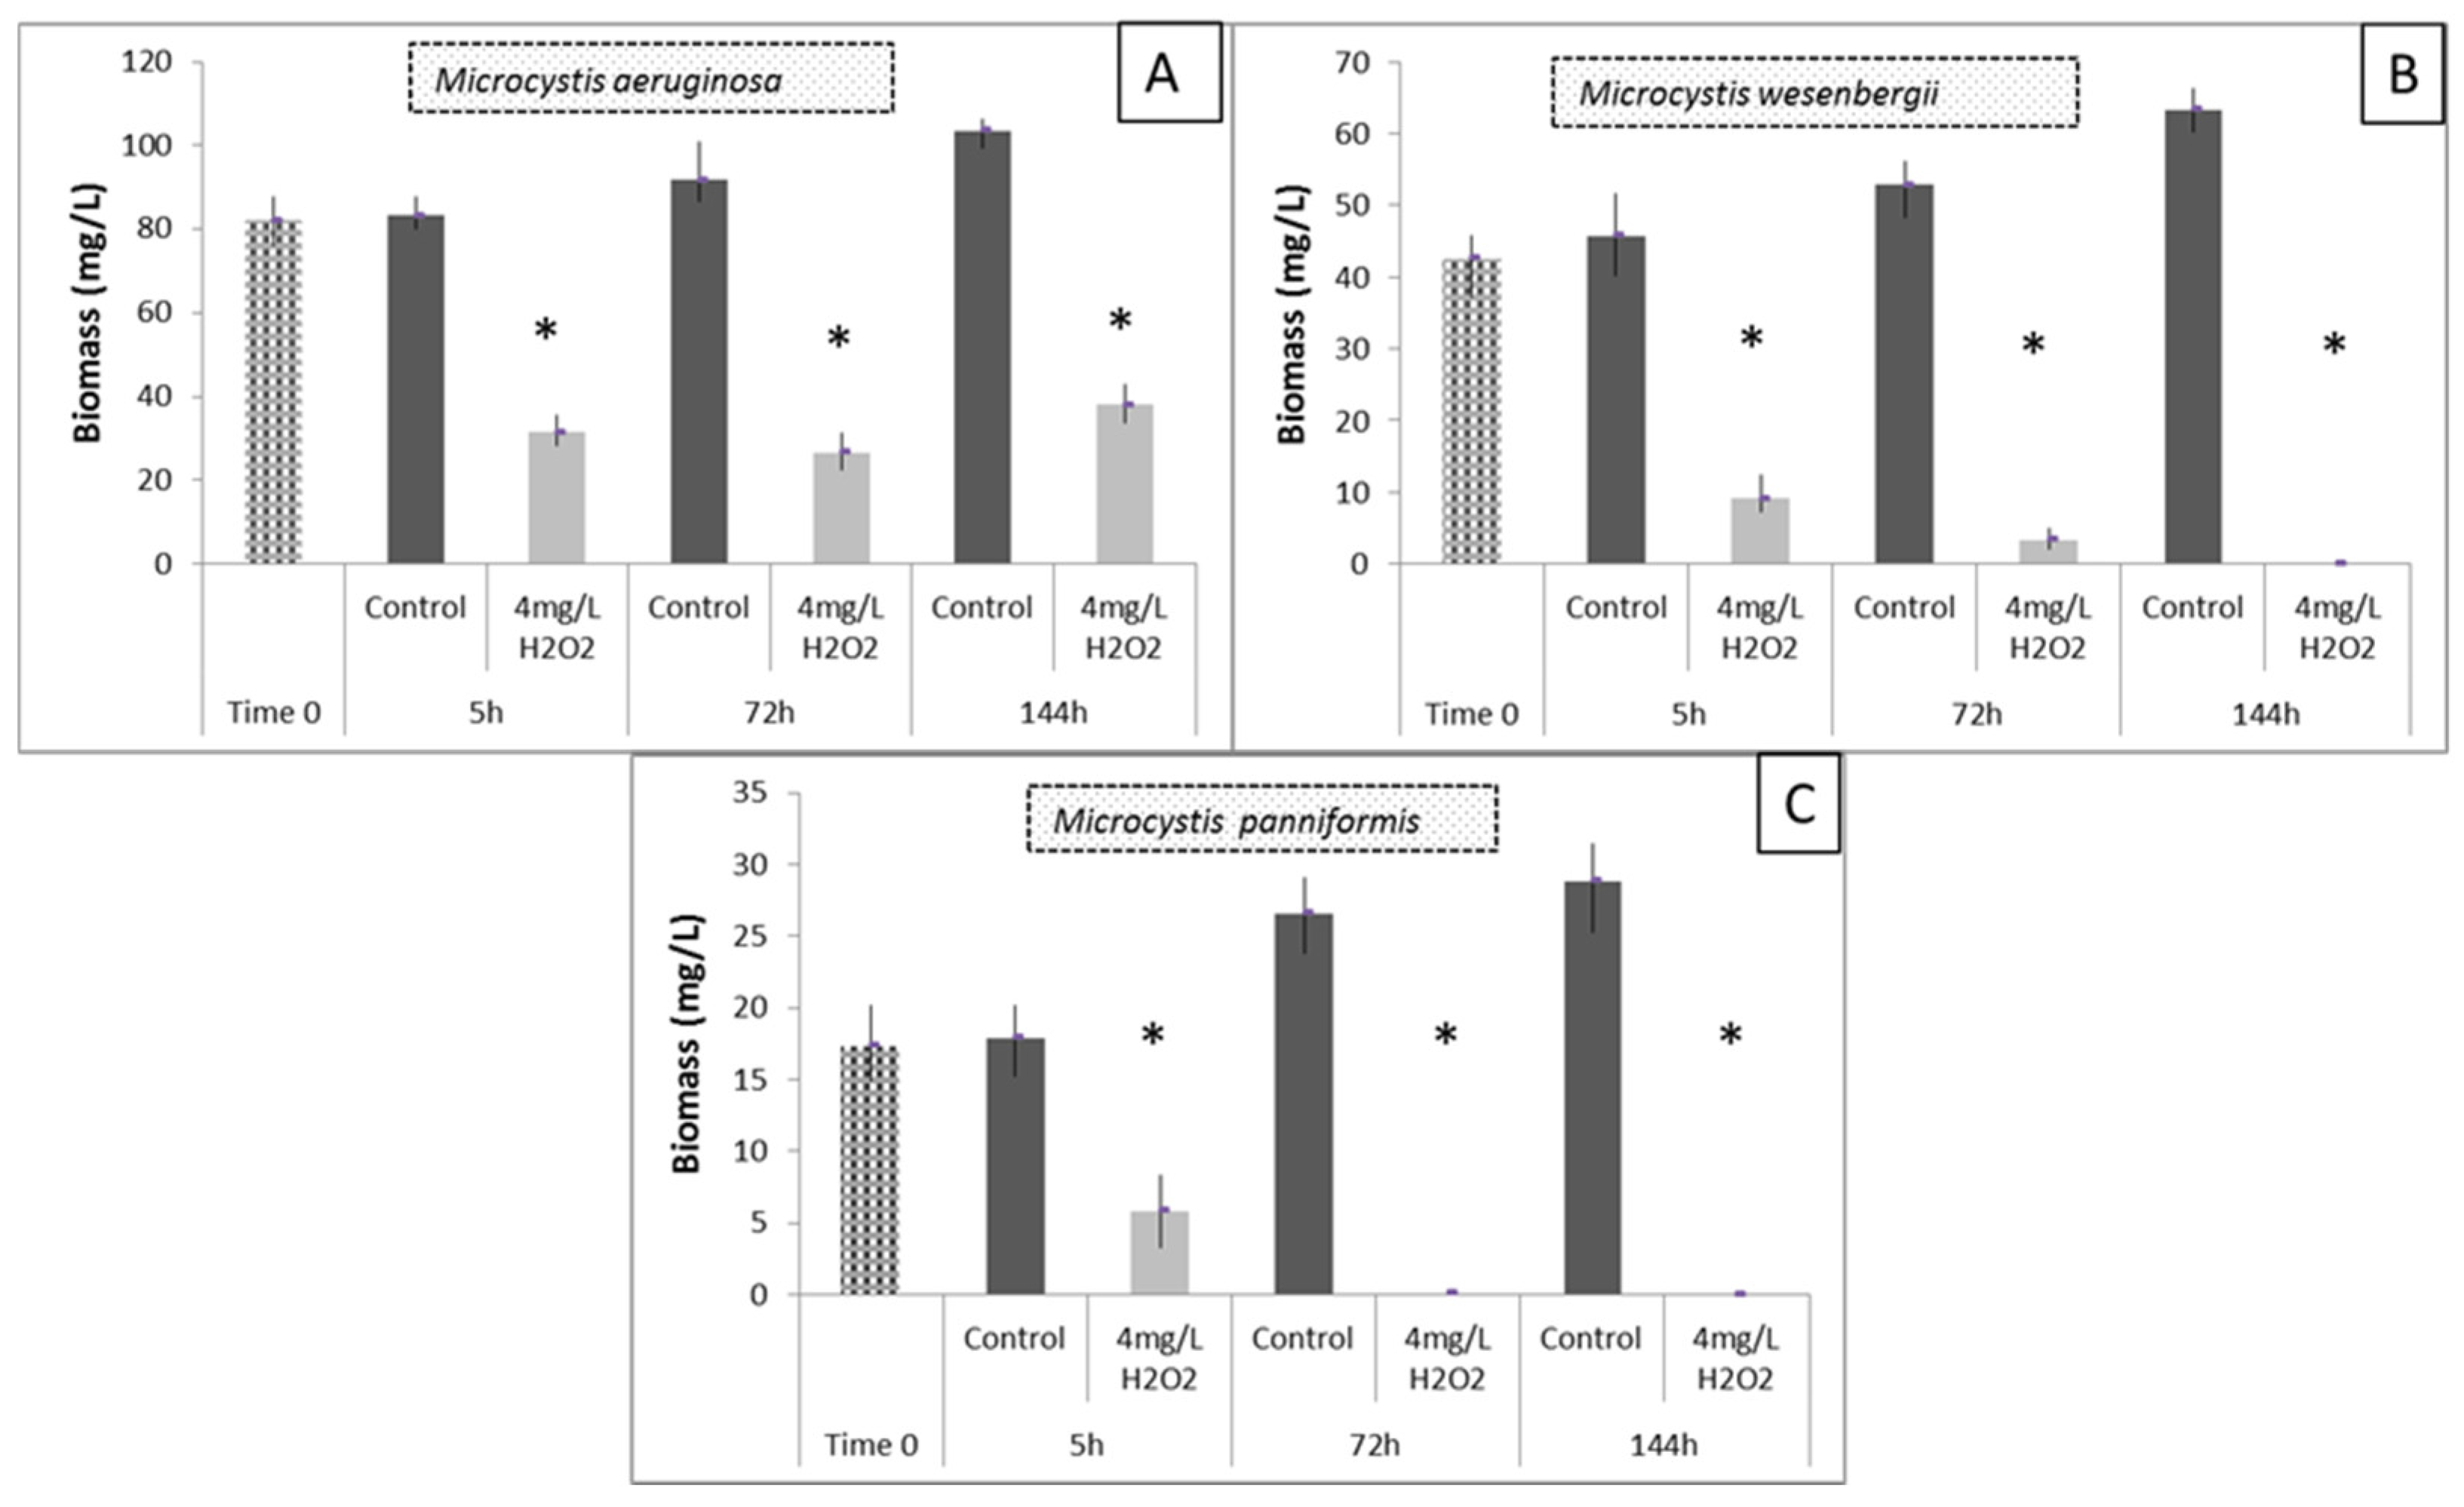
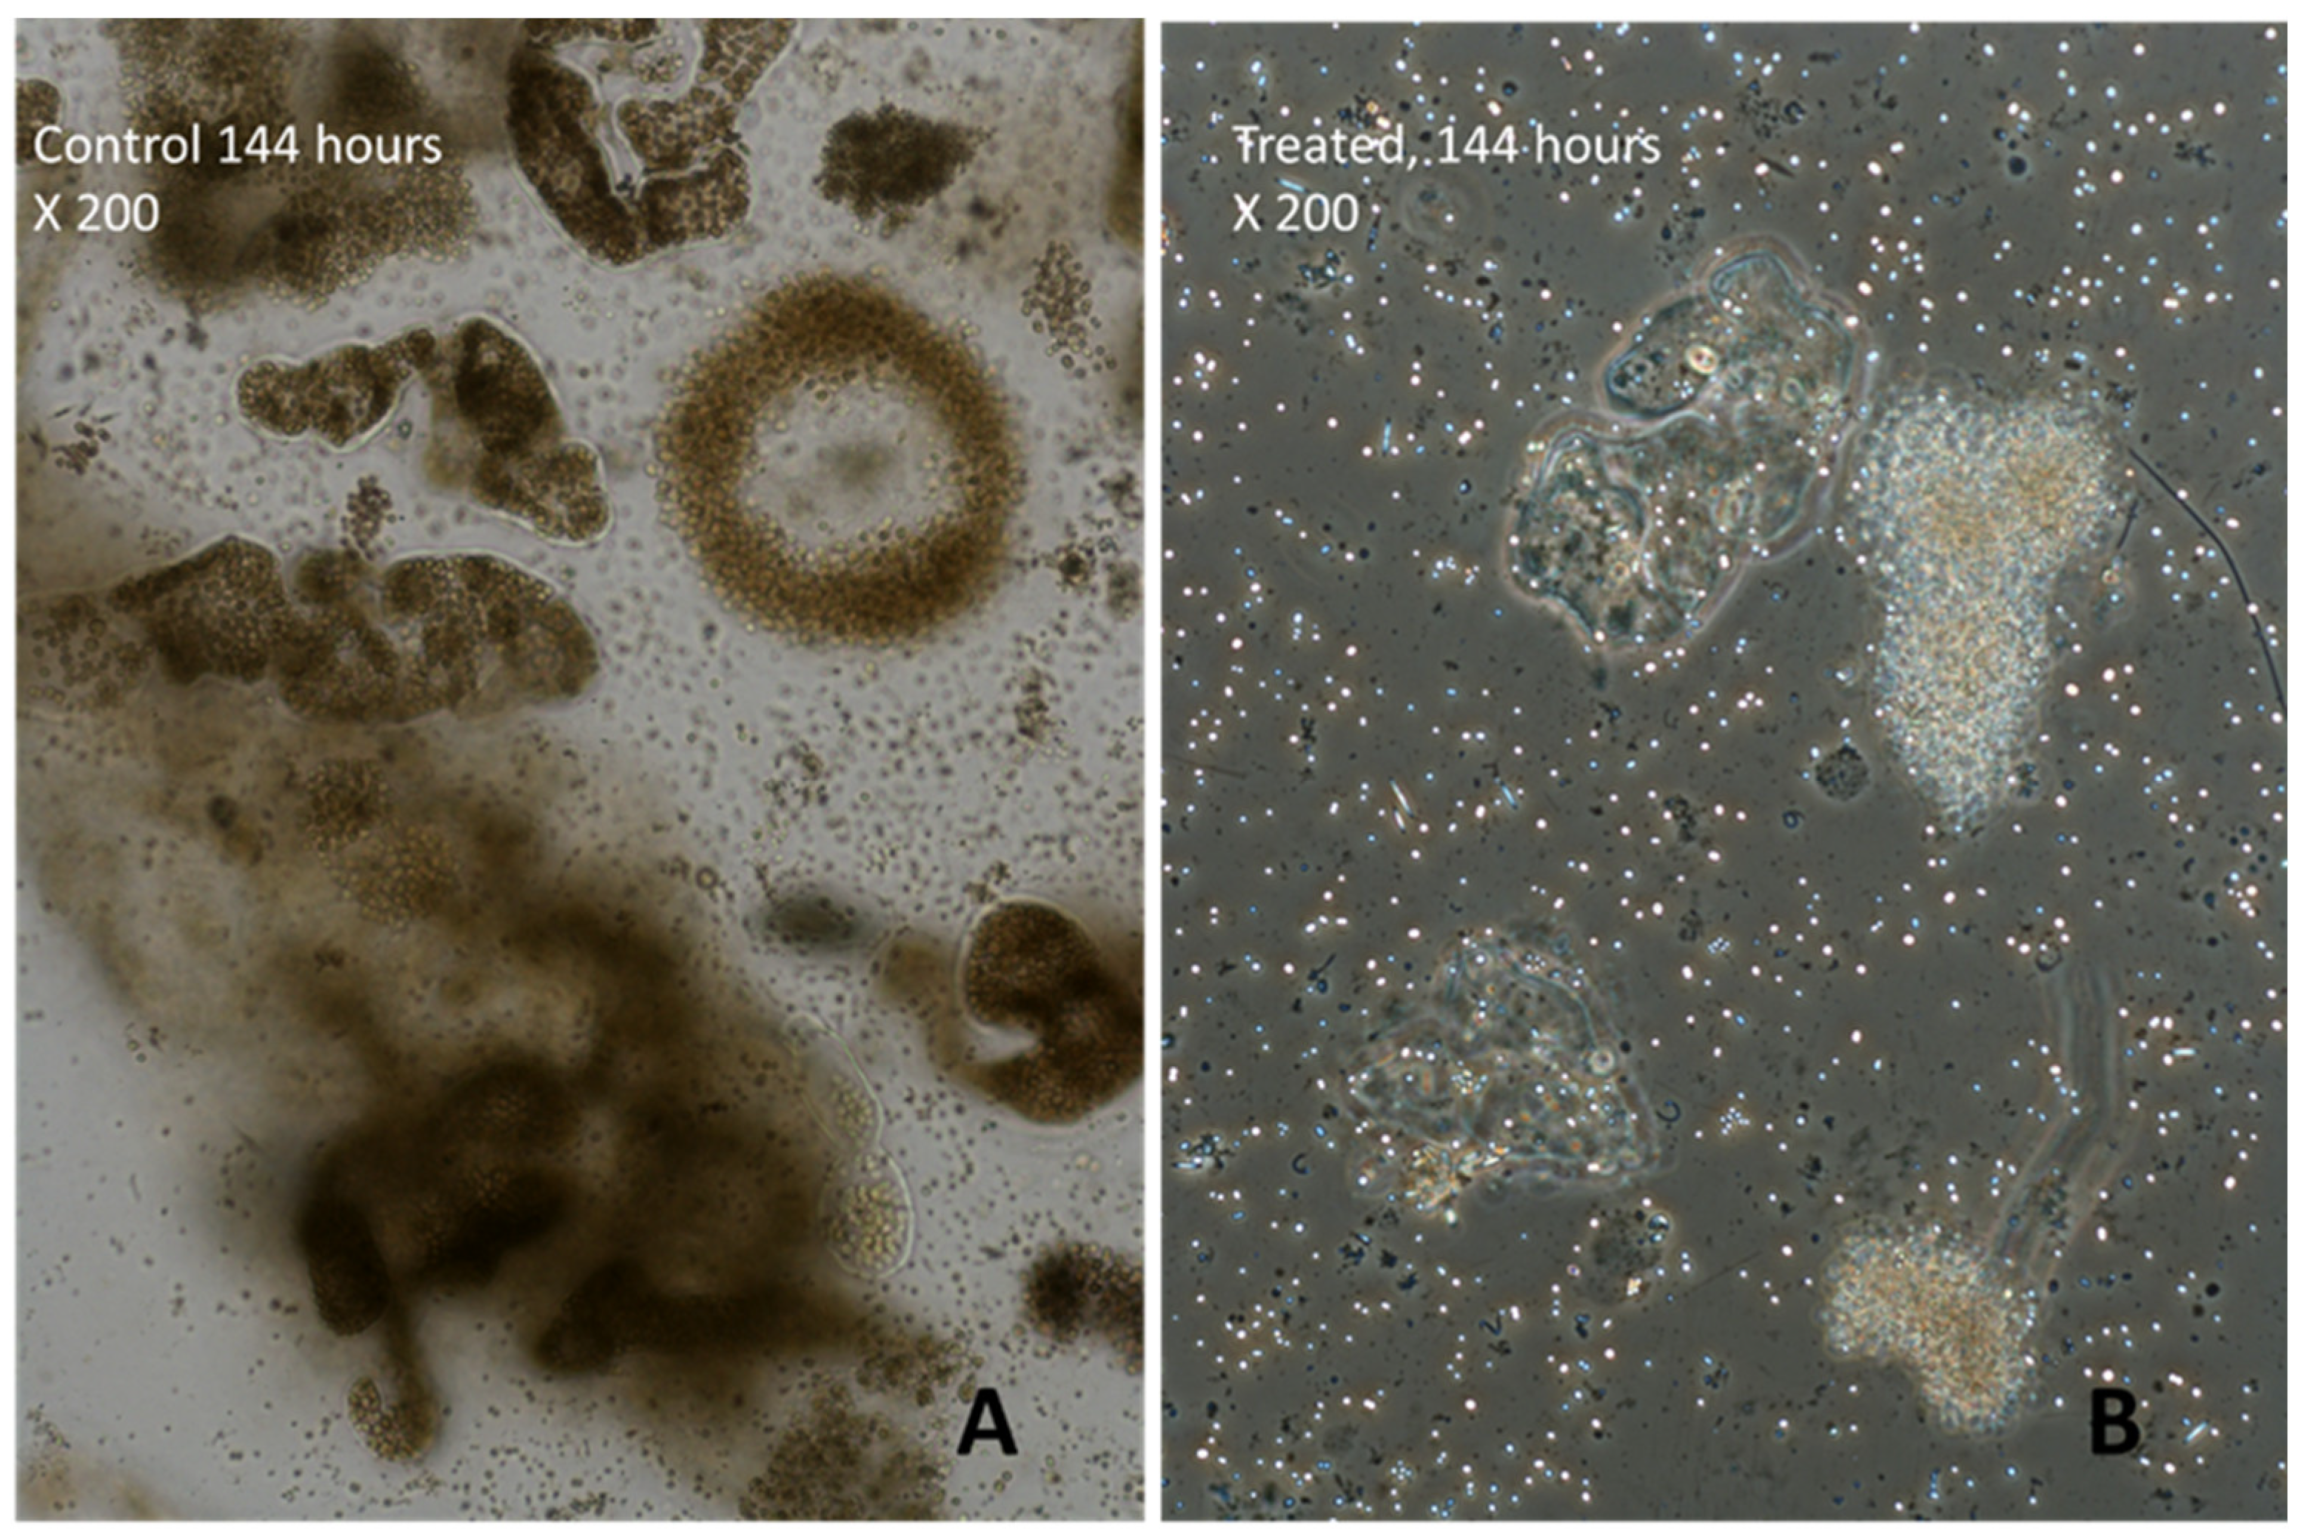
3.5. Effects of H2O2 on Different Species of Microcystis in Lake Pamvotis

Microcystis aeruginosa was the least affected species by H2O2 compared with Microcystis panniformis and Microcystis wesenbergii (Figure 7). Biomass of M. aeruginosa in treated samples decreased significantly (p < 0.05) 72 h after the beginning of the experiment. However, an increase was observed in its biomass at the end of the experiment compared to its biomass at 72 h. Overall, at the end of the experiment, biomass of M. aeruginosa was significantly lower (p < 0.05) than the initial biomass (biomass at time zero). M. aeruginosa’s biomass increased significantly in the control condition (p < 0.05) (Figure 7A). M. wesenbergii’s biomass decreased in treated samples to undetectable cell numbers at the end of the experiment (144 h), although conspicuous remnants of its colony mucilage were observed (Figure 8B). Interestingly, its biomass in control samples increased significantly (p < 0.05) at the end of the experiment (Figure 7B). M. panniformis was the most affected species by the H2O2 treatment. Its biomass decreased to undetectable levels as early as 72 h of the experiment. In contrast, M. panniformis’s biomass increased significantly (p < 0.05) over time (Figure 7C) in the control condition.

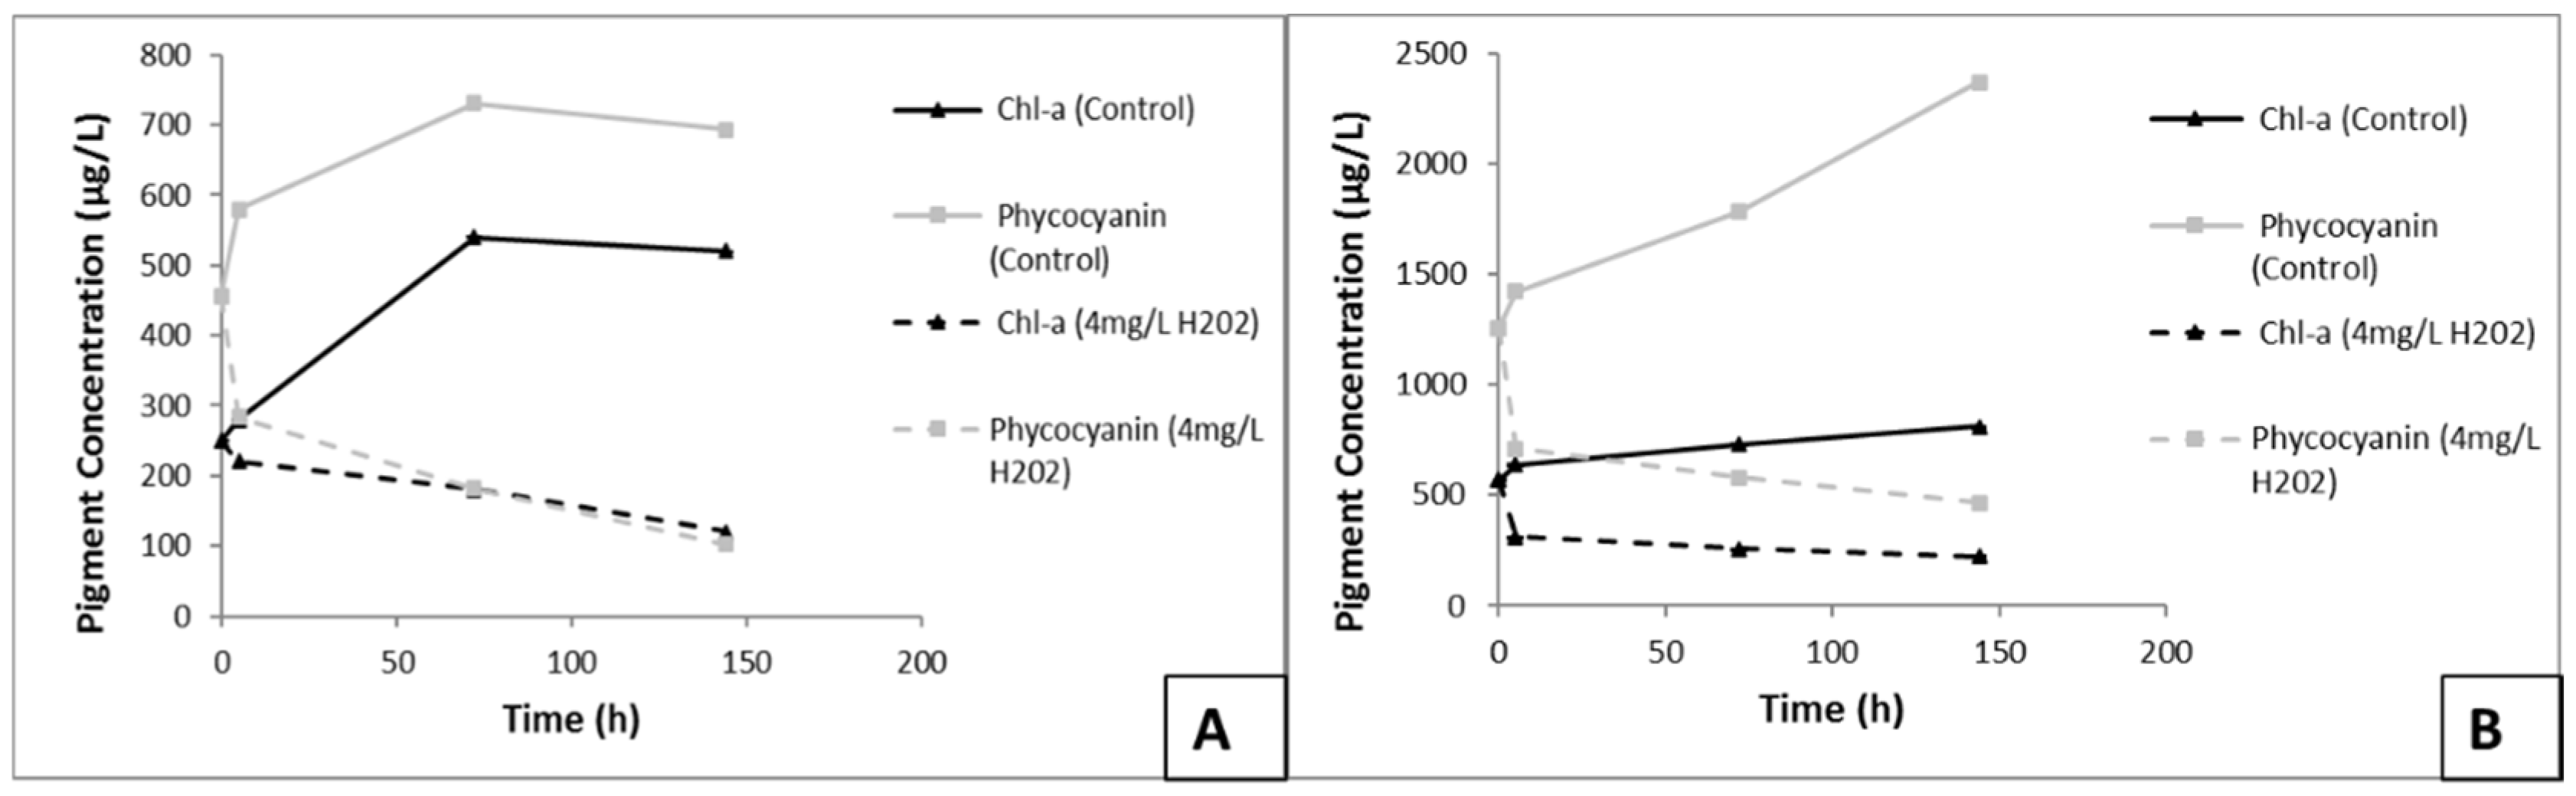
3.6. Effects of H2O2 on Chl-a and Phycocyanin

According to Figure 9, the application of H2O2 resulted in a decrease in Chl a and phycocyanin concentration in water samples from both waterbodies examined. In contrast, in control water samples of the Karla Reservoir and Lake Pamvotis, both pigments increased. In the Karla Reservoir, phycocyanin concentration decreased by 78% and it was significantly different (p < 0.05) from the corresponding concentration in Lake Pamvotis, which decreased by 63%.

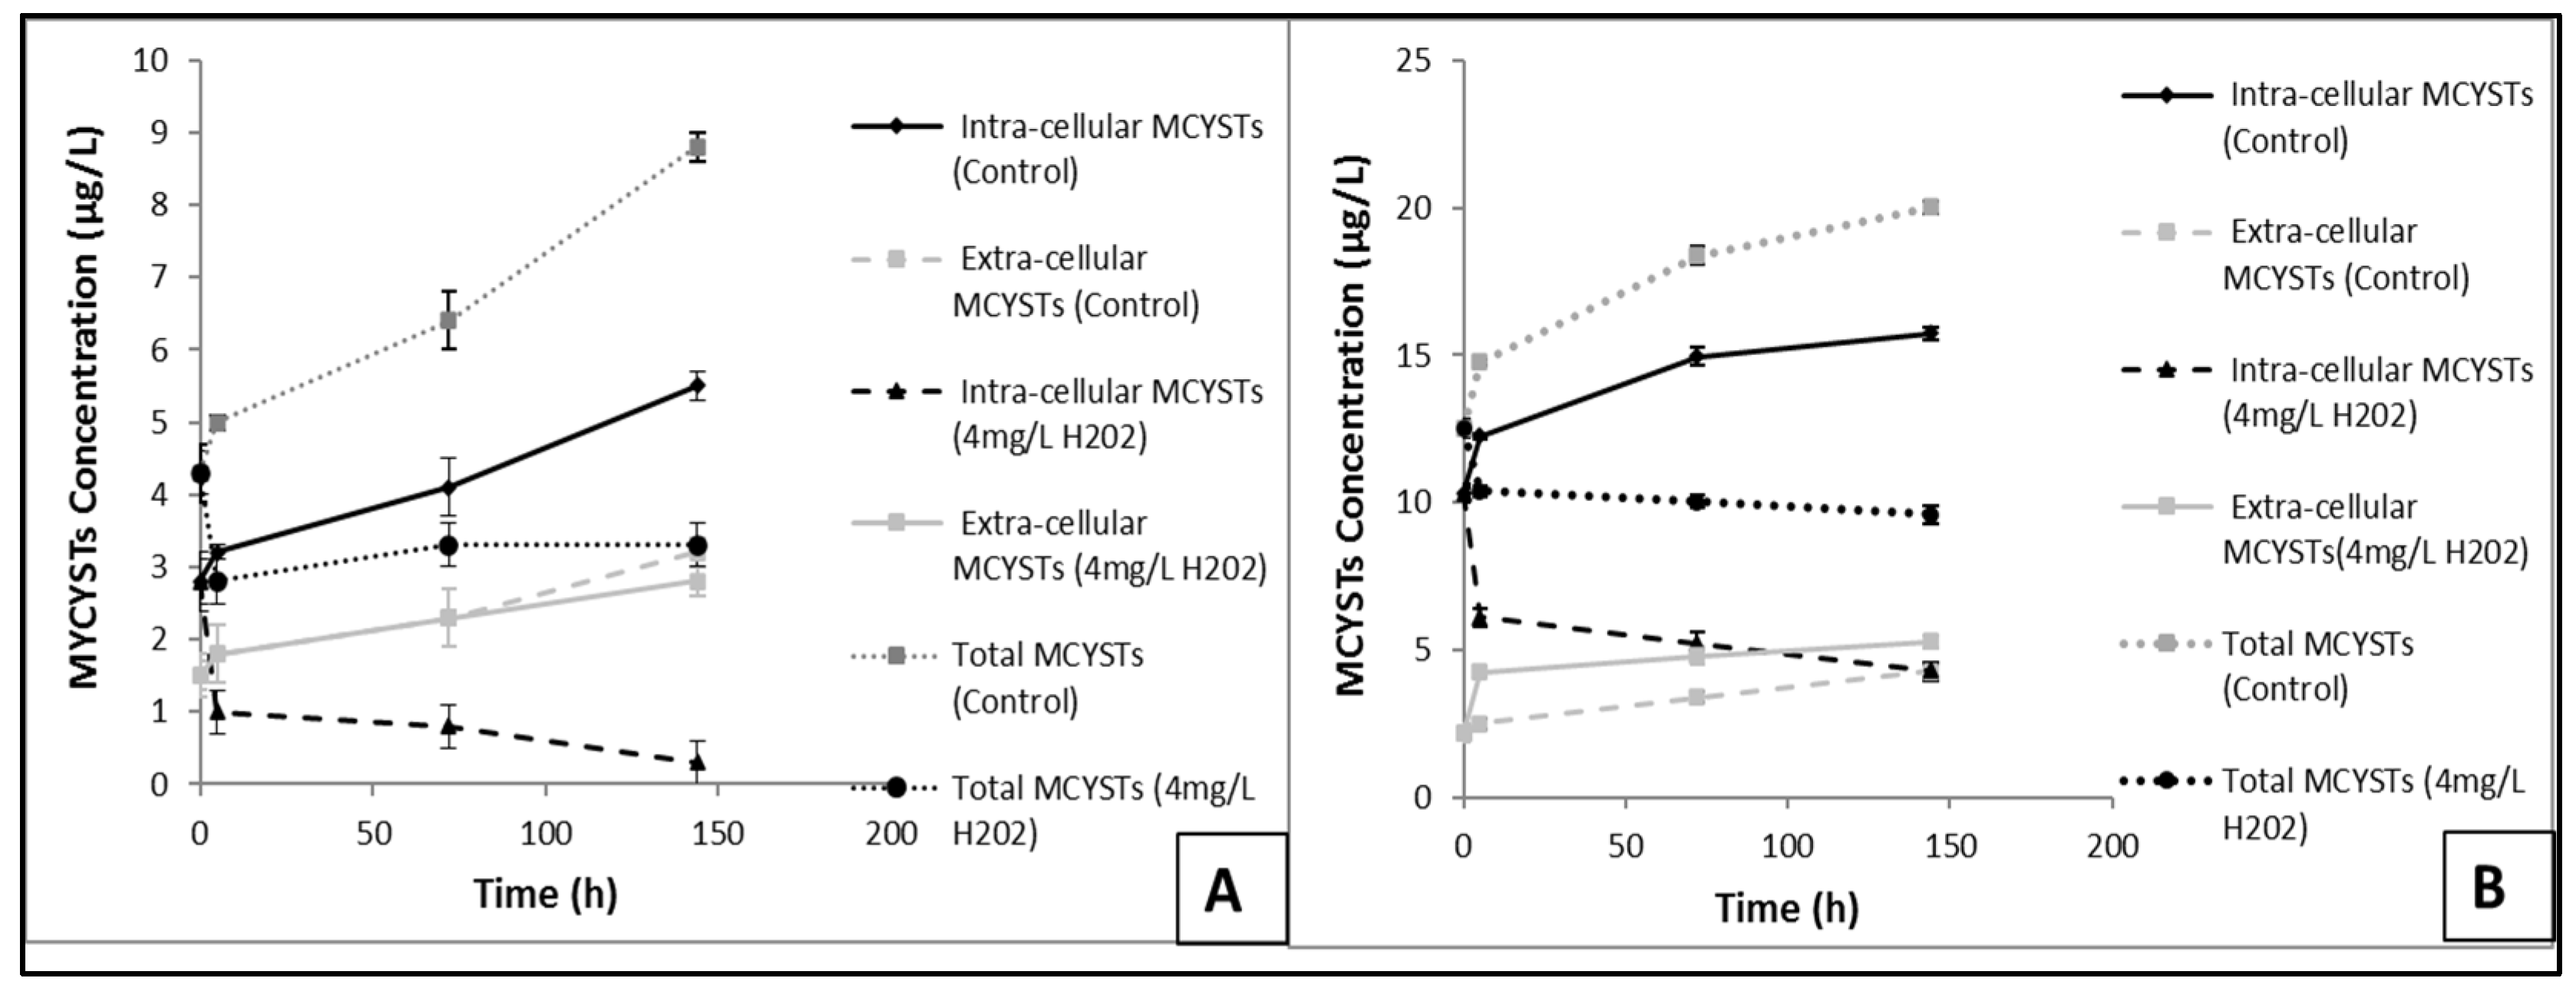
3.7. Effects of H2O2 on MCYSTs

According to Figure 10, intra-cellular and extra-cellular MCYSTs concentrations increased significantly (p < 0.05) over time in the control samples from both waterbodies. Intra-cellular MCYSTs concentration decreased significantly (p < 0.05) over time in the treated samples from both waterbodies. In contrast, extra-cellular MCYSTs concentration increased significantly (p < 0.05) over time in the treated samples from both waterbodies studied. Total MCYSTs concentration decreased significantly (p < 0.05) in the treated samples from both waterbodies.

4. Discussion

In the current study, the effects of H2O2 on phytoplankton biomass, cyanobacteria species, and MCYSTs concentrations of water samples originated from eutrophic—hypertrophic waterbodies, one lake and one reservoir, were evaluated. Both waterbodies have a history of toxic cyanobacterial blooms [39,40,46], making them suitable as study areas for collecting samples for our experiment. The two investigated waterbodies were characterized by similar physicochemical parameters (Temperature, Dissolved Oxygen, pH, Nitrate, Nitrite, Ammonium, SRP) apart from electrical conductivity. Water from the Karla Reservoir had higher conductivity than Lake Pamvotis water, which may be attributed to the geological profile of the Karla Reservoir’s whole catchment area [57], but also to runoff from the surrounding agricultural area [58]. Regarding biotic parameters, in the Karla Reservoir, almost 100% of phytoplankton consisted of cyanobacteria. In Lake Pamvotis, cyanobacteria were also contributing 98% of the total phytoplankton. Nevertheless, other phytoplankton groups (chlorophytes, diatoms, cryptophytes) were also observed in Lake Pamvotis at countable biomass levels. An important difference between the two waterbodies is related to the species composition and biomass of cyanobacteria: in the Karla Reservoir, filamentous cyanobacterial species were dominant (R. raciborski, A. favaloroi, P. limnetica), while in Lake Pamvotis colonial species were the dominant cyanobacterial species (M. aeruginosa, M. wesenbergii, M. panniformis). Furthermore, Lake Pamvotis was characterized by three times higher cyanobacterial biomass than the Karla Reservoir. These differences between the environments possibly contributed to the difference in cyanobacterial biomass reduction in samples from the two waterbodies. According to our results, the initial cyanobacterial biomass in Karla Reservoir samples treated with H2O2 decreased by 93%, and in Lake Pamvotis a cyanobacterial biomass decrease of 71% was shown. This difference in cyanobacterial reduction could be explained by differences in H2O2 degradation rates shown in the two waterbodies. The biological and chemical degradation rate in Lake Pamvotis was significantly higher than the corresponding rate in the Karla Reservoir, while the chemical H2O2 degradation rate was similar in both areas. Additionally, H2O2 degradation rates in filtered water samples from both studied areas was significantly lower than in unfiltered water samples, suggesting that a large part of H2O2 degradation is due to biological processes. Additionally, H2O2 in Lake Pamvotis was dissipated completely in 3 h, while in the Karla Reservoir H2O2 was dissipated completely in 5 h. The efficiency of H2O2 to control phytoplankton biomass depends on H2O2 decomposition and its residence time in water [32,59,60], which can be affected either by biotic factors, such as phytoplankton density and composition, or abiotic factors, such as water reductive power (affected by organic matter) [59,61]. Weenink et al. [59] used three phytoplankton densities (2:1:0.5 ratio) to calculate the rate of degradation of added H2O2. They showed that H2O2 degradation was faster in concentrated samples than in diluted samples. However, in our study, this effect could not be evaluated since the chemical composition of dissolved organic matter in the studied environments remains to be investigated.
In contrast to cyanobacteria, chlorophytes in Lake Pamvotis were positively affected by the application of H2O2. Biomass of diatoms and cryptophytes, in total, consisted of <2% of the phytoplankton biomass in Lake Pamvotis. However, diatoms and cryptophytes significantly increased their biomass after treatment with H2O2 at the end of the experiment. Positive effects of H2O2 on biomass of diatoms have been shown in cultures and in natural samples [27,59]. Alloxanthin (a carotenoid primarily found in cryptophytes) increased in phytoplankton samples treated with natural concentrations of H2O2 according to studies of Pflaumer [62]. Additionally, Barrington et al. [31] showed that cryptophytes Chl a concentrations increased 33% compared with the initial values. The positive effect of H2O2 on chlorophytes could be explained by the suggestion that these species benefited from the collapse of cyanobacteria and utilized the available nutrients [63].
Several laboratory studies have indicated that cyanobacteria are more sensitive to hydrogen peroxide (H2O2) than green algae and diatoms. Barroin and Feuillade [64] showed that as little as 1.75 ppm (corresponding to 1.75 mg/L) of H2O2 had a deleterious effect on laboratory cultures of the cyanobacterium Planktothrix rubescens (formerly known as Oscillatoria rubescens), while a 10 times higher concentration proved totally harmless to the green alga Pandorina morum. Subsequently, Dra’bkova’ et al. [65] investigated several more species and showed that H2O2 had generally a much stronger inhibitory effect on the photosynthesis of cyanobacteria than of eukaryotic phytoplankton. Matthijs et al. [32] introduced 2 mg/L of H2O2 homogeneously into the entire water volume of Lake Koetshuis (The Netherlands) and they showed that the cyanobacterial population collapsed by 99% within a few days. Furthermore, they concluded that eukaryotic phytoplankton (including green algae, cryptophytes, chrysophytes, and diatoms), zooplankton, and macrofauna remained largely unaffected. The higher sensitivity of cyanobacteria to H2O2 compared with eukaryotic phototrophs can be explained by the absence of compartmentalized organelles protected by membranes, as well as the lack of Mehler reaction as found in higher plants and algae [66,67,68]. This reaction consists of O2 reduction to superoxide anion (O2−) by electrons from photosystem I (PSI). Superoxide is then converted to H2O2 by superoxide dismutase and finally to water by peroxidase. In cyanobacteria, flavoproteins suppress O2− generation and the electrons from PSI are donated to O2 producing H2O without the formation of reactive oxygen species (ROS) [66,67]. Thus, cyanobacteria do not possess an anti-ROS system as efficient as that of green algae and higher plants [68]. Although there is enough information concerning sensitivity of cyanobacteria to H2O2, there is a lack of knowledge concerning the differential effects of H2O2 on cyanobacterrial genera or species, with few exceptions. According to our results, although R. raciboskii and A. favaloroi occurred in the Karla Reservoir with similar biomass (21.72 and 23.88 mg/L, respectively), R. raciboskii was the one most affected after treatment with 4 mg/L H2O2. R. raciboskii decreased its biomass to undetectable levels 72 h after the experiment started. A. favaloroi also decreased its biomass, but even after the end of the experiment remained in water samples in lower concentrations. According to these results, R. raciboskii seems to be more vulnerable to H2O2 than A. favaloroi, which shifted in filaments of smaller dimensions (both length and width). It has been shown that filamentous cyanobacteria are more vulnerable to H2O2 effects than colonial cyanobacteria [29,33]; however, little is known about the effects of H2O2 on different species of filamentous cyanobacteria. Yang et al. [33] showed that the H2O2 half-maximal effective concentration (EC50) values were similar for R. raciborskii and Anabaena flos-aquae when the same concentration of H2O2 was applied to cultured strains of these species. However, the results are not comparable to ours, since experimental conditions (cultures vs. natural samples) and species used (A. flos-aquae vs. A. favaloroi) were different. P. limnetica, another filamentous species of Oscillatoriales, was not affected by the application of 4 mg/L H2O2. In contrast, Chroococcus sp.’s biomass decreased significantly. The growth as multicellular filamentous clumps or colonies confers cyanobacteria with several advantages including resistance to oxidative stress [54]. Wu et al. [69] showed that colonial Microcystis was more resistant to the application of copper sulfate (copper sulfate is known as a chemical causing oxidative stress in microorganisms) compared with unicellular Microcystis. Therefore, low resistance of Chroococcus sp. to H2O2 treatment could be attributed to its unicellular form [70]. On the other hand, Lusty and Gobler [37] showed that the addition of 4 mg/L H2O2 in environmental lake samples resulted in the reduction of cyanobacteria and they also showed that Planktothrix was highly sensitive, Microcystis was moderately sensitive, and Raphidiopsis (Cylindrospermopsis) was the most resistant cyanobacterial species. However, they concluded that the effects of H2O2 are somewhat conditional upon the original cyanobacterial community composition. It seems that the dominant cyanobacterial genus is most reduced by H2O2, perhaps by providing larger organic surface area for the H2O2 to react with, allowing other genera at lower relative abundances replace the most H2O2-affected taxa.
Apart from the above-mentioned differences on the effects of H2O2 on different genera of cyanobacteria, this is the first time, to our best knowledge, that the differential effect of H2O2 was observed on a phtoplankton community including different cyanobacterial species of the same genus. According to our results, the treatment with 4 mg/L H2O2 differently affected the biomass of the three species of Microcystis found in Lake Pamvotis. The effect of H2O2 on biomass of M. aeruginosa, M. wesenbergii, and M. panniformis were compared by the rate of biomass reduction observed for each of Microcystis species. M. wesenbergii and M. panniformis biomass decreased by 100%, with M. panniformis affected only 72 h after the start of the experiment. M. wesenbergii was affected 144 h after the start of the experiment. M. aeruginosa was the least-affected species since its biomass only decreased by 53%. Furthermore, the largest reduction in biomass of M. aeruginosa occurred in 72 h after the start of the experiment and after this time its biomass began to increase. To date, there are no other studies about species-dependent variation in sensitivity of Microcystis species to H2O2. However, Wu et al. [69] showed species-dependent variation in sensitivity of Microcystis species to copper sulfate. Copper sulfate has been also used as a chemical reagent for blooms control [71] and according to the results of Wu et al. [69], M. wesenbergii and M. flos-aquae were the most vulnerable species to copper sulfate compared with M. aeruginosa and M. viridis. They also concluded that the species-dependent variation in the sensitivity of Microcystis species to copper sulfate may have resulted from variations in extracellular polysaccharide content in different Microcystis species. Gao et al. [72] showed that extracellular polymeric substances buffer against the biocidal effect of H2O2 on M. aeruginosa. Furthermore, roles of loosely-bound extracellular polymeric substances and tightly bound extracellular polymeric substances in the sensitivity of cyanobacterial species in H2O2 is still unknown, but they may contribute to species-dependent variation in the sensitivity of Microcystis species found in our study. M. wesenbergi is characterized by tightly-bound extracellular polymeric substances which makes this species more sensitive to cell rupture and maybe more vulnerable to H2O2 effect. In contrast, the loosely-bound extracellular polymeric substances of M. aeruginosa may protect this species against cell rupture and maybe also against the negative effect of H2O2.
The effect of H2O2 on cyanobacteria seems to be even more variable since different strains of the same species were found to have different sensitivities to H2O2 addition. Schuurmans et al. [73] showed that microcystin-producing strains are less prepared for high levels of oxidative stress and are therefore hit harder by H2O2 addition than non-toxic strains. In addition, some strains of Microcystis lack typical cyanobacterial catalases, thus being more sensitive to H2O2 effect [74]. Further research is needed to explain the mechanisms which are responsible for the species- and even the strain-dependent variation in sensitivity of cyanobacteria to H2O2.
The effects of H2O2 on cyanobactrerial biomass are in accordance with results related to effects of H2O2 on pigment concentrations in the studied waterbodies. Both concentrations of Chl a and phycocyanin reduced in treated samples originated from the Karla Reservoir and Lake Pamvotis. Phycocyanin is the characteristic pigment of cyanobacteria and a reduction in phycocyanin is justified due to the reduction in cyanobacterial biomass in both waterbodies. Chl a is a significant pigment found in cyanobacteria and in other phytoplanktonic organisms. Since phytoplankton of Karla Reservoir and Lake Pamvotis consists of >99% and >98% cyanobacteria, respectively, a decrease in cyanobacteria would result in a subsequent reduction of Chl a. Our results agree with studies of Spoof et al. [75], who showed a reduction of Chl a concentration in water samples from Lake Köyliönjärvi after treatment with 5 mg/L H2O2. Cyanobacteria in Lake Köyliönjärvi also consisted in the largest part of phytoplankton.
Measurable MCYST concentrations in both waterbodies have already been observed by previous studies [43,46,76]. The high MCYSTs concentrations in the Karla Reservoir and Lake Pamvotis are justified by the presence of toxic cyanobacteria in their water; as shown in the present study concerning Lake Pamvotis, the species Microcystis aeruginosa and Microcystis panniformis were dominant in the sample and possibly contributed to the production of MCYSTs. Microcystis wesenbergii also contributed to the cyanobacterial biomass, although it has been reported as a non-producing MCYST species [77]. Microcystis species were absent from the cyanobacterial biomass of the Karla Reservoir. Raphidiopsis (Cylindrospermopsis) raciborski, Aphanizomenon favaloroi, and Planktolyngbya limnetica were the dominant species in the Karla Reservoir, whereas Chroococcus species were present in low numbers. Cylindrospermopsis and Aphanizomenon sp. have been related to the production of MCYSTs [78], although they are not the main MCYST producers. Microcystin was detected in a coastal lagoon in Spain when Planktolyngbya contorta was abundant and Chroococcus dispersus was dominant [79]. Our results showed that intra-cellular MCYSTs concentration decreased with time after the application of 4 mg/L H2O2, which is consistent with the decrease in cyanobacterial biomass and phycocyanin concentrations. An increase in extra-cellular MCYSTs in treated samples was observed at the end of the experiment in both waterbodies. Lysis of cyanobacterial cells, induced by H2O2, probably resulted in the release of intra-cellular MCYSTs into the water. The decrease in intra-cellular MCYSTs concentration was higher than the increase of extra-cellular MCYSTs concentration, resulting in a decrease of Total MCYSTs in the Karla Reservoir and Lake Pamvotis. Spoof et al. [75] also found an increase in extra-cellular MCYSTs concentration and a reduction in intracellular MCYSTs concentration when they applied 5 mg/L H2O2 to water samples from Lake Köyliönjärvi. When Barrington et al. [31] applied H2O2 (0.1–1 g/L) in a waste-stabilization pond full-scale trial, they showed that both intra-cellular and extra-cellular MCYSTs were reduced. Hydrogen peroxide degrades within hours of addition [27,80], but extra-cellular microcystins will only be oxidized by H2O2 whilst it is still present within the water column; hence, degradation by H2O2 was not the sole mechanism by which extra-cellular microcystins were decreased in experiments of Barrington et al. [31]. Biodegradation of extra-cellular MCYSTs and adsorption to sediments that naturally occur in lakes and reservoirs may result in the longer-term reduction of extra-cellular MCYSTs compared with experiments under laboratory conditions [81,82].
Although H2O2 is an effective option of reducing the biomass of an already formed bloom, further research is needed to investigate its effect on other bentho-pelagic components. Preview studies demonstrated that the implementation of a relatively high concentration of H2O2 to control cyanobacterial blooms would lead to the alteration of the sex ratios of zooplankton [83] and result in histopathological changes and brain injuries in fish [84]. Furthermore, H2O2 treatment should be applied considering the different characteristics of the waterbodies, since the efficiency of H2O2 is influenced by light intensity and nutrient availability [35,85]. It is also dependent on H2O2 decomposition and its residence time in water [32,59], which can be affected either by biotic or abiotic factors.

5. Conclusions

Treatment with 4 mg/L H2O2 negatively affected the cyanobacteria from the Karla Reservoir and Lake Pamvotis by reducing their abundance. In contrast, other phytoplankton groups like Chlorophytes, Diatoms, and Cryptophytes were positively affected by H2O2 treatment. Furthermore, effects of H2O2 treatment on cyanobacterial genera or species were different depending on the genus and species. Concentrations of intra-cellular MCYSTs and total MCYSTs of water abstracted from the Karla Reservoir and Lake Pamvotis were also affected negatively, reducing the cyanotoxity of the waterbodies. More research is needed about the efficiency of H2O2 as a controller of cyanobacterial blooms and its effects on biotic factors other than phytoplankton.

Author Contributions

Conceptualization, T.P., M.K., N.S., C.S.L., M.M.-G. and K.A.K.; data curation, M.K., N.S., C.S.L. and M.M.-G.; formal analysis, T.P., M.K., N.S., A.P. and V.P.; funding acquisition, C.S.L.; investigation, T.P., A.P. and V.P.; methodology, T.P., A.P., V.P., M.M.-G. and K.A.K.; project administration, C.S.L., M.M.-G. and K.A.K.; resources, C.S.L.; supervision, T.P., C.S.L., M.M.-G. and K.A.K.; validation, T.P., M.K., M.M.-G. and K.A.K.; visualization, T.P., M.K., N.S. and M.M.-G.; writing—original draft, T.P.; Writing—review and editing, M.K., C.S.L., M.M.-G. and K.A.K. All authors have read and agreed to the published version of the manuscript.

Funding

This research received no external funding.

Conflicts of Interest

The authors declare no conflict of interest.

References

  1. Francis, G. Poisonous Australian lake. Nature 1878, 18, 11–12. [Google Scholar] [CrossRef] [Green Version]
  2. Brooks, B.W.; Lazorchak, J.M.; Howard, M.D.A.; Johnson, M.-V.V.; Morton, S.L.; Perkins, D.A.K.; Reavie, E.D.; Scott, G.I.; Smith, S.A.; Steevens, J.A. Are harmful algal blooms becoming the greatest inland water quality threat to public health and aquatic ecosystems? Environ. Toxicol. Chem. 2016, 35, 6–13. [Google Scholar] [CrossRef] [PubMed]
  3. Katsiapi, M.; Genitsaris, S.; Stefanidou, N.; Tsavdaridou, A.; Giannopoulou, I.; Stamou, G.; Michaloudi, E.; Mazaris, A.D.; Moustaka-Gouni, M. Ecological Connectivity in Two Ancient Lakes: Impact Upon Planktonic Cyanobacteria and Water Quality. Water 2020, 12, 18. [Google Scholar] [CrossRef] [Green Version]
  4. Benayache, Y.N.; Nguyen-Quang, T.; Hushchyna, K.; McLellan, K.; Afri-Mehennaoui, F.Z.; Noureddine Bouaï, N. An overview of cyanobacteria harmful algal bloom (CyanoHAB) issues in freshwater ecosystems. In Limnology-Some New Aspects of Inland Water Ecology; IntechOpen: London, UK, 2009. [Google Scholar]
  5. Moustaka-Gouni, M.; Sommer, U. Effects of Harmful Blooms of Large-Sized and Colonial Cyanobacteria on Aquatic Food Webs. Water 2020, 12, 1587. [Google Scholar] [CrossRef]
  6. Carey, C.C.; Ibelings, B.W.; Hoffman, E.; Hamilton, D.P.; Brookes, J.D. Ecophysiological adaptations favour cyanobacteria in a changing climate. Water Res. 2012, 46, 1394–1407. [Google Scholar] [CrossRef] [PubMed]
  7. Moustaka-Gouni, M.; Sommer, U.; Katsiapi, M.; Vardaka, E. Monitoring of cyanobacteria for water quality: Doing the necessary right or wrong? Mar. Freshw. Res. 2019, 71, 717–724. [Google Scholar] [CrossRef]
  8. Sivonen, K.; Jones, G. Cyanobacterial toxins. In Toxic Cyanobacteria in Water; Chorus, I., Bartram, J., Eds.; World Health Organization: Geneva, Switzerland; E & FN Spon: London, UK, 1999; pp. 41–110. [Google Scholar]
  9. De Figueiredo, D.R.; Azeiteiro, U.M.; Esteves, S.M.; Gonçalves, F.J.M.; Pereira, M.J. Microcystin-producing blooms—A serious global public health issue. Ecotox. Environ. Saf. 2004, 59, 151–163. [Google Scholar] [CrossRef]
  10. Merel, S.; Walker, D.; Chicana, R.; Snyder, S.; Baurès, E.; Thomas, O. State of knowledge and concerns on cyanobacterial blooms and cyanotoxins. Environ. Int. 2013, 59, 303–327. [Google Scholar] [CrossRef] [PubMed]
  11. Pearson, L.; Mihali, T.; Moffitt, M.; Kellmann, R.; Neilan, B. On the chemistry, toxicology, and genetics of the cyanobacterial toxins, microcystin, nodularin, saxitoxin and cylindrospermopsin. Mar. Drugs 2010, 8, 1650–1680. [Google Scholar] [CrossRef] [Green Version]
  12. MacKintosh, R.W.; Dalby, K.N.; Campbell, D.G.; Cohen, P.T.W.; Cohen, P.; MacKintosh, C. The cyanobacterial toxin microcystin binds covalently to cysteine-273 on protein phosphatase 1. FEBS Lett. 1995, 371, 236–240. [Google Scholar]
  13. Sotton, B.; Guillard, J.; Bony, S.; Devaux, A.; Domaizon, I.; Givaudan, N.; Crespeau, F.; Huet, H.; Anneville, O. Impact of Toxic Cyanobacterial Blooms on Eurasian Perch (Perca fluviatilis): Experimental Study and In Situ Observations in a Peri-Alpine Lake. PLoS ONE 2012, 7, e52243. [Google Scholar]
  14. Ma, J.; Feng, Y.; Jiang, S.; Li, X. Altered cellular metabolism of HepG2 cells caused by microcystin-LR. Environ. Pollut. 2017, 225, 610–619. [Google Scholar] [CrossRef] [Green Version]
  15. Oliveira, I.B.; de Silva, H.A. Cellular oxidative stress stimulated by microcystin: Review. Res. Soc. Dev. 2021, 10, e422101119765. [Google Scholar] [CrossRef]
  16. Zambrano, F.; Canelo, E. Effects of microcystin-LR on the partial reactions of the Naþ-Kþ pump of the gill of carp (Cyprinus carpio Linne). Toxicon 2004, 34, 451–458. [Google Scholar] [CrossRef]
  17. Jos, A.; Pichardo, S.; Prieto, A.I.; Repetto, G.; Vázquez, C.M.; Monero, I.; Cameán, A.M. Toxic cyanobacterial cells containing microcystins induce oxidative stress in exposed tilapia fish (Oreochromis sp.) under laboratory conditions. Aquat. Toxicol. 2005, 72, 261–271. [Google Scholar] [CrossRef]
  18. Karjalainen, M.; Engström-Öst, J.; Korpinen, S.; Peltonen, H.; Pääkkönen, J.-P.; Rönkkönen, S.; Suikkanen, S.; Viitasalo, M. Ecosystem Consequences of Cyanobacteria in the Northern Baltic Sea. AMBIO J. Hum. Environ. 2007, 36, 195–202. [Google Scholar] [CrossRef]
  19. Visser, P.M.; Ibelings, B.W.; Bormans, M.; Huisman, J.J.A.E. Artificial mixing to control cyanobacterial blooms: A review. Aquat. Ecol. 2016, 50, 423–441. [Google Scholar] [CrossRef] [Green Version]
  20. Huisman, J.; Codd, G.A.; Paerl, H.W.; Ibelings, B.W.; Verspagen, J.M.; Visser, P.M. Cyanobacterial blooms. Nat. Rev. Microbiol. 2018, 16, 471–483. [Google Scholar] [CrossRef] [PubMed]
  21. Paerl, H.W.; Gardner, W.S.; Havens, K.E.; Joyner, A.R.; McCarthy, M.J.; Newell, S.R.; Quin, B.; Scott, J.T. Mitigating cyanobacterial harmful algal blooms in aquatic ecosystems impacted by climate change and anthropogenic nutrients. Harmful Algae 2016, 54, 213–222. [Google Scholar] [CrossRef] [PubMed] [Green Version]
  22. Piehler, M. Watershed management strategies to prevent and control cyanobacterial harmful algal blooms. In Cyanobacterial Harmful Algal Blooms: State of the Science and Research Needs; Hudnell, H.K., Ed.; Springer: Berlin/Heidelberg, Germany, 2008; pp. 259–273. ISBN 978-0-387-75864-0. [Google Scholar]
  23. Schindler, D.W.; Hecky, R.E.; Findlay, D.L.; Stainton, M.P.; Parker, B.R.; Paterson, M.J.; Beaty, K.G.; Lyng, M.; Kasian, S.E.M. Eutrophication of lakes cannot be controlled by reducing nitrogen input: Results of a 37-year whole-ecosystem experiment. Proc. Natl. Acad. Sci. USA 2008, 105, 11254–11258. [Google Scholar] [CrossRef] [Green Version]
  24. Shao, J.; Li, R.; Lepo, J.E.; Gu, J.-D. Potential for control of harmful cyanobacterial blooms using biologically derived substances: Problems and prospects. J. Environ. Manag. 2013, 125, 149–155. [Google Scholar] [CrossRef] [PubMed]
  25. Bauza, L.; Aguilera, A.; Echenique, R.; Andrinolo, D.; Giannuzzi, L. Application of hydrogen peroxide to the control of eutrophic lake systems in laboratory assays. Toxins 2014, 6, 2657–2675. [Google Scholar] [CrossRef]
  26. Samuilov, V.D.; Timofeev, K.N.; Sinitsyn, S.V.; Bezryadnov, D.V. H2O2-induced inhibition of photosynthetic O2 evolution by Anabaena variabilis cells. Biochemistry 2001, 69, 926–933. [Google Scholar]
  27. Drábková, M.; Admiraal, W.; Marsálek, B. Combined exposure to hydrogen peroxide and light: Selective effects on cyanobacteria, green algae, and diatoms. Environ. Sci. Technol. 2007, 41, 309–314. [Google Scholar] [CrossRef] [PubMed]
  28. Fan, J.; Ho, L.; Hobson, P.; Daly, R.; Brookes, J. Application of various oxidants for cyanobacteria control and cyanotoxin removal in wastewater treatment. J. Environ. Eng. 2014, 140, 04014022. [Google Scholar] [CrossRef]
  29. Lürling, M.; Meng, D.; Faassen, E.J. Effects of hydrogen peroxide and ultrasound on biomass reduction and toxin release in the cyanobacterium, Microcystis aeruginosa. Toxins 2014, 6, 3260–3280. [Google Scholar] [CrossRef] [PubMed] [Green Version]
  30. Huo, X.; Chang, D.W.; Tseng, J.H.; Burch, M.D.; Lin, T.F. Exposure of Microcystis aeruginosa to hydrogen peroxide under light: Kinetic modelling of cell culture rupture and simultaneous microcystin degradation. Environ. Sci. Technol. 2015, 49, 5502–5510. [Google Scholar] [CrossRef]
  31. Barrington, D.J.; Reichwaldt, E.S.; Ghadouani, A. The use of hydrogen peroxide to remove cyanobacteria and microcystins from waste stabilization ponds and hypereutrophic systems. Ecol. Eng. 2013, 50, 86–94. [Google Scholar] [CrossRef]
  32. Matthijs, H.C.P.; Visser, P.M.; Reeze, B.; Meeuse, J.; Slot, P.C.; Wijn, G.; Talens, R.; Huisman, J. Selective suppression of harmful cyanobacteria in an entire lake with hydrogen peroxide. Water Res. 2012, 46, 1460–1472. [Google Scholar] [CrossRef]
  33. Yang, Z.; Buley, P.R.; Fernandez-Figueroa, E.G.; Barros, M.U.G.; Rajendran, S.; Wilson, A.E. Hydrogen peroxide treatment promotes chlorophytes over toxic cyanobacteria in a hyper-eutrophic aquaculture pond. Environ. Pollut. 2018, 240, 590–598. [Google Scholar] [CrossRef]
  34. Mikula, P.; Zezulka, S.; Jancula, D.; Marsalek, B. Metabolic activity and membrane integrity changes in Microcystis aeruginosa–new findings on hydrogen peroxide toxicity in cyanobacteria. Eur. J. Phycol. 2012, 47, 195–206. [Google Scholar] [CrossRef]
  35. Piel, T.; Sandrini, G.; White, E.; Xu, T.; Schuurmans, J.M.; Huisman, J.; Visser, P.M. Suppressing Cyanobacteria with Hydrogen Peroxide Is More Effective at High Light Intensities. Toxins 2020, 12, 18. [Google Scholar] [CrossRef] [Green Version]
  36. Wang, B.; Song, Q.; Long, J.; Song, G.; Mi, W.; Bi, Y. Optimization method for Microcystis bloom mitigation by hydrogen peroxide and its stimulative effects on growth of chlorophytes. Chemosphere 2019, 228, 503–512. [Google Scholar] [CrossRef]
  37. Lusty, M.W.; Gobler, C.J. The Efficacy of Hydrogen Peroxide in Mitigating Cyanobacterial Blooms and Altering Microbial Communities across Four Lakes in NY, USA. Toxins 2020, 12, 428. [Google Scholar] [CrossRef]
  38. Piel, T.; Sandrini, G.; Muyzer, G.; Brussaard, C.P.D.; Slot, P.C.; van Herk, M.J.; Huisman, J.; Visser, P.M. Resilience of Microbial Communities after Hydrogen Peroxide Treatment of a Eutrophic Lake to Suppress Harmful Cyanobacterial Blooms. Microorganisms 2021, 9, 1495. [Google Scholar] [CrossRef]
  39. Oikonomou, A.; Katsiapi, M.; Karayanni, H.; Moustaka-Gouni, M.; Kormas, K. Plankton microorganisms coinciding with two consecutive mass fish kills in a newly reconstructed lake. Sci. World J. 2012, 2012, 504135. [Google Scholar] [CrossRef] [Green Version]
  40. Papadimitriou, T.; Katsiapi, M.; Kormas, K.A.; Moustaka-Gouni, M.; Kagalou, I. Artificially born “killer” lake: Phytoplankton based water quality and microcystin affected fish in a reconstructed lake. Sci. Total Environ. 2013, 452–453, 116–124. [Google Scholar] [CrossRef]
  41. Papadimitriou, T.; Katsiapi, M.; Vlachopoulos, K.; Christopoulos, A.; Laspidou, C.; Moustaka-Gouni, M.; Kormas, K. Cyanotoxins as the “common suspects” for the Dalmatian pelican (Pelecanus crispus) deaths in a Mediterranean reconstructed reservoir. Environ. Pollut. 2018, 234, 779–787. [Google Scholar] [CrossRef] [PubMed]
  42. Levizou, E.; Statiris, G.; Papadimitriou, T.; Laspidou, C.S.; Kormas, K.A. Lettuce facing microcystins-rich irrigation water at different developmental stages: Effects on plant performance and microcystins bioaccumulation. Ecotoxicol. Environ. Saf. 2017, 143, 193–200. [Google Scholar] [CrossRef] [PubMed]
  43. Levizou, E.; Papadimitriou, T.; Papavasileiou, E.; Papadimitriou, N.; Kormas, A.K. Root vegetables bioaccumulate microcystins-LR in a developmental stage dependent manner under realistic exposure scenario: The case of carrot and radish. Agric. Water Manag. 2020, 240, 106274. [Google Scholar] [CrossRef]
  44. Kagalou, I.; Tsimarakis, G.; Patsias, A. Phytoplankton dynamics and physicochemical features in Lake Pamvotis. Fresen. Environ. Bull. 2001, 10, 845–849. [Google Scholar]
  45. Stalikas, C.; Pilidis, G.; Karayannis, M. Heavy metal contents in sediments of the lake Ioannina and Kalamas river in northwestern Greece. Fresen. Environ. Bull. 1994, 3, 575–579. [Google Scholar]
  46. Papadimitriou, T.; Kagalou, I.; Stalikas, C.; Pilidis, G.; Leonardos, I.D. Assessment of microcystin distribution and biomagnification in tissues of aquatic food web compartments from a shallow lake and evaluation of potential risks to public health. Ecotoxicology 2012, 21, 1155–1166. [Google Scholar] [CrossRef] [PubMed]
  47. APHA. Handbook, Standard Methods for the Examination of Water and Wastewater, 21st ed.; American Public Health Association: Washington, DC, USA; American Water Works Association: Denver, CO, USA; Water Environment Federation: Alexandria, VI, USA, 2005. [Google Scholar]
  48. Papadimitriou, T.; Kormas, K.; Dionysiou, D.D.; Laspidou, C. Using H2O2 treatments for the degradation of cyanobacteria and microcystins in a shallow hypertrophic reservoir. Environ. Sci. Pollut. Res. Int. 2016, 23, 21523–21535. [Google Scholar] [CrossRef] [PubMed]
  49. Allen, A.O.; Hochanadel, C.J.; Ghormley, J.A.; Davis, R.W. Decomposition of water and aqueous solutions under mixed fast neutron and gamma radiation. J. Phys. Chem. 1952, 56, 575–586. [Google Scholar] [CrossRef]
  50. Zapomělova, E.; Jezberová, J.; Hrouzek, P.; Hisem, D.; Reháková, K.; Komárková, J. Polyphasic characterization of three strains of Anabaena reniformis and Aphanizomenon aphanizomenoides (cyanobacteria) and their reclassification to Sphaerospermum gen. nov. (incl. Anabaena kisseleviana). J. Phycol. 2010, 46, 415. [Google Scholar] [CrossRef]
  51. Utermöhl, H. Zur Vervollkommung der quantitativen Phytoplankton-Methodik. Mitt. Int. Ver. Theor. Angew. Limnol. 1958, 9, 1–38. [Google Scholar]
  52. Katsiapi, M.; Moustaka, M.; Michaloudi, E.; Kormas, A.K. Phytoplankton and water quality in a Mediterranean drinking-water reservoir (Marathonas Reservoir, Greece). Environ. Monit. Assess 2011, 185, 563–575. [Google Scholar] [CrossRef]
  53. Jeffrey, S.W.; Humphrey, G.F. New spectrophotometric equations for determining chlorophylls a, b, c1 and c2 in higher plants, algae and natural phytoplankton. Biochem. Physiol. Pflanz. 1975, 167, 191–194. [Google Scholar] [CrossRef]
  54. Sarada, R.; Pillai, M.G.; Ravishankar, G.A. Phycocyanin from Spirulina sp.: Influence of processing of biomass on phycocyanin yield, analysis of efficacy of extractionmethods and stability studies on phycocyanin. Process Biochem. 1999, 34, 795–801. [Google Scholar] [CrossRef]
  55. Mellios, N.; Kofinas, D.; Laspidou, C.; Papadimitriou, T. Mathematical modeling of trophic state and nutrient flows of Lake Karla using the PCLake model. Environ. Process 2015, 2, 85–100. [Google Scholar] [CrossRef] [Green Version]
  56. Kotak, B.G.; Lam, A.K.Y.; Prepas, E.E. Variability of the hepatotoxin microcystin-LR in hypereutrophic drinking water lakes. J. Phycol. 1995, 31, 248–263. [Google Scholar] [CrossRef]
  57. Jouni, S. Current Trophic Status of Lake Karla, Greece, and Proposals for Remediation. Master’s Thesis, University of Edinburgh, Edinburgh, UK, 2011; p. 67. [Google Scholar]
  58. Chamoglou, M.; Papadimitriou, T.; Kagalou, I. Keys-Descriptors for the Functioning of a Mediterranean Reservoir: The Case of a New Lake Karla-Greece. Environ. Process 2014, 1, 127–135. [Google Scholar] [CrossRef] [Green Version]
  59. Weenink, F.J.; Luimstra, V.M.; Schuurmans, J.M.; van Herk, M.J.; Visser, P.M.; Matthijs, H.C.P.; Magalhaes, V.F.; Pestana, C.J.; Edwards, C.; Lawton, L.A.; et al. Combatting cyanobacteria with hydrogen peroxide: A laboratory study on the consequences for phytoplankton community and diversity. Front. Microbiol. 2015, 6, 714. [Google Scholar] [CrossRef] [PubMed] [Green Version]
  60. Santos, A.A.; Guedes, D.O.; Barros, M.U.; Oliveira, S.; Pacheco, A.B.; Azevedo, S.M. Effect of hydrogen peroxide on natural phytoplankton and bacterioplankton in a drinking water reservoir: Mesocosm-scale study. Water Res. 2021, 197, 117069. [Google Scholar] [CrossRef] [PubMed]
  61. Arvin, E.; Pedersen, L.-F. Hydrogen peroxide decomposition kinetics in aquaculture water. Aquac. Eng. 2015, 64, 1–7. [Google Scholar] [CrossRef]
  62. Pflaumer, L.A. Hydrogen Peroxide in Eutrophic Lake Taihu, China: Addition Effects on Phytoplankton and Diel Variability in Natural Concentrations. Ph.D. Thesis, The University of North Carolina, Chapel Hill, NC, USA, 2006. [Google Scholar]
  63. Sinhá, A.K.; Eggleton, M.A.; Lochmann, R.T. An environmentally friendly approach for mitigating cyanobacterial bloom and their toxins in hypereutrophic ponds: Potentiality of a newly developed granular hydrogen peroxide-based compound. Sci. Total Environ. 2018, 637–638, 524–537. [Google Scholar] [CrossRef]
  64. Barroin, G.; Feuillade, M. Hydrogen-peroxide as a potential algicide for Oscillatoria-Rubescens Dc. Water Res. 1986, 20, 619–623. [Google Scholar] [CrossRef]
  65. Drabkova, M.; Matthijs, H.C.P.; Admiraal, W.; Marsalek, B. Selective effects of H2O2 on cyanobacterial photosynthesis. Photosynthetica 2007, 45, 363–369. [Google Scholar] [CrossRef]
  66. Latifi, A.; Ruiz, M.; Zhang, C.C. Oxidative stress in cyanobacteria. FEMS Microbiol. Rev. 2009, 33, 258–278. [Google Scholar] [CrossRef] [Green Version]
  67. Mustila, H.; Ermakova, M.; Bersanini, L.; Richaud, P.; Ajlani, G.; Battchikova, N.; Cournac, L.; Aro, E.-M. Flavodiiron proteins Flv1 and Flv3 enable cyanobacterial growth and photosynthesis under fluctuating light. Proc. Natl. Acad. Sci. USA 2013, 110, 4111–4116. [Google Scholar]
  68. Passardi, F.; Zamocky, M.; Favet, J.; Jakopitsch, C.; Penel, C.; Obinger, C.; Dunand, C. Phylogenetic distribution of catalase-peroxidases: Are there patches of order in chaos? Gene 2007, 397, 101–113. [Google Scholar] [CrossRef]
  69. Wu, Z.; Gan, N.; Huang, Q.; Song, L. Response of Microcystis to copper stress—Do phenotypes of Microcystis make a difference in stress tolerance? Environ. Pollut. 2007, 147, 324–330. [Google Scholar] [CrossRef] [PubMed]
  70. Golubić, S. Zwei wichtige Merkmale zur Abgrenzung der Blaualgengattungen. Schweiz. Z. Hydrol. 1967, 29, 176–184. [Google Scholar] [CrossRef]
  71. Hadjoudja, S.; Vignoles, C.; Deluchat, V.; Lenain, J.F.; Jeune, A.H.; Baudu, M. Short term copper toxicity on Microcystis aeruginosa and Chlorella vulgaris using flow cytometry. Aquat. Toxicol. 2009, 94, 255–264. [Google Scholar] [CrossRef]
  72. Gao, L.; Pan, X.; Zhang, D.; Mu, S.; Lee, D.J.; Halik, U. Extracellular polymeric substances buffer against the biocidal effect of H2O2 on the bloom-forming cyanobacterium Microcystis aeruginosa. Water Res. 2015, 69, 51–58. [Google Scholar] [CrossRef]
  73. Schuurmans, J.M.; Brinkmann, B.W.; Makower, A.K.; Dittmann, E.; Huisman, J.; Matthijs, H.C.P. Microcystin interferes with defense against high oxidativestress in harmful cyanobacteria. Harmful Algae 2018, 78, 47–55. [Google Scholar] [CrossRef]
  74. Bernroitner, M.; Zamocky, P.; Furtmüller, G.; Günter, A.; Peschek, C.; Obinger, C. Occurrence, phylogeny, structure, and function of catalases and peroxidases in cyanobacteria. J. Exp. Bot. 2009, 60, 423–440. [Google Scholar] [CrossRef] [Green Version]
  75. Spoof, L.; Jaakkola, S.; Važić, T.; Häggqvist, K.; Kirkkala, T.; Ventelä, A.-M.; Kirkkala, T.; Svirčev, Z.; Meriluoto, J. Elimination of cyanobacteria and microcystins in irrigation water—Effects of hydrogen peroxide treatment. Environ. Sci. Pollut. Res. 2020, 27, 8638–8652. [Google Scholar] [CrossRef] [PubMed] [Green Version]
  76. Mellios, N.; Papadimitriou, T.; Laspidou, C. Predictive modeling of microcystin concentrations in a hypertrophic lake by means of Adaptive Neuro Fuzzy Inference System (ANFIS). Eur. Water 2016, 55, 91–103. [Google Scholar]
  77. Watanabe, M. Isolation, cultivation, and classification of bloom forming Microcystis in Japan. In Toxic Microcystis; Watanabe, M.F., Harada, K., Carmichael, W.W., Fujiki, H.P., Eds.; CRC Press: Boca Raton, FL, USA, 1996; pp. 13–34. [Google Scholar]
  78. Rastogi, R.P.; Sinha, R.P.; Incharoensakdi, A. The cyanotoxin-microcystins: Current overview. Rev. Environ. Sci. Biotech. 2014, 13, 215–249. [Google Scholar] [CrossRef]
  79. Bradt, S.; Villena, M.J. Detection of microcystins in the coastal lagoon La Albufera de Valencia, Spain by an enzyme-linked immunosorbent assay (E.L.I.S.A.). Limnetica 2002, 20, 187–196. [Google Scholar]
  80. Cooper, W.J.; Shao, C.W.; Lean, D.R.S.; Gordon, A.S.; Scully, F.E. Factors affecting the distribution of H2O2 in surface waters. In Environmental Chemistry of Lakes and Reservoirs; Baker, L.A., Ed.; American Chemical Society: Washington, DC, USA, 1994; Volume 237, pp. 391–422. [Google Scholar]
  81. Dziga, D.; Wasylewski, M.; Wladyka, B.; Nybom, S.; Meriluoto, J. Microbiological degradation of microcystins. Chem. Res. Toxicol. 2013, 26, 841–852. [Google Scholar] [CrossRef] [PubMed]
  82. Harada, K.I.; Tsuji, K. Persistence, and decomposition of hepatotoxic microcystins produced by cyanobacteria in natural environment. J. Toxicol. Toxin Rev. 1998, 17, 385–403. [Google Scholar] [CrossRef]
  83. Meinertz, J.R.; Greseth, S.L.; Gaikowski, M.P.; Schmidt, L.J. Chronic toxicity of hydrogen peroxide to Daphnia magna in a continuous exposure, fow-through test system. Sci. Total Environ. 2008, 392, 225–232. [Google Scholar] [CrossRef] [PubMed]
  84. Sinha, A.K.; Romano, N.; Shrivastava, J.; Monico, J.; Bishop, W.M. Oxidative stress, histopathological alterations, and antioxidant capacity in different tissues of largemouth bass (Micropterus salmoides) exposed to a newly developed sodium carbonate peroxyhydrate granular algaecide formulated with hydrogen peroxide. Aquat. Toxicol. 2020, 218, 105348. [Google Scholar] [CrossRef]
  85. Sandrini, G.; Piel, T.; Xu, T.; White, E.; Qin, H.; Slot, P.C.; Huisman, J.; Visser, P.M. Sensitivity to hydrogen peroxide of the bloom-forming cyanobacterium Microcystis PCC 7806 depends on nutrient availability. Harmful Algae 2020, 99, 101916. [Google Scholar] [CrossRef] [PubMed]
Figure 1. Map of Greece with study areas (Karla Reservoir and Lake Pamvotis) by Google Earth.
Sustainability 14 00123 g001
Figure 2. (A) Degradation rates of H2O2 over time in unfiltered and filtered water samples from the Karla Reservoir and Lake Pamvotis. (B). H2O2 concentration in water samples from the Karla Reservoir and Lake Pamvotis over time.
Sustainability 14 00123 g002
Figure 3. Biomass (mg/L) of cyanobacteria in the control and treated samples (4 mg/L H2O2) over time (hours) in Karla Reservoir water samples.
Sustainability 14 00123 g003
Figure 4. Initial biomass (time zero) and biomass (mg/L) of (A) Raphidiopsis (Cylindrospermopsis) raciborskii, (B) Aphanizomenon favaloroi, (C) Planktolyngbya limnetica, and (D) Chroococcus sp. in the control and treated samples (4 mg/L H2O2) over time (hours) in Karla Reservoir water samples. The asterisk indicates statistically significant differences in comparison with the control (p < 0.05).
Sustainability 14 00123 g004
Figure 5. Micrographs of the Karla Reservoirs’ water samples: (A) Control sample (initial), (B) Treated sample, 5 h after the beginning of the experiment, (C) Treated sample, 72 h after the beginning of the experiment, (D) Treated sample, 144 h after the beginning of the experiment.
Sustainability 14 00123 g005
Figure 6. Biomass (mg/L) of (A) Cyanobacteria, (B) Chlorophytes, (C) Diatoms, and (D) Cryptophytes in the control and treated samples (4 mg/L H2O2) over time (hour) in water samples from Lake Pamvotis.
Sustainability 14 00123 g006
Figure 7. Initial biomass (time zero) and biomass (mg/L) of different species of Microsystis: (A) Microcystis aeruginosa, (B) Microcystis wesenbergii, (C) Microcystis panniformis, in the control and treated samples (4 mg/L H2O2) over time (hour) in water samples from Lake Pamvotis. The asterisk indicates statistically significant differences in comparison with the control (p < 0.05).
Sustainability 14 00123 g007
Figure 8. Micrographs of Lake Pamvotis’ water samples: (A) Control sample (initial) and (B) Treated sample 144 h after the beginning of the experiment.
Sustainability 14 00123 g008
Figure 9. Chl a and phycocyanin concentrations in control and H2O2-treated water samples (4 mg/L) from (A) the Karla Reservoir and (B) Lake Pamvotis over time.
Sustainability 14 00123 g009
Figure 10. Variation of intra-cellular, extra-cellular, and total MCYSTs concentrations in: (A) the Karla Reservoir and (B) Lake Pamvotis in the control and treated samples (4 mg/L H2O2) over time (hour).
Sustainability 14 00123 g010
Table 1. Chemical-physical parameters and pigment and MCYST content of the Karla Reservoir and Lake Pamvotis before the experiment.
ParametersKarla ReservoirLake Pamvotis
Temperature (°C)23.522.4
Dissolved Oxygen (mg/L)8.008.10
pH9.048.85
Conductivity
(m S/cm)
3.211.97
Nitrate (mg/L)0.570.68
Nitrite (mg/L)0.020.03
Ammonium (mg/L)1.561.28
SRP (mg/L)0.320.25
Pigments
Chl a (μg/L)250570
Phycocyanin (μg/L)4561256
MCYSTs
Intra-cellular (μg/L)5.458.10
Extra-cellular (μg/L)3.655.21
Table 2. Total biomass (mg/L) of phytoplankton in the Karla Reservoir and Lake Pamvotis.
Lake Pamvotis (mg/L)Karla Reservoir (mg/L)
Cyanobacteria
Microcystis spp. (single cells)8.17
Microcystis aeruginosa (colonies)81.88
Microcystis wesenbergii (colonies)42.60
Microcystis panniformis (colonies)17.35
Raphidiopsis (Cylindrospermopsis) raciborskii 21.72
Aphanizomenon favaloroi 23.88
Planktolyngbya limnetica 1.55
Chroococcus sp. 1.91
Chlorophytes
Scenedesmus spp.0.07<0.01
Monoraphidium contortum
Monoraphidium minutum
Monoraphidium spp.
0.01
0.006
0.01
Diatoms
Small centric diatoms0.08<0.01
Aulacoseira granulata
Nitzschia spp.
0.20
0.37<0.01
Cryptophytes
Rhodomonas minuta0.68<0.01
Publisher’s Note: MDPI stays neutral with regard to jurisdictional claims in published maps and institutional affiliations.

