1. Introduction
Work-related musculoskeletal diseases (WMSDs) are occupational safety and health problems that affect not only the health in terms of work-related disabilities and lost time injuries but also the productivity of the workplace due to absences and substantial treatment costs [
1]. Many cases of WMSDs are underreported [
2,
3,
4,
5]. The prevalence of WMSD varies according to industries and occupations. Workers in some industries (for instance, construction industries) may be exposed to a greater risk of WMSDs [
6,
7,
8,
9].
Although there is progress in the use of modern equipment and technology in Malaysia, the Malaysian construction industry records a significant portion of nonfatal and fatal accidents, and the rate of such accidents has not noticeably reduced [
10,
11]. In 2015, the construction industry was reported to have the highest number of accident-related deaths in Malaysia. Among the occupational disease cases recorded between 2010 and 2015, a total of 708 cases were reported as occupational musculoskeletal diseases [
12].
1.1. Problem Statement
Several risk factors for hand-related musculoskeletal diseases have been identified among manual workers, including forceful repetitive movements, heavy lifting, and improper use of power tools [
13]. Heavy machinery operators are exposed to more subtle stressors, such as excessive time spent on sitting in a cab, whole-body vibration from the heavy machinery, high-resistance lever designs, repetitive motions of the hand, and awkward working postures [
14].
Although some control levers might be designed based on ergonomic principles for ease of use, operators are still at risk of overestimating their grip force when handling control levers for heavy machinery movement transmissions. Such control lever handling activities often involve pushing and pulling actions. In some studies, excessive push–pull activities and high grip force exertions have been identified as serious risk factors in the development of WMSDs [
15,
16].
While researchers have examined the risk factors for musculoskeletal diseases, there appear to be no studies specifically investigating the hand grip analysis of heavy machinery control levers in consideration of some of these risk factors. Therefore, this preliminary study aims to investigate the hand grip analysis for a heavy machinery control lever system, with an emphasis on some risk factors for hand WMSDs. Concerning heavy machinery, this study opts to explore the wheel loader, as it is a common heavy machinery used in Malaysia. There are two research objectives for this study:
To design and develop a mechanical system that emulates the push–pull operations of wheel loader control lever systems.
To perform an ergonomics analysis concerning the effects of push–pull operations, resistance level, and handle shape on grip force when moving the wheel loader control lever.
1.2. Hand-Related Musculoskeletal Disorder
Musculoskeletal diseases (MSDs) of the upper extremities can be classified into four areas, namely the shoulder, elbow, hand, and wrist [
6]. Researchers investigating the prevalence of musculoskeletal complaints in the general working population found that women had a higher incidence of upper extremity musculoskeletal complaints than men [
17]. An investigation of 996 construction workers found that MSD symptoms are commonly experienced in the hand. The same investigation revealed that women experienced these MSD symptoms more frequently (59.7%) than men (41.4%) [
18]. Another study on 410 engineers found that the prevalence of hand-related MSDs was around 30%, with close to 3% of these workers missing out on work due to MSD problems [
13].
1.3. Pushing and Pulling Activities
In ergonomics research, pushing and pulling can be described as acts of exerting force on another object using the hands, with a major part of the resultant force being exerted horizontally [
19]. In pushing activities, the force of the hand is directed away from the body, whereas, in pulling activities, the force is directed toward the body.
Pushing and pulling are also associated with musculoskeletal complaints such as lower back and shoulder pain. In addition to accident-induced MSDs (such as slippages), a push and pull force that exceeds the maximum exertion of the shoulder can cause an overexertion of the musculoskeletal system [
20]. Some of the risk factors used in measuring the exposure of individuals to push and pull activities include intensity, frequency, and duration [
21].
Das and Wang [
22] concluded that an individual’s maximum isometric push and pull strengths are affected by elbow angle, reach envelope, and working position. In addition, Di Domizio and Keir [
23] found that the push and pull forces are affected by the posture of the forearm. They also suggested that pushing and pulling with a coupled grip would alter muscle activity in the forearm but not in the shoulder.
Although repetitive manoeuvring of heavy machinery control levers involves pushing and pulling hand movements, this activity is often overlooked as a risk factor for WMSDs due to the small magnitude of load. However, Kumar [
24] mentioned that small loads sustained over a long period of time could still increase the risk of WMSDs due to the cumulative loading and gradual reduction in tissue tolerance. Therefore, it is still important for researchers to study the changes in the grip force when manoeuvring heavy machinery control levers.
1.4. Overexertion
In manual handling, the musculoskeletal system is vulnerable to overexertion injuries when pushing or pulling activities force people to exceed their reach to grasp limits [
25]. Overexertion injuries from manual handling have been reported to be significant risk factors for workplace injuries [
26]. A study involving 49 crane and earthmoving operators found that manual handling of heavy machinery, such as excavator buckets, grader blades, and cranes, accounted for 14 overexertion injuries, with an average severity of 4.5 [
27].
Everett [
28] identified some generic risk factors associated with overexertion injuries, such as repetitive exertions, static exertions, localised mechanical stress, and vibration. These risk factors are relatable with the manoeuvring of control levers that require repetitive hand movements while maintaining an appropriate posture within the cab affected by whole-body vibrations from heavy machinery.
1.5. Grip Posture
Successful grasping and handling of objects depends on the precise control of the grip to satisfy the task specifications and the properties of the grasped object, such as shape, size, material, and position relative to the body [
29,
30]. The wrist and finger joints work together to create a natural and secure grip [
31].
When handling tasks with high force requirements, the use of the entire hand with a secure posture and fully enveloped grip is required [
32]. One of the grips that meets this requirement includes the power grip. Although other grip techniques might still be used if the control lever or handle shape is different, it is common to use a power grip when handling control levers. The size or diameter of the handle can affect the operators’ grip posture if the operators are required to grip in an awkward posture repetitively for a long period of time. Such a condition can result in a weaker grip force and can eventually lead to MSDs.
1.6. Left-Handedness
Approximately 10% of the world’s population is left-handed [
33]. Most tools and workstations are generally designed for right-handed people. Oftentimes, left-handed people are forced to use their nondominant hand in controlling, handling, or manoeuvring objects.
Hand grip strength is also different among the left- and right-handed populations. Researchers found that 48% of left-handed people exerted a higher grip force when using their nondominant hand (right hand), as contrasted to the 6.9% of right-handed people. This finding suggested that the dominant hand would be stronger, since it is exercised more frequently compared to the nondominant hand on a daily basis [
34].
According to Taras, et al. [
35], left-handed individuals are 4.9 times more likely to experience a traumatic amputation than right-handed individuals. In view of such a severe consequence, it is important to consider left-handedness in the operation of heavy machineries, since the operators may be unaccustomed to using their nondominant hands to control the machines. This handedness-related unfamiliarity may lead to hand slippages and cause workplace errors and injuries. If the injuries are traumatic, the left-handed personnel may even face total permanent disability. Handedness-related errors with heavy machineries such as excavators, bulldozers, or cranes may even endanger the safety of the public at large. To prevent these issues, left-handedness should be accommodated in the design of heavy machinery control levers. Therefore, this study opts to focus its investigation on left-handed individuals.
1.7. Perceived Grip Exertion
Perceived grip exertion is an estimated measurement of actual grip exertion through a psychophysical approach. It is an assumption of human sense. One of the ways to rate perceived exertion is by using the Borg CR10 scale [
36]. Although there have been studies on causes pertaining to WMSDs, the measurement of direct grip force for certain manual tasks such as hand tool operations and lever controls can be challenging [
37]. This predicament exists because there are limitations in measuring grip force due to customisations that are often required for the mounting of force transducers onto tools or the attachment of force sensors onto fingers. These methods can interfere with the user’s regular work patterns and cause a reduction in efficiency [
38]. Therefore, investigators use an alternative method such as perceived exertion to estimate the exertions of the grip force.
A list of past studies that investigated the relationship between actual and perceived exertion is shown in
Table 1. The researchers concluded that the perceived force measurement method is more conventional and inexpensive in estimating grip force for complex tasks.
1.8. Control Levers in Heavy Machinery
A control lever is commonly used in heavy machinery to manoeuvre different attachments such as buckets, forklifts, and booms. A control lever can be categorised into two major types, namely the linear lever that can only move in a single axis (forward or backward to control a single function) and a joystick that can move in two axes to control two functions simultaneously (forward, backwards, and sideways). Hoffmann and Chan [
40] mentioned that control selection problems can exist among operators when there are multiple controls for a machine.
1.8.1. Problems with the Linear Lever
In a linear lever system, multiple levers may be required, as a single linear lever might only control a single function. The problem occurs when all controls are arranged in a single line on the control panel. There is a high possibility that an incorrect selection is made for a control of a particular function, which could lead to accidents at the work site. The length and shape coding of the control levers are done with the intention of reducing such errors. However, Steiner and Burgess-Limerick [
41] suggested that there is no evidence on the efficacy of length and shape coding in reducing selection error rates during the task performance of manoeuvring control levers.
1.8.2. Problems with the Joystick
Joysticks can be designed to be multifunctional. For some cases, only one or two of such joysticks are arranged on the control panel. Although these joysticks are relatively simple to control, there are different control patterns across different operation codes [
42]. For instance, the ISO (International Organisation for Standardisation) control pattern is different compared to the SAE (Society of Automotive Engineers) control pattern regarding the left and right hands of the operator. Hence, operators might face difficulties with different control pattern arrangements when switching to machines that use different codes.
1.8.3. Control Lever of Wheel Loader
Wheel loaders are heavy machinery used in a variety of applications, including civil and building construction, material handling, agriculture, and waste handling. When operators use the control lever to control the wheel loader, they perform repetitive hand movements in a static working posture [
43].
From an ergonomics perspective, there are a number of variables that can affect the hand force of operators, such as button-pressing, manoeuvring of the control lever, control lever height, control lever shape, and control lever resistance level. In the current study, primary considerations are given to variables such as handle shape, movement activity, and resistance level, because these variables can be effectively tested with the experiment. These variables can be tested with different combinations, such as cylindrical and spherical handles (handle shape), push–pull actions (movement activity), and high–low resistance levels (resistance level).
1.9. Discomfort in Heavy Machinery Work
According to Hägg, et al. [
44], anything that appears to be a dynamic working activity, such as manipulating levers with a forward abducted stance, can actually be a static task from a physiological point of view. There is a chance of static workload injuries even when operators work with only a small actuating force, which might appear insignificant to them at first.
A hypothesis known as the Cinderella hypothesis explains how low forces can cause injuries. The first activated muscle units are the ones that require the least amount of force, such as fine motor precision function. However, these muscle units remain active for a long time, even when a large force is required. Therefore, more muscle units are activated. According to the hypothesis, muscle fibres are the first to be damaged [
45]. A high-demanding cognitive workload, limb control, visual intake, and vibrations are risk factors related to discomfort. In some heavy machinery work, workers are required to perform hand-operated tasks rapidly and repeat precise movements for long periods of time. Such actions increase the pressure on the entire arm.
1.10. Patent Review
Safety device for control levers of construction machines [
46]: This invention includes a safety feature that is adapted to a construction machinery with hydrostatic transmission. The safety feature can automatically force the control lever to return to its neutral position if the operator removes his hands from the lever, thus stopping the operation movement of the machinery. The structure is simple, easy to manufacture, and inexpensive.
Control lever assembly [
47]: This invention comprises a control lever guide detent mechanism and a centring spring to force the control lever back to its neutral position. The main function of the guide detent mechanism is to retain the control lever in various detent positions to allow the sensing circuit to track and generate an electrical signal to the control valves.
Control lever with an automatic “return to original” position [
48]: This invention is related to the miniature control unit that is normally used in cranes. The assembly is compact and easily controlled without much resistance to rotate in two axes.
Control lever assembly and mounting apparatus [
49]: Complex designs are often needed to provide lever positioning stops and operational detents while mounting a control lever used to operate a machine or its implements. This invention includes a control lever mounted inside a housing by a plurality of non-metallic bearing members in the mounting apparatus of the invention. The bearing member is pressed against the control lever on at least one side. A recess is also integrally shaped in the bearing member to resist movement of the control lever and to indicate when the control lever approaches a point.
2. Methodology
The conceptualisation process includes the combination of features extracted from journals, patents, and existing products. In the context of the presented research approach, three concepts will be presented and scored to select the final one.
2.1. Concept 1
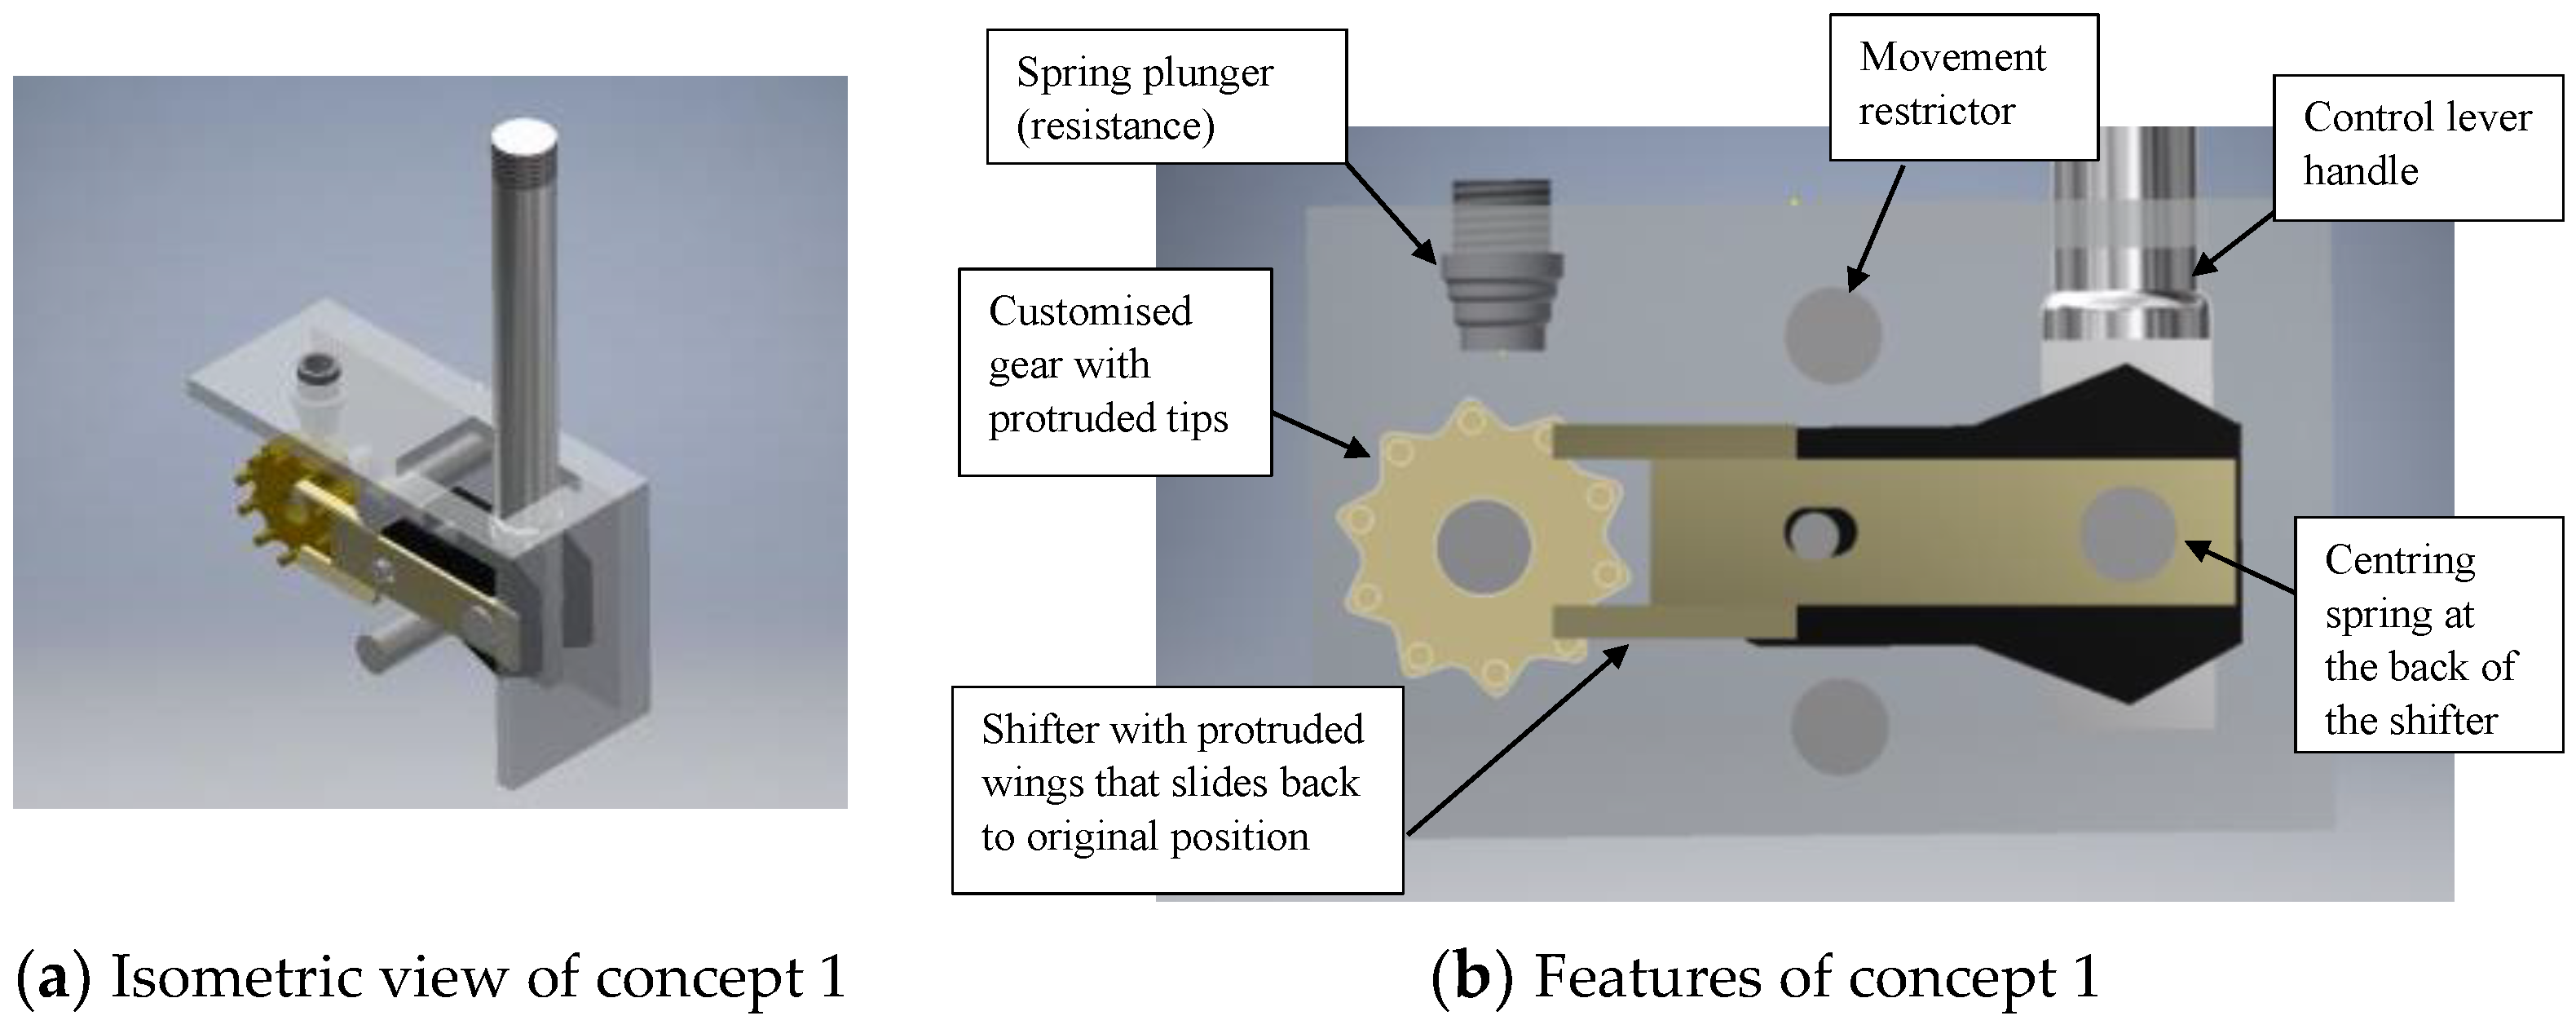
Figure 1 shows the isometric view and the important features of concept 1. The wings of the shifter are in contact with the protruded tips of the gear. When the control lever is pulled rearward (towards the customised gear), the shifter wing moves in the upward direction and shifts the gear counter-clockwise. The control lever slides back into its original position automatically with the help of the centring spring on the back of the shifter and vice versa. The spring plunger provides additional resistance to the control lever. The movement restrictor is designed to limit additional movements from the shifter and eventually limit the operating angle of the control lever.
2.2. Concept 2
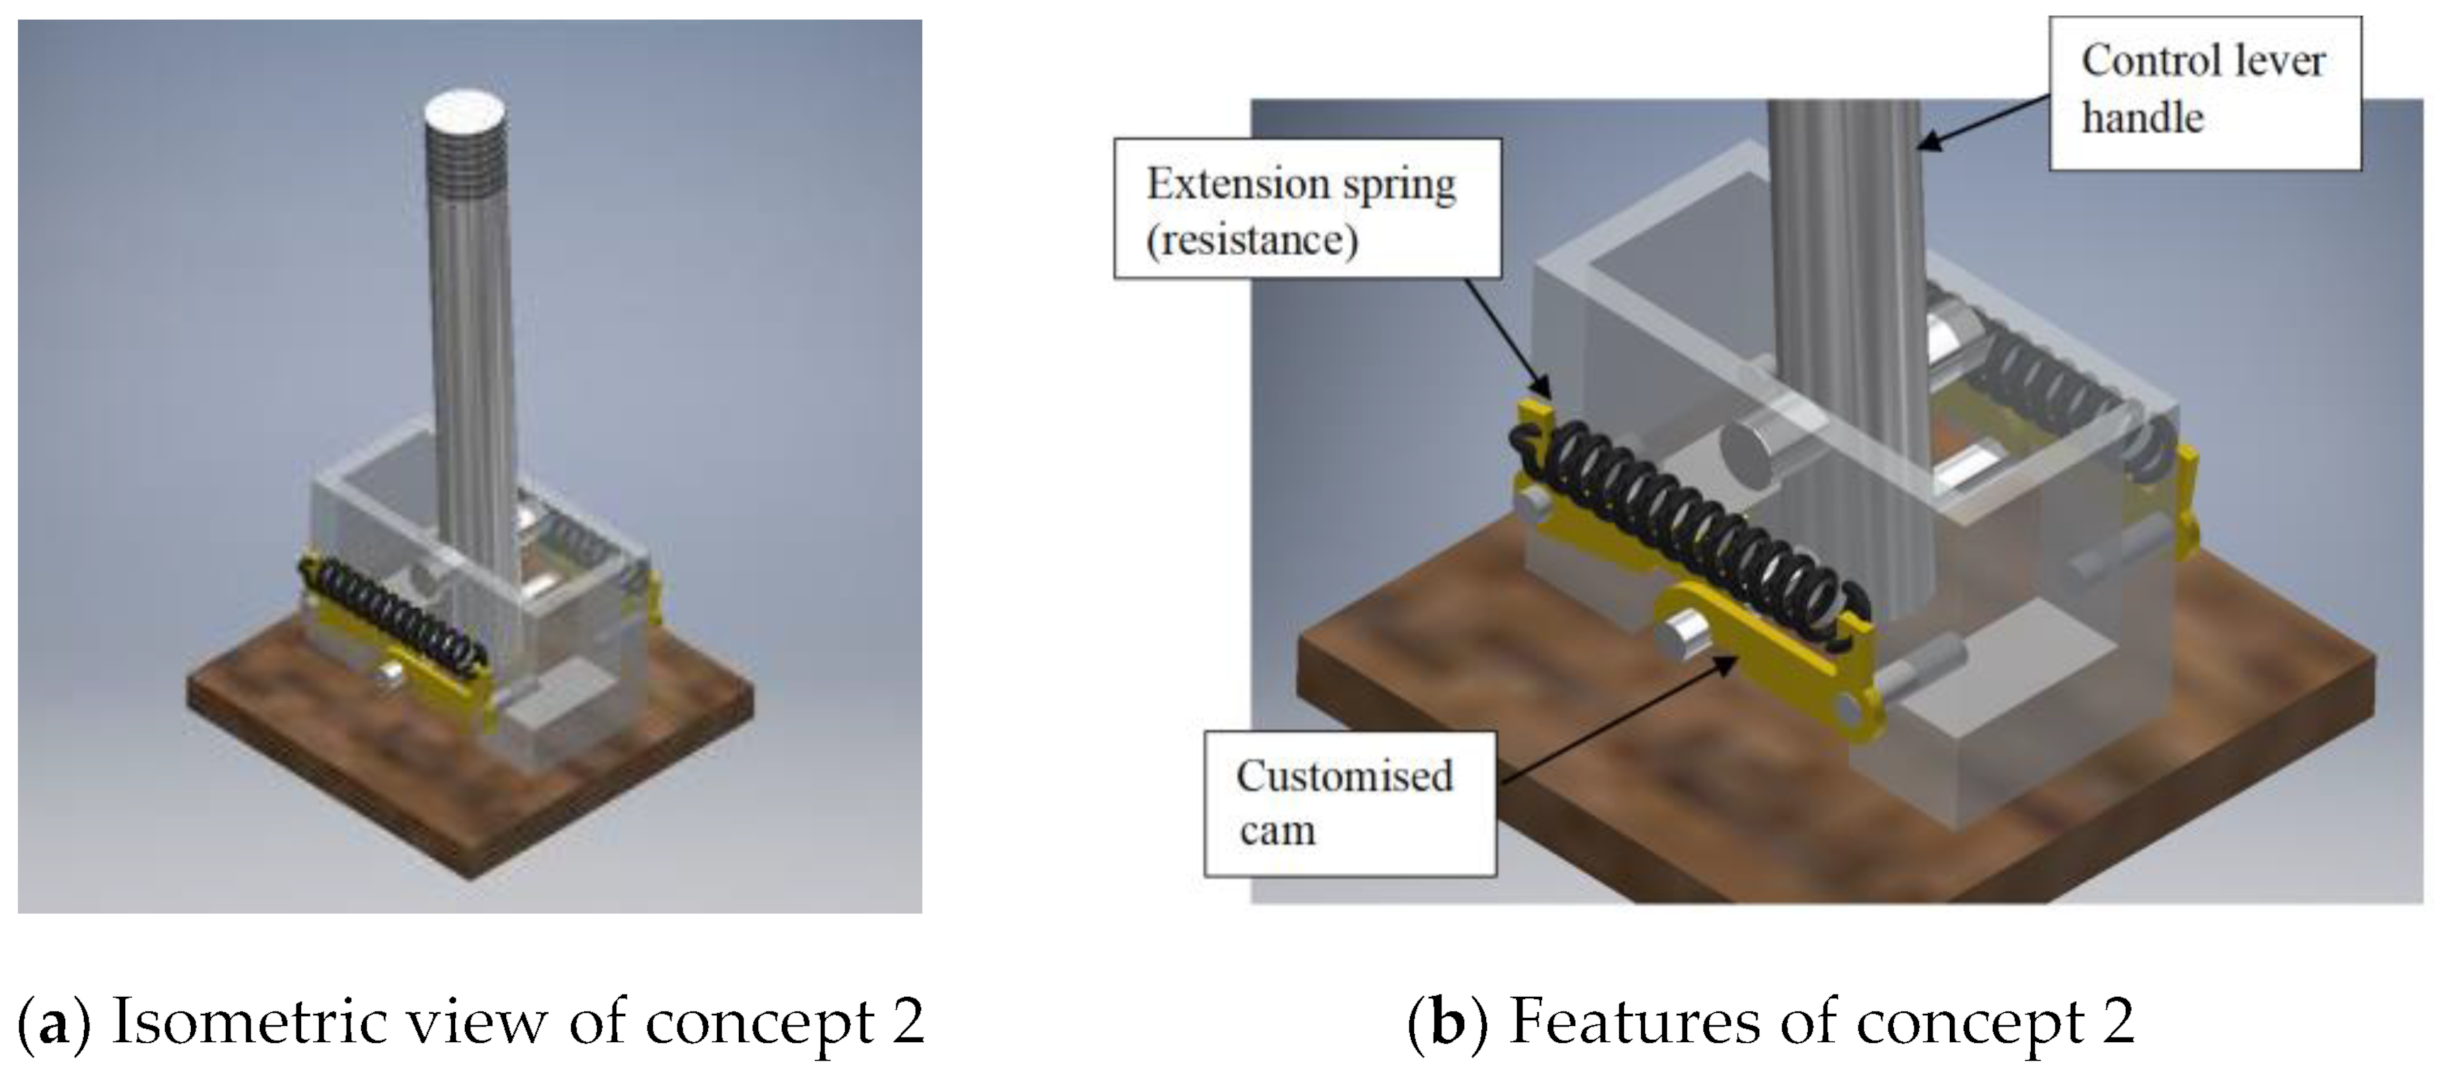
Figure 2 shows the isometric view and the important features of concept 2. The protruded shaft of the control lever handle moves in a flat U-shaped direction when the control lever handle is pushed or pulled. The cam is designed to possess grooves so that the protruded shaft can move smoothly. The extension spring connecting the cams on both sides forces the control lever back to its original position.
2.3. Concept 3
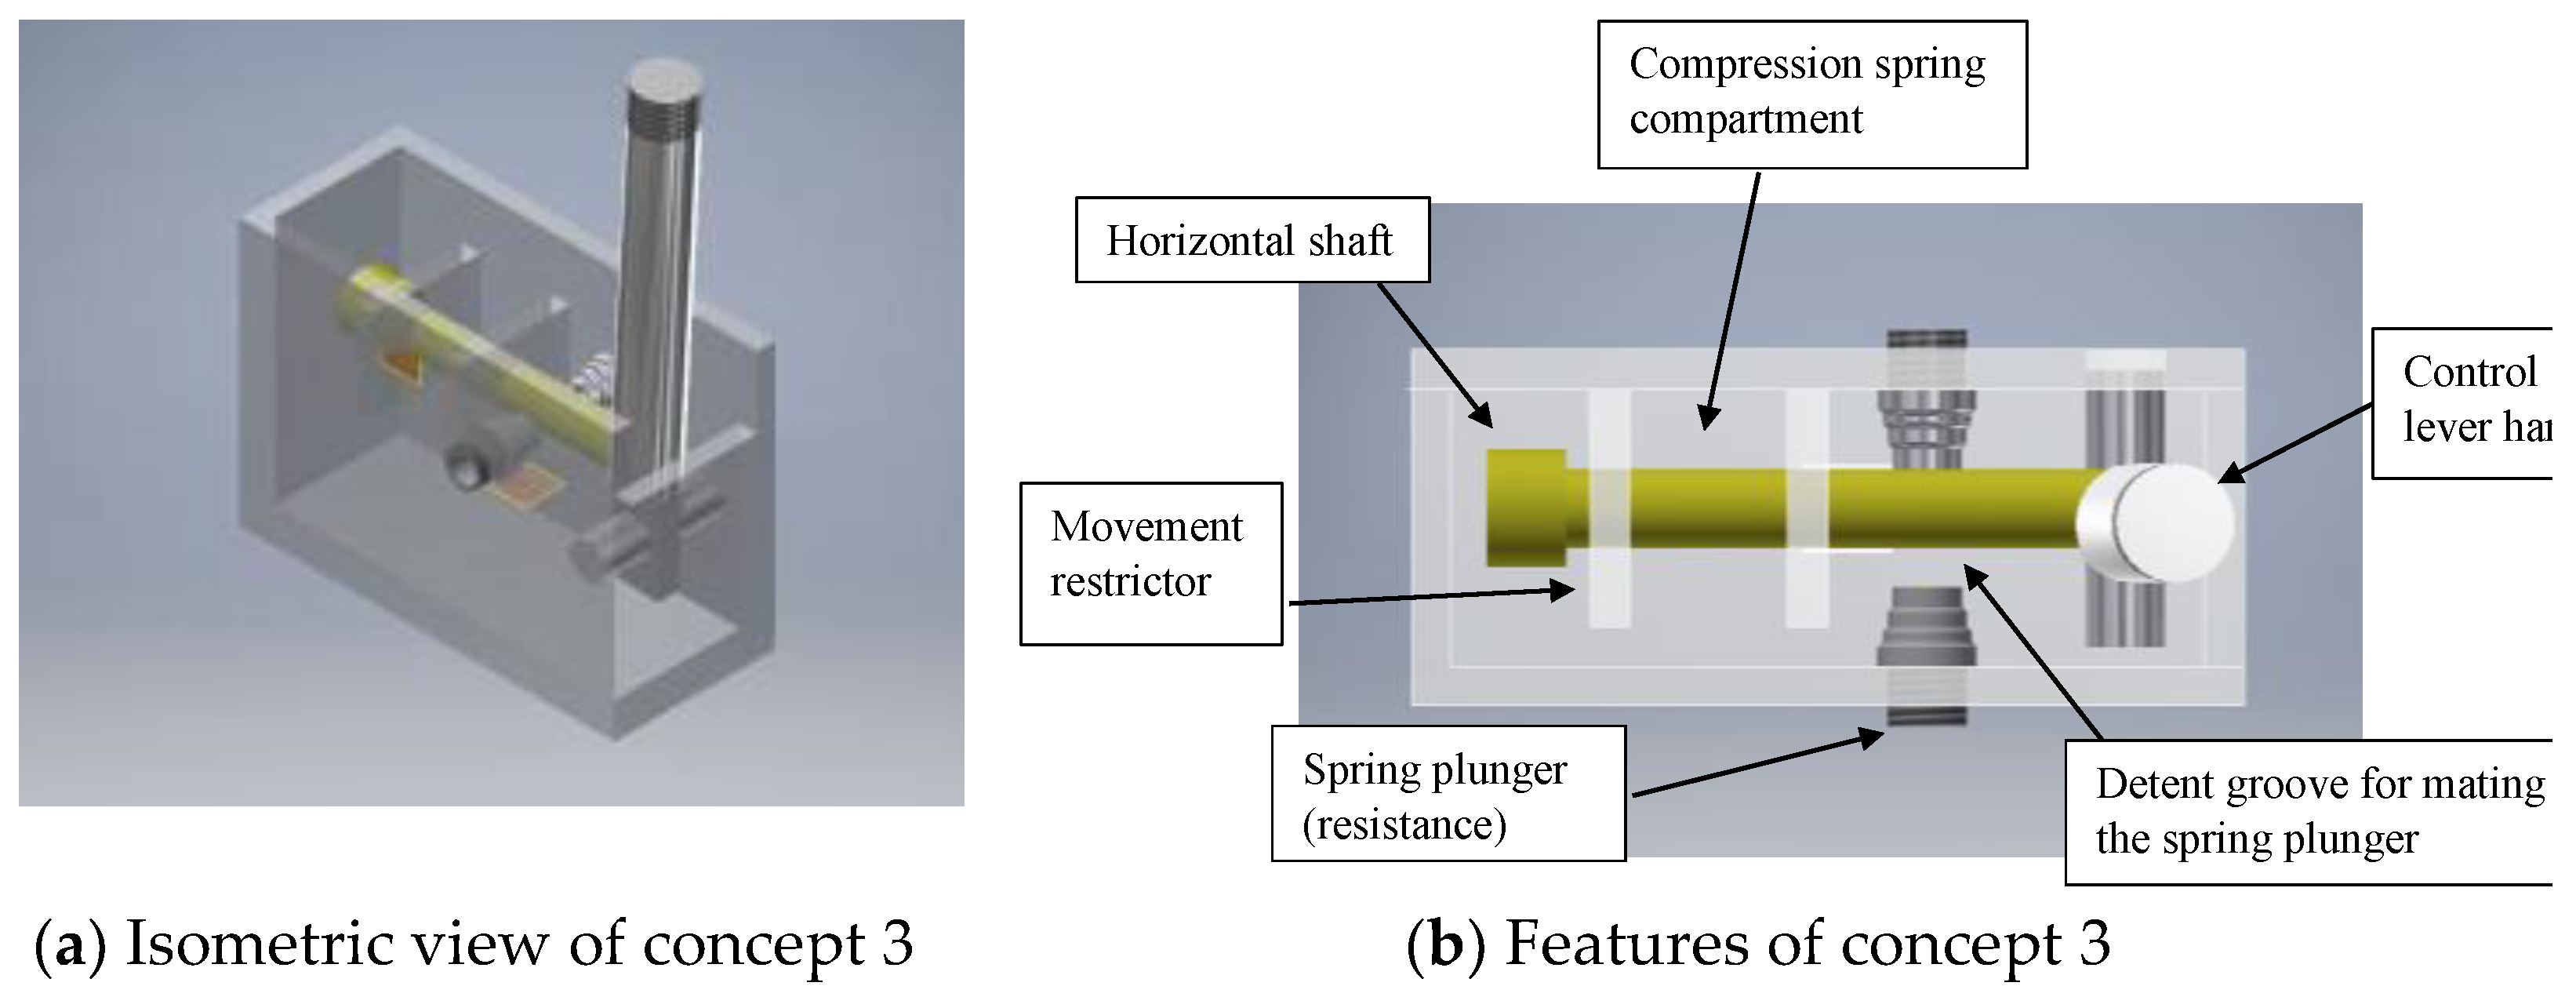
Figure 3 shows the isometric view and the important features in concept 3. The horizontal shaft is designed to be linked to the control lever handle. The horizontal shaft moves forward when the control lever is pulled backwards and vice versa. The spring plunger provides additional resistance to the control lever. The compression spring forces the horizontal shaft and control lever back to their original positions after a push or pull motion. The movement restrictor is designed to limit any additional movements from the shifter and to eventually limit the operating angle of the control lever.
2.4. Concept Scoring
The most suitable concept is chosen through a scoring method. The score is calculated according to the weight distribution of each criterion and the rating score (see
Table 2). The rating system used for the scoring process ranged from 1 to 5, and the description for each rating is defined as such:
Ease of maintenance and cost: This criterion expectation is subject to the researchers’ expertise and the constraints of this project, such as time and budget limitations. This criterion is used to restrict the project from exceeding its expected timeline and budget. The methods used to design and fabricate the prototype also need to be within the ability and expertise of the researchers to save time.
Ease of manufacturing: There may still be a risk that some overlooked problems from the design stage are noticed in the fabrication stage. The investigators need to account for such a possibility. Simplifying the design for future amendments is one of the methods to overcome such an issue. Design for manufacturing and assembly (DFMA) is an approach that simplifies a design so that it can be manufactured more efficiently with minimal cost and time [
50]. This aspect can be controlled by a criterion known as ease of manufacturing. This criterion is given a higher weight compared to the previous criterion.
Resistance mechanism: The resistance mechanism is important in differentiating the analysis of resistance effects on the hand grip force analysis. Old machines with mechanical controls often have manual control levers operated with high resistance rather than modern control levers operated with hydraulic aids [
51]. Since this criterion is one of the analysing aspects of the project, it is given a weightage of 30%.
Self-returning mechanism: A self-returning mechanism that allows the control lever to automatically return to its original position is also an important criterion in the design of a control lever system. This criterion prevents the movement of certain controls in a direction that would increase unsafe loading [
52]. Therefore, this criterion is given a weightage of 25%.
Tactile feedback: This criterion is important in giving the user a tactile feeling of the control lever position so that the user could exert force securely without experiencing any slippage. This criterion is given a weight of 10%.
Advantages and disadvantages of concepts: Based on the selection criteria, concept 1 has a primary advantage in the resistance mechanism from the design of its spring plunger that can be altered to accommodate different resistance levels through spring compression. This concept also has the upper hand regarding the self-returning mechanism of its shifter design with protruding wings and a spring that allows the return of the whole control lever to its original position. The customised gear with protruded tips also gives the design an added advantage in terms of tactile feedback. However, this concept is complex and costly, as it requires more parts for its manufacturing and assembly.
Concept 2 is a simple gimbal design that has the advantages in ease of manufacturing, ease of maintenance, and cost, since the design only requires a few parts for its manufacturing and assembly. It is complex in terms of the design of its customised cam, which requires precision machining for the grooves. The mechanism might not work smoothly if the cam is not machined precisely. The design of the resistance mechanism makes it difficult to alter the resistance levels as a change in different spring stiffness would be required. Although the self-returning system is not as effective as compared to concept 1, it still allows for the return of the control lever to its original position smoothly.
Concept 3 scored higher than the other concepts on average. Its resistance mechanism is akin to the one proposed for concept 1 (with a spring plunger). Similar to concept 2, the self-returning mechanism uses a compression spring in the spring compartment to allow for the return of the whole shaft to its original position. The tactile feedback is scored between concept 1 and concept 2. Most importantly, concept 3 is aligned with the DFMA objective, which is to produce a design that is simple, flexible, and capable of performing its intended function. Therefore, based on the suitability and rank in the concept scoring matrix, concept 3 is chosen as the finalised concept.
2.5. Dimension Estimation
The dimension of the control lever system is estimated by benchmarking three existing products, namely the Leverstak CH400 [
53], YK1A Universal Control Lever [
54], and P35S Directional Control [
55].
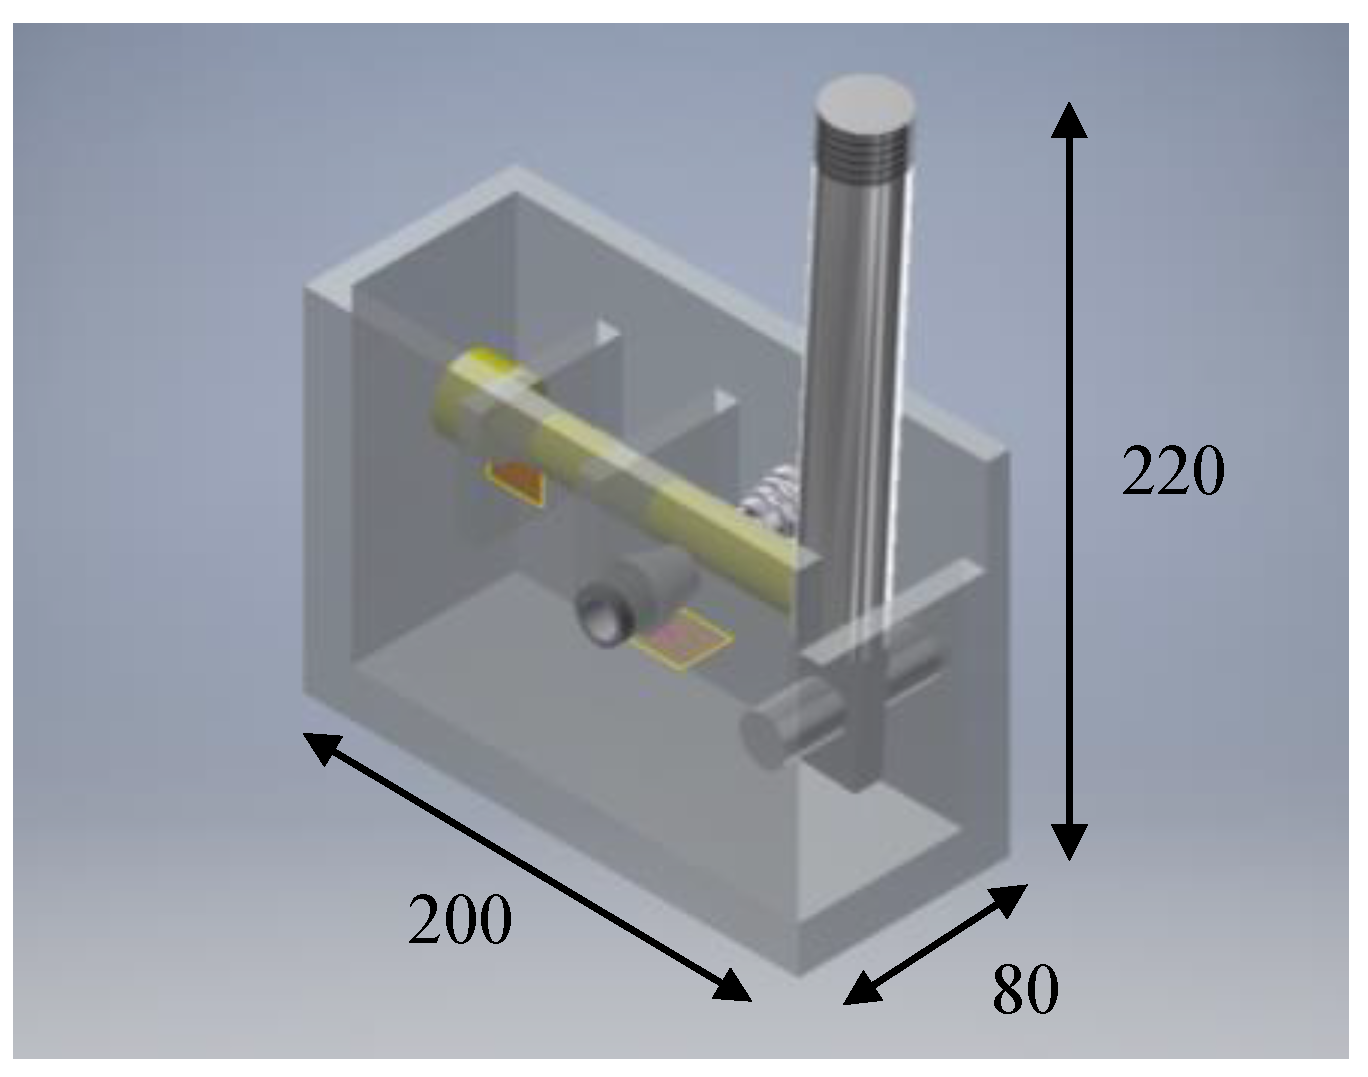
Table 3 shows the estimated dimension and mass of the control lever system. The estimated dimensions for length, width, and height are 200 mm, 80 mm, and 220 mm, respectively. These values are referenced when designing the mechanical system.
The body is modelled with the estimated dimensions so that the other parts, such as the shaft diameter, spring plunger, compression spring, and horizontal shaft, can be included.
Figure 4 illustrates the dimension of the control lever system. The diagram shown is not drawn to scale, and the units are in millimetres (mm).
2.6. Mechanical Analysis
After accounting for material selection using the Ashby chart, carbon steel was chosen as the material for the frame, shaft, and bracket, while PLA was chosen as the material for the handle. Stress analysis was performed using Autodesk Inventor 2019. The reaction force on the frame was required for the stress analysis. Based on the ISO10968: 2004 Earth-Moving Machinery standard, the recommended actuating force for a control lever should be between 20 N and 230 N in forward or backward movements, as shown in
Table 4 [
56]. The indicated values are meant to be achieved during movement before any engagement in a detent position. In the stress simulation, a normal actuating force of 80 N (F
N = 80 N) is used to observe the stress distribution in the bracket.
2.6.1. Axial Force from Spring Plunger
Since the assembly is designed with a spring plunger, the axial force of the spring plunger is also added to the actuating force. The spring plunger is in contact with a detent. The following is the calculation of the axial force (F
x) of a single spring plunger, assuming that the angle of the indexing counterpart face is 90° (α = 90°), and the spring force from the product table is 24 N (F = 24 N).
The spring plunger is designed to be on both sides of the frame, providing additional resistance. Thus, a total of 48 N is used in the stress simulation.
2.6.2. Compression Spring Design for Static Loading
Based on the following calculation, the load that the compression spring needs to support is the maximum total actuating force (F
max), which is calculated as 128 N with the spring plunger. The maximum deflection (y
max) is assumed to be 10 mm.
The constants for estimating the tensile strength (
) of music wire with an estimated wire diameter of 3 mm are as follows:
where E—Young’s modulus and G—shear modulus.
The maximum allowable tolerance for the diameter is set at 2 mm. The compression spring is designed to be over a rod, and the design calculations for static loading are as follows:
where d—wire diameter, d
rod—rod diameter, allow—maximum allowable tolerance for diameter, and K
B—Bergsträsser correction factor.
Table 5 shows the results for different wire diameters (from 2 to 3 mm). Based on the calculations, the most suitable compression spring was selected. The shaded parts within the table indicate values outside the range of the recommended values. A few design conditions are used to limit the design solution, such as the spring index constraint C (between 4 and 12), the active coil number (between 3 and 15), and the buckling criterion
, which should not exceed the critical length,
. The free length of the spring must be designed to fit a bracket that occupies a 30-mm-wide space. Thus, the free length must be shorter than 30 mm. The criterion of
eliminates the choices of diameters that exceed 2.4 mm. The factor of the safety
is exactly 1.2. Since the compression spring is designed to be over a rod, the inner diameter must be larger than the rod diameter, which is 12 mm. Thus, a wire diameter of 2.3 mm is chosen for the compression spring design, as the calculated free length is close to 30 mm.
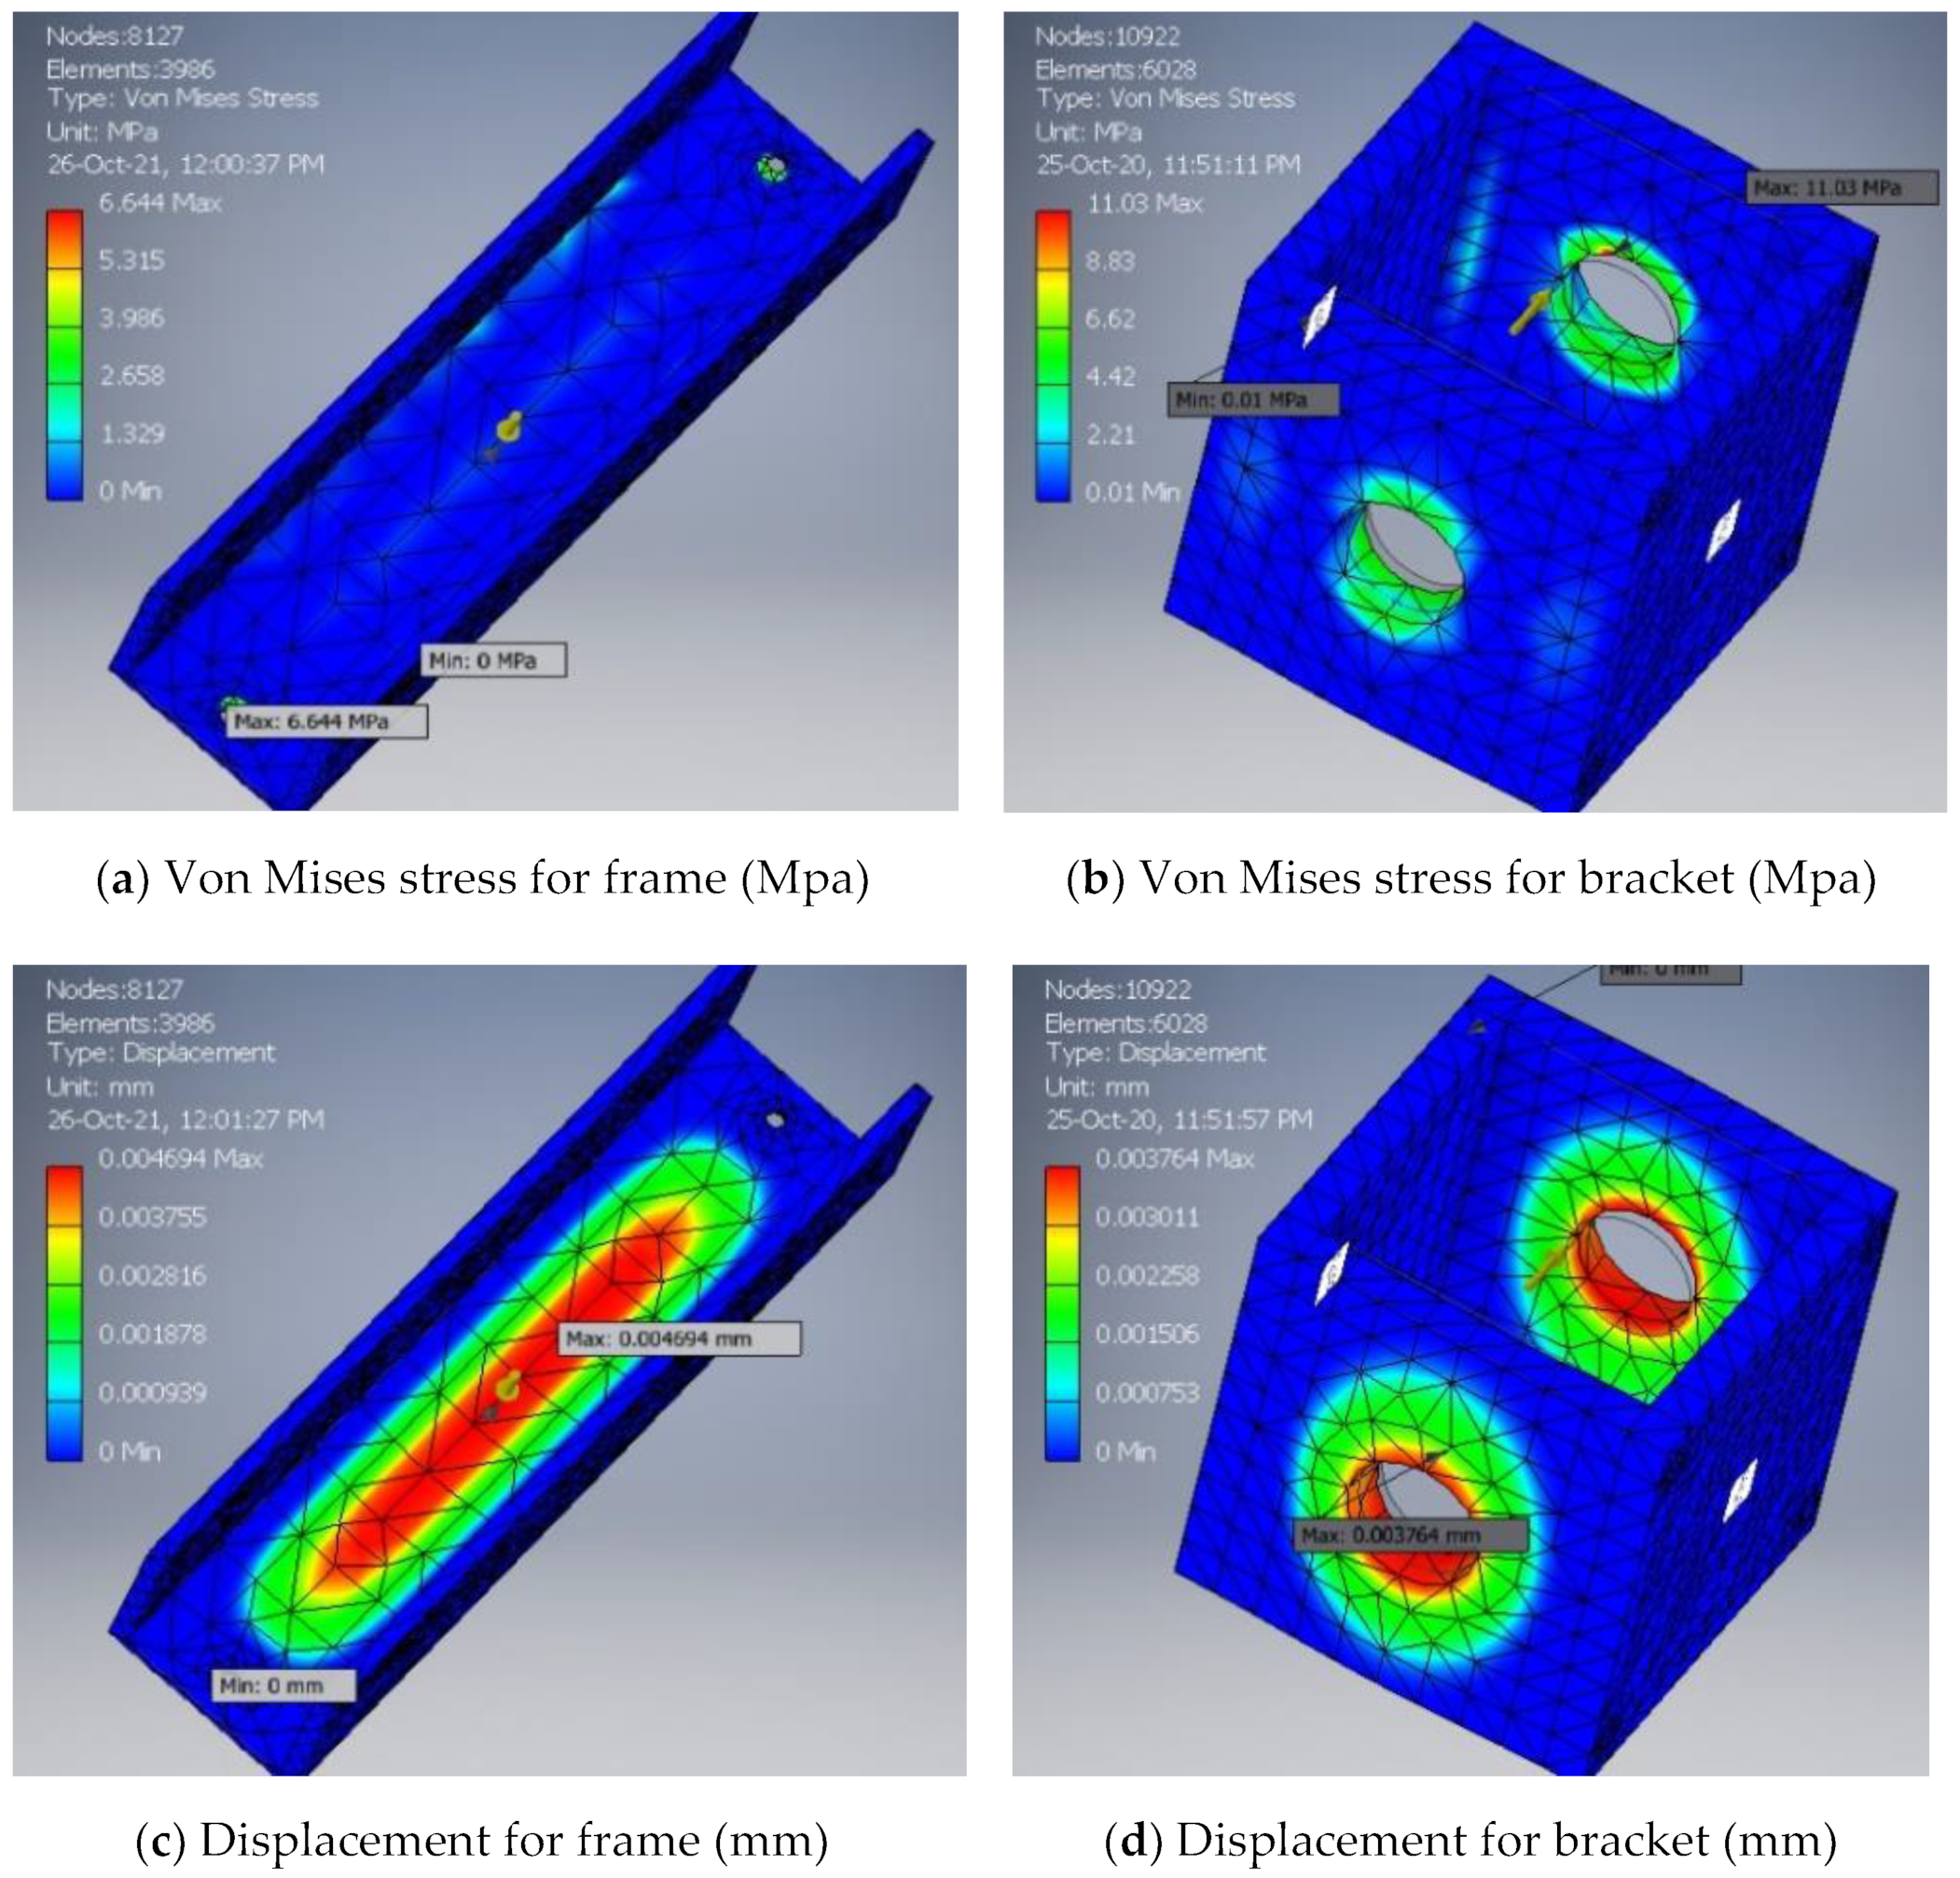
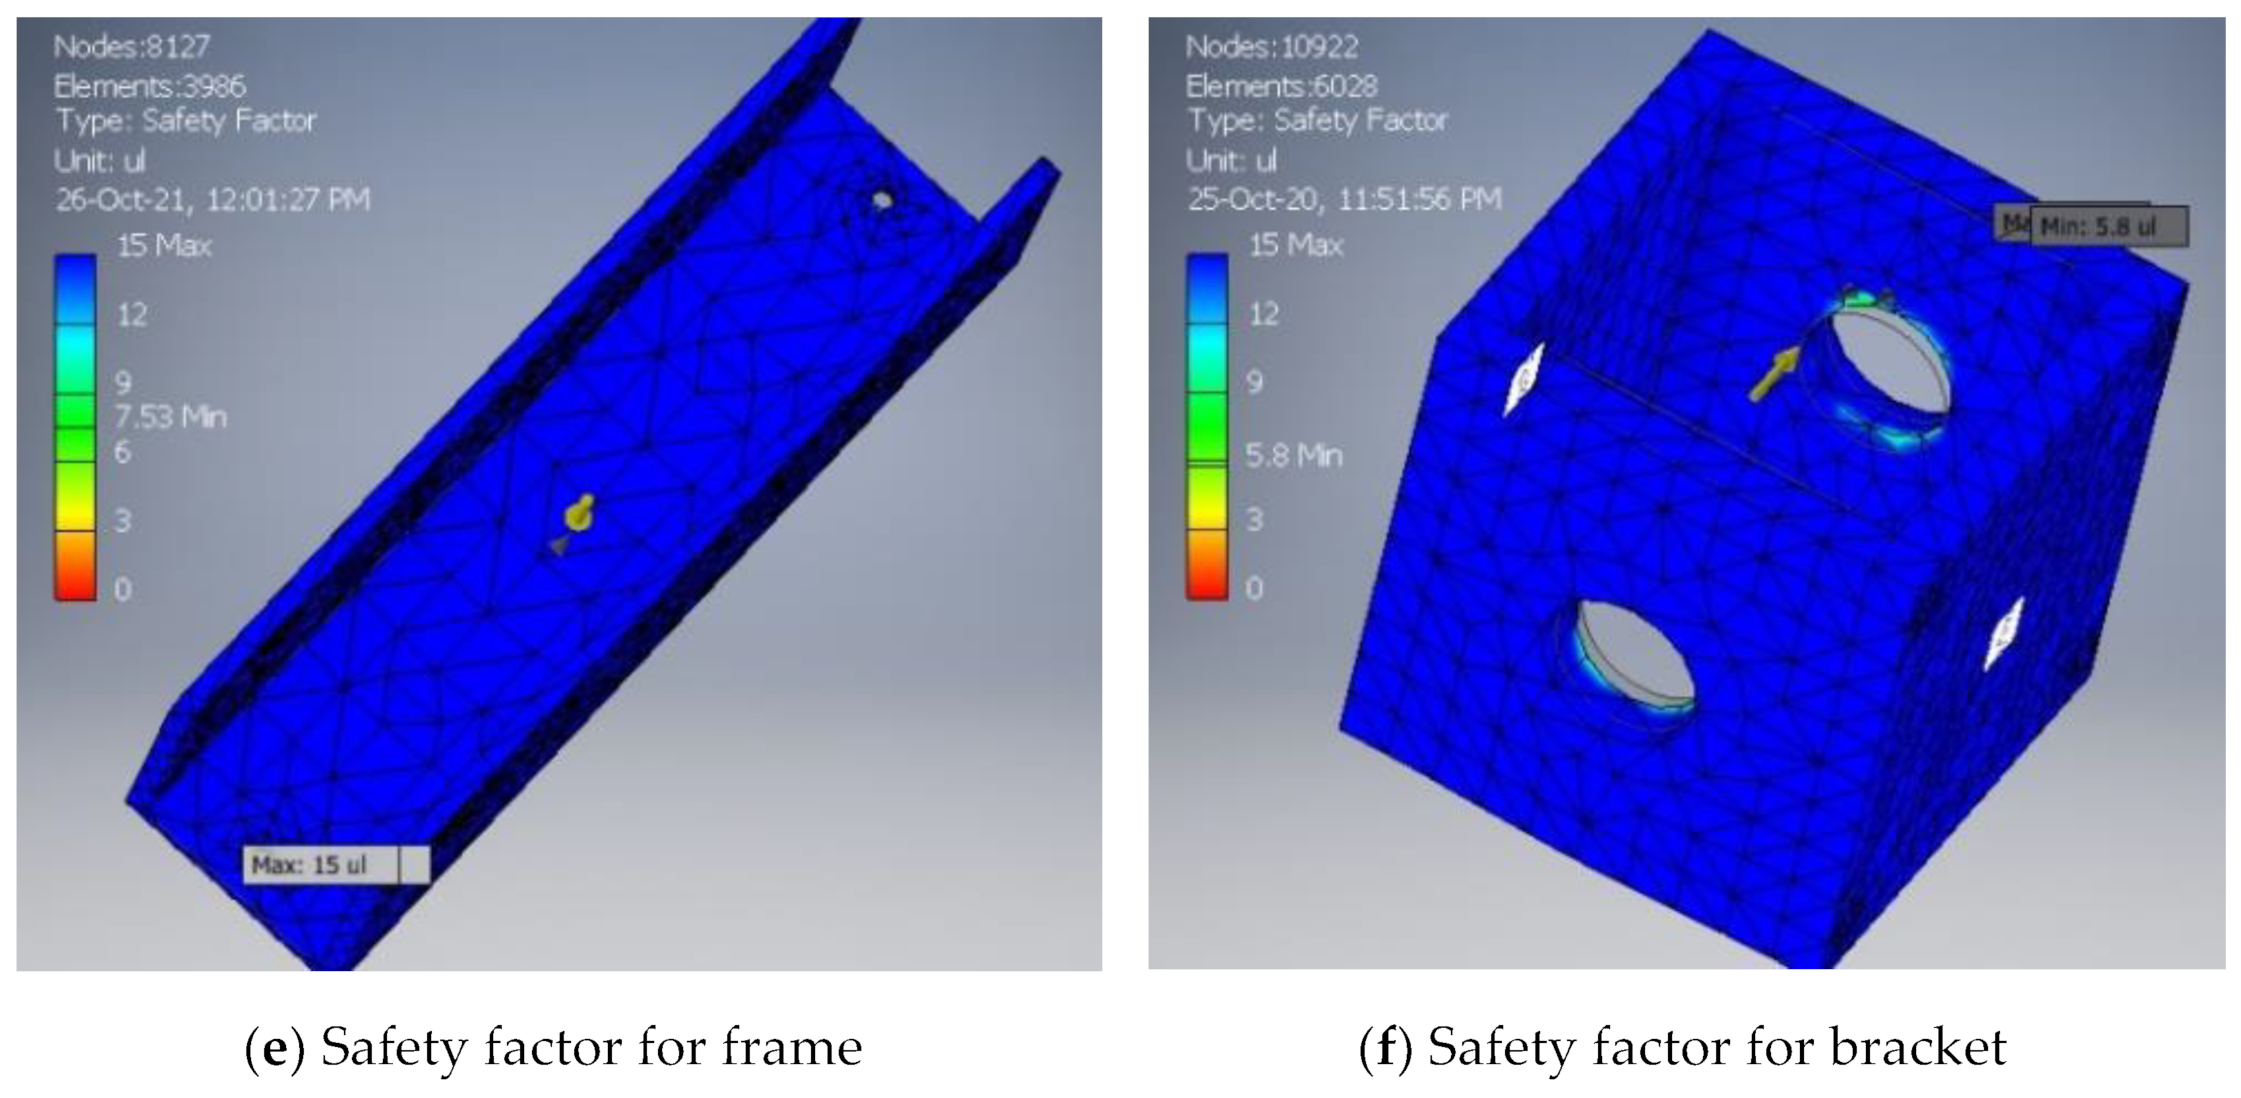
2.6.3. Simulation and Optimisation of Current Design
The preliminary simulations found that the safety factors for stress analyses were significantly greater than 1. This finding shows that there is an extent of overengineering in the design of the frame and bracket. To optimise the design, the dimensions of the design were modified (by reducing the thickness), and the stress analyses were repeated to inspect the safety factor.
Table 6 shows the comparison of the simulation results before and after the optimisation of different parts of the control lever.
Figure 5 shows the stress simulation diagrams for the finalised prototype. With the reduced safety factor, the maximal von Mises stress still did not exceed the tensile strength of the material, and the maximum deflection was still small compared to the size of the bracket and frame. Therefore, the optimised design was considered structurally safe.
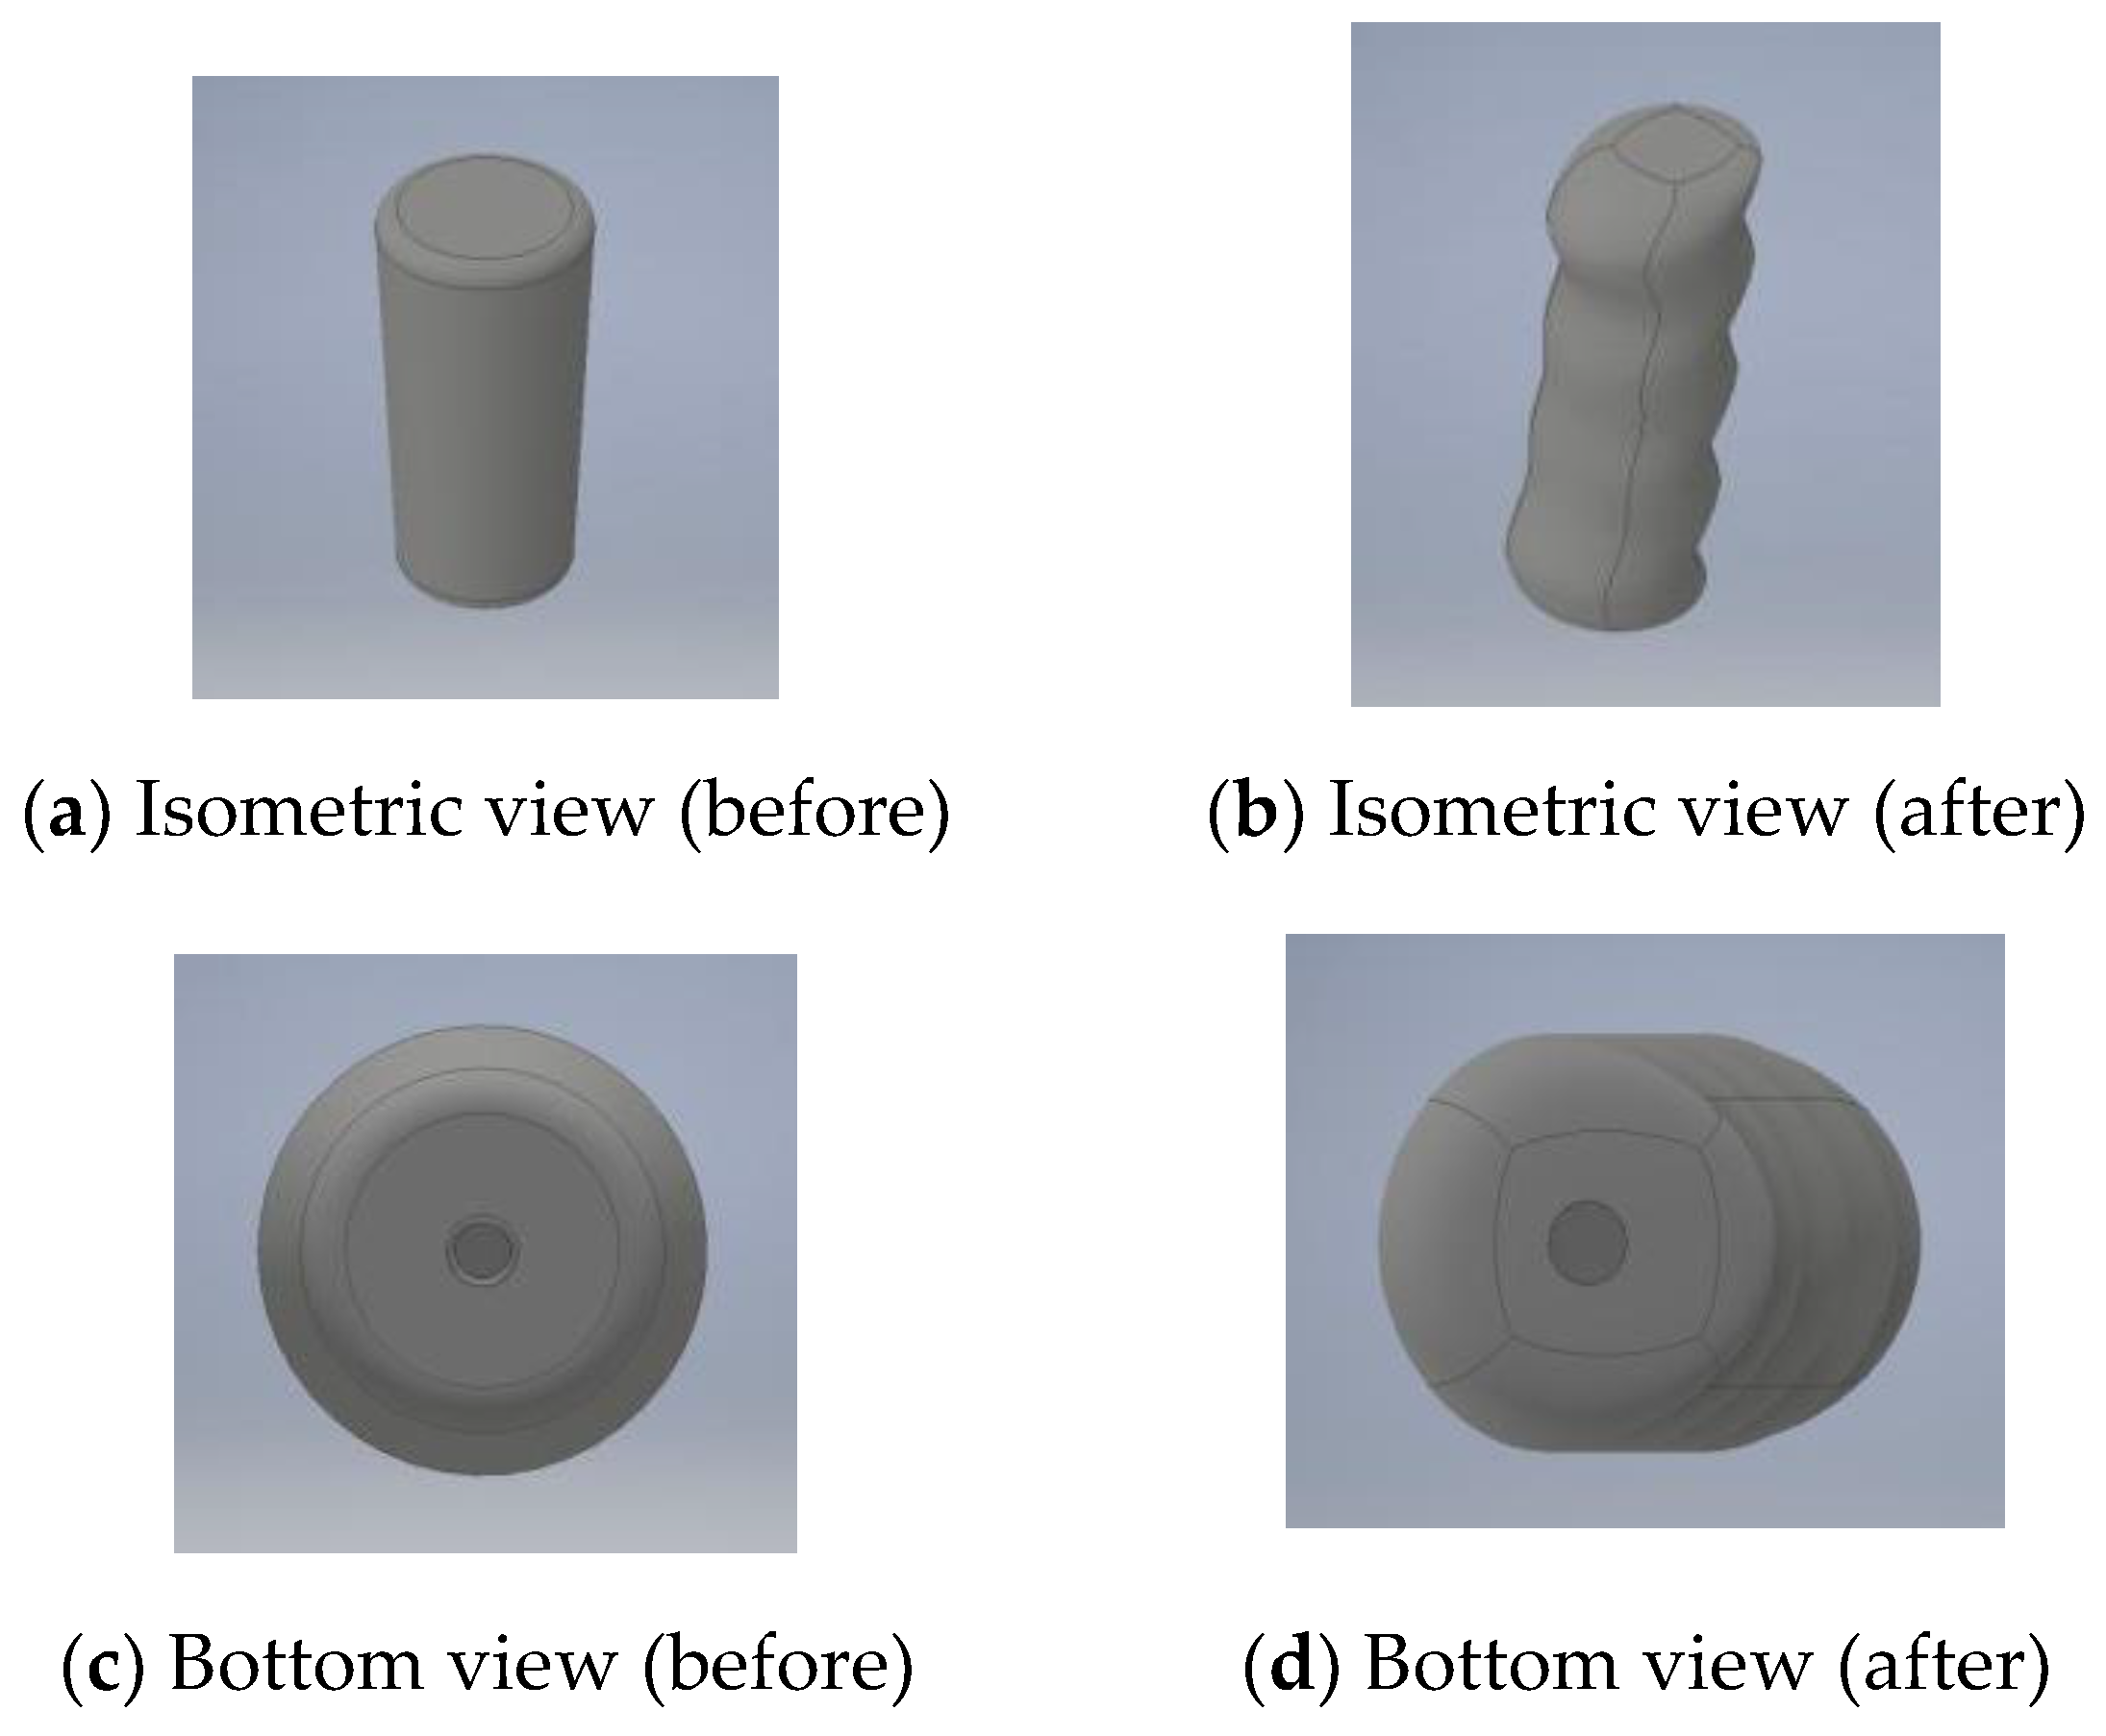
2.7. Handle Design
To design a fixed-sized handle that is comfortable for the operation of the control lever, measurements such as the width and length of the hand should be considered, and the design should accommodate the 50th percentile of the dimensions of the worker’s hand. Hand dimensions are used to determine the size of the lever grip. Based on anthropometric data collected from Malaysian operators (146 men and 168 women) aged 18 to 45 years [
57], there is a difference between the 5th and 95th percentile. Therefore, the cylindrical handle is designed with a height of 10 cm and a diameter of 30 cm, tapering at 3˚, while the spherical handle is designed with a diameter of 60 cm.
However, the preliminary handle designs were simple cylindrical and spherical handles that did not provide users with a firm or secure grip. There was a risk of slippage during the pushing and pulling actions, causing users to voluntarily increase their grip force in the process. Therefore, the cylindrical handle was redesigned with ergonomic contours of a 10° forward slant, while the spherical handle was redesigned by reducing its diameter to 50 cm.
Figure 6 shows the comparison of the cylindrical handle designs before and after the modifications.
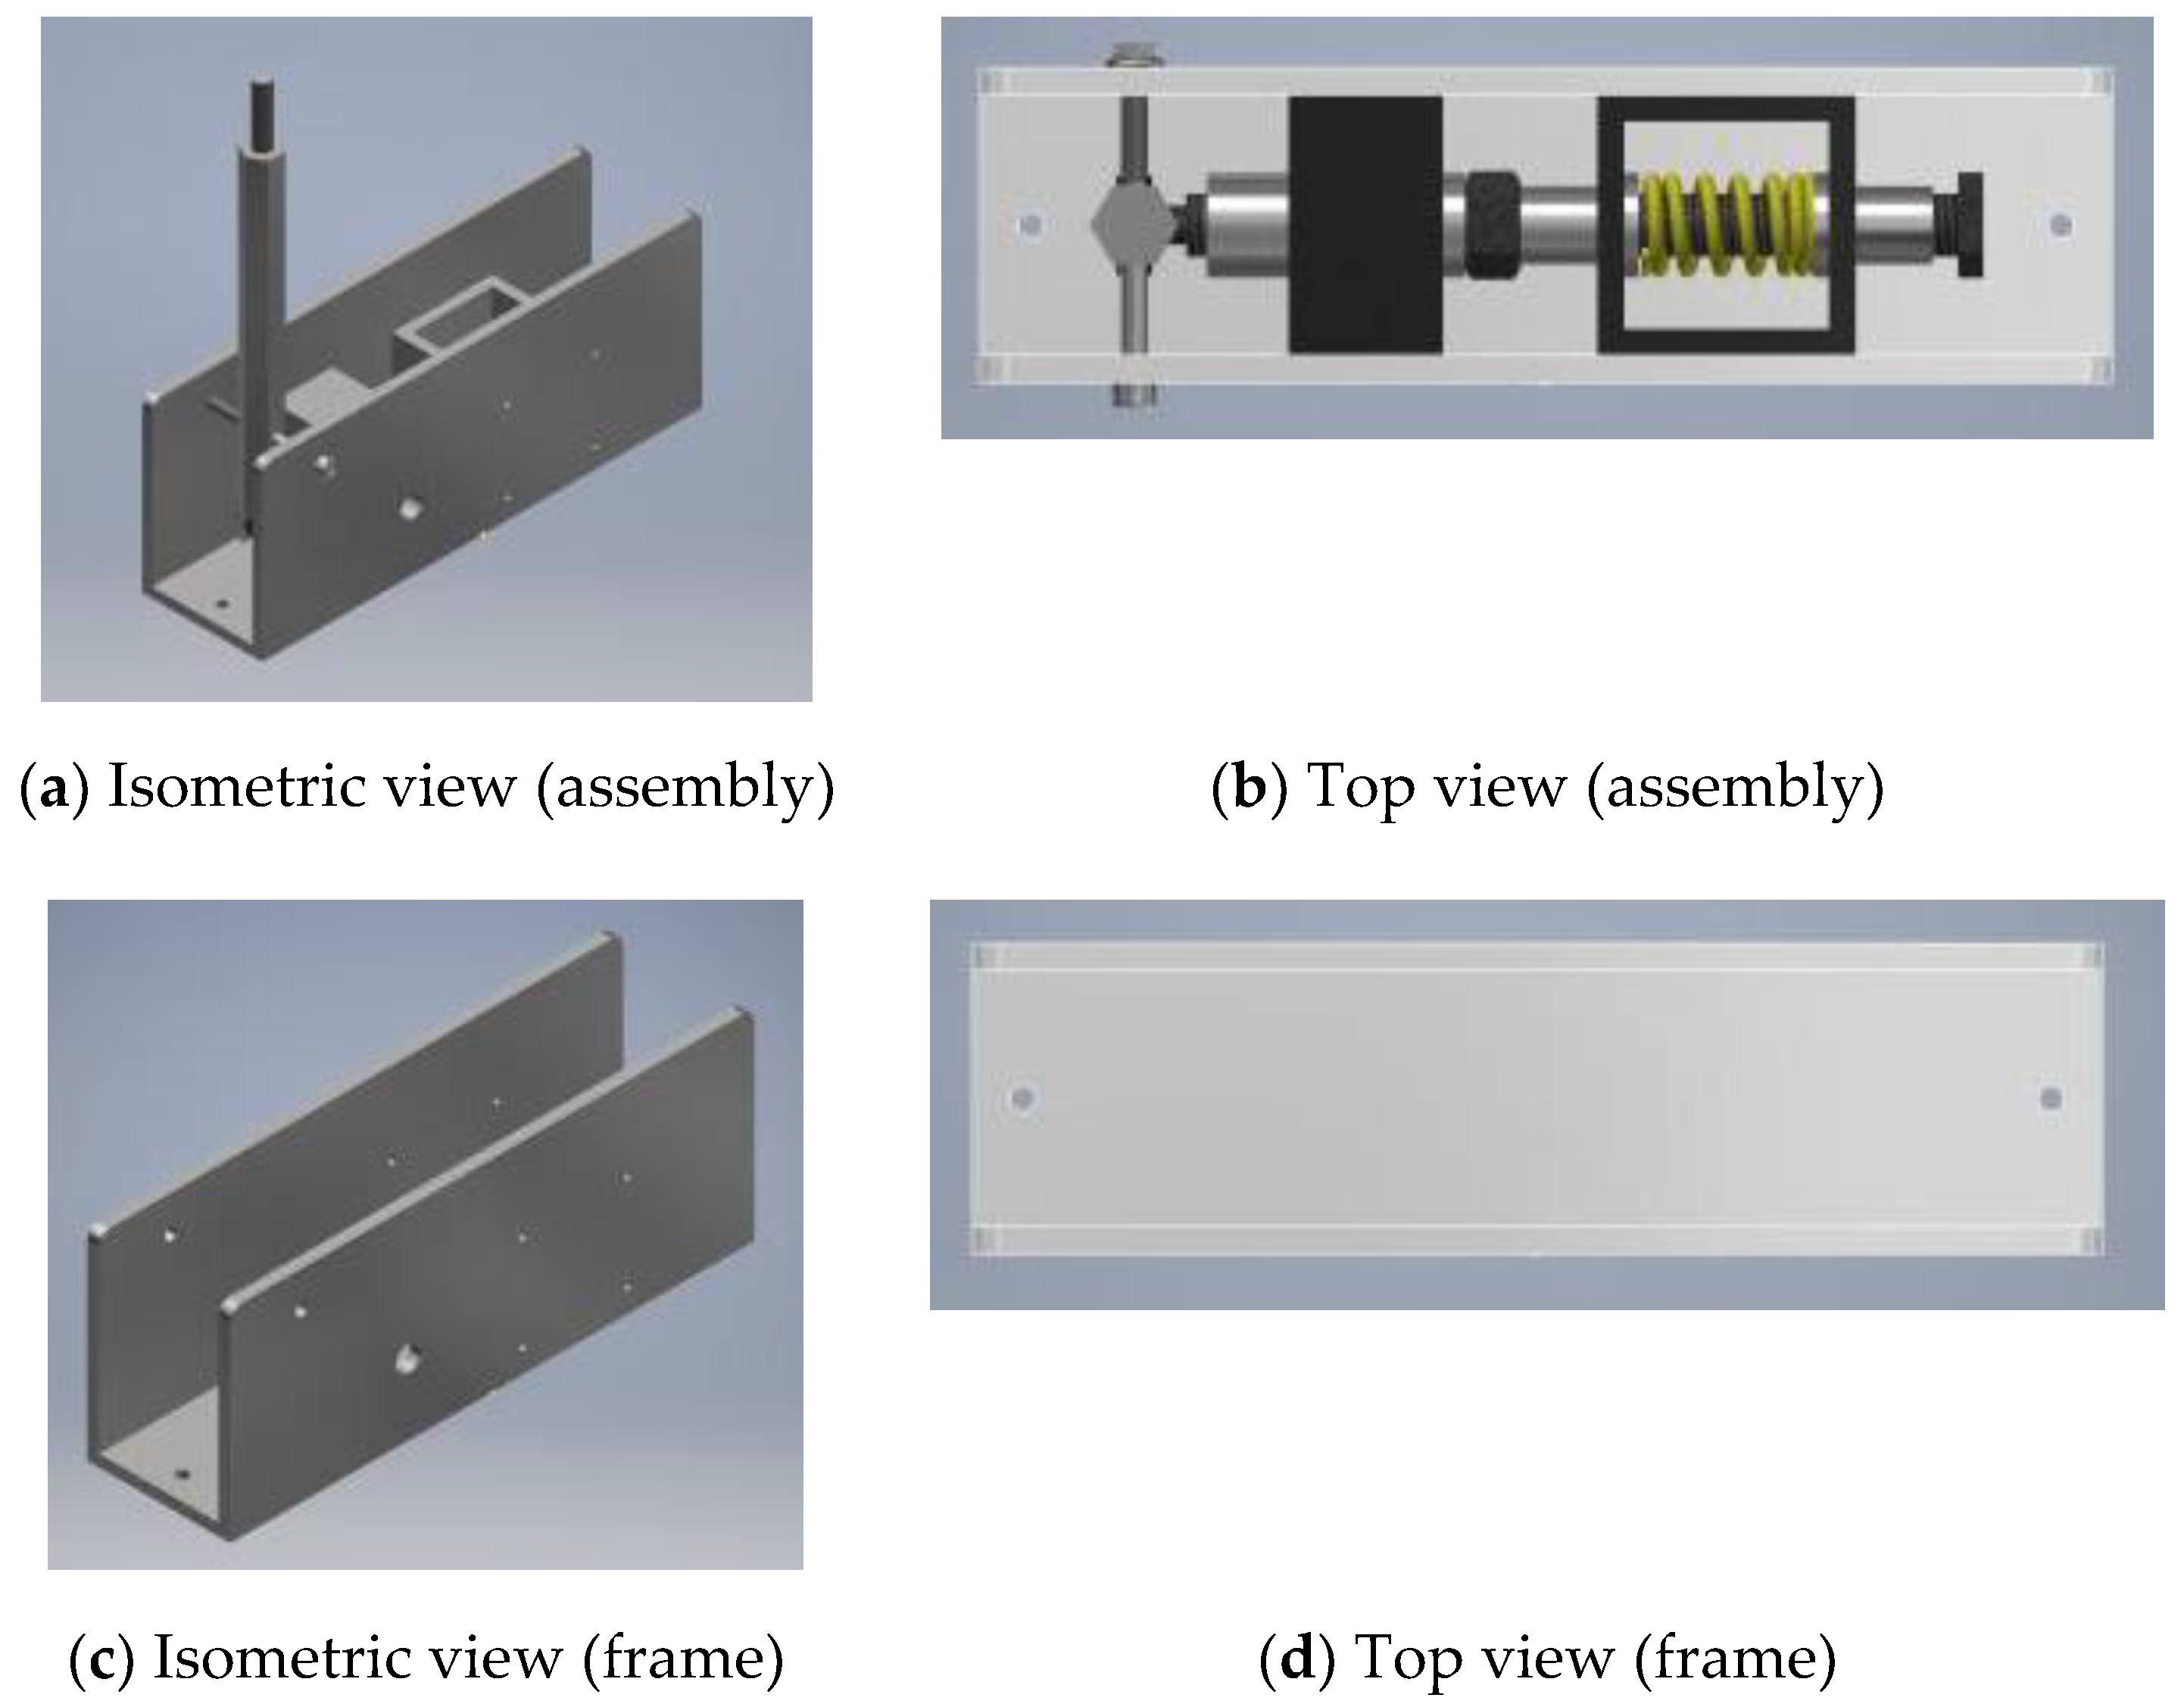
2.8. Finalised System Design
The design of the control lever system was finalised, with the isometric view and top view (assembly and frame) shown in
Figure 7.
2.9. Test Plan
The experimental procedures were drafted not only to test the prototyped apparatus but also to perform, in a coherent and systematic manner, the ergonomics analysis of the hand grip. Measurements were made using a sensor array and a perceived force scale. There were three experiments planned for the hand grip analysis. The first two experiments were tested with three different independent variables (resistance level, handle shape, and force direction), while the final experiment was tested with three scenarios, in which each of them accounted for two fixed independent variables (scenario 1: cylindrical handle with high resistance, scenario 2: pull action with high resistance, and scenario 3: pull action with cylindrical handle).
The sampling method used in this study was purposive sampling. Due to social distancing and pandemic concerns, the researchers’ access to different categories of participants was limited. Although not excluding the participation of heavy machinery operators, this study mainly involved the participation of normal and healthy adults aged 18–25 years old that had the experience of working with heavy machinery control levers throughout their industrial training or part-time work. The following procedures were developed solely for experimentation purposes. A pilot test on six users was executed before the effective experiment development to estimate the actual sample size required using Minitab 19 (testing and validation of the proposed methodology, including the associated methods and tools).
In this ergonomics analysis, a force sensor array and the Borg CR10 scale were used to estimate the exertion of the grip force. The force sensor array included a glove with pressure sensors (Velostat, a type of pressure-sensitive conductive sheet) attached on the surface that reacted to pressure and provided a hand pressure map of the participant’s grip. The Borg CR10 scale used is a subjective assessment scale ranging from 0 (muscle at rest, no movement, and no strength development) to 10 (maximal effort) [
58,
59]. The ratings perceived by the participants (users) were:
0: Rest (minimal);
0.5: Extremely easy;
1: Very easy;
2: Easy;
3: Moderate;
4: Somewhat hard;
5: Hard;
6: Hard to very hard;
7: Very hard;
8: Excessively hard;
9: Nearly maximal;
10: Maximal.
2.9.1. Experimental Procedure
This section details the experimental procedures for all the tests. A total of six participants were assigned to be pilot test subjects. Participants were asked to sign a consent form before the experiments and to declare that they have not experienced any form of hand-related musculoskeletal diseases or injuries before the experiment. The recorded anthropometric measurements included height, hand width, and hand length.
Test 1 was related to the estimated grip force by the following actions:
The participant is seated upright on a wooden chair.
The control lever system is adjusted to the participant’s elbow height.
The force sensor glove is fitted to the participant’s left hand.
The participant’s elbow is flexed at a 90° angle and placed on the handle of the control lever.
The participant executes the first combination in
Table 7, and the grip force map is recorded.
Each exertion is separated with a rest period of 1 min to ensure recovery from muscular fatigue.
Steps 5 and 6 are repeated with the remaining 7 combinations, which are randomised.
Steps 1–7 are repeated with the other participants.
The steps included in test 1 were repeated in the case of test 2 (perceived grip force), except that the participant’s bare hand was used instead of the sensor glove, and the Borg CR10 scale rating was recorded instead of the grip force map.
Test 3 consisted of the paired comparisons based on the following actions:
The participant is seated upright on a wooden chair.
The control lever system is adjusted to the participant’s elbow height.
The participant’s elbow is flexed at a 90° angle and placed on a control lever handle.
The control lever system is adjusted for scenario 1, where the shape is fixed as the cylindrical handle and the resistance level is set to high.
The participant performs the push and pull activities with the sensor glove. The grip force map is recorded.
Each exertion is separated with a rest period of 1 min to ensure recovery from muscular fatigue.
Steps 5 and 6 are repeated with the participant’s bare hand, and the perceived rating (using the Borg CR10 scale) is recorded.
Steps 4–7 are repeated with the other participants.
Step 4 is modified for scenario 2 (fixed conditions: pull action and high resistance) and scenario 3 (fixed conditions: pull action and cylindrical handle).
Step 5 is modified for scenario 2 (manipulated variable: cylindrical and spherical handles) and scenario 3 (manipulated variable: low and high resistance levels).
Steps 1–8 are repeated with scenarios 2 and 3 after accounting for steps 9 and 10.
2.9.2. Analysis Planning
For this study, Minitab 19 was used to perform the statistical analysis for all experiments. A normality analysis was performed prior to the parametric analyses. A sample size estimation was made using the pilot test data based on a 5% margin of error.
Furthermore, two types of analyses were used, namely regression, ANOVA (analysis of variance), and paired t-tests. The regression and ANOVA were used to support the analysis of the effects of push–pull operations, resistance levels, and handle shapes on the estimated and perceived grip forces (based on the test 1 and 2 results). The paired t-tests were used to determine whether there were significant differences between the two groups (based on the test 3 results).
For test 3, each of the experiments required two hypotheses, namely the null and alternative hypotheses. The paired t-test was used for test 3, with a significance level of 0.05 (α = 0.05). The following hypotheses were proposed.
Scenario 1:
- ○
Null hypothesis, Ho1: There is no significant difference in the estimated or perceived grip force between the two groups (push and pull action).
- ○
Alternate hypothesis, Ha1: There is a significant difference in the estimated or perceived grip force between the two groups (push and pull action).
Scenario 2:
- ○
Null hypothesis, Ho2: There is no significant difference in the estimated or perceived grip force between the two groups (spherical and cylindrical shapes).
- ○
Alternate hypothesis, Ha2: There is a significant difference in estimated or perceived grip force between the two groups (spherical and cylindrical shapes).
Scenario 3:
- ○
Null hypothesis, Ho3: There is no significant difference in the estimated or perceived grip force between the two groups (high and low resistance).
- ○
Alternate hypothesis, Ha3: There is a significant difference in the estimated or perceived grip force between the two groups (high and low resistance).
2.10. Grip Force Map System
The force mapping system was adopted from a previous project [
60]. This system is used to record contact area data and uses a pressure sensor matrix known as Velostat. The sensor used in this study measures an area of approximately 137.99 cm
2 and contains 170 individual sensing elements. The electrical signals from the sensor are processed via MATLAB (2019) and can be displayed as a force map. Since the force sensor glove only provides results of the mapped force area, the grip force still needs to be estimated.
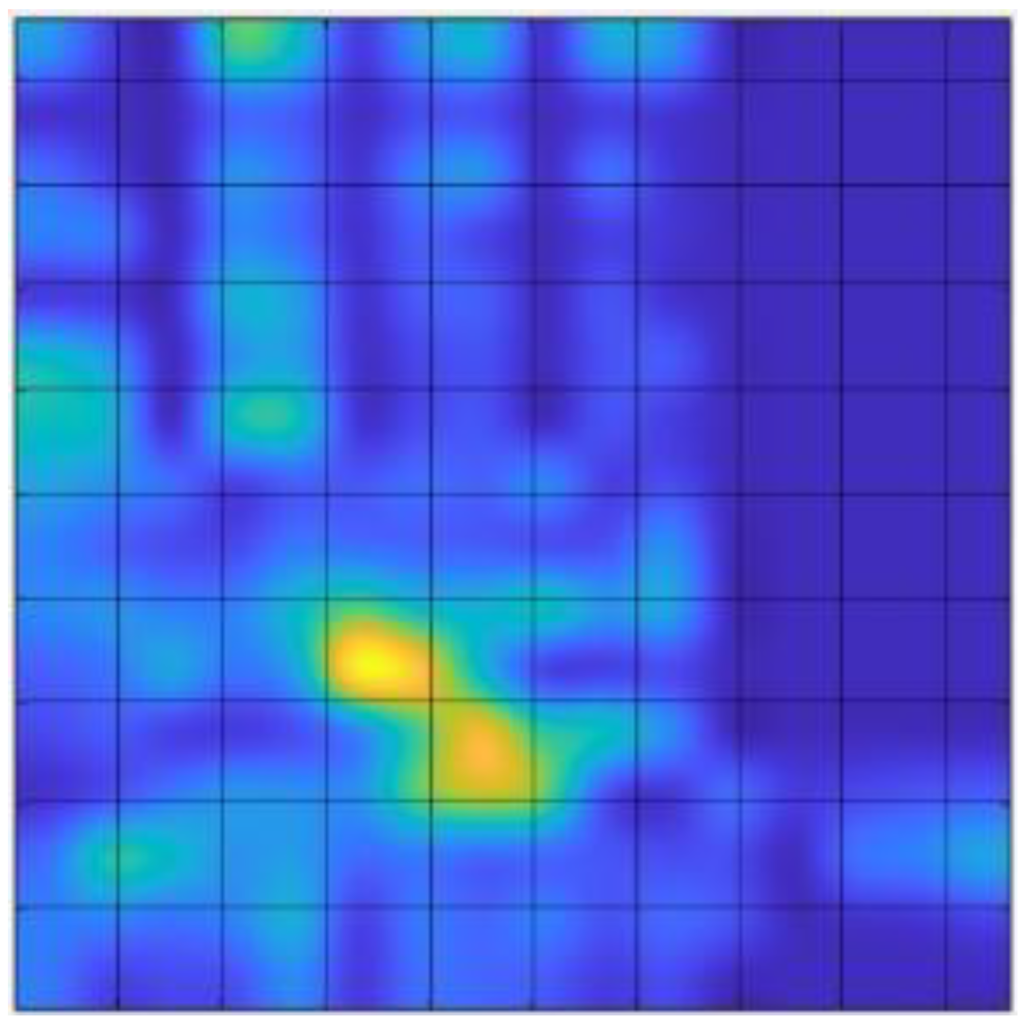
To simplify the calculations, the force map is divided into five equal zones, where each zone covers two rows, as shown in
Figure 8. The proximal thumb joint and palmar tissues are in contact for Zone 1, while the metacarpal joint of the fingers is in contact for Zone 2 and Zone 3. The proximal phalange of the fingers is in contact for Zone 4, while the distal and middle phalanges of the fingers are in contact for Zone 5. The assumption of force per unit area is based on a study on pressure sensor matrix using Velostat [
61] that suggested that the maximum grip pressure reached up to 10 N/cm
2. The value of the colour bar is multiplied by an estimated factor of 40 to obtain the force (measured in N). This estimation results in successive units of colour codes in the figure being classified as follows:
Dark blue—0 N;
Blue—2 N;
Light blue—4 N;
Green—6 N;
Orange—8 N;
Yellow—10 N.
Based on the 10 × 10 matrix shown in
Figure 9, the force was summed together based on each zone. The last three columns, from Zone 2 to Zone 5, were assumed to be 0 N, as the area was not mapped (example of the calculation is presented in
Table 8).
The estimated force falls in the range of 200–400 N, which was similar to the grip force found in a study on the actual force distribution of the hand measured by pressure sensors [
62]. Therefore, the reliability of this estimate was deemed acceptable. This method of recording and presenting the data has been used in a previous project, and the validity of the data acquisition and grip patterns have been verified through various experimental activities [
60].
2.11. Ethics Approval
All participants gave their written informed consent prior to the experiments. All procedures and protocols were approved by the Research Ethics Committee (REC) of the Technology Transfer Office (TTO) of Multimedia University. The research ethics approval for the project was granted with approval number EA0022021, and the approval letter was endorsed by the TTO Director cum REC Secretariat of the university. Informed consent was obtained from all subjects involved in the study.
3. Results
3.1. Prototyped Apparatus
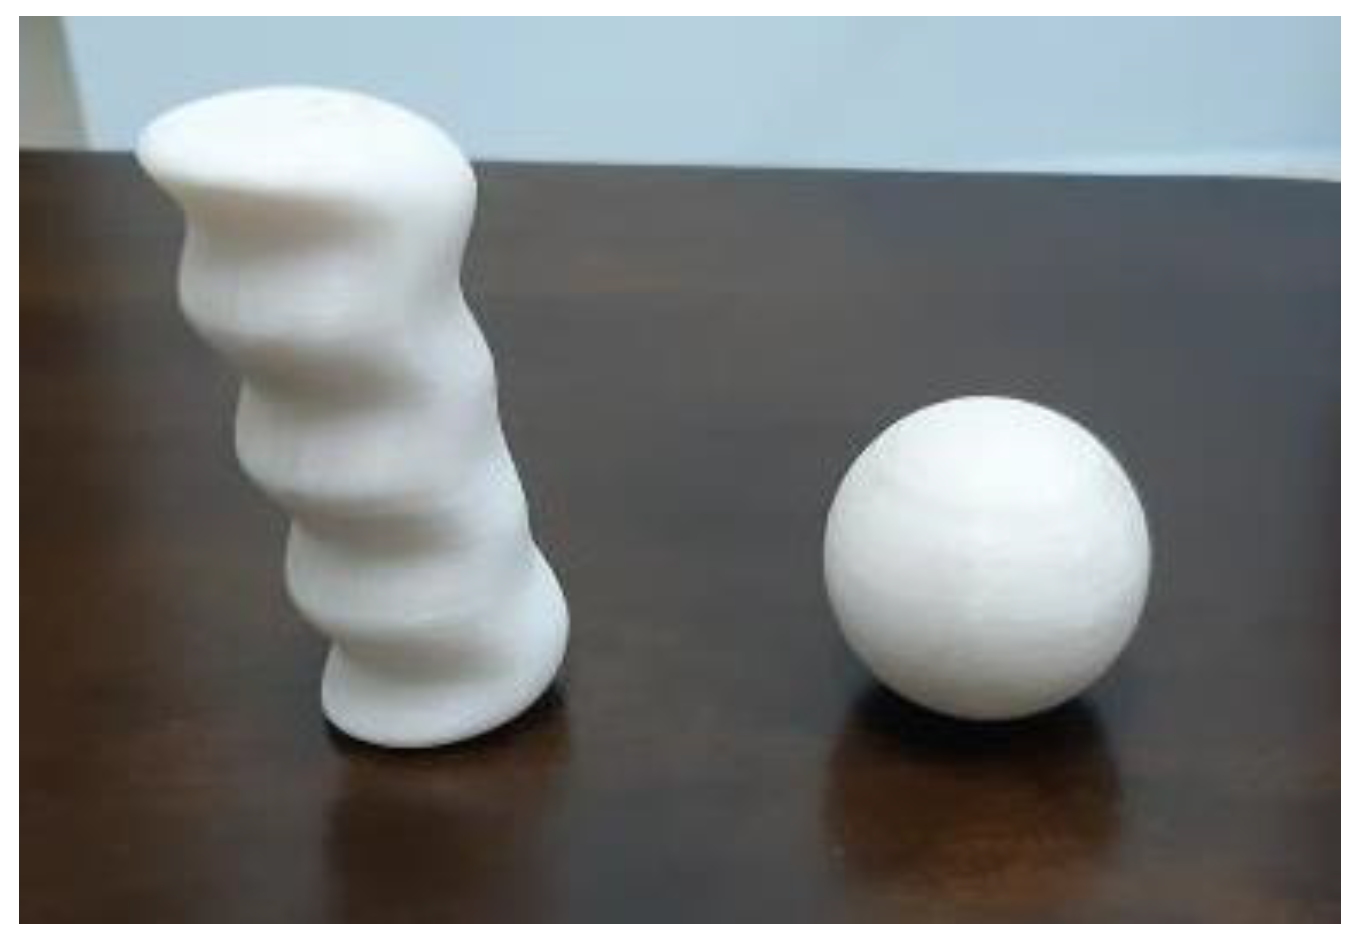
The apparatus is composed of two parts that include the 3D printed handle shapes (
Figure 10) and the body of the prototype apparatus (
Figure 11). Both shapes have been designed by considering ergonomic principles related to handling and prehension (hand anatomy shape). Furthermore, the whole apparatus is mounted on the test rig for the setup of the grip experiment (
Figure 11).
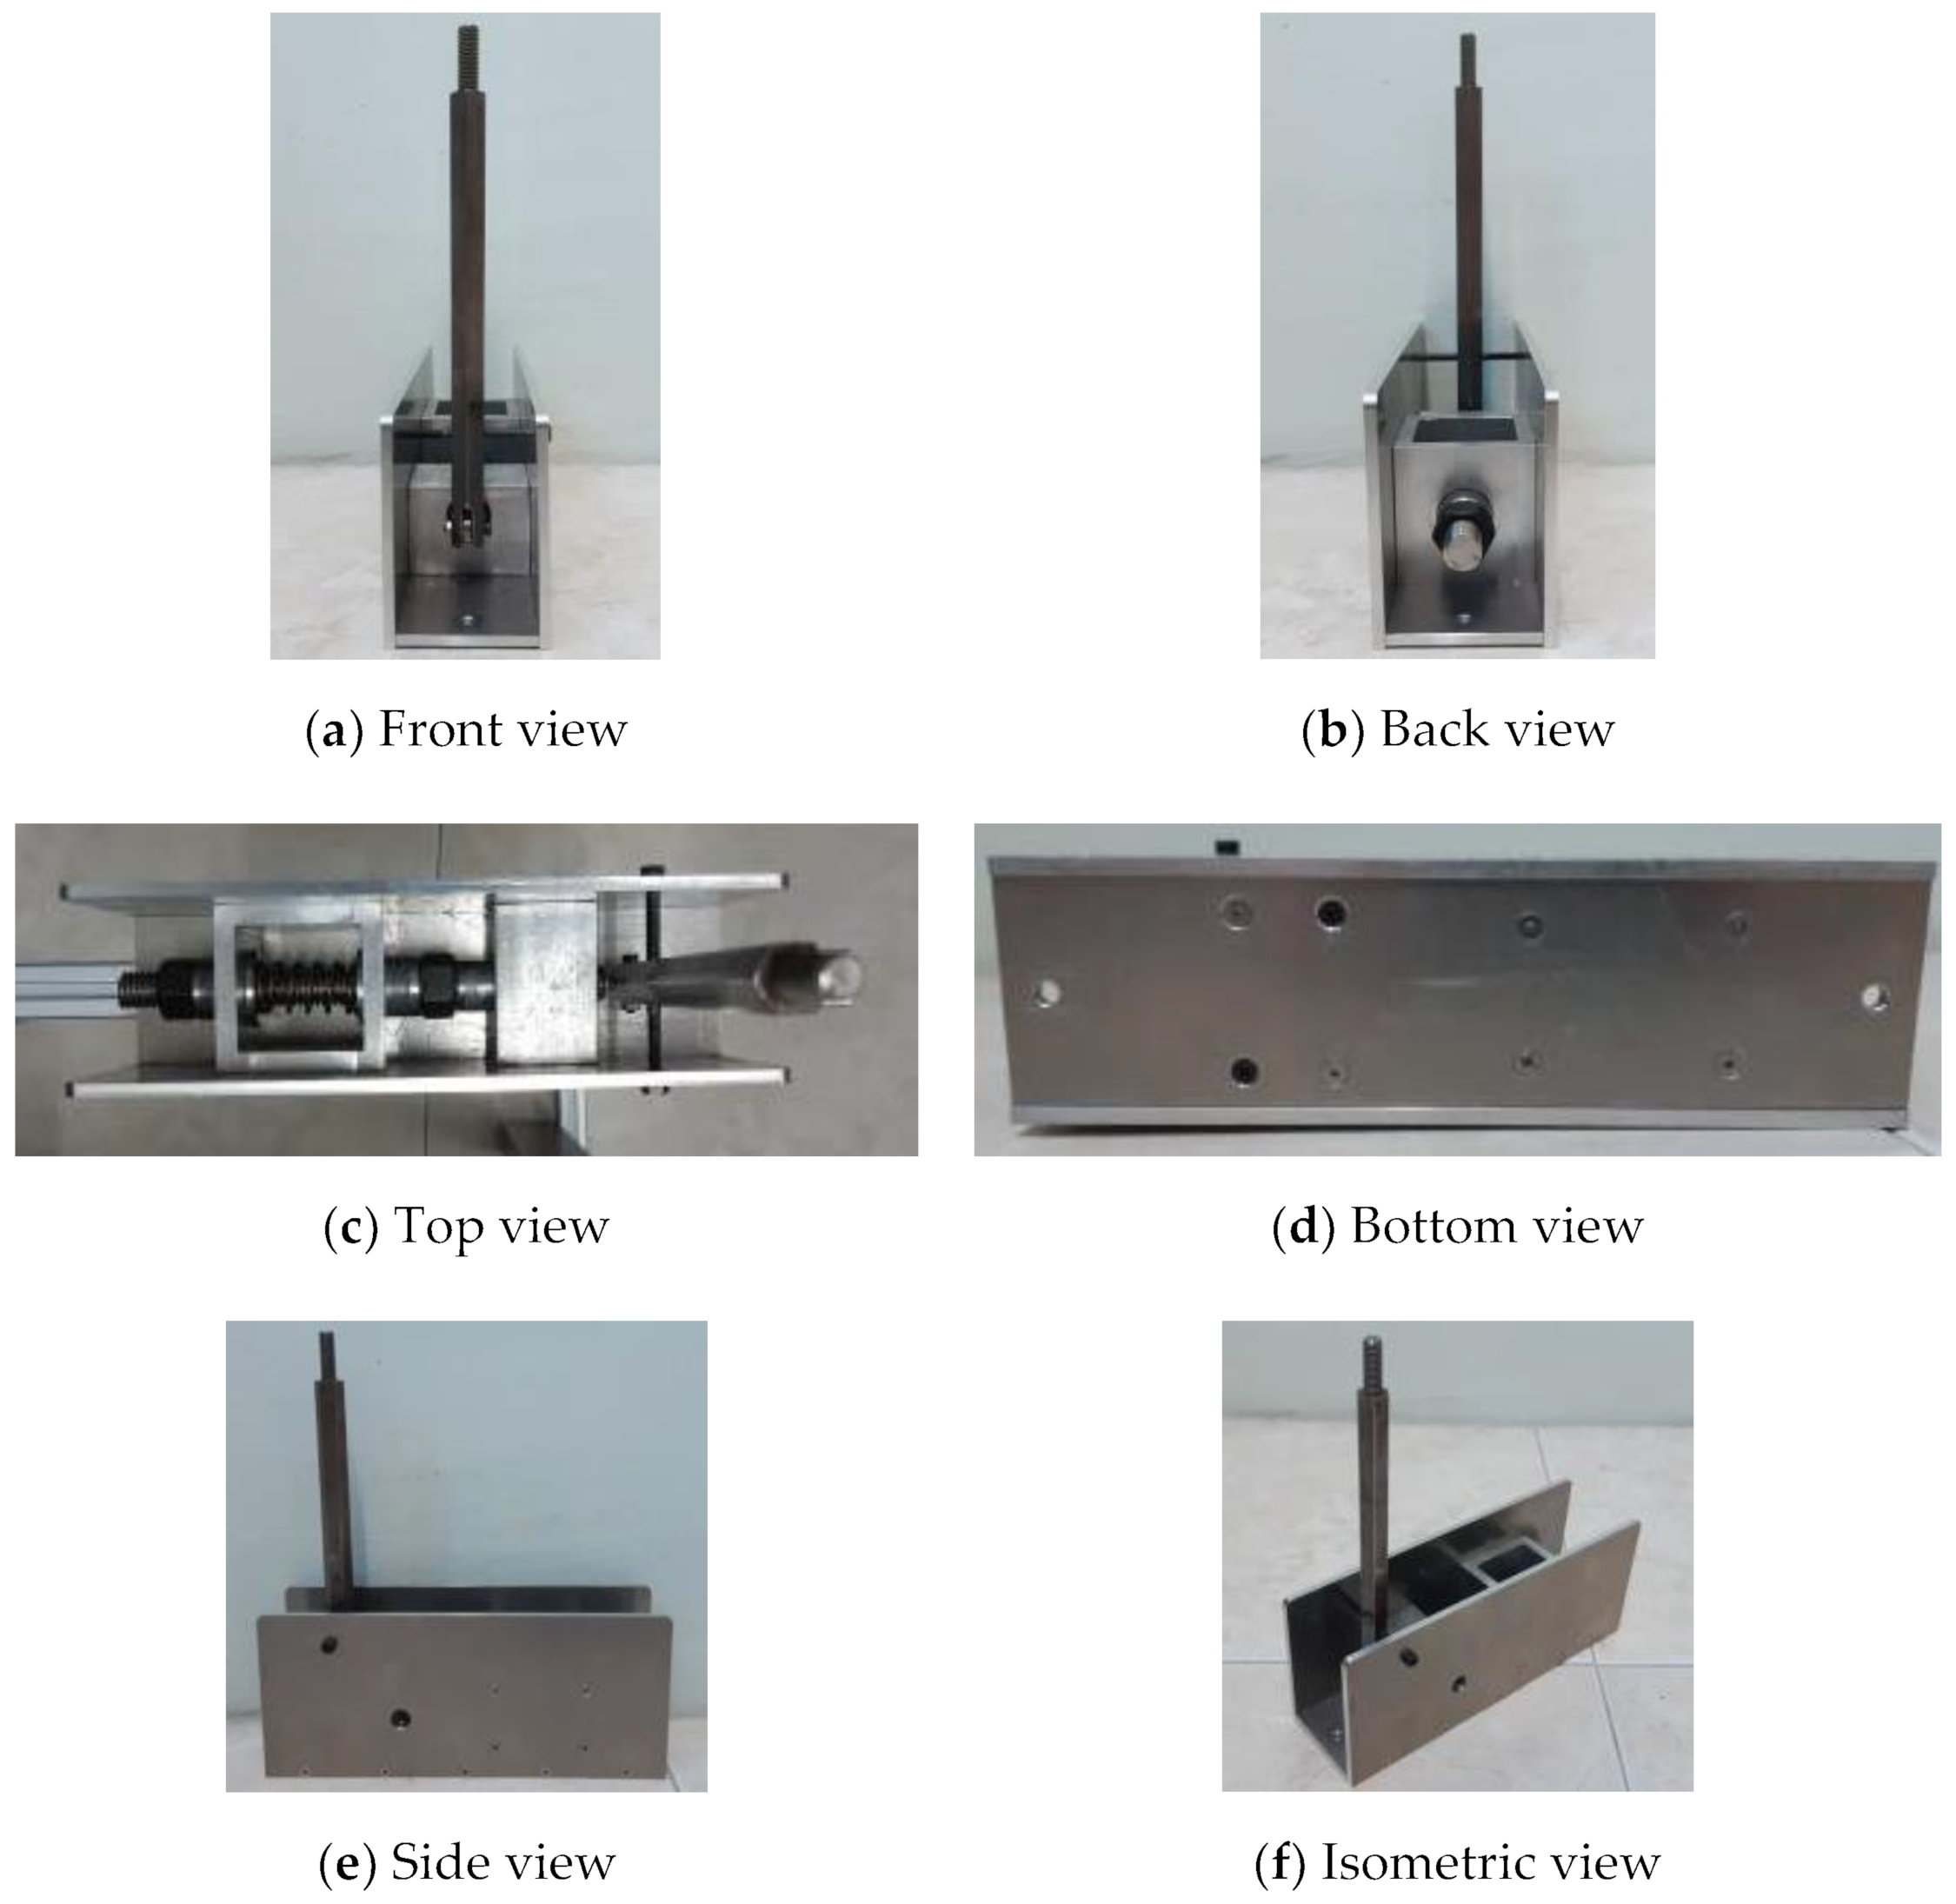
Figure 12a–f shows the front, back, top, bottom, side, and isometric views, respectively.
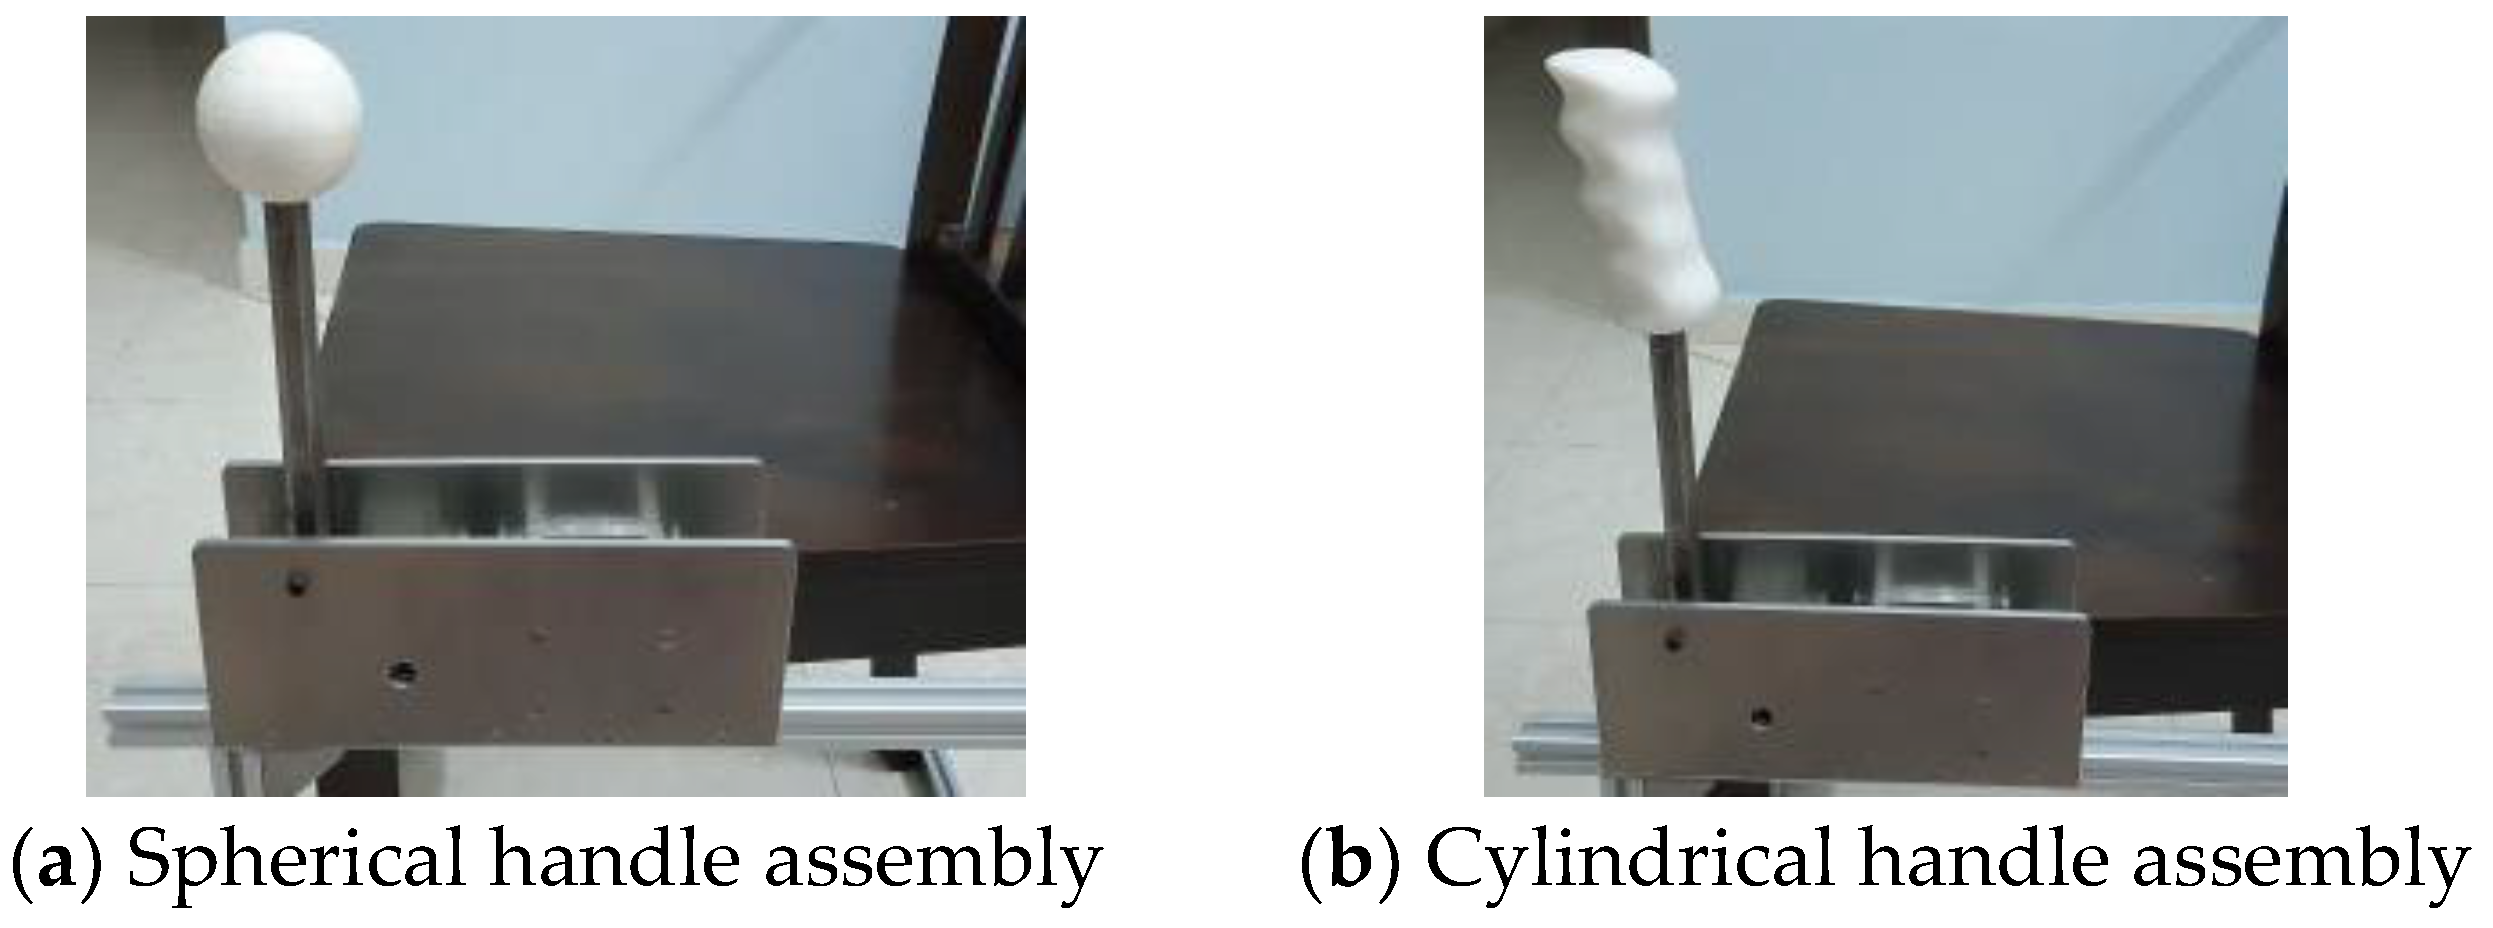
Figure 13a,b shows the 3D-printed handle installed on the prototyped apparatus. Installation was possible through the built-in threaded feature of the handles.
Using Minitab 19, the mean value for the estimated grip force from the pilot test was found to be 334.67 N, while the mean rating for the perceived force was found to be 3.542. The standard deviation for the estimated force was 5.95, while the standard deviation for the perceived force was 1.65 (see
Table 9). The margin of error for the confidence interval was set at 5% for the sample size estimation based on the standard deviation. According to the results of Minitab 19, the estimated sample size for the estimated force was eight participants. Only three participants were estimated for the perceived force rating. Therefore, the researchers opted to collect data from eight participants for the actual test.
Table 10 shows the anthropometric details of the eight participants. The data covers age, height, hand breadth, and hand length. The participants are 22–24 years of age, with an average height of around 173 cm, an average hand breadth of 8.55 cm, and an average hand length of 18.71 cm.
3.2. Results of Test 1
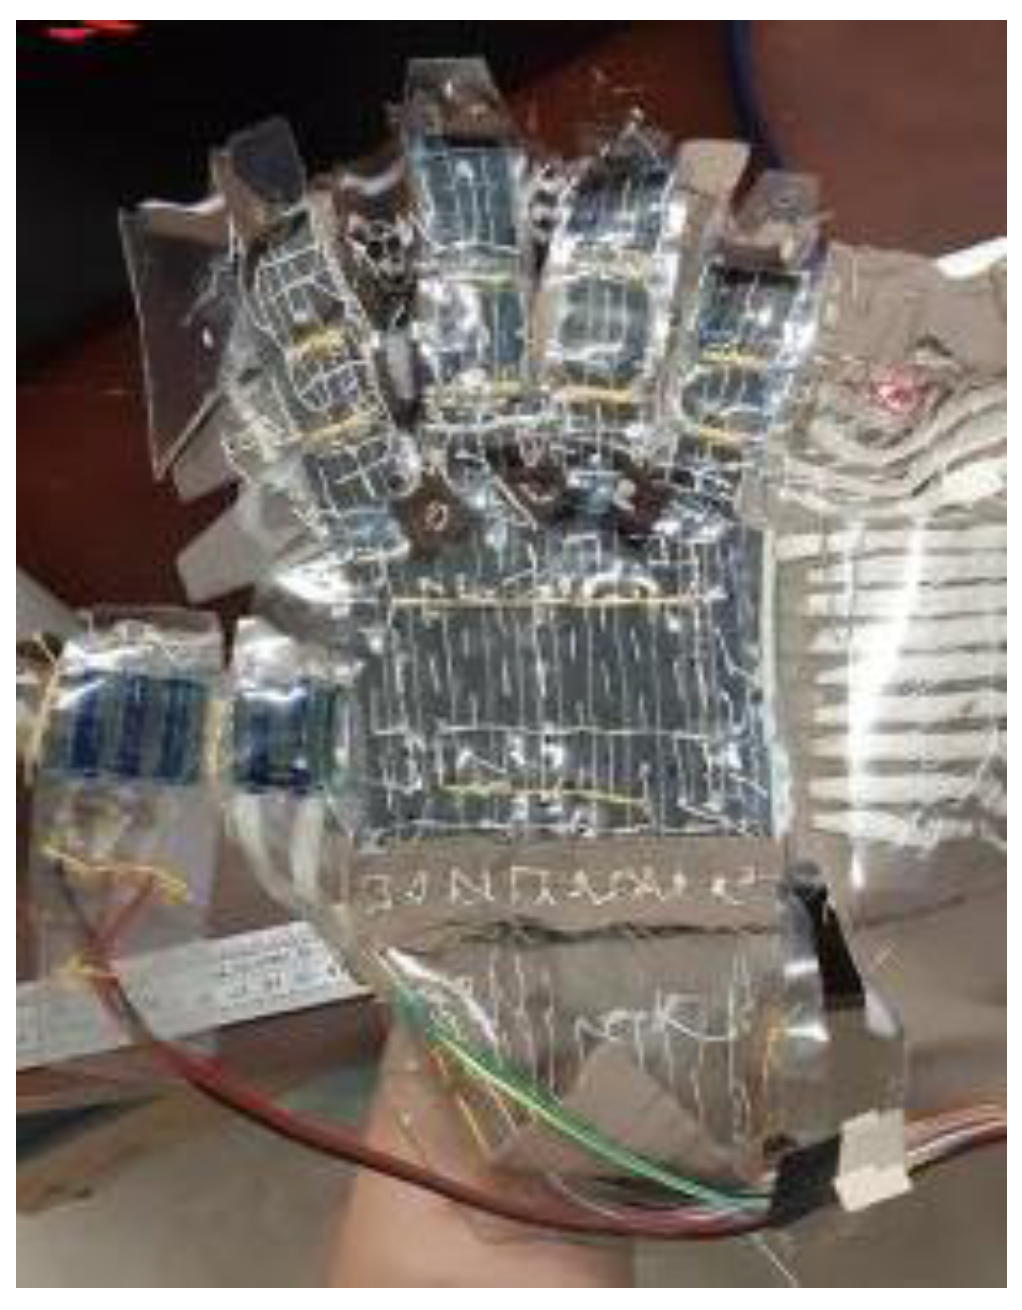
Figure 14 shows the sensor glove developed from another robotics study [
60]. The sensor glove provides force mapping with different colour regions for the researcher to interpret.
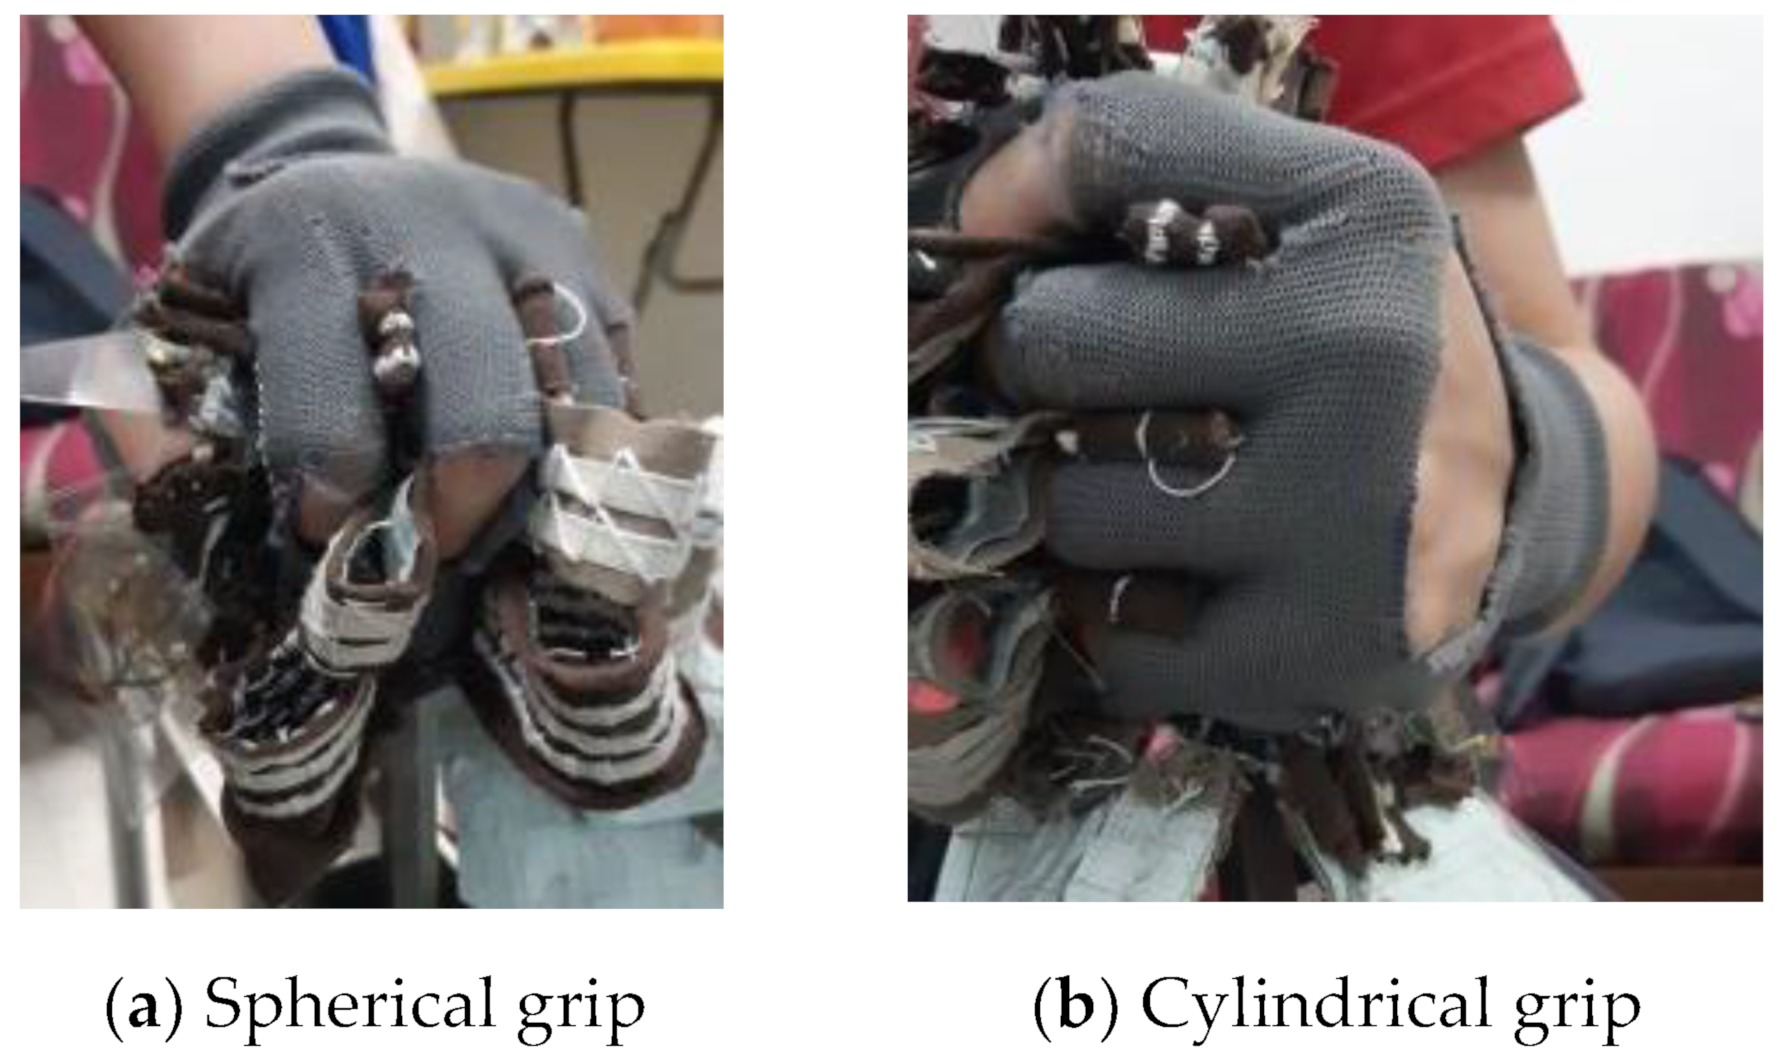
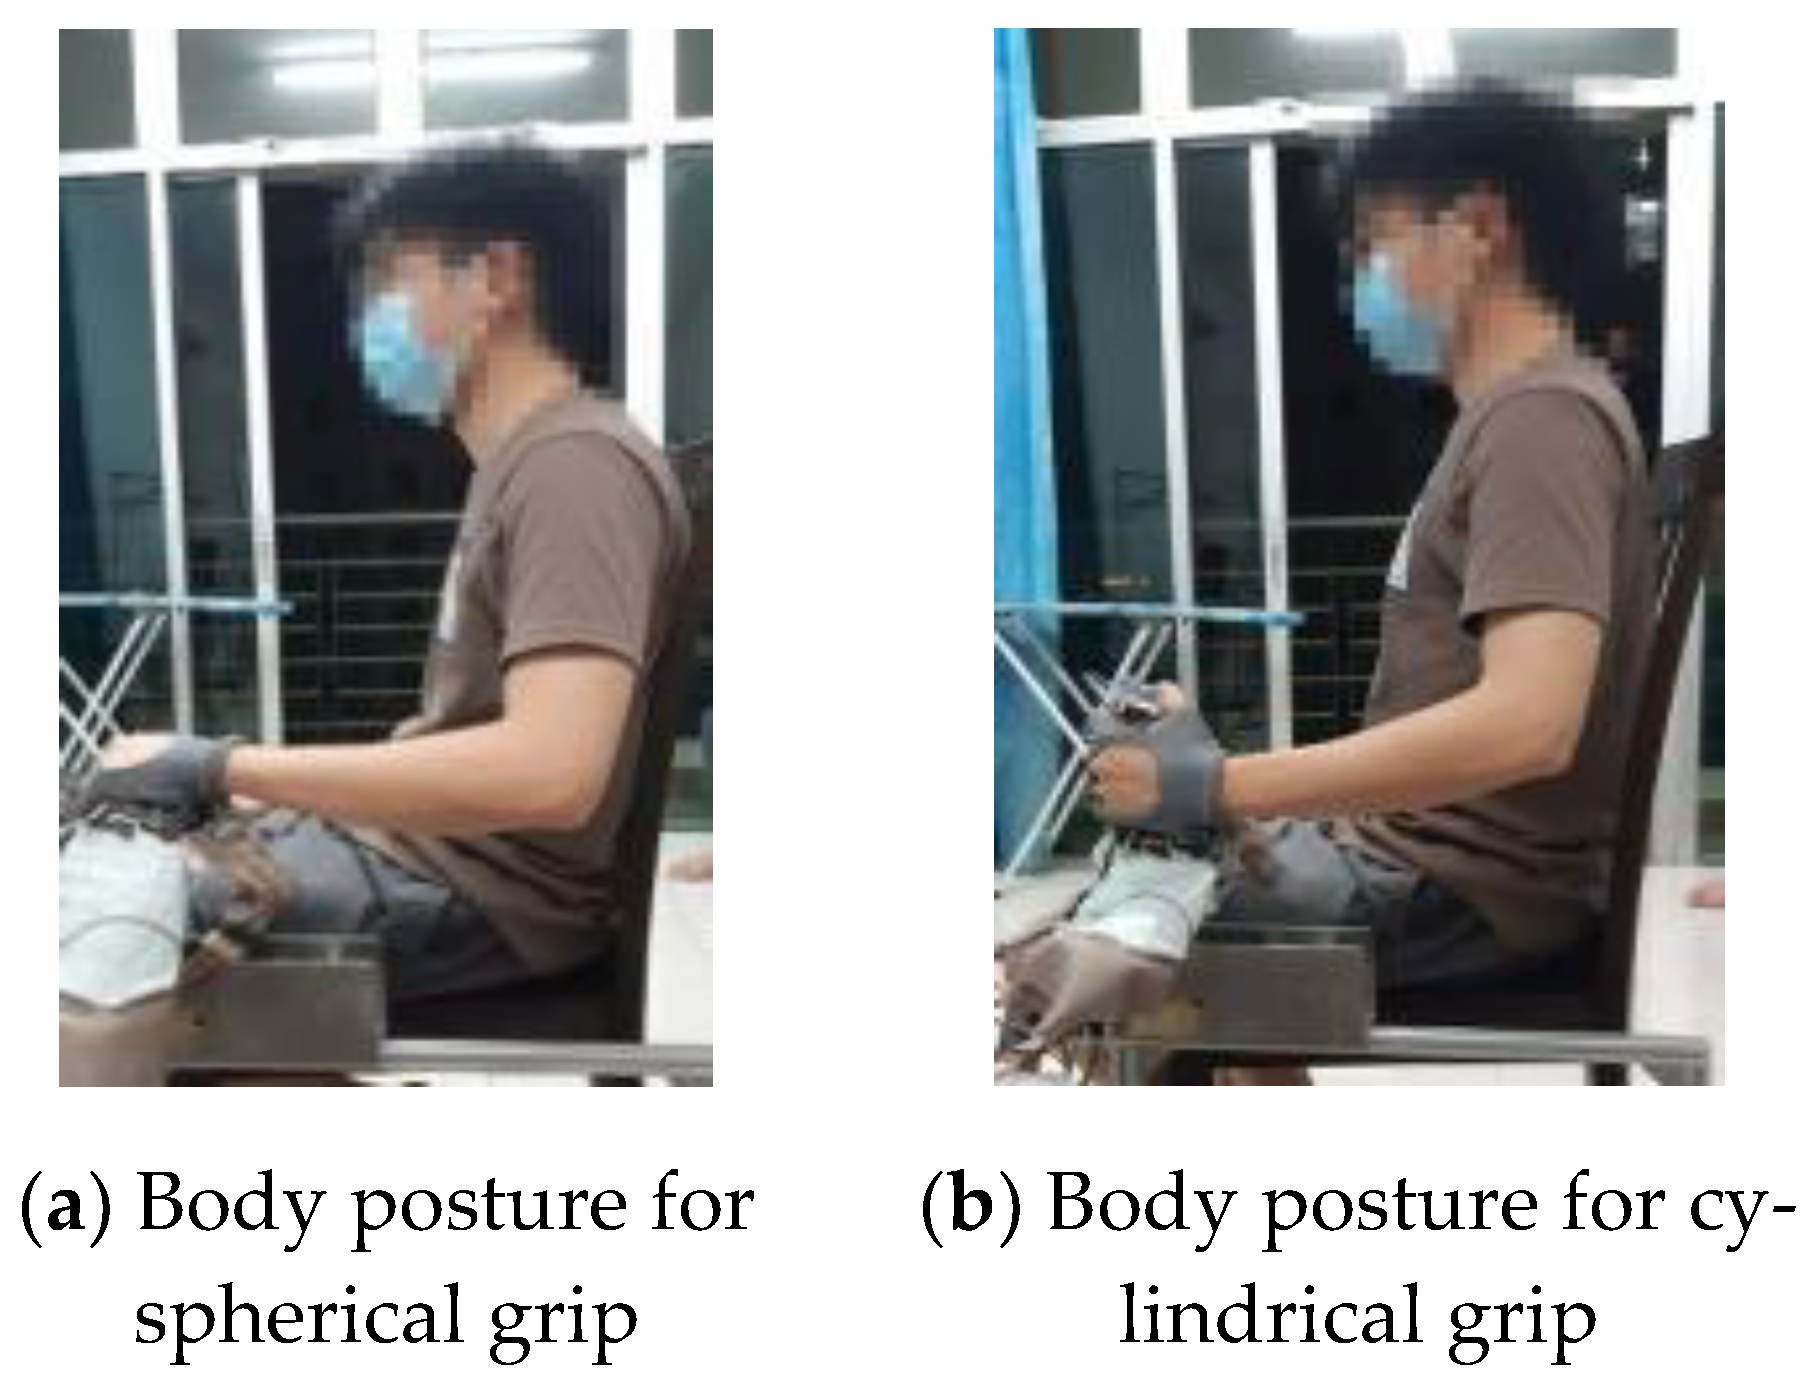
Figure 15a,b shows examples of the spherical and cylindrical grips during the control lever operation (ergonomics analysis). The body posture when administering the spherical and cylindrical grips is shown in
Figure 16. This is the part of the ergonomics study that is related to the diminishing strength of action and movement comfort.
Before the regression analysis, data samples were examined for any violation of the normality assumption using the Ryan-Joiner normality test. The test confirmed that the distribution of the data did not differ significantly from being symmetric. The inviolability of the normality assumption allowed parametric analyses such as regression and t-tests to be used. A linear regression analysis was performed to test the effects of the handle shape, movement activity, and resistance level on the estimated hand grip force. From the analysis, the predictors of handle shape and movement activity were found to be insignificant (p > 0.05). These predictors were removed from the model.
Table 11 shows the results of the regression analysis after removing insignificant variables. In this analysis, the resistance level was found to be a significant predictor (β = 0.455,
t (63) = −9.82,
p < 0.05). This predictor explained a significant proportion of the variance in the estimated grip force (R
2 = 74.13%, F (1, 63) = 19.70,
p < 0.05). A significant regression equation could be modelled as such:
where EF is the estimated grip force, X
1 is low resistance, and X
2 is high resistance.
However, the correlation of determination (R2) was moderate. Therefore, the regression model might not be very suitable to be used for prediction. Nevertheless, the analysis showed that the resistance level was the only predictor that significantly affected the estimated grip force in terms of the manoeuvrability of the mechanically emulated control lever.
3.3. Results of Test 2
Test 2 involved the collection of perceived grip force rating data using different experimental combinations. The participants were briefed on the definition and mechanism of the Borg CR10 scale beforehand.
Like in the case of test 1, a normality test was performed. It was found that the data did not differ significantly from being symmetric, and the normality assumption was not violated. Hence, parametric tests were permissible.
A linear regression analysis was performed to test the effects of the handle shape, movement activity, and resistance level on the perceived grip force. From the analysis, the shape of the handle (β = 0.117, t (60) = 4.80, p < 0.05), movement activity (β = 0.117, t (60) = −2.93, p < 0.05), and the resistance level (β = 0.117, t (60) = −8.80, p < 0.05) were found to be significant predictors. These predictors explained a significant proportion of the variance in the perceived grip force (R2 = 70.49%, F (3, 61) = 12.66, p < 0.05).
Table 12 shows the results of the regression analysis. A significant regression equation can be modelled as such:
where PF is the perceived grip force;
X1 is low resistance;
X2 is high resistance;
Y1 is spherical shape;
Y2 is cylindrical shape;
Z1 is push action;
Z2 is pull action.
Like in the case of test 1, the R2 was found to be moderate. Therefore, this regression model might not be appropriate for the prediction. However, the analysis proved that the handle shape, movement activity, and resistance level significantly affected the perceived grip force as far as manoeuvring the mechanically emulated control lever was concerned.
3.4. Results of Test 3
Test 3 involved both the collection of the estimated and perceived grip force with different scenarios of two fixed independent variables.
3.4.1. Test 3—Scenario 1
Scenario 1 uses the fixed combination of a cylindrical handle and high resistance. A paired
t-test was used to analyse the data.
Table 13 shows the results of the paired
t-test on movement activity. The pull action (Mean
pull = 339.50 N, SD
pull = 4.99, CV
pull = 0.015) was found to generate a higher force compared to the push action (Mean
push = 334.25 N, SD
push = 1.67, CV
push = 0.005),
t (7) = −2.90,
p = 0.023. In the case of perceived force, the pull action (Mean
pull = 5.625, SD
pull = 0.916, CV
pull = 0.163) was also perceived to generate a higher force compared to the push action (Mean
push = 4.375, SD
push = 0.744, CV
push = 0.17),
t (7) = −3.42,
p = 0.011. Since the
p-values for both sets were found to be less than the significance level (
p < 0.05), H
o1 was rejected, and H
a1 was supported, indicating that there was a significant difference in the estimated and perceived grip force between the two groups (push and pull action).
The estimated force and perceived force for the pull action were found to be slightly higher than the ones generated for the push action, with a difference of 5.252 N and 1.25 points, respectively. Therefore, it can be concluded that the pull action required more force to manoeuvre the control lever compared to the push action.
3.4.2. Test 3—Scenario 2
Scenario 2 uses the fixed combination of pulling action and high resistance. From the results of the paired
t-test in
Table 14, it was found that the force acting on the spherical handle (Mean
spherical = 334.25 N, SD
spherical = 3.45, CV
spherical = 0.01) was lower compared to the force acting on the cylindrical handle (Mean
cylindrical = 339.50 N, SD
cylindrical = 4.24, CV
cylindrical = 0.012),
t (7) = −3.28,
p = 0.013. However, in the case of perceived force rating, the perceived force acting on the spherical handle (Mean
spherical = 5.75, SD
spherical = 0.886, CV
spherical = 0.154) was higher compared to the force acting on the cylindrical handle (Mean
cylindrical = 4.5, SD
cylindrical = 0.926, CV
cylindrical = 0.206),
t (7) = 3.42,
p = 0.011. Since the
p-values for both sets were found to be less than the significance level (
p < 0.05), H
o2 was rejected, and H
a2 was supported, indicating that there was a significant difference in the estimated and perceived grip forces between the two groups (spherical and cylindrical shapes).
The conditions pertaining to the estimated and perceived forces demonstrated different outcomes, as the estimated grip force acting on the cylindrical handle was higher than the one for the spherical handle, but the perceived grip force acting on the spherical handle was higher than the one for the cylindrical handle.
3.4.3. Test 3—Scenario 3
Scenario 3 uses the fixed combination of a pull action and cylindrical handle. From the results of the paired
t-test in
Table 15, it was found that the high resistance level generated a higher force (M
high = 335.50 N, SD
high = 2.98, CV
high = 0.009) than the low resistance level (M
low = 327.25 N, SD
low = 4.65, CV
low = 0.014),
t (7) = 5.95,
p = 0.001. Similarly, for the perceived force, the high resistance level also generated a larger perceived force (M
high = 5.50, SD
high = 1.069, CV
high = 0.194) than the low resistance level (M
low = 3.125, SD
low = 1.553, CV
low = 0.497),
t (7) = 5.66,
p = 0.01. Since the
p-values for both sets were found to be less than the significance level (
p < 0.05), H
o3 was rejected, and H
a3 was supported, indicating that there was a significant difference in the estimated and perceived grip forces between the two groups (high and low resistance).
It was found that the estimated and perceived forces for the high resistance level were slightly higher than those generated for low resistance level, with a difference of 8.25 N and 2.375 points, respectively. Therefore, it can be concluded that a high resistance condition requires more force to manoeuvre the control lever compared to a low resistance condition.
4. Discussion
Several key findings can be concluded from this study, as will be presented in the following.
Firstly, more studies on wheel loader control lever topics could be done in the future. While reviewing the literature for this study, it was found that there were limited device-oriented studies on this topic. Most of the patents cited were a few decades old. Therefore, more device-oriented studies could be conducted on this topic to benefit the safety of the community working with heavy machinery.
There may also have been some inconsistent results. This inconsistency was probably due to the design of the sensor glove, which was bulky and uncomfortable to wear while gripping. This factor might have altered the estimated force. In addition, participants were prone to slightly change the way they gripped the handles during the experiment. There was a minor change in the position of the fingers while gripping, which might have affected the results.
The performance of the sensor glove greatly affected the result. Based on the results of test 1, it was found that resistance level was the only significant predictor in the regression, rendering only a moderate R2. This shortcoming was likely due to the sensor glove, which could only produce a force map of gripping activity. The overall grip force was estimated on the colour mapping generated by the sensor glove. The results might be more accurate if it were designed to directly measure the actual grip force as well.
The Borg CR10 scale was a more user-friendly measurement system. Test 2 proved that all three variables were significant predictors of the regression with a moderate R
2. Although the perceived force rating method with the Borg CR10 scale may not be the most accurate representation of grip force, it could be considered as a conventional and inexpensive method for grip force assessment [
38]. Since the manipulation of a control lever for a heavy machinery would be a complex task that renders the measurement of grip force in a real situation difficult, the perceived method would generally be easier to implement than the actual force measurement method.
It was proven that the pulling action required a greater grip force than the pushing action during the movement of the control lever in the first scenario of test 3. The pull force generated on a control lever in a seated posture would generally be higher than the push force [
63]. The results would improve with respect to the lower grip force by placing the levers to be handled with the elbows at a 90–135° angle, as this condition would require fewer muscle movements.
The cylindrical handle required more estimated force but less perceived force compared to the spherical handle. The cylindrical handle was designed primarily with ergonomic grooves that provided a secure grip for the participants. These groves allowed for a larger grip contact area during grip activity, eventually causing a larger number of force values to be estimated compared to the ones estimated for the spherical handle. However, the perceived force rating method provided a different finding compared to the estimated force method, in which the spherical handle required a larger perceived force rating to execute the activity compared to the cylindrical handle. This contrasting result was due to human perception, where participants were prone to overestimating the amount of perceived force compared to the actual exertion [
36]. Furthermore, the spherical handle was not designed with grooves. Therefore, the design might not have provided the user with a secure or comfortable grip. This aspect might have caused participants to rate the level of exertion higher than its actual value, since the participants might administer more effort than usual in controlling their grip to avoid possible hand-to-object slippages.
Lastly, scenario 3 from test 3 proved that a high resistance level required a larger grip force to operate the control lever than a low resistance level. This high resistance was likely due to the spring plunger design in the prototyped apparatus. Although a high resistance provided an increased tactile sensitivity for the user to recognise the position of the control lever, a high grip force could cause overexertion injuries for operators that work with heavy machines in the long run [
20]. The tactile sensitivity feature should be taken into consideration in control lever designs but with an optimised or adjustable resistance level for the convenience of the operator.
5. Conclusions
5.1. Achievement of Objectives
The objectives of this study were (1) to design and develop a mechanical system that emulates the push–pull operations of wheel loader control lever systems and (2) to perform an ergonomics analysis concerning the effects of push–pull operations, resistance level, and handle shape on grip force when moving the wheel loader control lever.
The first objective was achieved through the literature synthesis, conceptualisation, and engineering design process. The synthesis of the literature included reviews of journal articles, patents, and existing products that provided knowledge and information on the fundamental concepts and working principles of control levers and existing problems. The ideas and features extracted from the literature synthesis aided the conceptualisation of the control lever apparatus. Finally, the engineering design process included design drawings and the simulation, design optimisation, test planning, and fabrication of the control lever system.
The second objective was achieved through the experiments carried out to test and analyse the formulated hypotheses. The results of these experiments were able to explain the individual and compound effects of all the variables on both the estimated and perceived grip force.
5.2. Major Findings
The prototyped apparatus: After several modifications, the fabricated prototype was usable as the apparatus for this grip analysis study. After data collection, some of the outcomes discussed from a few hypotheses were found to be similar with the outcomes of previous studies. The analyses can be used in the future to design a more ergonomic control lever that requires only a small amount of force for improved operator comfortability when handling wheel loader systems for long durations.
The Borg CR10 scale: While this perceived force rating method might be an inaccurate representation of grip force measurement, it was still considered a feasible, quick, and inexpensive method suitable for experiments involving real working conditions where the appropriate measurement tools may be unavailable or unpurchasable.
5.3. Limitations of the Study
There were a few limitations in this study due to time and cost constraints. These limitations involved the fabrication and experimentation of the control lever system.
The size of the handle: This limitation was noticed during the design and fabrication of the handle. The size of the handle was designed to accommodate the 50th percentile (the majority) of hand sizes for machinery workers. If the hand size of the participant falls within the 5th or 95th percentiles (minority), the handle might not be suitable for the experiment.
The force was inaccurate: While the grip force was estimated to be within a range that was akin to some studies, the estimated force was still considered inaccurate, as it was not a direct measurement. This inaccuracy could have affected the data analysis. In addition, the force estimation method in this study should be validated against an actual force measurement. However, due to limited time and resources, the validation process was not done in the present study. Therefore, a better version of the sensor glove should be invented to accurately measure the grip force and grip force area for an improved data analysis.
The right hand was not tested: As the sensor glove from another study was primarily designed to test the left hand, the testing of the right hand was not considered in the experiments. Analyses of the effects from the right hand would still be important, since a vast majority of the world’s population is right-handed, and heavy machinery control levers should be designed to account for both handedness.
No professional operators or technicians as participants: Due to social distancing and pandemic concerns, access to external participants was limited, especially concerning professional heavy equipment operators. A field test with operators in actual working environments would be desirable to test the apparatus and observe the possible differences in the analysis.
Small sample size: The statistical power of a study might increase with increasing the sample size. However, access to more participants was limited, which led the study to restrict the sample size to eight participants due to social distancing and pandemic concerns. The sample size could be increased to improve the reliability of the study.
5.4. Recommendations for Future Studies
More research is to be conducted: More studies could be reviewed in the future, especially from journals, patents, and products from different areas of research. Expanding the scope of the study would help researchers acquire an improved understanding of existing studies, discuss the relevance of the study area, and broaden the horizons of the research. For instance, investigating the use of more advanced problem-solving tools could be done to reinforce the conceptualisation process. One of such tools includes the theory of inventive problem-solving (TRIZ). With this additional tool, a more inventive control lever system could be produced in the future.
More tests: Additional tests for the wheel loader control lever could include tests on different postures (standing and seated postures), different reach-to-grasp distances, and different handle sizes. Furthermore, all the test plans and results obtained could be triangulated with different types of datasets. The intention of triangulation in research is to increase the credibility and validity of the results. For this study, only experimental data was used. In the future, perhaps two to three sets of information from different datasets (such as surveys, interviews, or focus groups) could be used to formulate a more comprehensive and consolidated conjecture.
More improvements and modifications: Due to the time constraint, only a certain extent of improvements and modifications to the design was done. In the future, perhaps more comprehensive simulations and thorough tests could be done with the design. For example, the control lever system can be modified to directly measure the exact force exerted on the shaft. In addition, a variety of tests could be performed to thoroughly assess the intervention of more variables that could affect the grip force when handling the control lever. For example, variables such as the tilt angle and height of the control lever could be incorporated and tested to create more observations and inferences.
5.5. Concluding Remarks
While still considered preliminary, this study successfully demonstrated the ergonomic contribution to the engineering design approach of a wheel loader control lever. Further improvements can be made in the system, protocol, and data collection of this study. If extended, this research can potentially benefit the safety of manual workers who use heavy machinery through better ergonomic risk mitigation.


 ,
, 


