Review

Progressing towards Environmental Health Targets in China: An Integrative Review of Achievements in Air and Water Pollution under the “Ecological Civilisation and the Beautiful China” Dream

1
Centre for Health and Public Policy Research, Jiangsu University, 301 Xuefu Road, Zhenjiang 212013, China
2
School of Management, Jiangsu University, 301 Xuefu Road, Zhenjiang 212013, China
*
Author to whom correspondence should be addressed.
Sustainability 2021, 13(7), 3664; https://doi.org/10.3390/su13073664
Submission received: 20 February 2021 / Revised: 17 March 2021 / Accepted: 19 March 2021 / Published: 25 March 2021
(This article belongs to the Special Issue Sustainable Development, Environment, and Health)

Abstract

:
Despite the positive effect of industrialisation on health and quality of life indicators across the globe, it is also responsible for the release of chemical toxins into the environment. Thus, the pursuit of economic development through industrialisation has equally nurtured numerous environmental disasters with accompanying catastrophic health effects. China is one of the countries with high carbon emissions, but new policy changes have resulted in massive gains in controlling environmental damage while enhancing the environment-related quality of life. This paper combines the six-step integrative review strategy with the Preferred Reporting Items for Systematic Reviews and Meta-Analyses (PRISMA) strategy to determine appropriate exclusion and inclusion criteria to explore the available stock of literature. We note that overall pollution in China fell by 10% between 2014 and 2019 whereas the average fine particulate matter (PM2.5) concentration of 93 micrograms per cubic meter reduced by 47% by 2019. Beijing exhibited the top 200 most polluted cities in 2019 after recording the lowest PM2.5 ever. All cities that implemented the 2012 Environmental Air Quality Standards reduced the average concentration of PM2.5 and sulfur dioxide by 42–68% by the end of 2018. Improvements in freshwater quality and a decline in water pollution levels were recorded despite increases in economic growth, urbanisation, energy use, trade openness, and agriculture, all of which are major stimulants of pollution. Deterring environmental tariff, tight ecological inspections, closing down of non-compliant producers, heavy investment in environmental control, and the ambitious five year-plan to revitalise renewable energy goals emanating from China’s ecological civilisation masterplan are responsible for these improvements in air and water pollution. China needs to work more aggressively to consolidate the gains already made in order to quicken the actualisation of the ecological civilisation and beautiful China dream.

1. Introduction

The environmental health crisis has become a common theme in several national and international advocacy and policy interventions since the early 1960s. According to Liang and Yang [1], the impact of environmental pollution is significant and multifaceted. It includes damage to human health, social conflicts, and economic losses. Apart from the indirect effect of carbon emissions on overall human health, certain forms of environmental exploitation are directly linked to myriad environmental health crisis that affect populations exposed to them [2]. For example, drywalls are produced at predominantly lower prices in China relative to other parts of the world, but drywalls emit high levels of sulphur gas which corrodes electrical wiring. If human beings are exposed to excessive amounts of these substances, it can lead to acute breathing problems, headaches and bloody nose for the occupants of the building [3]. In a study by Tan, et al. [4], they explain that phthalates from vinyl floors emit household contaminants that can cause autism among children. Similarly, human exposure to high levels of polybrominated diphenyl ether (PBDE) flame retardants that are used to manufacture cushions, carpet padding and mattresses can transmit poisonous chemicals in the bloodstreams. This condition can ultimately lead to repetitive abortion or even infertility among women. A lot of radomised control trials have given clear indications that certain environmental exposures are responsible for or aggravate obesity, diabetes, cardiovascular and nervous systems diseases, cancer, asthma, allergies etc. [5].
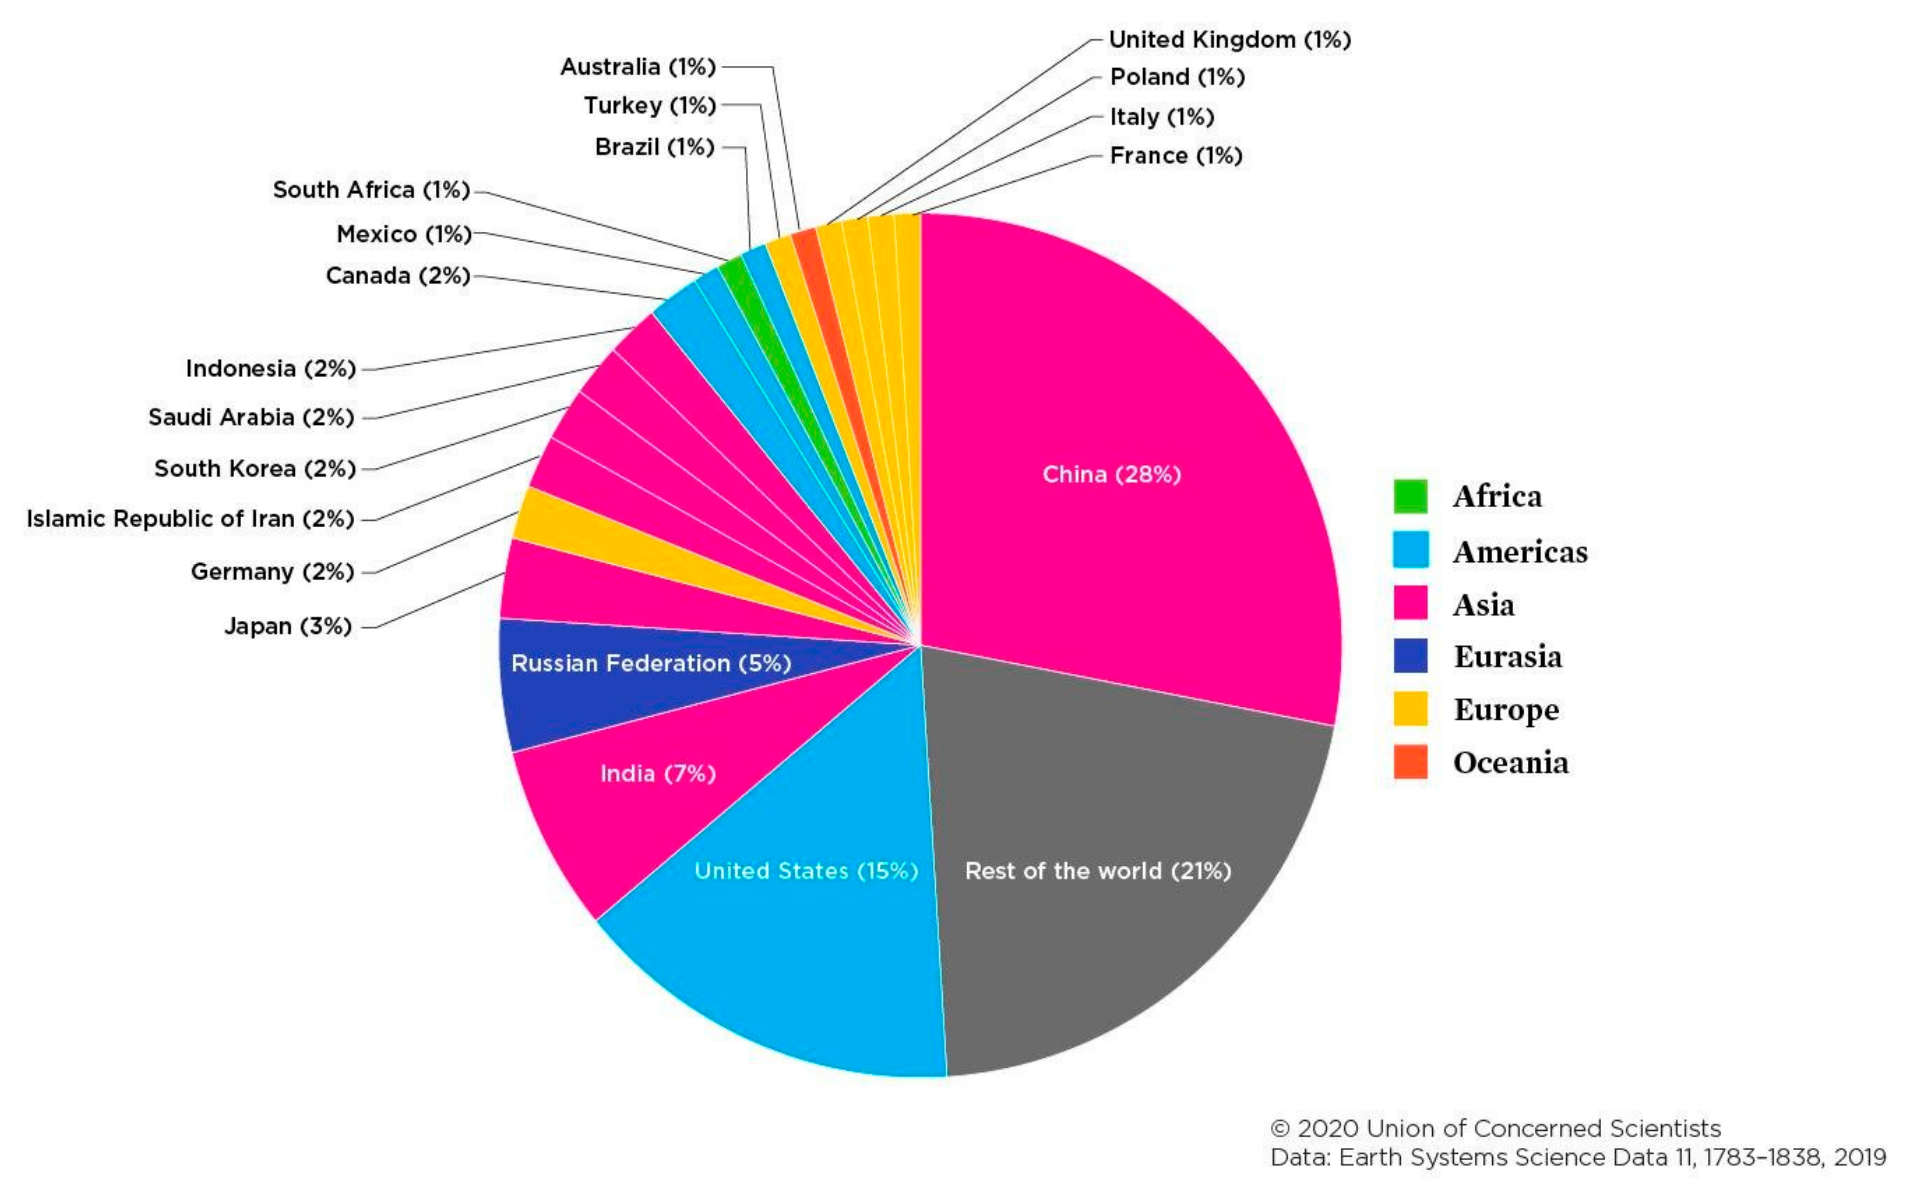
Even though China does not fall within the top five countries with the highest per capita emissions as indicated in Figure 1, it ranks first among the top 15 countries that generate 72% of CO2 emissions in the world. China generates approximately 28% of global carbon emissions.
This notwithstanding, China is not the only country that is guilty of environmental protection weaknesses. While China’s emission rate is double that generated by the US which is the second highest ranked country as indicated in Figure 2, the United States is responsible for more than twice the level of third-placed India [4]. Indeed, environmental pollution and the advocacy for environmental control began in the United States many years before environmental pollution became a problem to China.
Richard Carson’s 1962 best seller “silent spring” played a preeminent role in unveiling the unprecedented health calamity furtively perpetuated by industries through unguarded economic production and exploitation of the environment [5]. The 1st Earth Day in 1970 eventually gave birth to a new global action for environmental consciousness [6]. On this day, individual advocacy groups that were fighting individual environmental challenges, such as oil spills, pollution from factories, power plants, raw sewage, toxic dumps, pesticides, etc., came together to fight environmental injustice without recourse to their political and economic interests [7]. The organisers of this first earth day won the support of both Republicans and Democrats, urban and rural dwellers, rich and poor and business, and labour union leaders to encourage enterprises to aspire towards conscious production and business [8]. These advocacies ultimately led to the establishment of the Environmental Protection Agency in the US in 1970. It also inspired the passage of a wide range of pro-environmental legislations in the US such as the National Environmental Education Act, the Occupational Safety and Health Act, and the Clean Air Act which were the first of their kind. In 1972 and 1975, the Congress of the United States supported the pro-environmental advocacy by enacting environmental laws such as the Clean Water Act, the Endangered Species Act and the Federal Insecticide, Fungicide, and Rodenticide Act [9].
In China, however, advocacy for environmental control and consequential environmental health-related crisis took time to mature. According to Yu et al. [10], the initial interest was to develop and sustain a strong and resilient economy hence other consequential issues were not given much attention. This is particularly in the case where large-scale coal mining which is a major pollutant was the pivot of China’s economic rejuvenation. Over time, however, succeeding Chinese leaders recognised the need for pro-environmental based economic development and has since sought to entrench environmental, social, and governance issues in China civilisation strategy blueprints. This has culminated in the promulgation of China’s ecological civilisation and the beautiful China dream policy [11,12,13].
Due to the rising cases of environment-led catastrophes, the attitude of China towards environmental sustainability in preserving environment health has changed from just a public health sidebar to an important sector within China’s public health system [5]. There is now specific policies to in place to monitor and control the inflow and outflow of hazardous chemicals and biological agents that affects human health [14]. The call for fresh and stronger policies and programs to reduce negative environmental exposures in air, water, soil and food to protect people and provide communities with healthier environments keeps intensifying year-on-year.
The “ecological civilisation and the beautiful China dream” is China’s latest environmental policy strategy to create a pollution free society. Ex President Hu Jintao first proposed this new environmental protection ideology at the 17th National Congress of the Communist Party of China (CCP) in 2012. According to Ex President Hu Jintao, the proposal was to give “sustainability” the same attention as China’s economic development [15]. According to Ex President Hu, this new sustainability vision he was to go beyond filling a theoretical vacancy in China’s socialism and offer a future-oriented guiding principle based on an understanding of the extremely high price to be paid and irretrievable losses to incur if interest in sustainability delays further [16]. At that time, it was estimated that 62% of rivers in China had been seriously polluted while 90% of waterways flowing through urban areas had become so contaminated [8]. It was further estimated then that nearly 300 million Chinese lacked access to clean drinking water and several localities could not fulfill global pollutant emission reduction and energy saving quotas [17].
In 2015, China formally adopted a comprehensive ecological civilisation master plan for systematic and institutional reform. This master plan among others outlines a series of principles as well as short- and long-term objectives that needed to be achieved. The master plan envisaged that by 2020, China would have completed the institutional set-up to achieve ecological civilization [18]. In July, 2018, Current President Xi Jinping received the approval of the 18th National Congress of the Communist Party of China to engrave the “ecological civilisation and the beautiful China dream” into the country’s ideological framework for socio-economic development popularly known as “socialism with Chinese characteristics” [19].
Its past the year 2020, (the year predicted in 2015 to complete the institutional set-up to achieve ecological civilization), yet success is still far in sight. China has made a modicum of achievements towards environmental protection. This notwithstanding, the pace of progress towards enhanced air and water quality in China is too slow and the successes chalked so far seems unimpressive considering the huge investment China has committed to environmental sustainability in the past years. Unfortunately, China does not have many sympathizers in this course. Its sustainable actions and inactions are scrutinized mercilessly across the globe. Commentaries about China’ s geopolitical stance often suffocate even the smallest of achievements in environmental pollution [20]. This naturally creates the paucity of studies that independently, integratively and systematically evaluates the progress of the new China in the pages of environmental health protection. This review therefore fills this gap by interrogating the current stock of studies about China’s environmental progress. We seek to systematically track China’s progress towards environmental health targets within the complexities of air and water pollution challenges since the proposal of its “ecological civilisation and the beautiful China” dream.

2. Materials and Methods

This study employed an integrative review approach. An integrative review summarizes past empirical or theoretical literature which is then used to comprehensively access a particular phenomenon or problem. Integrative review is usually undertaken where full scale meta-analysis or systematic analysis of one form or another cannot be carried out. Thus, integrative review allows for the combination of various methods to synthesize the findings. This notwithstanding, aspects of the PRISMA model were applied to ensure a rigorous review process. The PRISMA model (The Preferred Reporting Items for Systematic Reviews) was developed by a consortium of experts who developed it as an enhancement of the QUOROM Statement (Quality of Reporting of Meta-analyses) which was developed in 1991. The entire model outlines the systematic procedure and graphical description of the set of activities that a researcher must undertake to obtain a good systematic synthesis of the extant literature. Prior to the PRISMA model, other systematic scoping strategies dominated. The predecessor QUOROM Statement (Quality of Reporting of Meta-analyses) was developed in 1999 to guide the process of systematically reporting meta-analysis of randomized control trials. The PRISMA Model was however developed in 2009 to improve the quality and the transparency benchmarks of the reporting process of other forms of systematic reviews. Figure 1 is the flow chart of the PRISMA model applied to this research. As in the case of Baranovitch [21], environmental health was treated as a multidimensional construct. It is influenced by political, economic, socio-cultural, technological, ecological and legal and other invisible factors. This is more so in the case of China which has topped the world environmental pollution chat for so many years.
The complexity and multidimensional nature of environmental concerns is well articulated by Ahmed [22] who argues that causal linkages between pollution sources, exposure pathways and impacts to environmental quality and human health and other environmental problems is like a maze with confusing routing paths. This complexity of the relationships between environmental factors and human health takes into account multiple pathways and interactions that come closer in one instance and move apart with visual illusions that confound even the most developed economies. Moreover, some of these factors have unidirectional effect whereas others have bi-directional or multidirectional influence on environmental health. China’s ecological civilisation attempts to design a seamless set of relationship that connect these factors and harness them into a beautiful China dream with high air and water quality. To this end the methodology applied to carry out this research took cognisance of the dynamic and constantly evolving nature of environmental health, air quality, water quality etc. Firstly, environmental drivers of environmental health, namely the air and water quality, were extracted from the current stock of literature and clustered, summarized, analysed, and reported accordingly.

2.1. Search Strategy

Between April 2019 and April 2020, a search was conducted among 8 bibliographic databases to obtained previous studies on environmental health indices in China especially, air quality and water quality. Initially, 12 databases were shortlisted but were screened down to 8 after screening the related contents, degree of access to database and the quality of information. The final 8 shortlisted databases used in the study were the Web of Science, SCOPUS, EBSCO, Directory of Open Access Journals, Education Resources Information Center, Pro-Quest, Digital Library of the Commons Repository and Social Science Research Network. A distinct and hierarchical search cluster term i.e., main topic (environmental health, environmental pollution, and environmental health policy), subtopic (air pollution, water pollution ecological civilisation, beautiful China dream), specific theme (cancer villages, groundwater quality, lakes and rivers quality etc.) were defined to search information in each database.
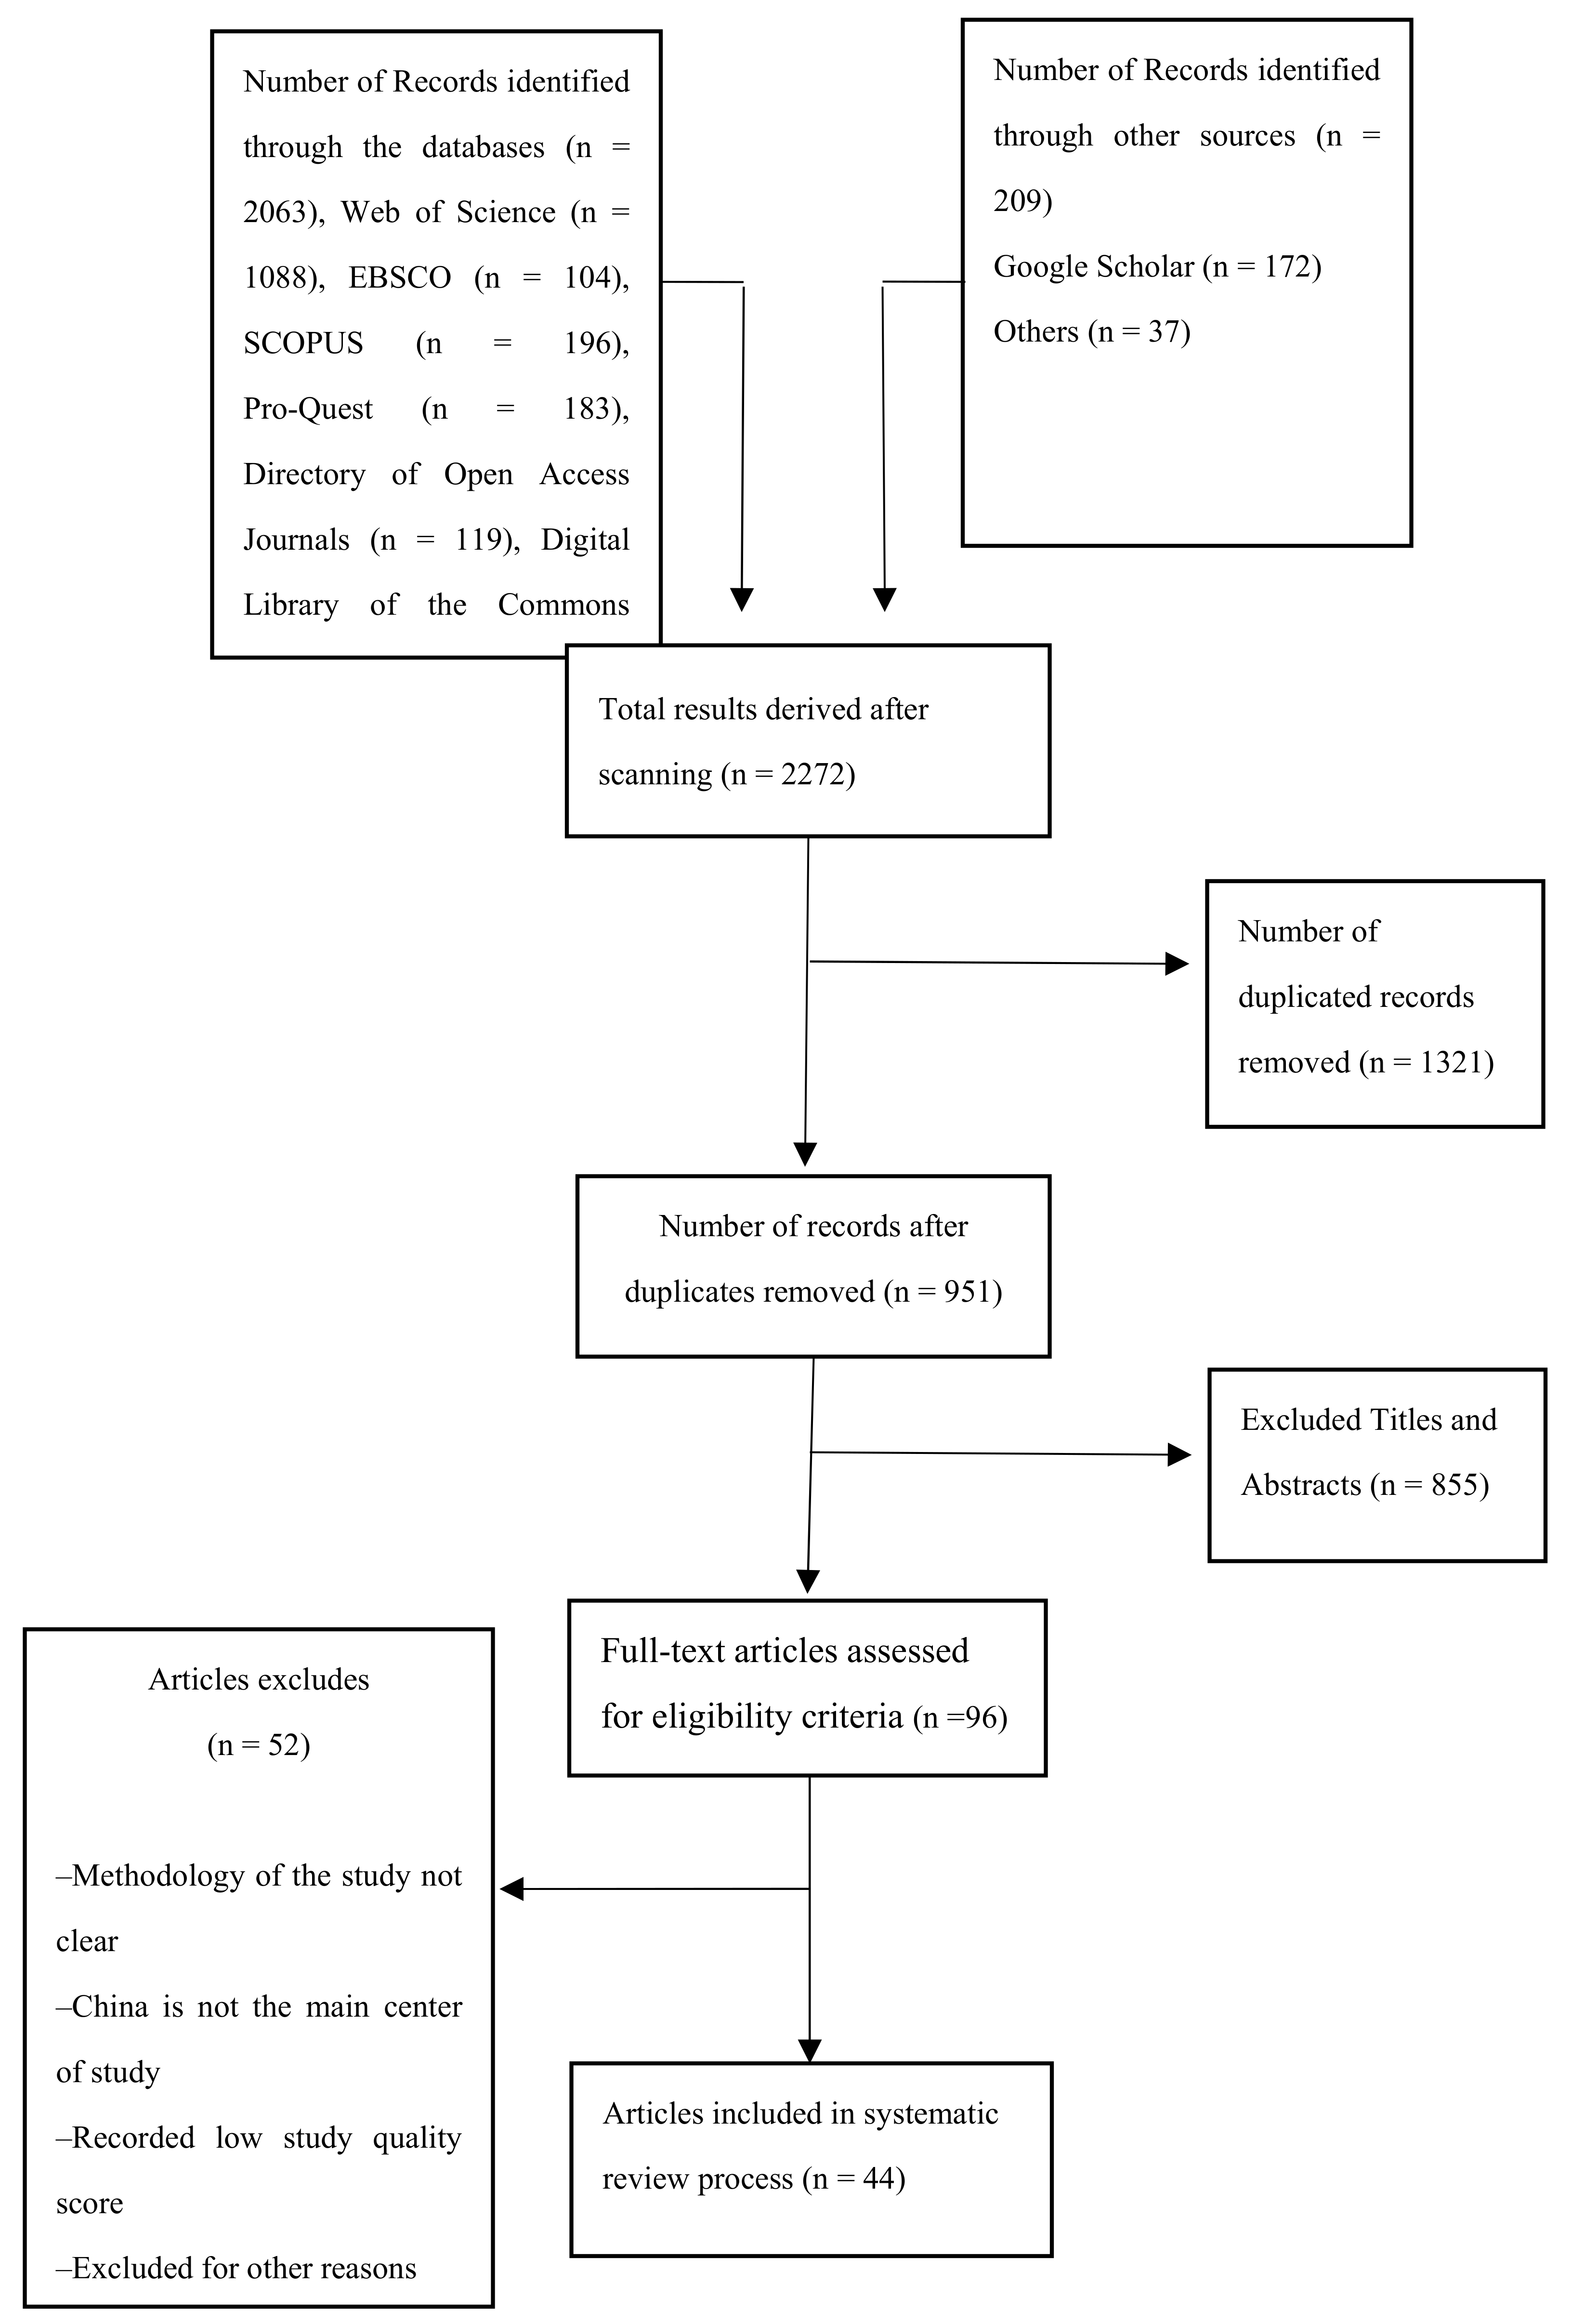
Narrative search procedures were also applied to select the main articles. In line with the requirements of the PRISMA model, search terms were combined through Boolean operators like AND/OR. The author and well-trained research assistants (mainly PhD candidates) entered each of the key subject terms, main topics, subtopic, and themes individually in English language. The keywords used to search the articles included the following; air pollution, water pollution, CO2 emission, PM2.5 concentrations, fresh water availability, population-weighted PM2.5, environmental absorptive capacity, ozone and particulate matter, ozone concentration, atmospheric CO2 concentration, indoor pollution environmental monitoring, air pollution, China’s environmental policies, household air pollution, lake water quality, indoor pollution, environmental ratings, water quality, surface water, river water, ocean water, ecological civilisation, death rates from outdoor, ambient particulate matter pollution. To improve the precision of the searches and sensitivity, truncations and wildcard characters were used. The initial search did not discriminate between the type of publication, time frame for publication, design of the study and the publication mode (peer review or others). The initial search yielded a total of 2063 papers as shown in the flow chart in Figure 3. The number of articles obtained from the database was supplemented with 209 additional articles that were procured by hand searching other sources such as Google Scholar and Science Direct. Thus, a total of 2272 articles were retrieved after the initial task.

2.2. Screening

The articles were screened using two steps. Firstly, the article was screened to remove duplicate articles. This was done by importing all the 2272 articles into four citations software namely. The four-citation software was used simultaneously to serve as a validation technique or ensure that they all returned the same results after the process. This was conducted by the support of the researcher and trained research assistant with specialisation in library and archival reference management systems. A total of 1321 duplicates were detected and removed from the four-citation software. The final compilation was compared between the four-citation software for a second time. The researcher then manually inspected and validated the final list of qualified articles to move to the next step. Thus, the remaining 951 were then carried to the next level of analysis.

2.3. Eligibility

The researchers applied strict eligibility criteria to ensure that only well qualified articles are carried over to the final review phase of the systematic review. The first criterion was the language of publication. The study admitted only articles published in the English language. Secondly, the article should be focused on China and should have been published within the last 5 years were admitted. This timeline was agreed to be the first time that the then Chinese President (Hu Jintao) proposed the ecological civilisation agenda. Next, the selected article must be a peer reviewed article (quantitative, qualitative and mixed, primary or secondary research). In the event the selected article is not a peer reviewed article, then it must be a report by a state agency, internationally recognised bodies such as the United Nations, IMF, World Bank, etc., or a highly respected professional body known for their involvement in the area of environmental health across the globe.
A typical example of this type of institution is KPMG, Price Water House Coopers, an international development agency, or an official document of a multinational company. In any specific case the decision to include an article was solely determined by the first author even though the research assistants offered their full professional advice however goodness of fit of articles with the eligibility criteria was the main consideration to include an article. All publications that were in dispute were validated and resolved through a hierarchy of other considerations and deliberations among the research team members until consensus was reached to accept or reject its inclusion. At the end of this process, a total of 44 articles were shortlisted for the final extraction process.

2.4. Data Extraction and Analysis

Finally, the data extraction and analysis were conducted to summarise the shortlisted articles. The standard practice is to qualitatively evaluate them and synthesize in tandem with the objectives of the research. This activity was conducted through a four-step process using content analysis procedure. The eligible articles were first scanned for environmental pollution, environmental health, air pollution, water pollution reports, statistics, targets, challenges, policies and strategies in China. In the second step, the extracted information was coded and extracted by the research team based on an inductive approach. Overlapping information from different research articles were counted only once. In the third stage the quality of research design and methodology and basis of report (where report is not a peer reviewed article) were strictly assessed. In the fourth stage, the main information (theme) and dimensions of study of each article were extracted into a matrix. The authors discussed them with the expert research assistants in April 2020. The feedback was integrated into the final analysis.

3. Results

3.1. Description of Studies

The descriptive characteristics of the final 44 articles that were extracted for final analysis have been presented in Table S1. The result shows that 16 of the articles were focused on air pollution alone whereas 22 of them focused on water pollution. The remainder focused on pollution in general or climate change. Thus, fifty percent of the studies involved lab-based experiments whereas 20% were quantitative studies. 30% of the studies were qualitative studies. The 44 studies were conducted across the length and breadth of China. One of them compared a situation in China and the United States. The range of study covered most of the provinces in Greater China. At least one research paper emanating from each of the six main zones in China, namely Northwest, South West, North, North East, South Central, and East China, was reviewed in this study. There were more studies undertaken in Southern part of China (63.9%) than there were from the northern part of the country. The theme of the studies reflected the objectives of the research outlined in the first section of the study and the details are shown in Table S1.

3.2. Study Quality

The quality of the selected studies was evaluated using the Mixed Methods Appraisal Tool (MMAT). The MMAT method has been used for more than 10 years and is considered a robust technique for systematic review. The MMAT method is preferred in assessing the quality of the articles because it enables a systematic reviewer to accurately evaluate the quality of articles conducted using quantitative, qualitative and mixed research methods and this is the case in this study. This view is supported in the work of Pluye and Hong (2014) who argue that, over time, the MMAT tool has become a leading quality assessment tool to determine the inclusion and exclusion of quantitative, qualitative and mixed methods articles for systematic reviews. The assigns scores to specific research quality benchmarks. The aggregation of the scores is used to determine the quality of the article.
The MMAT scores obtained for the articles reported in this study is presented in Table S2. The scores ranged between 25% and 100%. 18 studies received 70% rating based on the MMAT criteria, whereas 14 studies (80%) received 75%. Similarly, 20 studies received 80% and only five scored 100%. The most frequently occurring weaknesses in the selected studies were the failure to disclose the influence of the researcher’s background and orientation on the research process and outcome and the role of funding agencies in the research process. A number of the studies also lacked clear description of the sampling procedure, especially with quantitative studies. The reasons for electing to study specific cases such as air pollution, water pollution, cancer villages, etc. were also not elaborated by most of the studies.

3.3. Air Pollution Challenges Facing China

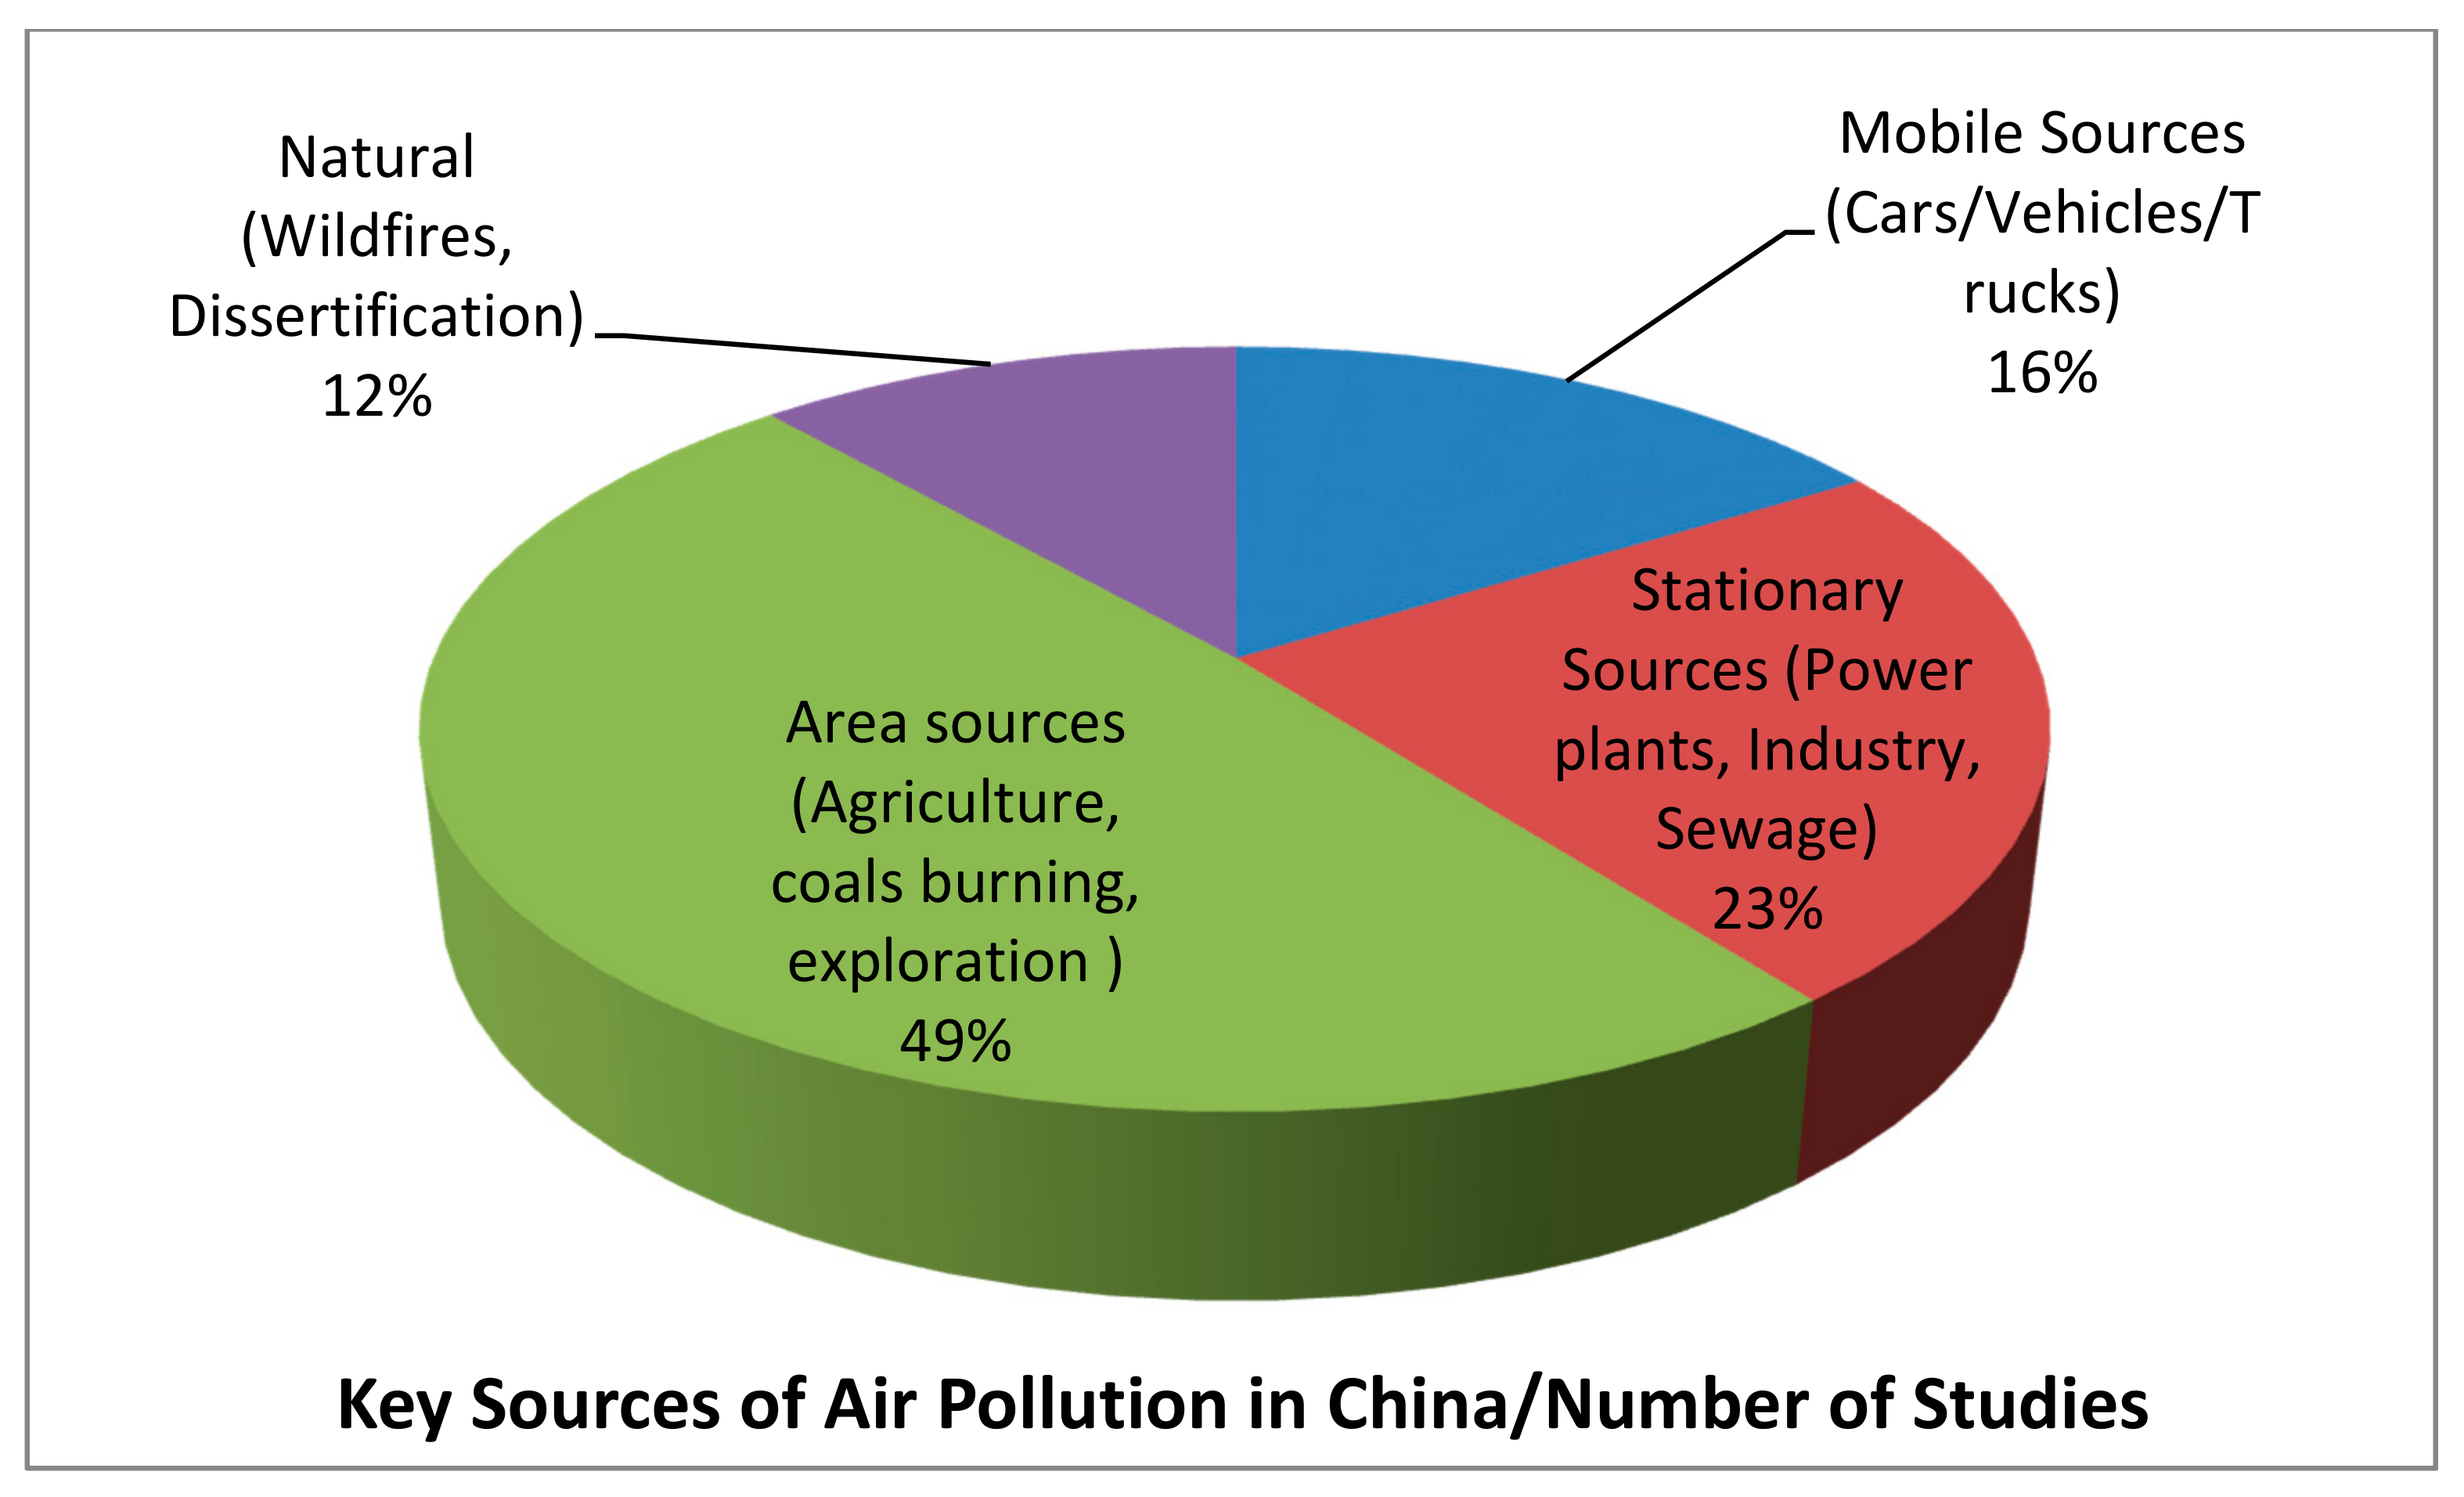
A number of the selected studies acknowledge the fact that the China has shown exceedingly high level commitment to environmental concerns within the last decade than previous years [23]. The notable environmental concerns were air pollution, water pollution, and desertification (State of Ecology & Environment Report Review, 2020). The most prominent topics about air pollution that were discussed in the various studies are outlined in Figure 4.
Figure 4 shows the distribution of studies regarding the key sources of the air pollution in China. 49% of the studies were dedicated to area sources of air pollution such as agriculture, urbanization, and coal mining. Further, 23% of the studies devote their work to stationary sources of air pollution which comes from power plants, oil refineries, industrial facilities, and factories while 16% of the studies are devoted to pollution emanating from mobile sources such as cars, buses, planes, trucks, and trains. The remaining 12% of the studies focuses on air pollution from natural sources such as wildfires and desertification. It is not by coincidence that the larger percentage of studies is interested in pollution from areas sources. In China, coal mining is one of the major sources of air pollution. As the production house of the world, industrial facilities and factors as sources of pollution is also significant hence its importance to the studies that were examined.
In these studies, the authors emphasize that for a long time, poor air quality became normal daily challenge in several parts of China. Generally, any air quality rating that exceeds 300 on the World’s air quality scale means that the air is unsafe for breathing [24]. Technically, people living under such air conditions must be advised to stay indoors with an air purifier running and they must remain as motionless as possible to reduce excessive inhalation of bad air. However, the case in China is often different. In some instances, air quality in Beijing alone can exceed the 300 threshold over 20 consecutive days [25]. In some of the major industrial cities in China air quality ratings above 500 have become usual and this may persist over several days. For example, in January 2017, an air quality rating of 886 was recorded in China and this is interpreted as eye bleeding because it is comparable to living in a smoke lounge [19].
Three reasons are extracted from the studies as accounting for this state of excessive pollution. One strand of studies such as [20,26,27,28] blame this phenomenon on high number of manufacturing industries located across China that emits excessively high levels of harmful substances into the atmosphere. Other studies such as [29] think coal burning for energy is China’s main source of pollution. Until recently, coal was the main source of electric power driving China’s economic development. Currently, 47% of all coal burnt in the world is done in China. This is nearly the size burnt by all other countries in the world. Guo et al. [30], explains that Beijing’s poor air quality is exceptional because it is surrounded by a vast network of coal burning power plants.
The set of studies also blames the rapid increase in the number of motor vehicles, trucks, trains etc. as the main source of pollution in China. These have shifted the conventional coal combustion type of poor air quality to a mixed coal combustion/motor vehicle emission in large cities such as Shanghai, Guangzhou, Hangzhou, Nanjing, Shenzhen, and Chongqing.
According to Ma, et al. [31] these different sources emit poisonous substances such as sulphur dioxide molecule (SO2), nitrogen dioxide (NO2) and inhalable particles (PM < 10 μm in aerodynamic diameter; PM10). These are the critical pollutants in China [32]. Generally, SO2 and NO2 levels are not very different across China (national annual average PM10 of 121 μg/m3 nationwide), however, the PM levels in southern cities (annual average PM10 of are 102 μg/m3) are much lower than those in the northern part of the country (annual average PM10 of are 140 μg/m3). On the other hand, the annual average concentrations of SO2 and NO2 nationwide are 66 μg/m3 and 38 μg/m3, respectively, which far exceed global allowable limits respectively [32].
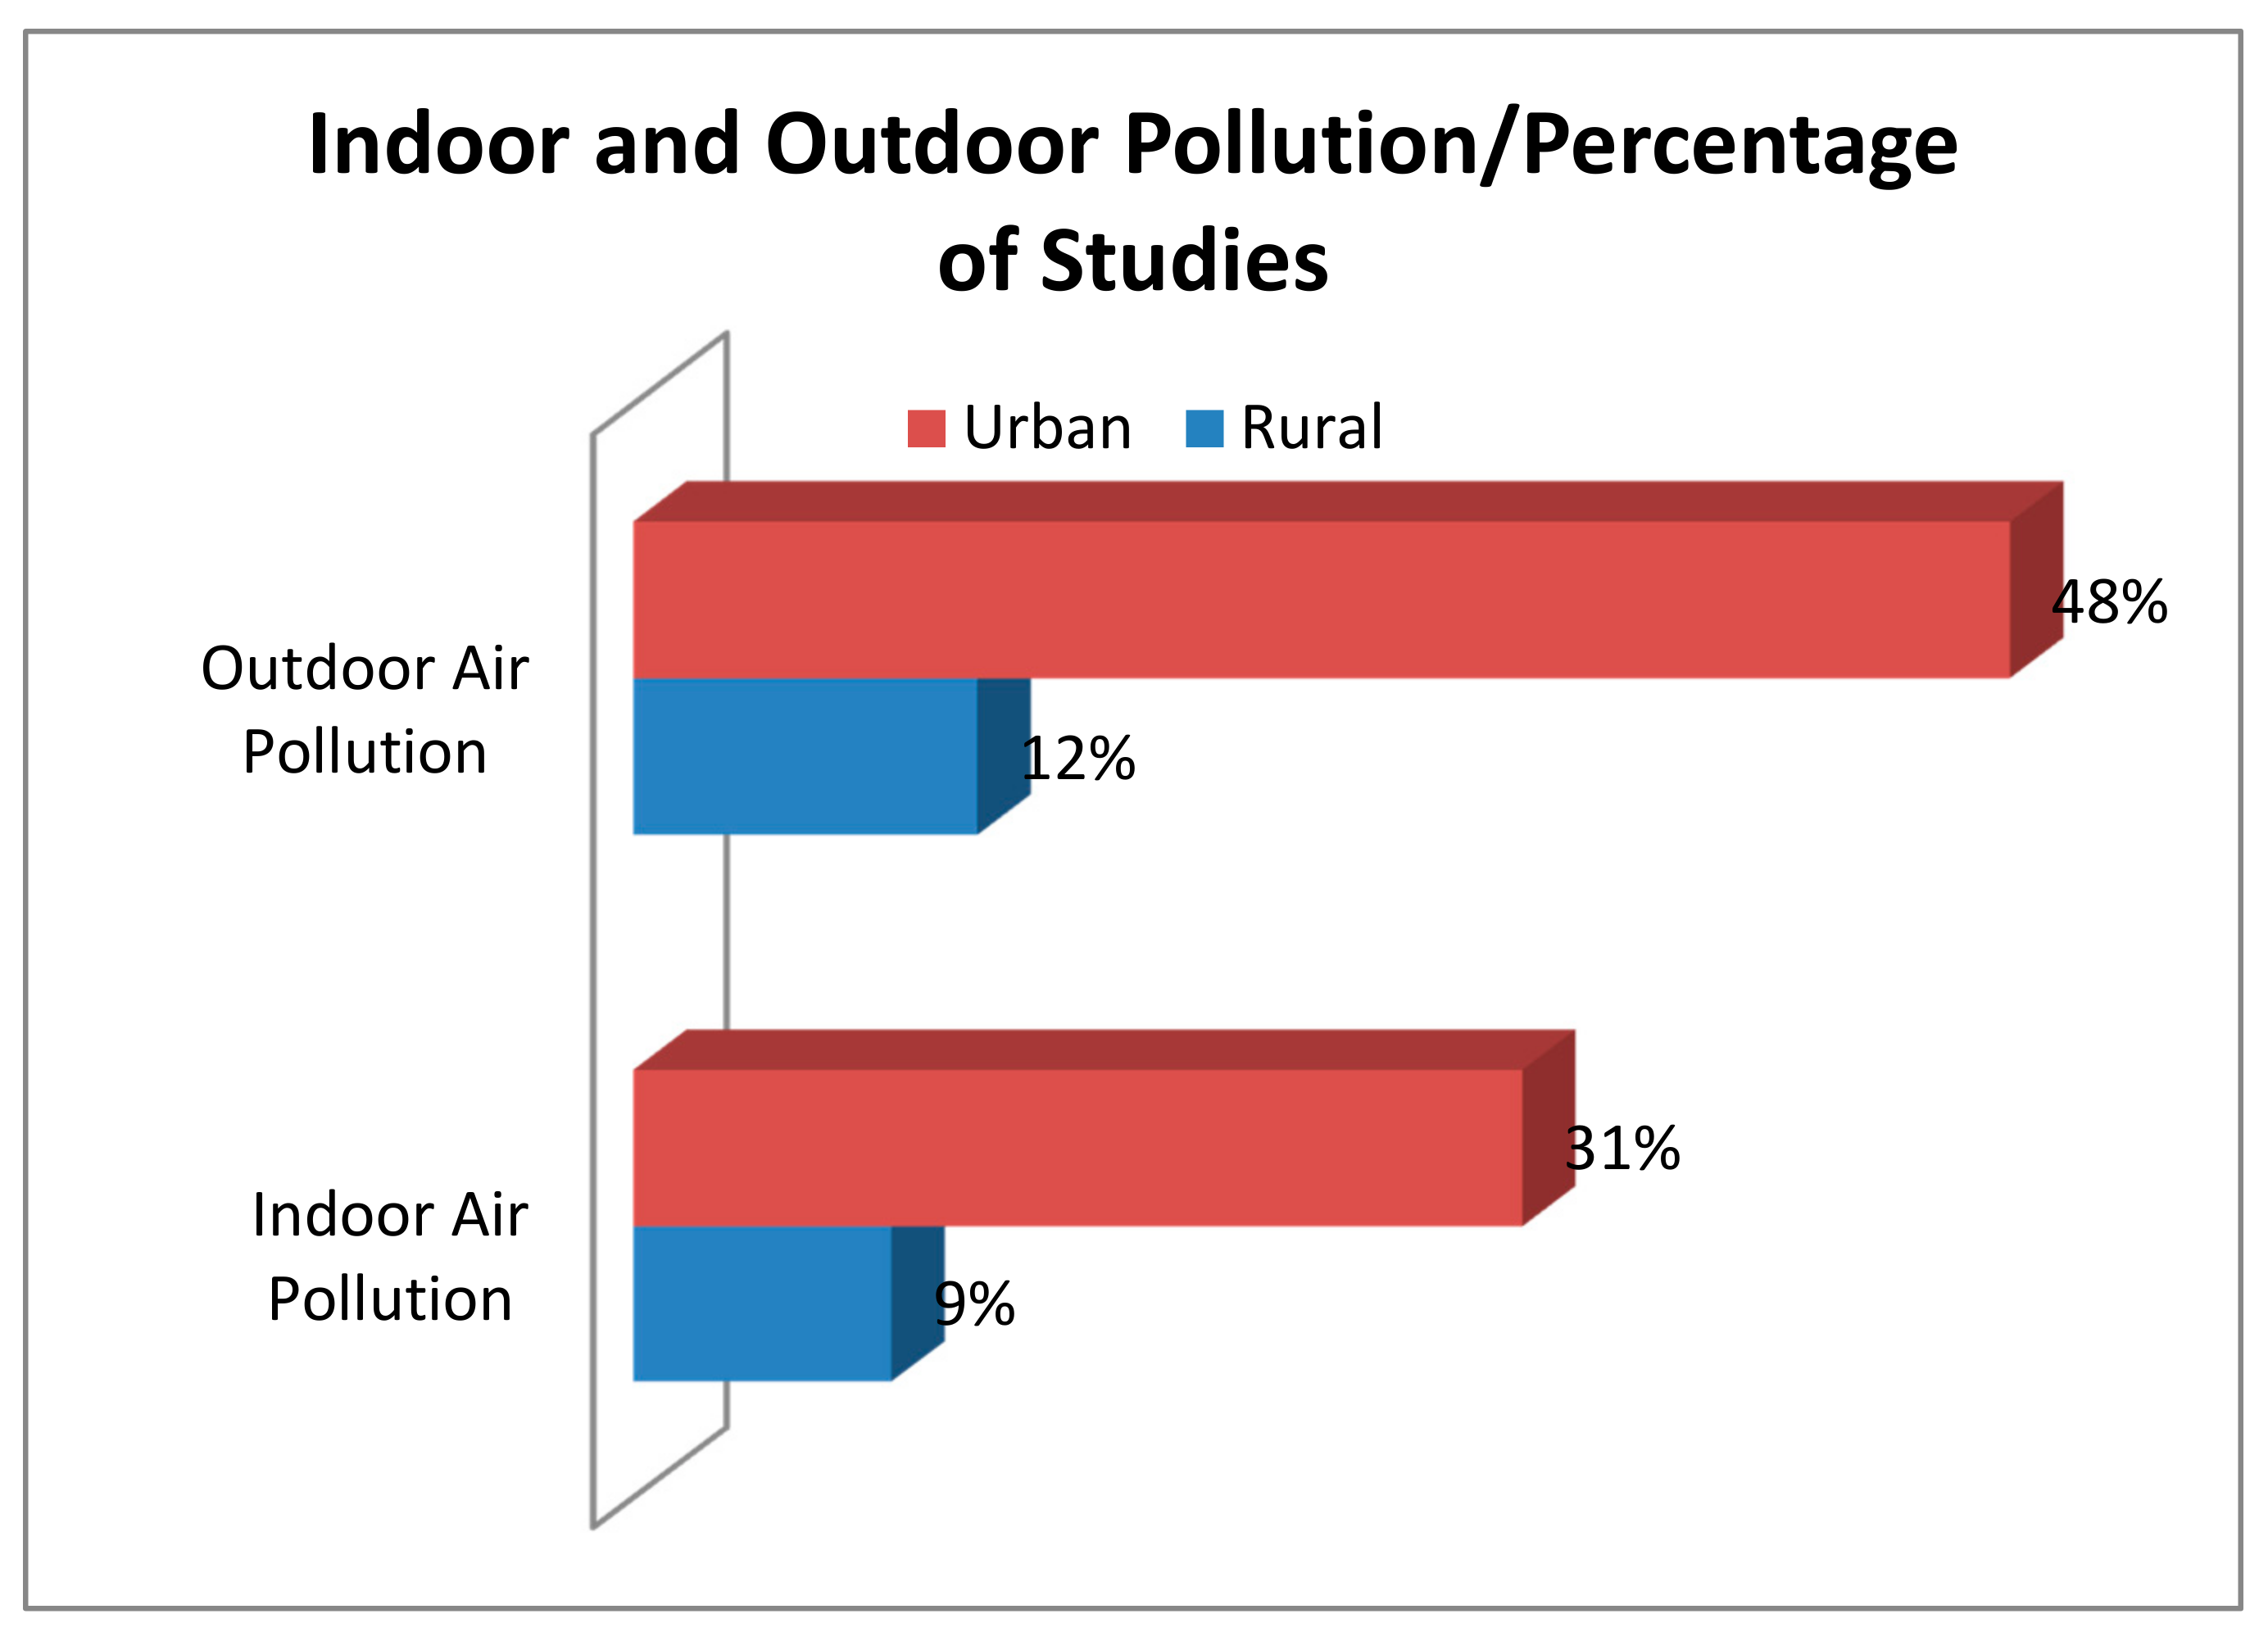
Figure 5 shows the concentration of air pollution studies in urban and rural areas of China. Consistently, both outdoor and indoor pollution in urban parts of China dominates the studies. Moreover, 48% of the studies are devoted to outdoor air pollution in urban China whereas 31% of them are dedicated to indoor air pollution in China. The figure also shows the limited interest of studies in rural air pollution in China. For example, only 12% of the studies were interested in outdoor air pollution in China whiles 9% focused on indoor air pollution in China. Zheng, et al. [33] report that China has 16 of the 32 most polluted cities in the world. The poor quality of air quality in Urumqi (Urghur-Xinjiang Autonomous Region), Lanzhou (Gansu Province) and Linfen (Shaanxi Province), Xingtai, Baoding, Shijiazhuang, Handan, Hengshui, Tangshan, Langfan, Cangzhou, and Zhengzhou consistently rank high among the world’s most polluted places. The pollution in these place is of great concern inside and outside China because, the pollution notwithstanding, these areas are among the least developed parts of China [34].
In a survey among Linfen’s residents in the Shaanxi province where two-thirds of China’s coal is produced, the residents literally claimed to choke on coal dust in the evenings [35]. To ameliorate this challenge, the authorities in Linfen city has instituted measures to replace small, highly polluting plants with larger, cleaner, more regulated facilities, to cut toxic emissions and shift from coal to gas for central heating. Even though these initiatives have provided some interventions, these are not significant enough to overturn the many years of accumulated environmental health damages emanating from coal mining in the city and its environs[36].
Environmental pollution and the consequential environmental health crisis for Urumqi (Urghur-Xinjiang Autonomous Region) is very critical considering the fact that it is located in one of the poorest autonomous regions in China. Together with Tibet, they form the heartbeat of political and religious resistance against the Communist Party of China [21]. Further, Urumqi and other cities in the autonomous region are home to nearly 11% of the minority ethnic groups in China and these have a history of poor access to healthcare among other socio-economic challenges. This is compounded by the fact that the territory lie nearly 900 m above sea level which presents existing breathing difficult at such a high altitude even with normal clean air [37].
Like Linfen city, Urumqi’s air poor air quality emanates from the large number of coal-fired power plants in the city that dampens the overall air quality. Sometimes an underground coal fire can burn continuously for 50 years. A typical example is the Terak minefield underground fire that burnt continuously for more than 50 years until it was put out in 2007 after persistent protest from within and outside China [38]. Urumqi holds the dubious honour of going 119 continuous days with air quality exceeding Grade II, which is the highest number of days in the region [39].
The precarious difference between Urumqi’s pollution and those in other provinces is that desulphurization technologies used in other provinces are barely available or utilized in Urumqi. This leads to high retention of SO2 particles [39]. The situation has further aggravated the already dark sky in Urumqi since lack of desulphurization alone contributes nearly 70,000 t of toxic gases per year since the 1950s. Urumqi has a lot of underground coal fires which are hazardous because it cause cave-in when the coal turns to soft ash below the surface [40]. The 2017 Xinjiang Statistical Yearbook showed that Urumqi recorded the worst NO2 and SO2 and the third worst PM10 levels among all major cities in China in 2017 (State of Ecology and Environment Report Review, 2020).
Lanzhou is the capital city of Gansu province in north-western China. Lanzhou city also features prominently in the air pollution in China. Significantly Gansu province is the poorest of the 34 provinces, municipalities, special administrative regions and autonomous regions in China [41]. The authors reveal that in 2011, Lanzhou was ranked the most polluted city in China but the status has passed on to Xingtai city the Hebei province not because pollution has improved in Lanzhou but has increased dramatically in Xingtai city [42]. Air pollution from sandstorms, factories, and traffic emissions constitutes the main source of the crisis.
Unfortunately, Lanzhou is surrounded by mountainous areas some of which peak up to 500–600 fts above sea level. This trough-shaped topography traps air pollutants at the ground level, resulting in well-documented poor air quality [43]. Periodic analysis of the characteristics of Lanzhou’s ambient air pollution shows that its PM10, SO2 and NO2 concentrations have consistently exceeded allowable health guidelines [44]. Previous research studies have consistently linked poor air quality in Lanzhou to the high birth defects, low birth weight, Pre-term birth, intrauterine growth retardation, infant death, and disability and other respiratory diseases.
In a population based control study, Zhang, et al. [45] found at that congenital malformations of cardiac septa were associated with exposure of pregnant women to PM10 especially in the second trimester of their pregnancy while SO2 exposures at any point during the pregnancy could lead to similar results. A synthesis of the findings of time series research in major Chinese cities namely Beijing, Shanghai, Chongqing, Shenyang, Wuhan, and Taiyuan further corroborated the existing notion that persistent exposure to minimum and short-term air pollution is associated mortality or morbidity [46]. Specifically, the authors found out that morbidity and mortality risk estimate per unit increase in air pollution levels among the Chinese population is similar to the magnitude of risk estimated in other parts of the world. A recent study in Hong Kong, Wuhan, and Shanghai supports the evidence of short-term risks [47], with substantial health effects detected at air pollution levels below minimum air quality standards in China.
Currently, a new national-level air pollution time-series study, by the China Air Pollution and Health Effects Study (CAPES) is under way. In addition, several on-going panel studies are examining associations between air pollution and subclinical health outcomes. These panel studies should provide a unique opportunity to assess the public health benefits of air pollution reduction in a city where air pollution levels have been high. China’s main strategy to overcome air pollution is an expansion in renewable energy capacity. The goal of the government is to spend $360 billion on renewable energy by the end of 2023. In addition, it is also the goal of the Chinese government to increase the composition of renewable energy in the national electricity consumption to 35% by 2030. If these standards are met, China would have produced renewable energy capacity of the same scale as the total electricity demand for the US. This would represent half of the world’s green building floor space. China has a proven track record of achieving ambitious long term renewable energy goals set forth within China’s Five-Year Plan.

3.4. Water Pollution Challenges Facing China

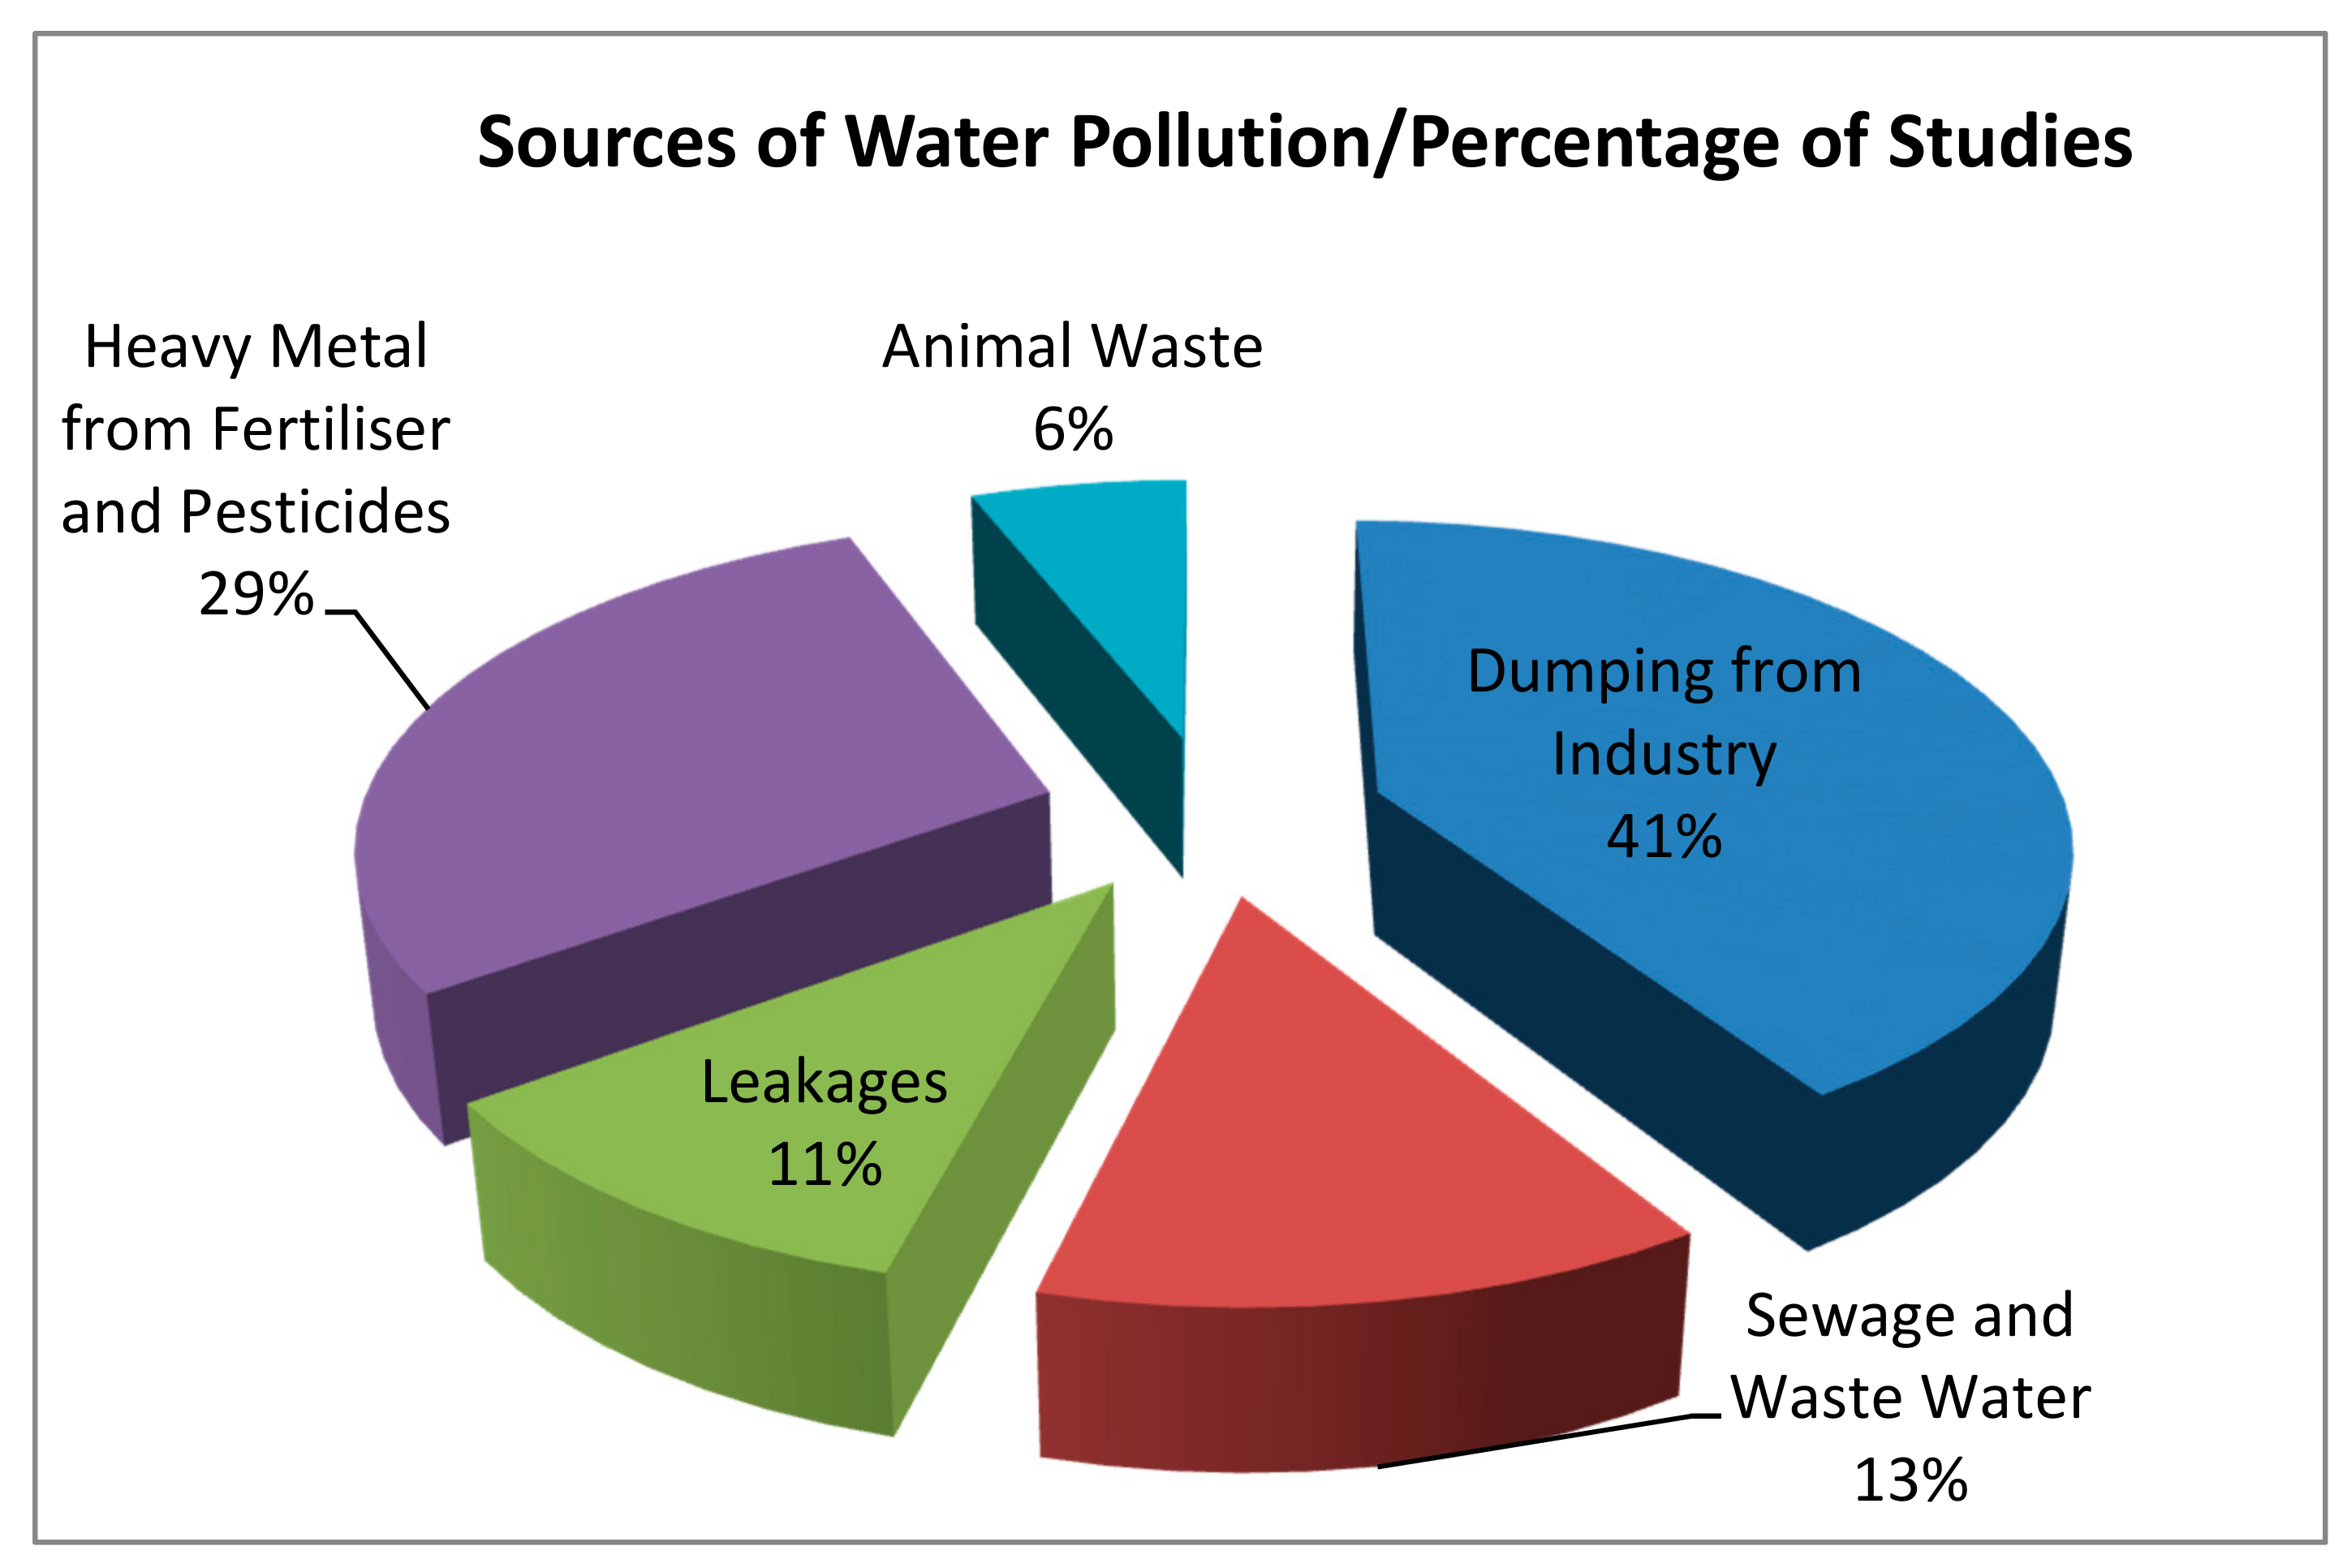
The problem of water pollution in China was mentioned by more than half of the selected articles. These studies admit that water pollution in China is receiving some degree of attention in China compared to what pertained a decade ago [48]. Figure 6 summarises the main sources of water pollution in China and the number of studies dedicated to them.
In this figure, 41% of the studies are dedicated to dumping from industry whereas 29% of the studies are devoted to heavy metal from fertilizers and pesticides as sources of pollution. Leakages, animal waste as well as sewage and wastewater are the other contributors to water pollution in China. Despite the persistent effort to control water pollution by the government of China, it remains a major environmental health challenge in China. Dumping of dead carcasses by livestock producers and industrial emissions is a major sources of water pollution in China. In Shanghai, for example, a new local policy to control water pollution was drafted in 2013 after discovery over 16,000 swine carcasses in the city’s famous Huangpu River [49]. The embarrassment from this event encouraged other provinces to rejuvenate the crackdown on water pollution. The Huangpu River passes through Shanghai’s skylines hence a tourism. Besides, it is the main source drinking water for the over 25 million inhabitants of the megacity. The case in Shanghai was only the tip of the iceberg of an endemic water pollution crisis across the length and breadth of China (less prominent cities and villages) without attention [50]. Ma, et al. [51] explains that the crackdown after the post “Huangpu River pollution debacle” were very strict but the strictness lasted just some few months.
A similar dumping tragedy that polluted a water body occurred in December 2013. In this case, hundreds of dead piglets were wrapped in sacks and hurled into a river near Fuqing in China’s Fujian province. Two weeks later, 100,000 kg of poisoned dead fish were scooped up from the Fuhe River in Hubei province. In 2016, 1000 dead ducks were scooped from the Pengshan River in the Sichuan province. The next source of water pollution is industrial leakage and dumping. He and Li [52], discloses that China’s textile industry has matured due to heavy investment and favourable economic circumstances. However, the textile industry has had a paradoxical effect on water pollution in many parts of China. A lot of dye and textile manufacturing companies secretly disposes unused, expired, and poor-quality dye and other hazardous chemicals in strategic water bodies which eventually pollute sources of drinking water for towns and villages along the water body. Most of these companies engage in this type of activity in order to avoid or reduce the cost of treatment of the dyes. For example, in 2011 and again in 2017, the colour of parts of the Jiang River in Luoyang turned completely red after industrial dyes were illegally dumped by a nearby chemical plant. The resulting negative publicity and the environmental health effect inspired a new state-wide clamp down on such heinous crimes [53].
However, these interventions are not well implemented and have emboldened other industries to do the same under cover or without deterrent sanction. The environmental health dangers of dumping dye is further explained by Lin, et al. [54]who reveals that most of the textile manufacturing companies dotted across China uses nearly 8000 synthetic chemicals to bleach, treat, and brighten clothes. Additionally, finishing processes in cloth making require the use of additives that are dangerous to human health, marine life and the environment as a whole. Azo dye for example is the most frequently used dye in the fashion industry and responsible for high intensity hues and poppy red. However, when Azo dye breaks down and metabolizes, they become carcinogenic (cancer causing property). Unfortunately, arylamines and other chemicals emitted from the azo dye used in the textile industry do not easily dissipate but evaporate into the air or are absorbed through the skin [55]. Thus, any human contact with synthetic dyes can trigger allergic reactions, skin irritations, and rashes, or at worse cancer [56]. Persistently, textile manufacturers pollute Chinese water bodies by dumping of Azo dyes into rivers. The negative environmental health effects of Azo dye in China and failure by enterprises to self-regulate had led to the prohibition of 2,4 and 2,6-xylidine used in Azo dye by the China National Standard [57].
Beside the dyes, factories still freely discharge their waste water into lakes and rivers due to poor regulation and enforcement. Wang and Zhu [58] speculate that in the case of China, the enforcement lapses are sometimes genetically engineered especially in situations where influential persons have economic interest in these enterprises, but the allegations are yet to be proven. That notwithstanding, evidence of unsafe factory leakages into water bodies abound in many of the provinces in China. In 2013 and also in 2018, for example, managers of a chemical company arrested for leaking benzene (a cancer-causing agent) into one of the tributaries of River Huangpu resulting in the hospitalization of more than 20 people. Most of these rivers serve as the main source of drinking water for communities along the banks of the river. Cui et al. [59] explain that, besides official complicity, a major reason why water pollution appears to be a daunting challenge in China is the demand for cheaper products. Moreover, multinational companies consistently ignore the need to scrutinise the environmental practices of their suppliers and rather focus on cheaper prices. To this end even though national development in China especially in its rural areas seems to have lifted a lot out of poverty, there is a paradox of health crisis as a concomitant of economic development.
Besides the dumping of livestock into water bodies, another major source of agriculture causes water pollution. Jiang et al. [60] disclosed that the reason why the rate of water pollution in China doubled the predicted figure in 2019 was because the government underestimated the amount of pollution that emanates from agricultural to pollute water bodies. In Sun [61] is the exacerbating impact of farm fertiliser on water pollution is discussed. In Ebrahimi, et al. [9] they reveal fertislise is contains toxic substances hence failure to properly control its use can lead to leakage into rivers to pollute them. Some of these toxic substances include arsenic, fluorine and sulphates which are directly linked to high rates of liver, stomach and oesophageal cancer. Zhaodan Wu and Ye posit that commercial phosphate fertilizers contain small amounts of heavy-metal contaminants which account for a minor proportion of phosphate rocks. Even organic fertilsers such as biosolids (animal manures and sewage sludges) have some proportion of heavy-metal contaminants. The organic complexity of the heavy-metals found in biosolids may impede the rate of chemical reaction in the soil. These heavy-metal become accumulated in the soils with repeated application of fertiliser. Cadmium (Cd) is the most dangerous of these heavy metals, but it is not the only one. Other heavy-metals that can spillover into water bodies through fertilisers include to Some of these heavy metals arsenic (As), chromium (Cr), lead (Pb), mercury (Hg), nickel (Ni), and vanadium (V). To deal with the potential catastrophic effect of these heavy metals, some countries including China have set a tolerance level on the addition of heavy-metal to soil to avert the long-term negative effect associated with prolong exposure. These limits have been set per tillage layer (surface 20–30 cm) of soil where most root activity occurs. China has also instituted some form of control on heavy-metal concentrations in sewage biosolids. Like other countries, it has imposed maximum total and annual loading rates to soil. There are also intentions to impose a phased-in limits on maximum heavy metal concentrations permitted in P fertilizers, or they are already in effect. Most of the fertilizer regulations relate Cd limits to P concentrations, so P application rates dictate Cd inputs to soil. Regulations affecting sewage biosolids include a number of heavy metals, while those concerning P fertilizers only include limits on Cd at this time.
It is also inferred in [62,63] that, in the case of China, excessive pollution induced algae blooms have caused the surface of its lakes and water bodies to turn a bright green with greater problem lurking beneath the surface. For example, it is estimated that about 90% of groundwater in Chinese cities and towns are highly contaminated despite the closure of several pollutant sources and most rural areas in China lack effective wastewater treatment systems.
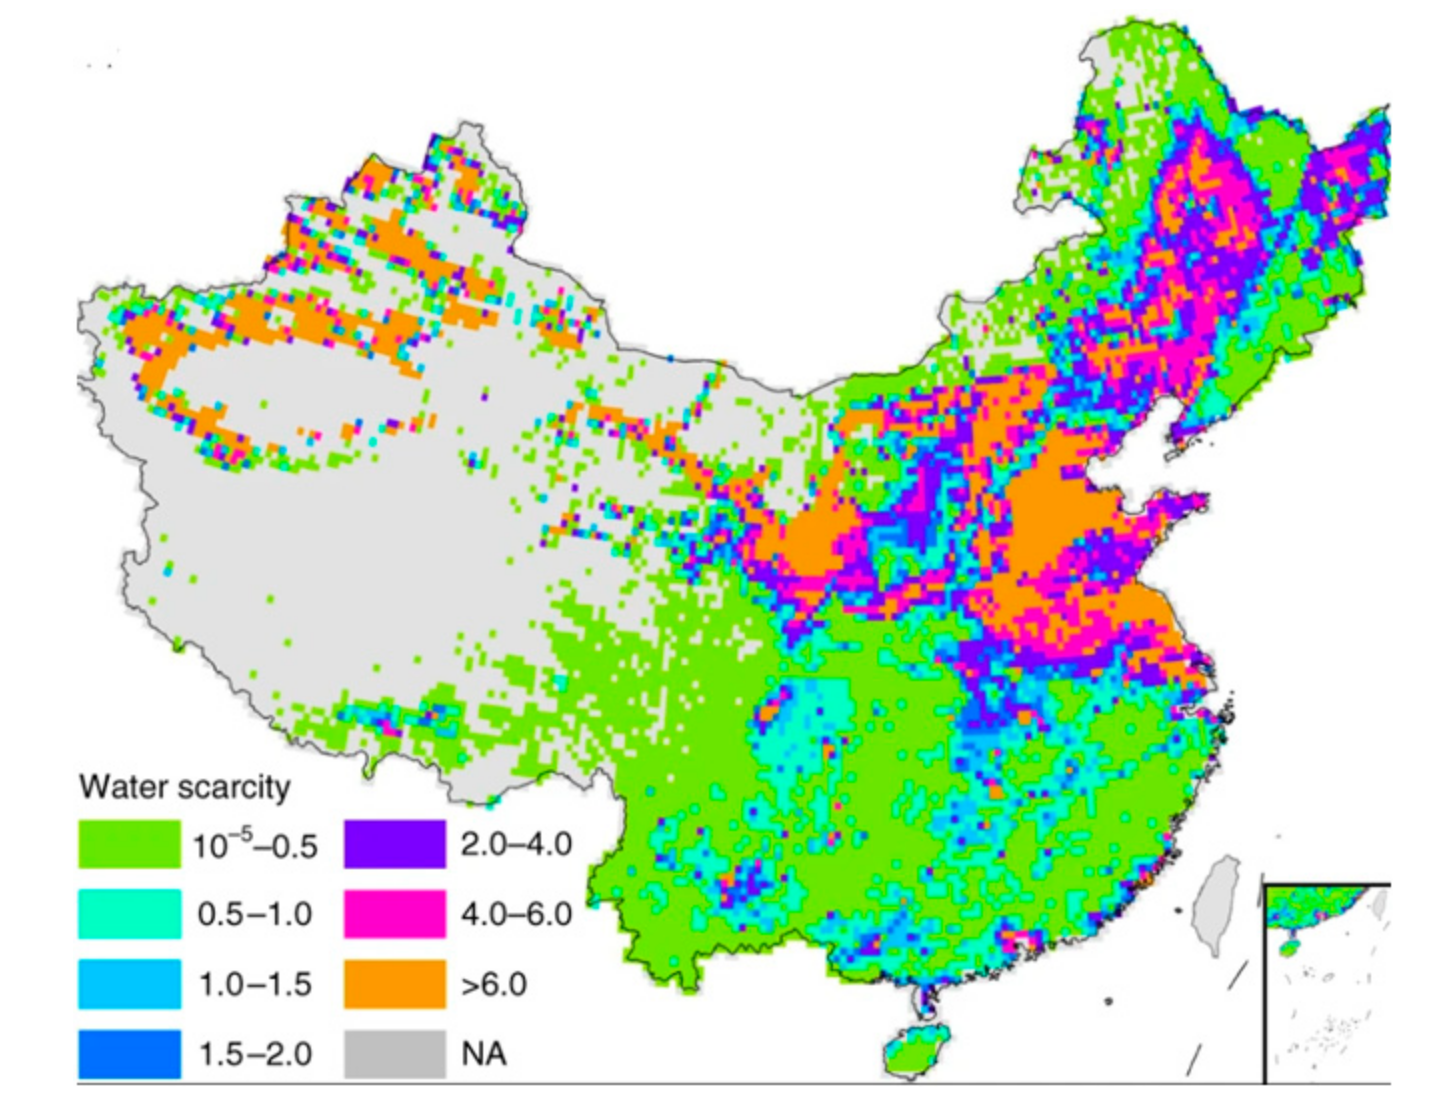
A large collection of the studies confirmed the belief that the water pollution cases in the coastal parts of China is worse than water pollution in other parts of the country. This is the case largely because there are more manufacturing centres that contribute to pollution along the coastal belts than in the inner provinces. Figure 7 does not only confirm this phenomenon, but also confirms the existing notion that water pollution appears to be a bigger problem than it seems in other parts of the country.
According to Gao et al. [64], there is no issue that underscores the challenges of environmental crisis in China than the gradual appreciation of the fact that residents of certain villages are exposed to exceeding levels of pollution even though they cannot be classified as “cancer villages” as suggested by some international media. These are entire towns that have been completely written off as so polluted that simply living there is synonymous with high rate of cancer risk. For years, residents and advocacy groups in villages such as Wuli, Yanglingang, Yangqiao, and 459 other villages have waged a desperate war to draw the attention of government to the high risk of stomach, liver, and kidney and colon cancer in these areas which are mostly near heavy industrial complexes. In Huangmengying village in the Henan Province, it is reported that the rate of cancer infection is even more than the birth rate [65].
In Shenzhen city in the southern Guangdong province in China, the Maozhou River had attained notoriety for pollution. In 2019, a total of 2.5 million tons of pollutants were removed from the river. Over a period the water colour in the towns and villages in its vicinity had changed from white to a shade of orange as a results of the impact of different forms of varying industrial effluent [66]. According to the Guangdong provincial administration, an accumulated amount of 120 billion RMB (about 16.9 billion U.S. dollars) were invested into the pollution treatment of these heavily polluted rivers in Shenzhen and to enhance the landscape enhancement of its surrounding areas [67]. Scientific experiments have revealed the presence of contaminants, such as cadmium and zinc, which are known cancer causing chemicals in rivers across China. Shangba and Wengyuan cities in Guangdong province have gained notoriety for both Cadmium and Lead Pollution in rivers.
For example, in Shangba, Guo, et al. [67] reports that the Lead in the soil was 44 times higher than normal and Cadmium 12 times higher (1). Both Cadmium and Lead are well known for their being a human carcinogen. In 2017, a total number of fishes, chicken, ducks, animals and person that came in long contact with the river died [67]. The 2019 State of Ecological and Environmental Report by China’s Ministry of Ecology and Environment summarises some of the water pollution challenges and achievements. From this report, it is evident that continuous improvement of water and ocean quality remains a major priority in China’s ecological civilisation and beautiful china dream due to its healthcare implications. In 2019 alone the Chinese government spent a total of 53.2 billion Yuan to promote an integrated water, air, soil and rural pollution management. The same year, the national green development fund was established to sustain the program (State of Ecology and Environment Report Review, 2019).

4. Discussion

4.1. How China Can Improve Air Pollution through Ecological Civilisation

Even though ambient air quality in China has improved significantly since the beginning of 2020, a number of researchers believe this is attributable to the outbreak of the novel coronavirus (COVID-19) in December 2019 [23]. With the onset of the virus, a number of economic activities especially factory work was suspended for the first three months of the year while a significant amount of other pollution-making activities has been reduced in China for most part of the year. This notwithstanding, air quality in China remains the worst in the world and its outdoor air pollution is has ramifying public health concerns [9]. In 2019, the World Bank estimated that the health cost associated with outdoor air quality in China alone is 350 billion Chinese Yuan but could reach 500 billion Chinese Yuan by 2025.
This is nearly 4% of China Gross Domestic Product. This assessment is based only on the healthcare expenditure directly traced to air pollution-related cardiopulmonary disease and easily traceable outpatient and emergency department visits [36]. The estimated health–related cost also includes pollution-induced changes in respiratory and other clinical symptoms, lung function and poor immune function. As indicated by China’s Environment Ministry, the problem is that several chemicals and heavy metals that are banned in other countries are still found in many parts of China due to their economic value. These have contributed to the emergence of cancer villages in individual regions, which is the first official admission of the existence of “cancer villages” that have plagued China for decades [68].
These challenges notwithstanding, China has made some persistent progress in the production of clean energy and this has become a global reference point of sustainable economic growth. The clean energy and other initiatives to reduce pollution has caught the attention of very affluent western countries to catch up with China but the clean energy targets and achievements in China have not come on a silver platter [7]. On the contrary, it is the results of several years of planning and commitments, unprecedented in the history of China. For example, in 2010, the NPC outline the major plan for the reorganisation of the energy sector to achieve higher conservation through new energy technologies, and environmental protection initiatives. The NPC devoted a substantial amount of $20 billion US dollars to be able to achieve this objective [69].
Even though the initial cost of clean energy appears to be costly, it remains crucial to China’s sustainable economic development due to the positive health effects relative to other types of non-renewable or unclean air [70]. The long term accumulation of these negative externalities of unclean air can be more debilitating than the cost of clean air both in terms of out of pocket expenditure and loss of human capital that is needed to anchor China’s economic development [71]. Going forward, China must further limit the serious environmental externalities of fossil fuel dependence in some parts of the country especially in Lanzhou, Urumqi, and Linfen cities, etc.
Instead, it must keep the momentum to continue investing heavily to reduce reliance on coals and other fossil fuels which has received global applause over the last two years. In 2019, China invested twice as the US in clean energy technology ($34.6 billion vs. $18.6 billion), propelling it to the number one place in global ranking of clean energy investment [72]. This again places China neck-to-neck with the US to become on the top of the global rankings in total renewable energy production (52.5 GW vs. 53.4 GW).
Despite the fact that China has invested nearly 100% more than the US in terms of clean energy, dirty energy has dominated its economy for such a long time, hence the massive investment in clean energy has only improved renewable energy percentage of the total energy use to 4% which is at par with the US [6]. The competition between China and America in terms of the highest proportion of clean air is critical for the global economy since the two countries alone contribute half to poor air quality across the globe [73]. China must seize the opportunity of the US’s withdrawal from the Paris Accord to consolidates its global environmental legitimacy and brand and consolidate environmental healthcare across. Between 2017 and 2019, China has increased its green energy capacity by nearly 79% as against the 24% increment in the US within the period [74].
China’s ability to pursue and achieve its ambitious renewable energy targets can go a long way to promote safer environment and sustainable economic development. For example, the country hopes to generate 20 GW from solar photovoltaics, 30 GW from biomass, and a massive 150 GW from wind by 2020 which appears to be beyond its reach considering the impact of COVID-19. These investments will be critical in promoting innovation in clean energy which is directly and significantly related to high environmental healthcare. However, these investments alone are not enough to guarantee China’s global leadership in the development of clean energy technology and innovation [75]. Thus, for China to emerge as a leader in clean energy and other environmental technologies, it must improve higher education in science and engineering, invest in infrastructure, fund research and development, and encourage indigenous entrepreneurship and inventive activity.

4.2. How China Can Improve Water Pollution through Ecological Civilisation

The new ecological and socio-economic aspirations of China are engraved in the opening statement of the report of the 18th meeting of the China Communist Party. The statement affirms China’s confidence about its future environmental quality. The statement reiterates China target to become a moderately prosperous society in all respect by 2021 when the CCP celebrates its centenary anniversary and become a modern prosperous, strong democratic, harmonious and culturally advanced socialist country by 2049 when China celebrates its centennial anniversary [70].
A key part of this agenda is to ensure that clean water is available to all citizens in the fulfilment of both national and international obligations. The 2019, report of the State of Ecology and Environment Report Review provides some progress in this regard and China must strengthen its effort to achieve the desired objectives. In China, water quality is graded on a scale of (I–V+). [76]. Water sources with I–III water quality are considered fit for human use in ascending order.
On the other hand, Grade IV–V+ water sources are “unfit for human contact”. The State of Ecology and Environment Report Review (2019) reveals that shallow water and groundwater quality is still far from targets. As of 2019, 85.7% of ground water failed the lowest ground water quality test, classified as Grade IV and V (unfit for human contact). Only 14.4% matched the grade 1–5 category, or fit for human use.
The situation is even worse in the case of shallow water because 46.2% fall below the Grade V category which is classified as highly unfit for human contact. Comparatively, even though Grade I–III category of groundwater improved from 13.8% to 14.4% in 2019, and 14% more of Grade V improved from to Grade V water quality levels, the gains were offset by the deterioration in the quantity of Grade V+ groundwater from 15.5% to 18.8% which is below the 15% target by 2020 (State of Ecology and Environment Report Review, 2019).
A major achievement for China between 2015 and 2019 is that while ground and shallow water quality continues to decline, the quality of national surface water has improved significantly since 2015. Between 2015 and 2019, Grade I–III national surface water quality improved from 64.5% to 74.9% in 2019 while Grade IV–V surface water category improved from 26.7% to 21.7%. Grade V+ national surface water has consistently improved from 8.8% to 3.4% between 2015 and 2019 [77]. The current statistics on the water quality in key lakes and reservoirs also provide some indication of the progress in the water pollution and the consequential effect on human health [78]. Between 2015 and 2019, China recorded year-on-year improvements in the water quality of its key lakes and reservoirs. Most of them have attained Grade I–III. Statistically, Grade I–III water category lakes and reservoirs moved from 66.6% in 2018 to 69.1% in 2019, but the number of grade V+ water quality in lakes and reservoirs has declined from 8.1% in 2019 to 7.3% in 2019 [79].
Together, there are 110 key lakes and reservoirs in this category and more effort is needed to bring them to the desirable level if water pollution-related healthcare crisis is to subside in villages and rural communities in China where most of the effect of pollution is strongly felt on the healthcare of the inhabitants [22]
A major part of China’s effort to improve environmental health is to improve water quality in the seven major rivers, namely the Yangtze, Yellow, Pearl, Songhua, Huai, Liao, and Hai rivers (See Figure 8). The documents that detail their priority for water quality is the Water Pollution and Prevention Control Law (“Water Ten Law”) which was issued in 2015.
This document has set very tough targets on water pollution, prevention and control [80]. It has been promulgated as an umbrella plan that ties in all other key national policies for water scarcity and geographical mismatch in water quality distribution. The Water Ten Law was finally approved in 2016 to become the legal backbone for the Water Ten Plan and came into force on 1 January 2018. The law provides the legislative framework to guide discharge of key water pollutants and water quality improvement targets. The new law also means that environmental violations are going to face more severe punishments. The penalties for excessive pollutant discharge have been increased to RMB100,000 RMBmn, compared to 2–5 times the pollutant discharge fee previously [81]. Currently, the Yellow river is the only river in the northern part of China to meet the Ten Target of 70% in Grade I–III water quality [82]. Between 2015 and 2019, Grade I–III water quality in the Yellow river increased from 66.4% to 73% in 2019. However, the river still contains a lot of pollutants despite the improvement in water quality thus downgrading the Grade 5+ water quality from 12.4% to 8.8%. This falls short of Grade V+ target of less than <5%. The quality of water in the Yellow river is important to national health security as evidenced in the words of President Xi in March 2019. This is because it is the main source of water for food and industry by nearly 150 million people living along its banks).
To this extent China has put forward a special water restoration plan for the ecological protection and high-quality development of the yellow river. The Supreme People’s Court has vowed to punish criminal acts damaging the ecological environment in the Yellow River Basin [83]. This notwithstanding, China’s operational mechanism to map and monitor all sewerage outlets in the Yellow river to fight pollution requires strict supervision and implementation along this large river basin. China must apply the Yellow River Ecological Basin pilot scheme to protect and beautify the yellow river as well.
Water safety and its consequential environmental health effect is the reason why China is investing a lot of money to protect the Yangtze and Pear river basins to achieve water ten targets. These Grade I–III water quality from these two rivers located in the Southern China have consistently outperformed the rivers in northern China [84]. Indeed, they are the only rivers in China that have met the water ten targets in terms of Grade I–III water quality, however, they also have the highest level of V+ water supply. The need to protect the Yangtze from excessive pollution is largely because Yangtze has a lot of socio-economic importance to China. This explains why the government has set a much higher water quality standard for the river since 2018. Through the legislation of the Yangtze Action Plan, Grade I–III water quality level in the Yangtze is expected to reach approximately 85% and Grade IV+ is predicted to be less than 2% by the end of 2020 [85]. Some of the policies that have been implemented by government to effectively promote the agenda have yielded substantial benefits as the water quality has improved from 87.5 in 2018 to 91.7 in 2019 and Grade IV+ water has also improved from 1.8% to 0.6%, meeting both targets [86].
In the case of the Pearl, Grade I–III water quality has not been stable. For example, between 2017 and 2018, the water quality declined from 85.6% but in 2019 it has seen marginal improvement from 84.8% to 86.1%. At the same time Grade V+ water quality in the Pear River has also improved from 5.5% to 3%. Despite these achievements, much still remains to be done if China is to achieve high environmental protection of the Yangtze and the Pearl River Delta to provide sustainable quality water for the citizens along its banks [87]. This is because the success is attenuated by the persistent decline in the water quality along the tributaries of the Pearl River. For example, the persistent dumping of dye and other dangerous chemicals may erode all the gains been made in other areas of the rivers; protection. The governed must expedite action to review both the Yangtze River Protection Act and the Pearl River Delta Ecological Protection. Even though the Standing Committee of the National People Congress has indicated its willingness to review these documents, it’s long overdue and extra effort to ensure quick review and legislation can compensate for past lapses [88].
The protection of the Songhua River and the Huai River requires substantial investment to improve clean water availability from them since they are part of the top seven important rivers in China. According to Wang [66] both the quantity of poor water (Grade V+) in both the Huai and Songhua Rivers reached 2.8% and Hua 0.6% respectively. However, the two rivers have not been able to improve on the percentage of Grade I–III levels to the estimated 70% in the Ten Water Target [89]. In 2018, Grade I–III water quality in Songhua River declined 57.9% to 66.4% which still falls short of the 70% benchmark. In the case of the Huai River, the percentage of Grade I–III water quality benchmark is still unmet since due to marginal the marginal improvement from 57.2% to 63.7% in 2019 (State of Ecology and Environment Report Review, 2019). This implies that currently the Huai and Yangtze rivers have the lowest Grade V+ water quality category performance at 0.6%. The grade I–III water quality in the Liao River has improved from 48.9% in 2018 to 56.3% in 2019 whereas that of the Hai river has improved from 46.3% in 2018 to 51.9% in 2019. Similarly, the Grade IV+ water quality in the Liao River has also improved from 22.1% to 8.7%.

5. Conclusions

The objective of this research was to systematically explore China’s progress in mitigating air and water pollution as part of its ecological civilisation and beautiful China dream. The environmental healthcare implications of the persistence and improvement to environmental pollution were of significant interest in this research. In 2018, China’s ecological civilisation and the beautiful China dream were ultimately engraved into the national ideology for socio-economic and political development and national orientation. At the heart of this dream is the need to rejuvenate and modernise the Chinese nation through sustainable development. However, the path to economic prosperity has not been all rosy in terms of the environmental pollution and the contemporaneous health impact on its citizens and beyond.
The extant literature is replete with studies that highlight China’s high percentage contribution to global pollution. For this reason, China is rarely a leading source of inspiration for successful environment management. For many years, it has tolerated compromised environmental standards that have culminated into endemic air, water, soil quality that continues to plague many of its cities. In cities such as Qingtai, Linfen, Lanzhou, and Urumqi, pollutions have long exceeded the global allowable limits and several villages under them have been declared as cancer villages. Further, China’s Ministry of Environmental Protection, which is the top environmental regulator, has over the years classified more than half of its water resources as too polluted for human use.
In 2018, China first acknowledged that villages with exceeding levels of pollution may exit but not enough to be classified as cancer villages. These are villages where pollution levels have reached unsustainable levels such that entire whole communities stand the risk. This represented the saddest commentary of an otherwise economic renaissance or turnaround that has left several critics of its political and economic orientation dumbfounded. Despite the persisting challenges, it appears that the Chinese government has abandoned its perceived obdurate approach to environmental pollution as suggested by western countries and researchers. This posture fuelled speculation that China prioritises economic development at any cost, even at the health of its citizens and wholesale eco-destruction. Over the last decade however, China has acknowledged the daunting environmental challenges facing the country and has rejuvenated its effort to overcome these challenges especially water and air pollution.
Currently, China, strategy is tailored towards a move away from coal-based economy to clean energy. Since 2005, China has invested in clean energy than any other country in the world. The 2019, State of Ecology and Environment Report Review shows that China can become a beacon of clean energy and an inspiration to even developed countries. There is the need to double its effort to arrest water pollution. The benefit of most of ecological reclamation strategies that have been put in place currently remains a work in progress in China hence the need to strengthen surveillance especially among industries that pollute these water bodies. The Yangtze Action Plan and Yangtze River Protection Act or the, Water Resource Special Plan for Ecological Protection and High-Quality Development of the Yellow River must be extended to all other strategic national rivers including the local levels to ensure effective protection of their basins. There is the need to review the pollution violation fine upwards in order to improve compliance of the private sector and other individuals whose actions and inactions compromise the quality of environmental health that must be a public good for all citizens.
As an academic research, this study has limitations that needs to be highlighted. Firstly the articles were selected from only 10 databases. Even with these sources, a strict inclusions and exclusion criteria was used to deny some studies from been reviewed. They were deemed low quality, downgraded and disregarded because of the criteria set by the authors yet a lot of the other databases and studies not included in this study may contain information that could have helped to put the current research work in its appropriate context. The second limitation is that the study analysed papers that were designed with quantitative and qualitative or primary and secondary research methods. These research strategies have their own limitations which can affect the validity of the information in the articles used to construct this study. Moreover, the authors of the reviewed articles themselves have acknowledged several of their own limitations in conducting their studies and that also limits the applicability of the findings of this research. This paper is also limited by the fact that only articles published in the English language were reviewed. There are several other articles published in Chinese and other languages about the same subject that contains very useful information that were not reviewed in this study. The influence of extenuating factors (including potential biases in the reviewed papers) can possibly limit the value of these papers.
There is the need to augment this study with addition work in the future. Specifically, there is the need to expand the base of the papers to include those conducted in other languages. Most importantly, the impact of COVID-19 on environment in general and strategic social interventions such as the ecological civilisation may be uncommon. Future work should thoroughly explore whether the coronavirus has or retard China’s stride towards achieving its ecological civilisation targets. Such a study should also look for strategies that must be adopted to ameliorate any negative effect of the coronavirus on environmental health targets.

Supplementary Materials

The following are available online at https://www.mdpi.com/article/10.3390/su13073664/s1, Table S1: Description of Studies, Table S2: tMixed Methods Appraisal Tool (MMAT) Study Quality Evaluation Schedule.

Author Contributions

Conceptualization, H.A.A. and T.M.; Data curation, L.Z.; Formal analysis, H.A.A. and X.X.; Funding acquisition, L.Z.; Investigation, L.Z., X.X. and T.M.; Methodology, H.A.A. and X.X.; Project administration, X.X.; Supervision, L.Z.; Visualization, T.M.; Writing original draft, H.A.A. and T.M.; Writing review and editing, H.A.A. All authors have read and agreed to the published version of the manuscript.

Funding

This research received no external funding or This research was funded by the National Natural Science Foundation of China (71904066), the Social science application research project of Jiangsu Province (19SYB-095, 20SHD002), the Universities’ Philosophy and Social Science Researches in Jiangsu Province (2019SJA1884) for their support for this project.

Informed Consent Statement

Not applicable.

Data Availability Statement

The selected studies for this research are held by the authors and will be made available upon reasonable request.

Acknowledgments

The authors deeply appreciate the support of the staff and fellows of the Center for Health and Public Policy Research at the Jiangsu University. The support of the postdoctoral fellows at the School of Management is also highly appreciated. Officer in departments of the Provincial Administration of Jiangsu Province are also acknowledged for their diverse service toward the collection of accurate data for the research.

Conflicts of Interest

The authors declare no conflict of interest. The funders had no role in the design of the study; in the collection, analyses, or interpretation of data; in the writing of the manuscript, or in the decision to publish the results.

References

  1. Liang, W.; Yang, M. Urbanization, economic growth and environmental pollution: Evidence from China. Sustain. Comput. Inform. Syst. 2019, 21, 1–9. [Google Scholar] [CrossRef]
  2. Liu, K.; Lin, B. Research on influencing factors of environmental pollution in China: A spatial econometric analysis. J. Clean. Prod. 2019, 206, 356–364. [Google Scholar] [CrossRef]
  3. Li, K.; Fang, L.; He, L. How population and energy price affect China’s environmental pollution? Energy Policy 2019, 129, 386–396. [Google Scholar] [CrossRef]
  4. Tan, H.; Yang, L.; Yu, Y.; Guan, Q.; Liu, X.; Li, L.; Chen, D. Co-existence of organophosphate di-and tri-esters in house dust from South China and Midwestern United States: Implications for human exposure. Environ. Sci. Technol. 2019, 53, 4784–4793. [Google Scholar] [CrossRef]
  5. Mohsen, M.; Wang, Q.; Zhang, L.; Sun, L.; Lin, C.; Yang, H. Microplastic ingestion by the farmed sea cucumber Apostichopus japonicus in China. Environ. Pollut. 2019, 245, 1071–1078. [Google Scholar] [CrossRef]
  6. Dutheil, F.; Baker, J.S.; Navel, V. COVID-19 as a factor influencing air pollution? Environ. Pollut. 2020, 263, 114466. [Google Scholar] [CrossRef]
  7. Aunan, K.; Hansen, M.H.; Liu, Z.; Wang, S. The hidden hazard of household air pollution in rural China. Environ. Sci. Policy 2019, 93, 27–33. [Google Scholar] [CrossRef]
  8. Bian, Y.; Song, K.; Bai, J. Market segmentation, resource misallocation and environmental pollution. J. Clean. Prod. 2019, 228, 376–387. [Google Scholar] [CrossRef]
  9. Ebrahimi, M.; Khalili, N.; Razi, S.; Keshavarz-Fathi, M.; Khalili, N.; Rezaei, N. Effects of lead and cadmium on the immune system and cancer progression. J. Environ. Health Sci. Eng. 2020, 8, 335–343. [Google Scholar] [CrossRef]
  10. Yu, Y.; Yang, X.; Li, K. Effects of the terms and characteristics of cadres on environmental pollution: Evidence from 230 cities in China. J. Environ. Manag. 2019, 232, 179–187. [Google Scholar] [CrossRef]
  11. Wang, M.H.; He, Y.; Sen, B. Research and management of plastic pollution in coastal environments of China. Environ. Pollut. 2019, 248, 898–905. [Google Scholar] [CrossRef]
  12. Yang, X.; Lin, S.; Li, Y.; He, M. Can high-speed rail reduce environmental pollution? Evidence from China. J. Clean. Prod. 2019, 239, 118135. [Google Scholar] [CrossRef]
  13. Liang, L.; Wang, Z.; Li, J. The effect of urbanization on environmental pollution in rapidly developing urban agglomerations. J. Clean. Prod. 2019, 237, 117649. [Google Scholar] [CrossRef]
  14. Zhang, C.; Zhou, H.; Cui, Y.; Wang, C.; Li, Y.; Zhang, D. Microplastics in offshore sediment in the yellow Sea and east China Sea, China. Environ. Pollut. 2019, 244, 827–833. [Google Scholar] [CrossRef]
  15. Wang, P.; Hu, Y.; Cheng, H. Municipal solid waste (MSW) incineration fly ash as an important source of heavy metal pollution in China. Environ. Pollut. 2019, 252, 461–475. [Google Scholar] [CrossRef]
  16. Hao, Y.; Guo, Y.; Guo, Y.; Wu, H.; Ren, S. Does outward foreign direct investment (OFDI) affect the home country’s environmental quality? The case of China. Struct. Chang. Econ. Dyn. 2020, 52, 109–119. [Google Scholar] [CrossRef]
  17. Ma, X.; Jia, H.; Sha, T.; An, J.; Tian, R. Spatial and seasonal characteristics of particulate matter and gaseous pollution in China: Implications for control policy. Environ. Pollut. 2019, 248, 421–428. [Google Scholar] [CrossRef]
  18. Zeng, Y.; Cao, Y.; Qiao, X.; Seyler, B.C.; Tang, Y. Air pollution reduction in China: Recent success but great challenge for the future. Sci. Total Environ. 2019, 663, 329–337. [Google Scholar] [CrossRef]
  19. Yongjian, Z.; Jingu, X.; Fengming, H.; Liqing, C. Association between short-term exposure to air pollution and COVID-19 infection: Evidence from China. Sci. Total Environ. 2020, 727, 138704. [Google Scholar]
  20. Zou, B.; You, J.; Lin, Y.; Duan, X.; Zhao, X.; Fang, X.; Li, S. Air pollution intervention and life-saving effect in China. Environ. Int. 2019, 125, 529–541. [Google Scholar] [CrossRef]
  21. Baranovitch, N. The Impact of Environmental Pollution on Ethnic Unrest in Xinjiang: A Uyghur Perspective. Mod. China 2019, 45, 504–536. [Google Scholar] [CrossRef]
  22. Ahmed, Z.; Asghar, M.M.; Malik, M.N.; Nawaz, K. Moving towards a sustainable environment: The dynamic linkage between natural resources, human capital, urbanization, economic growth, and ecological footprint in China. Resour. Policy 2020, 67, 101677. [Google Scholar] [CrossRef]
  23. Muhammad, S.; Long, X.; Salman, M. COVID-19 pandemic and environmental pollution: A blessing in disguise? Sci. Total Environ. 2020, 728, 138820. [Google Scholar] [CrossRef]
  24. Yang, W.; Yuan, G.; Han, J. Is China’s air pollution control policy effective? Evidence from Yangtze River Delta cities. J. Clean. Prod. 2019, 220, 110–133. [Google Scholar] [CrossRef]
  25. Peng, L.; Zhao, X.; Tao, Y.; Mi, S.; Huang, J.; Zhang, Q. The effects of air pollution and meteorological factors on measles cases in Lanzhou, China. Environ. Sci. Pollut. Res. 2020, 27, 13524–13533. [Google Scholar] [CrossRef]
  26. Zhao, H.; Geng, G.; Zhang, Q.; Davis, S.J.; Li, X.; Liu, Y.; He, K. Inequality of household consumption and air pollution-related deaths in China. Nat. Commun. 2019, 10, 1–9. [Google Scholar] [CrossRef]
  27. Uduji, J.I.; Okolo-Obasi, E.N.; Asongu, S.A. Multinational oil companies in Nigeria and corporate social responsibility in the HIV/AIDS response in host communities. Local Environ. 2019, 24, 393–416. [Google Scholar] [CrossRef]
  28. Xu, W.; Sun, J.; Liu, Y.; Xiao, Y.; Tian, Y.; Zhao, B.; Zhang, X. Spatiotemporal variation and socioeconomic drivers of air pollution in China during 2005–2016. J. Environ. Manag. 2019, 245, 66–75. [Google Scholar] [CrossRef]
  29. He, J.; Liu, H.; Salvo, A. Severe air pollution and labor productivity: Evidence from industrial towns in China. Am. Econ. J. Appl. Econ. 2019, 11, 173–201. [Google Scholar] [CrossRef]
  30. Guo, J.; Zhang, X.; Gu, F.; Zhang, H.; Fan, Y. Does air pollution stimulate electric vehicle sales? Empirical evidence from twenty major cities in China. J. Clean. Prod. 2020, 249, 119372. [Google Scholar] [CrossRef]
  31. Ma, Z.; Liu, R.; Liu, Y.; Bi, J. Effects of air pollution control policies on PM 2.5 pollution improvement in China from 2005 to 2017: A satellite-based perspective. Atmos. Chem. Phys. 2019, 19, 6861–6877. [Google Scholar] [CrossRef]
  32. Liu, J.; Kiesewetter, G.; Klimont, Z.; Cofala, J.; Heyes, C.; Schöpp, W.; Amann, M. Mitigation pathways of air pollution from residential emissions in the Beijing-Tianjin-Hebei region in China. Environ. Int. 2019, 125, 236–244. [Google Scholar] [CrossRef] [PubMed]
  33. Zheng, S.; Wang, J.; Sun, C.; Zhang, X.; Kahn, M.E. Air pollution lowers Chinese urbanites’ expressed happiness on social media. Nat. Hum. Behav. 2019, 3, 237–243. [Google Scholar] [CrossRef] [PubMed]
  34. Yu, M.; Zhu, Y.; Lin, C.-J.; Wang, S.; Xing, J.; Jang, C.; Yu, L. Effects of air pollution control measures on air quality improvement in Guangzhou, China. J. Environ. Manag. 2019, 244, 127–137. [Google Scholar] [CrossRef]
  35. Li, X.; Hu, X.-M.; Ma, Y.; Wang, Y.; Li, L.; Zhao, Z. Impact of planetary boundary layer structure on the formation and evolution of air-pollution episodes in Shenyang, Northeast China. Atmos. Environ. 2019, 214, 116850. [Google Scholar] [CrossRef]
  36. Ito, K.; Zhang, S. Willingness to pay for clean air: Evidence from air purifier markets in China. J. Political Econ. 2020, 128, 1627–1672. [Google Scholar] [CrossRef]
  37. Sierra-Hernández, M.R.; Beaudon, E.; Gabrielli, P.; Thompson, L. 21st-century Asian air pollution impacts glacier in northwestern Tibet. Atmos. Chem. Phys. 2019, 19, 15533–15544. [Google Scholar] [CrossRef]
  38. Liang, D.; Wang, Y.-Q.; Wang, Y.-J.; Ma, C. National air pollution distribution in China and related geographic, gaseous pollutant, and socio-economic factors. Environ. Pollut. 2019, 250, 998–1009. [Google Scholar] [CrossRef]
  39. Li, Y.; Huang, J.; Li, Z.; Zheng, K. Atmospheric pollution revealed by trace elements in recent snow from the central to the northern Tibetan Plateau. Environ. Pollut. 2020, 263, 114459. [Google Scholar] [CrossRef]
  40. Chen, J.; Lu, J.; Ning, J.; Yan, Y.; Li, S.; Zhou, L. Pollution characteristics, sources, and risk assessment of heavy metals and perfluorinated compounds in PM 2.5 in the major industrial city of northern Xinjiang, China. Air Qual. Atmos. Health 2019, 12, 909–918. [Google Scholar] [CrossRef]
  41. Ma, Y.; Ma, B.; Jiao, H.; Zhang, Y.; Xin, J.; Yu, Z. An analysis of the effects of weather and air pollution on tropospheric ozone using a generalized additive model in Western China: Lanzhou, Gansu. Atmos. Environ. 2020, 224, 117342. [Google Scholar] [CrossRef]
  42. Liao, Q.; Jin, W.; Tao, Y.; Qu, J.; Li, Y.; Niu, Y. Health and Economic Loss Assessment of PM2. 5 Pollution during 2015–2017 in Gansu Province, China. Int. J. Environ. Res. Public Health 2020, 17, 3253. [Google Scholar] [CrossRef]
  43. Zheng, Y.; Peng, J.; Xiao, J.; Su, P.; Li, S. Industrial structure transformation and provincial heterogeneity characteristics evolution of air pollution: Evidence of a threshold effect from China. Atmos. Pollut. Res. 2020, 11, 598–609. [Google Scholar] [CrossRef]
  44. Liu, H.; Zhang, Y.; Tian, Y.; Zheng, Y.; Gou, F.; Yang, X.; Hu, W. Epidemic features of seasonal influenza transmission among eight different climate zones in Gansu, China. Environ. Res. 2020, 183, 109189. [Google Scholar] [CrossRef]
  45. Zhang, J.-Y.; Gong, T.-T.; Huang, Y.-H.; Li, J.; Liu, S.; Chen, Y.-L.; Wu, Q.J. Association between maternal exposure to PM10 and polydactyly and syndactyly: A population-based case-control study in Liaoning Province, China. Environ. Res. 2020, 187, 109643. [Google Scholar] [CrossRef]
  46. Liu, Z.; Zhou, J.; Zhang, J.; Mao, Y.; Huang, X.; Qian, G. Evaluation for the heavy metal risk in fine particulate matter from the perspective of urban energy and industrial structure in China: A meta-analysis. J. Clean. Prod. 2020, 244, 118597. [Google Scholar] [CrossRef]
  47. Yang, T.; Liu, Y.; Zhao, W.; Chen, Z.; Deng, J. Association of Ambient Air Pollution with Nasopharyngeal Carcinoma Incidence in Ten Large Chinese Cities, 2006–2013. Int. J. Environ. Res. Public Health 2020, 17, 1824. [Google Scholar] [CrossRef]
  48. Li, J.; Liao, H.; Hu, J.; Li, N. Severe particulate pollution days in China during 2013–2018 and the associated typical weather patterns in Beijing-Tianjin-Hebei and the Yangtze River Delta regions. Environ. Pollut. 2019, 248, 74–81. [Google Scholar] [CrossRef]
  49. He, L.; Zhong, H.; Liu, G.; Dai, Z.; Brookes, P.C.; Xu, J. Remediation of heavy metal contaminated soils by biochar: Mechanisms, potential risks and applications in China. Environ. Pollut. 2019, 252, 846–855. [Google Scholar] [CrossRef]
  50. Fan, Y.; Zheng, K.; Zhu, Z.; Chen, G.; Peng, X. Distribution, sedimentary record, and persistence of microplastics in the Pearl River catchment, China. Environ. Pollut. 2019, 251, 862–870. [Google Scholar] [CrossRef]
  51. Ma, T.; Sun, S.; Fu, G.; Hall, J.W.; Ni, Y.; He, L.; Zhou, C. Pollution exacerbates China’s water scarcity and its regional inequality. Nat. Commun. 2020, 11, 1–9. [Google Scholar] [CrossRef]
  52. He, X.; Li, P. Surface water pollution in the middle Chinese Loess Plateau with special focus on hexavalent chromium (Cr 6+): Occurrence, sources and health risks. Expo. Health 2020, 12, 385–401. [Google Scholar] [CrossRef]
  53. Wang, J.; Song, Y. Effect of water pollution control on provincial boundaries of River-Director System: Based on the study of the Yangtze River valley in China. Environ. Sci. Pollut. Res. 2020, 27, 35217–35227. [Google Scholar] [CrossRef]
  54. Lin, S.-S.; Shen, S.-L.; Zhou, A.; Lyu, H.-M. Sustainable development and environmental restoration in Lake Erhai, China. J. Clean. Prod. 2020, 258, 120758. [Google Scholar] [CrossRef]
  55. Ma, T.; Zhao, N.; Ni, Y.; Yi, J.; Wilson, J.P.; He, L.; Cheng, W. China’s improving inland surface water quality since 2003. Sci. Adv. 2020, 6, eaau3798. [Google Scholar] [CrossRef]
  56. Li, Y.; Fu, Y.; Hu, K.; Zhang, Y.; Chen, J.; Zhang, S.; Liu, Y. Positive correlation between human exposure to organophosphate esters and gastrointestinal cancer in patients from Wuhan, China. Ecotoxicol. Environ. Saf. 2020, 196, 110548. [Google Scholar] [CrossRef]
  57. Feng, X.; Shao, L.; Xi, C.; Jones, T.; Zhang, D.; BéruBé, K. Particle-induced oxidative damage by indoor size-segregated particulate matter from coal-burning homes in the Xuanwei lung cancer epidemic area, Yunnan Province, China. Chemosphere 2020, 256, 127058. [Google Scholar] [CrossRef]
  58. Wang, Y.; Zhu, G. Risk associated with increasing bromide in drinking water sources in Yancheng City, China. Environ. Monit. Assess. 2020, 192, 36. [Google Scholar] [CrossRef]
  59. Cui, C.; Dong, H.; Ren, H.; Lin, G.; Zhao, L. Characterization of Esophageal Cancer and Its Association with Influencing Factors in Guangzhou City, China. Int. J. Environ. Res. Public Health 2020, 17, 1498. [Google Scholar] [CrossRef]
  60. Jiang, Y.; Chen, S.; Hu, B.; Zhou, Y.; Liang, Z.; Jia, X.; Shi, Z. A comprehensive framework for assessing the impact of potential agricultural pollution on grain security and human health in economically developed areas. Environ. Pollut. 2020, 263, 114653. [Google Scholar] [CrossRef]
  61. Sun, X.; Peng, X.; Hou, R. Metrological study on the literature of regional distribution of esophageal cancer in China. AIP Conf. Proc. 2020, 2335, 020023. [Google Scholar]
  62. Liu, S.; Liu, Y.; Yang, D.; Li, C.; Zhao, Y.; Ma, H.; Lu, S. Trace elements in shellfish from Shenzhen, China: Implication of coastal water pollution and human exposure. Environ. Pollut. 2020, 263, 114582. [Google Scholar] [CrossRef]
  63. Zhang, H.; Wang, L.; Wang, Y.; Chang, S. Using disability-adjusted life years to estimate the cancer risks of low-level arsenic in drinking water. J. Environ. Sci. Health Part A 2020, 55, 63–70. [Google Scholar] [CrossRef] [PubMed]
  64. Gao, Y.; Shahab, S.; Ahmadpoor, N. Morphology of Urban Villages in China: A Case Study of Dayuan Village in Guangzhou. Urban Sci. 2020, 4, 23. [Google Scholar] [CrossRef]
  65. Chen, A. CHINESE CANCER VILLAGES: Rural Development, Environmental Change and Public Healthrural... Development, Environmental Change and Public Healt; AMSTERDAM University Press: Amsterdam, The Netherlands, 2020. [Google Scholar]
  66. Wang, S.; Zhang, C.; Pan, Z.; Sun, D.; Zhou, A.; Xie, S.; Zou, J. Microplastics in wild freshwater fish of different feeding habits from Beijiang and Pearl River Delta regions, south China. Chemosphere 2020, 258, 127345. [Google Scholar] [CrossRef]
  67. Guo, C.; Chen, Y.; Xia, W.; Qu, X.; Yuan, H.; Xie, S.; Lin, L.S. Eutrophication and heavy metal pollution patterns in the water suppling lakes of China’s south-to-north water diversion project. Sci. Total Environ. 2020, 711, 134543. [Google Scholar] [CrossRef]
  68. Li, X.; Jin, L.; Kan, H. Air Pollution: A Global Problem Needs Local Fixes; Nature Publishing Group: Berlin, Germany, 2019. [Google Scholar]
  69. Yang, Y.; Yang, W. Does whistleblowing work for air pollution control in China? A study based on three-party evolutionary game model under incomplete information. Sustainability 2019, 11, 324. [Google Scholar] [CrossRef]
  70. Wu, Z.; Ye, Q. Water pollution loads and shifting within China’s inter-province trade. J. Clean. Prod. 2020, 259, 120879. [Google Scholar] [CrossRef]
  71. Hou, X.; Chan, C.; Dong, G.; Yim, S. Impacts of transboundary air pollution and local emissions on PM2. 5 pollution in the Pearl River Delta region of China and the public health, and the policy implications. Environ. Res. Lett. 2019, 14, 034005. [Google Scholar] [CrossRef]
  72. Yang, Z.; Hao, J.; Huang, S.; Yang, W.; Zhu, Z.; Tian, L.; Liu, S. Acute effects of air pollution on the incidence of hand, foot, and mouth disease in Wuhan, China. Atmos. Environ. 2020, 225, 117358. [Google Scholar] [CrossRef]
  73. Zhang, H.; Dong, H.; Ren, M.; Liang, Q.; Shen, X.; Wang, Q.; Huang, C. Ambient air pollution exposure and gestational diabetes mellitus in Guangzhou, China: A prospective cohort study. Sci. Total Environ. 2020, 699, 134390. [Google Scholar] [CrossRef]
  74. Li, K.; Jacob, D.J.; Liao, H.; Zhu, J.; Shah, V.; Shen, L.; Zhai, S. A two-pollutant strategy for improving ozone and particulate air quality in China. Nature Geoscience 2019, 12, 906–910. [Google Scholar] [CrossRef]
  75. Tilt, B. China’s air pollution crisis: Science and policy perspectives. Environ. Sci. Policy 2019, 92, 275–280. [Google Scholar] [CrossRef]
  76. Gu, H.; Cao, Y.; Elahi, E.; Jha, S.K. Human health damages related to air pollution in China. Environ. Sci. Pollut. Res. 2019, 26, 13115–13125. [Google Scholar] [CrossRef]
  77. Fang, D.; Chen, B.; Hubacek, K.; Ni, R.; Chen, L.; Feng, K.; Lin, J. Clean air for some: Unintended spillover effects of regional air pollution policies. Sci. Adv. 2019, 5, eaav4707. [Google Scholar] [CrossRef]
  78. Cai, J.; He, Y.; Xie, R.; Liu, Y. A footprint-based water security assessment: An analysis of Hunan province in China. J. Clean. Prod. 2020, 245, 118485. [Google Scholar] [CrossRef]
  79. Wang, R.; Qi, R.; Cheng, J.; Zhu, Y.; Lu, P. The behavior and cognition of ecological civilization among Chinese university students. J. Clean. Prod. 2020, 243, 118464. [Google Scholar] [CrossRef]
  80. Qin, L.-T.; Pang, X.-R.; Zeng, H.-H.; Liang, Y.-P.; Mo, L.-Y.; Wang, D.-Q.; Dai, J.F. Ecological and human health risk of sulfonamides in surface water and groundwater of Huixian karst wetland in Guilin, China. Sci. Total Environ. 2020, 708, 134552. [Google Scholar] [CrossRef]
  81. Zhang, Y.; Hu, Y.; Zhang, B.; Li, Y.; Zhang, X.; Xie, Y. Conflict between nature reserves and surrounding communities in China: An empirical study based on a social and ecological system framework. Glob. Ecol. Conserv. 2020, 21, e00804. [Google Scholar] [CrossRef]
  82. Xiao, Y.; Xiao, Q.; Sun, X. Ecological Risks Arising from the Impact of Large-scale Afforestation on the Regional Water Supply Balance in Southwest china. Sci. Rep. 2020, 10, 1–10. [Google Scholar] [CrossRef]
  83. Yang, Y.; Yao, C.; Xu, D. Ecological compensation standards of national scenic spots in western China: A case study of Taibai Mountain. Tour. Manag. 2020, 76, 103950. [Google Scholar] [CrossRef]
  84. Qu, S.; Wu, W.; Nel, W.; Ji, J. The behavior of metals/metalloids during natural weathering: A systematic study of the mono-lithological watersheds in the upper Pearl River Basin, China. Sci. Total Environ. 2020, 708, 134572. [Google Scholar] [CrossRef]
  85. Liu, Y.; Mao, D. Integrated assessment of water quality characteristics and ecological compensation in the Xiangjiang River, south-central China. Ecol. Indic. 2020, 110, 105922. [Google Scholar] [CrossRef]
  86. Zhang, B.; Zhang, Q.-Q.; Zhang, S.-X.; Xing, C.; Ying, G.-G. Emission estimation and fate modelling of three typical pesticides in Dongjiang River basin, China. Environ. Pollut. 2020, 258, 113660. [Google Scholar] [CrossRef] [PubMed]
  87. Wen, Z.; Song, K.; Liu, G.; Lyu, L.; Shang, Y.; Fang, C.; Du, J. Characterizing DOC sources in China’s Haihe River basin using spectroscopy and stable carbon isotopes. Environ. Pollut. 2020, 258, 113684. [Google Scholar] [CrossRef] [PubMed]
  88. Liu, Y.; Li, H.; Cui, G.; Cao, Y. Water quality attribution and simulation of non-point source pollution load flux in the Hulan River basin. Sci. Rep. 2020, 10, 1–15. [Google Scholar] [CrossRef] [PubMed]
  89. Ruan, S.; Zhuang, Y.; Hong, S.; Zhang, L.; Wang, Z.; Tang, X.; Wen, W. Cooperative identification for critical periods and critical source areas of nonpoint source pollution in a typical watershed in China. Environ. Sci. Pollut. Res. 2020, 27, 10472–10483. [Google Scholar] [CrossRef] [PubMed]
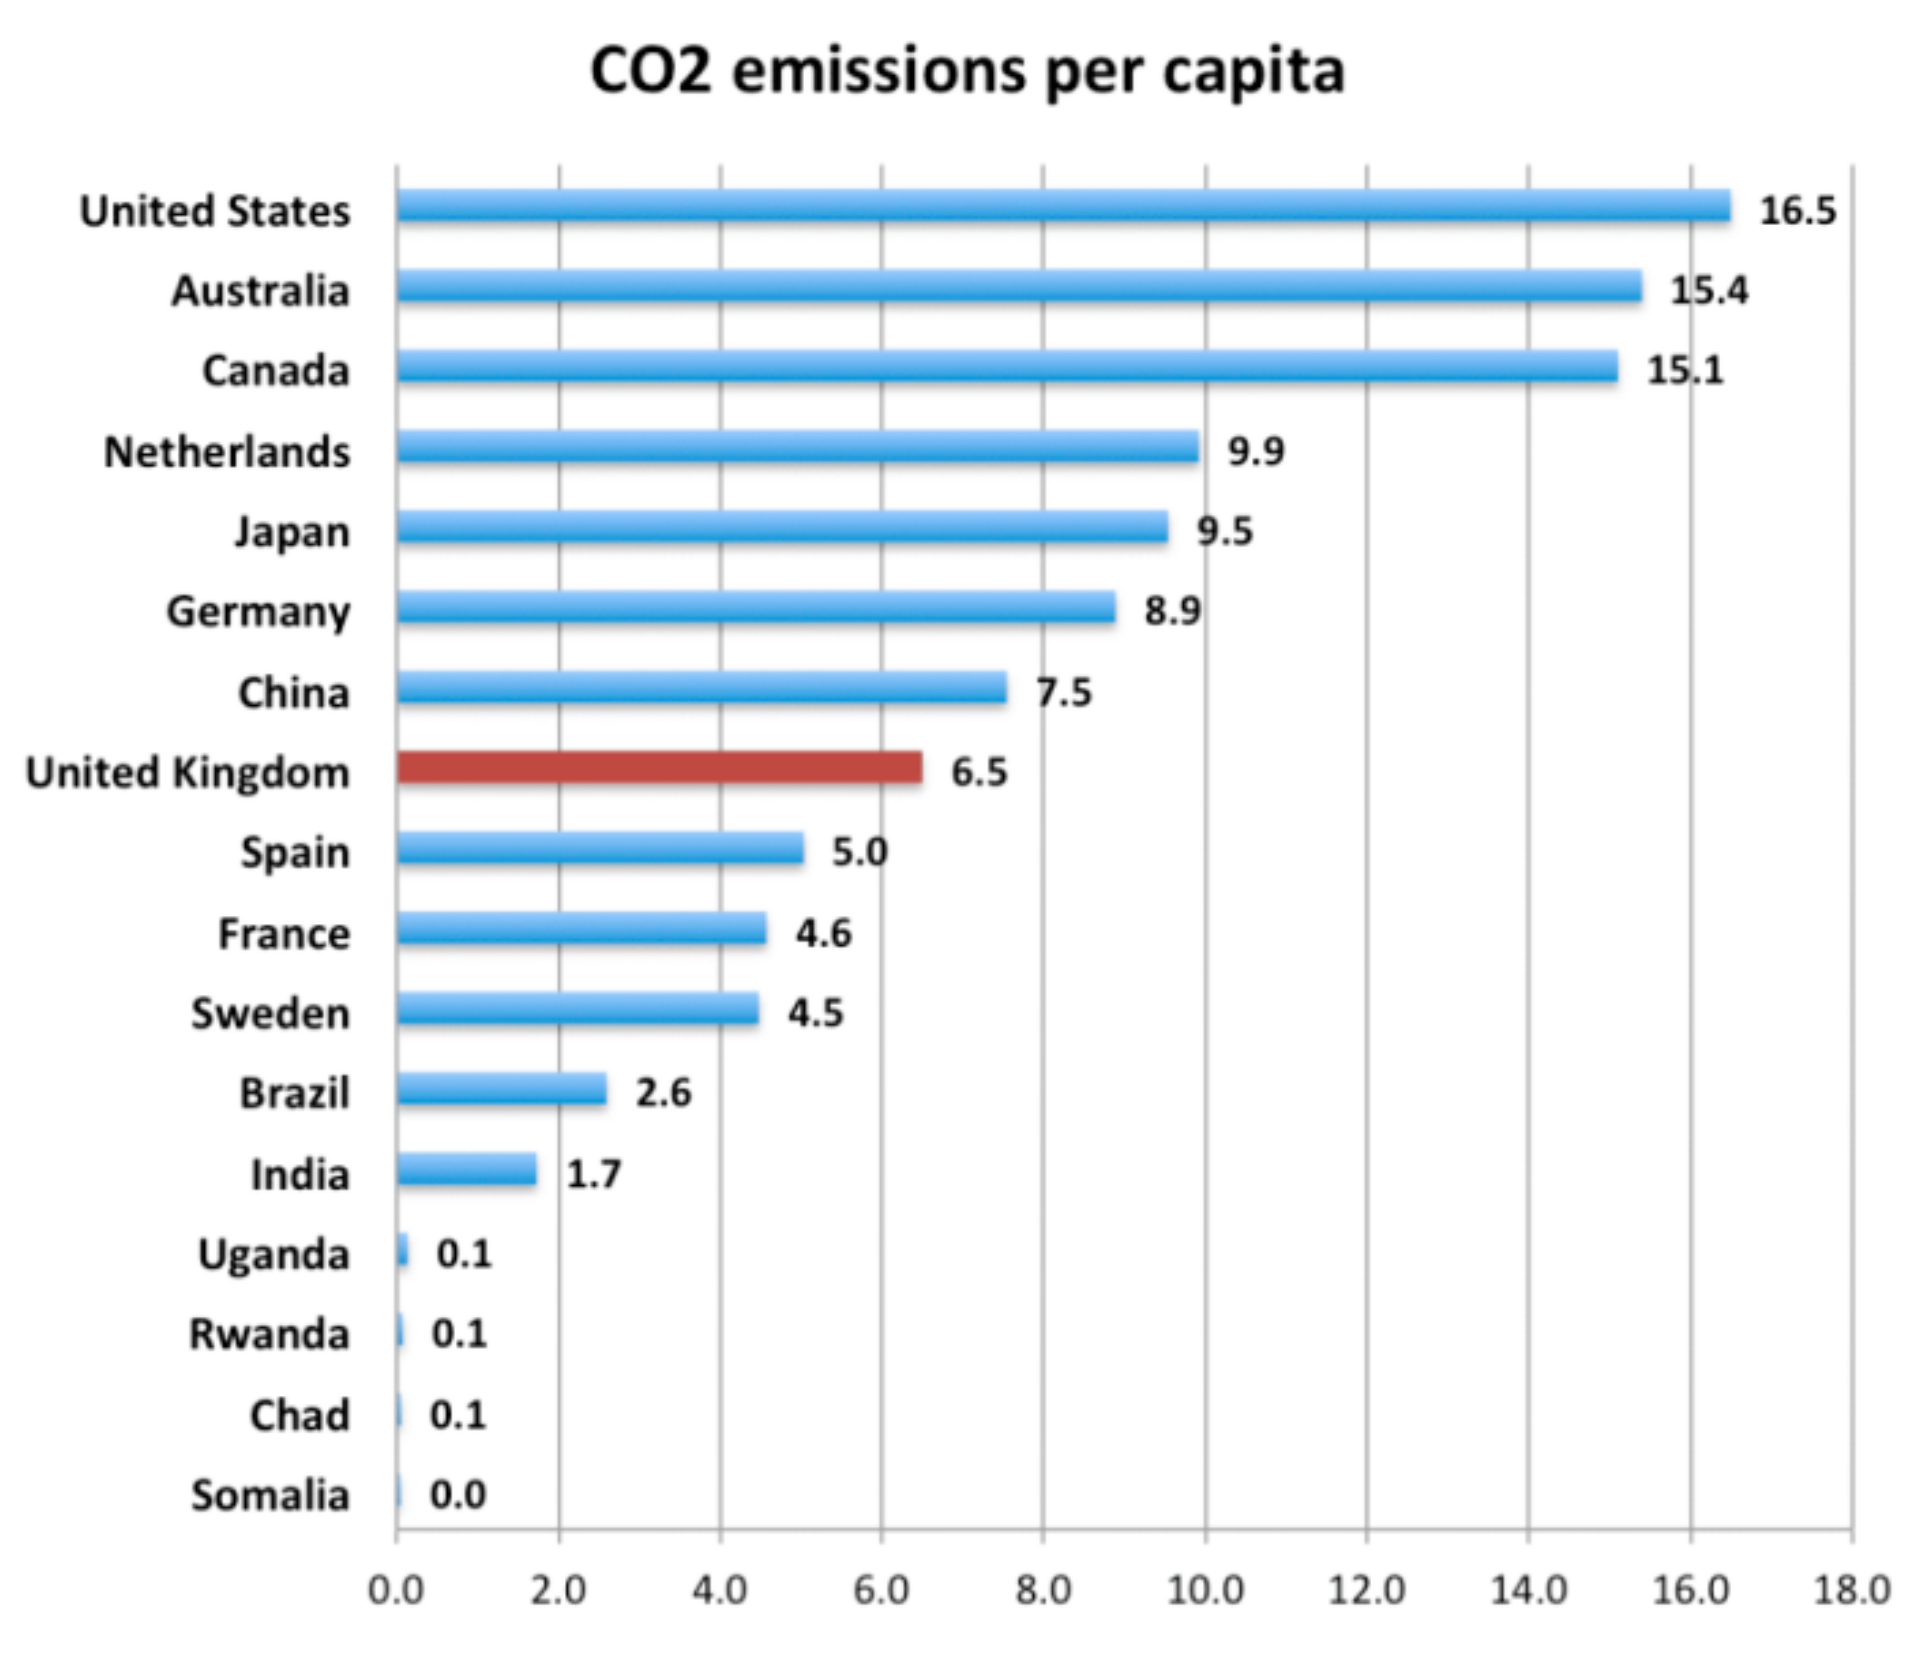
Figure 1. Top countries with CO2 per capita (Source: World Bank).
Sustainability 13 03664 g001
Figure 2. Distribution of Emmission related pollution across the regions of the world (Source: UCSUSA, 2019).
Sustainability 13 03664 g002
Figure 3. Flow of Article Selection process.
Sustainability 13 03664 g003
Figure 4. Key Sources of Air Pollution in China/Number of Studies (Source: Authors).
Sustainability 13 03664 g004
Figure 5. Indoor and Outdoor Pollution/Percentage of Studies (Source: Authors).
Sustainability 13 03664 g005
Figure 6. Sources of Water Pollution/Percentage of Studies (Source: Authors).
Sustainability 13 03664 g006
Figure 7. Distribution of pollution induced water scarcity across China’s provinces (Source: Nature Communications, 2019).
Sustainability 13 03664 g007
Figure 8. Spatial distributions of river basins in this study (Source: Nature Communications, 2019).
Sustainability 13 03664 g008
Publisher’s Note: MDPI stays neutral with regard to jurisdictional claims in published maps and institutional affiliations.