Article

The Evolutionary Trend and Impact of Global Plastic Waste Trade Network

1
Business School, Changshu Institute of Technology, Changshu 215500, China
2
School of Maritime Economics and Management, Dalian Maritime University, Dalian 116026, China
3
UNEP-Tongji Institute of Environment for Sustainable Development, Tongji University, Shanghai 200092, China
4
Southampton Business School, University of Southampton, Southampton SO17 1BJ, UK
*
Authors to whom correspondence should be addressed.
Sustainability 2021, 13(7), 3662; https://doi.org/10.3390/su13073662
Submission received: 23 February 2021 / Revised: 16 March 2021 / Accepted: 20 March 2021 / Published: 25 March 2021

Abstract

:
Marine plastic waste, global warming, and ozone holes have become global environmental problems that need to be resolved urgently. With the promulgation of plastic bans in many countries, the global plastic waste trade will undergo tremendous change. In order to explore the future evolutionary trend of the global plastic waste trade network, this paper focuses on the analysis of the import and export of plastic waste from major trading countries around the world. Based on the bilateral trade volume of plastic waste from 1990 to 2019, a global plastic waste trade network is constructed, and the structure and characteristics of the network are studied. The results show that the global plastic waste trade network has shifted its center of gravity, and the import center has gradually shifted from China to Southeast Asia. The global plastic waste trade network presents a sparse state. Moreover, the dependence of related countries on plastic waste trade decreases, whilst the closeness of trade links also decreases. Sudden factors such as plastic waste import bans have a disruptive impact on plastic waste management.

1. Introduction

Plastic waste refers to the man-made or reprocessed plastic solid waste that exists in the natural environment [1]. The global production of plastic products is extremely high but the recycling rate is relatively low, which causes a lot of waste of resources and causes a devastating blow to humans and marine life. The global focus on plastic waste is gradually increasing [2]. “Nature” uses plastic waste recycling technology for the production of the cover of its magazine, which has attracted widespread attention. Not only academically, but the international community is paying more and more attention to plastic waste. On World Environment Day, the United Nations Environment Programme called on all countries to introduce measures to control plastic waste pollution and formulate regulations for the management of disposable plastic waste products. China designated a ban on the import of waste in 2018 [3]. Later, Vietnam, the Philippines and other countries have successively formulated restrictive measures on the import of plastic waste [4]. This series of measures has attracted widespread attention and discussion, which has led to a change in the global plastic waste industry chain. Furthermore, these measures will have an additional impact on the distribution of marine plastic waste. The G20 summit in 2019 made marine plastic waste management an important topic and reached important consensus. The member states pledged to “reduce the discharge of plastic waste to the ocean to zero by 2050”. From the perspective of the G20 goal, the treatment of marine plastic waste is extremely urgent. In order to achieve zero discharge of plastic waste by 2030, it requires extensive cooperation and participation from the international community.
Although the marine plastic waste and plastic waste trade have attracted global attention in recent years, the academic community has not paid much attention to it until recently. The decade of the 1970s was the embryonic period of marine plastic waste research [5]. From 2010 onwards, research has gradually become more systematic [6]. Plastic waste in the ocean is divided into large plastic waste, microplastic waste and nanoplastic waste according to their size [7]. Since Thompson [8] and others first proposed the term “microplastic waste”, marine microplastics have attracted widespread attention. The two major TOP journals “Nature” and “Science” have published more than 10 articles on microplastic waste, mainly focusing on the distribution of microplastic waste [9], source convergence [10], policy management [11,12,13] and other issues. These research results show that the geographical distribution and abundance of marine microplastics have changed significantly, and have directly harmed marine life and the global ecological environment [14]. In-depth research on the toxicology, environmental chemistry and ecological hazard mechanisms of marine microplastics has been conducted and achieved good progress [15]. Some scholars tracked the stock and flow of certain plastics in multiple countries or regions based on plastic waste trade data [16]. Liang et al. [17] discussed relevant management policies for waste trade in Asia. Brooks et al. [18] drew up a regional statistical map and used the 2000–2016 plastic waste trade data to conduct a regional and income level regression analysis. The results show that high-income countries in the Economic Cooperation Organization have been exporting plastic waste to low-income countries in East Asia and the Pacific. Wang et al. [19] used a complex network to draw a topology map and geographic information system data to identify the structure of the global plastic waste trade on this basis. The research results show that Asia has become the main region for global plastic waste export.
In 2017, China banned the import of plastic waste, according to Chinese customs, the volume of plastic trade dropped dramatically after the ban, while exports have not changed significantly since then [20]. With bans imposed by other countries, India’s trade surged in 2018, with South Korea and Thailand turning from net exporters to net importers, whilst exports from the USA have also dropped significantly. Exports from other net exporters also fell in 2018, while imports increased [21]. This shows that the structure of the global plastic waste trade is changing as more and more countries enact bans and many countries change their imports and exports. In 2020, COVID-19 pandemic broke out globally. In the hopes of preventing further infection, more consumers used disposable products [22]. The surge in demand for plastic produces a large amount of plastic waste, which increases the pressure on the country to deal with plastic waste. Many countries will choose to export to reduce the cost of domestic waste management. What is the future trend of plastics waste trade development? What is the impact on plastic waste management? Such research questions are worth exploring.
In order to answer these research questions, a complex network method is applied to quantitatively describe the spatio-temporal evolution of the global network for plastic waste trade. The main contributions of this research are as follows: (1) from 1990–2019 global import and export trade, this research describes the plastic waste trade present situation, and analyzes the key countries imports of plastics products (2) build a global plastic waste trade network. The calculation of network centrality and network density shows that the global plastic waste trade network is sparse, the dependence of plastic waste trade in related countries has declined, and the closeness of trade ties has decreased.
The remaining of this paper is arranged as below: Section 2 introduces the current situation of global plastic waste trade. Section 3 introduces the methods used in this study. Section 4 analyzes the structural evolution of global trade in plastics waste. Finally, the conclusions and discussions are presented in Section 5.

2. Global Trade Volume of Plastic Waste

2.1. Global Trade Volume

Plastics are ubiquitous in the ocean. According to their sources, marine plastic garbage can be divided into land-sourced garbage and sea-sourced garbage [23]. The distribution of land-based plastic waste will directly affect the flow of marine plastic waste, thereby affecting the treatment of marine plastic waste. The plastic waste trade directly changes a country’s plastic waste inventory, which in turn changes the distribution of marine plastic waste [24]. International trade can only affect the distribution of waste in the short-term. In the long-term, the distribution of plastic waste will change with the action of ocean currents and winds that naturally occur in the oceans. According to the United Nations Comtrade Database (http://comtrade.un.org/, accessed on 13 December 2020), code 3915 in the HS (International Convention Harmonized Commodity Description and Coding, Unified System) refers to plastic scrap, plastic leather scrap, and the database provides the volume, price and weight of the trade. 
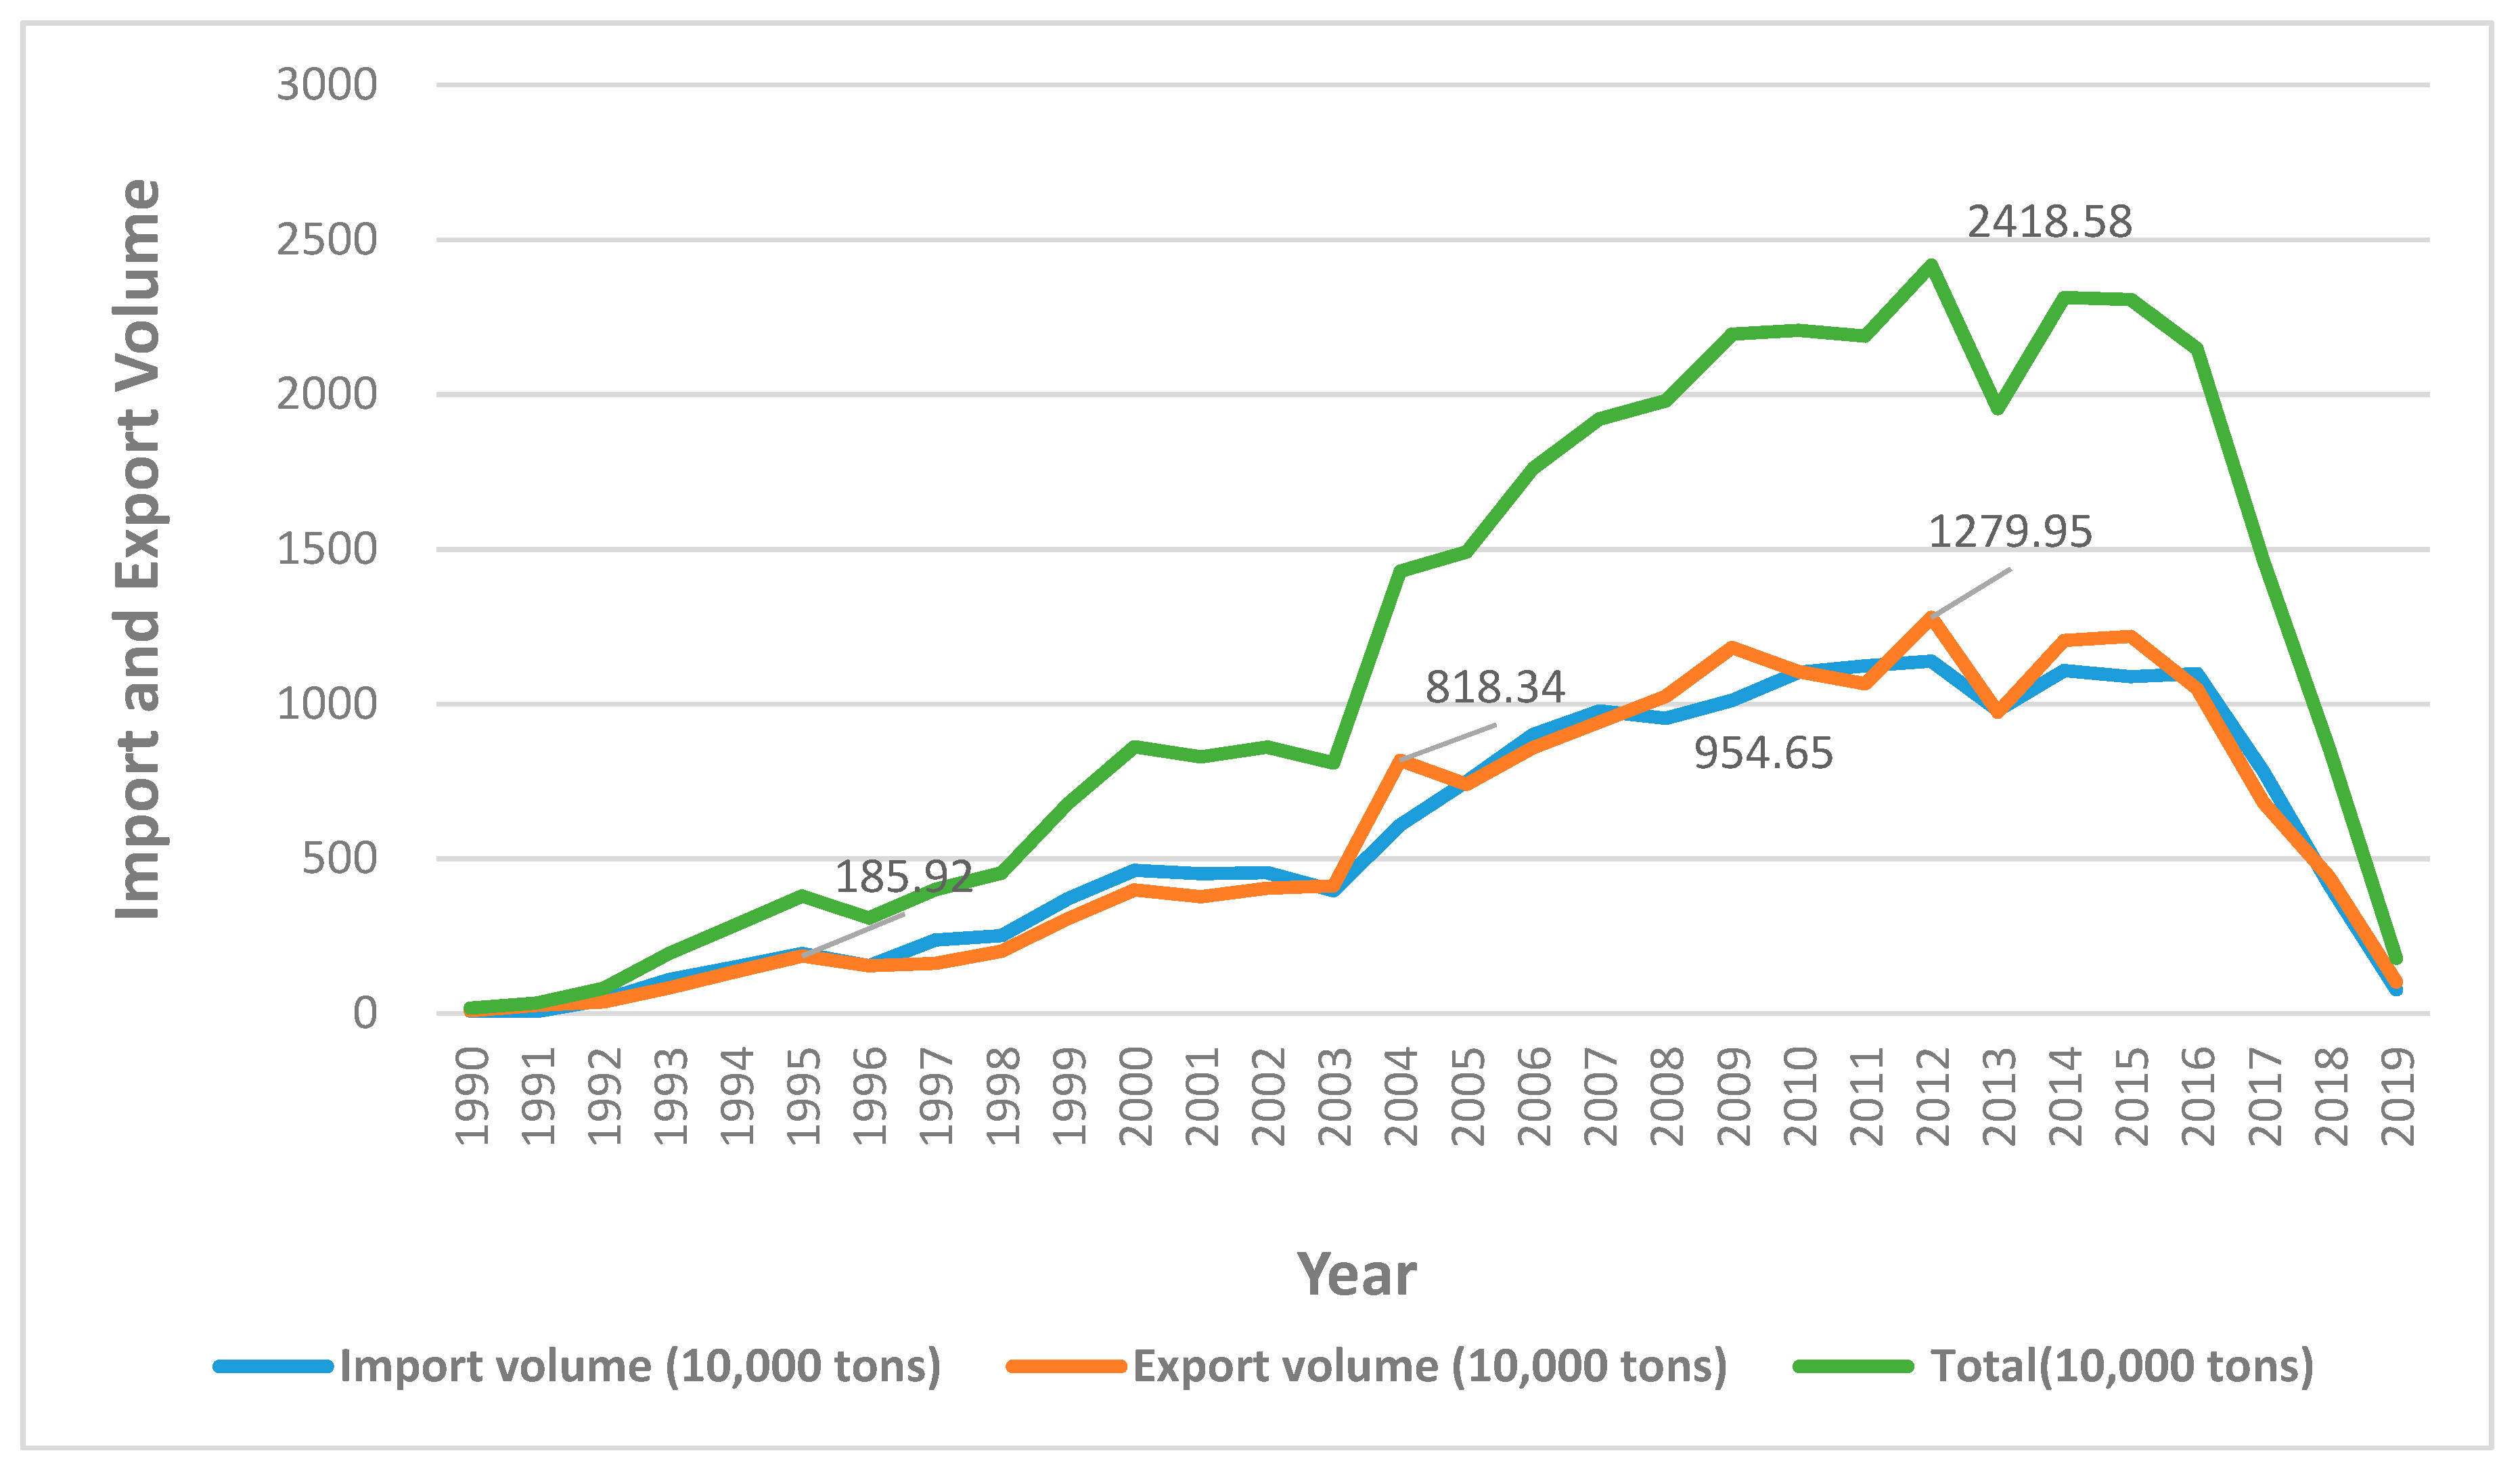
Figure 1 is plotted based on the volume of import and export trade, the global trade in plastic waste has undergone major changes in recent years:
From the perspective of global trade imports (Figure 1), the global plastic waste trade volume rose rapidly from 1990, experienced a period of rapid development from 2006 to 2016, and fell sharply after 2016. Global imports rose from 84,500 tons in 1990 to 11,386,200 tons in 2012, and experienced a period of stable trade, from 7,823,200 tons in 2016 to 765,000 tons in 2019. It can be seen from the two curves of global total export volume and import volume that the trends are roughly similar, with the overall rising first and then falling. In 2013, the global export volume dropped significantly, an important reason was the Green Fence Campaign, which resulted in the reduction of acceptable plastic waste in China and the transport of plastic waste back to the original exporting countries. In addition, there was no infrastructure for waste management in other regions, so both the global import and export volume of plastics were affected, and the import and export volume declined at the same time. Of course, the impact of this movement is temporary, with exports and imports rising from 2014 to 2016. After China announced a ban on plastic waste in 2017, global imports and exports fell sharply. In general, plastic waste exports more than imports. There is a big import gap, it shows a lack of formal plastic waste management that countries can’t internally “digest” the waste. On the one hand, countries are seeking new solutions, to promote recycled plastics processing technology or to redesign of plastic packaging for recycling [18]. On the other hand, they export waste to acceptable countries and reduce domestic waste through trade, but this trade has decreased as a large number of countries have enacted bans.
From the Figure 1, the global plastic waste trade can be divided into three stages. The first stage (before 2000): The total import and export volume of the global plastic waste trade is low and the growth rate is slow, importing 84,500 tons from 1990, the export of 92,800 tons increased to 4,628,700 and 3,992,300 tons in 2000. In this stage, the European Union and North America dominated trade. The second stage (2001 to 2016): in this stage, the global trade volume increased sharply. The export volume increased from 4,521,000 tons in 2001 to 10,492,300 tons in 2016, and the import volume increased from 3,774,400 to 10,985,000 tons. The import volume and export volume increased by 142% and 147% respectively, and reached the maximum value of 11.39 million tons and 12.8 million tons in 2012. The third stage is (2017 to 2019): in this stage the total global import and export volume has shown a downward trend, from 782 million tons and 6.82 million tons in 2017 to 765,000 tons and 1.025 million tons, a drop of nearly 90% and 85%. Plastic trade can reduce manufacturing costs, as can be seen in the 1990s when China recycled plastic waste profitably by using it in the manufacturing industry. China’s demand for plastic is driving the global plastic trade, leading the country to accept more than 50% of the global plastic waste, and making it the world’s global plastic waste factory at the beginning of the 21st century. Along with the development of China’s manufacturing industry, the priority has also changed. Now the plastic recycling industry has a greater internal market, in order to protect the ecological environment domestically, China has implemented plastic import restrictions, following the “green fence” and “blue sky” initiatives launched by the Chinese government in 2017. The purpose was to crack down on smuggling solid waste “national sword action”, after which the global plastic trade went into chaos.
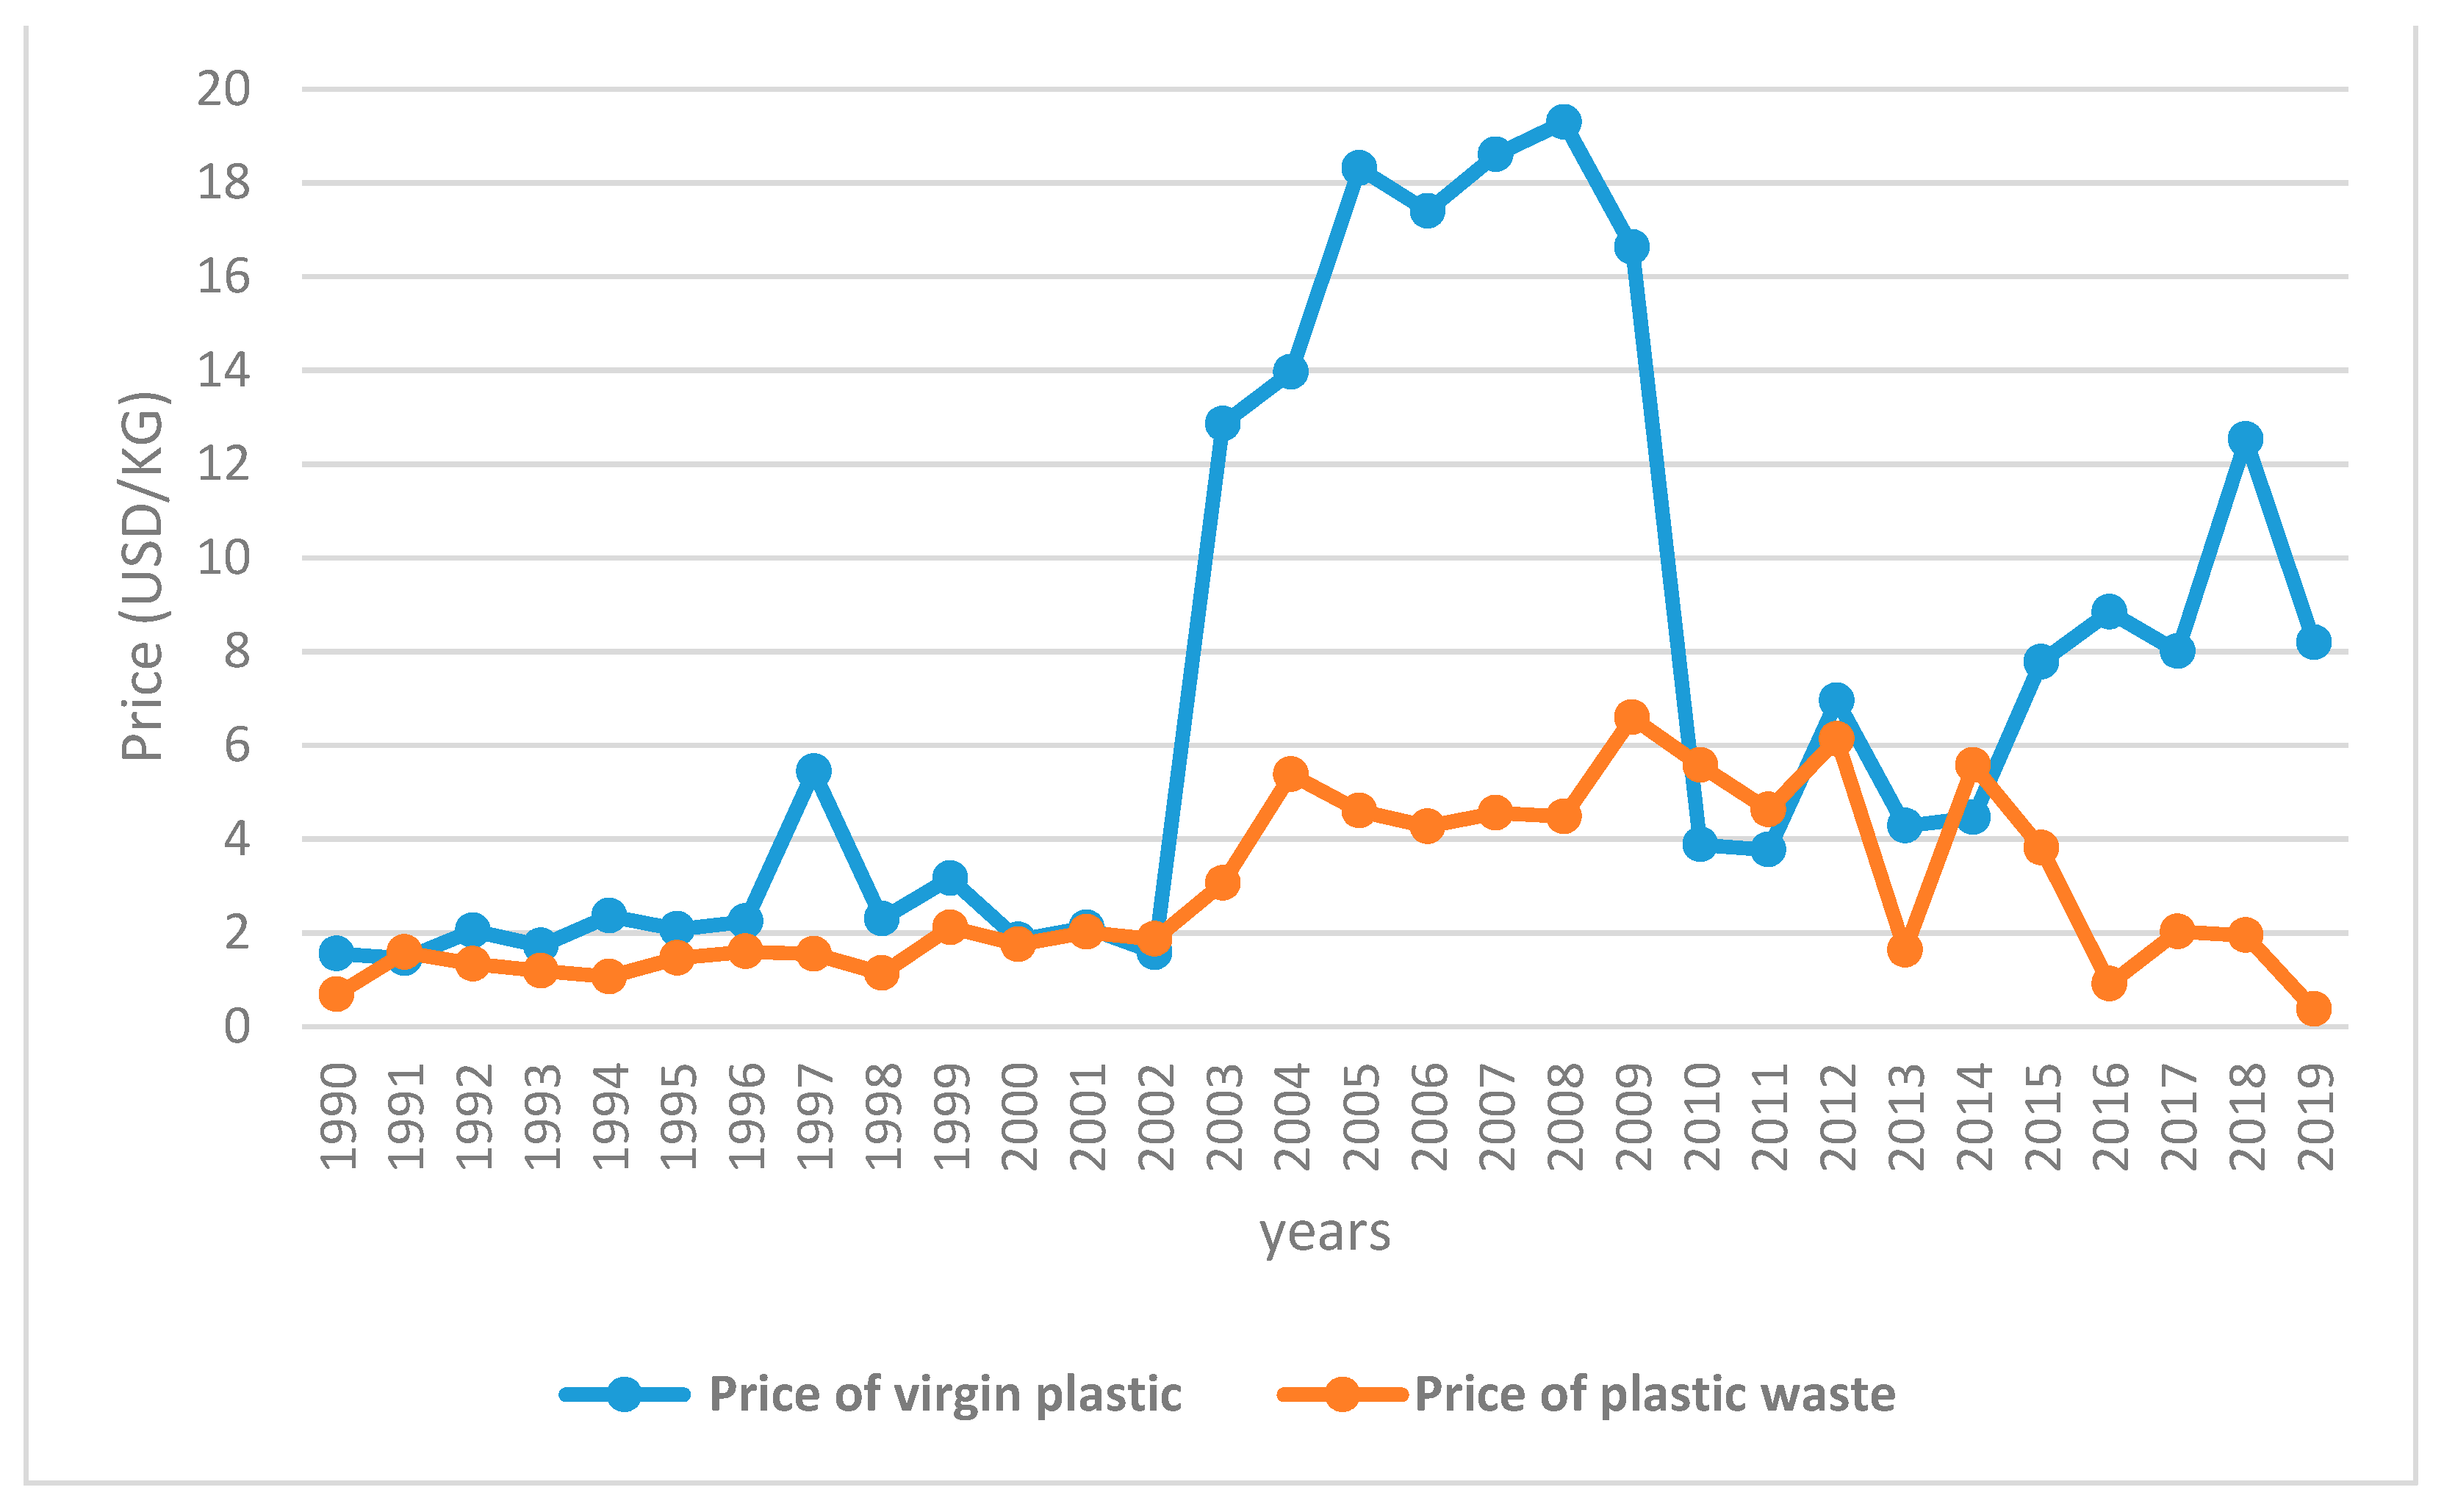
Global plastic waste trade is the cross-border transfer of plastic waste in which trade transaction price is an important factor affecting the volume of import and export trade. In order to explore the relationship between the price of plastic waste and the import and export volume (according to the UN Comtrade Database), the price of plastic waste imported and exported per unit and the price of virgin plastic finished products from 1990 to 2019 were calculated (Figure 2). It can be seen from Figure 2 that the price of plastic waste is generally follows the price of virgin plastic. During 1990 to 2000, the prices of the two curves were roughly the same; during 2000 to 2010, the price of virgin plastics was significantly higher than that of plastic waste; after 2010, the gap between the two curves gradually widened. Plastics are mostly formed by petroleum and other fossil fuels which are refined. Plastic flexible packaging materials are basically petroleum refined byproducts that are processed into the base material as raw materials. These would include, polypropylene (PP), ink, glue and other materials that are closely related to oil. In the value proportion of plastic flexible packaging products, the material cost accounts for 80% of its total cost, accounting for about 60% of sales. Therefore, the cost of plastic flexible packaging products and oil prices are positively correlated. The price of petroleum increased rapidly from 2005 to 2008, which led to a significant rise in the transaction price of plastics. After the financial crisis in 2008, the transaction price of virgin plastics dropped sharply, and the price of plastic waste also declined. In recent years, the fluctuation range of oil price has been smaller, and the price of plastic waste has been relatively stable. After 2014, the price showed a declining trend. One important reason is that China promulgated the “Green Fence Action” in 2013. As the largest importer, it has become more expensive to transport to China, so the plastic waste exporting countries turn to Africa, Southeast Asia and other regions with lower prices. The price of plastic waste is expected to rise in the future as the Basel Convention is gradually implemented and more and more countries sign up to agreements banning cross-border transfers of waste.
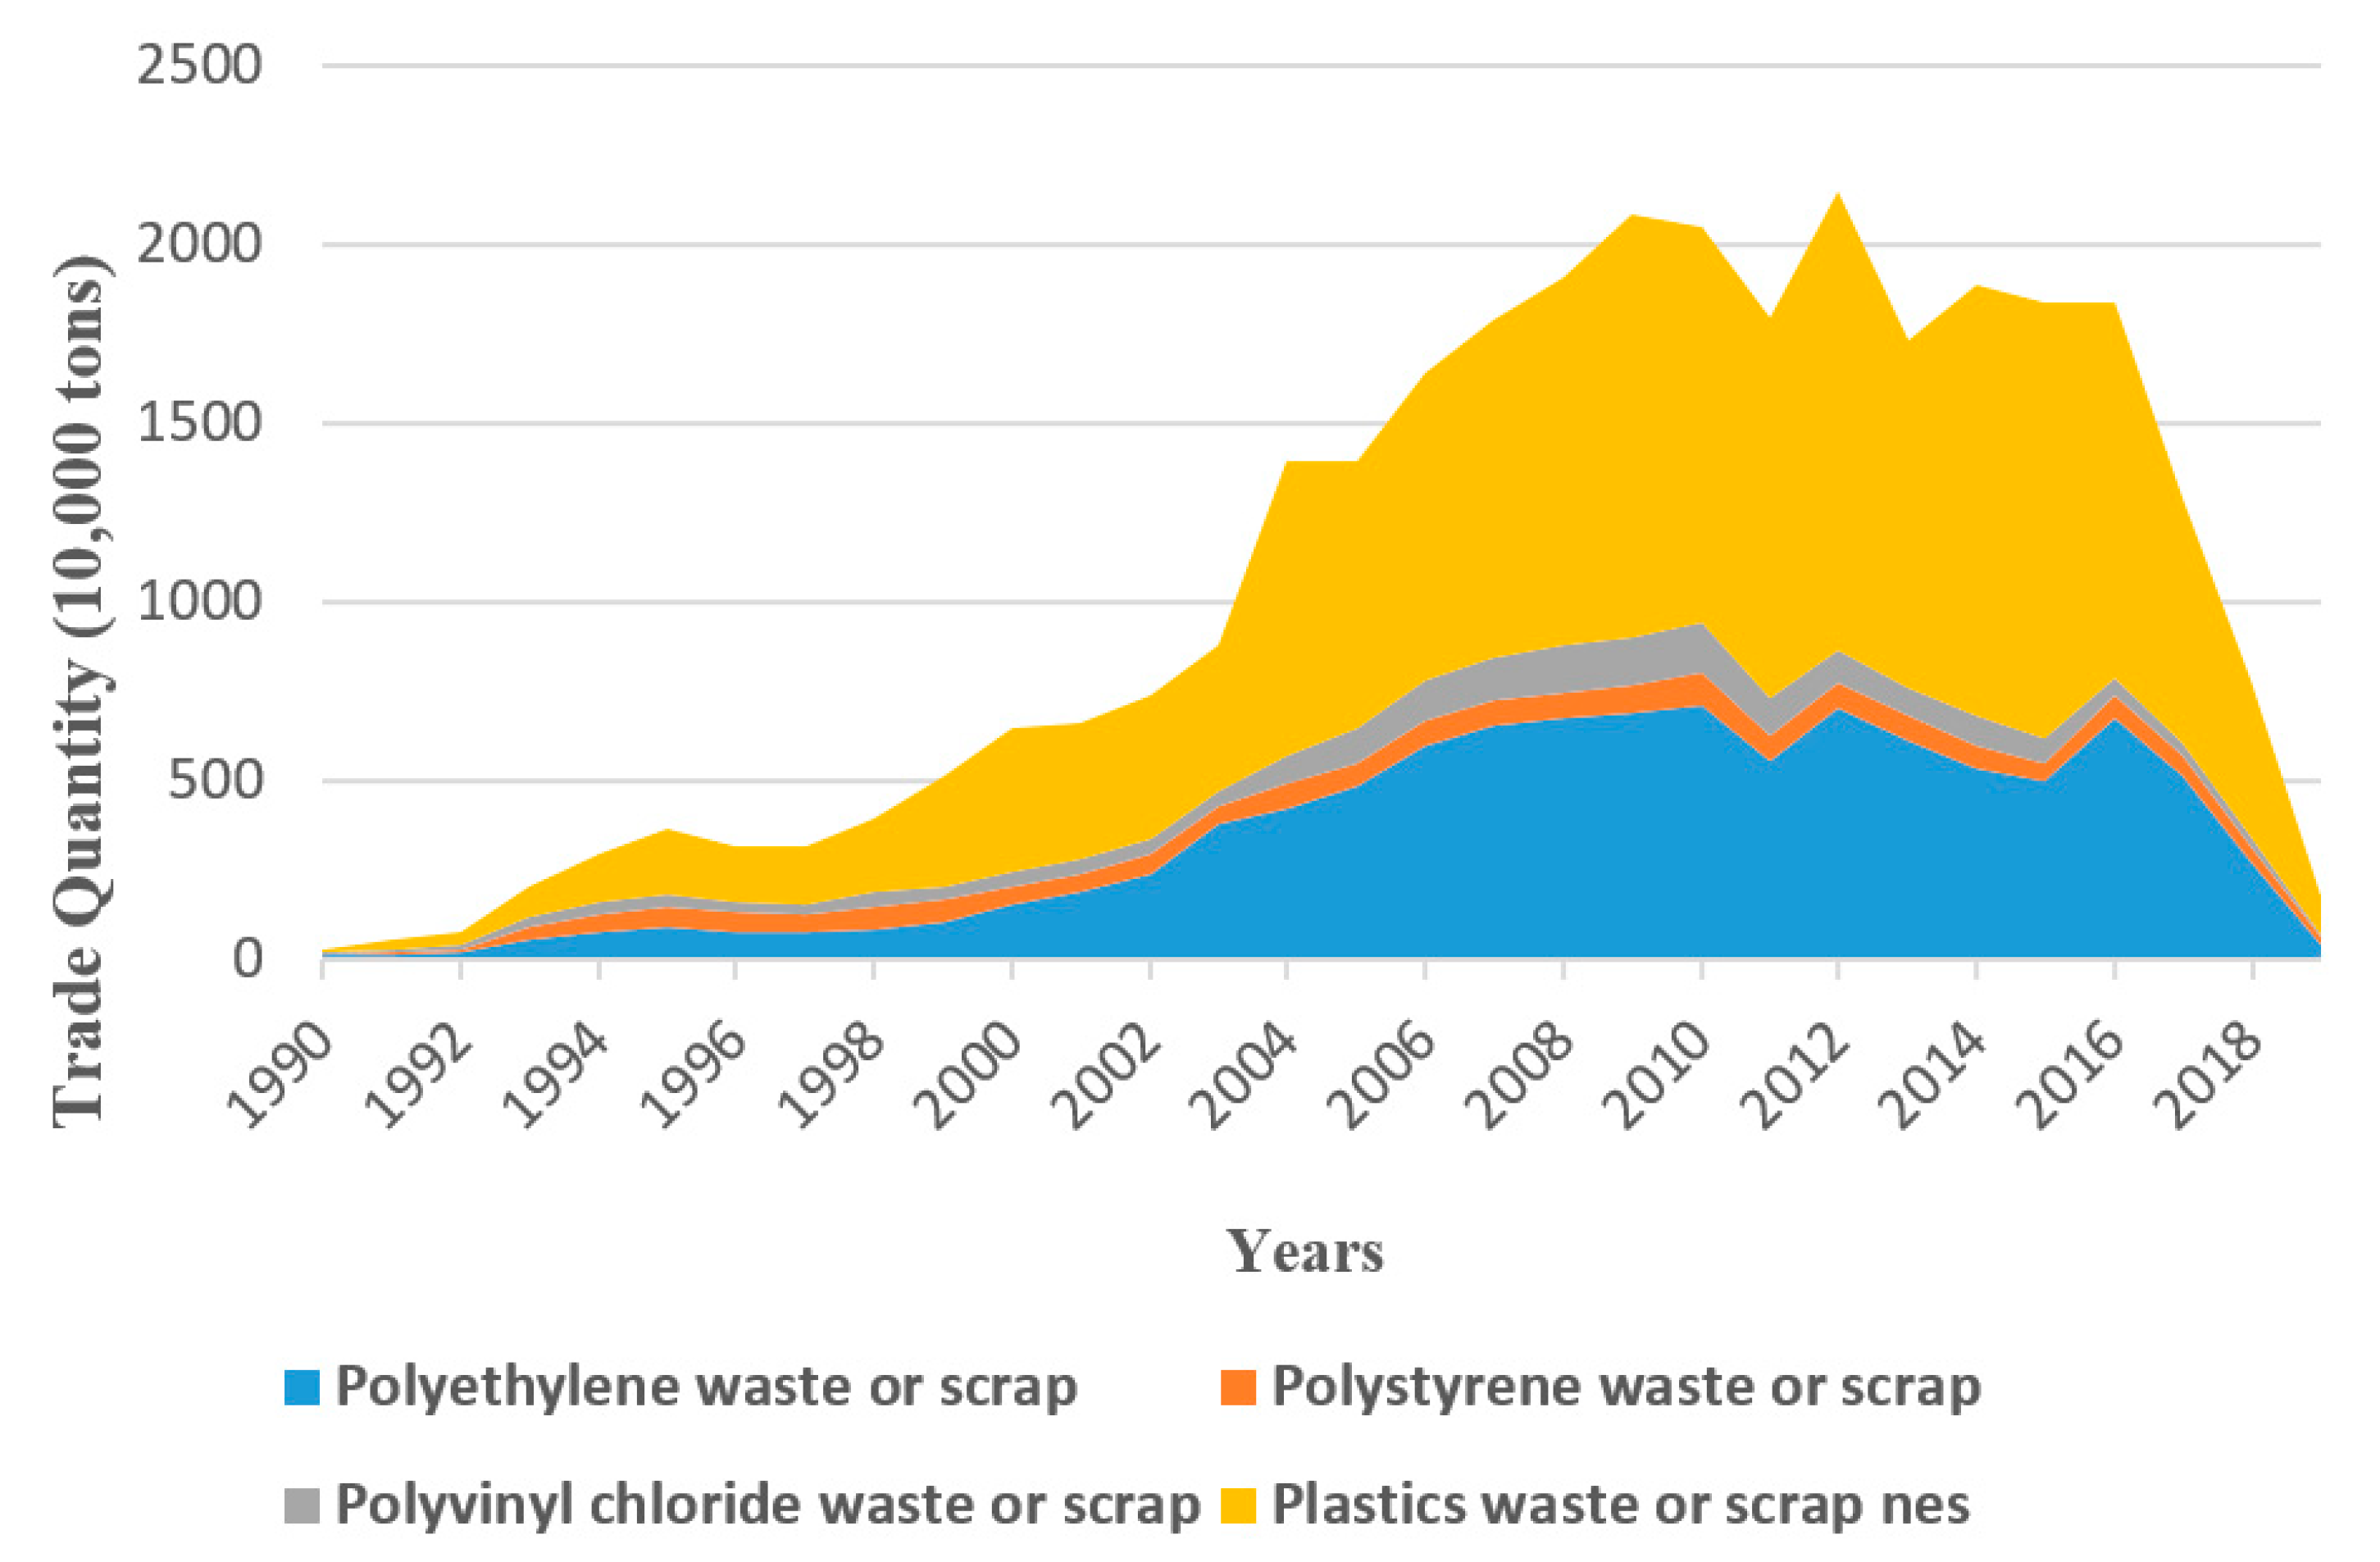
According to the UN Comtrade statistics list, plastic waste trade (HS 3915) can be divided into polyethylene waste (HS 391510), polystyrene waste (HS 391520), polyvinyl chloride (HS 391530), and others. The “other” plastics group includes plastic scrap polymers, which do not yet have an internationally agreed code for reporting. However, this includes trade in polymers such as polypropylene (PP) and polyethylene terephthalate (PET). Polyethylene (PE) waste is mainly used to make films and pipes. The recycling process is simple, however, the recycling value is relatively high [25]. Polystyrene (PS) products are widely used in various capacities due to the small density, large volume, good thermal insulation performance and convenient installation. These capacities include, buildings and cold storage thermal insulation layers and disposable packaging materials, commonly found in a variety of household appliances, industrial accessories and product transportation packaging. In addition, a considerable part is used for disposable fast food lunch boxes, food packaging boxes, etc. The typical polystyrene waste is foam pads and various fast food boxes and drink cups, which are dirty and covered with dust and food debris, so it is difficult to recycle and of low value [26]. Polyvinyl chloride (PVC) is mainly used for pipes, handbags, cables and so on. From the perspective of import and export categories (Figure 3), the global plastic waste import and export trade was dominated by polyethylene and polystyrene waste in the early years. Polyethylene and polystyrene mixed with polypropylene are the most commonly used products by consumers [27]. With the continuous development of trade, after entering the 21st century, polyethylene waste has become the main trading plastic waste which is easy to obtain and easy to recycle. Furthermore, polyethylene has a wide range of uses after recycling and processing, namely: further recycling, pelletizing, reusing, and making diesel.

2.2. Main Country Trade Situation

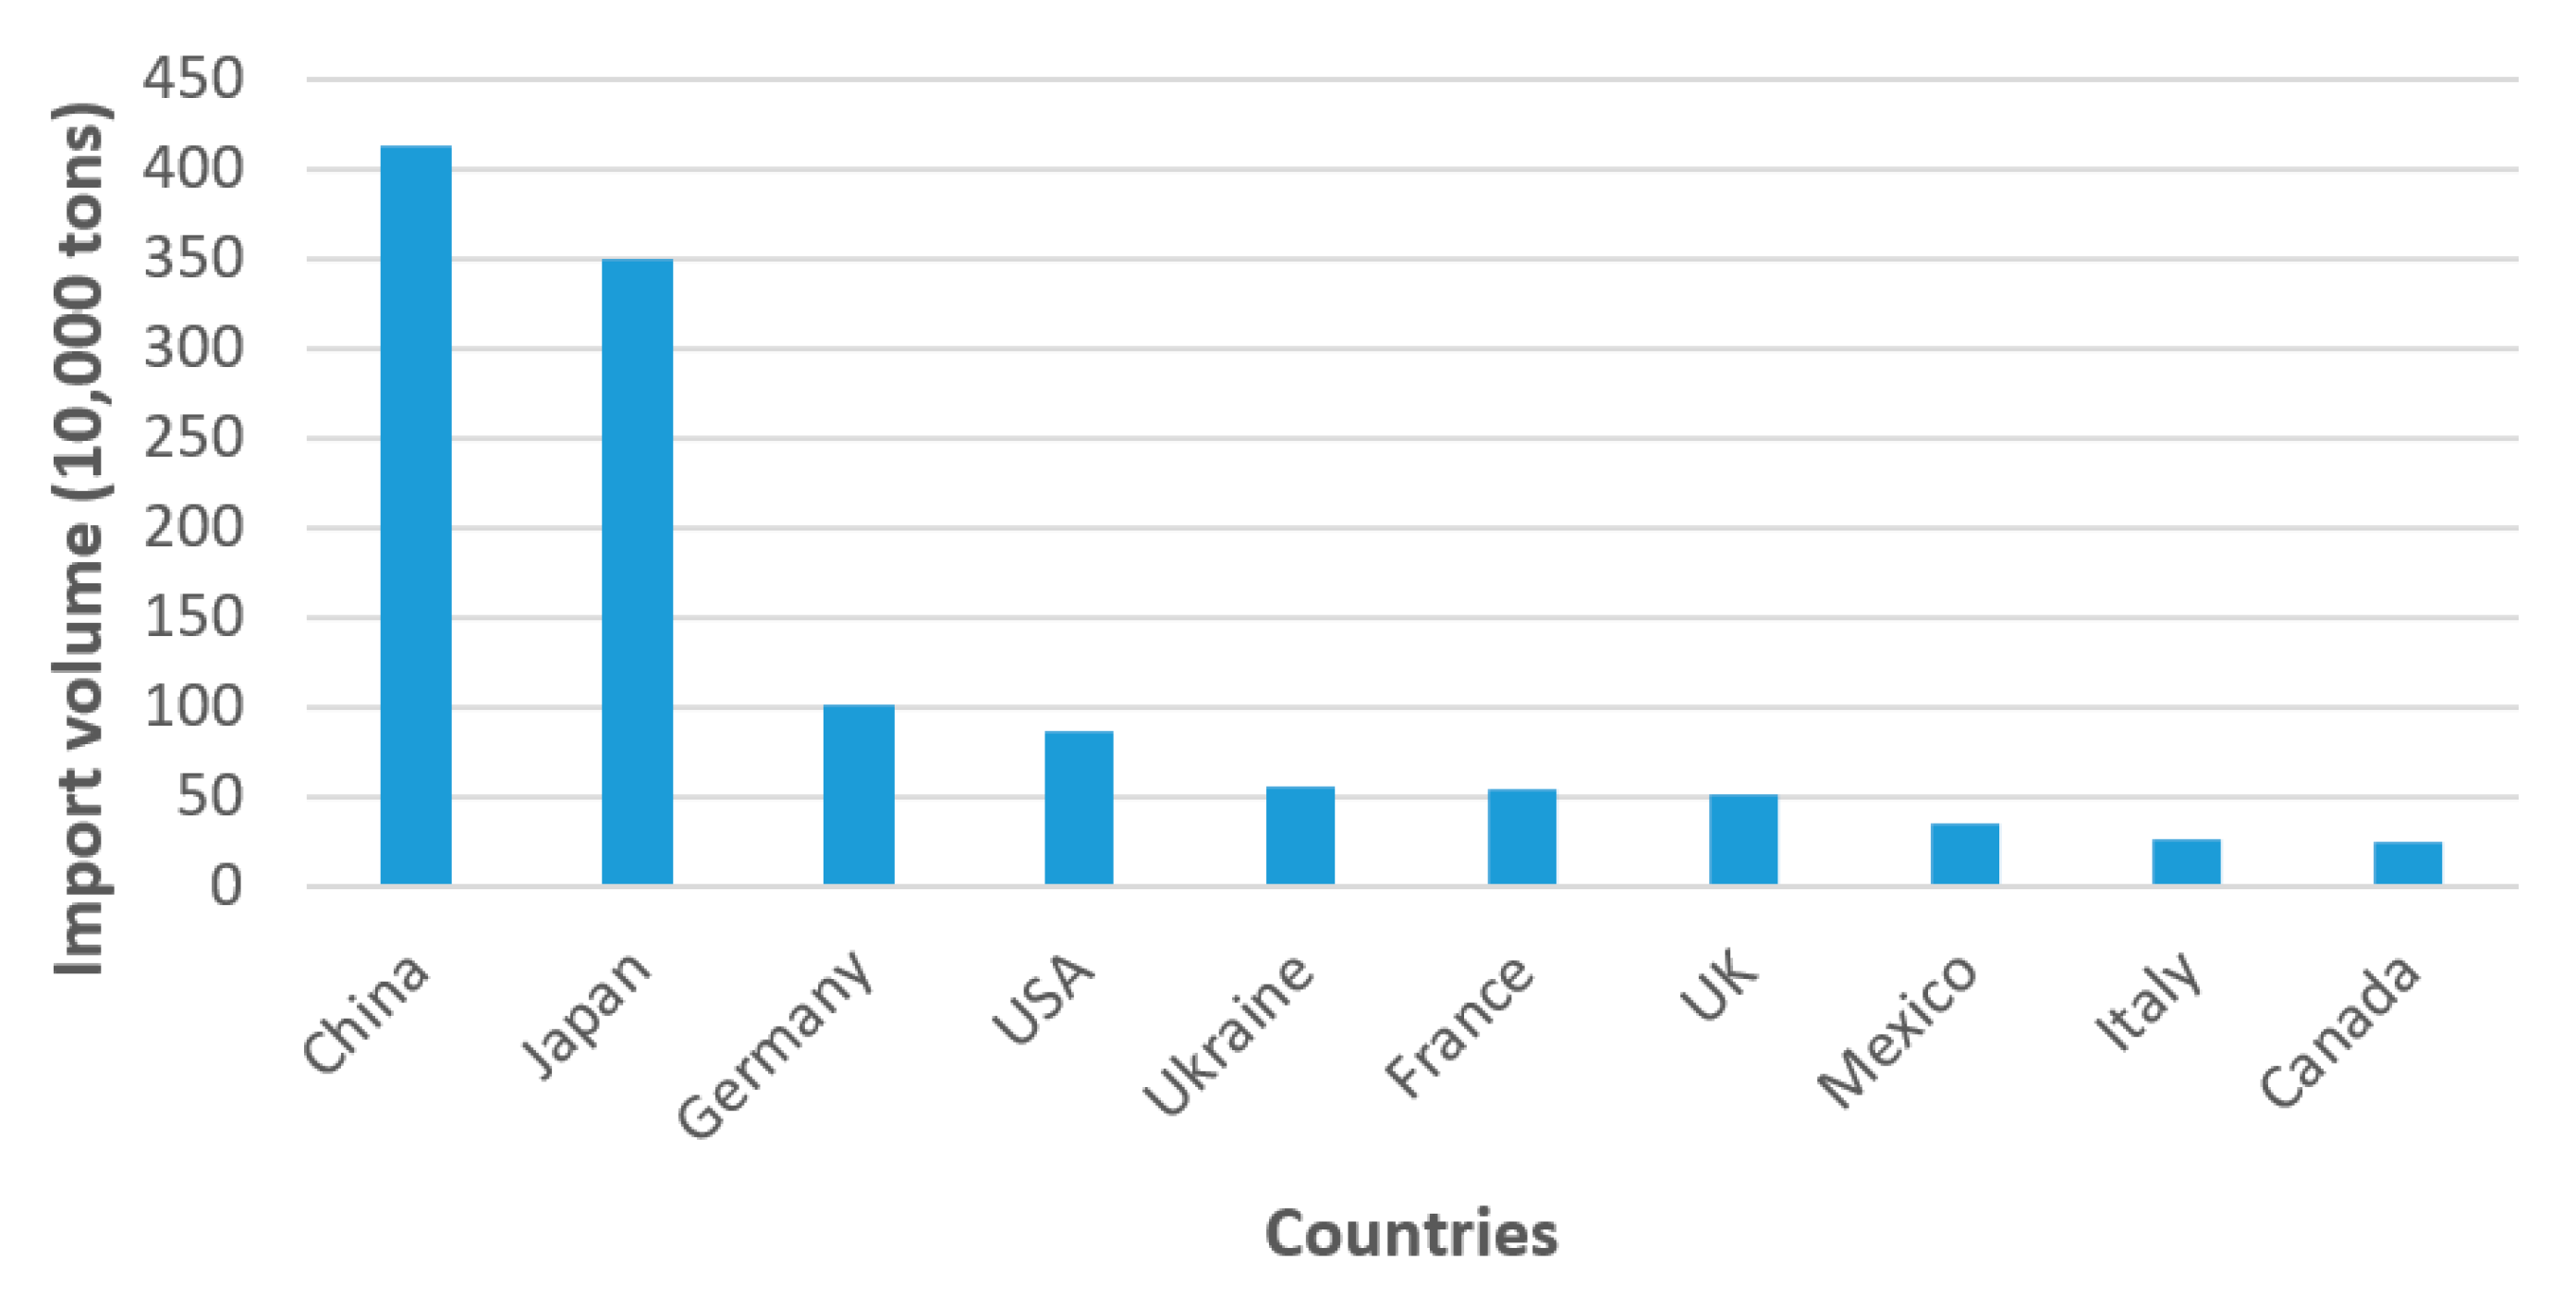
According to the UN Comtrade Database, Figure 4 shows the top 10 countries in terms of global trade volume between 1990 and 2017. From 1990 to 2017, China (including Hong Kong, China) has been the world’s largest importer of plastic waste, followed by Japan and the European Union. That is, in the first two stages, China, Japan, the European Union, Germany, and the United States have always been the world’s largest plastic waste importers. The five countries (or regions) accounted for more than 65% of the total, which has a significant impact on the global plastic waste trade.
After China announced a ban on foreign waste imports in 2017, the global plastic waste trade has changed. The top 10 global plastic waste exports from 2015 to 2019 are listed in Table 1 as follows:
From Table 1, it can be concluded that Hong Kong has always been among the top three in global export volume (excluding the year 2018). From 2015 to 2017, Hong Kong, China has been ranked in first place. In 2018, its position declined and was subsequently ranked in fifth place. Hong Kong’s exports fell by 80% in 2018, and in 2019 it rose to second place but with decreased volume. The United States ranks in the forefront of the world’s export volume, and has been in second place from 2015 to 2017, accounting for about 16% of the world’s exports. Japan is the country with the largest export volume (except Hong Kong, China and the USA), and its exports accounted for 14% of the world’s total exports. After China issued the ban, seven of the top ten export rankings were found to be developed countries. In general, the world’s plastic waste exports are dominated by developed countries.
From the statistical data in Table 2, the top two imports of waste plastics from 2015 to 2017 were relatively stable. They have been China, Hong Kong (China). It is worth noting that China and Hong Kong (China) are calculated separately in the statistics. According to the statistics of import and export volume, Hong Kong is the largest export region and import region. Plastic waste flows from other countries to Hong Kong and then to mainland China, where Hong Kong is one of China’s most important transshipment ports for plastic waste, transferring 22% of world trade to China each year [28]. In 2017, the pattern changed with the implementation of China’s ban on plastic imports, whereby plastic waste from other countries could no longer be exported to Hong Kong, which was also a major factor in exports’ decrease from the US, Japan and other countries. In 2018, for the first time in history, China was no longer the top importer of plastic waste, with Malaysia taking the top spot. However, the list changed in 2019 again. China (Hong Kong), Canada, and Poland have become the top three, and Malaysia has fallen out of the top ten. One of the reasons is that Southeast Asian countries such as Malaysia have followed China in enacting plastic waste import bans. Since China issued the ban, the export target countries have undergone dynamic changes and are now extremely unstable. The estimated global import trade of waste plastics will shift to Southeast Asian countries. The influx of a large amount of plastic waste will make it difficult for these countries to cope with it. Therefore, Southeast Asian countries are undergoing changes and refuse to become the “trash can” of plastic waste in the world [29].
Based on the above findings, the global plastic waste trade is unevenly distributed. The trade is mainly concentrated in Europe, Southeast Asia and North America. With the promulgation of bans in China and other countries, the focus on global plastic waste trade has changed. Europe has gone from being a big exporter to being both a big importer and exporter, and some countries in Asia have seen a significant drop in imports.
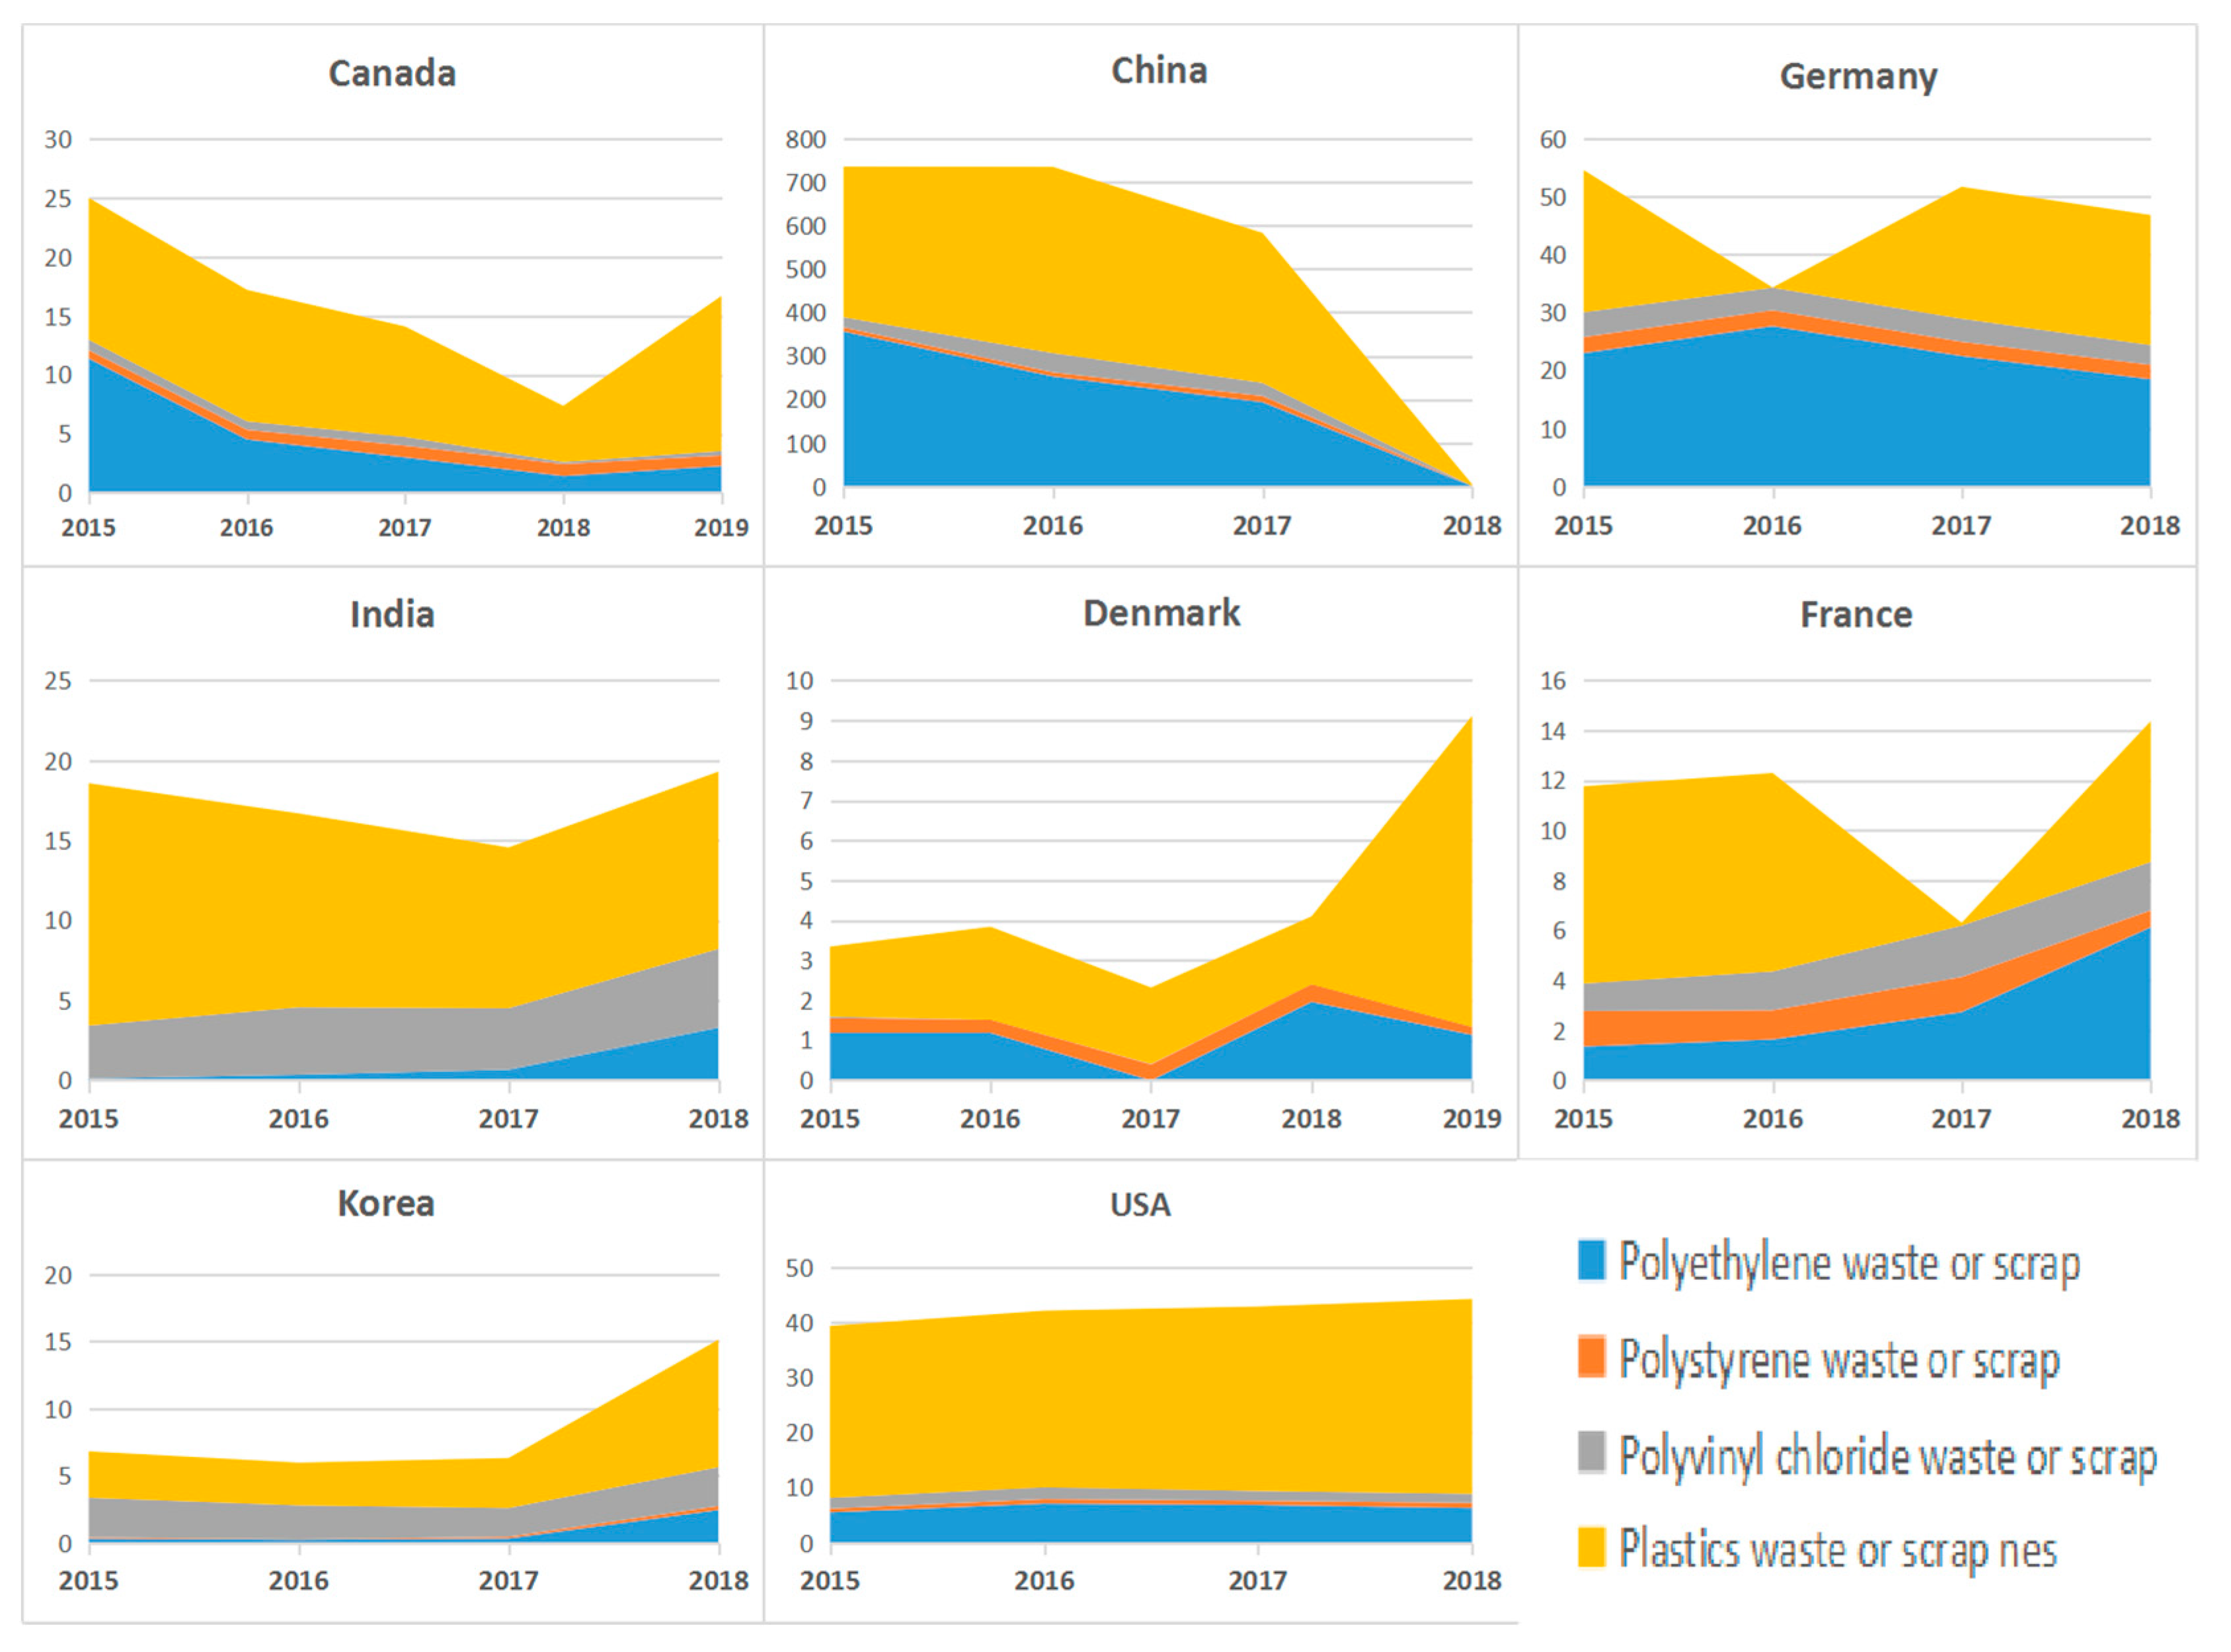
Figure 5 respectively reflects the imported plastic waste categories of major plastic waste trading countries from 2015 to 2018.
As shown in Figure 5, imports of plastic waste in some countries, such as China and France, have declined significantly, but imports in most countries have increased, such as Japan and Denmark. The imports from the United States have remained stable. After the 2018 import ban took effect, China’s plastic waste imports continued to decline, from 3.4589 million tons in 2015 to 36,900 tons in 2018. Denmark’s imports in 2019 rose sharply, from 16,900 tons in 2018 to 78,000 tons. Japan also rose sharply, from 21,000 tons in 2018 to 16,800 tons, an increase of 6.7 times. In terms of total volume, the United States, Germany and Canada are important importing countries. The United States basically maintained around 350,000 tons in 2015–2018, and Germany basically remained at 220,000 tons. Canada’s imports in 2015–2018 have gradually declined, and imports in 2018 were 77,400 tons, but rose rapidly to 130,000 tons in 2019.
After the import ban took effect on 1 January 2018, China’s plastic waste imports continued to decline. With the exception of China and Japan, India experienced substantial growth in 2018 and fell back in 2019, while South Korea and Thailand jumped from net exporters to net importing countries. The United States plastic waste exports continued to decline in the period from 2018 to 2019. Imports also fell in 2019. Other net exporting countries also showed a decline in exports and an increase in imports in 2018. Among them, were the Netherlands and Belgium. In Spain and Canada, imports exceeded exports. This shows that the global plastic waste trade had some important changes under the influence of sudden factors. Next, this article will use complex network methods to predict the changing trend on global plastic waste.

3. Methods and Data Sources

3.1. Methods

The complex network is used to describe the model of interconnected systems in natural sciences, social sciences and science engineering technology [30]. The complex network originated from the Königsberg Seven Bridges problem in 1736. After continuous research by scholars, the current widely used models include Random network, W-S network(Small World network is a network between the regular network and the random network) and scale-free network models [31]. The achievements of complex networks within international trade are mainly used as a quantitative analysis tool to measure changes in trade relation networks between countries [32]. The network characteristic indexes in the complex network can reflect the structural characteristics of the complex network, and the topological network indexes and weighted network indexes can reflect the connectivity of network nodes and node centrality from different levels respectively.

3.2. Data Sources

From a global perspective, the share of plastic waste trade varies across the continents [19]. According to Figure 6, the global plastic waste trade is mainly concentrated in North America, Europe, Asia, and Oceania. According to the data of the United Nations Commodity Trade Database, this paper selects 40 countries that account for 80% of the global plastic waste trade as the research countries in order to carry out plastic waste trade cooperation, as shown in Table 3.
The trade volume of plastic waste of 40 countries was obtained from the United Nations Commodity Trade Database, and the data from 1990 to 2019 was selected to construct a 40 × 40 initial trade matrix. Based on this, the data was binarized. If the trade volume between the two countries is greater than the weight number, it is determined that the two countries have economic and trade cooperation relations on plastic waste, and the adjacency matrix is assigned a value of 1, otherwise it is considered that there is no economic and trade cooperation between the two countries and the adjacency matrix is assigned a value of 0.

3.3. Complex Network Index Analysis

UCINET software is used to draw the binary data, and the resulting trade network is shown in Figure 7 and Figure 8:
In Figure 7 and Figure 8, the data is as follows: red nodes representing important countries in the trade network and blue nodes representing countries with small trade volume. The size of a node reflects its influence in the network. The position of a node in the network reflects its position in the network. The status of the network suggests the closer to the center, the higher is the status. It can be seen from the figures that the plastic waste trade network diagram in 2019 has a clear sparse trend compared with the previous diagrams, indicating that the density of the network has decreased and the closeness of trade ties between node countries has decreased. In Figure 7 and Figure 8, China, the United States and Germany have always occupied central positions in the network. They have the greatest impact on the global plastic waste trade network, and have greater influence and voice.

4. Results

4.1. Degree Centrality Analysis

Calculate the degree centrality of the above network, and the results are shown in Table 4.
Analyzing the data in Table 4 shows that China has the overall largest degree centrality from the period 1990 to 2019. By 2019, China’s degree centrality has dropped significantly, ranking 21st. The degree centrality of the United Kingdom and the United States has always occupied a core position in the global plastic waste trade network. South Korea, Germany and Belgium belong to the sub-core nodes. These countries have little change in the degree of centrality in the 10 years from 2010 to 2019, and they are relatively stable, indicating that these countries have close trade ties with other member states in the plastic waste trade. Bangladesh, Yemen and Iraq have relatively small degrees of centrality, and they are at the edge of the network. This shows that these countries have little impact on the global plastic waste trade and are not key node countries. Clustering by region shows that the global plastic waste trade has formed the following regions: Asian, centered on China, Japan and South Korea; European, centered on Germany, the United Kingdom and Italy; North American, centered on the United States.

4.2. Closeness Centrality Analysis

Calculate the proximity centrality of the member states of the aforementioned plastic waste trade network, and the results are shown in Table 5:
Table 5 shows that the closeness centrality gap of the member states is not very large, and the closeness centrality values of most member states show a downward trend. Vietnam, Canada, the Philippines and India multiply their closeness to centrality values by increasing states, which indicates that their ability to not be controlled by other member states in the network has become stronger, and has gradually become key nodes in the global plastic waste trade network.
The proximity centrality of China, the United States, and the United Kingdom ranks among the top three in the network. It shows that the three countries rely less on other countries in the network. The garbage trade between these countries and other member states is almost unaffected. Their independence is higher, and it is more likely to realize internal disposal of plastic waste. The proximity to the center of Bangladesh, Yemen and Iraq is at the end, which shows that these countries are highly dependent on the plastic waste trade of other member states.

4.3. Betweenness Centrality Analysis

The intermediate centrality of member states in the global plastic waste trade network is calculated as shown in Table 6:
It can be seen from Table 6 that the intermediate centrality of most member states is multiplied by a stable state. The centrality of some countries has always been 0, which reflects that they have less contact with other countries in the network and have little influence and ability to control other countries. The United States, Canada, South Korea, Poland and India are showing a clear upward trend, and China, Malaysia, Germany and the United Arab Emirates are showing a downward trend, which shows that these countries have strengthened their independence in the trade of plastic waste. China’s centrality has been at the highest position from 2005 to 2015, and the value of the centrality has declined since 2015, indicating that China’s influence in the global plastic waste trade is gradually declining. The centrality of the United States and other countries has been on the rise, and has gradually become key modes country influencing the plastic waste trade. South Korea and Saudi Arabia are the top-ranked countries in the centrality of the Asian region. These two countries have relatively strong control over the exchanges between member states.

4.4. Analysis on Density of Global Plastic Waste Trade Network

In order to explore the evolution of the spatial pattern of the global plastic waste trade network, Figure 9a shows global plastic waste import and export trade data from 2000 to 2017, and Figure 9b shows global plastic waste import and export trade data from 2018 to 2019. Where the size of the node represents the size of the weight, that is, the total size of the country’s plastic waste imports and exports.
According to Figure 9, the global plastic waste trade network has undergone significant node changes in the periods 2000 to 2017 and from 2018 to 2019. From 2000 to 2017, there were eight major net importers of plastic waste. In descending order of import volume, they were as follows: China, Malaysia, Vietnam, South Korea, Singapore, India, Ukraine and Turkey. Apart from Ukraine, which is a European country, the rest were all from Asia Countries. Apart from Singapore, the rest are all developing countries.
In the 2018–2019 period, the main net importing countries have increased to 17, including Austria, Lithuania, Croatia, Bulgaria, Latvia, Russia, Thailand, Indonesia, and Morocco. All of them are developing countries except Austria. Apart from Thailand and Indonesia, which are Asian countries, Morocco is an African country, and the other six countries are all European countries.
After China promulgated the ban, the number of major net importers of plastic waste increased, and expanded from Asia as the main import area to include European and African countries, and the net importing countries changed from all developing countries to mainly developing countries.
Using UCINET to calculate the overall network density of the trade network, the results are shown in Table 7:
The data in Table 7 shows that the overall network density of the plastic waste trade network was stable from 1990 to 2018, and it declined significantly from 2018 to 2019, indicating that the global plastic waste trade was frequent from 2010 to 2018. The plastic waste trade between member countries shows the quantity is large and the density is high. In the year 2018 to 2019, the overall network density decreased from 0.6382 to 0.4846, indicating that the global plastic waste trade has decreased, some connections are disconnected, and the overall network density has declined, which indicates that the global plastic waste trade network density is showing a sparse development.

5. Discussion and Conclusions

5.1. Discussion

The COVID-19 epidemic has changed consumer habits. Packaged food and takeaway packaging has increased. Further increases have been seen in plastic medical waste such as PPE and syringes, which strains municipal solid waste, although some countries treat them in another approach. A large number of single-use plastic products have been used, resulting in a large amount of plastic waste, which has become more difficult to manage. Whether imported or domestic waste, this presents a huge challenge to plastic waste management and recycling. China’s ban only bans plastic waste, not the import of plastic parts, which are stored in large quantities or shipped to Southeast Asian countries to remain for a short period of time. The most widely used plastic waste management techniques in the world are recycling, incineration and landfill, of which 14–18% of plastic waste is recycled, 24% is incinerated and 58–62% of plastic waste is taken to landfills [33]. Incineration releases a large amounts of carbon dioxide, and landfill may pollute the water environment. For developed countries, the level of waste treatment technology remains high, and the plastic recycling industry has good future prospects. In 2018, Japan’s plastic waste recycling rate was as high as 84% [17], and South Korea’s plastic recycling rate was 41%. However, most developing countries lack the technology and capacity to deal with plastic waste. Some countries, such as Myanmar, Vietnam and Indonesia, currently have no specific regulations. Although Malaysia has enacted some import restrictions, the plastic waste management system still has a long way to go in terms of current laws and regulations. Global imports of plastic waste have dropped sharply since China’s ban in 2017, with exports from countries such as the United States, Germany and Japan dropping. With Vietnam, Thailand and Indonesia tightening import restrictions, the countries should do a better job of managing plastic waste internally.
On the one hand, relevant countries need to strengthen cooperation in plastic waste treatment technology, research and development of degradable plastics, optimization of plastic reverse supply chain, etc. At present, European developed countries, Japan and other countries are in a leading position in the plastic waste treatment technology and the development of new environmental friendly plastics. At the same time, European and American countries began to apply the blockchain technology to the reverse supply chain of waste plastics [34]. By optimizing the reverse supply network, the efficiency and effect of recycling can be improved, so as to improve the efficiency of waste plastic treatment and transaction.
On the other hand, countries need to strengthen cooperation in education regarding sustainable development and the potential harm of plastic waste, so that consumers can develop green and sustainable consumption habits, and constantly reduce the discharge of plastic waste to the natural environment. In addition, a practical international cooperative governance mechanism needs to be established in order to encourage relevant countries, international organizations, non-profit organizations and enterprises to actively participate in the treatment of plastic waste. Furthermore, these groups should form an open innovative cooperation network, improve the efficiency of cooperative governance and jointly deal with the problem of plastic waste pollution [33].

5.2. Conclusions

It is undeniable that the trade of plastic waste provides more jobs for importing countries and profits for recycling enterprises. However, the low level of recycling technology and the non-standard sorting processes seriously affect both the environment and human health. At present, according to the analysis of trade status and trade network, among the categories of plastic waste, polyethylene (PE) is the main category of plastic waste trade, which has the largest recycling value and sustainable development value. In the use of data on import and export trade volume, specific plastic product flow direction can be further studied in the future.
In terms of countries, developed countries are exporters of plastic waste, while developing countries are importers. China, once the largest trade importers, has lost its position and influence in the network since the waste ban. Developed countries have chosen to export to Asia, where costs are lower, so imports from countries like Malaysia and India have increased. From the perspective of network density, the global plastic waste trade network is sparse, and the dependence of relevant countries on plastic waste trade has decreased, and the degree of trade links has decreased. An important reason is that more and more countries have issued bans on plastic imports.
Many plastic recyclers have chosen to set up factories in Southeast Asia, where the latest processing technology is generally lacking. Imports are expected to increase, but not for long as some countries restrict the import of plastic waste. Cambodia reduced imports, production, distribution, and consumption of plastic bags in 2017. Malaysia banned the import of plastic waste in 2017. In 2018, Malaysia adjusted its policy to strengthen the management of imported waste plastics from industries to avoid further imbalance of domestic plastic pollution. In March 2019, India made two amendments to the Hazardous Waste Rules (2016) to impose a total ban on the import of plastic waste in all regions of India. To some extent, the ban has eroded the market advantage Asian importing countries enjoyed due to low costs and the increasing competitiveness of high-standard plastic recycling industries in Europe and North America. Increasing the amount of plastic recycled in Europe and North America, forcing the industry to upgrade technology and scale up production, will lead to changes in the layout and industry shift of the global plastic waste reverse supply chain.

Author Contributions

Conceptualization, C.Z.; Data Curation and Methodology, M.L.; Writing—Reviewing and Editing, Y.G. and H.D. All authors have read and agreed to the published version of the manuscript.

Funding

This research was supported by Social Science Fund of Liaoning Province (L18AJY010) and National Natural Science Foundation of China (No. 71974144).

Data Availability Statement

Data is contained within the article and Appendix A.

Conflicts of Interest

The authors declare no conflict of interest.

Appendix A

Table A1. Plastic Waste Trade Network Degree Centrality from 1990 to 2019.
Country/Year19901995200020052010201520182019
Australia33.33320.51328.20546.15456.4164.10379.48725.641
Austria10.25625.64148.71853.84661.53874.35974.35961.538
Bangladesh7.692010.25630.76946.15433.3337.6925.128
Belgium0074.35984.61594.87287.17989.74489.744
Canada28.20533.33356.4166.66769.23169.23176.92376.923
China10.25648.71876.92397.43610010097.43671.795
Czech Republic023.07746.15446.15461.53874.35979.48771.795
Denmark41.02628.20548.71846.15464.10361.53869.23169.231
France17.94948.71869.23184.61582.05189.74492.30882.051
Germany069.23187.17992.30892.30894.87292.30889.744
India38.46246.15458.97484.61594.87289.74492.30892.308
Indonesia35.89725.64143.5956.4174.35969.23174.35969.231
Iraq2.564002.5647.69210.2567.6925.128
Ireland12.82148.71843.5941.02658.97451.28258.97456.41
Italy17.94961.53874.35989.74489.74489.74492.30887.179
Japan23.07735.89753.84658.97464.10387.17987.17984.615
Korea35.89723.07764.10369.23179.48789.74489.74492.308
Malaysia35.89733.33356.4174.35979.48776.92376.92356.41
Mexico15.38520.51317.94948.71856.4179.48779.48774.359
Netherlands28.20566.66779.48789.74487.17987.17989.74487.179
New Zealand7.6925.12815.38541.02651.28246.15451.28251.282
Norway2.56415.38525.64138.46248.71848.71853.84630.769
Pakistan7.69217.94946.15458.97466.66751.28253.84653.846
Philippines10.25620.51333.33364.10335.89735.89743.5948.718
Poland2.56423.07733.33358.97461.53882.05182.05176.923
Portugal5.12820.51330.76928.20553.84658.97464.10361.538
Saudi Arabia12.82128.20538.46241.02656.4192.30887.17961.538
Singapore56.4130.76953.84666.66769.23171.79571.79571.795
Slovakia07.69223.07735.89741.02651.28253.84653.846
Slovenia07.69225.64141.02656.4146.15453.84635.897
Spain35.89728.20558.97474.35984.61587.17992.30887.179
Sweden12.82125.64143.5961.53876.92379.48789.74479.487
Switzerland5.12825.64146.15456.4151.28284.61584.61571.795
Thailand28.20523.07743.5941.02661.53882.05179.48761.538
Turkey7.6925.12825.64146.15466.66792.30887.17984.615
United Arab Emirates5.1282.56446.15458.97464.10374.35979.48743.59
United Kingdom30.76956.4182.05192.30889.74492.30894.87289.744
United States30.76974.35989.74494.87292.30894.87294.87294.872
Vietnam05.12825.64169.23176.92379.48776.92374.359
Yemen0010.25615.38520.51310.2565.1282.564
Table A2. Plastic Waste Trade Network closeness centrality from 1990 to 2019.
Country/Year19901995200020052010201520182019
Australia11.74717.41136.79263.93469.64373.58582.97957.353
Austria11.30417.64740.20667.24172.22279.59279.59272.222
Bangladesh11.08031.96759.091656051.31650.649
Belgium0044.82886.66795.12288.63690.69890.698
Canada11.50417.8941.4897576.47176.47181.2581.25
China11.23918.39645.34997.510010097.578
Czech Republic017.48939.39463.93472.22279.59282.97978
Denmark11.8917.72740.20663.93473.58572.22276.47176.471
France11.53818.48343.8286.66784.78390.69892.85784.783
Germany019.21247.56192.85792.85795.12292.85790.698
India11.81818.3141.93584.78395.12290.69892.85792.857
Indonesia11.60717.64739.39469.64379.59276.47179.59276.471
Iraq10.6560041.9355252.70350.64950.649
Ireland11.30418.48339.39462.90370.90967.24170.90969.643
Italy11.53818.93244.82890.69890.69890.69892.85788.636
Japan11.33718.05641.05369.64373.58588.63688.63686.667
Korea11.64217.56842.85776.47182.97990.69890.69892.857
Malaysia11.78217.97241.48979.59282.97981.2581.2569.643
Mexico11.30417.41135.4556569.64382.97982.97979.592
Netherlands11.67719.11845.88290.69888.63688.63690.69888.636
New Zealand11.17515.91835.13561.90567.2416567.24167.241
Norway10.86417.25736.44960.93866.10266.10268.42159.091
Pakistan11.11117.41139.79670.9097567.24168.42168.421
Philippines11.14317.48937.86473.58560.93860.93863.93466.102
Poland10.86417.48937.569.64372.22284.78384.78381.25
Portugal11.01717.41137.14357.35368.42170.90973.58572.222
Saudi Arabia11.40417.80838.61462.90369.64392.85788.63672.222
Singapore12.07417.8941.0537576.471787878
Slovakia016.8136.1116062.90367.24168.42168.421
Slovenia016.8136.44961.90569.6436568.42159.091
Spain11.64217.64741.9357886.66788.63692.85788.636
Sweden11.47117.6473972.22281.2582.97990.69882.979
Switzerland11.01717.64739.79668.42167.24186.66786.66778
Thailand11.53817.48939.39462.90372.22284.78382.97972.222
Turkey10.86416.59636.449657592.85788.63686.667
United Arab Emirates11.11115.78939.79670.90973.58579.59282.97962.903
United Kingdom11.74718.7546.42992.85790.69892.85795.12290.698
United States11.71219.40348.14895.12292.85795.12295.12295.122
Vietnam016.73836.79276.47181.2582.97981.2579.592
Yemen0033.91353.42555.71452.70350.64948.75
Table A3. Plastic Waste Trade Network Betweenness Centrality from 1990 to 2019.
Country/Year19901995200020052010201520182019
Australia2.271.0510.2020.1530.420.1030.2730.007
Austria0.6810.5550.7650.3720.4350.370.2380.184
Bangladesh0000.1080.085000
Belgium002.2741.9492.2490.7140.621.336
Canada0.8950.561.1030.9290.5780.1460.1740.843
China0.1924.9944.674.3674.9234.2335.0980.417
Czech Republic00.4370.6610.2720.3770.3370.2930.388
Denmark14.2720.3380.5540.1730.4620.1370.1420.325
France0.5843.3171.8232.1771.0920.9710.8020.792
Germany09.0195.242.8521.5811.4890.8021.336
India4.8275.9992.242.7032.2492.1682.2126.127
Indonesia2.8860.2030.2560.360.7370.3850.2560.583
Iraq00000000
Ireland1.0193.4370.3650.1750.1870.0160.0350.044
Italy0.7127.354.2593.4463.440.8820.8021.033
Japan0.5220.6311.7270.5230.5621.0110.6031.091
Korea2.5980.3331.8911.0241.0631.1492.8558.795
Malaysia1.7330.6191.3971.851.0150.6540.3870.2
Mexico0.7480.02900.0940.2460.3790.2310.428
Netherlands1.6767.424.6552.6911.5170.7140.621.14
New Zealand0000.1070.2540.01600.264
Norway000.0290.1170.2390.0370.0330
Pakistan00.10.3115.630.4360.01700.138
Philippines00.0850.1310.7090.064000.159
Poland00.1680.1250.520.4420.5890.3580.748
Portugal000.0190.0070.1730.0920.080.22
Saudi Arabia0.4140.4370.6420.3270.4063.3712.0950.275
Singapore13.6360.4742.0040.7690.6160.3740.1810.64
Slovakia000.0980.0740.0850.0360.0420.157
Slovenia000.0750.1150.7330.0070.0250.006
Spain9.5360.1891.6641.2581.2820.8390.8021.033
Sweden0.4420.2750.4310.6730.8310.5160.620.651
Switzerland00.1270.590.690.1820.5940.3950.356
Thailand1.8660.1941.1750.1860.4080.840.330.16
Turkey0.11900.0280.1881.7171.9952.0111.033
United Arab Emirates000.9221.1130.7131.2230.330.141
United Kingdom4.2783.7724.4912.8681.3451.9952.5561.659
United States2.78410.1026.3513.2451.6681.4892.3994.404
Vietnam000.140.7990.7970.6080.3160.673
Yemen00000.018000

References

  1. Eriksen, M.K.; Pivnenko, K.; Olsson, M.E.; Astrup, T.F. Contamination in plastic recycling: Influence of metals on the quality of reprocessed plastic. Waste Manag. 2018, 79, 595–606. [Google Scholar] [CrossRef]
  2. Lebreton, L.; Andrady, A. Future scenarios of global plastic waste generation and disposal. Palgrave Commun. 2019, 5, 1–11. [Google Scholar] [CrossRef] [Green Version]
  3. Huang, K.L. China’s ban could curb plastic waste. Nature 2018, 553, 405. [Google Scholar] [CrossRef] [PubMed] [Green Version]
  4. Sasaki, S. The effects on thailand of china’s import restrictions on waste: Measures and challenges related to the international recycling of waste plastic and e-waste. J. Mater. Cycles Waste Manag. 2021, 23, 77–83. [Google Scholar] [CrossRef]
  5. McGillicuddy, D.J.; Kosnyrev, V.K.; Ryan, J.P.; Yoder, J.A. Covariation of mesoscale ocean color and sea-surface temperature patterns in the Sargasso Sea. Deep. Res. Part II Top. Stud. Oceanogr. 2001, 48, 1823–1836. [Google Scholar] [CrossRef]
  6. Coyle, R.; Hardiman, G.; Driscoll, K.O. Microplastics in the marine environment: A review of their sources, distribution processes, uptake and exchange in ecosystems. Case Stud. Chem. Environ. Eng. 2020, 2, 100010. [Google Scholar] [CrossRef]
  7. Andrady, A.L. The plastic in microplastics: A review. Mar. Pollut. Bull. 2017, 119, 12–22. [Google Scholar] [CrossRef]
  8. Thompson, R.C. Lost at sea: Where is all the plastic? Science 2004, 304, 838. [Google Scholar] [CrossRef] [PubMed]
  9. Claessens, M.; De Meester, S.; Van Landuyt, L.; De Clerck, K.; Janssen, C.R. Occurrence and distribution of microplastics in marine sediments along the Belgian coast. Mar. Pollut. Bull. 2011, 62, 2199–2204. [Google Scholar] [CrossRef] [PubMed]
  10. Oztekin, A.; Bat, L.; Baki, O.G. Beach litter pollution in Sinop Sarikum Lagoon coast of the southern black sea. Turkish J. Fish. Aquat. Sci. 2020, 20, 197–205. [Google Scholar] [CrossRef]
  11. Schmidt, C.; Krauth, T.; Wagner, S. Correction to: Export of plastic debris by rivers into the sea (Environmental Science and Technology (2017) 51: 21 (12246-12253) doi:10.1021/acs.est.7b02368). Environ. Sci. Technol. 2018, 52, 927. [Google Scholar] [CrossRef] [Green Version]
  12. Borrelle, S.B.; Rochman, C.M.; Liboiron, M.; Bond, A.L.; Lusher, A.; Bradshaw, H.; Provencher, J.F. Why we need an international agreement on marine plastic pollution. Proc. Natl. Acad. Sci. USA 2017, 114, 9994–9997. [Google Scholar] [CrossRef] [PubMed] [Green Version]
  13. Sheate, W.R. Purposes, paradigms and pressure groups: Accountability and sustainability in EU environmental assessment, 1985–2010. Environ. Impact Assess. Rev. 2012, 33, 91–102. [Google Scholar] [CrossRef]
  14. Clunies-Ross, P.J.; Smith, G.P.S.; Gordon, K.C.; Gaw, S. Synthetic shorelines in New Zealand? Quantification and characterisation of microplastic pollution on Canterbury’s coastlines. N. Z. J. Mar. Freshw. Res. 2016, 50, 317–325. [Google Scholar] [CrossRef]
  15. Beaumont, N.J.; Aanesen, M.; Austen, M.C.; Börger, T.; Clark, J.R.; Cole, M.; Hooper, T.; Lindeque, P.K.; Pascoe, C.; Wyles, K.J. Global ecological, social and economic impacts of marine plastic. Mar. Pollut. Bull. 2019, 142, 189–195. [Google Scholar] [CrossRef] [PubMed]
  16. Ciacci, L.; Passarini, F.; Vassura, I. The European PVC cycle: In-use stock and flows. Resour. Conserv. Recycl. 2017, 123, 108–116. [Google Scholar] [CrossRef]
  17. Liang, Y.; Tan, Q.; Song, Q.; Li, J. An analysis of the plastic waste trade and management in Asia. Waste Manag. 2021, 119, 242–253. [Google Scholar] [CrossRef]
  18. Brooks, A.L.; Wang, S.; Jambeck, J.R. The chinese import ban and its impact on global plastic waste trade. Mar. Pol. 2018, 72, 219–230. [Google Scholar] [CrossRef] [Green Version]
  19. Wang, C.; Zhao, L.; Lim, M.K.; Chen, W.Q.; Sutherland, J.W. Structure of the global plastic waste trade network and the impact of China’s import Ban. Resour. Conserv. Recycl. 2020, 153, 104591. [Google Scholar] [CrossRef]
  20. Cheng, Y. The related trade and economic impact of China’s waste plastic import ban. J. Hubei Uni. Eco. 2020, 17, 31–34. (In Chinese) [Google Scholar]
  21. Hao, Z. The status quo and treatment of foreign garbage. Ecolog. Eco. 2017, 33, 10–13. (In Chinese) [Google Scholar]
  22. Vanapalli, K.R.; Sharma, H.B.; Ranjan, V.P.; Samal, B.; Bhattacharya, J.; Dubey, B.K.; Goel, S. Challenges and strategies for effective plastic waste management during and post COVID-19 pandemic. Sci. Total Environ. 2021, 750, 141514. [Google Scholar] [CrossRef]
  23. Jefferson, M. WHITHER PLASTICS?—Petrochemicals, plastics and sustainability in a garbage-riddled world. Energy Res. Soc. Sci. 2019, 56, 101229. [Google Scholar] [CrossRef]
  24. Zhao, X.; You, F. Waste High-Density Polyethylene Recycling Process Systems for Mitigating Plastic Pollution through a Sustainable Design and Synthesis Paradigm. AIChE J. 2020, 7. [Google Scholar] [CrossRef]
  25. De Assunção, R.M.N.; Royer, B.; Oliveira, J.S.; Filho, G.R.; De Castro Motta, L.A. Synthesis, characterization, and application of the sodium poly (styrenesulfonate) produced from waste polystyrene cups as an admixture in concrete. J. Appl. Polym. Sci. 2005, 96, 1534–1538. [Google Scholar] [CrossRef]
  26. Jenna, R.J.; Roland, G.; Chris, W.; Theodore, R.S.; Miriam, P.; Anthony, A.; Ramani, N. Law Kara Lavender Plastic waste inputs from land into the ocean. Science 2015, 347, 768–770. [Google Scholar]
  27. PlasticsEurope. Available online: https://www.plasticseurope.org/en/resources/publications/4312-plastics-facts-2020 (accessed on 13 March 2021).
  28. Wen, Z.; Xie, Y.; Chen, M.; Christian, D.D. China’s plastic import ban increases prospects of environmental impact mitigation of plastic waste trade flow worldwide. Nat. Commun. 2021, 12, 425. [Google Scholar] [CrossRef] [PubMed]
  29. Ri, L. Marine plastic waste treatment in Southeast Asia and China’s participation. Stu. Inter. Rel. 2020, 1, 125–142. (In Chinese) [Google Scholar]
  30. Gross, T.; Blasius, B. Adaptive coevolutionary networks: A review. J. R. Soc. Interface 2008, 5, 259–271. [Google Scholar] [CrossRef] [PubMed] [Green Version]
  31. Sun, K. Complex networks theory: A new method of research in power grid. Proc. IEEE Power Eng. Soc. Transm. Distrib. Conf. 2005, 2005, 1–6. [Google Scholar] [CrossRef]
  32. Fagiolo, G.; Reyes, J.; Schiavo, S. The evolution of the world trade web: A weighted-network analysis. J. Evol. Econ. 2010, 20, 479–514. [Google Scholar] [CrossRef]
  33. OECD. Improving Plastics Management: Trends, Policy Responses, and the Role of International Co-Operation and Trade, OECD Environment Policy Papers; No. 12; OECD Publishing: Paris, France, 2018; Available online: https://www.oecd-ilibrary.org/environment/improving-plastics-management_c5f7c448-en (accessed on 23 March 2021). [CrossRef]
  34. Jambeck, J.; Hardesty, B.D.; Brooks, A.L.; Friend, T.; Teleki, K.; Fabres, J.; Beaudoin, Y.; Bamba, A.; Francis, J.; Ribbink, A.J.; et al. Challenges and emerging solutions to the land-based plastic waste issue in Africa. Mar. Policy 2018, 96, 256–263. [Google Scholar] [CrossRef]
Figure 1. Global plastic waste import and export trade volume from 1990 to 2019.
Sustainability 13 03662 g001
Figure 2. Prices of virgin plastic and plastic waste per unit from 1990 to 2019.
Sustainability 13 03662 g002
Figure 3. Global import volume of various types of plastic waste from 1990 to 2019.
Sustainability 13 03662 g003
Figure 4. Top 10 countries in plastic waste import volume from 1990 to 2017.
Sustainability 13 03662 g004
Figure 5. Import volume of plastic waste in major plastic waste trading countries.
Sustainability 13 03662 g005
Figure 6. Distribution map of countries where plastic waste trade accounts for 80% of the world.
Sustainability 13 03662 g006
Figure 7. Topological diagram of plastic waste trade network. (a) 1990 network diagram. (b) 1995 network diagram. (c) 2000 network diagram. (d) 2005 network diagram.
Sustainability 13 03662 g007
Figure 8. Topological diagram of plastic waste trade network. (a) 2010 network diagram. (b) 2015 network diagram. (c) 2018 network diagram. (d) 2019 network diagram.
Sustainability 13 03662 g008
Figure 9. The global plastic waste trade network. (a) from 2000 to 2017. (b) from 2018 to 2019. Purple nodes: Import is greater than export; Green node: Export is greater than import. Purple nodes and green nodes represent net importers and net exporters of plastic waste trade respectively.
Sustainability 13 03662 g009
Table 1. The world’s top 10 exports of plastic waste (10,000 tons) from 2015 to 2019.
20152016201720182019
CountryExportCountryExportCountryExportCountryExportCountryExport
Hong Kong238.44Hong Kong212.60Hong Kong128.56Japan61.69Japan55.27
U.S.A.108.31U.S.A.205.61U.S.A.107.31U.S.A.51.41Hong Kong17.51
Japan94.65Japan88.53Japan84.24Germany39.12Canada8.35
Germany41.91Germany46.85Germany41.87Mexico23.38Poland6.41
Mexico35.63Mexico31.88Mexico27.91Hong Kong22.57Czech Republic6.17
Netherlands32.51Netherlands29.04Vietnam27.87France19.89Greece3.82
Thailand23.29Vietnam24.98Thailand25.83Thailand18.63Denmark2.42
Spain22.98France24.71Netherlands22.12Netherlands18.49El Salvador1.02
UK20.78Spain22.42Spain19.41Italy16.83Macedonia0.49
France20.73Indonesia18.11Italy19.19Belgium16.67Senegal0.37
Table 2. Top 10 countries (regions) of global plastic waste import volume (10,000 tons) from 2015 to 2019.
20152016201720182019
CountryImportCountryImportCountryImportCountryImportCountryImport
Hong Kong843.70Hong Kong839.66China585.86Malaysia87.25Hong Kong60.66
China738.46China737.72Hong Kong367.99Hong Kong59.80Canada16.65
U.S.A.245.84Germany180.02Germany173.51Netherlands55.54Poland14.46
Germany192.24Japan152.93Japan143.43Thailand55.27Denmark9.12
Japan160.84Netherlands106.78Netherlands100.64Germany46.80Czech Republic4.81
Netherlands109.61UK93.51Belgium74.22U.S.A.44.23Greece3.64
UK87.88Belgium77.90Malaysia71.56Turkey43.69Japan1.86
Belgium69.04France60.69UK65.73Indonesia32.05Switzerland1.09
France58.64U.S.A.45.67U.S.A47.32Belgium21.31El Salvador0.74
Canada24.99Austria15.69Turkey26.19Austria19.89Azerbaijan0.70
Table 3. List of countries.
RegionCountry
North AmericaMexico, USA, Canada
EuropeUK, Italy, Spain, Turkey, Slovenia, Slovakia, Switzerland, Sweden, Portugal, Norway, Czech Republic, Netherlands, France, Germany, Denmark, Poland, Belgium, Austria, Ireland
AsiaChina, Vietnam, Indonesia, Singapore, Thailand, Japan, Malaysia, South Korea, Philippines, India, Saudi Arabia, United Arab Emirates, Iraq, Pakistan, Bangladesh, Yemen
OceaniaNew Zealand, Australia
Table 4. Plastic Waste Trade Network Degree Centrality from 1990 to 2019.
Country19901995200020052010201520182019
China10.2648.7276.9297.44100.00 100.00 97.44 71.80
Germany0.0069.2387.1892.3192.31 94.87 92.31 89.74
India38.4646.1558.9784.6294.87 89.74 92.31 92.31
Italy17.9561.5474.3689.7489.74 89.74 92.31 87.18
Japan23.0835.9053.8558.9764.10 87.18 87.18 84.62
Korea35.9023.0864.1069.2379.49 89.74 89.74 92.31
Singapore56.4130.7753.8566.6769.23 71.80 71.80 71.80
Spain35.9028.2158.9774.3684.62 87.18 92.31 87.18
Sweden12.8225.6443.5961.5476.92 79.49 89.74 79.49
UK30.7756.4182.0592.3189.74 92.31 94.87 89.74
USA30.7774.3689.7494.8792.31 94.87 94.87 94.87
(Source: Excerpt from Table A1 in Appendix A).
Table 5. Plastic Waste Trade Network closeness centrality from 1990 to 2019.
Country19901995200020052010201520182019
Belgium0044.8386.6795.1288.6490.7090.70
China11.2418.4045.3597.50100.00100.0097.5078.00
Germany0.0019.2147.5692.8692.8695.1292.8690.70
India11.8218.3141.9484.7895.1290.7092.8692.86
Italy11.5418.9344.8390.7090.7090.7092.8688.64
Japan11.3418.0641.0569.6473.5988.6488.6486.67
Malaysia11.7817.9741.4979.5982.9881.2581.2569.64
Spain11.6417.6541.9478.0086.6788.6492.8688.64
UK11.7518.7546.4392.8690.7092.8695.1290.70
USA11.7119.4048.1595.1292.8695.1295.1295.12
(Source: Excerpt from Table A2 in Appendix A).
Table 6. Betweenness Centrality of Plastic Waste Trade Network from 1990 to 2019.
Country19901995200020052010201520182019
Belgium0.000.002.271.952.250.710.621.34
China0.194.994.674.374.924.235.100.42
Germany0.009.025.242.851.581.490.801.34
India4.836.002.242.702.252.172.216.13
Italy0.717.354.263.453.440.880.801.03
Korea2.600.331.891.021.061.152.868.80
Malaysia1.730.621.401.851.020.650.390.20
Turkey0.120.000.030.191.722.002.011.03
UK4.283.774.492.871.352.002.561.66
USA2.7810.106.353.251.671.492.404.40
(Source: Extracted from Table A3 in Appendix A).
Table 7. The overall density of the plastic waste trade network from 1990 to 2019.
Year19901995200020052010
Overall network density0.09170.21090.38400.50710.5891
Year20152016201720182019
Overall network density0.61770.61260.6263 0.54320.4645
Publisher’s Note: MDPI stays neutral with regard to jurisdictional claims in published maps and institutional affiliations.

