Article

Sustainability Indicators for Foods Benefiting Climate and Health

1
Department of Internal Medicine and Clinical Nutrition, the Sahlgrenska Academy, University of Gothenburg, 405 30 Gothenburg, Sweden
2
Department of Agriculture and Food, RISE Research Institutes of Sweden, 223 70 Lund, Sweden
3
Department of Agriculture and Food, RISE Research Institutes of Sweden, 402 29 Gothenburg, Sweden
4
Sustainable Health, Department of Public Health and Clinical Medicine, Umeå University, 901 87 Umeå, Sweden
*
Author to whom correspondence should be addressed.
Sustainability 2021, 13(7), 3621; https://doi.org/10.3390/su13073621
Submission received: 1 February 2021 / Revised: 16 March 2021 / Accepted: 21 March 2021 / Published: 24 March 2021

Abstract

:
New methods for combined evaluation of nutritional and environmental aspects of food products are needed to enable a transformation of dietary guidelines integrating both health and environmental perspectives. We evaluated two sustainability aspects; nutrition and climate impact, of foods commonly consumed in Sweden and the implications of using parallel or integrated assessments of these two aspects, also discussing the usability and suitability of these food sustainability indicators in relation to Swedish dietary guidelines, industry food product development, and consumer communication. There were large differences in both nutrient density and climate impact among the different foods. The parallel assessment easily visualized synergies and trade-offs between these two sustainability aspects for the different foods. Coherence with dietary guidelines was good, and suitability and usability deemed satisfying. The integrated indicator showed better coherence with dietary guidelines than indicators based solely on nutrient density or climate impact; however, the difficulty to interpret the score limits its usability in product development and consumer communication. With both methods, advantageous as well as less advantageous plant-based and animal-based food alternatives were suggested. The two alternative methods evaluated could serve as useful tools to drive individual and societal development towards more sustainable food production and consumption.

1. Introduction

Transformation of food production and changes in food consumption are central for reducing environmental impacts [1,2,3,4] as well as for improving human health [5,6,7,8]. Food production emits approximately 20–30% of total greenhouse gas emissions (GHGE) globally [9] and substantially contributes to other environmental impacts such as biodiversity loss, freshwater use, and land use change [6]. A suboptimal diet is a strong, but preventable, risk factor for non-communicable disease morbidity and mortality [7], underscoring the need for improving diets globally. Identifying dietary patterns benefiting both health and environment is therefore crucial.
Sustainable eating is closely linked to several UN sustainability goals and is a prerequisite for realizing the goals of good health and well-being, responsible production and consumption, and climate action. By its multidisciplinary effects on society, ecology, and economy, transition towards more sustainable diets affects sustainability both at the local and international level. In 2019, the Food and Agriculture Organization of the UN (FAO) and the World Health Organization (WHO) published guiding principles and requested of governments and other policy-making actors to update their national dietary guidelines to integrate a wide sustainability perspective including both health and environmental aspects [10]. To support such dietary guidelines, new tools and methods for combined evaluations of health and environmental impacts of food products are needed. Life cycle assessment (LCA) is an important tool for evaluating environmental impacts arising from the food sector [11], but traditionally does not capture nutritional or health aspects. However, recent literature has examined the possibility of including nutritional quality in LCA [12,13,14,15], complementing the customarily used functional unit based on mass. Two methods for a combined evaluation of environmental and nutritional performance of food products have been proposed; a two-axis plot with the nutritional quality score on one axis and environmental impact on the other; and a single integrated score [13]. Still, the suitability and usability of the two proposed methods must be evaluated. A recent study examined the nutrient density and climate impact of seafood using the two proposed methods [16]; however, such indicator assessments are still lacking for most other food groups.
The current study was part of a larger research project evaluating methods for including nutrition and health indicators in food LCA. Within the larger project, methods for assessing nutrient density and the impact of key methodological choices were evaluated on a food product level by their coherence with dietary guidelines [17], and validated in relation to the impact of self-selected reported diets on total mortality in a Swedish population-based prospective cohort study [18]. In this study, the nutrient density index proposed to best reflect existing dietary guidelines and associated health effects was combined with climate impact data. The aims of the current study were:
(i)
To evaluate nutrient density and climate impact of 118 foods commonly consumed in Sweden.
(ii)
To study implications of using parallel or integrated assessments when evaluating nutrient density and climate impact.
(iii)
To study implications of different reference units for calculating nutrient density and different functional units for calculating climate impact in these assessments.
(iv)
To discuss the usability and suitability of the parallel and integrated assessments in relation to the Swedish dietary guidelines and as tools in industry food product development and communication towards consumers.

2. Materials and Methods

2.1. Selection of Food Products and Nutritional Information

For the selection of food products to include we aimed to cover commonly consumed foods in Swedish diets, well represented by food products included in a validated food frequency questionnaire frequently used in published studies in Sweden [19]. Included food products were further expanded with the addition of several products that more recently have entered the Swedish food market (e.g., plant-based dairy options and plant-based meat substitutes), resulting in 118 individual food products (e.g., herring) from 14 different food groups (e.g., fish and seafood). The 118 food products were divided into 53 subgroups (e.g., pelagic fish) based on their nutritional and/or climate impact properties; see Supplementary Table S1 for categorization. All the nutrient content information of the food products for the main analyses were procured from the national food composition database (version 20171215) at the Swedish National Food Agency (SFA) [20]. The only exceptions were data on added sugar, which were based on unpublished information provided by the SFA [21]. A sensitivity analysis was performed to test the robustness of the nutrient density assessment and the effect of variations in nutrient composition data. For this, nutritional data from version 20200116 of the national food composition database [22], updated nutrient content information on enriched oat drink from unpublished information provided by the SFA, as well as updated nutrient content information on walnuts [23] were used to calculate nutrient density. This sensitivity analysis showed no or minor differences in the results; hence, results from these analyses are not further discussed. The portion sizes were mainly obtained from the Swedish national food composition database [20]. If data on portion size was missing for a specific food product, it was replaced with either (i) the portion size for a similar food, (ii) a portion size from the food and nutrition database of the U.S. Department of Agriculture [24], or (iii) the suggested portion size from its manufacturer.

2.2. Estimation of Nutrient Density of Food Products

Details about suitable indices for scoring the nutrient density of food products and individual diets have been described elsewhere [17]. In brief, in the larger research project of which the current study is a part of, the nutrient density of the included food products was calculated using different variants of the Nutrient Rich Foods (NRF) index [25], varying in number and selected nutrients included (nine, 11, or 21 nutrients to encourage and three nutrients to limit), choice of reference units (100 g, 100 kcal or portion size), and usage of capping and/or weighting. The methods were evaluated on a food group level based on the coherence with dietary guidelines [17,26], and on diet-level against total mortality in a large Swedish population-based prospective study [18]. NRF11.3, the index which harmonized the most with the dietary guidelines, and which most successfully predicted a decreased risk of total mortality when diet was evaluated, was used in the current study. NRF11.3 represents a version of the index which is adapted to the nutritional status of the Swedish population by including two nutrients at risk of low intake (vitamin D and folate) [27] in addition to the nine qualitative nutrients and three disqualitative nutrients included in the original index NRF9.3. NRF9.3 has been suggested to serve as a benchmark index for future algorithm development, since it explained the highest percentage of variation from the Healthy Eating Index in a validation study [25]. The two variants of NRF11.3 best reflecting existing dietary guidelines when food products were examined (NRF11.3 per 100 kcal with weighting and NRF11.3 per portion size) [17] were evaluated in the current study. Results for the former are presented below and results for the latter are shown in the Supplementary Materials. NRF11.3 assigns a nutrient density score based on 11 nutrients (protein, dietary fiber, iron, folate, vitamins A, C, D, E, magnesium, calcium, potassium) to be encouraged (qualitative nutrients) and three nutrients (saturated fat, added sugar, sodium) to be limited (disqualitative nutrients). The score for NRF11.3 was calculated by the following equation, originally developed by Fulgoni et al. [25] and further adapted by Bianchi et al. [17]:
NRF 11.3   = 1 11   ( Qualitative   nutrient DRI ) 1 3   ( Disqualitative   nutrient MRI )
A mean of sex and age specific dietary reference intakes (DRIs) and maximum recommended intakes (MRIs) were taken from the Nordic Nutrition Recommendations (NNR) 2012 [5]. When specific recommendations for fertile women existed (iron, folate), these were used. Weighting was used to strengthen the impact of qualitative nutrients where the population mean intakes were below DRI values and lessen it where the mean intakes were above DRI [13], based on the most recent national food survey in Sweden from 2010–2011 [27]. Weighting factors were used in the above formula to correct the relative weight of individual nutrients to the overall index. The weighting factors for the qualitative nutrients were calculated by dividing DRI of the nutrient by the mean intake of the nutrient. Disqualitative nutrients where the population mean intakes were below MRI (i.e., added sugar) were not weighted; however, nutrients where the mean intakes were above MRI (i.e., saturated fat and sodium) were weighted by dividing the mean intake by the MRI of the nutrient, strengthening the impact of those nutrients. Nutrients included in NRF11.3, with DRIs, MRIs, and weighting factors for the nutrients are presented in Table 1.

2.3. Estimation of Climate Impact of Food Products

GHGE for all food products were estimated using data based on LCA from RISE Food Climate Database [28,29]. Climate impact is expressed as kg carbon dioxide equivalents (CO2e) per kg food product, including GHGE from primary production and up to the raw food products possible processing in industry, excluding packaging and emissions from land use change. A climate contribution for a generally assumed transport to Sweden was included for imported food products. Climate impact data are expressed per edible weight (e.g., excluding shell and bones). For foods consumed in prepared form (e.g., fish, rice, lentils), the functional unit refers to the cooked weight. The climate data in RISE Food Climate Database aims to be representative of Swedish consumption [30] and reflects the dominating production methods used to produce food on the Swedish market. For the current analyses, the GHGE for meat and dairy products were based on LCA data from Swedish production, which are lower in general compared to the average impact of production systems globally [31].

2.4. Analytical Approach and Assessments of Coherence with Dietary Guidelines

Two different methods were used for the combined evaluation of nutrient density and climate impact of foods: a parallel assessment of the two aspects illustrated in a two-axis graph, and an integrated score of climate impact and nutrient density.
For the parallel assessment using a two-axis graph, the nutrient density and climate impact of the included food subgroups were evaluated in relation to the median performance of all food subgroups and expressed as a percent of the median. With the relative nutrient density on one axis and relative climate impact on the other, the food subgroups were separated into foods with higher/lower nutrient density and higher/lower climate impact, creating four groupings separated by the median, illustrating synergies and trade-offs between these two qualities of the food subgroups. For the main analysis, climate impact was expressed by the functional unit kg of food; however, a complementary analysis using the functional unit kcal of food also was performed.
For the integrated score, the ratio of climate impact to nutrient density was calculated by dividing kg CO2e per kg food product by NRF11.3 per reference unit of food product. Some of the food products had a negative NRF11.3 score and before calculating the integrated score, the negative nutrient density scores were capped at the lowest positive score in the sample (e.g., all food products with negative scores when calculated by NRF11.3 per 100 kcal with weighting were capped at the score 0.018, representing biscuits). The integrated score ranked the subgroups according to climate impact relative to nutrient density and indicated which food subgroups that provide the highest nutritional value at the lowest climate impact and vice versa.
As mentioned above, for both parallel assessment and integrated indicator assessment, the main analyses expressed nutrient density per reference unit 100 kcal and with weighting. Complementary analyses performed by using the reference unit portion size are shown in Supplementary Materials.
Additionally, assessment of coherence of the results from the two methods with the Swedish food based dietary guidelines [26] were performed, based on the method developed by the research group [17]. The assessment was based on foods with the best and worst performance, i.e., found in the quadrants of higher nutrient density and lower climate impact (best performing) and lower nutrient density and higher climate impact (worst performing) in the two axis graph, and Q1 (best performing) and Q5 (worst performing) ranked based on nutrient density, climate impact, or the integrated climate-nutrient score. Here, the proportion of food subgroups that, by the Swedish dietary guidelines, would be labelled “green” (increase consumption of), “yellow” (healthier options that unhealthier ones should be exchanged to) and “red” (limit) were inspected (see Supplementary Table S1).

2.5. Evaluation of Usability and Suitability of Combined Nutritional and Climate Indicators with Potential Users

The usability of the two methods employed to evaluate the combined nutritional and climate impact performance of food products, as tools in product development and communication towards the public, were evaluated with the help of industry partners participating in the larger research project. The companies were invited to test the two methods on their own food product portfolio and have internal discussions with their communication departments regarding usability and possibilities and limitations of the methods. For these internal discussions, the companies were provided with examples of how the methods could be used in practice (Figure 1a,b).

2.6. Statistics

The results are presented using solely descriptive statistics since the relative categorization and ranking of the food products were considered more of interest in respect to the aims of the study than the absolute scores of nutrient density, climate impact, and the climate-nutrient indicator. The main analyses are set at subgroup level. Since the subgroup sizes are small (one to six food products per food subgroup) and the data skewed, the median values of the included subgroup food products were used in the analyses. Due to the high number of comparisons, these have not been evaluated for statistical significance but rather the patterns of results are emphasized. Microsoft Excel 2016 was used for all analyses.

3. Results

There were large differences in both nutrient density (score range −0.41 to 5.37 for NRF11.3 per 100 kcal with weighting) and climate impact (range 0.1 to 48 kg CO2e per kg) among the different food subgroups.

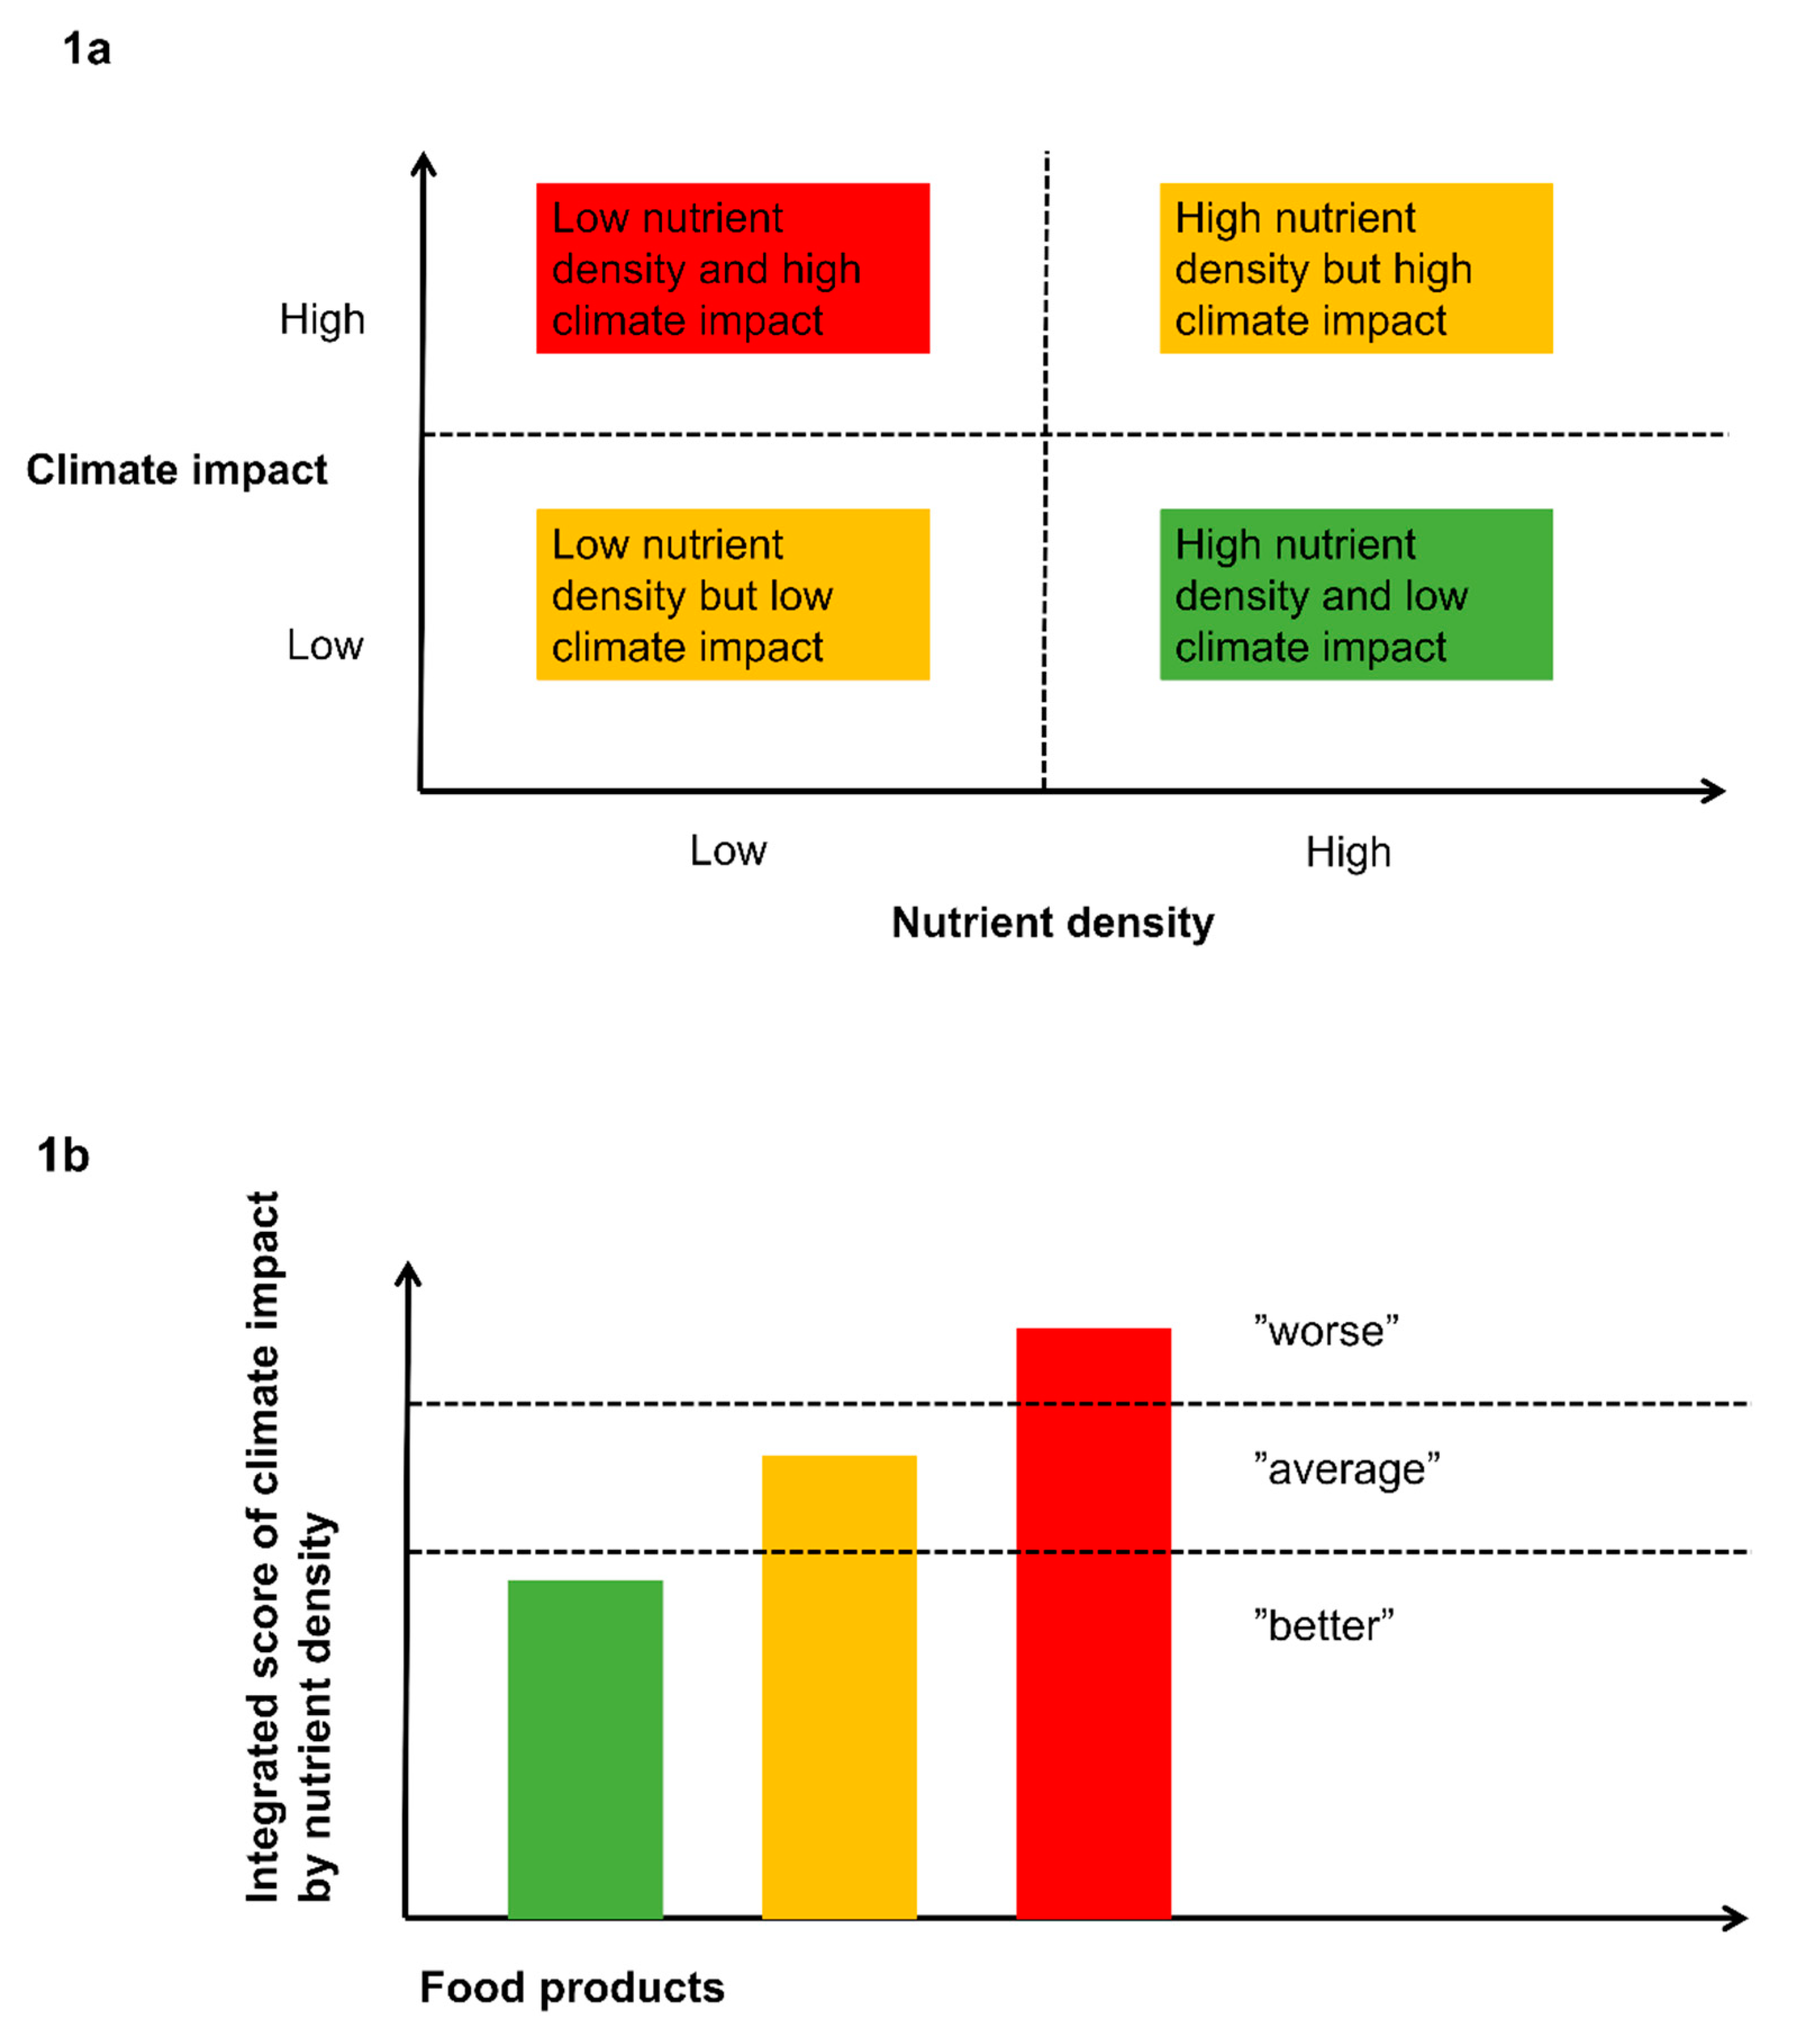
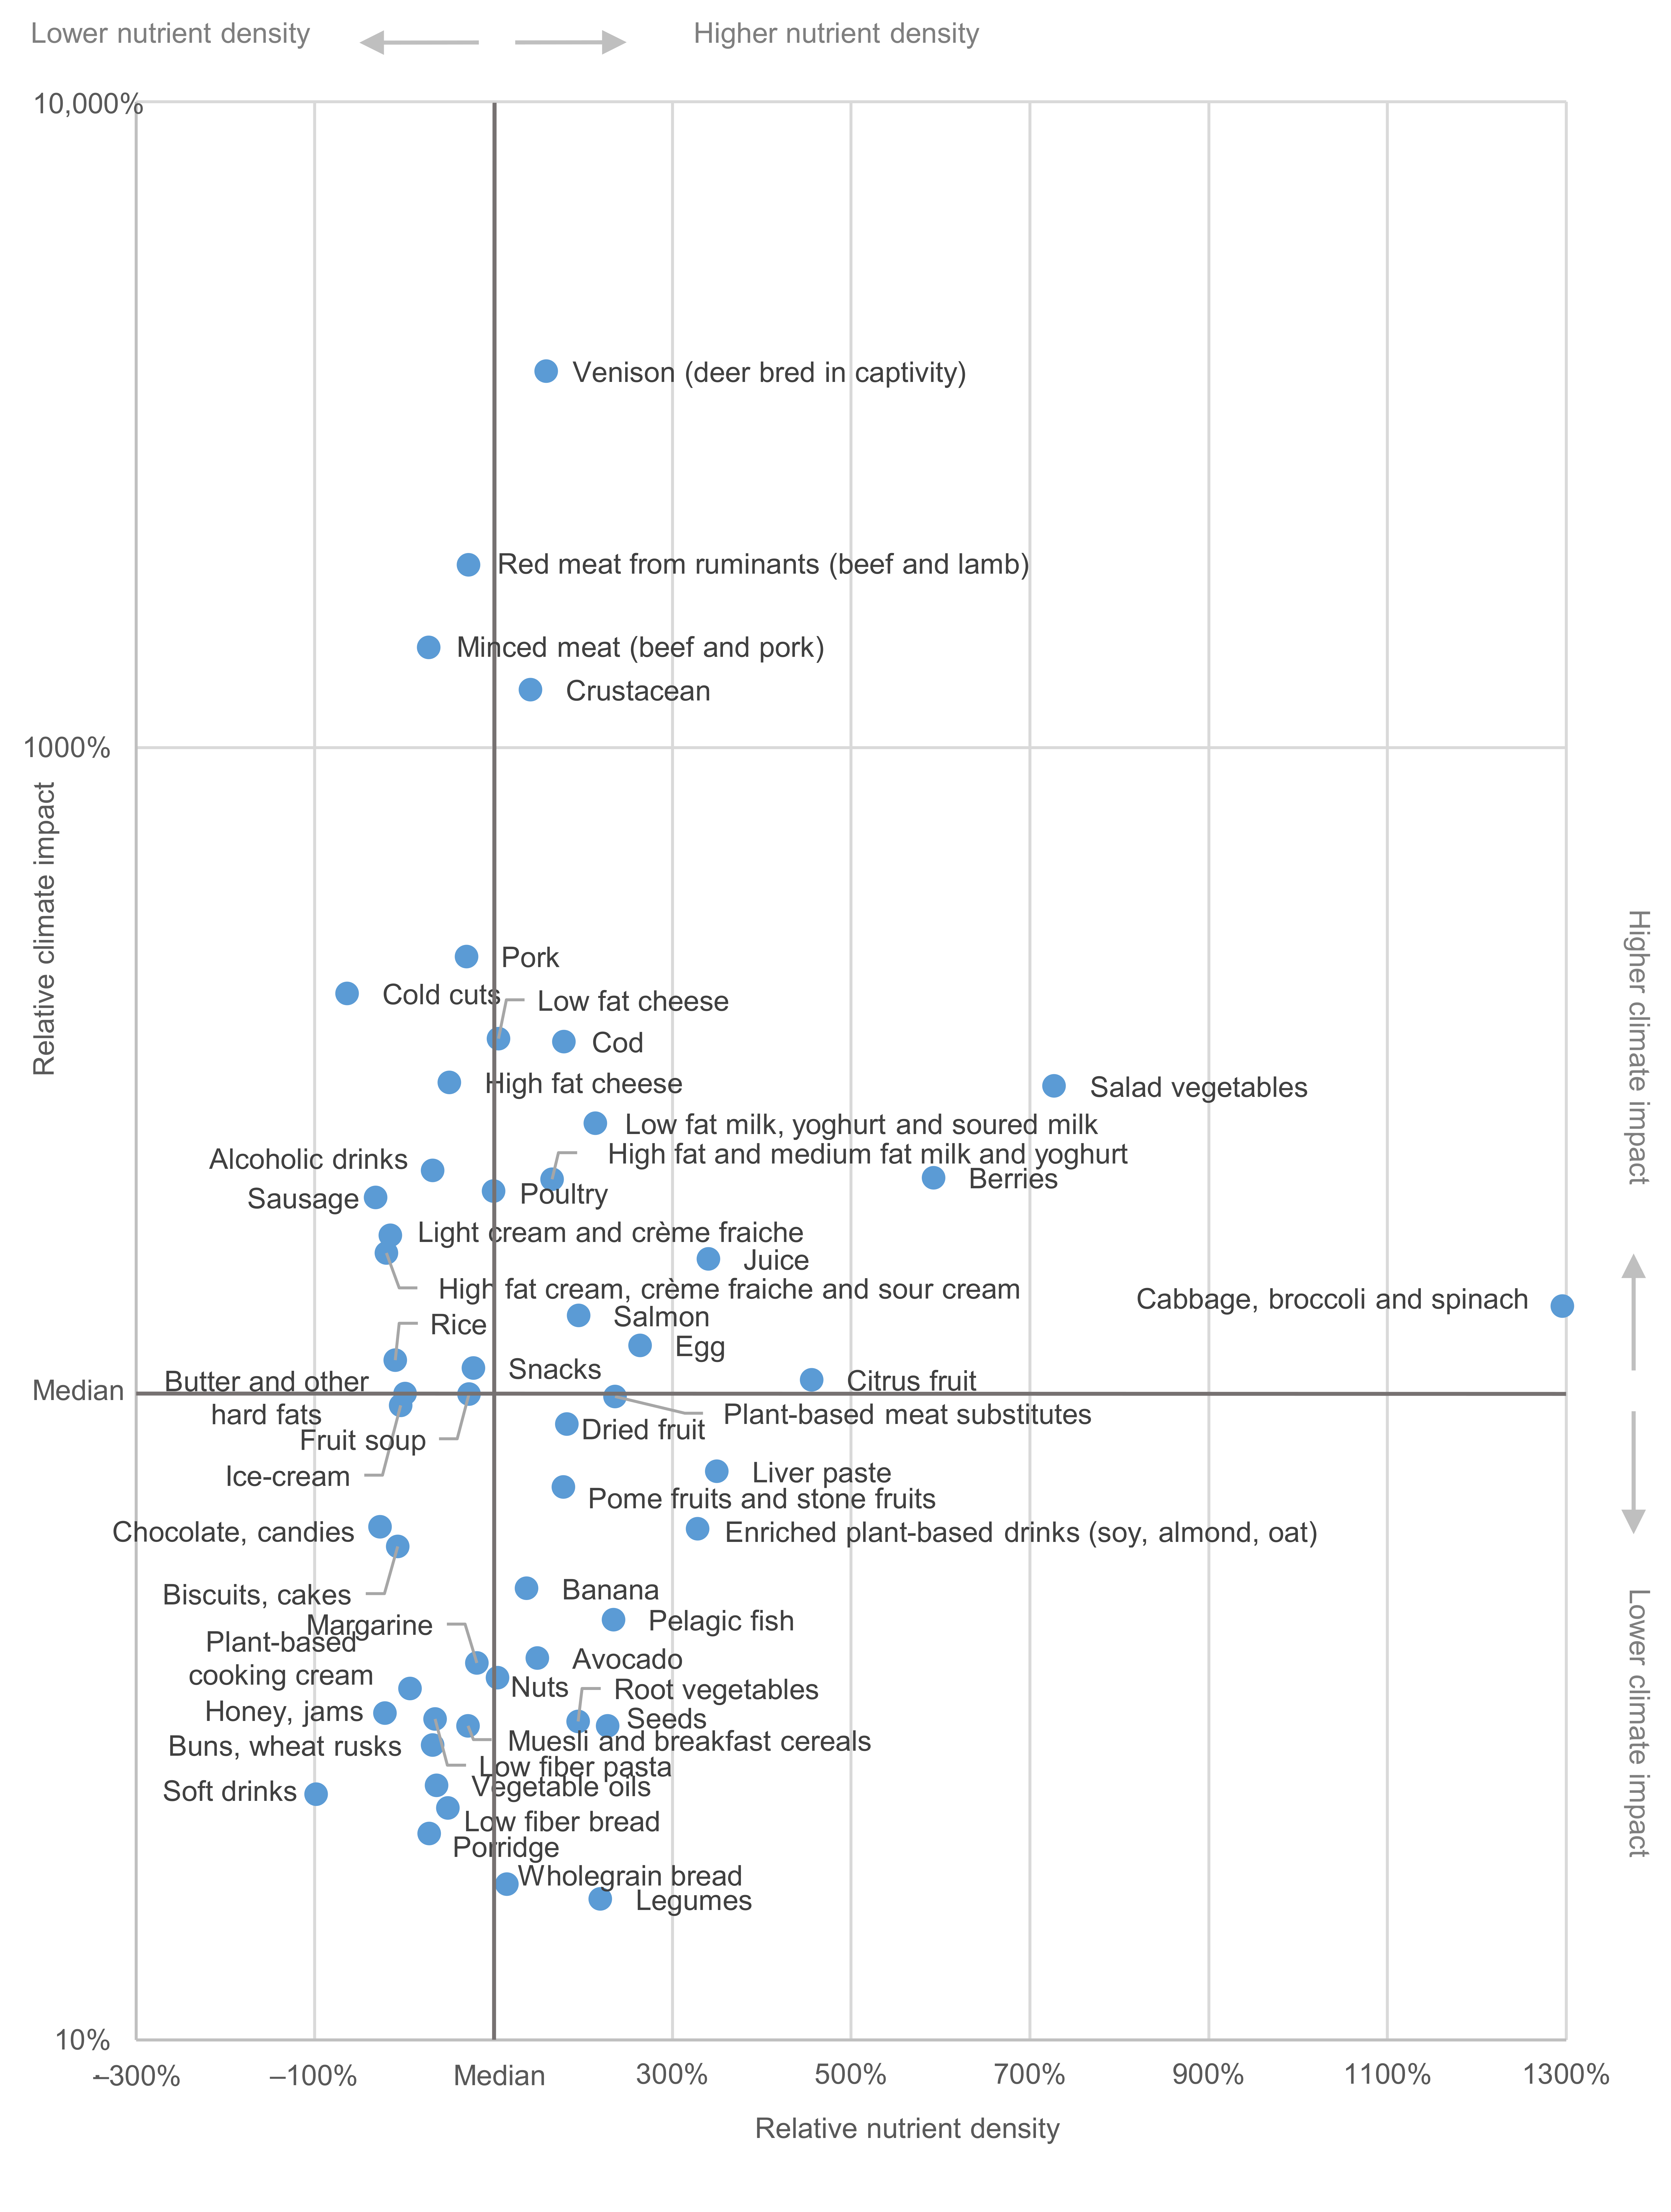
3.1. Parallel Assessment: Synergies and Trade-Offs between Nutrient Density and Climate Impact Visualized

Using the two-axis graph, food subgroups with positive synergies between nutrition and climate performance, i.e., nutrient density above median (score > 0.41) and climate impact below median (<1.2 kg CO2e per kg) of included food subgroups, could easily be visualized. These were primarily plant-based foods, including vegetables, berries, fruit and legumes, and drinks, including juice, enriched plant-based drinks (based on oat, soy, and almond), milk, and yoghurt (see Figure 2). Pelagic fish and wholegrain bread were also found to be food subgroups benefiting both perspectives. Of the food subgroups categorized in this quadrant, only juice is considered a food whose consumption should be limited. Thus, this method for evaluating nutrition and climate qualities of foods exhibited a high level of coherence with the dietary guidelines.
Likewise, food subgroups with negative synergies between nutrition and climate performance (i.e., nutrient density below median and climate impact above median of included food subgroups) could easily be identified. These were mostly animal-based foods, and products with high fat and/or sugar content, e.g., red meat from ruminants (beef and lamb) and pork, minced meat (beef and pork), processed meat (sausage and cold cuts), cheese, and other high-fat dairy products, vegetable oils, snacks, sweets, and pastries (see Figure 2). The selection of foods represented in this quadrant also showed a high level of coherence with the dietary guidelines (i.e., including only foods that should be limited), with the exception of vegetable oil that is considered a healthier alternative to solid fat in the dietary guidelines.
Trade-offs between nutritional and climate performance were identified for some food products. Refined cereal products, alcoholic drinks, rice, and food products largely made of sugars (soft drinks, honey, jams) were found to have relatively low climate impact per kg but also low nutrient density. Foods with relatively higher nutrient density but also higher climate impact included animal-based foods such as liver paste, eggs, crustaceans, some fish species, and venison (deer bred in captivity), as well as seeds, dried fruit, and nuts (see Figure 2).
Only small differences between the categorization of foods in the four groups were found when nutrient density was calculated by the reference unit portion size compared to 100 kcal with weighting; see Supplementary Figure S1.
Some differences in the categorization were found when climate impact was expressed per kcal instead of per kg of food subgroup; see Figure 3. For the food subgroups categorized as having high nutrient density, those with low-energy content, such as vegetables growing above ground, berries and citrus fruit, as well as drinks, e.g., juice and milk, were categorized as having a high instead of a low climate impact when calculated per kcal instead of per kg. Food subgroups with high-energy content, such as dried fruit, seeds, nuts, and liver paste were categorized as having a low instead of high climate impact when calculated per kcal instead of per kg. For the food subgroups categorized as having low nutrient density, the change of functional unit resulted in only few subgroups changing categorizations from lower to higher climate impact (rice and alcoholic drinks). More food subgroups changed categorization from higher to lower climate impact, including high-fat food products, such as vegetable oils and margarine, and high-fat sugar-sweetened products, such as sweets, pastries, and ice cream. The level of coherence with the dietary guidelines of all quadrants remained similar regardless of functional unit for climate impact.

3.2. Integrated Assessment of Nutrient Density and Climate Impact

The ranking of food subgroups when based solely on nutrient density or climate impact, or when based on the integrated score of both nutrient density and climate impact, differed widely (see Table 2). Q1 represents the food subgroups with the highest nutrient density, lowest climate impact, and lowest climate impact per nutrient density score, respectively.
When ranked by the integrated climate-nutrient score, only plant-based food groups, such as vegetables, legumes, fruit, berries, wholegrain bread, enriched plant-based drinks, and juice were found in Q1. When ranked solely by nutrient density or solely by climate impact, many plant-based foods reoccurred in Q1. An important difference between rankings was the larger representation of foods with relatively lower nutrient density (soft drinks and plant-based cooking cream) in Q1 when food subgroups were ranked solely on climate impact, compared to the integrated climate-nutrient score. Top performing food subgroups in Q1 included more animal-based foods (e.g., liver paste, egg, and pelagic fish) when ranking was based on solely nutrient density, compared to the integrated climate-nutrient score. Since Q1 based on the integrated climate-nutrient score contained a larger proportion of foods which we should increase our consumption of according to dietary guidelines, and a lower proportion of foods which we should limit our consumption of (e.g., only juice), it corresponded more closely to the dietary guidelines than Q1 based on solely climate impact or nutrient density.
When ranked by the integrated climate-nutrient score, high-fat dairy products, processed meat (sausage and cold cuts), minced meat (beef and pork), red meat from ruminants (beef and lamb), high-fat sweets, and pastries were found in Q5. Differences in outcome among the three rankings were the addition of crustaceans, pork, snacks, and low-fat cheese and the withdrawal of sugar-sweetened foods (ice cream, biscuits, cakes, chocolate, and candies) in Q5 when food subgroups were ranked solely based on climate impact compared to the integrated climate-nutrient score. When the ranking was based on solely nutrient density compared to the integrated climate-nutrient score, an addition of low-fat sugar-sweetened foods and drinks, such as honey, jams, and soft drinks, as well as a withdrawal of red meat from ruminants could be found in Q5. Even though food groups represented in Q5 differed to a certain extent among the three rankings, all three corresponded well with present dietary guidelines in terms of foods we should limit our consumption of.
Only small differences between the results were found when nutrient density was calculated by the reference unit portion size compared to 100 kcal with weighting, see Supplementary Table S2.

3.3. Usability and Suitability of Combined Nutritional and Climate Indicators in Regards to Potential Users

The companies were generally positive towards using both nutritional and climate sustainability indicators as tools for internal product development. To assess nutrient density and climate impact as two separate dimensions in parallel assessment was considered most useful for product development. The integrated score was considered more difficult to interpret and therefore less suitable for product development, as it does not provide information on the impact of the individual parameters and therefore does not indicate where improvements are needed. Presenting climate impact and nutrient density as two separate dimensions was also considered to provide greater clarity and transparency for consumers if used as a tool for consumer communication compared to the integrated score. However, the integrated score was considered to be useful as an alternative method to incorporate nutritional aspects when comparing environmental impacts of foods compared to the method most commonly used, where environmental impact is expressed per weight basis without any consideration to the foods’ nutritional value.
Nevertheless, several hindrances were pointed out. One limitation raised was accessibility of product specific data on nutrient content and climate impact to enable the food industry to carry out combined assessment of climate impact and nutrient density. Since analysis of nutrient content of food products is expensive, most food producers do not have complete nutritional information of their food products, making it difficult to use advanced algorithms that include several nutrients. Another limitation raised was the legislation requirements regarding food labeling and nutritional health claims that need to be considered before nutrient density indexes can be communicated as front-of-pack labeling. Furthermore, the companies found it difficult to interpret the absolute values of nutrient density, climate impact, and the integrated climate-nutrient indicator and the methods were considered better suited to make relative comparisons among food products. However, it was deemed that pronounced thresholds to evaluate the indicators would increase the usefulness of both methods for combined assessment.

4. Discussion

The results indicate that positive synergies between climate impact and nutrient density exist for a wide range of food subgroups that should be encouraged in dietary guidelines for more sustainable diets. Food subgroups with higher climate impact and lower nutrient density, of which restricted consumption, or efforts for improved performance, are needed, were also highlighted. Indicated trade-offs between the nutritional and climate impact performance of foods can provide guidance for prioritizing efforts within product development for increased nutritional quality and initiatives for reduced climate impact from production systems. Results of both methods for a combined assessment of nutritional and climate sustainability showed high coherence with the present dietary guidelines based on public health [26].
Methods and indicators for inter-disciplinary sustainability assessments are in high demand to guide more sustainable dietary choices. Nutrient density scores used in combination with environmental assessments offer a possibility for an indicator capturing both nutritional and environmental aspects. However, the usefulness of nutrient density scores, used separately or in combination with environmental assessment, is today greatly limited by the lack of harmonization and guiding principles for the use of methods. Many different methods for calculating nutrient density of food products exist [13,15,17,25] and choice of index and how it is integrated with environmental assessments can greatly affect the conclusions regarding which foods are more and less sustainable to consume [13,32]. Here, our results demonstrate how two different approaches for performing combined analyses of nutrient density and climate impact, parallel and integrated, and encompassed method choices, e.g., choice of functional unit expressing climate impact of foods, have important implications for food subgroup categorization and ranking.
The parallel assessment using a two-axis graph easily visualized synergies and trade-offs between the two sustainability aspects for different food subgroups. Coherence with dietary guidelines was good, and suitability and usability for industry food product development and consumer communication was deemed satisfying. Still, we found that using kg or kcal as functional unit for the climate impact of the food subgroups affected the categorization into higher/lower climate impact of several food subgroups. The choice of functional unit especially affected the categorization of foods varying in energy and water content. Expressing climate impact per kg was shown to give advantage to foods with lower energy content and often high water content, whereas climate impact per kcal was shown to benefit foods with higher energy content. Since food LCA usually employs the functional unit mass, using kg instead of kcal to express climate impact in combined analyses with nutrient density was considered to simplify the interpretation of the categorization of the food subgroups.
The integrated indicator showed better coherence with dietary guidelines than indicators based solely on nutrient density or solely on climate impact, and it was considered useful as an alternative method to incorporate nutritional aspects when comparing environmental impacts of foods. However, there is a challenge in how to handle negative nutrient density scores, i.e., when the sum of disqualitative nutrients exceeds the sum of qualitative nutrients, when integrating nutrient density and climate impact into one score. This challenge has previously been mentioned [13,14]. Unhandled negative nutrient density scores will complicate the interpretation of the ranking of the food products based on an integrated score; however, there is no consensus on how negative nutrient density values should be handled. For this study, capping was used to handle negative nutrient density scores. A consequence of using this approach is that food subgroups with originally negative nutrient density values score better than if the differences in nutrient density were proportional. How to handle negative nutrient density values when combining them with climate impact in one score therefore needs further investigation.
Furthermore, a risk of the integrated indicator of nutrient density and climate impact is that it might promote foods with high climate impact if these have a sufficiently high nutrient density. Correspondingly, foods with low nutrient density risk being promoted if they have a sufficiently low climate impact. To reach goals for more sustainable diets, consumption of high climate impact foods needs to be limited despite potentially high nutritional values, and for health reasons, consumption of nutrient poor foods should be limited no matter how climate friendly they are. It should also be noted that the comparisons made between foods in this study are relative. To define thresholds for what can be considered as more or less sustainable would increase the usefulness of both methods for combined assessment of nutrient density and climate impact, enabling evaluations of specific foods rather than making relative comparisons between foods. This is a challenge for the future.
Another risk of combined assessments of foods’ environmental impact and nutrient value is the possibility for food companies to improve the sustainability performance of their food products by using enrichment. This applies to the integrated indicator primarily, but also to the parallel assessment. The nutrient density index does not differentiate between products that are nutrient rich naturally or by enrichment, perhaps giving the latter an unfair edge. Although enrichment may be valuable in certain contexts, future index development should focus on addressing how we can distinguish between enriched and unenriched products. These methods should also be able to consider other aspects of the food matrix beyond purely the content of nutrients, so that correct messages can be delivered to both product developers and consumers.
Data quality and availability are central aspects for assessments of nutrient density and climate impact, which may affect their use in product development and consumer communication. Most food producers do not have complete nutrient information for their food products. To use national food composition databases as an alternative to specific analytical data would only provide approximate values since most of the raw materials and formulated products used in the industry are not represented in the food composition databases. Consequently, is it more reasonable to develop a simpler method of assessing nutrient density, using the nutritional information already reported by the food producers? Whether such methods could capture the nutritional value sufficiently well compared to more comprehensive methods proposed [17,25], or if it can be expected and required of food producers to analyze nutrient content more comprehensively, needs to be further evaluated.
Quality of climate data may also vary. LCA data age quickly [33] and GHGE values used often represent the average climate impact of a product group rather than being manufacturer specific values. Differences in production systems can cause major differences in climate impact for the same type of food [34], meaning that the LCA studies used for the combined assessment may affect the sustainability status of a food product. Higher specificity of both nutrient content and climate/environmental impacts of food products is an opportunity for higher precision in future studies, but also requires large resources in quantifying and updating data. In this study, climate impact was used as an environmental indicator due to the relatively high data availability and large climate impact from the food system. However, environmental sustainability includes many other aspects that are important to consider. The methods presented can be applied for additional environmental impact; however, assessments currently possible may be limited by availability of LCA data for specific foods. Other sustainability dimensions, such as equity, animal welfare, and affordability, are also important to capture. Development of methods and tools that can provide a broader picture of food sustainability is a strong future research need.
Several front-of-pack labels of food products regarding nutrition (in addition to the nutrition value declaration) [35] or environmental impact have either been on the market for some time, have recently appeared or are being evaluated for use at the moment. Some examples are the Swedish Keyhole [36], which guides consumers to the food product options with less sugar and salt, more whole grains and fiber, and healthier fats; the French Nutri-Score [37], which converts the nutritional value of products into a code consisting of five letters and colors taking into account the nutrients and ingredients to avoid and to increase consumption of; climate impact declarations [38,39]; and the newly launched Swedish retailer Coop Sustainability Declaration [40], a declaration of the impact on the earth’s resources, climate, and society. All fill a purpose; however, none, to our knowledge, evaluate both nutrition and environmental impact simultaneously. Nevertheless, how to combine sustainability indicators and how they are best presented as front-of-pack labeling needs to be further investigated, also taking into account the challenge of legislation requirements regarding food labeling and nutritional health claims.
Lastly, it is also important to consider that a possible shift in dietary habits, leading to a shift in demand for different foods will have far-reaching consequences for actors in the supply chain as well as societal effects. In Sweden, animal production generates around 55% of total agricultural income [41] and a decrease in, e.g., red meat production may lead to loss of jobs and income to Swedish farmers and the broader rural community. It might also limit the possibilities to maintain the cultural landscape and biodiversity [42]. There would also be effects in other parts of the supply chain and the broader food systems, but probably less severe. A thorough understanding of these ripple effects is needed to implement policies that take a holistic perspective of sustainable food systems.

5. Conclusions

This study evaluated two alternative methods for a combined assessment of the nutritional and climate qualities of foods and several associated methodological choices. Both methods demonstrated a high level of coherence with the dietary guidelines and could serve as useful tools to drive the development towards more sustainable food production and consumption. The results provide a first suggestion regarding foods benefiting both health and climate that could be promoted by sustainable dietary guidelines, as well as foods that could be limited due to high climate impact and low nutrient density. However, the usability and suitability of the methods’ application in product development and consumer communication needs further consideration, and calls for further research.

Supplementary Materials

The following are available online at https://www.mdpi.com/article/10.3390/su13073621/s1, Table S1: Categorization and color-coding of food products and food subgroups according to the Swedish food based dietary guidelines. Table S2: Ranking of 53 food subgroups based on nutrient density calculated by NRF11.3 per portion size, climate impact, and a combined climate impact and nutrient density score. Figure S1: A combined analysis of nutrient density and climate impact of 53 food subgroups.

Author Contributions

Conceptualization, E.H., U.S., and A.W.; data curation, J.S.; formal analysis, A.S. and M.B.; funding acquisition, E.H., U.S. and A.W.; project administration, M.B.; visualization, A.S.; writing—original draft preparation, A.S.; writing—review and editing, E.H., U.S., J.S., A.W., and M.B. All authors have read and agreed to the published version of the manuscript.

Funding

This research was funded by grants from The Swedish Foundation for Agricultural Research (grant no R-18-26-133), and The Swedish Research Council for Environment, Agricultural Sciences and Spatial Planning (Formas, grant no FR-2019/0007). The funders had no role in the design of the study; in the collection, analyses, or interpretation of data; in the writing of the manuscript, or in the decision to publish the results.

Data Availability Statement

Climate impact data described in the manuscript will not be made available to editors due to legal limitations. Nutrient content information of the food products can be procured from the national food composition database (http://www7.slv.se/SokNaringsinnehall, accessed on 19 July 2019) at the Swedish National Food Agency.

Acknowledgments

The authors want to acknowledge Anna Karin Lindroos at the Swedish National Food Agency, for providing unpublished data on added sugar for relevant food products and updated nutrient content information on enriched oat drink. Participants from participating companies Susanne Larson (IKEA), Ulrika Gunnerud (Fazer), Anna-Karin Modin Edman (Arla Foods), Christer Rosén (Kronägg) and Rebecka Persson (Orkla Foods) should be acknowledged as well for their assistance in suggesting more recent food products to analyze, as well as for their part in the discussion of the usability and suitability of the proposed methods.

Conflicts of Interest

The authors declare no conflict of interest. Five companies: IKEA; Orkla Foods; Fazer; Kronägg; and Arla Foods, participated in the research project where the current study is included. The companies assisted with feedback regarding more recent food products to include in the analyses, as well as insights for discussion regarding the usability of the analyzed methods; however, they were not involved in the study design, analysis or interpretation of data.

References

  1. IPCC. Climate Change 2014: Synthesis Report. Contribution of Working Groups I, II and III to the Fifth Assessment Report of the Intergovernmental Panel on Climate Change; Core Writing Team, Pachauri, R.K., Meyer, L.A., Eds.; IPCC: Geneva, Switzerland, 2014; p. 151. [Google Scholar]
  2. Sonesson, U.; Davis, J.; Ziegler, F. Food Production and Emissions of Greenhouse Gases—An Overview of the Climate Impact of Different Product Groups; SIK, The Swedish Institute for Food and Biotechnology: Gothenburg, Sweden, 2009. [Google Scholar]
  3. Springmann, M.; Clark, M.; Mason-D’Croz, D.; Wiebe, K.; Leon Bodirsky, B.; Lassaletta, L.; de Vries, W.; Vermeulen, S.J.; Herrero, M.; Carlson, K.M.; et al. Options for keeping the food system within environmental limits. Nature 2018, 562, 519–525. [Google Scholar] [CrossRef]
  4. Hallström, E.; Carlsson-Kanyama, A.; Börjesson, P. Environmental impact of dietary change: A systematic review. J. Clean. Prod. 2015, 91, 1–11. [Google Scholar] [CrossRef]
  5. Nordic Council of Ministers. Nordic Nutrition Recommendations 2012; Nord: Copenhagen, Denmark, 2014. [Google Scholar]
  6. Willett, W.; Rockström, J.; Loken, B.; Springmann, M.; Lang, T.; Vermeulen, S.; Garnett, T.; Tilman, D.; DeClerk, F.; Woos, A.; et al. Food in the Anthropocene: The EAT–Lancet Commission on healthy diets from sustainable food systems. Lancet 2019, 393, 447–492. [Google Scholar] [CrossRef]
  7. GBD 2017 Diet Collaborators. Health effects of dietary risks in 195 countries, 1990–2017: A systematic analysis for the Global Burden of Disease Study. Lancet 2019, 393, 1958–1972. [Google Scholar] [CrossRef]
  8. World Health Organization. Diet, Nutrition and the Prevention of Chronic Diseases; WHO Technical Report Series; WHO: Geneva, Switzerland, 2003; p. 916. [Google Scholar]
  9. Vermeulen, S.J.; Campbell, B.M.; Ingram, J.S.I. Climate change and food systems. Annu. Rev. 2012, 37, 195–222. [Google Scholar] [CrossRef]
  10. FAO and WHO. Sustainable Healthy Diets—Guiding Principles [Internet]; FAO and WHO: Rome, Italy, 2019; Available online: https://www.who.int/publications-detail/9789241516648 (accessed on 22 April 2020).
  11. Cucurachi, S.; Scherer, L.; Guinée, J.; Tukker, A. Life cycle assessment of food systems. One Earth 2019, 1, 292–297. [Google Scholar] [CrossRef]
  12. McAuliffe, G.A.; Takahashi, T.; Lee, M.R.F. Applications of nutritional functional units in commodity-level life cycle assessment (LCA) of agri-food systems. Int. J. Life Cycle Assess. 2019, 25, 208–221. [Google Scholar] [CrossRef] [PubMed]
  13. Hallström, E.; Davis, J.; Woodhouse, A.; Sonesson, U. Using dietary quality scores to assess sustainability of food products and human diets: A systematic review. Ecol. Indic. 2018, 93, 219–230. [Google Scholar] [CrossRef]
  14. Saarinen, M.; Fogelholm, M.; Tahvonen, R.; Kurppa, S. Taking nutrition into account within life cycle assessment of food products. J. Clean. Prod. 2017, 149, 828–844. [Google Scholar] [CrossRef]
  15. Green, A.; Nemecek, T.; Chaudhary, A.; Mathys, A. Assessing nutritional, health, and environmental sustainability dimensions of agri-food production. Glob. Food Secur. 2020, 26, 100406. [Google Scholar] [CrossRef]
  16. Hallström, E.; Bergman, K.; Mifflin, K.; Parker, R.; Tyedmers, P.; Troell, M.; Ziegler, F. Combined climate and nutritional performance of seafoods. J. Clean. Prod. 2019, 230, 402–411. [Google Scholar] [CrossRef]
  17. Bianchi, M.; Strid, A.; Winkvist, A.; Lindroos, A.K.; Sonesson, U.; Hallström, E. Systematic evaluation of nutrition indicators for use within food LCA studies. Sustainability 2020, 12, 8992. [Google Scholar] [CrossRef]
  18. Strid, A.; Johansson, I.; Bianchi, M.; Sonesson, U.; Hallström, E.; Lindahl, B.; Winkvist, A. Diets benefiting health and climate relates to longevity in northern Sweden. AJCN 2021. accepted manuscript. [Google Scholar]
  19. Johansson, I.; Hallmans, G.; Wikman, A.; Biessy, C.; Riboli, E.; Kaaks, R. Validation and calibration of food-frequency questionnaire measurements in the Northern Sweden Health and Disease cohort. Public Health Nutr. 2002, 5, 487–496. [Google Scholar] [CrossRef]
  20. The Swedish National Food Agency. Livsmedelsdatabasen (Food Composition Database) [Internet]. 2019. Available online: http://www7.slv.se/SokNaringsinnehall (accessed on 19 July 2019). (In Swedish).
  21. Wanselius, J.; Axelsson, C.; Moraeus, L.; Berg, C.; Mattison, I.; Larsson, C. Procedure to estimate added and free sugars in food items from the Swedish food composition database used in the national dietary survey Riksmaten Adolescents 2016–2017. Nutrients 2019, 11, 1342. [Google Scholar] [CrossRef] [PubMed]
  22. The Swedish National Food Agency. Livsmedelsdatabasen (Food Composition Database) [Internet]. 2020. Available online: http://www7.slv.se/SokNaringsinnehall (accessed on 22 June 2020). (In Swedish).
  23. The Swedish National Food Agency. Nötter, Frön och Gryn 2018. Analys av Näringsämnen. (Nuts, Seeds and Groats 2018. Analysis of Nutrients); The Swedish National Food Agency: Uppsala, Sweden, 2020. (In Swedish) [Google Scholar]
  24. U.S. Department of Agriculture. FoodData Central [Internet]. 2019. Available online: https://fdc.nal.usda.gov/ (accessed on 1 April 2019).
  25. Fulgoni, V.L.; Keast, D.R.; Drewnowski, A. Development and validation of the nutrient-rich foods index: A tool to measure nutritional quality of foods. J. Nutr. 2009, 139, 1549–1554. [Google Scholar] [CrossRef] [PubMed]
  26. The Swedish National Food Agency. Hitta Ditt Sätt—Att Äta Grönare, Lagom Mycket Och Röra på Dig (Find Your Way—To Eat Greener, Adequate and to Do Physical Activity); The Swedish National Food Agency: Uppsala, Sweden, 2017. (In Swedish) [Google Scholar]
  27. The Swedish National Food Agency. Riksmaten 2010-11—Livsmedels- och Näringsintag Bland Vuxna i Sverige (Food and Nutrition Intake among Adults in Sweden); Livsmedelsverket: Uppsala, Sweden, 2012. (In Swedish) [Google Scholar]
  28. RISE Food Climate Database 1.5; RISE Research Institutes of Sweden: Gothenburg, Sweden, 2018.
  29. RISE Food Climate Database 1.6; RISE Research Institutes of Sweden: Gothenburg, Sweden, 2019.
  30. Research Institutes of Sweden RISE. Öppna Listan—Ett Utdrag Från RISE Klimatdatabas för Livsmedel v 1.6 (2019) (The Open List—An Excerpt from RISE Food Climate Database v 1.6 (2019); RISE: Gothenburg, Sweden, 2019. (In Swedish) [Google Scholar]
  31. Moberg, E.; Andersson, M.W.; Säll, S.; Hansson, P.A.; Röös, E. Determining the climate impact of food for use in a climate tax—design of a consistent and transparent model. Int. J. Life Cycle Assess. 2019, 24, 1715–1728. [Google Scholar] [CrossRef]
  32. Conrad, Z.; Blackstone, N.T.; Roy, E.D. Healthy diets can create environmental trade-offs, depending on how diet quality is measured. Nutr. J. 2020, 19, 117. [Google Scholar] [CrossRef]
  33. Röös, E. Mat-Klimat-Listan (Food Climate List). Version 1.1. Report 077; SLU: Uppsala, Sweden, 2014. (In Swedish) [Google Scholar]
  34. Notarnicola, B.; Sala, S.; Anton, A.; McLaren, S.J.; Saouter, E.; Sonesson, U. The role of life cycle assessment in supporting sustainable agri-food systems: A review of the challenges. J. Clean. Prod. 2017, 140, 399–409. [Google Scholar] [CrossRef]
  35. Temple, N.J. Front-of-pack food labels: A narrative review. Appetite 2020, 144, 104485. [Google Scholar] [CrossRef]
  36. The Swedish National Food Agency. Nyckelhålet (The Keyhole) [Internet]. 2020. Available online: https://www.livsmedelsverket.se/livsmedel-och-innehall/text-pa-forpackning-markning/nyckelhalet (accessed on 21 September 2020). (In Swedish).
  37. Colruyt Group. What Is the Nutri-Score? [Internet]. 2020. Available online: https://nutriscore.colruytgroup.com/colruytgroup/en/about-nutri-score (accessed on 21 September 2020).
  38. Oatly. Havredryck Med Koldioxidekvivalenter (Oat Drink with Carbon Dioxide Equivalents) [Internet]. 2020. Available online: https://www.oatly.com/se/klimatavtryck (accessed on 21 September 2020). (In Swedish).
  39. Arla. Netto Noll Klimatavtryck (Net Zero Carbon Footprint) [Internet]. 2020. Available online: https://www.arla.se/om-arla/vart-ansvar/ekologiskt/netto-noll-klimatavtryck/ (accessed on 21 September 2020). (In Swedish).
  40. Coop. Coops Hållbarhetsdeklaration (Coop’s Sustainability Declaration) [Internet]. 2020. Available online: https://www.coop.se/vart-ansvar/hallbarhetsarbete/hallbarhetsdeklaration/ (accessed on 21 September 2020). (In Swedish).
  41. The Swedish Board of Agriculture. Jordbruksverkets Statistikdatabas (The Swedish Board of Agricultures’ Statistics Database) [Internet]. 2021. Available online: http://statistik.sjv.se/PXWeb/pxweb/sv/Jordbruksverkets%20statistikdatabas/Jordbruksverkets%20statistikdatabas__Jordbrukets%20ekonomi__1%20EAA/?rxid=5adf4929-f548-4f27-9bc9-78e127837625 (accessed on 16 March 2021). (In Swedish).
  42. Laurentius Nilsson, F.O. Biodiversity on Swedish pastures: Estimating biodiversity production costs. J. Environ. Manag. 2009, 90, 131–143. [Google Scholar] [CrossRef] [PubMed]
Figure 1. Suggestions on how the two methods of combined assessment of nutrient density and climate impact of food products can be used in practice: (a) as a separate analysis with climate impact on one axis and nutrient density on the other axis; (b) and as an integrated score calculated by dividing climate impact by nutrient density. Categorization of performance in relation to predefined thresholds (dotted lines).
Sustainability 13 03621 g001
Figure 2. A combined analysis of nutrient density and climate impact of 53 food subgroups. Nutrient density was calculated by NRF11.3 per 100 kcal with weighting and climate impact was expressed as kg CO2e/kg food subgroup (at the stage of industry gate and including transport to Sweden for imported food; cooked weight for foods that require preparation). The thicker lines represents the median of all food subgroups included, i.e., median score of 0.41 for nutrient density and median value of 1.2 kg CO2e/kg food subgroup for climate impact. Nutritional information was retrieved from version 20171215 of the Swedish food composition database. Abbreviations: NRF, Nutrient Rich Foods index; CO2e, carbon dioxide equivalents.
Sustainability 13 03621 g002
Figure 3. A combined analysis of nutrient density and climate impact of 53 food subgroups. Nutrient density was calculated by NRF11.3 per 100 kcal with weighting and climate impact was expressed as kg CO2e/100 kcal food subgroup (at the stage of industry gate and including transport to Sweden for imported food; cooked weight for foods that require preparation). The thicker lines represent the median of all food subgroups included, i.e., median score of 0.41 for nutrient density and median value of 0.1 kg CO2e/100 kcal food subgroup for climate impact. Nutritional information was retrieved from version 20171215 of the Swedish food composition database. Abbreviations: NRF, Nutrient Rich Foods index; CO2e, carbon dioxide equivalents.
Sustainability 13 03621 g003
Table 1. Nutrients included in the dietary nutrient density score NRF11.3 and their reference values and weighting factors.
Qualitative NutrientsDRIWeighting Factors
Protein (g)871.08
Fiber (g)301.51
Vitamin A (retinol equivalents)8000.97
Vitamin C (mg)750.79
Vitamin E (mg)90.73
Calcium (mg)8000.91
Iron (mg)121.15
Potassium (g)3.31.06
Magnesium (mg)3150.95
Vitamin D (µg)101.43
Folate (µg)3501.35
Disqualitative nutrientsMRIWeighting factors
Saturated fat (g)271.12
Added sugar (g)591.00
Sodium (g)2.41.30
DRI and MRI values are from the Nordic Nutrition Recommendations 2012. DRI and MRI are average values for men and women aged 31–60 years with an average level of physical activity. When specific recommendations for fertile women existed (iron, folate), these were used. Mean intakes of the Swedish population taken from the national food survey in Sweden from 2010–2011 (Riksmaten 2010–2011). Weighting factors for qualitative nutrients calculated by DRI for nutrient/mean intake of nutrient and for disqualitative nutrients by mean intake of nutrient/DRI for nutrient. Abbreviations: NRF, Nutrient Rich Foods index; DRI, daily reference intake; MRI, maximum recommended intake.
Table 2. Ranking of 53 food subgroups based on nutrient density calculated by NRF11.3 per 100 kcal with weighting, climate impact expressed per kg at the stage of industry gate and including transport to Sweden for imported food; cooked weight for foods that require preparation, and a combined climate impact and nutrient density score.
Quintile 1Ranking Based on Nutrient DensityRanking Based on Climate ImpactRanking Based on Combined Nutrient Density and Climate Impact
1Cabbage, broccoli, and spinachSoft drinksCabbage, broccoli, and spinach
Salad vegetablesRoot vegetablesRoot vegetables
BerriesPorridgeEnriched plant-based drinks (soy, almond, oat)
Citrus fruitLegumesSalad vegetables
Liver pasteEnriched plant-based drinks (oat, soy, almond)Legumes
JuicePome fruits and stone fruitsCitrus fruit
Enriched plant-based drinks (soy, almond, oat)Low fiber pastaBerries
EggWholegrain breadJuice
Plant-based meat substitutesCabbage, broccoli, and spinachPome fruits and stone fruits
Pelagic fish Plant-based cooking creamBanana
SeedsBananaWholegrain bread
2LegumesCitrus fruitPelagic fish
Low fat milk, yoghurt, and soured milkSalad vegetablesPorridge
SalmonFruit soupLow fat milk, yoghurt, and soured milk
Root vegetablesLow fiber breadAvocado
Dried fruitJuiceEgg
CodPelagic fish Liver paste
Pome fruits and stone fruitsHoney, jamsPlant-based meat substitutes
High fat and medium fat milk and yoghurtAvocadoHigh fat and medium fat milk and yoghurt
Venison (deer bred in captivity)BerriesSeeds
AvocadoLow fat milk, yoghurt, and soured milkFruit soup
3CrustaceanMuesli and breakfast cerealsLow fiber bread
BananaHigh fat and medium fat milk and yoghurtLow fiber pasta
Wholegrain breadRiceSalmon
Low fat cheeseAlcoholic drinksMuesli and breakfast cereals
NutsPlant-based meat substitutesCod
PoultryEggNuts
MargarineSeedsDried fruit
SnacksIce-creamSoft drinks 2
Fruit soupBiscuits, cakesMargarine
Red meat from ruminants (beef and lamb)MargarineBuns, wheat rusks
Muesli and breakfast cerealsVegetable oilsPoultry
4PorkLiver pasteAlcoholic drinks
High fat cheeseNutsPlant-based cooking cream 2
Low fiber breadDried fruitSnacks
Vegetable oilsChocolate, candiesVegetable oils
Low fiber pastaSalmonCrustacean
Alcoholic drinksBuns, wheat rusksLow fat cheese
Buns, wheat rusksLight cream and crème fraichePork
PorridgeCodHoney, jams 2
Minced meat (67% beef and 33% pork)PoultryHigh fat cheese
Plant-based cooking creamHigh fat cream, crème fraiche and sour cream Rice 2
5Butter and other hard fatsSausageVenison (deer bred in captivity)
Ice-creamCold cutsIce-cream 2
Biscuits, cakesButter and other hard fatsRed meat from ruminants (beef and lamb)
RicePorkBiscuits, cakes 2
Light cream and crème fraicheLow fat cheeseChocolate, candies 2
High fat cream, crème fraiche, and sour cream High fat cheeseLight cream and crème fraiche 2
Honey, jamsCrustaceanButter and other hard fats 2
Chocolate, candiesSnacksMinced meat (67% beef and 33% pork)
SausageMinced meat (67% beef and 33% pork)High fat cream, crème fraiche, and sour cream 2
Cold cutsRed meat from ruminants (beef and lamb)Sausage 2
Soft drinksVenison (deer bred in captivity)Cold cuts 2
Qualitative nutrients in NRF11.3 are protein, fiber, iron, potassium, calcium, magnesium, vitamin A, vitamin C, vitamin E, vitamin D, and folate, and disqualitative nutrients are sodium, saturated fat, and added sugar. The combined climate impact and nutrient density score was calculated by dividing kg CO2e/kg food group with NRF11.3 per 100 kcal with weighting. Negative NRF values were capped at the lowest positive value in the sample before calculating the combined score. Weighting was based on mean intakes of the Swedish population taken from the national food survey in Sweden from 2010–2011 (Riksmaten 2010–2011). Weighting factors for qualitative nutrients were calculated by DRI for nutrient/mean intake of nutrient and for disqualitative nutrients by mean intake of nutrient/DRI for nutrient. Disqualitative nutrients where mean intake in the population was below MRI were not weighted. 1 Quintile 1 represents the food subgroups with the highest nutrient density score, lowest climate impact, and lowest climate impact per nutrient density score. 2 Food subgroups including food products with negative NRF values. Nutritional information was retrieved from version 20171215 of the Swedish food composition database (http://www7.slv.se/soknaringsinnehall, accessed on 19 July 2019). Abbreviations: DRI, daily reference intake; MRI, maximum recommended intake; NRF, Nutrient Rich Foods index.
Publisher’s Note: MDPI stays neutral with regard to jurisdictional claims in published maps and institutional affiliations.

