
A Novel Multiobjective Hybrid Technique for Siting and Sizing of Distributed Generation and Capacitor Banks in Radial Distribution Systems

 ,
,  ,
,  ,
, 
Abstract
1. Introduction
1.1. Background
1.2. Literature Survey
1.3. Research Gap
- Some approaches consider only the active power injection, i.e., DG with unity power factor.
- Few methodologies are appropriate for the allocation of a single DG unit.
- Locations of DGs and/or CBs are fixed in some cases.
- Environmental concerns are not considered.
- Few network constraints are unnoticed.
- Economic considerations are ignored in some articles.
- The computational time of some methods is so high.
- The results found by some presented methods are not optimal.
1.4. Paper Contributions
- Demonstrating the penetration of DGs and CBs to improve the technical, environmental, and economic concerns of RDS by satisfying three technical objectives, that is, power loss reduction, voltage profile improvement, and stability index enhancement
- Considering two economic issues, namely, minimizing the costs of generated power and CBs, and reducing the emission as an environmental value for realizing the clean operation
- Considering six operational cases of DGs/CBs with multiobjective optimization to discover the technical, economic, and environmental impacts through the proposed EGWO-PSO method and comparison with other techniques
- Applying the proposed method to standard radial distribution systems
1.5. Paper Organization
2. Problem Formulation
2.1. Objective Functions
2.1.1. Technical Objective Functions
- In the distribution network, the power losses are related to the line current. The line currents can be reduced with the proper placement of CBs and DGs. Minimization of the distribution power losses (of1) can be expressed [6] using Equation (1).
- To ensure quality supply voltage, one of the effective ways is to minimize the voltage deviation index (VDI). It is a measure of the deviation of the voltage at all the load buses in the system. Minimization of VDI (of2) can be described as follows [7]:
- An Optimal allocation of DGs and CBs in the distribution network enhances the voltage stability index (VSI) in the network. An improved VSI of the distribution means that the voltage profile of the bus is maintained within an acceptable limit over the variable loading scenarios. Maximization of voltage stability index (of3) can be expressed as follows [6,7]:of3 = max (VSI),
2.1.2. Economic Objective Function
2.1.3. Environmental Objective Function
2.2. Constraints
2.2.1. Equality Constraints:
2.2.2. Inequality Constraints
- DGs capacity constraint [30]:
- Reactive power resources constraints:
- Bus voltage constraints:
2.3. Optimal Location of CB and DGs Based on LSF
3. Proposed Hybrid Optimization Algorithm
3.1. Enhanced GWO
3.2. Particle Swarm Optimization
- PSO is a simple algorithm and users could easily develop this algorithm with basic mathematical and logic operations.
- Its implementation is easy and computation is efficient in terms of both memory requirements and speed.
- It does not require a good initial solution to start its iteration process.
- PSO is much faster for power system optimization.
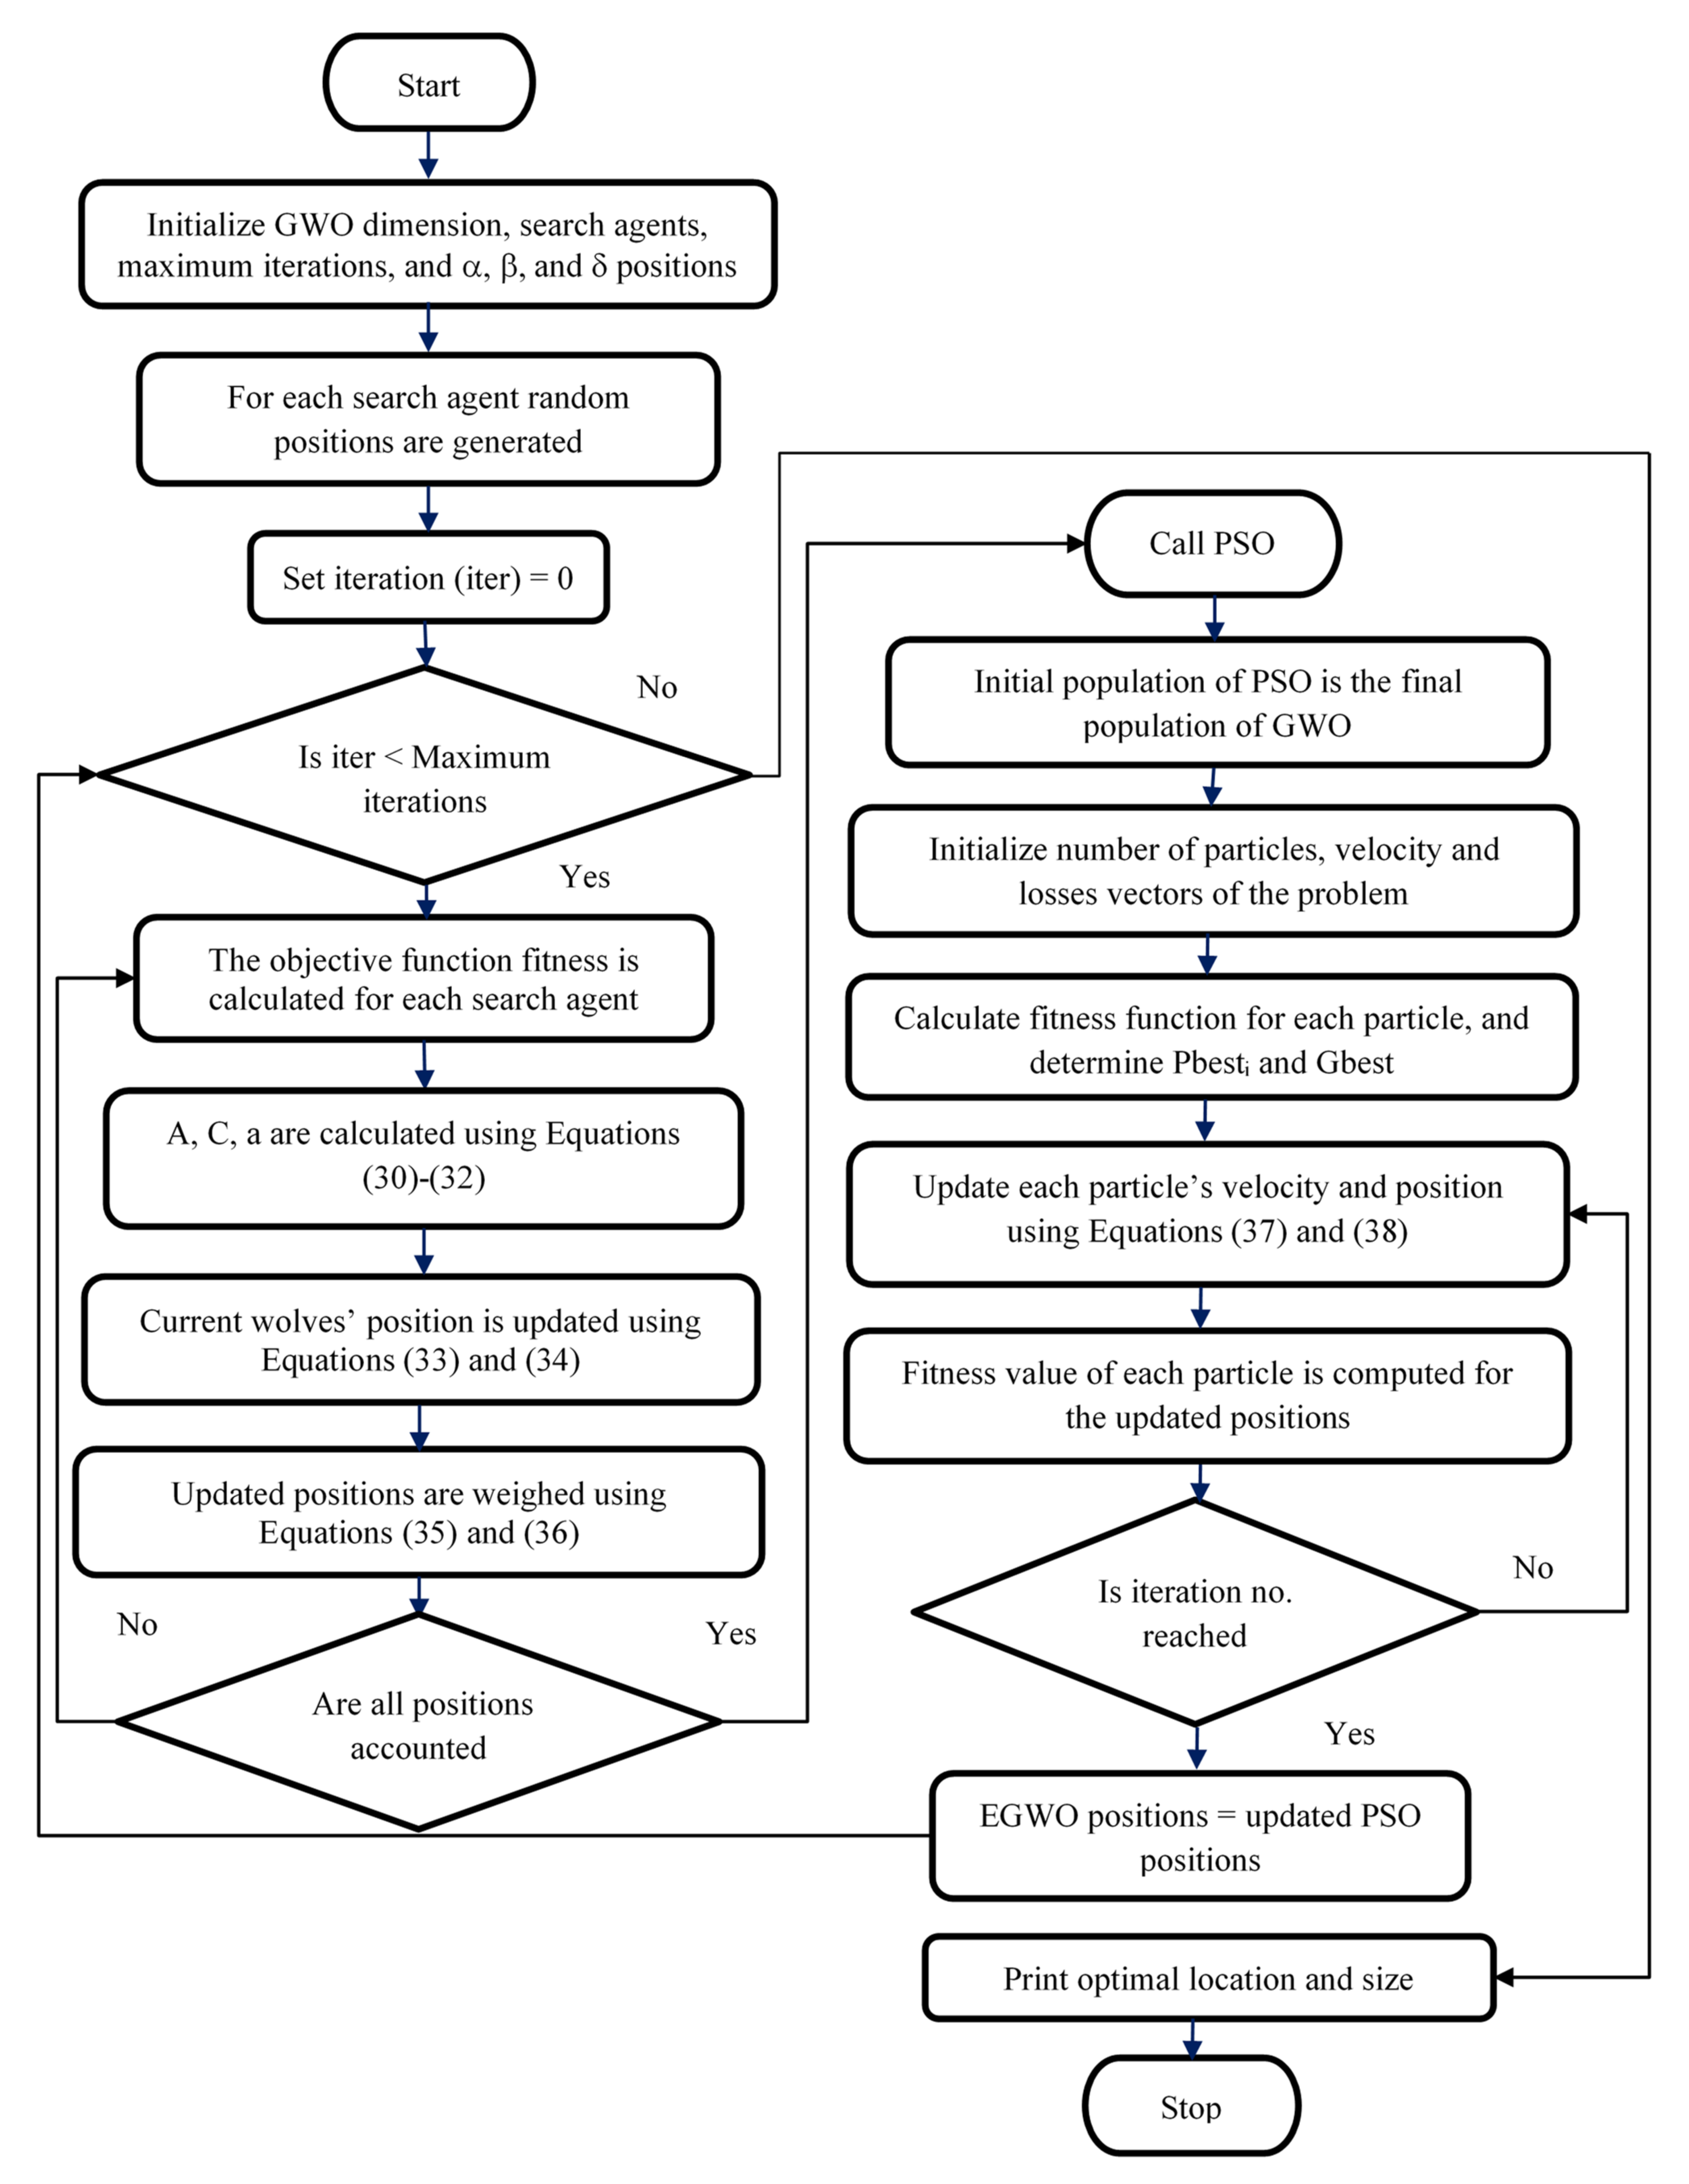
3.3. Hybrid Enhanced GWO-PSO (EGWO-PSO)
- Step 1:
- Initialize the search agents, maximum iterations, dimension, and boundaries of the problem.
- Step 2:
- Search agent population is generated randomly by the EGWO and the positions of α, β and δ wolves’ are initialized.
- Step 3:
- The random size of CB/DG units for each search agent is placed at buses identified by the LSF method and the objective function is calculated.
- Step 4:
- The components of “a0”are determined using the modified Equation (32) and the parameters A and C are calculated using Equations (30) and (31), respectively.
- Step 5:
- The positions of α, β, and δ wolves are updated using Equations (33) and (34).
- Step 6:
- The positions of search agents are weighted in each iteration using Equations (35) and updated using Equation (36).
- Step 7:
- The above steps are repeated for all the positions of search agents.
- Step 8:
- Initialize the number of particles, velocity, and losses vector of the problem.
- Step 9:
- The final population of EGWO is the initial population of PSO.
- Step 10:
- The CB/DG size for each particle is assigned to the same buses considered for EGWO and the fitness function of all the particles is evaluated.
- Step 11:
- Individual PBesti and global GBest are computed.
- Step 12:
- Using Equations (37) and (38), each swarm velocity and swarm position are updated.
- Step 13:
- The fitness value of each particle is computed for the updated sizing of CBs/DGs placed at the best nodes obtained in step 11.
- Step 14:
- Steps 12 and 13 are repeated for all the particles until maximum iterations are reached.
- Step 15:
- The improved positions are returned to step 3 of enhanced GWO.
- Step 16:
- Steps 3 to 15 are repeated till the stopping criterion is reached.
4. Test Systems and Cases
4.1. Test Distribution Systems
4.2. Case Study
- Case 1:
- Optimal placement and sizing of CBs alone
- Case 2:
- Optimal placement and sizing of DGs at UPF
- Case 3:
- Optimal placement and sizing of the combination of CBs and DGs at UPF
- Case 4:
- Optimal placement and sizing of DGs at LPF
- Case 5:
- Optimal placement and sizing of the combination of CBs and DGs at LPF
- Case 6:
- Optimal placement and sizing of multi-CBs and DGs
5. Result and Discussions
5.1. Results of 33-Bus Network
- Case 1:
- Optimal placement and sizing of CBs alone
- Case 2:
- Optimal placement and sizing of DGs at unity PF
- Case 3:
- Optimal placement and sizing of a combination of CBs and DGs at UPF.
- Case 4:
- Optimal placement and sizing of DGs at LPF
- Case 5:
- Optimal placement and sizing of a combination of CBs and DGs at LPF
- Case 6:
- Optimal placement and sizing of multi-CBs and DGs.
5.2. Results of 69-Bus System
- Case 1:
- Optimal placement and sizing of CBs alone
- Case 2:
- Optimal placement and sizing of DGs at unity PF
- Case 3:
- Optimal placement and sizing of a combination of CBs and DGs at UPF
- Case 4:
- Optimal placement and sizing of DGs at LPF
- Case 5:
- Optimal placement and sizing of a combination of CBs and DGs at LPF.
- Case 6:
- Optimal placement and sizing of multi-CBs and DGs.
6. Conclusions
- Real power loss of the system is reduced greatly up to 92.60% and 96.79% for 33 and 69 test systems, respectively, using the optimal placement and sizing of combined DGs and CBs.
- The voltage stability index (VSI) of the system is improved significantly from its base value of 0.6968 p.u. to 0. 9788 p.u. for the 33-bus test system and 0.6850 to 0.9933 p.u. for the 69-bus test system.
- Excellent emission reduction has taken place up to 72%.
- Significant cost reduction of up to 25% is attained.
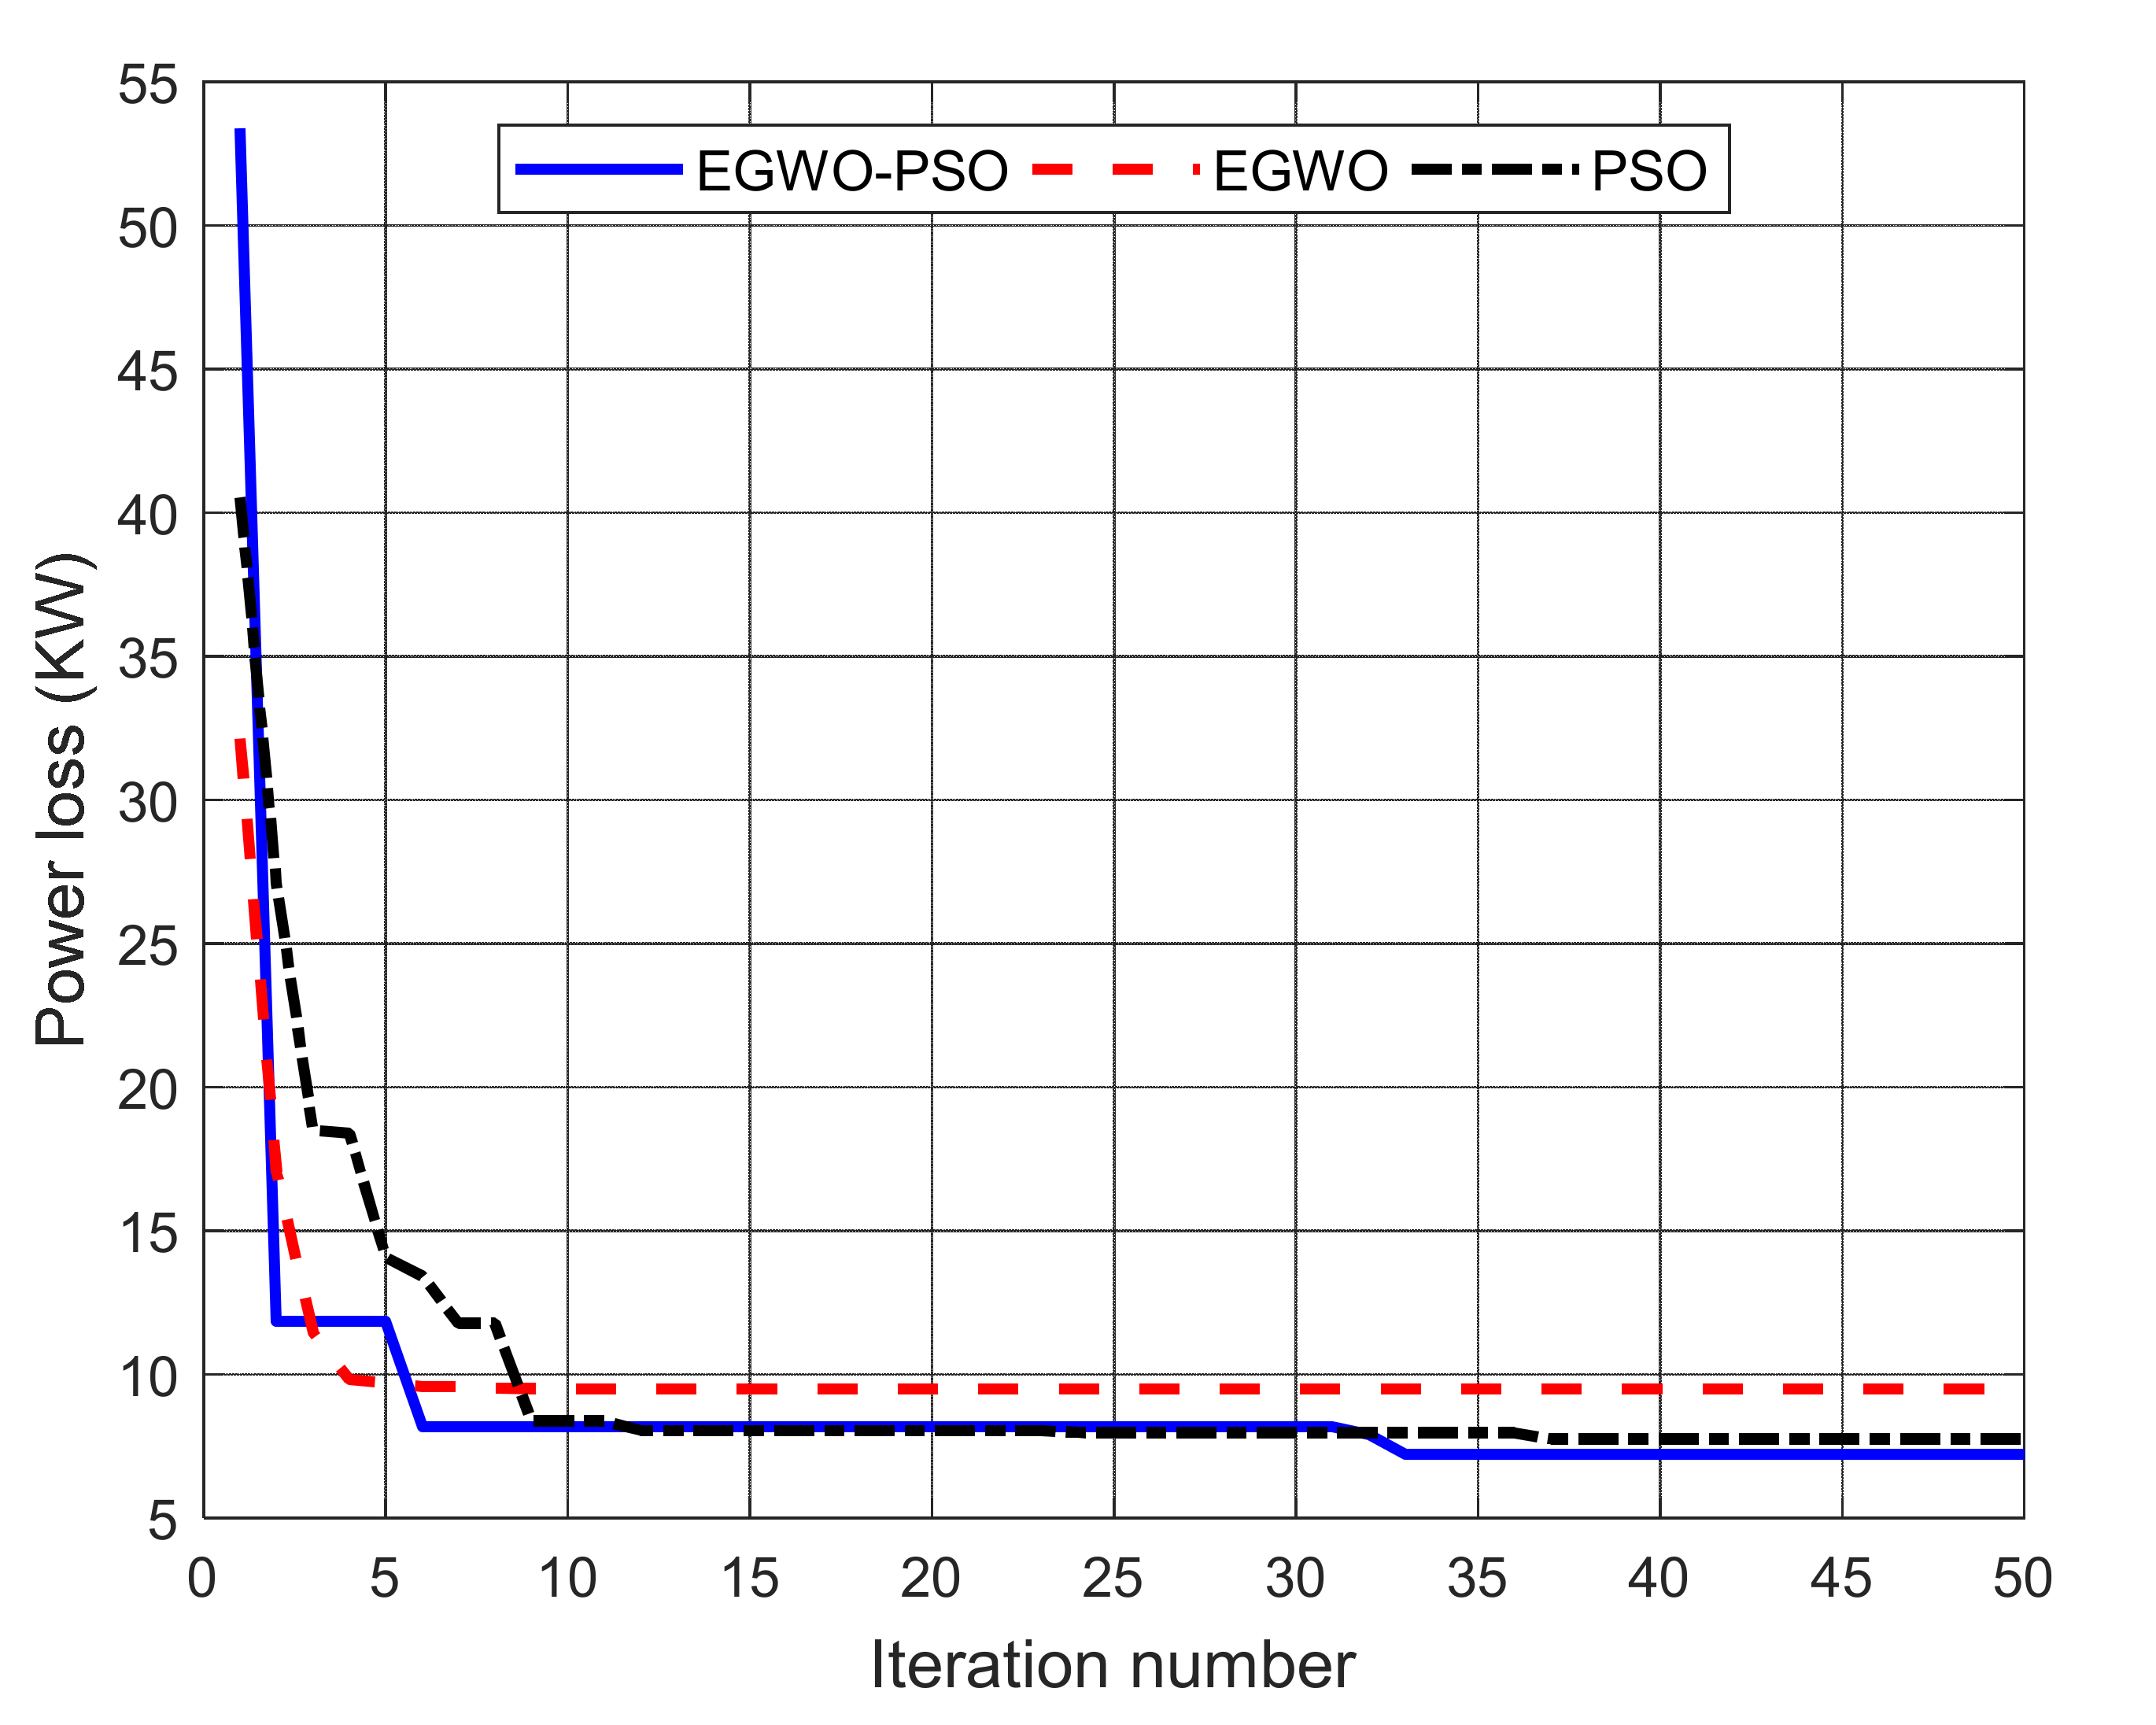
- Excellent convergence characteristics have been obtained for EGWO-PSO.
Author Contributions
Funding
Institutional Review Board Statement
Informed Consent Statement
Data Availability Statement
Conflicts of Interest
Nomenclature
| a | Fixed generation cost coefficient |
| A and C | Coefficients of grey wolf optimizer (GWO) |
| a0 | Modified optimizer of enhanced GWO |
| b | Variable generation cost coefficient |
| c1 and c2 | Control coefficients of particle swarm optimization (PSO) |
| CCB | Investment cost of the capacitor bank (CB) |
| CCi | Purchase cost of ith CB |
| CDGi | Generation cost of ith distributed generation (DG) unit |
| CGrid | Substation cost |
| CO2, NOx and SO2 | Carbon dioxide, nitrogen oxides, and sulfur dioxide, respectively. |
| EGrid | Emissions generated by the grid |
| ei | Installation cost of ith CB |
| EPVi, EWTi and EGTi | Emissions generated by the ith photovoltaic (PV), wind turbine (WT), and gas turbine (GT) power plants, respectively |
| GBest | Global best of PSO |
| Gr | Annual rates of benefit |
| Ii | Current magnitude of ith branch |
| LF | Load factor of DGs |
| min and max | Lowest and highest permissible limits respectively. |
| n | Total number of buses in the system |
| NC | Number of capacitor bank units |
| NDG | Total number of DG units |
| nL | Total number of branches |
| NPQ | Total number of load buses |
| NPV, NWT and NGT | Total number of PV, WT, and GT DG units, respectively |
| NR | Number of installed reactive power resources |
| O & M | Operation and maintenance |
| PBesti | Personal best of ith particle of PSO |
| PD | Total active power demand |
| PDGi and QDGi | Active and reactive power the capacity of a DG unit at ith bus, respectively |
| Pd and Qd | Active and reactive power demand, respectively |
| PgGrid | Real power produced by the substation |
| Pij loss | Active power loss in the line between the nodes i and j |
| Pj and Qj | Real and reactive power of load at jth node, respectively |
| PLossj and QLossj | Active and reactive power line losses of jth bus, respectively |
| PPVi, PWTi and PGTi | Active power generated by the PV, WT, and GT DG units at ith bus, respectively |
| PrGrid | Generated power cost at the substation |
| Ps and Qs | Real and reactive power of swing bus, respectively |
| QCi | Reactive power capacity of ith CB |
| Qd | Total reactive power demand |
| QRi | Reactive power injection by CB and/or DG unit at ith node |
| r1 and r2 | Random numbers |
| Ri | Resistance of ith branch |
| t | Current iteration |
| Vi and Vj | Voltage magnitude at ith and jth nodes, respectively |
| vi | Velocity of the ith particle in PSO |
| VLi | RMS value of ith load-bus voltage |
| W | Inertia weight of PSO |
| w | Weight coefficient of GWO |
| X | Location of a grey wolf |
| xi | Position vector of the ith particle in PSO |
| Xij and Rij | Reactance and resistance of the line between nodes i and j, respectively |
| Xp | Position of the prey in GWO |
| α, β, δ, and ω | Fittest, second best, third best, and remaining solutions of GWO, respectively |
| ς and θ | Control parameters of GWO |
| μ | Update coefficient of PSO |
| Abbreviations | |
| ABC | Artificial bee colony |
| ACO-ABC | Ant colony optimization and artificial bee colony |
| ALO | Ant lion optimization |
| BBBC | Big bang–big crunch |
| BPSO-SLFA | Binary particle swarm optimization-shuffled frog leap algorithm |
| BSA | Backtracking search algorithm |
| CB | Capacitor bank |
| Cf-PSO | Constriction factor particle swarm optimization |
| CSA | Crow search algorithm |
| CSO | Cuckoo search optimization |
| CTLBO | Comprehensive teaching learning-based optimization |
| CVSI | Combined voltage stability index |
| CWOA-LSF | Chaotic whale optimization algorithm and loss sensitivity factor |
| DE | Differential evolution |
| DE-PS | Differential evolution and pattern search |
| DG | Distributed generation |
| DS | Distribution systems |
| DSA | Direct search algorithm |
| EA | Efficient analytical |
| EA-OPF | Efficient analytical and optimal power flow |
| EGWO | Enhanced grey wolf optimizer |
| EGWO-PSO | Enhanced grey wolf optimizer and particle swarm optimization |
| FPA | Flower pollination algorithm |
| Fuzzy GA | Fuzzy genetic algorithm |
| FWA | Fireworks algorithm |
| GA | Genetic algorithm |
| GA-IWD | Genetic algorithm-intelligent water drops |
| GSA | Gravitational search algorithm |
| GWO | Grey wolf optimizer |
| GWO-PSO | Grey wolf optimizer and particle swarm optimization |
| HGWO | Hybrid grey wolf optimizer |
| HS | Harmony search |
| HSA | Harmony search algorithm |
| HSA-PABC | Harmony search algorithm and particle artificial bee colony |
| IA | Improved analytical |
| I-DBEA | Improved decomposition-based evolutionary algorithm |
| IEEE | Institute of Electrical and Electronics Engineers |
| IGWO | Improved grey wolf optimizer |
| IMDE | Intersect mutation differential evolution |
| IMOEHO | Improved multiobjective elephant herding optimization |
| IMOHS | Improved multiobjective harmony search |
| IPSO | Improved particle swarm optimization |
| KHA | Krill herd algorithm |
| LPF | Lagging/leading power factor |
| LSF | Loss sensitivity factor |
| LSFSA | Loss sensitivity factor simulated annealing |
| MINLP | Loss sensitivity factor simulated annealing |
| MODE | Multiobjective differential evolution |
| MOF | Multiobjective functions |
| MOHTLBOGWO | Multiobjective hybrid teaching learning-based optimization-grey wolf optimizer |
| MOPSO | Multiobjective particle swarm optimization |
| MTLBO | Modified teaching learning-based optimization |
| of | Objective function |
| OPF | Optimal power flow |
| PBOA | Polar bear optimization algorithm |
| PF | Power factor |
| PGSA | Plant growth simulation algorithm |
| PSO | Particle swarm optimization |
| PV, WT, and GT | Photovoltaic, wind, and Gas turbine power plants, respectively |
| QOTLBO | Quasi-oppositional TLBO |
| RDS | Radial distribution systems |
| RGA | Refined genetic algorithm |
| SHO | Spotted hyena optimizer |
| SSA | Spring search algorithm |
| TLBO | Teaching learning-based optimization |
| TM | Taguchi method |
| UPF | Unity power factor |
| VDI | Voltage deviation index |
| VSI | Voltage stability index |
| WCA | Water cycle algorithm |
| WOA | Whale optimization algorithm |
References
- Bayat, S.A.; Davoudkhani, I.F.; Moghaddam, M.J.H.; Najmi, E.S.; Abdelaziz, A.Y.; Ahmadi, A.; Razavi, S.E.; Gandoman, F.H. Fuzzy multi-objective placement of renewable energy sources in distribution system with objective of loss reduction and reliability improvement using a novel hybrid method. Appl. Soft Comput. 2019, 77, 761–779. [Google Scholar]
- Khodabakhshian, A.; Andishgar, M.H. Simultaneous placement and sizing of DGs and shunt capacitors in distribution systems by using IMDE algorithm. Int. J. Electr. Power Energy Syst. 2016, 82, 599–607. [Google Scholar] [CrossRef]
- Suresh, M.C.V.; Belwin, E.J. Optimal DG placement for benefit maximization in distribution networks by using Dragonfly algorithm. Renew. Wind Water Sol. 2018, 5, 1–8. [Google Scholar] [CrossRef]
- Saddique, M.W.; Haroon, S.S.; Amin, S.; Bhatti, A.R.; Sajjad, I.A.; Liaqat, R. Optimal Placement and Sizing of Shunt Capacitors in Radial Distribution System Using Polar Bear Optimization Algorithm. Arab. J. Sci. Eng. 2021, 46, 873–899. [Google Scholar] [CrossRef]
- Bayat, A.; Bagheri, A. Optimal active and reactive power allocation in distribution networks using a novel heuristic approach. Appl. Energy 2019, 233–234, 71–85. [Google Scholar] [CrossRef]
- El-Ela, A.A.A.; El-Sehiemy, R.A.; Abbas, A.S. Optimal Placement and Sizing of Distributed Generation and Capacitor Banks in Distribution Systems Using Water Cycle Algorithm. IEEE Syst. J. 2018, 12, 3629–3636. [Google Scholar] [CrossRef]
- Ali, A.; Keerio, M.U.; Laghari, J.A. Optimal Site and Size of Distributed Generation Allocation in Radial Distribution Network using Multi-objective optimization. J. Mod. Power Syst. Clean Energy 2020, in press. [Google Scholar]
- Palanisamy, R.; Muthusamy, S.K. Optimal Siting and Sizing of Multiple Distributed Generation Units in Radial Distribution System Using Ant Lion Optimization Algorithm. J. Electr. Eng. Technol. 2021, 16, 79–89. [Google Scholar] [CrossRef]
- Yang, B.; Yu, L.; Chen, Y.; Ye, H.; Shao, R.; Shu, H.; Yu, T.; Zhang, X.; Sun, L. Modelling, applications, and evaluations of optimal sizing and placement of distributed generations: A critical state-of-the-art survey. Int. J. Energy Res. 2021, 45, 3615–3642. [Google Scholar] [CrossRef]
- Taha, I.B.M.; Elattar, E.E. Optimal reactive power resources sizing for power system operations enhancement based on improved grey wolf optimiser. IET Gener. Transm. Distrib. 2018, 12, 3421–3434. [Google Scholar] [CrossRef]
- Sanjay, R.; Jayabarathi, T.; Raghunathan, T.; Ramesh, V.; Mithulananthan, N. Optimal Allocation of Distributed Generation Using Hybrid Grey Wolf Optimizer. IEEE Access 2017, 5, 14807–14818. [Google Scholar] [CrossRef]
- Abd El-salam, M.; Beshr, E.; Eteiba, M. A New Hybrid Technique for Minimizing Power Losses in a Distribution System by Optimal Sizing and Siting of Distributed Generators with Network Reconfiguration. Energies 2018, 11, 3351. [Google Scholar] [CrossRef]
- Balu, K.; Mukherjee, V. Siting and Sizing of Distributed Generation and Shunt Capacitor Banks in Radial Distribution System Using Constriction Factor Particle Swarm Optimization. Electr. Power Compon. Syst. 2020, 48, 697–710. [Google Scholar] [CrossRef]
- Adetunji, K.E.; Hofsajer, I.W.; Abu-Mahfouz, A.M.; Cheng, L. A Review of Metaheuristic Techniques for Optimal Integration of Electrical Units in Distribution Networks. IEEE Access 2021, 9, 5046–5068. [Google Scholar] [CrossRef]
- Moradi, M.H.; Abedini, M. A novel method for optimal DG units capacity and location in Microgrids. Int. J. Electr. Power Energy Syst. 2016, 75, 236–244. [Google Scholar] [CrossRef]
- Abdelaziz, A.Y.; Ali, E.S.; Abd Elazim, S.M. Flower Pollination Algorithm and Loss Sensitivity Factors for optimal sizing and placement of capacitors in radial distribution systems. Int. J. Electr. Power Energy Syst. 2016, 78, 207–214. [Google Scholar] [CrossRef]
- Muthukumar, K.; Jayalalitha, S. Optimal placement and sizing of distributed generators and shunt capacitors for power loss minimization in radial distribution networks using hybrid heuristic search optimization technique. Int. J. Electr. Power Energy Syst. 2016, 78, 299–319. [Google Scholar] [CrossRef]
- Kansal, S.; Kumar, V.; Tyagi, B. Hybrid approach for optimal placement of multiple DGs of multiple types in distribution networks. Int. J. Electr. Power Energy Syst. 2016, 75, 226–235. [Google Scholar] [CrossRef]
- Ali, E.S.; Abd Elazim, S.M.; Abdelaziz, A.Y. Ant Lion Optimization Algorithm for optimal location and sizing of renewable distributed generations. Renew. Energy 2017, 101, 1311–1324. [Google Scholar] [CrossRef]
- Ramadan, H.S.; Bendary, A.F.; Nagy, S. Particle swarm optimization algorithm for capacitor allocation problem in distribution systems with wind turbine generators. Int. J. Electr. Power Energy Syst. 2017, 84, 143–152. [Google Scholar] [CrossRef]
- Kumar, M.; Nallagownden, P.; Elamvazuthi, I. Optimal Placement and Sizing of Renewable Distributed Generations and Capacitor Banks into Radial Distribution Systems. Energies 2017, 10, 811. [Google Scholar] [CrossRef]
- Prakash, D.B.; Lakshminarayana, C. Multiple DG placements in radial distribution system for multi objectives using Whale Optimization Algorithm. Alex. Eng. J. 2018, 57, 2797–2806. [Google Scholar] [CrossRef]
- HassanzadehFard, H.; Jalilian, A. Optimal sizing and location of renewable energy based DG units in distribution systems considering load growth. Int. J. Electr. Power Energy Syst. 2018, 101, 356–370. [Google Scholar] [CrossRef]
- Gampa, S.R.; Das, D. Simultaneous optimal allocation and sizing of distributed generations and shunt capacitors in distribution networks using fuzzy GA methodology. J. Electr. Syst. Inf. Technol. 2019, 6, 4. [Google Scholar] [CrossRef]
- Hassan, A.S.; Sun, Y.; Wang, Z. Multi-objective for optimal placement and sizing DG units in reducing loss of power and enhancing voltage profile using BPSO-SLFA. Energy Rep. 2020, 6, 1581–1589. [Google Scholar] [CrossRef]
- Rajalakshmi, J.; Durairaj, S. Application of multi-objective optimization algorithm for siting and sizing of distributed generations in distribution networks. J. Comb. Optim. 2021, 41, 267–289. [Google Scholar] [CrossRef]
- Mahmoud, I.; Kamel, S.; Abdel-Mawgoud, H.; Nasrat, L.; Jurado, F. Integration of DG and Capacitor in Radial Distribution Networks Using an Efficient Hybrid Optimization Method. Electr. Power Compon. Syst. 2020, 48, 1102–1110. [Google Scholar] [CrossRef]
- Dehghani, M.; Montazeri, Z.; Malik, O.P. Optimal Sizing and Placement of Capacitor Banks and Distributed Generation in Distribution Systems Using Spring Search Algorithm. Int. J. Electr. Power Energy Syst. 2020, 21. [Google Scholar] [CrossRef]
- Naderipour, A.; Abdul-Malek, Z.; Hajivand, M.; Seifabad, Z.M.; Farsi, M.A.; Nowdeh, S.A.; Davoudkhani, I.F. Spotted hyena optimizer algorithm for capacitor allocation in radial distribution system with distributed generation and microgrid operation considering different load types. Sci. Rep. 2021, 11, 2728. [Google Scholar] [CrossRef] [PubMed]
- Oliveira, V.Y.M.; Oliveira, R.M.S.; Affonso, C.M. Cuckoo Search approach enhanced with genetic replacement of abandoned nests applied to optimal allocation of distributed generation units. IET Gener. Transm. Distrib. 2018, 12, 3353–3362. [Google Scholar] [CrossRef]
- Quadri, I.A.; Bhowmick, S.; Joshi, D. A comprehensive technique for optimal allocation of distributed energy resources in radial distribution systems. Appl. Energy 2018, 211, 1245–1260. [Google Scholar] [CrossRef]
- Pasha, A.M.; Zeineldin, H.H.; El-Saadany, E.F.; Alkaabi, S.S. Optimal allocation of distributed generation for planning master–slave controlled microgrids. IET Gener. Transm. Distrib. 2019, 13, 3704–3712. [Google Scholar] [CrossRef]
- Murthy, V.V.S.N.; Kumar, A. Comparison of optimal DG allocation methods in radial distribution systems based on sensitivity approaches. Int. J. Electr. Power Energy Syst. 2013, 53, 450–467. [Google Scholar] [CrossRef]
- Sadiq, A.A.; Adamu, S.S.; Buhari, M. Optimal distributed generation planning in distribution networks: A comparison of transmission network models with FACTS. Eng. Sci. Technol. Int. J. 2019, 22, 33–46. [Google Scholar] [CrossRef]
- Poornazaryan, B.; Karimyan, P.; Gharehpetian, G.B.; Abedi, M. Optimal allocation and sizing of DG units considering voltage stability, losses and load variations. Int. J. Electr. Power Energy Syst. 2016, 79, 42–52. [Google Scholar] [CrossRef]
- Mirjalili, S.; Mirjalili, S.M.; Lewis, A. Grey wolf optimizer. Adv. Eng. Softw. 2014, 69, 46–61. [Google Scholar] [CrossRef]
- Şenel, F.A.; Gökçe, F.; Yüksel, A.S.; Yiğit, T. A novel hybrid PSO–GWO algorithm for optimization problems. Eng. Comput. 2018, 35, 1359–1373. [Google Scholar] [CrossRef]
- Abdelshafy, A.M.; Hassan, H.; Jurasz, J. Optimal design of a grid-connected desalination plant powered by renewable energy resources using a hybrid PSO–GWO approach. Energy Convers. Manag. 2018, 173, 331–347. [Google Scholar] [CrossRef]
- Zimmerman, R.D.; Murillo-Sanchez, C.E. Matpower [Software]. 2019. Available online: https://matpower.org (accessed on 5 January 2021). [CrossRef]
- Kumar, S.; Mandal, K.K.; Chakraborty, N. Optimal DG placement by multi-objective opposition based chaotic differential evolution for techno-economic analysis. Appl. Soft Comput. 2019, 78, 70–83. [Google Scholar] [CrossRef]
- Askarzadeh, A. Capacitor placement in distribution systems for power loss reduction and voltage improvement: A new methodology. IET Gener. Transm. Distrib. 2016, 10, 3631–3638. [Google Scholar] [CrossRef]
- Sarma, A.K. Optimal selection of capacitors for radial distribution systems using plant growth simulation algorithm. Int. J. Adv. Sci. Technol. 2011, 30, 43–54. [Google Scholar]
- Sultana, S.; Roy, P.K. Multi-objective quasi-oppositional teaching learning based optimization for optimal location of distributed generator in radial distribution systems. Int. J. Electr. Power Energy Syst. 2014, 63, 534–545. [Google Scholar] [CrossRef]
- Moradi, M.H.; Abedini, M. A combination of genetic algorithm and particle swarm optimization for optimal DG location and sizing in distribution systems. Int. J. Electr. Power Energy Syst. 2012, 34, 66–74. [Google Scholar] [CrossRef]
- Mohamed Imran, A.; Kowsalya, M.; Kothari, D.P. A novel integration technique for optimal network reconfiguration and distributed generation placement in power distribution networks. Int. J. Electr. Power Energy Syst. 2014, 63, 461–472. [Google Scholar] [CrossRef]
- Rao, R.S.; Ravindra, K.; Satish, K.; Narasimham, S.V.L. Power Loss Minimization in Distribution System Using Network Reconfiguration in the Presence of Distributed Generation. IEEE Trans. Power Syst. 2013, 28, 317–325. [Google Scholar] [CrossRef]
- Kefayat, M.; Lashkar Ara, A.; Nabavi Niaki, S.A. A hybrid of ant colony optimization and artificial bee colony algorithm for probabilistic optimal placement and sizing of distributed energy resources. Energy Convers. Manag. 2015, 92, 149–161. [Google Scholar] [CrossRef]
- Meena, N.K.; Parashar, S.; Swarnkar, A.; Gupta, N.; Niazi, K.R. Improved Elephant Herding Optimization for Multiobjective DER Accommodation in Distribution Systems. IEEE Trans. Ind. Inform. 2018, 14, 1029–1039. [Google Scholar] [CrossRef]
- Meena, N.K.; Swarnkar, A.; Gupta, N.; Niazi, K.R. A Taguchi-based approach for optimal placement of distributed generations for power loss minimization in distribution system. In Proceedings of the 2015 IEEE Power Energy Society General Meeting, Denver, CO, USA, 26–30 July 2015; pp. 1–5. [Google Scholar]
- Saonerkar, A.K.; Bagde, B.Y. Optimized DG placement in radial distribution system with reconfiguration and capacitor placement using genetic algorithm. In Proceedings of the 2014 IEEE International Conference on Advanced Communications, Control and Computing Technologies, Ramanathapuram, India, 8–10 May 2014; pp. 1077–1083. [Google Scholar]
- Injeti, S.K.; Prema Kumar, N. A novel approach to identify optimal access point and capacity of multiple DGs in a small, medium and large scale radial distribution systems. Int. J. Electr. Power Energy Syst. 2013, 45, 142–151. [Google Scholar] [CrossRef]
- Hung, D.Q.; Mithulananthan, N. Multiple Distributed Generator Placement in Primary Distribution Networks for Loss Reduction. IEEE Trans. Ind. Electron. 2013, 60, 1700–1708. [Google Scholar] [CrossRef]
- Prakash, K.; Sydulu, M. Particle swarm optimization based capacitor placement on radial distribution systems. In Proceedings of the 2007 IEEE Power Engineering Society General Meeting, Tampa, FL, USA, 24–28 June 2007; pp. 1–5. [Google Scholar]
- Mohamed Shuaib, Y.; Surya Kalavathi, M.; Christober Asir Rajan, C. Optimal capacitor placement in radial distribution system using Gravitational Search Algorithm. Int. J. Electr. Power Energy Syst. 2015, 64, 384–397. [Google Scholar] [CrossRef]
- Neelima, S.; Subramanyam, P.S. Efficient optimal sizing and allocation of capacitors in radial distribution systems using drdlf and differential evolution. ACEEE Int. J. Elect. Power Eng. 2011, 2, 56–61. [Google Scholar]
- El-Fergany, A.A. Optimal capacitor allocations using evolutionary algorithms. IET Gener. Transm. Distrib. 2013, 7, 593–601. [Google Scholar] [CrossRef]
- El-Fergany, A.A.; Abdelaziz, A.Y. Capacitor allocations in radial distribution networks using cuckoo search algorithm. IET Gener. Transm. Distrib. 2014, 8, 223–232. [Google Scholar] [CrossRef]
- Ramalinga Raju, M.; Ramachandra Murthy, K.V.S.; Ravindra, K. Direct search algorithm for capacitive compensation in radial distribution systems. Int. J. Electr. Power Energy Syst. 2012, 42, 24–30. [Google Scholar] [CrossRef]
- Sultana, S.; Roy, P.K. Optimal capacitor placement in radial distribution systems using teaching learning based optimization. Int. J. Electr. Power Energy Syst. 2014, 54, 387–398. [Google Scholar] [CrossRef]
- Das, D. Optimal placement of capacitors in radial distribution system using a fuzzy-GA method. Int. J. Electr. Power Energy Syst. 2008, 30, 361–367. [Google Scholar] [CrossRef]
- Hamouda, A.; Lakehal, N.; Zehar, K. Heuristic method for reactive energy management in distribution feeders. Int. J. Energy Converse Manag. 2010, 51, 518–523. [Google Scholar] [CrossRef]
- Kaur, S.; Kumbhar, G.; Sharma, J. A MINLP technique for optimal placement of multiple DG units in distribution systems. Int. J. Electr. Power Energy Syst. 2014, 63, 609–617. [Google Scholar] [CrossRef]
- Mahmoud, K.; Yorino, N.; Ahmed, A. Optimal Distributed Generation Allocation in Distribution Systems for Loss Minimization. IEEE Trans. Power Syst. 2016, 31, 960–969. [Google Scholar] [CrossRef]
- Martín García, J.A.; Gil Mena, A.J. Optimal distributed generation location and size using a modified teaching–learning based optimization algorithm. Int. J. Electr. Power Energy Syst. 2013, 50, 65–75. [Google Scholar] [CrossRef]
- Sultana, S.; Roy, P.K. Krill herd algorithm for optimal location of distributed generator in radial distribution system. Appl. Soft Comput. 2016, 40, 391–404. [Google Scholar] [CrossRef]
- Gantayet, A.; Mohanty, S. An analytical approach for optimal placement and sizing of distributed generation based on a combined voltage stability index. In Proceedings of the 2015 IEEE Power, Communication and Information Technology Conference (PCITC), Bhubaneswar, India, 15–17 October 2015; pp. 762–767. [Google Scholar]
- Nekooei, K.; Farsangi, M.M.; Nezamabadi-Pour, H.; Lee, K.Y. An Improved Multi-Objective Harmony Search for Optimal Placement of DGs in Distribution Systems. IEEE Trans. Smart Grid 2013, 4, 557–567. [Google Scholar] [CrossRef]
- AlRashidi, M.R.; AlHajri, M.F. Optimal planning of multiple distributed generation sources in distribution networks: A new approach. Energy Convers. Manag. 2011, 52, 3301–3308. [Google Scholar] [CrossRef]


| Ref. No. | Year | Objective Function | Optimization Method | Installation | Inferences | Research Gap (Technical Limitations/ Drawbacks) | |
|---|---|---|---|---|---|---|---|
| DG | CB | ||||||
| [15] | 2016 | Minimizing network power losses, improving voltage regulation, and increasing the voltage stability | GA-IWD | √ | High-quality solution, a linear increase of computational time | Only active power injection considered, DG investment cost ignored | |
| [16] | 2016 | Minimizing the total cost | FPA | √ | Net saving maximized | Load uncertainties ignored | |
| [17] | 2016 | Minimizing power losses | Hybrid HSA-PABC | √ | √ | Enhanced solution accuracy and rate of convergence | Economic evaluations ignored |
| [18] | 2016 | Minimizing total real power loss | Analytical + PSO | √ | Improved voltage profile and power factor | No voltage stability assessment | |
| [2] | 2016 | Minimizing total cost of losses | IMDE | √ | √ | Improved performance for loss reduction | Investment cost ignored |
| [11] | 2017 | Minimizing total real power losses | HGWO | √ | Best performance without tuning of the algorithm | No reliability and uncertainties of load considered | |
| [19] | 2017 | Reducing power losses and improving voltage profile and VSI | ALO | √ | Robust algorithm and improved performance | Only PV and wind turbine DGs considered | |
| [20] | 2017 | Minimizing the cost of total power losses | PSO | √ | Near-optimal solution with enhanced performance | Not robust in the larger system | |
| [21] | 2017 | Minimization of power loss, and voltage deviation, and voltage stability improvement | MOPSO | √ | √ | Increased search capability and improved performance | Longer computation time and only one test system is considered |
| [6] | 2018 | Minimizing distribution power losses, power generation costs, and generation units’ emissions, and improving voltage profile and voltage stability index | WCA | √ | √ | Good convergence characteristics, substantial technical, economic, and environmental benefits | Reactive power injection of DGs alone case not considered and the multiobjective for two cases only |
| [10] | 2018 | Minimizing generation cost, power loss, and voltage deviation | IGWO | √ | √ | Enhanced convergence rate and quality of the solution | Power factor constraints and voltage stability ignored |
| [22] | 2018 | Minimizing power loss and operating cost, and improving voltage profile | WOA | √ | More effective in the multiobjective placement of DGs | Power factor constraints ignored | |
| [23] | 2018 | Minimizing total net present cost | PSO | √ | Improved power system performance | Only one test system considered | |
| [12] | 2018 | Minimizing power losses | Hybrid GWO-PSO | √ | Fast, small number of iterations and optimal solution | Power factor constraints ignored, no voltage stability assessment | |
| [1] | 2019 | Minimizing power losses and improving reliability | MOHTLBOGWO | √ | Better convergence speed and not trapped at all in local optimal | Only PV and wind sources considered | |
| [5] | 2019 | Minimizing power loss and improve voltage profile | New heuristic | √ | √ | Robust, fast, and easy to implement | Loosened network constraints |
| [24] | 2019 | Minimization of active power, reactive power, and real power loss. Improvement of branch current capacity, voltage profile, and voltage stability | Fuzzy GA | √ | √ | Improved power system performance | Economic considerations are ignored |
| [4] | 2020 | Minimizing annual operating cost | PBOA | √ | Improved performance and fast convergence | Power factor constraints ignored | |
| [8] | 2020 | Minimizing total real power losses | ALO | √ | Lesser number of iterations and CPU time | No voltage stability assessment, only PV and wind sources studied | |
| [13] | 2020 | Minimizing active and reactive power losses, and total voltage deviation, and improving voltage stability index | Cf-PSO | √ | √ | Stable and steady convergence | Reactive power injection of DGs not considered |
| [25] | 2020 | Minimizing power loss and improving voltage stability | BPSO-SLFA | √ | Enhanced reliability of results | Economic and environmental concerns ignored | |
| [26] | 2020 | Minimizing power losses, energy cost, and pollutant emissions, and enhancing voltage profile and VSI | MODE | √ | Excellent convergence characteristics and enhanced distribution system performance | Only two cases of DGs studied | |
| [27] | 2020 | Minimizing power losses and enhancing voltage profile | Hybrid CWOA+ LSF | √ | √ | Better performance | Fixed DG number, only one test system considered |
| [7] | Early Access | Minimizing real power losses and voltage deviation, and maximizing voltage stability index | I-DBEA | √ | Solving effectively nonlinear and mixed-integer variable problems, and is independent of local trappings and penalty factor | Power factor constraint ignored; economic evaluations ignored | |
| [28] | 2020 | Minimization of power losses, power generation costs, and generation units’ emissions. Enhancement of voltage profile. | SSA | √ | √ | Improved system parameters and reduction in energy losses with condensed cost and emission | Voltage stability is not considered and only one test system is demonstrated. |
| [29] | 2021 | Minimizing the cost of energy losses, peak power losses, and the capacitor | SHO | √ | √ | High convergence speed and more annual net savings | Only one test system is considered |
| DG Type | Rated Capacity (MW) | Life Time (year) | Capital Cost ($/kW) | O&M Costs ($/kWh) | Fuel Cost ($/kWh) | Emission Factors (lb/MWh) | ||
|---|---|---|---|---|---|---|---|---|
| NOx | SO2 | CO2 | ||||||
| Grid | 25 | 25 | - | - | 0.044 | 5.06 | 11.6 | 2031 |
| PV | 1 | 20 | 3985 | 0.01207 | - | - | - | - |
| WT | 5 | 20 | 1822 | 0.00952 | - | - | - | - |
| GT | 3 | 12 | 1224 | 0.06481 | 0.0667 | 0.279 | 0.93 | 1239.2 |
| Techniques | CB Size (MVAR) and Location | Total CB Size (MVAR) | Power Loss (KW) | Loss Reduction (%) | Min. Voltage (p.u.) | VDI (p.u.) | VSI (p.u.) |
|---|---|---|---|---|---|---|---|
| Base case | -- | -- | 202.68 | 0 | 0.913 (18) | 0.1171 | 0.6968 |
| WCA [6] | 0.3973 (14), 0.4511 (24), 1.0 (30) | 1.8484 | 130.912 | 35.41 | 0.951 (18) | -- | -- |
| FPA [15] | 0.25 (6), 0.4 (9), 0.95 (30) | 1.6 | 134.47 | 33.65 | 0.9365 | -- | -- |
| PSO [41] | 0.9 (2), 0.45 (7), 0.3 (15), 0.45 (29), 0.45 (31) | 2.55 | 132.48 | 34.64 | 0.945 | -- | -- |
| PGSA [42] | 1.2 (6), 0.76 (28), 0.2 (29) | 2.16 | 135.4 | 33.19 | 0.9463 | -- | -- |
| CSA [41] | 0.6 (11), 0.45 (24), 0.6 (30), 0.3 (33) | 1.95 | 131.5 | 35.12 | 0.943 | -- | -- |
| EGWO-PSO | 0.4238 (13), 0.5663 (24), 1.1439 (30) | 2.134 | 132.17 | 34.79 | 0.9377 (18) | 0.0551 | 0.775 |
| Techniques | DG Size (MW) and Location | Total DG Size (MW) | Power Loss (KW) | Loss Reduction (%) | Min. Voltage (p.u.) | VDI (p.u.) | VSI (p.u.) |
|---|---|---|---|---|---|---|---|
| Base case | -- | -- | 202.68 | 0 | 0.913 (18) | 0.1171 | 0.6968 |
| WCA [6] | 0.8546 (14), 1.1017 (24), 1.181 (29) | 3.1373 | 71.052 | 64.94 | 0.973 (33) | -- | -- |
| I-DBEA [7] | 1.098 (13), 1.097 (24), 1.715 (30) | 3.9131 | 94.8514 | 53.21 | -- | 0.0007 | 0.9650 |
| CTLBO [31] | 1.0364 (13), 1.1630 (24), 1.5217 (30) | 3.7211 | 85.9595 | 57.59 | -- | 0.0026 | 0.9481 |
| CTLBO ε-method [31] | 1.1926 (13), 0.8706 (25), 1.6296 (30) | 3.6928 | 96.1732 | 52.54 | -- | 0.0009 | 0.9638 |
| TLBO [43] | 1.1826 (12), 1.1913 (28), 1.1863 (30) | 3.5602 | 124.6950 | 38.47 | -- | 0.0011 | 0.9503 |
| QOTLBO [43] | 1.0834 (13), 1.1876 (26), 1.1992 (30) | 3.4702 | 103.4030 | 48.97 | -- | 0.0011 | 0.9530 |
| GA [44] | 1.50 (11), 0.4228 (29), 1.0714 (30) | 2.9942 | 106.3 | 47.55 | 0.981 (25) | 0.0407 | 0.9497 |
| PSO [44] | 1.1768 (8), 0.9816 (13), 0.8297 (32) | 2.9881 | 105.3000 | 48.05 | 0.980 (30) | 0.0335 | 0.9256 |
| GA/PSO [44] | 0.925 (11), 0.863 (16), 1.200 (32) | 2.988 | 103.4 | 48.98 | 0.980 (25) | 0.0124 | 0.9508 |
| FWA [45] | 0.5897 (14), 0.189 (18), 1.0146 (32) | 1.2036 | 88.68 | 56.25 | 0.968 | -- | -- |
| HSA [46] | 0.5724 (17), 0.107 (18), 1.0462 (33) | 1.7256 | 96.76 | 52.26 | 0.967 (29) | -- | -- |
| ACO-ABC [47] | 0.7547 (14), 1.0999 (24), 1.0714 (30) | 2.9260 | 71.4 | 64.77 | -- | -- | -- |
| IMOEHO [48] | 1.057 (14), 1.054 (24), 1.741 (30) | 3.8520 | 95.0000 | 53.13 | -- | 0.0008 | 0.9673 |
| TM [49] | 0.5876 (15), 0.1959 (25), 0.783 (33) | 1.5665 | 91.305 | 54.95 | 0.958 (30) | -- | -- |
| EGWO-PSO | 0.754 (14), 1.099 (24), 1.071 (30) | 2.924 | 71.457 | 64.74 | 0.9687 (33) | 0.0135 | 0.8813 |
| Techniques | DG Size (MW) and Location | Total DG Size (MW) | CB Size (MVAR) and Location | Total CB Size (MVAR) | Power Loss (KW) | Loss Reduction (%) | Min. Voltage (p.u.) | VDI (p.u.) | VSI (p.u.) |
|---|---|---|---|---|---|---|---|---|---|
| Base case | -- | -- | -- | -- | 202.68 | 0 | 0.913 (18) | 0.1171 | 0.6968 |
| WCA [6] | 0.563 (11), 0.973 (25), 1.04 (29) | 2.576 | 0.535 (14), 0.465 (23), 0.565 (30) | 1.565 | 24.688 | 87.82 | 0.980 (33) | -- | -- |
| GA [50] | 0.25 (16), 0.25 (22), 0.50 (30) | 1 | 0.30 (15), 0.30 (18) 0.30 (29), 0.60 (30), 0.30 (31) | 1.8 | 71.25 | 64.85 | 0.971 | -- | -- |
| EGWO-PSO | 0.746 (14), 1.078 (24), 1.048 (30) | 2.873 | 0.528 (11), 0.712 (23), 1 (29) | 2.241 | 15.157 | 92.52 | 0.9941 (22) | 0.00036 | 0.9786 |
| Techniques | DG Location, Size (MW), and Power Factor | Total DG Size (MW) | Power Loss (KW) | Loss Reduction (%) | Min. Voltage (p.u.) | VDI (p.u.) | VSI (p.u.) |
|---|---|---|---|---|---|---|---|
| Base case | -- | -- | 202.68 | 0 | 0.913 (18) | 0.1171 | 0.6968 |
| I-DBEA [7] | (13, 0.7491, 0.85), (24, 1.0420, 0.85), (30, 1.2395, 0.85) | 3.0307 | 14.570 | 92.8081 | -- | 0.0002 | 0.9733 |
| LSFSA [51] | (6, 1.383, 0.85), (18, 0.552, 0.85), (30, 1.063, 0.85) | 2.9980 | 26.700 | 86.8300 | -- | 0.0013 | 0.9323 |
| IMOEHO [48] | (13, 0.929, 0.85), (24, 1.181, 0.85), (30, 1.473, 0.85) | 3.5830 | 14.900 | 92.6000 | -- | 0.0003 | 0.9814 |
| IA [52] | (6, 1.059, 0.85), (14, 0.741, 0.85), (30, 1.059, 0.85) | 2.8590 | 23.100 | 88.6000 | -- | -- | -- |
| EGWO-PSO | (13, 0.7793, 0.905) (24, 1.0723, 0.89) (30, 1.0356, 0.715) | 2.8872 | 11.68 | 94.24 | 0.9926 (8) | 0.00062 | 0.9707 |
| Techniques | DG LOCATION, Size (MW), and Power Factor | Total DG Size (MW) | CB Size (MVAR) and Location | Total CB Size (MVAR) | Power Loss (KW) | Loss Reduction (%) | Min. Voltage (p.u.) | VDI (p.u.) | VSI (p.u.) |
|---|---|---|---|---|---|---|---|---|---|
| Base case | - | - | 202.68 | 0 | 0.913 (18) | 0.1171 | 0.6968 | ||
| WCA [6] | (11, 0.9917, 0.905) (31, 0.9823, 0.985) (24, 1.652, 0.959) | 3.626 | 0.325 (19), 0.3116 (23), 0.5432 (30) | 1.1798 | 19.848 | 90.207 | 0.989 (18) | 0.041 | 0.985 |
| EGWO-PSO | (13, 0.77762, 1) (24, 1.072, 0.996) (30, 1.0345, 0.999) | 2.8841 | 0.5235 (11), 0.6925 (23), 1 (29) | 2.2159 | 14.994 | 92.602 | 0.99408 (22) | 0.000343 | 0.9788 |
| Techniques | Grid Location, Active Power (MW), and Reactive Power (MVAR) | PV Location, Active Power (MW), and Reactive Power (MVAR) | WT Location, Active Power (MW), and Reactive Power (MVAR) | GT Location, Active Power (MW), and Reactive Power (MVAR) | CB Location and Reactive Power (MVAR) | Power Loss (KW) | Loss Reduction (%) | Cost ($/h) | Emission (lb/h) (×106) |
|---|---|---|---|---|---|---|---|---|---|
| Base case | -- | -- | -- | -- | -- | 202.68 | 0 | 304.8966 | 8.0267 |
| WCA [6] | (1, 1.541, 0.6572) | (32, 0.7149, 0.4385) (27, 0.6397, 0.2776) | (25, 0.6476, 0.1467) | (18, 0.2008, 0.0516) | (15, 0.3) (19, 0.45) (26,0) | 28.9615 | 85.71 | 249.3429 | 3.4045 |
| EGWO-PSO | (1, 1.0136, 0.2434) | (32, 0.1728, 0.83568) (27, 1.3008, 0.07421) | (25, 0.7751, 0.42202) | (13, 0.4719, 0.0212) | (15, 0.3) (19, 0.45) (26, 0) | 19.217 | 90.52 | 227.372 | 2.2899 |
| Techniques | CB Size (MVAR) and Location | Total CB Size (MVAR) | Power Loss (KW) | Loss Reduction (%) | Min. Voltage (p.u.) | VDI (p.u.) | VSI (p.u.) |
|---|---|---|---|---|---|---|---|
| Base case | -- | -- | 225 | 0 | 0.9092 (65) | 0.0993 | 0.6850 |
| WCA [6] | 1.2882 (61), 0.2134 (69), 0.27 (18) | 1.7716 | 144.53 | 35.76 | 0.95 (65) | -- | -- |
| FPA [15] | 1.35 (61) | 1.35 | 150.28 | 33.2 | 0.9333 | -- | -- |
| PSO [53] | 0.241 (46), 0.365 (47), 1.015 (50) | 1.621 | 152.48 | 33.2 | -- | -- | -- |
| PGSA [42] | 1.2 (57), 0.274 (58), 0.2 (61) | 1.674 | 147.4 | 34.48 | -- | -- | -- |
| GSA [54] | 0.15 (26), 0.15 (13), 1.050 (15) | 1.35 | 145.9 | 35.16 | 0.952 | -- | -- |
| DE [55] | 0.2 (16), 0.7 (60), 0.5 (61) | 1.4 | 147.96 | 34.24 | 0.9296 | -- | -- |
| DE-PS [56] | 0.95 (61), 0.2 (64), 0.50 (65), 0.15 (59), 0.3 (21) | 1.650 | 146.13 | 35.02 | 0.9327 (65) | -- | -- |
| CSO [57] | 1.2 (62), 0.25 (21) | 1.45 | 147.95 | 34.24 | 0.930 | -- | -- |
| DSA [58] | 0.9 (61), 0.45 (15), 0.45 (60) | 1.800 | 147 | 34.64 | -- | -- | -- |
| TLBO [59] | 0.6 (12), 1.050 (61), 0.150 (64) | 1.800 | 146.35 | 34.92 | 0.9313 (65) | -- | -- |
| Fuzzy GA [60] | 0.1 (59), 0.7 (61), 0.8 (64) | 1.600 | 156.62 | 30.4 | 0.9369 | -- | -- |
| Heuristic [61] | 0.6 (8), 0.15 (58), 1.05 (60) | 1.8 | 148.48 | 34 | 0.9305 | -- | -- |
| Hybrid [17] | 1.19 (61), 0.25 (18), 0.33 (11) | 1.770 | 145.2 | 35.47 | -- | -- | -- |
| New heuristic [5] | 1.21 (61), 0.226 (21), 0.32 (12) | 1.756 | 145.3 | 35.42 | -- | -- | -- |
| EGWO-PSO | 0.4232 (11), 0.2543 (20), 1.4112 (61) | 2.0887 | 145.13 | 35.50 | 0.93142 (65) | 0.0461 | 0.78415 |
| Techniques | DG Size (MW) and Location | Total DG Size (MW) | Power Loss (KW) | Loss Reduction (%) | Min. Voltage (p.u.) | VDI (p.u.) | VSI (p.u.) |
|---|---|---|---|---|---|---|---|
| Base case | -- | -- | 225 | 0 | 0.9092 (65) | 0.0993 | 0.6850 |
| WCA [6] | 0.775 (61), 1.105 (62), 0.4380 (23) | 2.318 | 71.5 | 68.22 | 0.987 (65) | -- | -- |
| I-DBEA [7] | 2.1487 (61), 0.4717 (19), 0.7126 (11) | 3.320 | 78.347 | 65.17 | -- | 0.0002 | 0.9772 |
| CTLBO [31] | 0.5603 (11), 0.4274 (18), 2.1534 (61) | 3.1411 | 76.372 | 66.04 | -- | 0.0008 | 0.9770 |
| CTLBO ε-method [31] | 0.9658 (12), 0.2307 (25), 2.1336 (61) | 3.3301 | 79.660 | 64.57 | -- | 0.0003 | 0.9770 |
| TLBO [43] | 1.0134 (13), 0.9901 (61), 1.1601 (62) | 3.1636 | 82.172 | 63.46 | -- | 0.0008 | 0.9745 |
| QOTLBO [43] | 0.8114 (15), 1.1470 (61), 1.0022 (63) | 2.9606 | 80.585 | 64.17 | -- | 0.0007 | 0.9769 |
| GA [44] | 0.9297 (21), 1.0752 (62), 0.984 (64) | 2.9897 | 89.000 | 60.42 | -- | 0.0012 | 0.9706 |
| PSO [44] | 1.1998 (61), 0.7956 (63), 0.9925 (17) | 2.9879 | 83.200 | 63.01 | -- | 0.0049 | 0.9676 |
| GA/PSO [44] | 0.8849 (63), 1.1926 (61), 0.9105 (21) | 2.988 | 81.100 | 63.90 | -- | 0.0031 | 0.9768 |
| FWA [45] | 0.2258 (27), 1.1986 (61), 0.4085 (65) | 1.8329 | 77.85 | 65.4 | 0.974 (62) | -- | -- |
| HSA [46] | 0.1018 (65), 0.3690 (64), 1.3024 (63) | 1.7732 | 86.77 | 61.43 | 0.9677 | -- | -- |
| ACO- ABC [47] | 0.559 (11), 0.346 (21), 1.715 (61) | 2.622 | 69.429 | 69.14 | -- | -- | -- |
| HGWO [11] | 0.527 (11), 0.380 (17), 1.718 (61) | 2.625 | 69.425 | 69.14 | -- | -- | -- |
| MINLP [62] | 0.530 (11), 0.380 (17), 1.720 (61) | 2.630 | 69.426 | 69.14 | -- | -- | -- |
| Exhaustive OPF [63] | 0.527 (11), 0.380 (18), 1.719 (61) | 2.626 | 69.43 | 69.14 | -- | -- | -- |
| EA-OPF [63] | 0.527 (11), 0.380 (18), 1.719 (61) | 2.626 | 69.43 | 69.14 | -- | -- | -- |
| EA [63] | 0.467 (11), 0.380 (18), 1.795 (61) | 2.642 | 69.62 | 69.06 | -- | -- | -- |
| MTLBO [64] | 0.493 (11), 0.378 (18), 1.672 (61) | 2.544 | 69.539 | 69.09 | -- | -- | -- |
| KHA [65] | 0.496 (12), 0.311 (22), 1.735 (61) | 2.542 | 69.56 | 69.08 | -- | -- | -- |
| Hybrid [17] | 0.510 (11), 0.380 (17), 1.670 (61) | 2.560 | 69.52 | 69.10 | -- | -- | -- |
| CVSI [66] | 1.895 (61) | 1.895 | 83.18 | 63.03 | 0.968 (27) | -- | -- |
| New heuristic [5] | 1.689 (61), 0.312 (21), 0.471 (12) | 2.472 | 69.7 | 69.02 | -- | -- | -- |
| EGWO-PSO | 0.5268 (11), 0.3803 (18), 1.719 (61) | 2.6261 | 69.428 | 69.14 | 0.979 (65) | 0.0052 | 0.9205 |
| Techniques | DG Size (MW) and Location | Total DG Size (MW) | CB Size (MVAR) and Location | Total CB Size (MVAR) | Power Loss (KW) | Loss Reduction (%) | Min. Voltage (p.u.) | VDI (p.u.) | VSI (p.u.) |
|---|---|---|---|---|---|---|---|---|---|
| Base case | -- | -- | -- | -- | 225 | 0 | 0.9092 (65) | 0.0993 | 0.6850 |
| WCA [6] | 0.5408 (17), 2 (61), 1.1592 (69) | 3.7 | 1.1879 (2), 1.2373 (62), 0.2697 (69) | 2.6949 | 33.339 | 85.18 | 0.994 (50) | -- | -- |
| EGWO-PSO | 0.4957 (11), 0.3804 (17), 1.6554 (61) | 2.5315 | 1 (61), 0.4134 (64), 0.4759 (69) | 1.8893 | 7.8554 | 96.5087 | 0.99427 (50) | 0.000198 | 0.9794 |
| Techniques | DG Location, Size (MW), and Power Factor | Total DG Size (MW) | Power Loss (KW) | Loss Reduction (%) | Min. Voltage (p.u.) | VDI (p.u.) | VSI (p.u.) |
|---|---|---|---|---|---|---|---|
| Base case | -- | -- | 225 | 0 | 0.9092 (65) | 0.0993 | 0.6850 |
| I-DBEA [7] | (61, 1.50, 0.85), (59, 0.370, 0.85), (16, 0.575, 0.85) | 2.4459 | 7.9660 | 96.45 | -- | 0.000266 | 0.9774 |
| LSFSA [51] | (18, 0.5498, 0.85), (60, 1.1954, 0.85), (65, 0.3122, 0.85) | 2.0574 | 16.2600 | 92.77 | -- | 0.002300 | 0.9678 |
| IMOHS [67] | (61, 1.4552, 0.85), (11, 0.4769, 0.85), (21, 0.3124, 0.85) | 2.2445 | 10.5000 | 95.33 | -- | 0.001800 | 0.9468 |
| HGWO [11] | (11, 0.614, 0.81), (18, 0.452, 0.83), (61, 2.056, 0.81) | 3.122 | 4.26 | 98.11 | -- | -- | -- |
| MINLP [62] | (11, 0.607, 0.813), (50, 1.058, 0.82), (61, 1.058, 0.82) | 3.123 | 4.26 | 98.11 | -- | -- | -- |
| EA-OPF [63] | (11, 0.611, 0.81), (18, 0.456, 0.83), (61, 2.067, 0.81) | 3.134 | 4.27 | 98.1 | -- | -- | -- |
| EA [63] | (11, 0.668, 0.82), (18, 0.458, 0.83), (61, 2.113, 0.82) | 3.239 | 4.48 | 98.01 | -- | -- | -- |
| Hybrid [17] | (18, 0.480, 0.77), (61, 2.060, 0.83), (66, 0.530, 0.82) | 3.070 | 4.30 | 98.09 | -- | -- | -- |
| PSO [17] | (11, 0.600, 0.83), (18, 0.460, 0.81), (61, 2.060, 0.81) | 3.120 | 4.61 | 97.9 | -- | -- | -- |
| KHA [65] | (11, 0.560, 0.86), (22, 0.357, 0.86), (61, 1.773, 0.86) | 2.690 | 5.91 | 97.37 | -- | -- | -- |
| IPSO [68] | (21, 0.375, 0.85), (61, 1.515, 0.85), (64, 0.353, 0.85) | 2.243 | 12.80 | 94.31 | -- | -- | -- |
| EGWO-PSO | (11, 0.4945, 0.81), (18, 0.3792, 0.83), (61, 1.6743, 0.81) | 2.548 | 4.2676 | 98.1 | 0.99427 (50) | 0.000128 | 0.9791 |
| Techniques | DG Location, Size (MW), and Power Factor | Total DG Size (MW) | CB Size (MVAR) and Location | Total CB Size (MVAR) | Power Loss (KW) | Loss Reduction (%) | Min. Voltage (p.u.) | VDI (p.u.) | VSI (p.u.) |
|---|---|---|---|---|---|---|---|---|---|
| Base case | -- | -- | -- | -- | 225 | 0 | 0.9092 (65) | 0.0993 | 0.6850 |
| WCA [6] | (61, 1.82547, 0.877), (36, 1.0414, 0.916), (19, 0.1063, 0.904) | 2.9732 | 0.0188 (15), 0.4578 (33), 0.5586 (22) | 1.0352 | 18.7048 | 91.6867 | 0.994 (50) | 0.0092 | 0.0313 |
| EGWO-PSO | (11, 0.49369, 1), (18, 0.3789, 0.948), (61, 1.6532, 1) | 2.5258 | 1 (61), 0.41341 (64), 0.47591 (69) | 1.8893 | 7.2081 | 96.7964 | 0.99428 (50) | 0.000115 | 0.9797 |
| Techniques | Grid Location, Active Power (MW), and Reactive Power (MVAR) | PV Location, Active Power (MW), and Reactive Power (MVAR) | WT Location, Active Power (MW), and Reactive Power (MVAR) | GT Location, Active Power (MW), and Reactive Power (MVAR) | CB Location and Reactive Power (MVAR) | Power Loss (KW) | Loss Reduction (%) | Cost ($/h) | Emission (lb/h) (× 106) |
|---|---|---|---|---|---|---|---|---|---|
| Base case | -- | -- | -- | -- | -- | 225 | 0 | 309.7134 | 8.2508 |
| WCA [6] | (1, 1.7467, 0.2946) | (58, 0.1024, 0.0352) (66, 0.7314, 0.2913) | (63, 0.7030, 0.2742) | (64, 0.5405, 0.3130) | (23, 0.6) (62, 0.6) (42, 0.3) | 22.36 | 90.06 | 297.47 | 4.247 |
| EGWO-PSO | (1, 1.2885, 0.50695) | (11, 0.5470, 0.3546) (20, 0.3559, 0.0047) | (63, 1.3344, 0.0277 | (64, 0.2851, 0.4603) | (23, 0.3) (42, 0.45) (62, 0.6) | 8.837 | 96.07 | 250.5372 | 2.992 |
Publisher’s Note: MDPI stays neutral with regard to jurisdictional claims in published maps and institutional affiliations. |
© 2021 by the authors. Licensee MDPI, Basel, Switzerland. This article is an open access article distributed under the terms and conditions of the Creative Commons Attribution (CC BY) license (http://creativecommons.org/licenses/by/4.0/).
Share and Cite
Venkatesan, C.; Kannadasan, R.; Alsharif, M.H.; Kim, M.-K.; Nebhen, J. A Novel Multiobjective Hybrid Technique for Siting and Sizing of Distributed Generation and Capacitor Banks in Radial Distribution Systems. Sustainability 2021, 13, 3308. https://doi.org/10.3390/su13063308
Venkatesan C, Kannadasan R, Alsharif MH, Kim M-K, Nebhen J. A Novel Multiobjective Hybrid Technique for Siting and Sizing of Distributed Generation and Capacitor Banks in Radial Distribution Systems. Sustainability. 2021; 13(6):3308. https://doi.org/10.3390/su13063308
Chicago/Turabian StyleVenkatesan, Chandrasekaran, Raju Kannadasan, Mohammed H. Alsharif, Mun-Kyeom Kim, and Jamel Nebhen. 2021. "A Novel Multiobjective Hybrid Technique for Siting and Sizing of Distributed Generation and Capacitor Banks in Radial Distribution Systems" Sustainability 13, no. 6: 3308. https://doi.org/10.3390/su13063308
APA StyleVenkatesan, C., Kannadasan, R., Alsharif, M. H., Kim, M.-K., & Nebhen, J. (2021). A Novel Multiobjective Hybrid Technique for Siting and Sizing of Distributed Generation and Capacitor Banks in Radial Distribution Systems. Sustainability, 13(6), 3308. https://doi.org/10.3390/su13063308